Dell Latitude 15 9520 2-in-1 vs. Latitude 9510 2-in-1: Nyare är inte alltid bättre
Latitude 9520 2-in-1 byter ut den 10:e generationens Intel-processor på Latitude 9510 2-in-1 mot nyare 11:e generationens alternativ samtidigt som chassit är identiskt. Vi rekommenderar därför att du kollar in vår befintliga recensionen av Latitude 9510 2-in-1 för att få veta mer om våra tankar om chassit, tangentbordet och andra fysiska egenskaper hos systemet. Den här recensionen kommer att fokusera på skillnaderna mellan de två modellerna, inklusive vad användarna kan förvänta sig när det gäller prestanda.
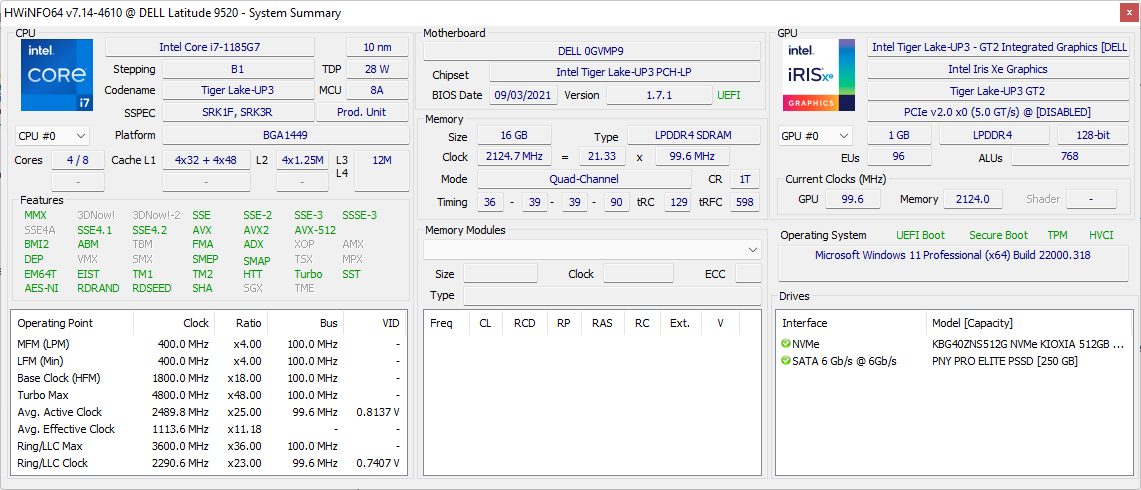
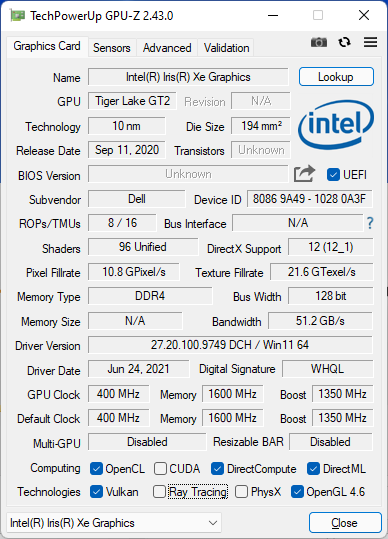
Vår testenhet är en konfiguration i den högre prisklassen med vPro-aktiverad Core i7-1185G7 CPU, Iris Xe 96 EUs GPU, 16 GB RAM och 512 GB NVMe SSD för cirka 2 800 USD. Lägre SKU:er med Core i5-1145G7 CPU och halva lagringskapaciteten finns tillgängliga för cirka 2 300 dollar. Observera att alla 2-i-1 SKU:er kommer med samma 15-tums FHD-panel med närhetssensor och elektronisk slutare. Alternativt kan användarna också köpa Latitude 9520 clamshell om 2-i-1-formfaktorn inte är önskvärd.
Latitude 9520 2-in-1 konkurrerar med andra avancerade konvertibla datorer för företag som MSI Summit E13 Flip, Microsoft Surface Book, HP EliteBook x360 1040 G7, eller Lenovo ThinkPad x13 Yoga.
Fler recensioner av Dell:
Potential Competitors in Comparison
Gradering | Datum | Modell | Vikt | Höjd | Storlek | Upplösning | Pris |
|---|---|---|---|---|---|---|---|
| 89.2 % v7 (old) | 11/2021 | Dell Latitude 15 9520 2-in-1 i7-1185G7, Iris Xe G7 96EUs | 1.7 kg | 13.99 mm | 15.00" | 1920x1080 | |
| 88.6 % v7 (old) | 09/2020 | Dell Latitude 9510 2-in-1 i7-10810U, UHD Graphics 620 | 1.7 kg | 13.99 mm | 15.00" | 1920x1080 | |
| 86.1 % v7 (old) | 09/2021 | HP EliteBook 850 G8 3C7Z8EA i7-1165G7, Iris Xe G7 96EUs | 1.8 kg | 19 mm | 15.60" | 1920x1080 | |
| 85.1 % v7 (old) | Lenovo ThinkPad L15 G2 AMD R5 5600U, Vega 7 | 1.9 kg | 21 mm | 15.60" | 1920x1080 | ||
| 81.2 % v7 (old) | MSI Summit B15 A11M i7-1165G7, Iris Xe G7 96EUs | 1.5 kg | 16.9 mm | 15.60" | 1920x1080 | ||
| 84.9 % v7 (old) | 05/2021 | Microsoft Surface Laptop 4 15 AMD TFF_00028 R7 4980U, Vega 8 | 1.6 kg | 14.7 mm | 15.00" | 2496x1664 |
Fall
Även om chassit är identiskt med fjolårsmodellen känns gångjärnen på vår Latitude 9520 2-i-1-testenhet svagare i vinklar mellan 60 och 90 grader. Idealiskt sett ska gångjärnens styvhet vara jämn över alla vinklar. Vi rekommenderar att du kontrollerar gångjärnen efter köpet för att se om de är onormala.

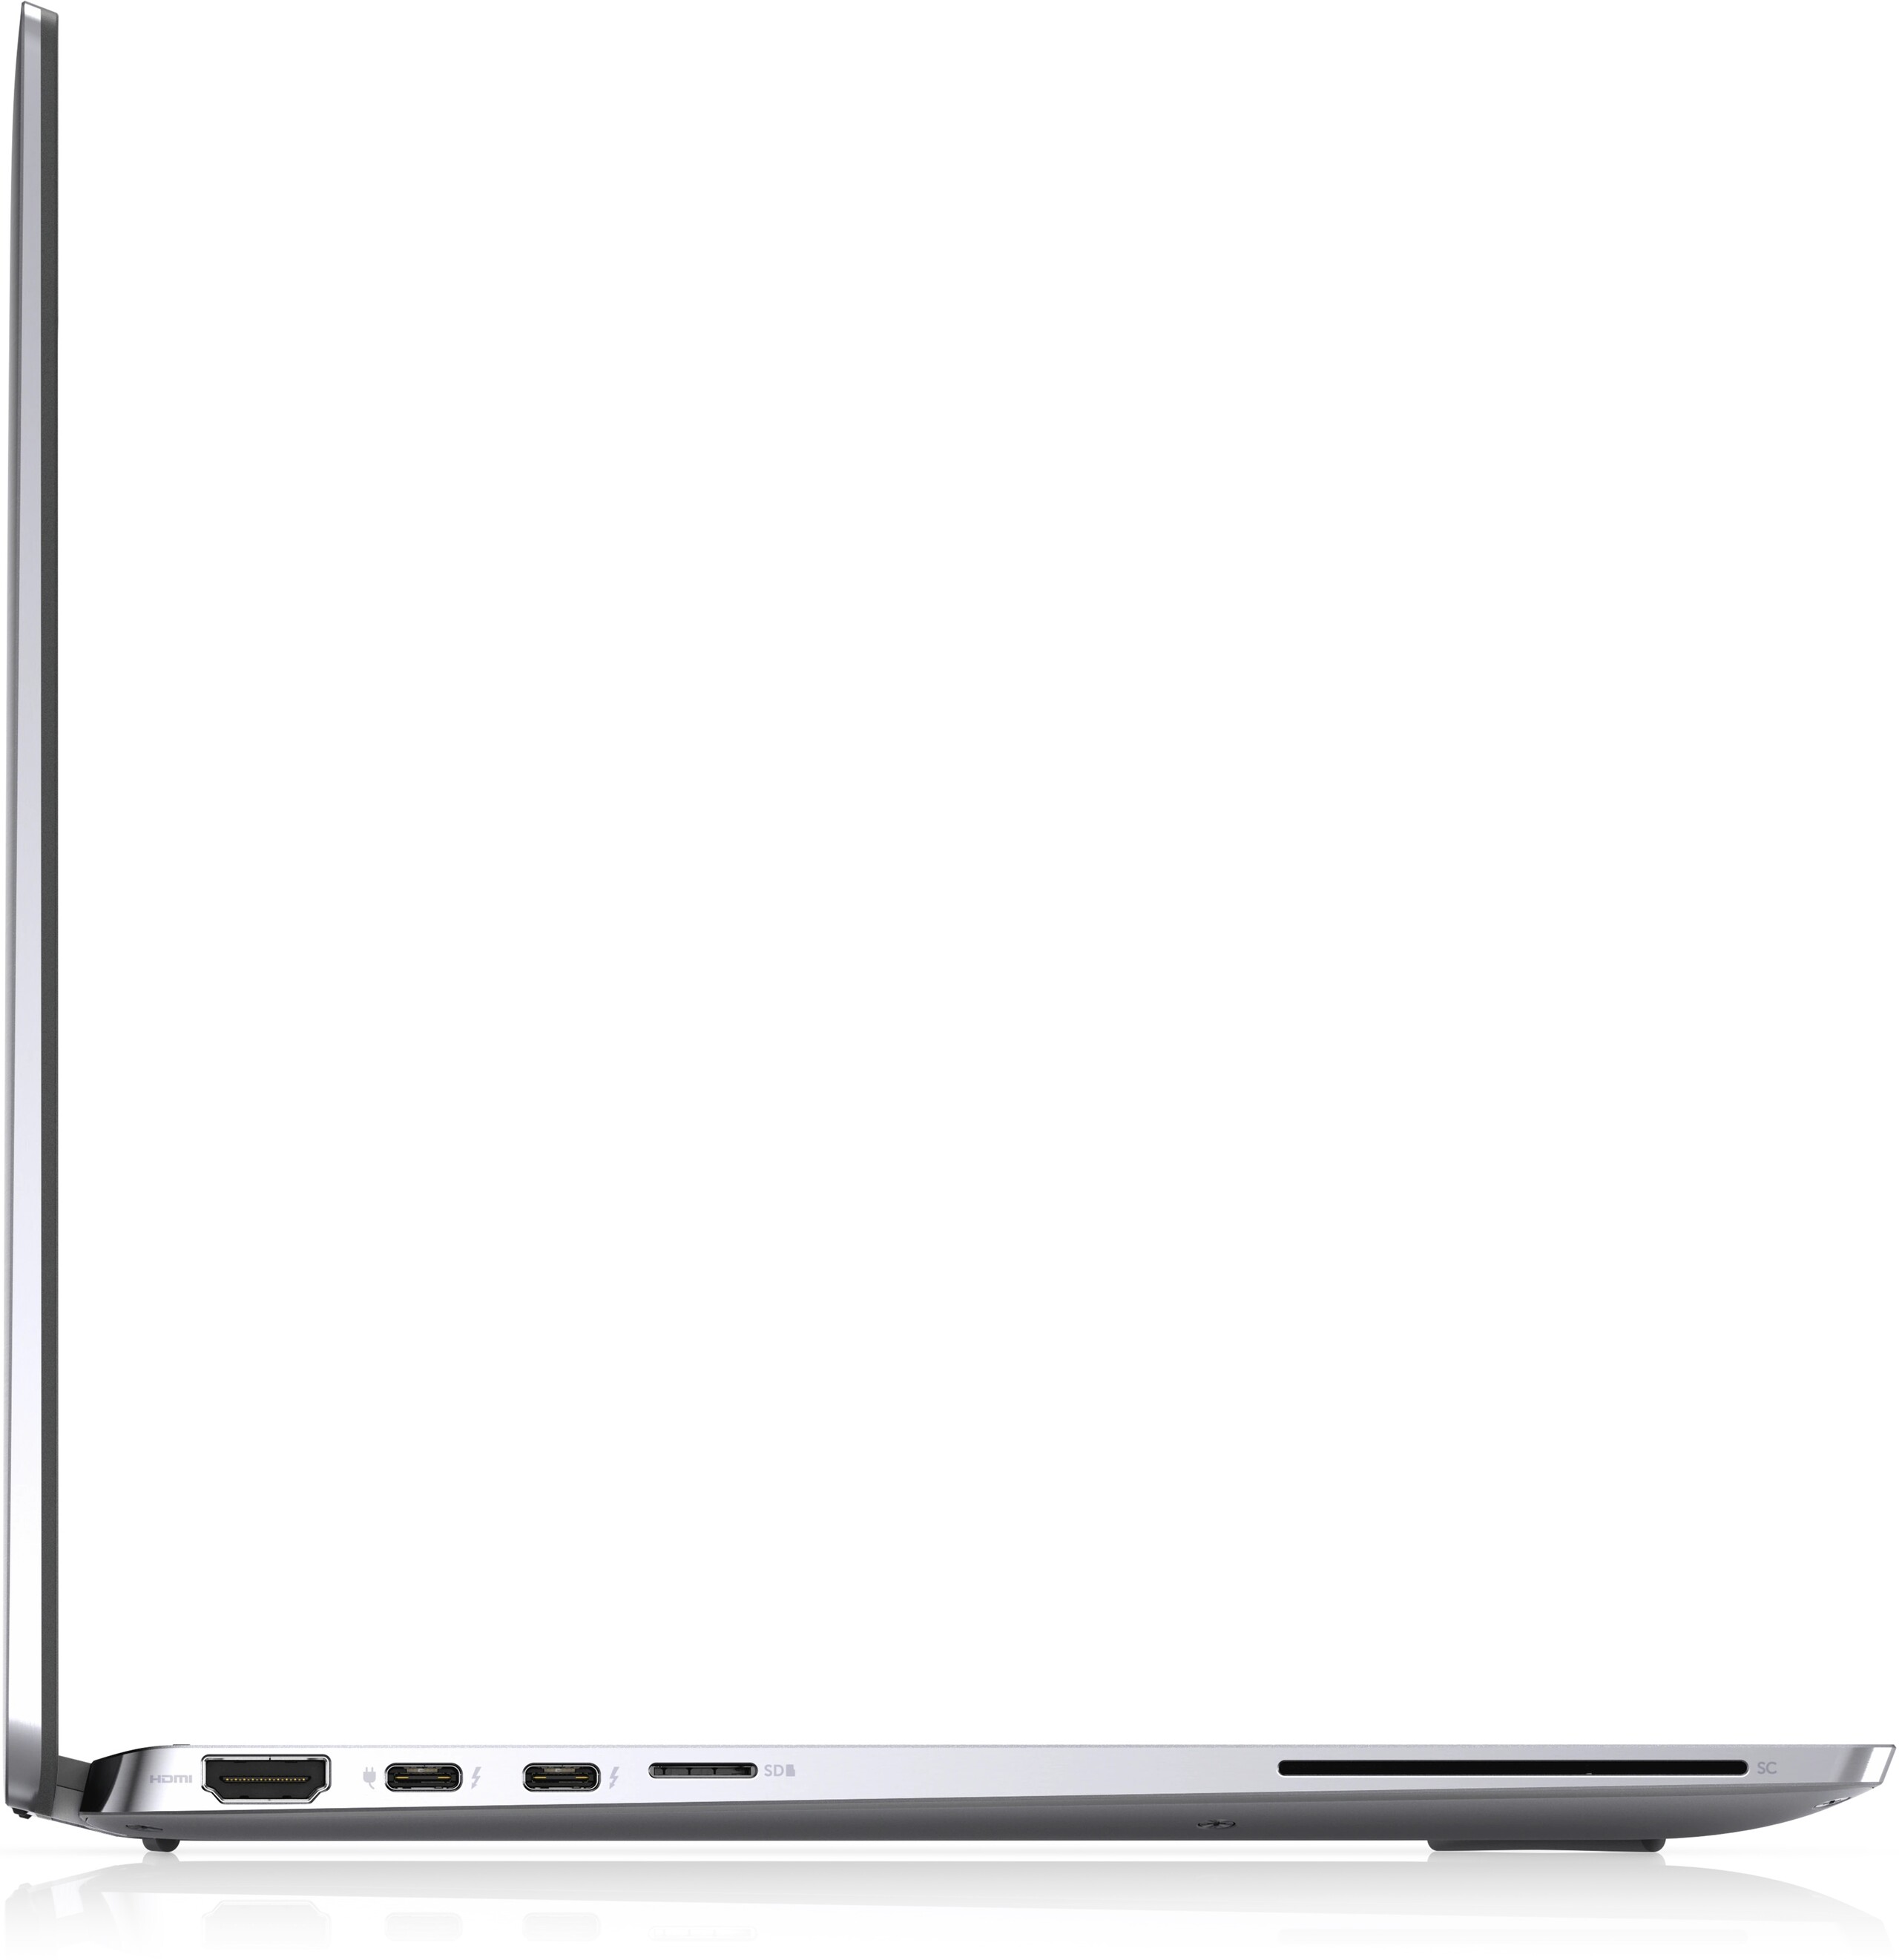
Anslutningsmöjligheter
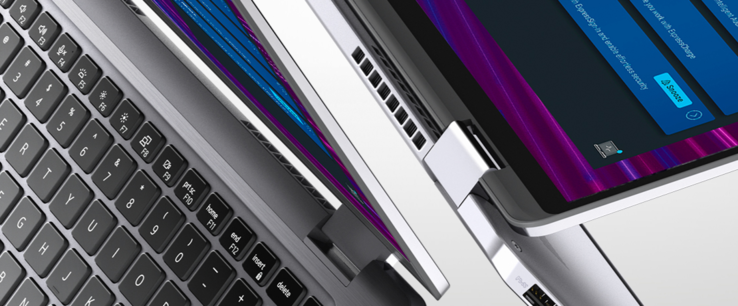
Thunderbolt 3-portarna på Latitude 9510 har uppgraderats till Thunderbolt 4 på vår Latitude 9520. För de flesta användare kommer uppgraderingen dock inte att ha någon större betydelse om du inte planerar att använda externa GPU:er. Alla andra portar är annars identiska mellan de två modellerna.
SD-kortläsare
| SD Card Reader | |
| average JPG Copy Test (av. of 3 runs) | |
| Dell Latitude 9510 2-in-1 (Toshiba Exceria Pro M501 64 GB UHS-II) | |
| Dell Latitude 15 9520 2-in-1 (AV Pro V60) | |
| MSI Summit B15 A11M (AV PRO microSD 128 GB V60) | |
| Lenovo ThinkPad L15 G2 AMD (AV Pro V60) | |
| maximum AS SSD Seq Read Test (1GB) | |
| MSI Summit B15 A11M (AV PRO microSD 128 GB V60) | |
| Dell Latitude 9510 2-in-1 (Toshiba Exceria Pro M501 64 GB UHS-II) | |
| Dell Latitude 15 9520 2-in-1 (AV Pro V60) | |
| Lenovo ThinkPad L15 G2 AMD (AV Pro V60) | |
Kommunikation
| Networking | |
| iperf3 transmit AX12 | |
| HP EliteBook 850 G8 3C7Z8EA | |
| Microsoft Surface Laptop 4 15 AMD TFF_00028 | |
| MSI Summit B15 A11M | |
| Dell Latitude 15 9520 2-in-1 | |
| Dell Latitude 9510 2-in-1 | |
| Lenovo ThinkPad L15 G2 AMD | |
| iperf3 receive AX12 | |
| Dell Latitude 9510 2-in-1 | |
| Dell Latitude 15 9520 2-in-1 | |
| Microsoft Surface Laptop 4 15 AMD TFF_00028 | |
| MSI Summit B15 A11M | |
| HP EliteBook 850 G8 3C7Z8EA | |
| Lenovo ThinkPad L15 G2 AMD | |
Webbkamera


Underhåll
Visa
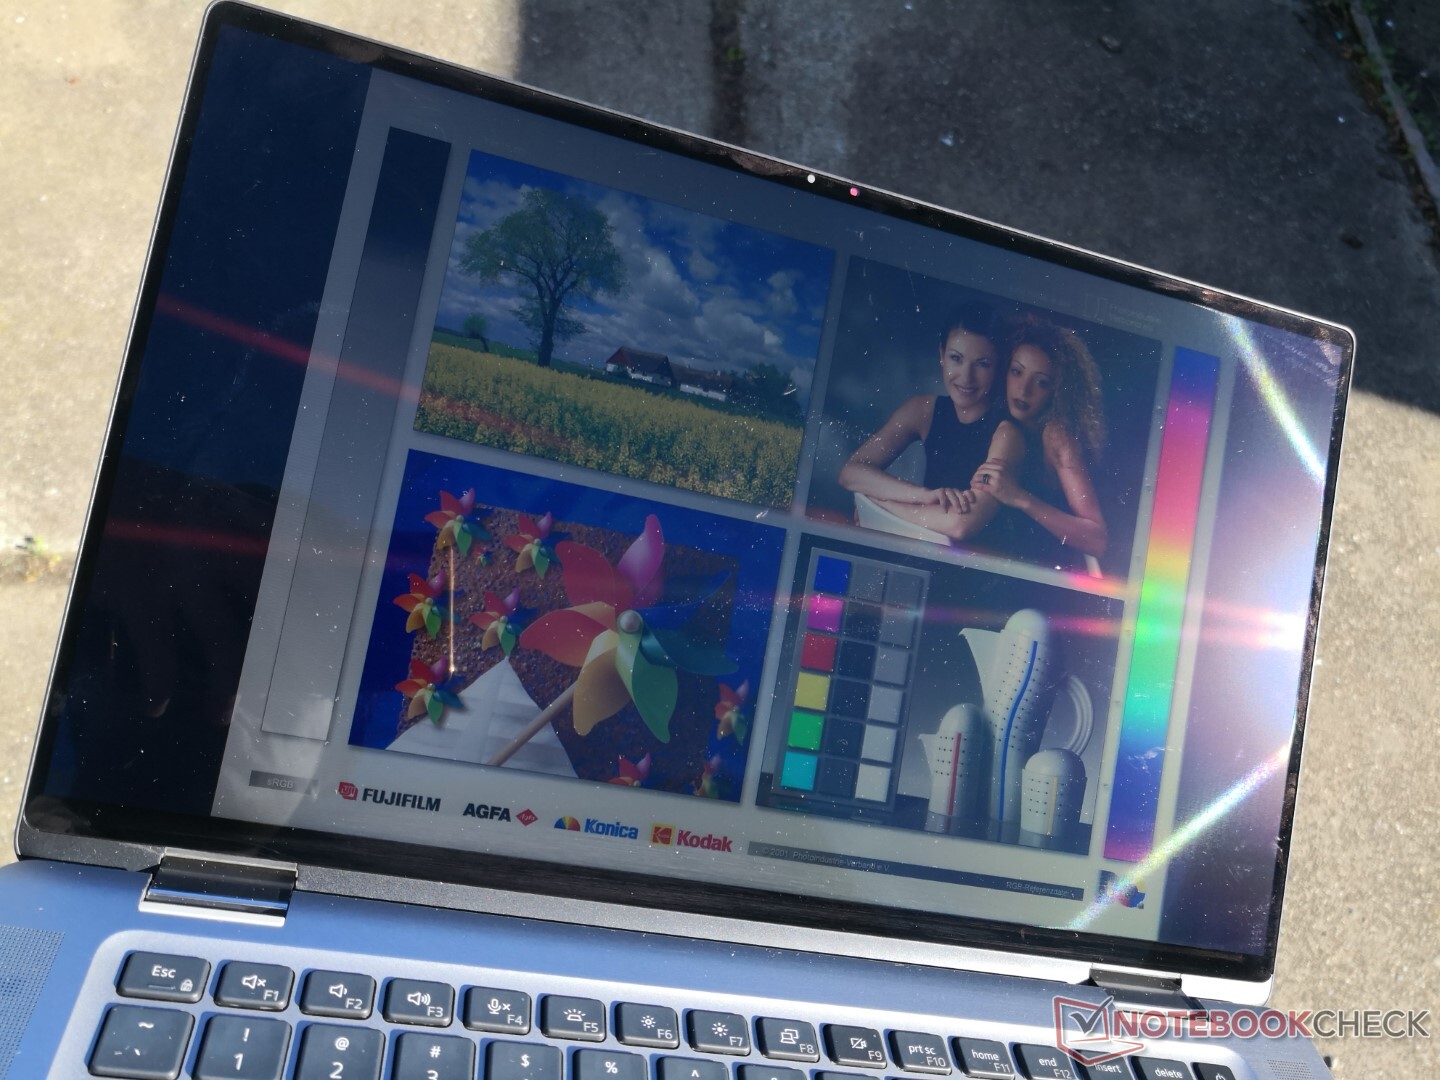
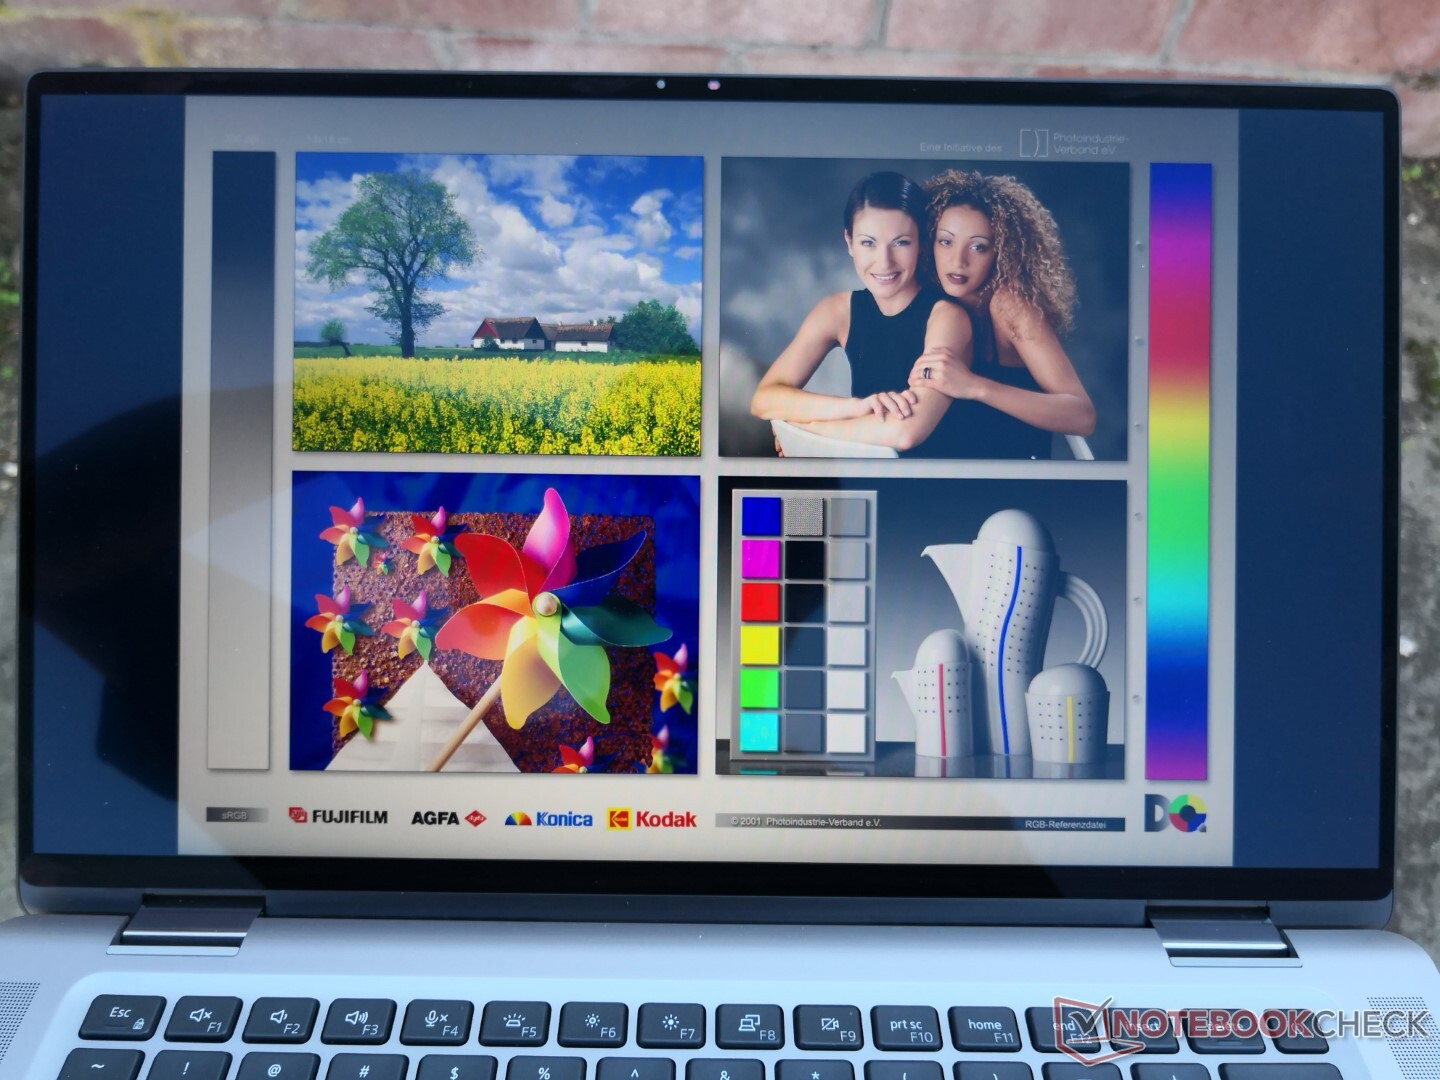
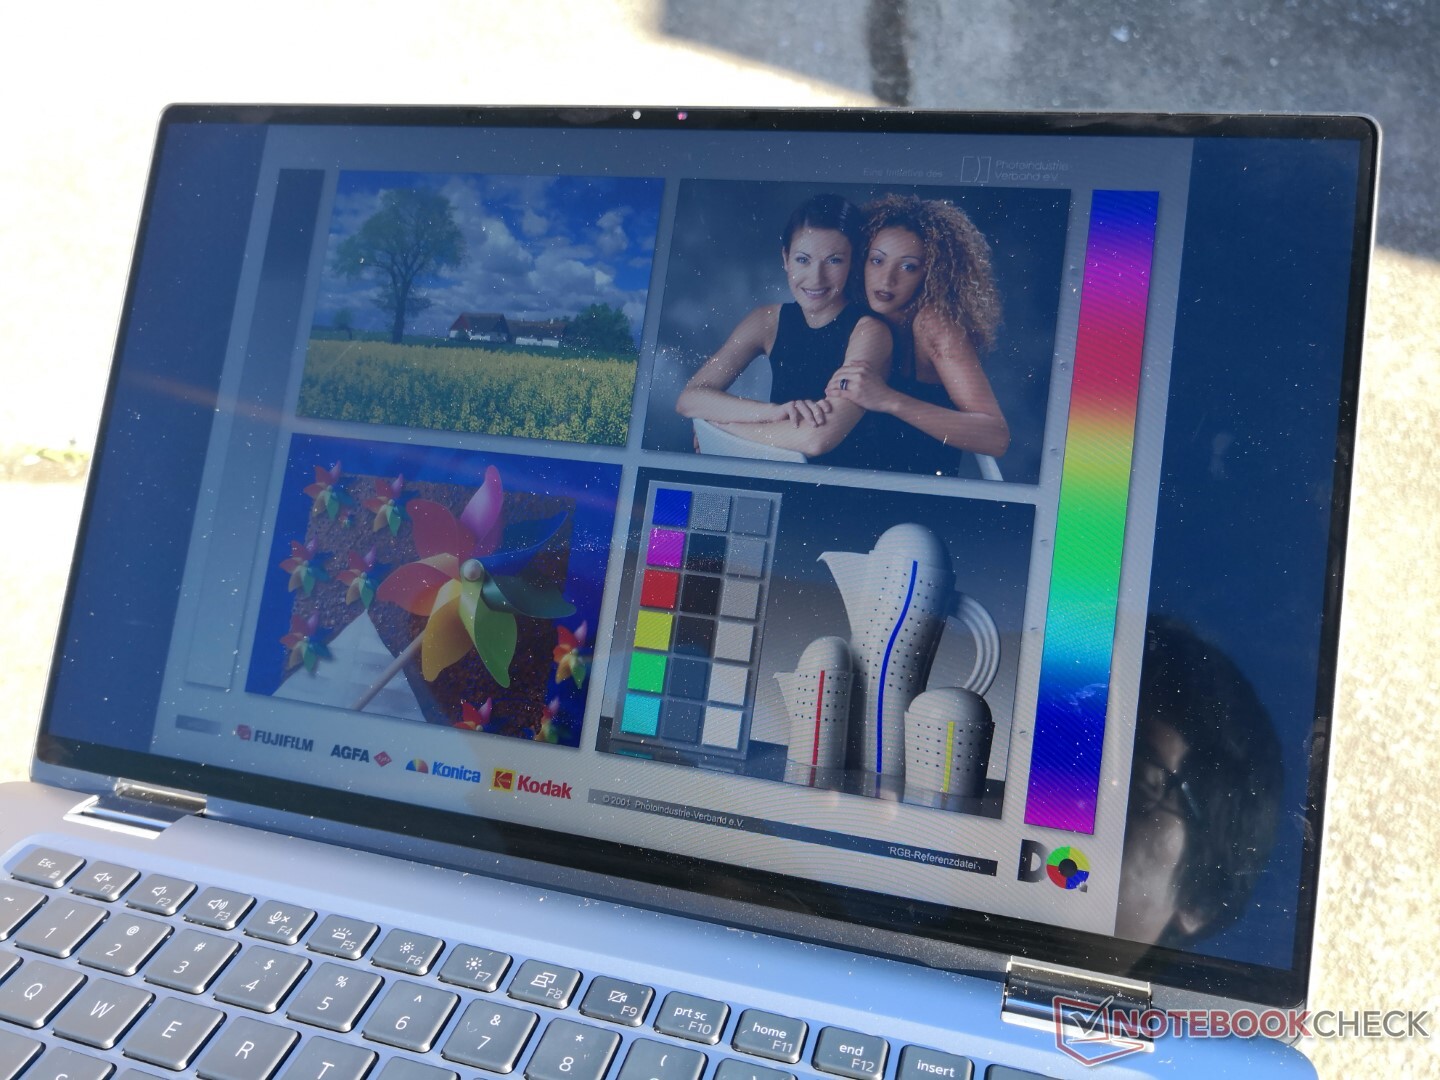
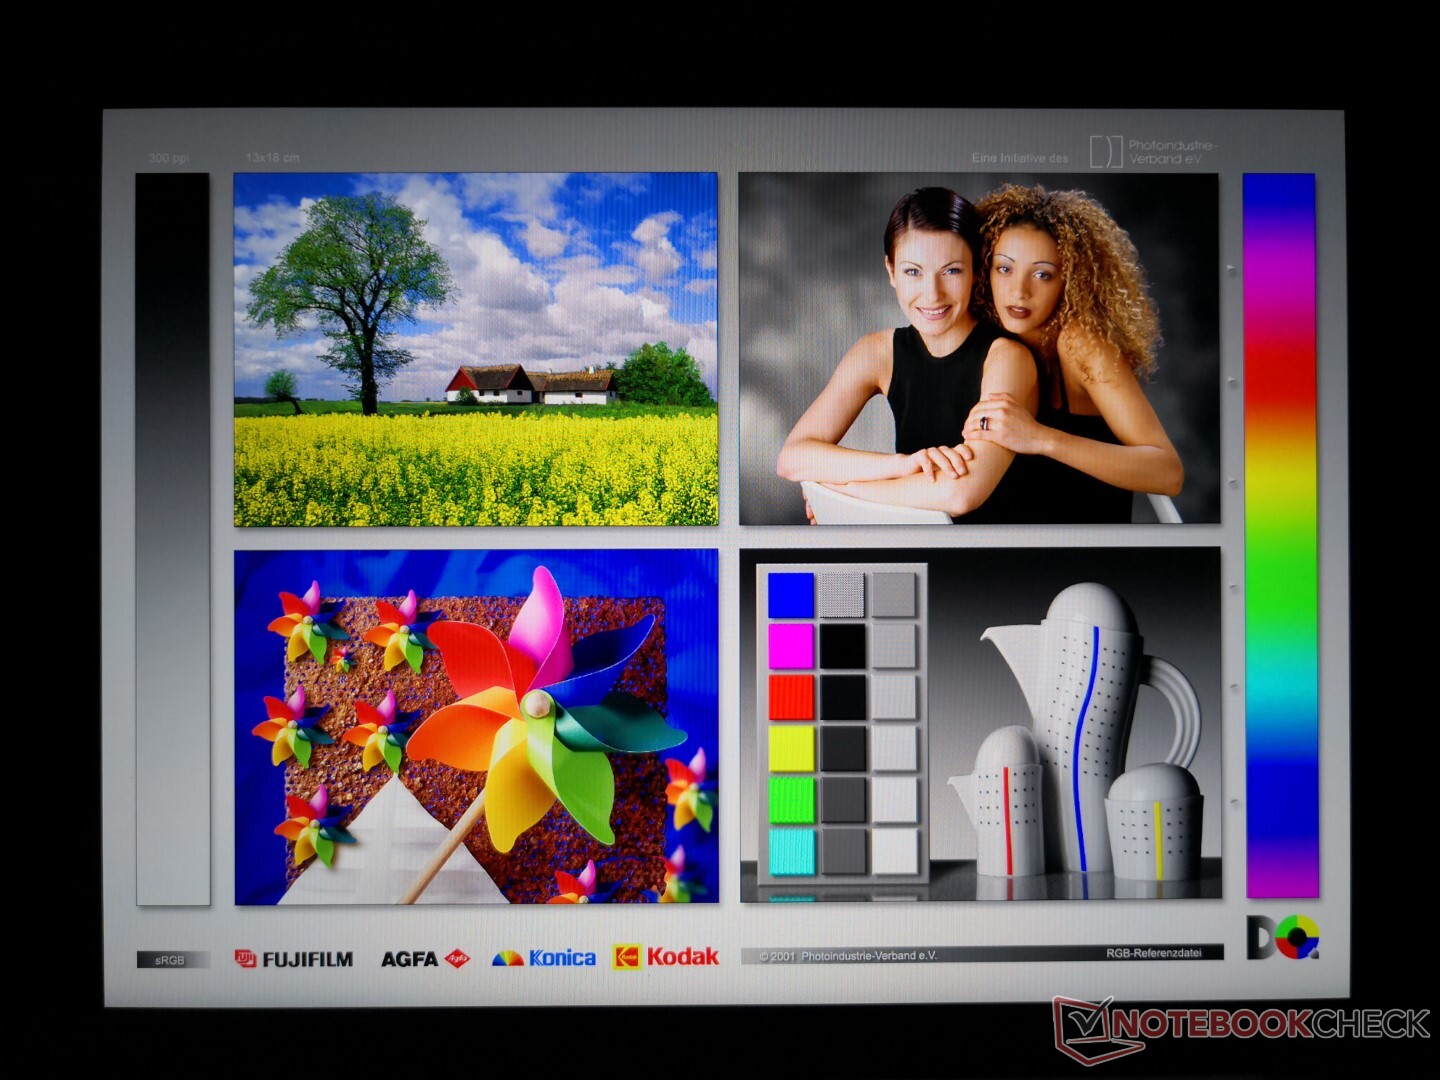
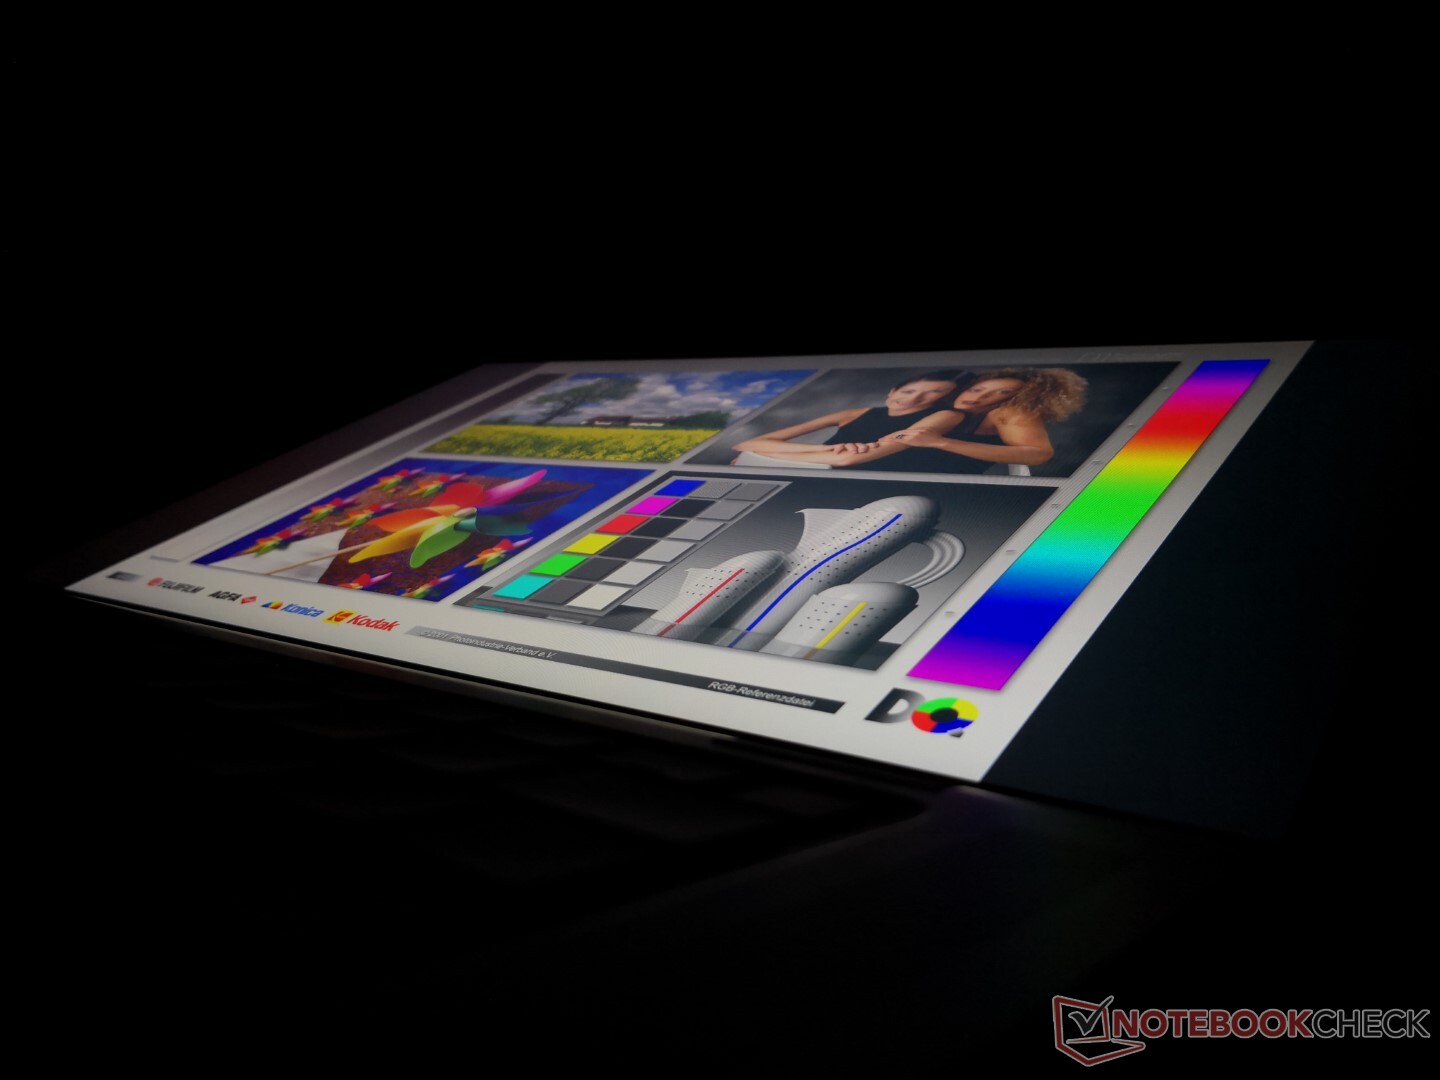
Dell använder samma AU Optronics B150HAN IPS-panel på både Latitude 9510 2-in-1 och 9520 2-in-1 för en liknande visuell upplevelse. Det finns tyvärr inga nya panelalternativ för 9520 2-in-1. 4K- eller OLED-alternativ skulle vara bra att se på framtida revideringar av Latitude 2-in-1.
| |||||||||||||||||||||||||
Distribution av ljusstyrkan: 84 %
Mitt på batteriet: 403.6 cd/m²
Kontrast: 1835:1 (Svärta: 0.22 cd/m²)
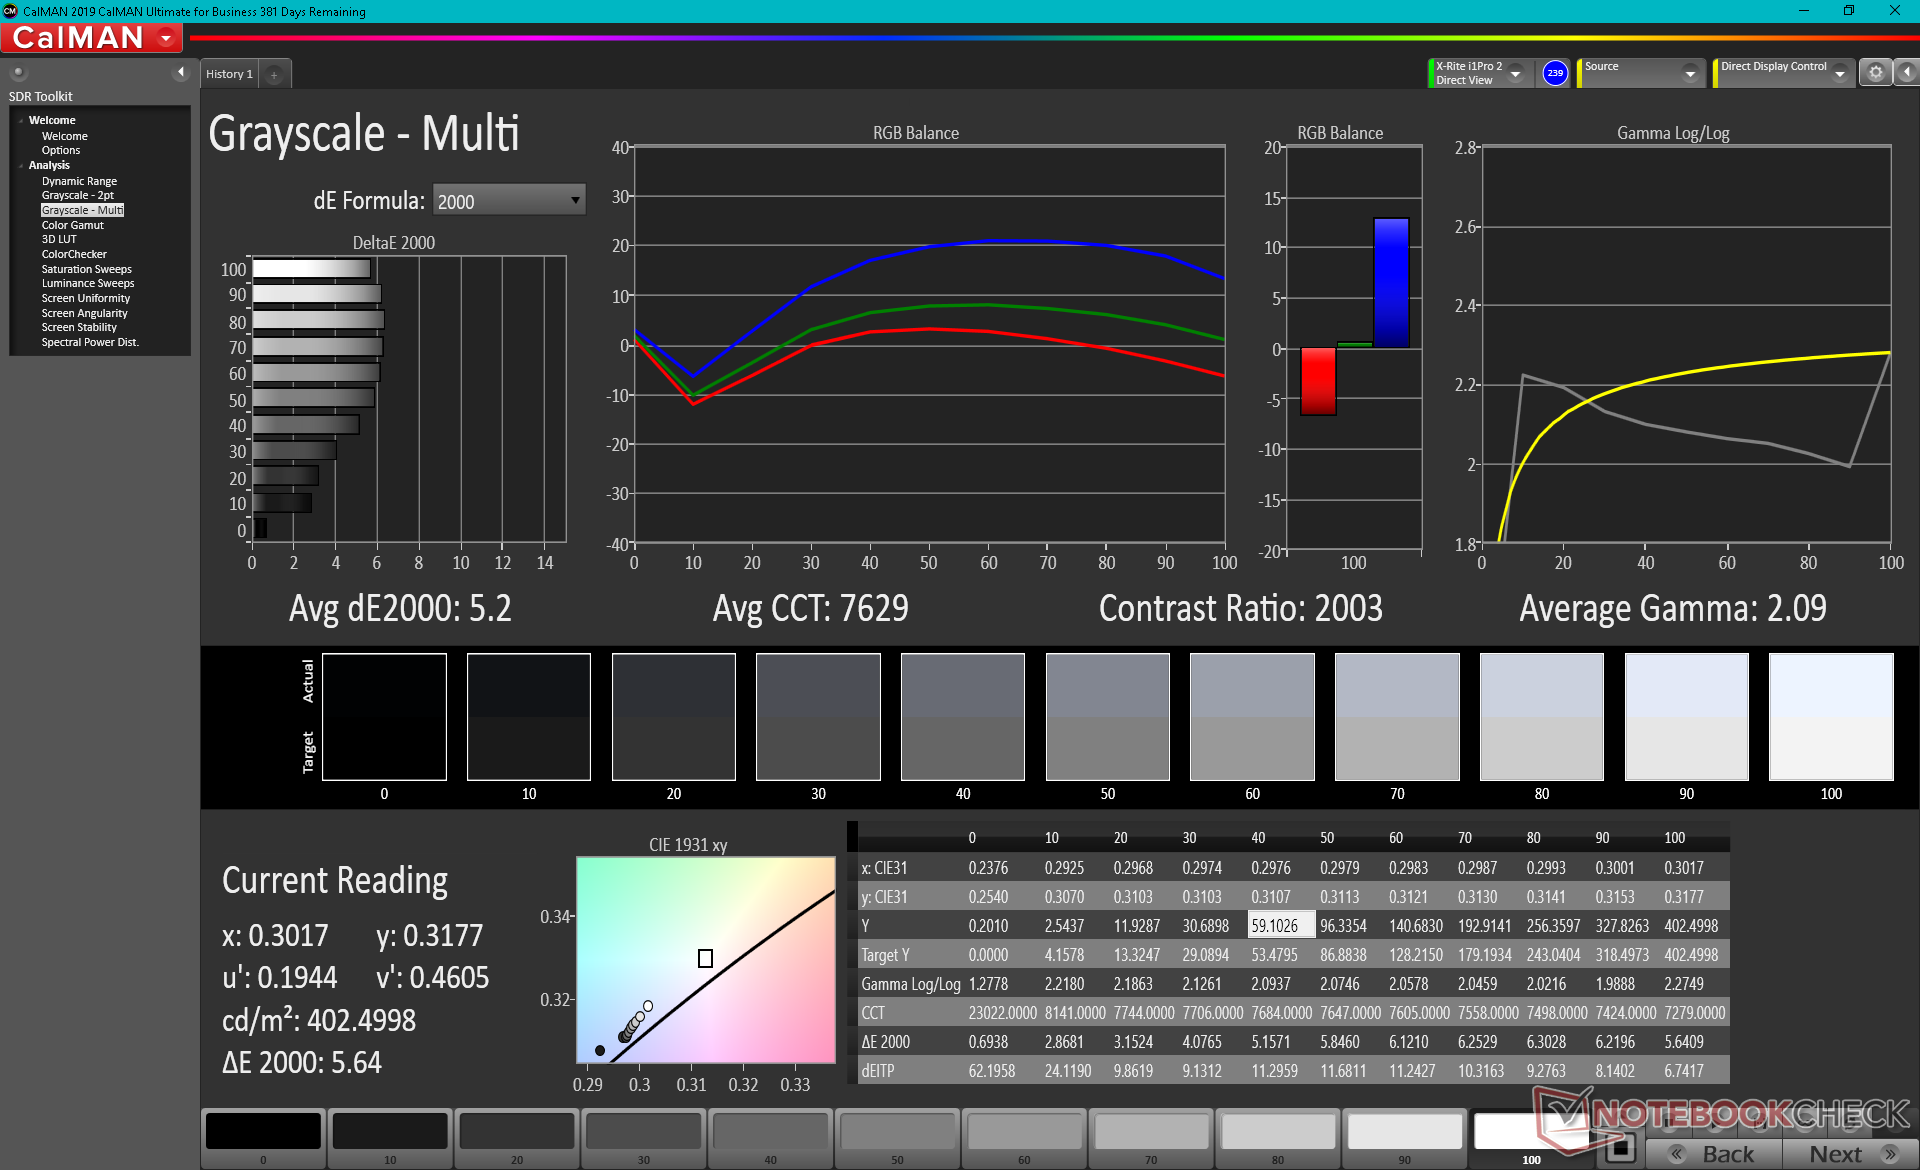
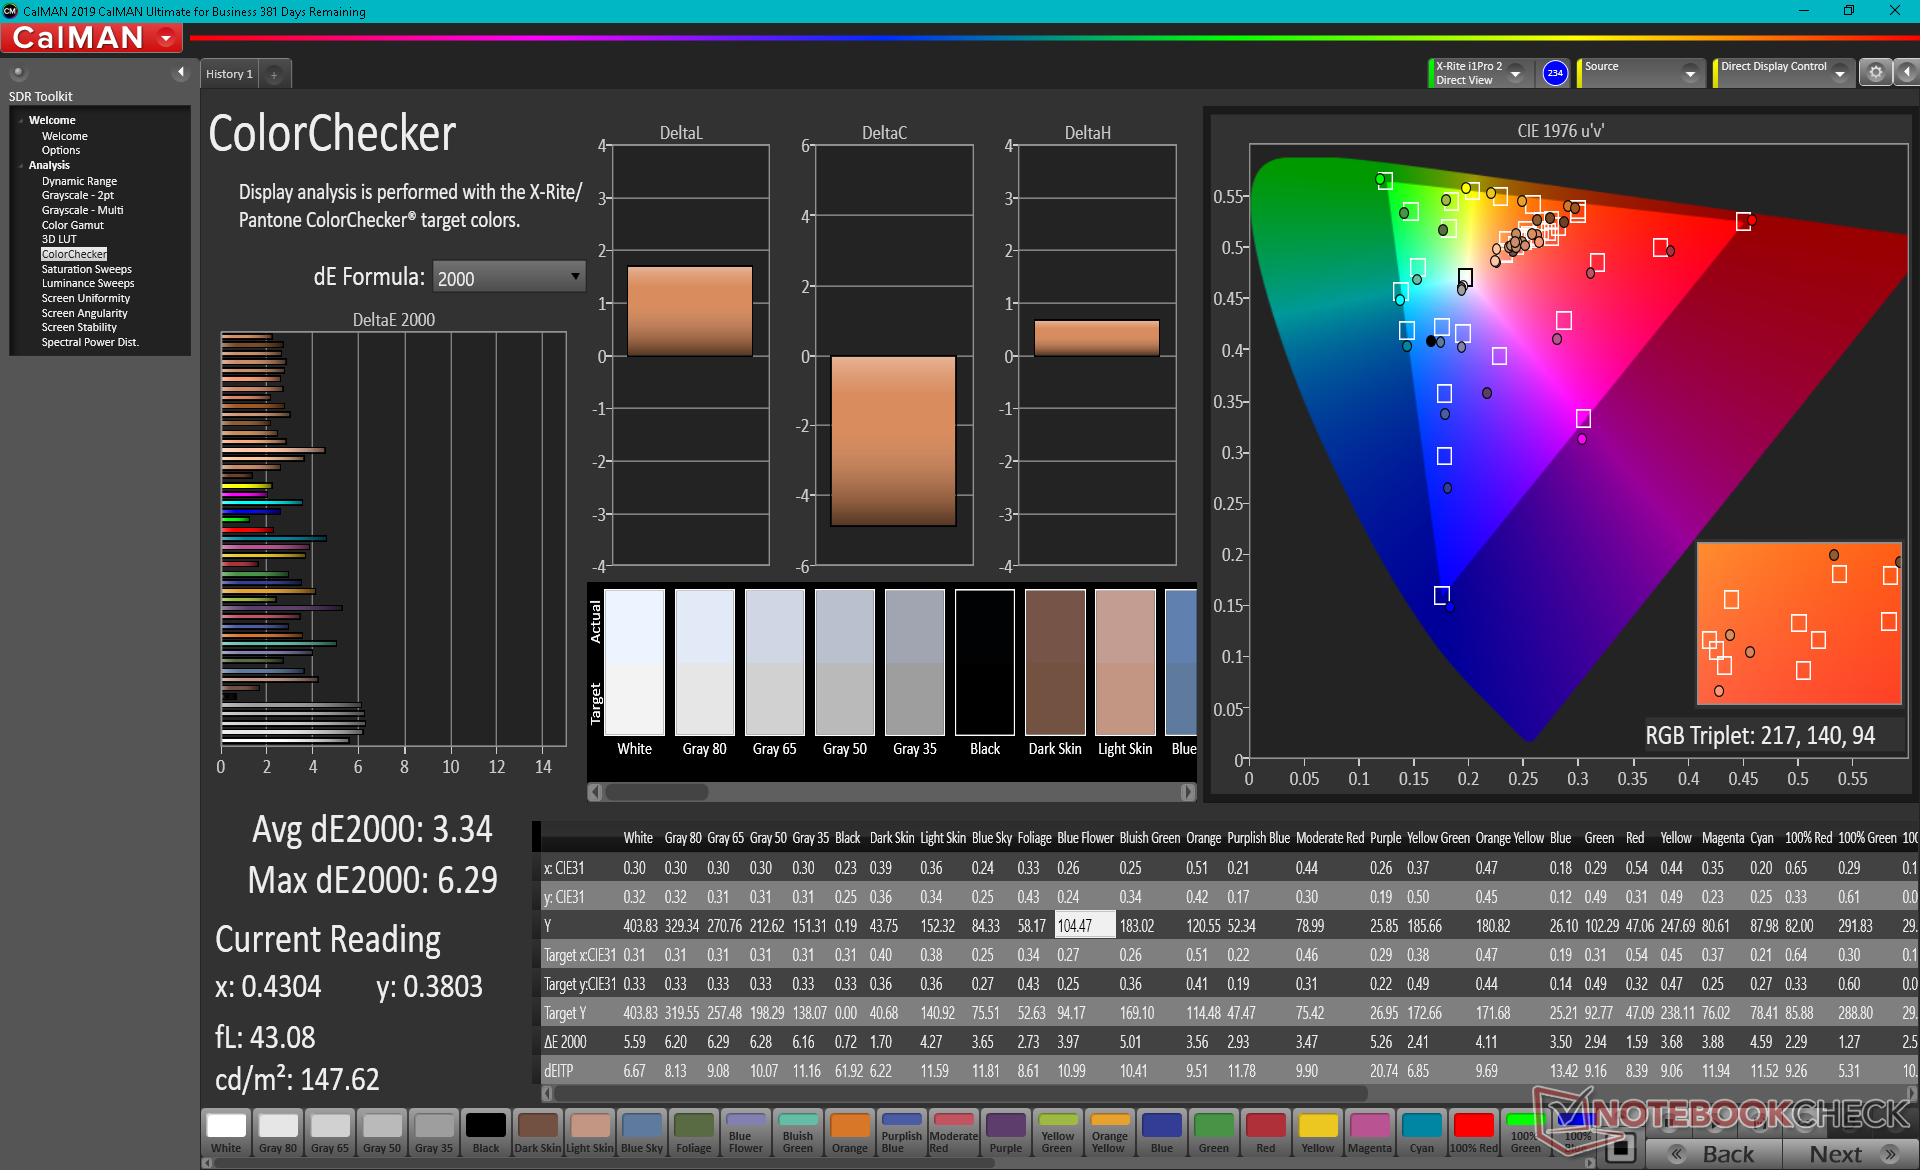
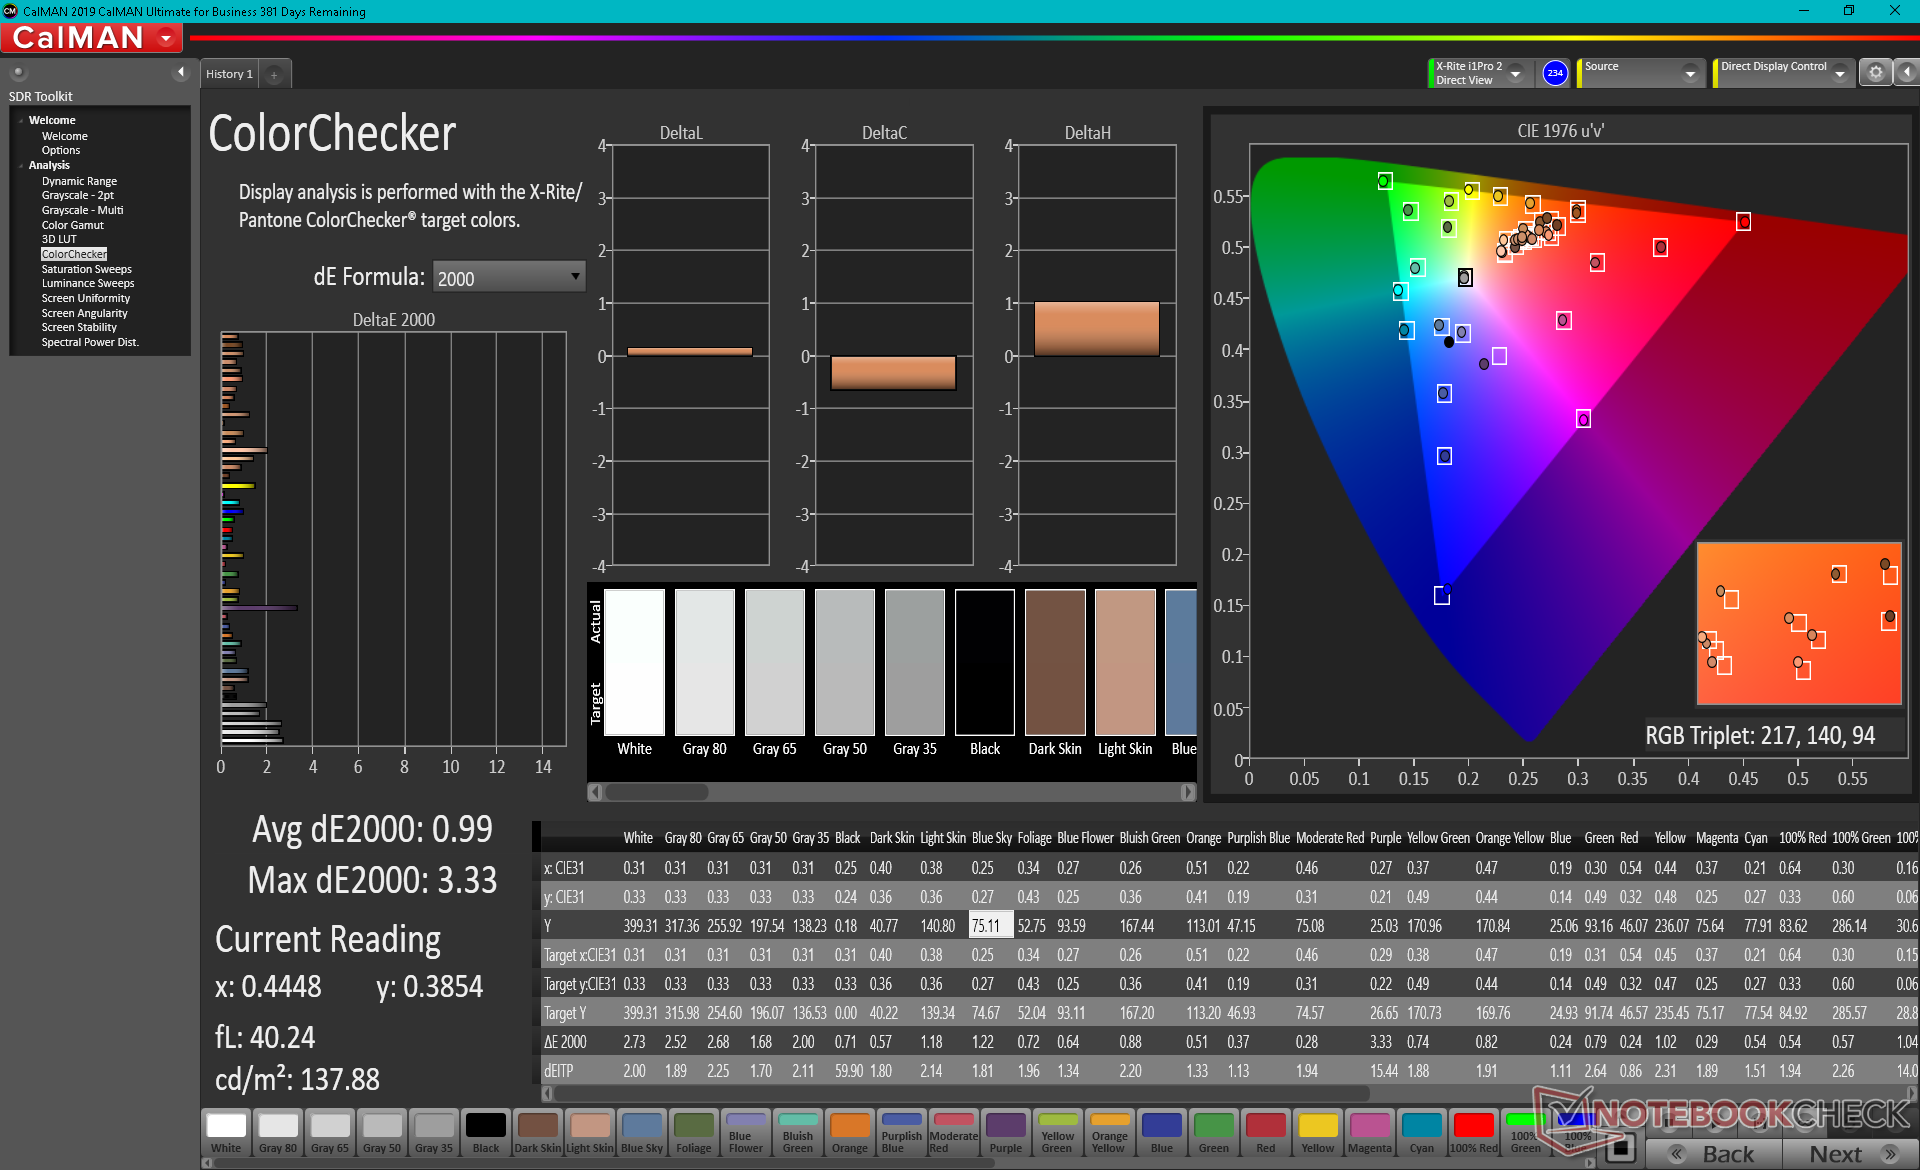
ΔE ColorChecker Calman: 3.34 | ∀{0.5-29.43 Ø4.73}
calibrated: 0.99
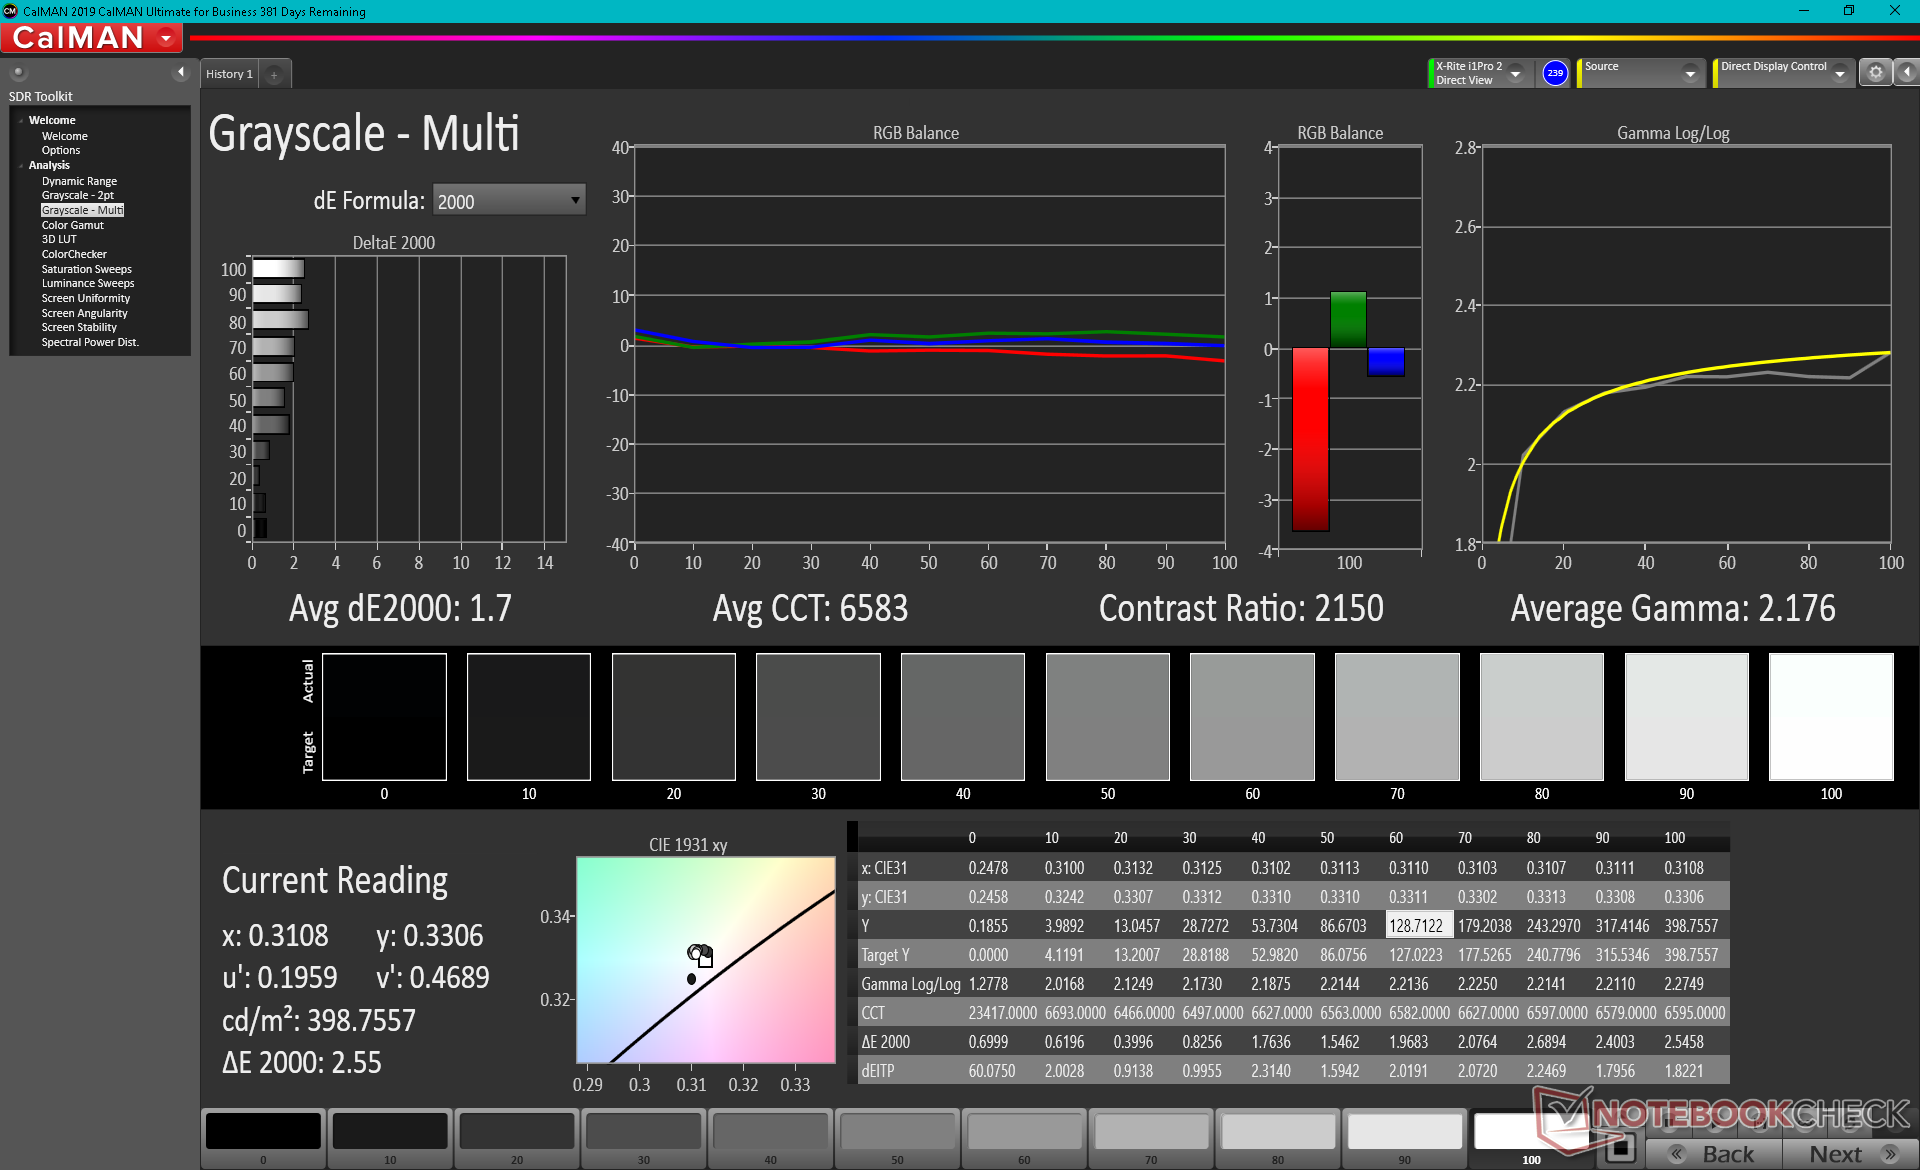
ΔE Greyscale Calman: 5.2 | ∀{0.09-98 Ø4.97}
70.4% AdobeRGB 1998 (Argyll 3D)
98.7% sRGB (Argyll 3D)
69.9% Display P3 (Argyll 3D)
Gamma: 2.09
CCT: 7629 K
| Dell Latitude 15 9520 2-in-1 AU Optronics B150HAN, IPS, 1920x1080, 15" | Dell Latitude 9510 2-in-1 AU Optronics B150HAN, IPS, 1920x1080, 15" | HP EliteBook 850 G8 3C7Z8EA InfoVision X156NVF8 R1, I, 1920x1080, 15.6" | Lenovo ThinkPad L15 G2 AMD N156HCA-EAB, IPS LED, 1920x1080, 15.6" | MSI Summit B15 A11M Chi Mei N156HCE-EN1, IPS, 1920x1080, 15.6" | Microsoft Surface Laptop 4 15 AMD TFF_00028 SHP14B4, IPS, 2496x1664, 15" | |
|---|---|---|---|---|---|---|
| Display | 1% | -6% | -35% | -7% | -4% | |
| Display P3 Coverage (%) | 69.9 | 71.2 2% | 43.8 -37% | 65.7 -6% | 65.2 -7% | |
| sRGB Coverage (%) | 98.7 | 99.3 1% | 95 -4% | 65.7 -33% | 90.6 -8% | 97.7 -1% |
| AdobeRGB 1998 Coverage (%) | 70.4 | 71.3 1% | 65 -8% | 45.3 -36% | 66 -6% | 67.3 -4% |
| Response Times | -27% | -19% | -6% | -11% | -32% | |
| Response Time Grey 50% / Grey 80% * (ms) | 39.2 ? | 52.8 ? -35% | 47 ? -20% | 40 -2% | 40.4 ? -3% | 58.4 ? -49% |
| Response Time Black / White * (ms) | 27.2 ? | 32 ? -18% | 32 ? -18% | 30 -10% | 32.4 ? -19% | 31.2 ? -15% |
| PWM Frequency (Hz) | 312 ? | 25510 ? | 21550 ? | |||
| Screen | -27% | 7% | -49% | -71% | 6% | |
| Brightness middle (cd/m²) | 403.6 | 426.7 6% | 802 99% | 298 -26% | 341.3 -15% | 405 0% |
| Brightness (cd/m²) | 368 | 394 7% | 702 91% | 276 -25% | 310 -16% | 379 3% |
| Brightness Distribution (%) | 84 | 87 4% | 77 -8% | 86 2% | 81 -4% | 79 -6% |
| Black Level * (cd/m²) | 0.22 | 0.3 -36% | 0.245 -11% | 0.26 -18% | 0.45 -105% | 0.26 -18% |
| Contrast (:1) | 1835 | 1422 -23% | 3273 78% | 1146 -38% | 758 -59% | 1558 -15% |
| Colorchecker dE 2000 * | 3.34 | 4.28 -28% | 6.22 -86% | 3.7 -11% | 6.17 -85% | 2.6 22% |
| Colorchecker dE 2000 max. * | 6.29 | 10.43 -66% | 9.92 -58% | 15 -138% | 11.75 -87% | 6.6 -5% |
| Colorchecker dE 2000 calibrated * | 0.99 | 1.46 -47% | 3.5 -254% | 3.3 -233% | 0.9 9% | |
| Greyscale dE 2000 * | 5.2 | 8.1 -56% | 7.69 -48% | 1.7 67% | 7.1 -37% | 1.9 63% |
| Gamma | 2.09 105% | 2.26 97% | 2.75 80% | 2.21 100% | 2.2 100% | 2.11 104% |
| CCT | 7629 85% | 7993 81% | 6135 106% | 6588 99% | 6842 95% | 6825 95% |
| Color Space (Percent of AdobeRGB 1998) (%) | 65.2 | 65 | 58.7 | 62 | ||
| Color Space (Percent of sRGB) (%) | 99.2 | 95 | 90.1 | 97.7 | ||
| Totalt genomsnitt (program/inställningar) | -18% /
-21% | -6% /
1% | -30% /
-40% | -30% /
-49% | -10% /
-2% |
* ... mindre är bättre
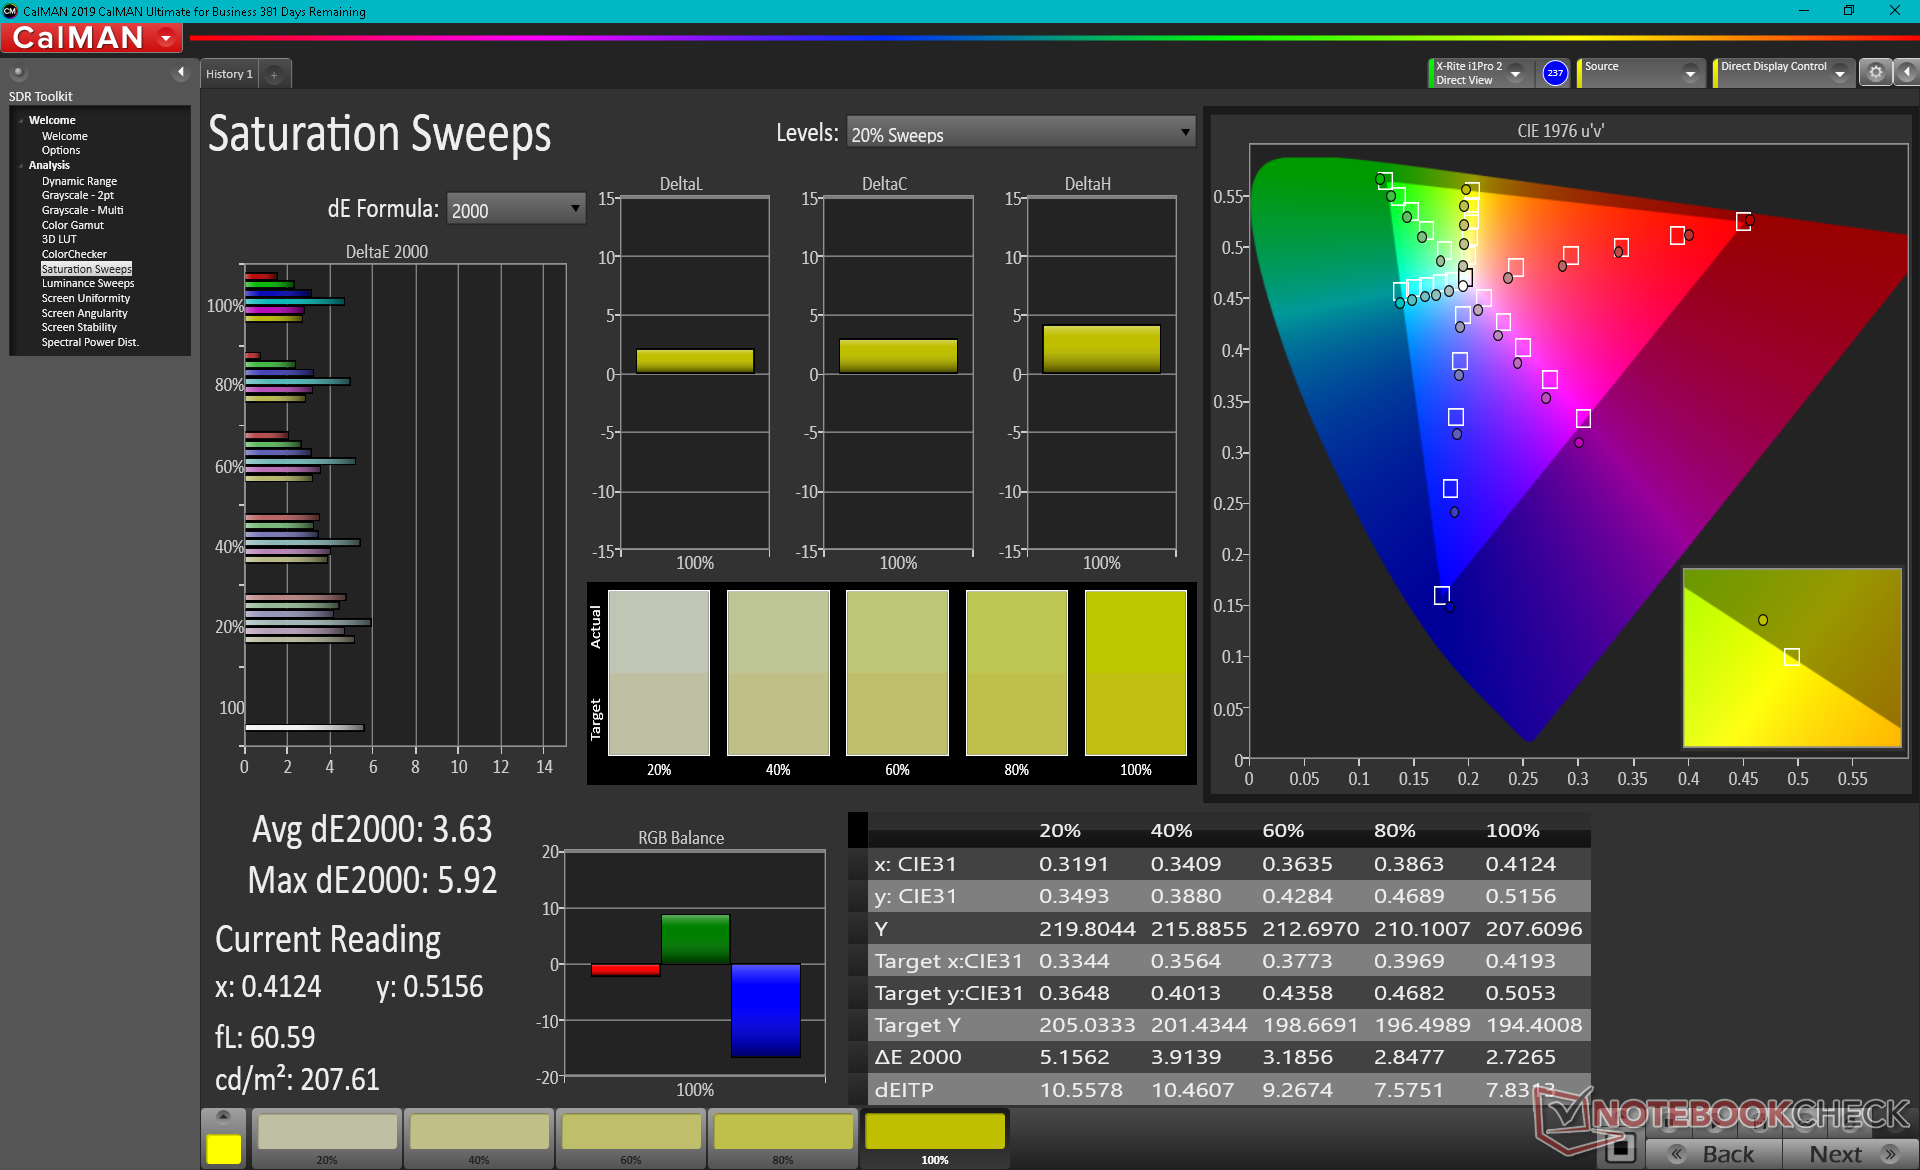
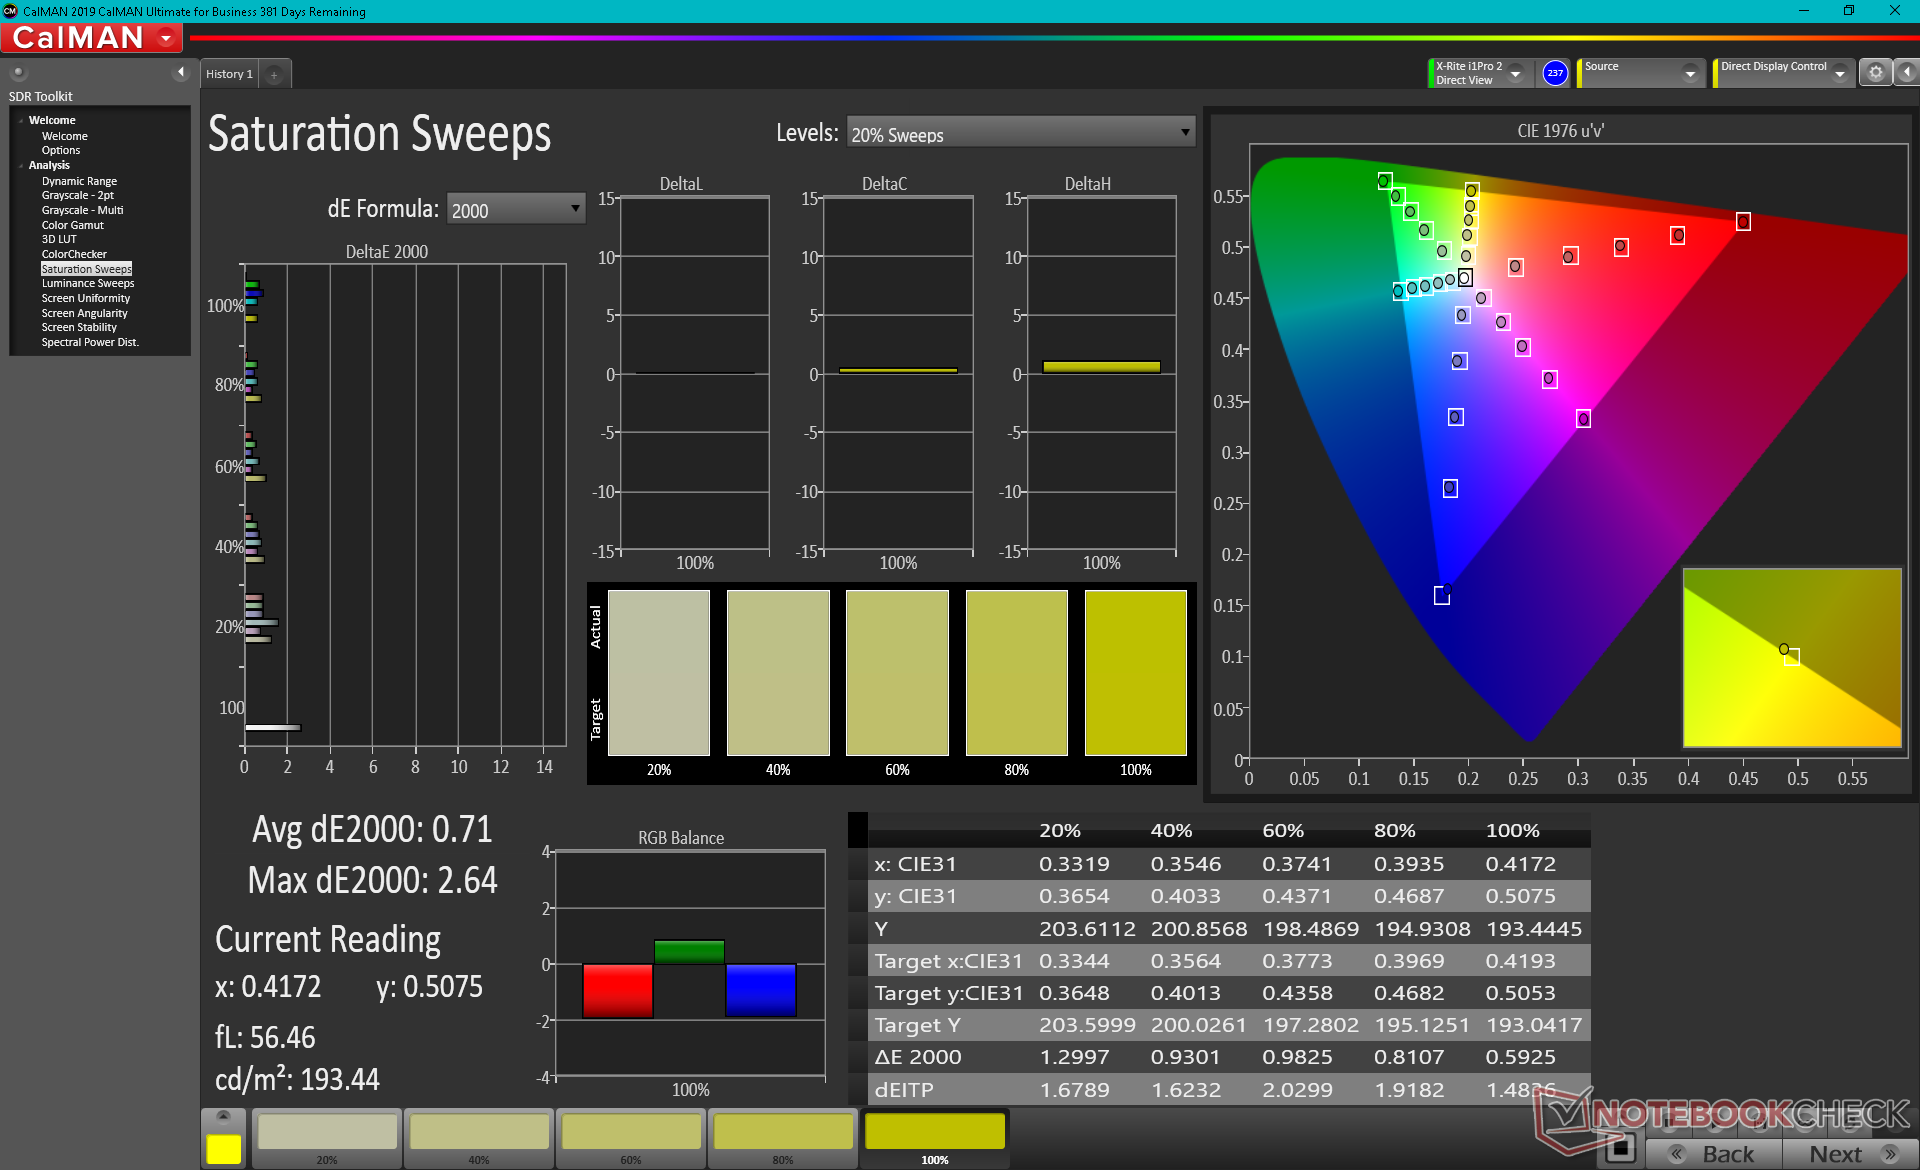
Skärmen är hyfsat kalibrerad direkt från förpackningen med genomsnittliga deltaE-värden för gråskala och färg på endast 5,2 respektive 3,34. En korrekt kalibrering av slutanvändaren kan minska dessa värden till långt under <2 vardera, vilket visas i våra CalMAN-skärmbilder nedan.
Visa svarstider
| ↔ Svarstid svart till vitt | ||
|---|---|---|
| 27.2 ms ... stiga ↗ och falla ↘ kombinerat | ↗ 14 ms stiga | 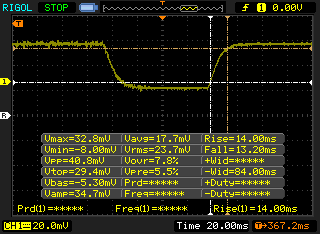 |
| ↘ 13.2 ms hösten | ||
| Skärmen visar relativt långsamma svarsfrekvenser i våra tester och kan vara för långsam för spelare. I jämförelse sträcker sig alla testade enheter från 0.1 (minst) till 240 (maximalt) ms. » 69 % av alla enheter är bättre. Detta innebär att den uppmätta svarstiden är sämre än genomsnittet av alla testade enheter (19.9 ms). | ||
| ↔ Svarstid 50 % grått till 80 % grått | ||
| 39.2 ms ... stiga ↗ och falla ↘ kombinerat | ↗ 19.2 ms stiga | 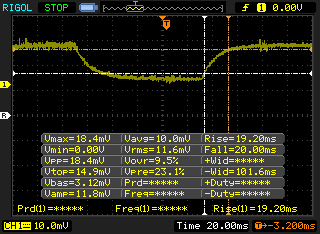 |
| ↘ 20 ms hösten | ||
| Skärmen visar långsamma svarsfrekvenser i våra tester och kommer att vara otillfredsställande för spelare. I jämförelse sträcker sig alla testade enheter från 0.165 (minst) till 636 (maximalt) ms. » 60 % av alla enheter är bättre. Detta innebär att den uppmätta svarstiden är sämre än genomsnittet av alla testade enheter (31.1 ms). | ||
Skärmflimmer / PWM (Puls-Width Modulation)
| Skärmflimmer / PWM upptäcktes inte | 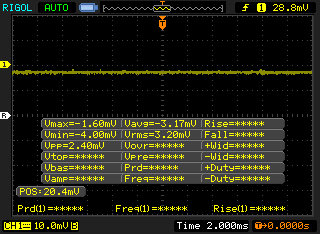 | ||
Som jämförelse: 52 % av alla testade enheter använder inte PWM för att dämpa skärmen. Om PWM upptäcktes mättes ett medelvärde av 7784 (minst: 5 - maximum: 343500) Hz. | |||
Prestanda
Provningsförhållanden
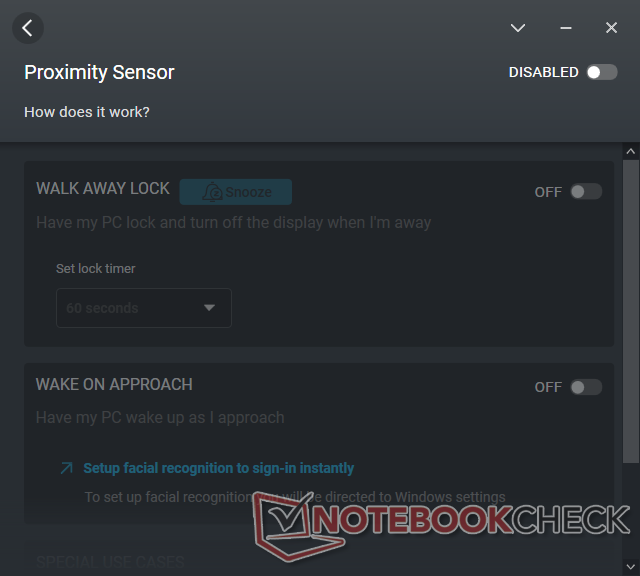
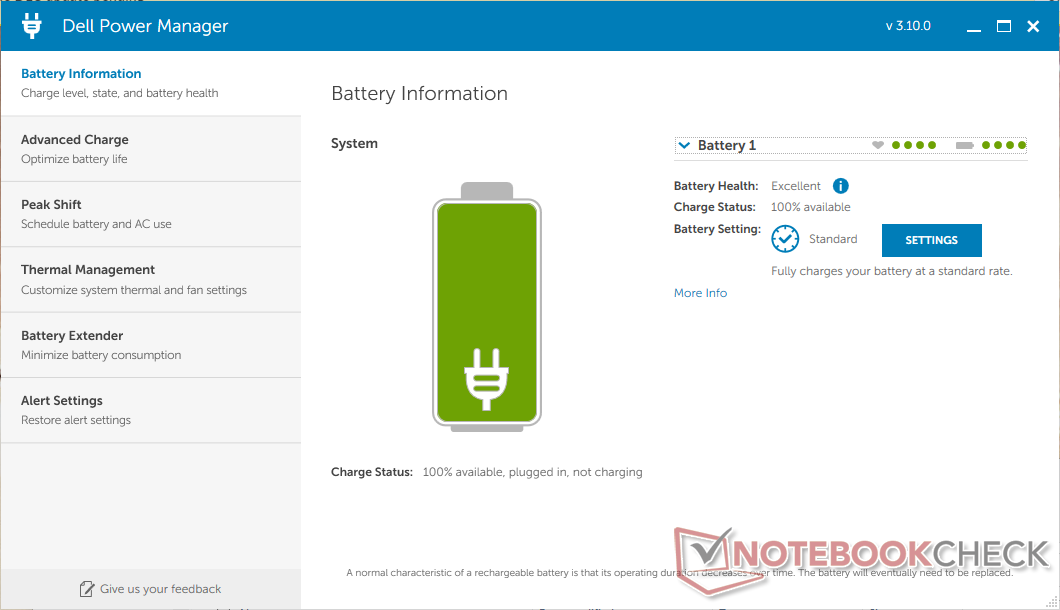
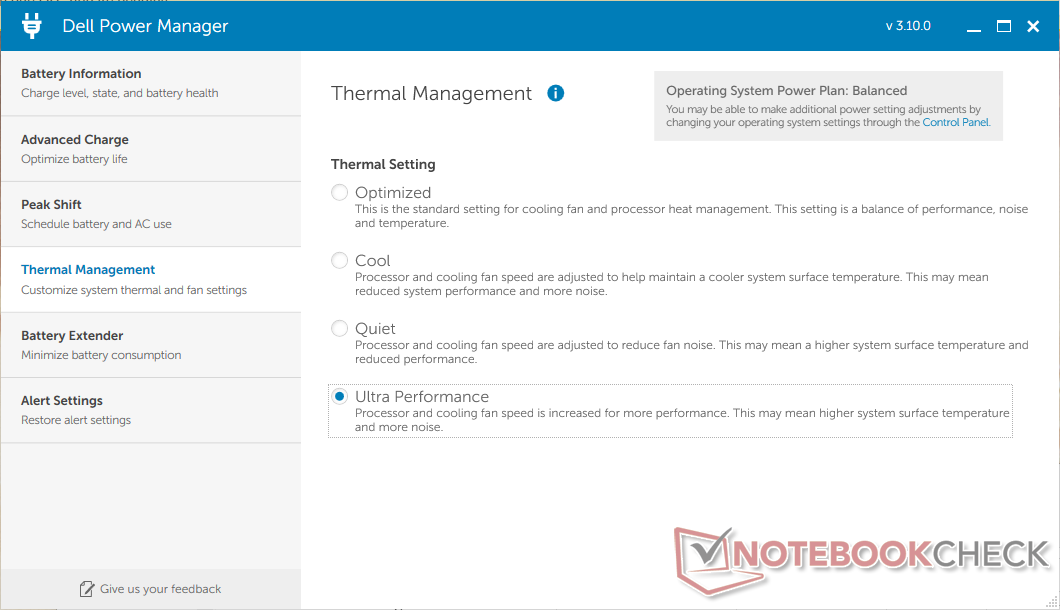
Vårt system ställdes in i Windows-läget "Bästa prestanda" och Dell Power Manager ställdes in på Ultra Performance innan vi körde de nedanstående riktmärkena för att få högsta möjliga poäng. Användarna bör också bekanta sig med den förinstallerade Dell Optimizer-programvaran som innehåller ytterligare inställningar för ljud, nätverk och närhetssensor för handsfree-inloggning.
Processor
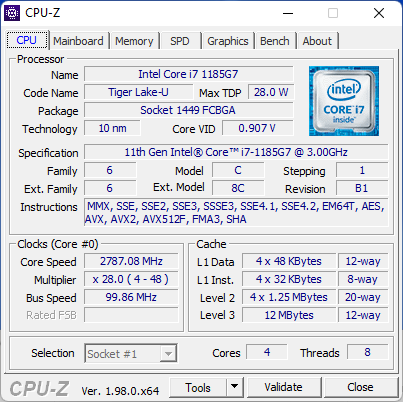
CPU-prestanda med flera trådar är en blandad kompott eftersom Core i7-1185G7 har två färre kärnor än i förra årets Core i7-10810U vilket innebär en nedgradering på cirka 25 till 35 procent. Deltaet är större än väntat eftersom i7-1185G7 i vår Latitude 9520 2-in-1 presterar minst 15 till 20 procent långsammare än de flesta andra bärbara datorer som använder exakt samma CPU. Core i7-1185G7-processorn i den MSI Stealth 15Mkan till exempel erbjuda upp till 50 procent snabbare prestanda för flera trådar än vår Dell
Prestandan för entrådig process är tack och lov där den borde vara i förhållande till den genomsnittliga Core i7-1185G7. Användare kan förvänta sig cirka 30 procent snabbare prestanda än Core i7-10810U i detta avseende.
Cinebench R15 Multi Loop
Cinebench R23: Multi Core | Single Core
Cinebench R20: CPU (Multi Core) | CPU (Single Core)
Cinebench R15: CPU Multi 64Bit | CPU Single 64Bit
Blender: v2.79 BMW27 CPU
7-Zip 18.03: 7z b 4 | 7z b 4 -mmt1
Geekbench 5.5: Multi-Core | Single-Core
HWBOT x265 Benchmark v2.2: 4k Preset
LibreOffice : 20 Documents To PDF
R Benchmark 2.5: Overall mean
| CPU Performance rating | |
| HP Pavilion Aero 13 be0097nr -2! | |
| Lenovo ThinkPad E15 G3-20YG003UGE | |
| Microsoft Surface Laptop 4 15 AMD TFF_00028 | |
| Lenovo ThinkPad L15 G2 AMD | |
| MSI Prestige 15 A10SC -10! | |
| Genomsnitt Intel Core i7-1185G7 | |
| HP EliteBook 850 G8 3C7Z8EA | |
| Asus ZenBook 15 UX534FT-DB77 -10! | |
| Dell Latitude 15 9520 2-in-1 -2! | |
| Asus ExpertBook B1 B1500CEAE, i5-1135G7 | |
| Samsung Galaxy Book Flex 15-NP950 -2! | |
| Dell Latitude 9510 2-in-1 -2! | |
| LG Gram 15Z90N -3! | |
| Cinebench R23 / Multi Core | |
| Microsoft Surface Laptop 4 15 AMD TFF_00028 | |
| Lenovo ThinkPad E15 G3-20YG003UGE | |
| HP Pavilion Aero 13 be0097nr | |
| Lenovo ThinkPad L15 G2 AMD | |
| Genomsnitt Intel Core i7-1185G7 (3610 - 6383, n=24) | |
| HP EliteBook 850 G8 3C7Z8EA | |
| Dell Latitude 15 9520 2-in-1 | |
| Asus ExpertBook B1 B1500CEAE, i5-1135G7 | |
| Cinebench R23 / Single Core | |
| HP EliteBook 850 G8 3C7Z8EA | |
| Genomsnitt Intel Core i7-1185G7 (1251 - 1532, n=24) | |
| HP Pavilion Aero 13 be0097nr | |
| Dell Latitude 15 9520 2-in-1 | |
| Lenovo ThinkPad L15 G2 AMD | |
| Microsoft Surface Laptop 4 15 AMD TFF_00028 | |
| Lenovo ThinkPad E15 G3-20YG003UGE | |
| Asus ExpertBook B1 B1500CEAE, i5-1135G7 | |
| Cinebench R20 / CPU (Multi Core) | |
| Lenovo ThinkPad E15 G3-20YG003UGE | |
| Microsoft Surface Laptop 4 15 AMD TFF_00028 | |
| HP Pavilion Aero 13 be0097nr | |
| Lenovo ThinkPad L15 G2 AMD | |
| MSI Prestige 15 A10SC | |
| Dell Latitude 9510 2-in-1 | |
| Genomsnitt Intel Core i7-1185G7 (1425 - 2493, n=28) | |
| Samsung Galaxy Book Flex 15-NP950 | |
| HP EliteBook 850 G8 3C7Z8EA | |
| Dell Latitude 15 9520 2-in-1 | |
| Asus ExpertBook B1 B1500CEAE, i5-1135G7 | |
| Asus ZenBook 15 UX534FT-DB77 | |
| LG Gram 15Z90N | |
| Cinebench R20 / CPU (Single Core) | |
| HP EliteBook 850 G8 3C7Z8EA | |
| Genomsnitt Intel Core i7-1185G7 (489 - 593, n=28) | |
| HP Pavilion Aero 13 be0097nr | |
| Dell Latitude 15 9520 2-in-1 | |
| Lenovo ThinkPad L15 G2 AMD | |
| Microsoft Surface Laptop 4 15 AMD TFF_00028 | |
| Lenovo ThinkPad E15 G3-20YG003UGE | |
| Asus ExpertBook B1 B1500CEAE, i5-1135G7 | |
| Samsung Galaxy Book Flex 15-NP950 | |
| MSI Prestige 15 A10SC | |
| Asus ZenBook 15 UX534FT-DB77 | |
| Dell Latitude 9510 2-in-1 | |
| LG Gram 15Z90N | |
| Cinebench R15 / CPU Multi 64Bit | |
| Microsoft Surface Laptop 4 15 AMD TFF_00028 | |
| Lenovo ThinkPad E15 G3-20YG003UGE | |
| HP Pavilion Aero 13 be0097nr | |
| Lenovo ThinkPad L15 G2 AMD | |
| MSI Prestige 15 A10SC | |
| Dell Latitude 9510 2-in-1 | |
| Genomsnitt Intel Core i7-1185G7 (617 - 1066, n=32) | |
| Asus ExpertBook B1 B1500CEAE, i5-1135G7 | |
| Samsung Galaxy Book Flex 15-NP950 | |
| HP EliteBook 850 G8 3C7Z8EA | |
| Dell Latitude 15 9520 2-in-1 | |
| Asus ZenBook 15 UX534FT-DB77 | |
| LG Gram 15Z90N | |
| Cinebench R15 / CPU Single 64Bit | |
| HP Pavilion Aero 13 be0097nr | |
| Lenovo ThinkPad L15 G2 AMD | |
| HP EliteBook 850 G8 3C7Z8EA | |
| Genomsnitt Intel Core i7-1185G7 (168 - 230, n=27) | |
| Dell Latitude 15 9520 2-in-1 | |
| Asus ExpertBook B1 B1500CEAE, i5-1135G7 | |
| MSI Prestige 15 A10SC | |
| Lenovo ThinkPad E15 G3-20YG003UGE | |
| Microsoft Surface Laptop 4 15 AMD TFF_00028 | |
| Asus ZenBook 15 UX534FT-DB77 | |
| Samsung Galaxy Book Flex 15-NP950 | |
| Dell Latitude 9510 2-in-1 | |
| LG Gram 15Z90N | |
| Blender / v2.79 BMW27 CPU | |
| LG Gram 15Z90N | |
| Dell Latitude 9510 2-in-1 | |
| Samsung Galaxy Book Flex 15-NP950 | |
| Asus ExpertBook B1 B1500CEAE, i5-1135G7 | |
| HP EliteBook 850 G8 3C7Z8EA | |
| Dell Latitude 15 9520 2-in-1 | |
| Genomsnitt Intel Core i7-1185G7 (478 - 745, n=28) | |
| Lenovo ThinkPad L15 G2 AMD | |
| Microsoft Surface Laptop 4 15 AMD TFF_00028 | |
| HP Pavilion Aero 13 be0097nr | |
| Lenovo ThinkPad E15 G3-20YG003UGE | |
| 7-Zip 18.03 / 7z b 4 | |
| HP Pavilion Aero 13 be0097nr | |
| Microsoft Surface Laptop 4 15 AMD TFF_00028 | |
| Lenovo ThinkPad E15 G3-20YG003UGE | |
| Lenovo ThinkPad L15 G2 AMD | |
| Genomsnitt Intel Core i7-1185G7 (18812 - 27693, n=27) | |
| Samsung Galaxy Book Flex 15-NP950 | |
| Dell Latitude 15 9520 2-in-1 | |
| HP EliteBook 850 G8 3C7Z8EA | |
| Asus ExpertBook B1 B1500CEAE, i5-1135G7 | |
| Dell Latitude 9510 2-in-1 | |
| LG Gram 15Z90N | |
| 7-Zip 18.03 / 7z b 4 -mmt1 | |
| HP Pavilion Aero 13 be0097nr | |
| HP EliteBook 850 G8 3C7Z8EA | |
| Lenovo ThinkPad L15 G2 AMD | |
| Genomsnitt Intel Core i7-1185G7 (3678 - 5507, n=27) | |
| Dell Latitude 15 9520 2-in-1 | |
| Asus ExpertBook B1 B1500CEAE, i5-1135G7 | |
| Samsung Galaxy Book Flex 15-NP950 | |
| Lenovo ThinkPad E15 G3-20YG003UGE | |
| Dell Latitude 9510 2-in-1 | |
| Microsoft Surface Laptop 4 15 AMD TFF_00028 | |
| LG Gram 15Z90N | |
| Geekbench 5.5 / Multi-Core | |
| Microsoft Surface Laptop 4 15 AMD TFF_00028 | |
| Lenovo ThinkPad E15 G3-20YG003UGE | |
| HP EliteBook 850 G8 3C7Z8EA | |
| Genomsnitt Intel Core i7-1185G7 (4620 - 5944, n=21) | |
| Lenovo ThinkPad L15 G2 AMD | |
| Samsung Galaxy Book Flex 15-NP950 | |
| Asus ExpertBook B1 B1500CEAE, i5-1135G7 | |
| Dell Latitude 9510 2-in-1 | |
| LG Gram 15Z90N | |
| Geekbench 5.5 / Single-Core | |
| HP EliteBook 850 G8 3C7Z8EA | |
| Genomsnitt Intel Core i7-1185G7 (1398 - 1626, n=21) | |
| Lenovo ThinkPad L15 G2 AMD | |
| Asus ExpertBook B1 B1500CEAE, i5-1135G7 | |
| Samsung Galaxy Book Flex 15-NP950 | |
| Dell Latitude 9510 2-in-1 | |
| Lenovo ThinkPad E15 G3-20YG003UGE | |
| LG Gram 15Z90N | |
| Microsoft Surface Laptop 4 15 AMD TFF_00028 | |
| HWBOT x265 Benchmark v2.2 / 4k Preset | |
| HP Pavilion Aero 13 be0097nr | |
| Lenovo ThinkPad E15 G3-20YG003UGE | |
| Microsoft Surface Laptop 4 15 AMD TFF_00028 | |
| Lenovo ThinkPad L15 G2 AMD | |
| Genomsnitt Intel Core i7-1185G7 (5.02 - 8.13, n=27) | |
| Samsung Galaxy Book Flex 15-NP950 | |
| HP EliteBook 850 G8 3C7Z8EA | |
| Dell Latitude 15 9520 2-in-1 | |
| Asus ExpertBook B1 B1500CEAE, i5-1135G7 | |
| Dell Latitude 9510 2-in-1 | |
| LibreOffice / 20 Documents To PDF | |
| Microsoft Surface Laptop 4 15 AMD TFF_00028 | |
| Dell Latitude 9510 2-in-1 | |
| Lenovo ThinkPad E15 G3-20YG003UGE | |
| Samsung Galaxy Book Flex 15-NP950 | |
| HP EliteBook 850 G8 3C7Z8EA | |
| HP Pavilion Aero 13 be0097nr | |
| Dell Latitude 15 9520 2-in-1 | |
| Asus ExpertBook B1 B1500CEAE, i5-1135G7 | |
| Genomsnitt Intel Core i7-1185G7 (41.3 - 61.7, n=26) | |
| Lenovo ThinkPad L15 G2 AMD | |
| LG Gram 15Z90N | |
| R Benchmark 2.5 / Overall mean | |
| LG Gram 15Z90N | |
| Dell Latitude 9510 2-in-1 | |
| Samsung Galaxy Book Flex 15-NP950 | |
| Asus ExpertBook B1 B1500CEAE, i5-1135G7 | |
| Microsoft Surface Laptop 4 15 AMD TFF_00028 | |
| Dell Latitude 15 9520 2-in-1 | |
| Lenovo ThinkPad E15 G3-20YG003UGE | |
| Genomsnitt Intel Core i7-1185G7 (0.55 - 0.615, n=27) | |
| HP EliteBook 850 G8 3C7Z8EA | |
| Lenovo ThinkPad L15 G2 AMD | |
| HP Pavilion Aero 13 be0097nr | |
Cinebench R23: Multi Core | Single Core
Cinebench R20: CPU (Multi Core) | CPU (Single Core)
Cinebench R15: CPU Multi 64Bit | CPU Single 64Bit
Blender: v2.79 BMW27 CPU
7-Zip 18.03: 7z b 4 | 7z b 4 -mmt1
Geekbench 5.5: Multi-Core | Single-Core
HWBOT x265 Benchmark v2.2: 4k Preset
LibreOffice : 20 Documents To PDF
R Benchmark 2.5: Overall mean
* ... mindre är bättre
AIDA64: FP32 Ray-Trace | FPU Julia | CPU SHA3 | CPU Queen | FPU SinJulia | FPU Mandel | CPU AES | CPU ZLib | FP64 Ray-Trace | CPU PhotoWorxx
| Performance rating | |
| Microsoft Surface Laptop 4 15 AMD TFF_00028 | |
| Lenovo ThinkPad L15 G2 AMD | |
| MSI Summit B15 A11M | |
| Genomsnitt Intel Core i7-1185G7 | |
| HP EliteBook 850 G8 3C7Z8EA | |
| Dell Latitude 15 9520 2-in-1 | |
| Dell Latitude 9510 2-in-1 | |
| AIDA64 / FP32 Ray-Trace | |
| Microsoft Surface Laptop 4 15 AMD TFF_00028 | |
| Lenovo ThinkPad L15 G2 AMD | |
| MSI Summit B15 A11M | |
| Genomsnitt Intel Core i7-1185G7 (5621 - 7453, n=20) | |
| HP EliteBook 850 G8 3C7Z8EA | |
| Dell Latitude 15 9520 2-in-1 | |
| Dell Latitude 9510 2-in-1 | |
| AIDA64 / FPU Julia | |
| Microsoft Surface Laptop 4 15 AMD TFF_00028 | |
| Lenovo ThinkPad L15 G2 AMD | |
| Dell Latitude 9510 2-in-1 | |
| MSI Summit B15 A11M | |
| Genomsnitt Intel Core i7-1185G7 (23248 - 32614, n=20) | |
| HP EliteBook 850 G8 3C7Z8EA | |
| Dell Latitude 15 9520 2-in-1 | |
| AIDA64 / CPU SHA3 | |
| Microsoft Surface Laptop 4 15 AMD TFF_00028 | |
| MSI Summit B15 A11M | |
| Lenovo ThinkPad L15 G2 AMD | |
| Genomsnitt Intel Core i7-1185G7 (1530 - 2209, n=20) | |
| HP EliteBook 850 G8 3C7Z8EA | |
| Dell Latitude 15 9520 2-in-1 | |
| Dell Latitude 9510 2-in-1 | |
| AIDA64 / CPU Queen | |
| Microsoft Surface Laptop 4 15 AMD TFF_00028 | |
| Lenovo ThinkPad L15 G2 AMD | |
| Dell Latitude 9510 2-in-1 | |
| HP EliteBook 850 G8 3C7Z8EA | |
| Genomsnitt Intel Core i7-1185G7 (44677 - 52815, n=20) | |
| Dell Latitude 15 9520 2-in-1 | |
| MSI Summit B15 A11M | |
| AIDA64 / FPU SinJulia | |
| Microsoft Surface Laptop 4 15 AMD TFF_00028 | |
| Lenovo ThinkPad L15 G2 AMD | |
| Dell Latitude 9510 2-in-1 | |
| MSI Summit B15 A11M | |
| Genomsnitt Intel Core i7-1185G7 (3870 - 5027, n=20) | |
| HP EliteBook 850 G8 3C7Z8EA | |
| Dell Latitude 15 9520 2-in-1 | |
| AIDA64 / FPU Mandel | |
| Microsoft Surface Laptop 4 15 AMD TFF_00028 | |
| Lenovo ThinkPad L15 G2 AMD | |
| MSI Summit B15 A11M | |
| Genomsnitt Intel Core i7-1185G7 (14584 - 19594, n=20) | |
| HP EliteBook 850 G8 3C7Z8EA | |
| Dell Latitude 15 9520 2-in-1 | |
| Dell Latitude 9510 2-in-1 | |
| AIDA64 / CPU AES | |
| Lenovo ThinkPad L15 G2 AMD | |
| HP EliteBook 850 G8 3C7Z8EA | |
| Genomsnitt Intel Core i7-1185G7 (33002 - 76826, n=20) | |
| MSI Summit B15 A11M | |
| Microsoft Surface Laptop 4 15 AMD TFF_00028 | |
| Dell Latitude 15 9520 2-in-1 | |
| Dell Latitude 9510 2-in-1 | |
| AIDA64 / CPU ZLib | |
| Microsoft Surface Laptop 4 15 AMD TFF_00028 | |
| Lenovo ThinkPad L15 G2 AMD | |
| Dell Latitude 9510 2-in-1 | |
| MSI Summit B15 A11M | |
| HP EliteBook 850 G8 3C7Z8EA | |
| Genomsnitt Intel Core i7-1185G7 (258 - 412, n=22) | |
| Dell Latitude 15 9520 2-in-1 | |
| AIDA64 / FP64 Ray-Trace | |
| Microsoft Surface Laptop 4 15 AMD TFF_00028 | |
| Lenovo ThinkPad L15 G2 AMD | |
| MSI Summit B15 A11M | |
| Genomsnitt Intel Core i7-1185G7 (2821 - 4094, n=20) | |
| HP EliteBook 850 G8 3C7Z8EA | |
| Dell Latitude 15 9520 2-in-1 | |
| Dell Latitude 9510 2-in-1 | |
| AIDA64 / CPU PhotoWorxx | |
| Dell Latitude 15 9520 2-in-1 | |
| Genomsnitt Intel Core i7-1185G7 (22349 - 43701, n=20) | |
| MSI Summit B15 A11M | |
| HP EliteBook 850 G8 3C7Z8EA | |
| Microsoft Surface Laptop 4 15 AMD TFF_00028 | |
| Dell Latitude 9510 2-in-1 | |
| Lenovo ThinkPad L15 G2 AMD | |
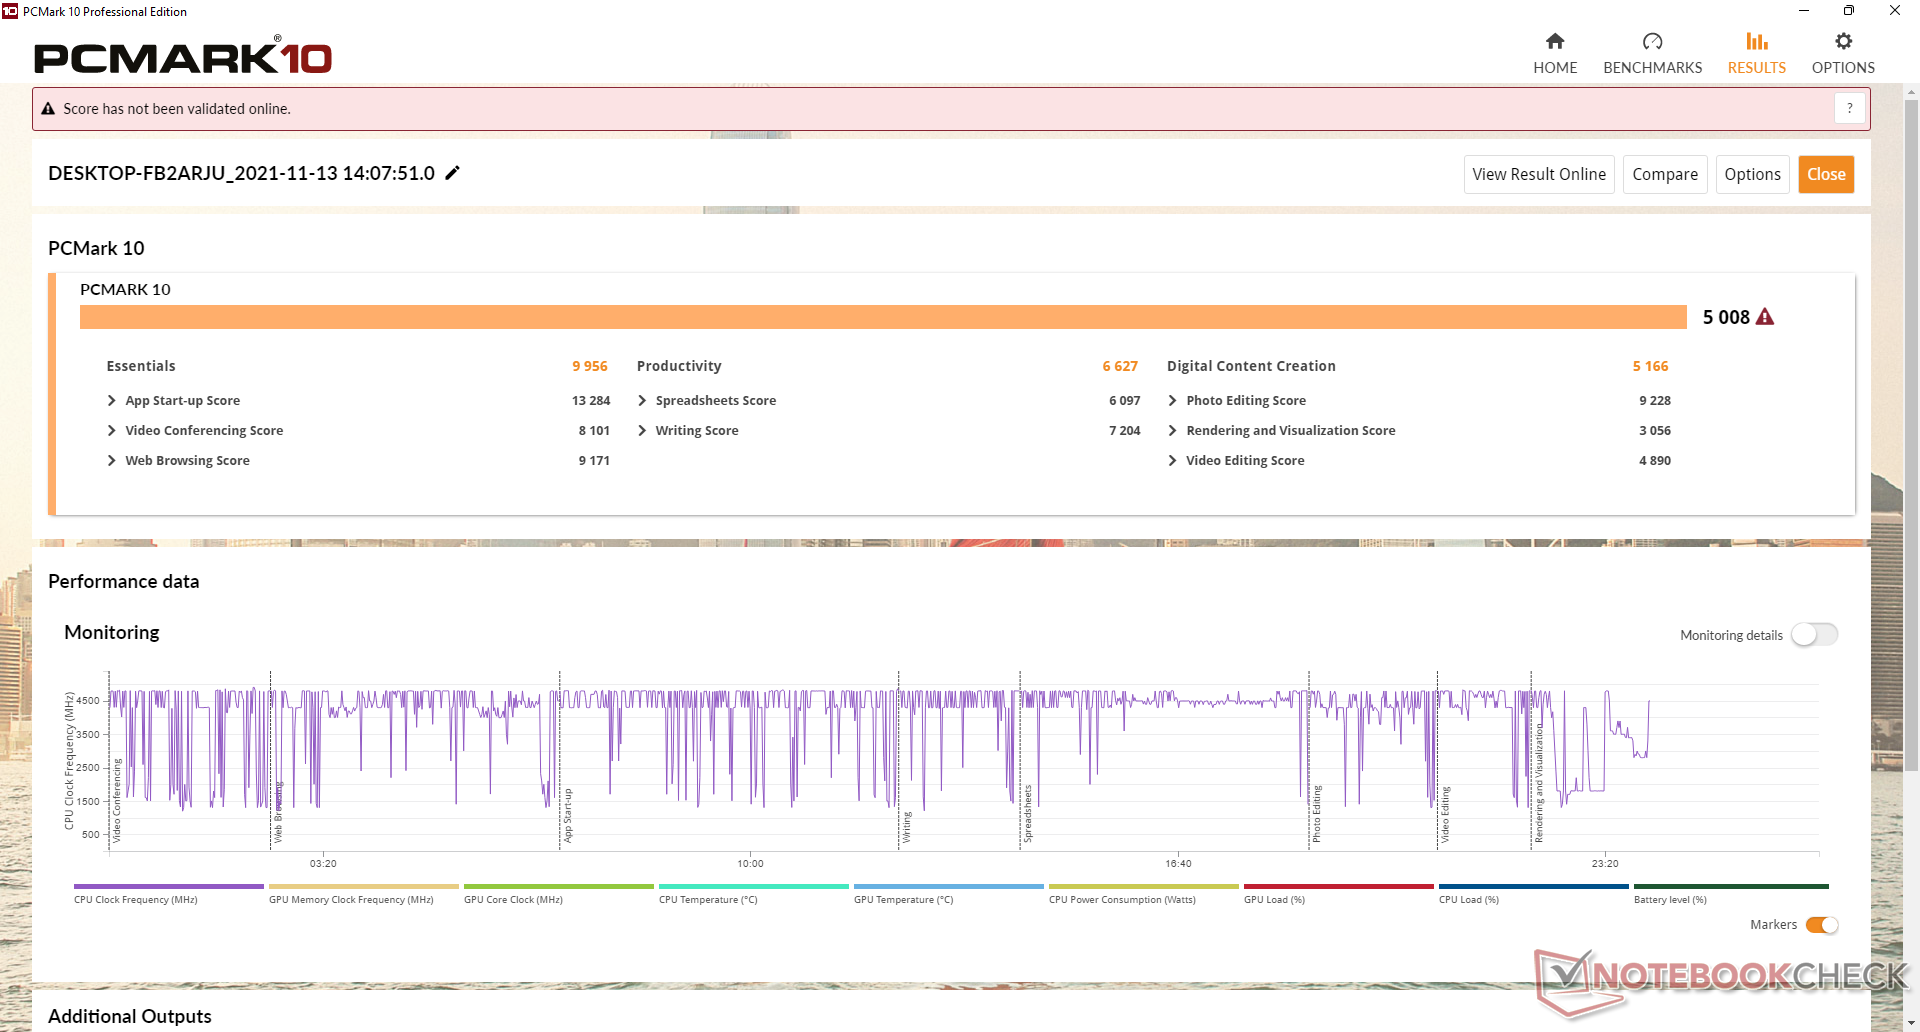
Systemets prestanda
PCMark 10-resultaten är generellt sett högre än vad vi registrerade på Latitude 9510 2-in-1, särskilt i Digital Content Creation där grafiken är viktigast. Den äldre modellen har ett högre resultat för produktivitet, vilket sannolikt beror på dess överlägsna prestanda för flera trådar.
| PCMark 10 / Score | |
| Lenovo ThinkPad L15 G2 AMD | |
| Microsoft Surface Laptop 4 15 AMD TFF_00028 | |
| Dell Latitude 15 9520 2-in-1 | |
| Genomsnitt Intel Core i7-1185G7, Intel Iris Xe Graphics G7 96EUs (4746 - 5561, n=20) | |
| HP EliteBook 850 G8 3C7Z8EA | |
| MSI Summit B15 A11M | |
| Dell Latitude 9510 2-in-1 | |
| PCMark 10 / Essentials | |
| Lenovo ThinkPad L15 G2 AMD | |
| Dell Latitude 15 9520 2-in-1 | |
| Genomsnitt Intel Core i7-1185G7, Intel Iris Xe Graphics G7 96EUs (8279 - 10664, n=20) | |
| Dell Latitude 9510 2-in-1 | |
| MSI Summit B15 A11M | |
| HP EliteBook 850 G8 3C7Z8EA | |
| Microsoft Surface Laptop 4 15 AMD TFF_00028 | |
| PCMark 10 / Productivity | |
| Lenovo ThinkPad L15 G2 AMD | |
| Microsoft Surface Laptop 4 15 AMD TFF_00028 | |
| Dell Latitude 9510 2-in-1 | |
| HP EliteBook 850 G8 3C7Z8EA | |
| Genomsnitt Intel Core i7-1185G7, Intel Iris Xe Graphics G7 96EUs (5799 - 8770, n=20) | |
| Dell Latitude 15 9520 2-in-1 | |
| MSI Summit B15 A11M | |
| PCMark 10 / Digital Content Creation | |
| Microsoft Surface Laptop 4 15 AMD TFF_00028 | |
| Dell Latitude 15 9520 2-in-1 | |
| Genomsnitt Intel Core i7-1185G7, Intel Iris Xe Graphics G7 96EUs (4424 - 5684, n=20) | |
| HP EliteBook 850 G8 3C7Z8EA | |
| Lenovo ThinkPad L15 G2 AMD | |
| MSI Summit B15 A11M | |
| Dell Latitude 9510 2-in-1 | |
| PCMark 10 Score | 5008 poäng | |
Hjälp | ||
| AIDA64 / Memory Copy | |
| Dell Latitude 15 9520 2-in-1 | |
| Genomsnitt Intel Core i7-1185G7 (36515 - 68450, n=20) | |
| HP EliteBook 850 G8 3C7Z8EA | |
| Microsoft Surface Laptop 4 15 AMD TFF_00028 | |
| MSI Summit B15 A11M | |
| Dell Latitude 9510 2-in-1 | |
| Lenovo ThinkPad L15 G2 AMD | |
| AIDA64 / Memory Read | |
| Dell Latitude 15 9520 2-in-1 | |
| Genomsnitt Intel Core i7-1185G7 (38394 - 64291, n=20) | |
| HP EliteBook 850 G8 3C7Z8EA | |
| Microsoft Surface Laptop 4 15 AMD TFF_00028 | |
| MSI Summit B15 A11M | |
| Dell Latitude 9510 2-in-1 | |
| Lenovo ThinkPad L15 G2 AMD | |
| AIDA64 / Memory Write | |
| Dell Latitude 15 9520 2-in-1 | |
| Genomsnitt Intel Core i7-1185G7 (37684 - 66873, n=20) | |
| HP EliteBook 850 G8 3C7Z8EA | |
| MSI Summit B15 A11M | |
| Microsoft Surface Laptop 4 15 AMD TFF_00028 | |
| Dell Latitude 9510 2-in-1 | |
| Lenovo ThinkPad L15 G2 AMD | |
| AIDA64 / Memory Latency | |
| Microsoft Surface Laptop 4 15 AMD TFF_00028 | |
| Dell Latitude 15 9520 2-in-1 | |
| Dell Latitude 9510 2-in-1 | |
| Lenovo ThinkPad L15 G2 AMD | |
| Genomsnitt Intel Core i7-1185G7 (78.3 - 117, n=22) | |
| MSI Summit B15 A11M | |
| HP EliteBook 850 G8 3C7Z8EA | |
* ... mindre är bättre
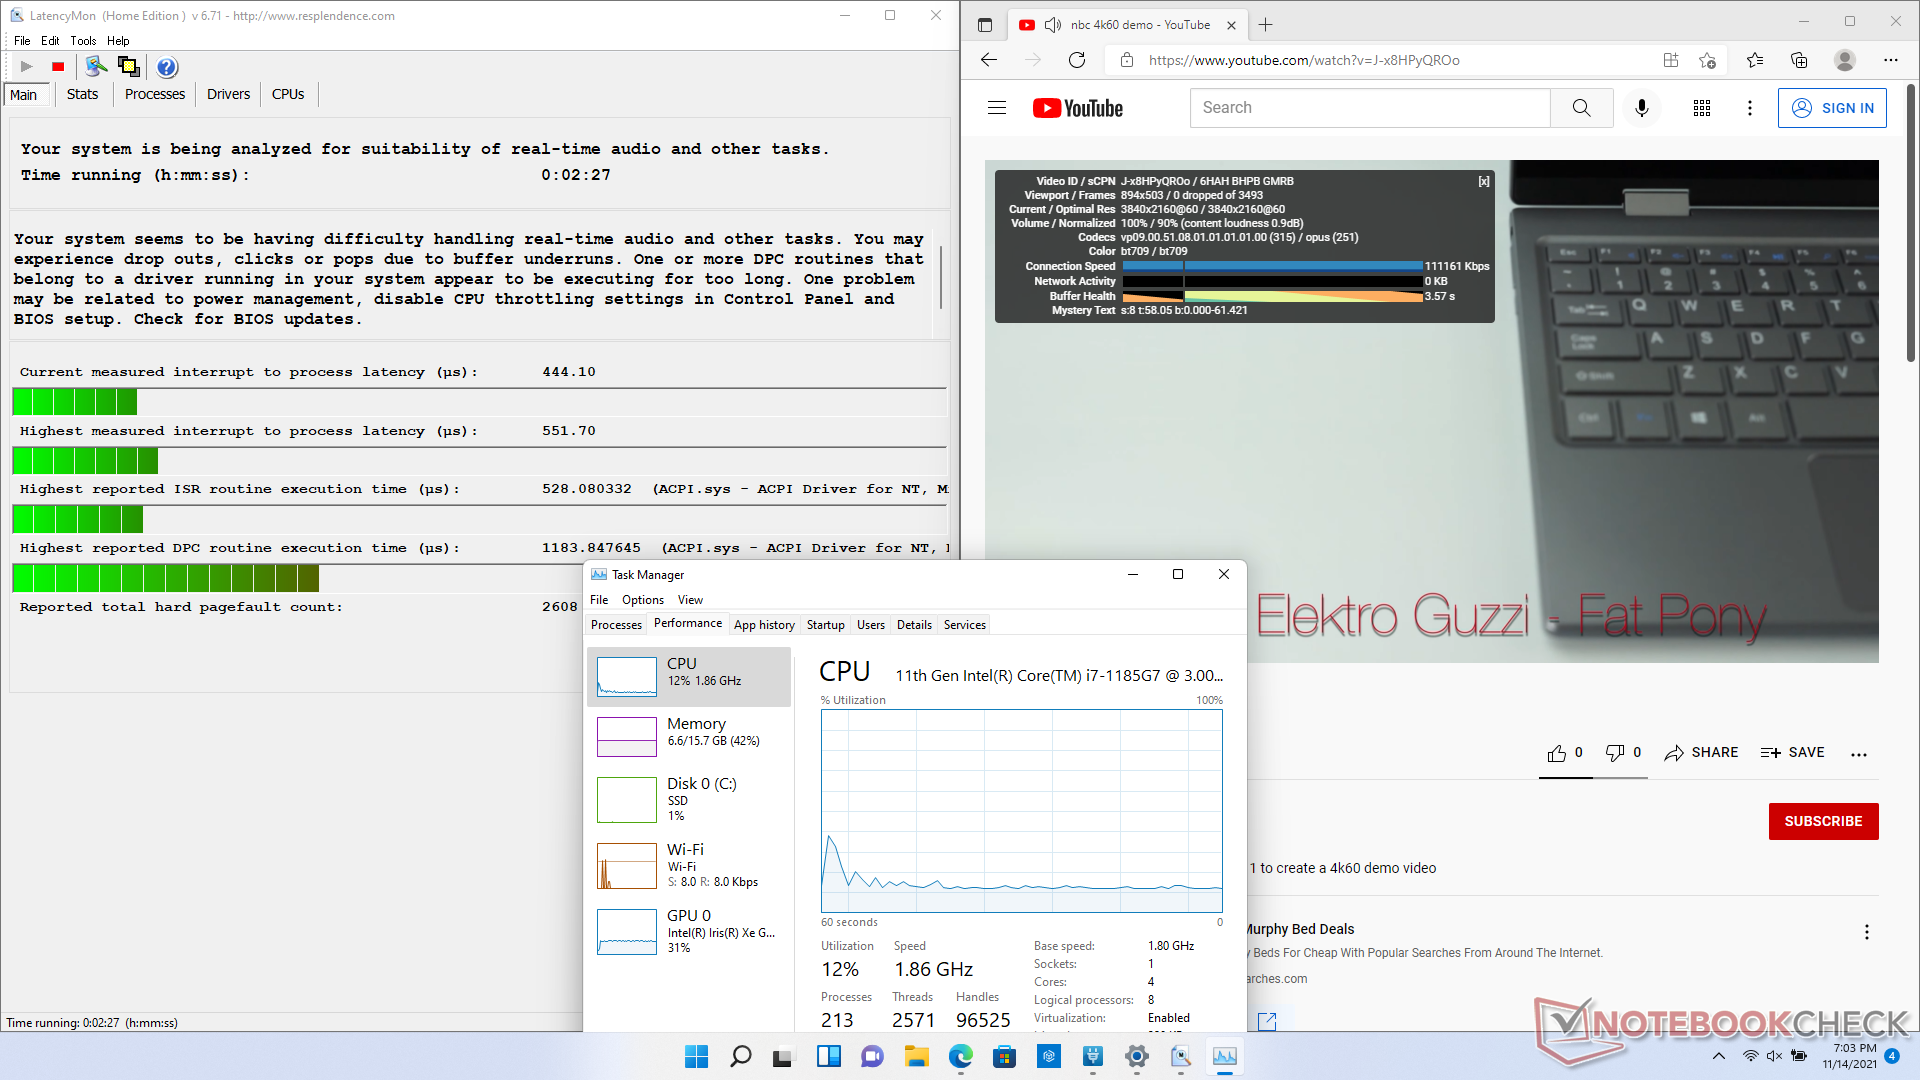
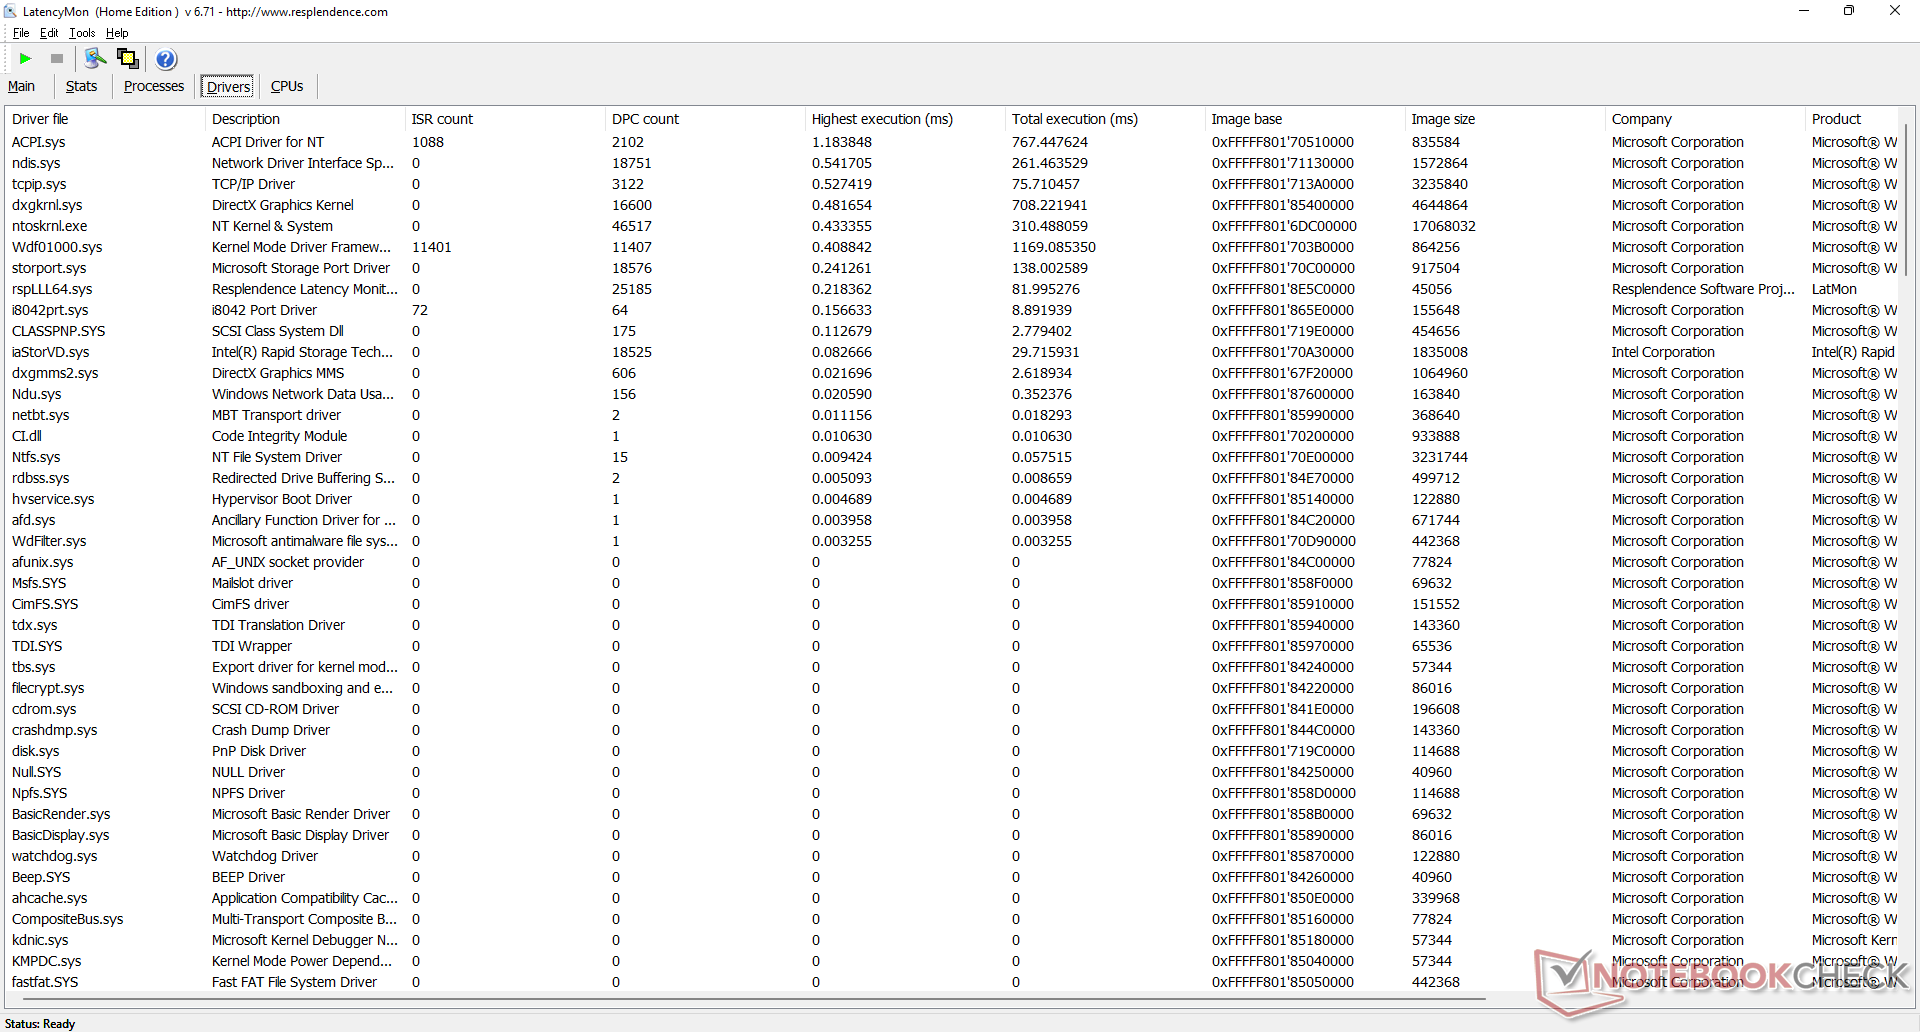
DPC-latenstid
LatencyMon visar mindre problem med DPC-avbrottstiden i samband med ACPI.sys när du öppnar flera webbläsarflikar på vår hemsida. Det är ändå en förbättring jämfört med vad vi observerade på förra årets modell
Uppspelning av 4K-video vid 60 FPS är fortfarande perfekt utan tappade bilder och med ett effektivare GPU-utnyttjande än med UHD Graphics 620.
| DPC Latencies / LatencyMon - interrupt to process latency (max), Web, Youtube, Prime95 | |
| Dell Latitude 9510 2-in-1 | |
| Lenovo ThinkPad L15 G2 AMD | |
| HP EliteBook 850 G8 3C7Z8EA | |
| MSI Summit B15 A11M | |
| Microsoft Surface Laptop 4 15 AMD TFF_00028 | |
| Dell Latitude 15 9520 2-in-1 | |
* ... mindre är bättre
Lagringsenheter
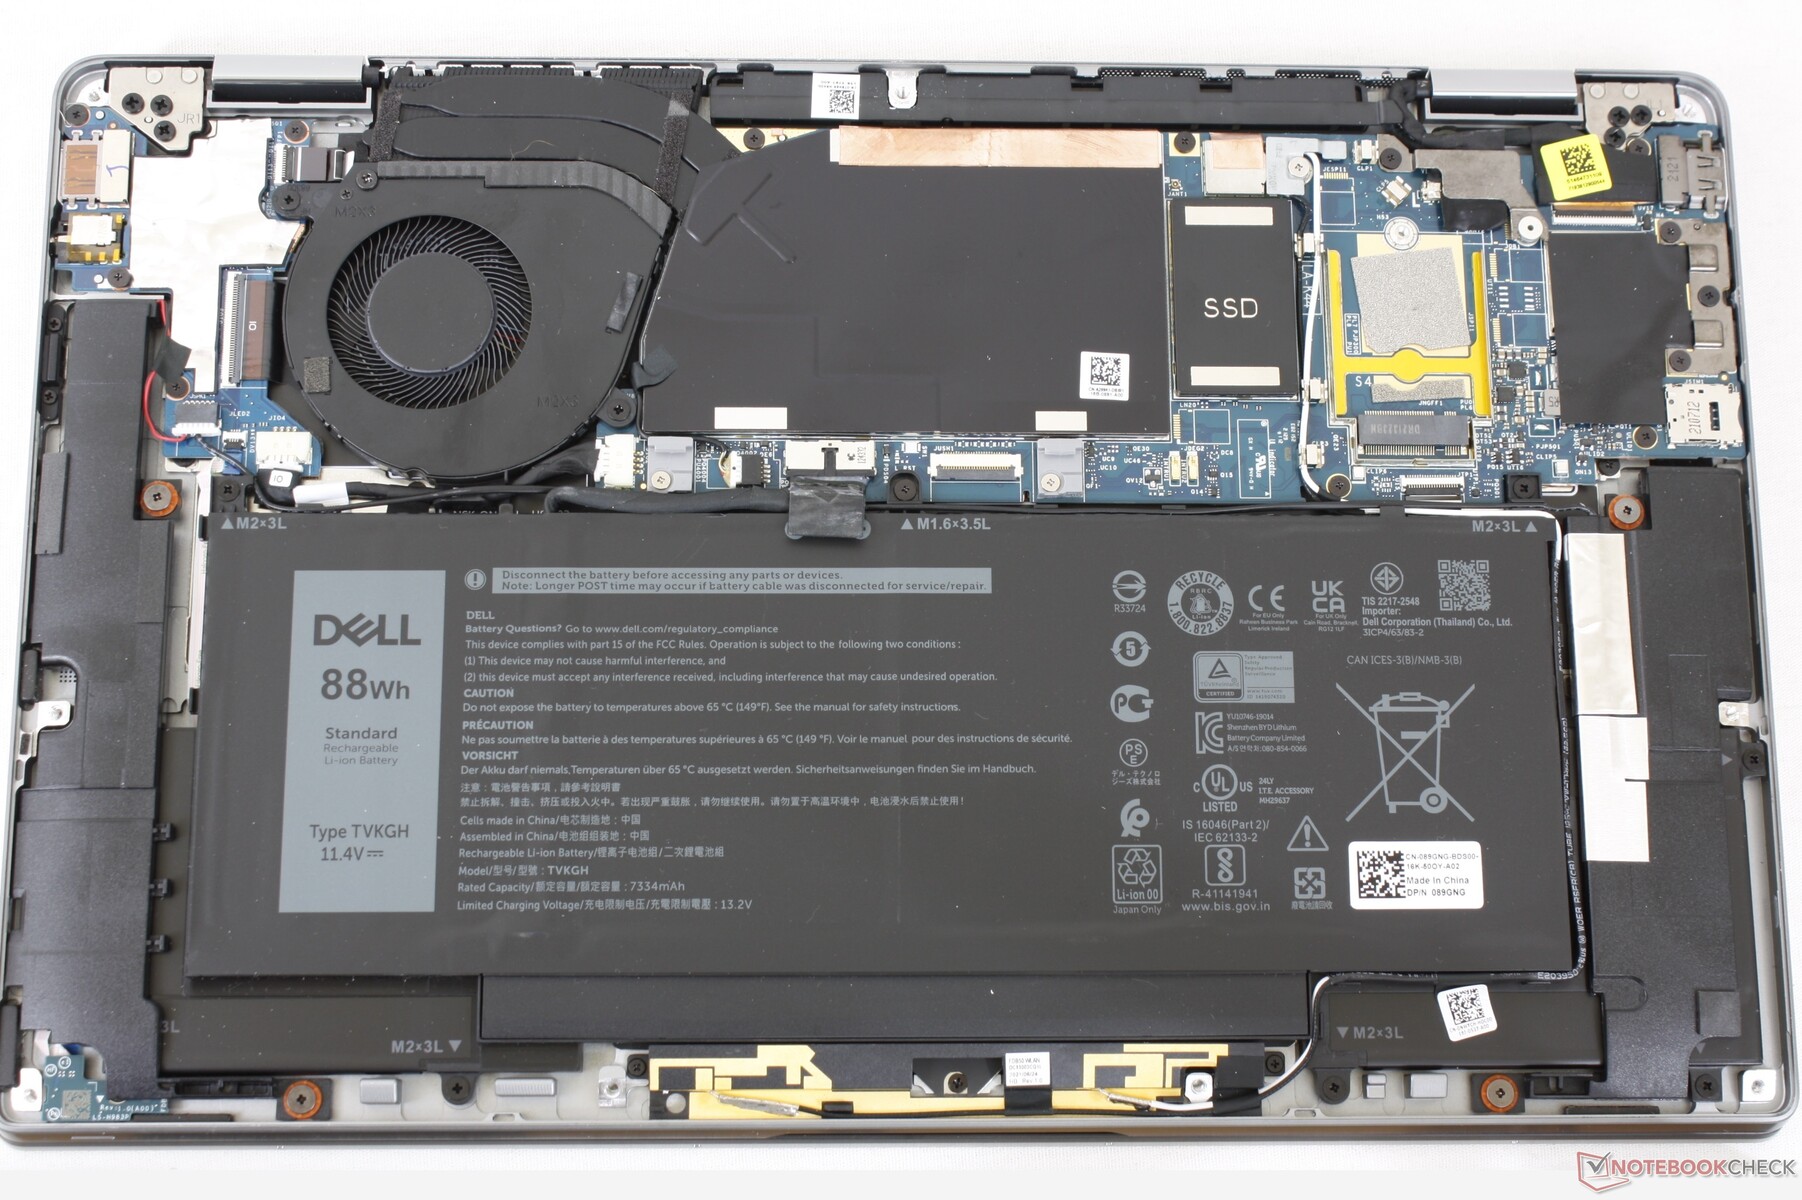
Vår testenhet använder samma PCIe3 x4 Toshiba KBG40ZNS512G NVMe M.2 2230 SSD som finns i Latitude 9510 2-in-1. Dell erbjuder för närvarande inga PCIe4-alternativ trots att Intel-chipsetet teoretiskt sett borde kunna stödja sådana SSD-enheter. Avsaknaden av en värmespridare kommer dock att innebära att alla PCIe4-SSD:er sannolikt skulle strypas efter en kort tid i alla fall.

| Drive Performance rating - Percent | |
| HP EliteBook 850 G8 3C7Z8EA | |
| Lenovo ThinkPad L15 G2 AMD | |
| MSI Summit B15 A11M | |
| Microsoft Surface Laptop 4 15 AMD TFF_00028 | |
| Dell Latitude 15 9520 2-in-1 | |
| Dell Latitude 9510 2-in-1 | |
* ... mindre är bättre
Disk Throttling: DiskSpd Read Loop, Queue Depth 8
GPU-prestanda
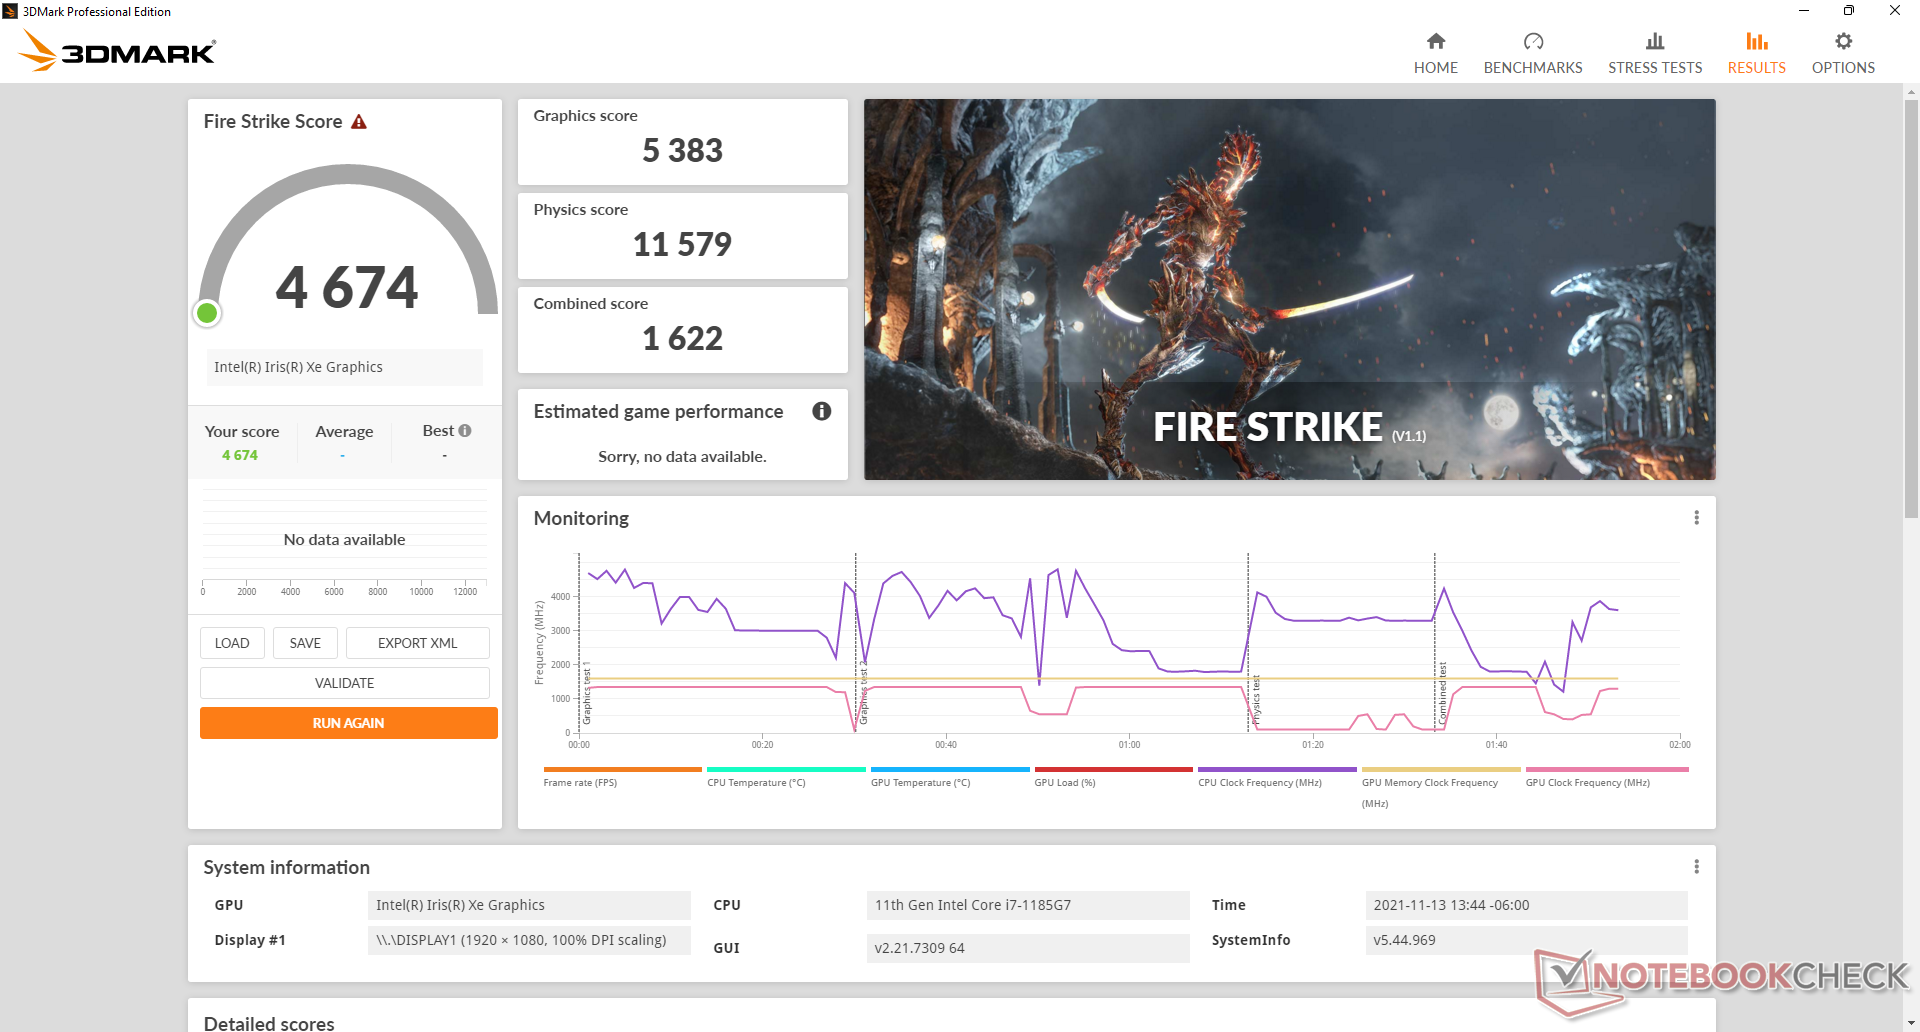
3DMark-resultaten visar att Iris Xe 96 EUs i vår Latitude 9520 2-i-1-version presterar bra i förhållande till andra bärbara Iris Xe-datorer i vår databas. Djävulen ligger dock i detaljerna, eftersom spelprestanda i den verkliga världen är dålig på grund av de ovanligt stora fluktuerande bildfrekvenserna. Till exempel hoppade bildfrekvensen ständigt mellan 40 FPS och 90 FPS när den bara gick på tomgång på Witcher 3 på de lägsta inställningarna medan den Iris Xe-drivna MSI Summit B15 skulle köras mycket stabilare utan några av de kraftiga FPS-fallen. Även om vår Latitude 9520 2-in-1 Iris Xe utan tvekan är snabbare än UHD Graphics 620 på förra årets Latitude 9510 2-in-1, kunde den definitivt ha varit stabilare när det gäller prestanda över tid.
| 3DMark Performance rating - Percent | |
| MSI Prestige 15 A10SC | |
| HP EliteBook 850 G8 3C7Z8EA | |
| Dell Latitude 15 9520 2-in-1 | |
| Genomsnitt Intel Iris Xe Graphics G7 96EUs | |
| Asus Vivobook 15 K513EQ | |
| Microsoft Surface Laptop 4 15 AMD TFF_00028 | |
| HP Pavilion Aero 13 be0097nr | |
| Lenovo ThinkPad E15 G3-20YG003UGE | |
| Samsung Galaxy Book Flex 15-NP950 | |
| Asus VivoBook S15 S530UN-BQ097T | |
| Lenovo ThinkPad L15 G2 AMD | |
| Asus ExpertBook B1 B1500CEAE, i5-1135G7 | |
| LG Gram 15Z90N -2! | |
| Dell Latitude 9510 2-in-1 | |
| 3DMark 11 - 1280x720 Performance GPU | |
| MSI Prestige 15 A10SC | |
| HP EliteBook 850 G8 3C7Z8EA | |
| Genomsnitt Intel Iris Xe Graphics G7 96EUs (2867 - 7676, n=209) | |
| Asus Vivobook 15 K513EQ | |
| Microsoft Surface Laptop 4 15 AMD TFF_00028 | |
| HP Pavilion Aero 13 be0097nr | |
| Lenovo ThinkPad E15 G3-20YG003UGE | |
| Dell Latitude 15 9520 2-in-1 | |
| Samsung Galaxy Book Flex 15-NP950 | |
| Asus VivoBook S15 S530UN-BQ097T | |
| Lenovo ThinkPad L15 G2 AMD | |
| Asus ExpertBook B1 B1500CEAE, i5-1135G7 | |
| LG Gram 15Z90N | |
| Dell Latitude 9510 2-in-1 | |
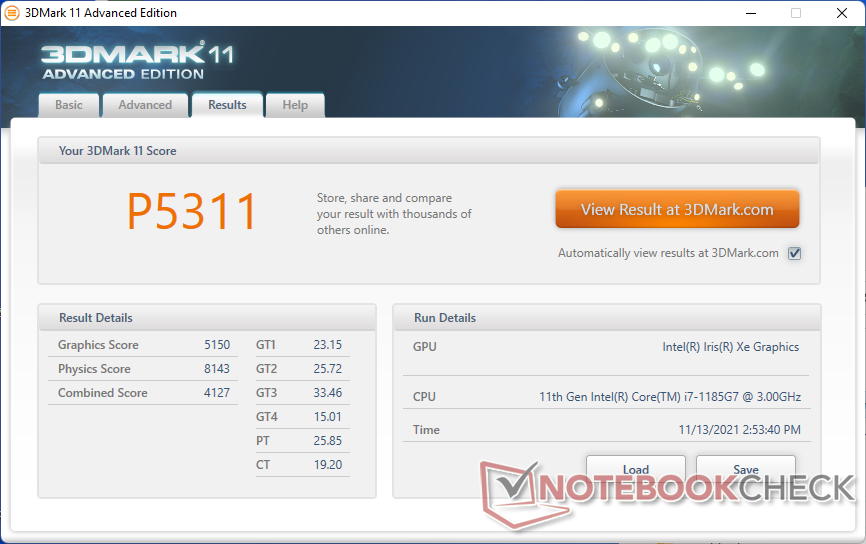
| 3DMark 11 Performance | 5311 poäng | |
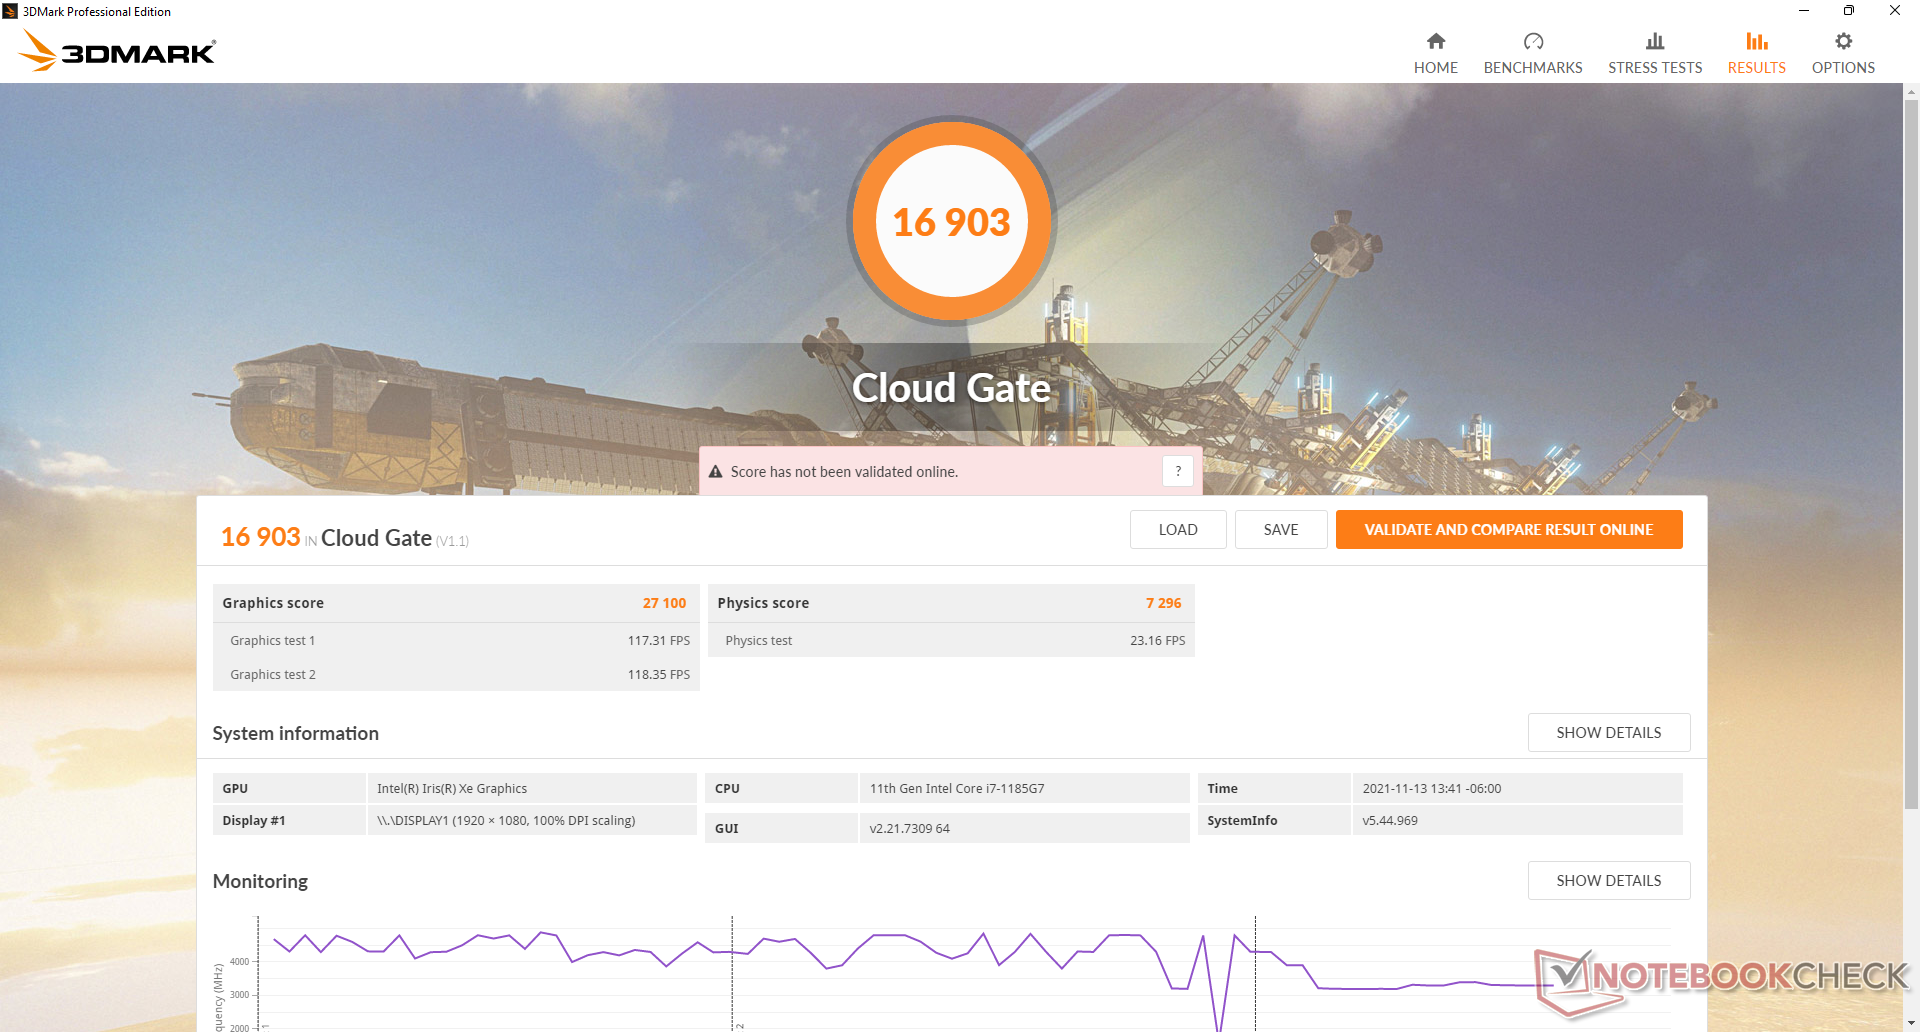
| 3DMark Cloud Gate Standard Score | 16903 poäng | |
| 3DMark Fire Strike Score | 4674 poäng | |
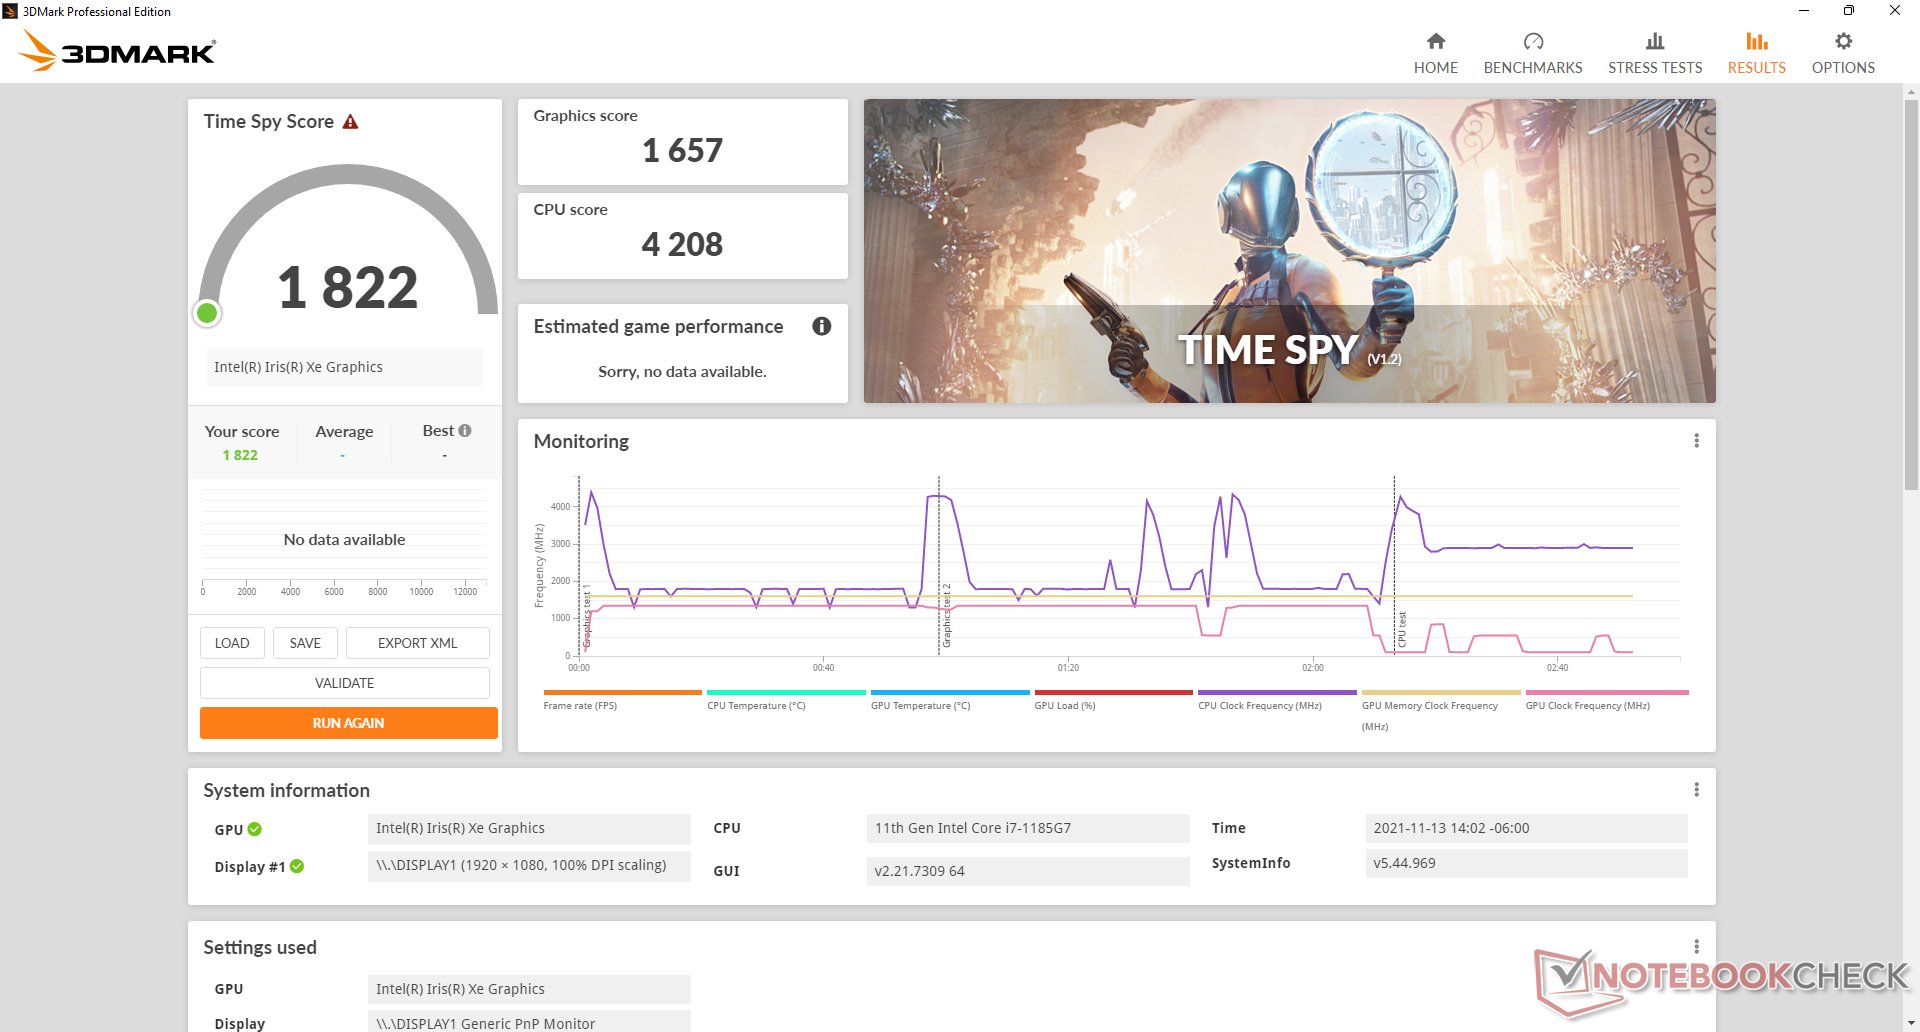
| 3DMark Time Spy Score | 1822 poäng | |
Hjälp | ||
| Final Fantasy XV Benchmark | |
| 1280x720 Lite Quality | |
| HP EliteBook 850 G8 3C7Z8EA | |
| Genomsnitt Intel Iris Xe Graphics G7 96EUs (14.9 - 56.5, n=189) | |
| Dell Latitude 15 9520 2-in-1 | |
| Lenovo ThinkPad E15 G3-20YG003UGE | |
| HP Pavilion Aero 13 be0097nr | |
| Lenovo ThinkPad L15 G2 AMD | |
| Asus ExpertBook B1 B1500CEAE, i5-1135G7 | |
| 1920x1080 Standard Quality | |
| HP EliteBook 850 G8 3C7Z8EA | |
| Genomsnitt Intel Iris Xe Graphics G7 96EUs (10.5 - 31.2, n=185) | |
| Dell Latitude 15 9520 2-in-1 | |
| Lenovo ThinkPad E15 G3-20YG003UGE | |
| HP Pavilion Aero 13 be0097nr | |
| Lenovo ThinkPad L15 G2 AMD | |
| Asus ExpertBook B1 B1500CEAE, i5-1135G7 | |
| 1920x1080 High Quality | |
| Genomsnitt Intel Iris Xe Graphics G7 96EUs (8.15 - 27.8, n=178) | |
| HP EliteBook 850 G8 3C7Z8EA | |
| Dell Latitude 15 9520 2-in-1 | |
| HP Pavilion Aero 13 be0097nr | |
| Lenovo ThinkPad E15 G3-20YG003UGE | |
| Lenovo ThinkPad L15 G2 AMD | |
| Asus ExpertBook B1 B1500CEAE, i5-1135G7 | |
| Far Cry 5 | |
| 1280x720 Low Preset AA:T | |
| Genomsnitt Intel Iris Xe Graphics G7 96EUs (23 - 75, n=93) | |
| HP EliteBook 850 G8 3C7Z8EA | |
| Microsoft Surface Laptop 4 15 AMD TFF_00028 | |
| HP Pavilion Aero 13 be0097nr | |
| Lenovo ThinkPad L15 G2 AMD | |
| 1920x1080 Low Preset AA:T | |
| Genomsnitt Intel Iris Xe Graphics G7 96EUs (15 - 48, n=41) | |
| HP Pavilion Aero 13 be0097nr | |
| 1920x1080 Medium Preset AA:T | |
| Genomsnitt Intel Iris Xe Graphics G7 96EUs (14 - 39, n=91) | |
| HP EliteBook 850 G8 3C7Z8EA | |
| HP Pavilion Aero 13 be0097nr | |
| Microsoft Surface Laptop 4 15 AMD TFF_00028 | |
| Lenovo ThinkPad L15 G2 AMD | |
| 1920x1080 High Preset AA:T | |
| Genomsnitt Intel Iris Xe Graphics G7 96EUs (10 - 35, n=89) | |
| HP EliteBook 850 G8 3C7Z8EA | |
| HP Pavilion Aero 13 be0097nr | |
| Lenovo ThinkPad L15 G2 AMD | |
| 1920x1080 Ultra Preset AA:T | |
| Genomsnitt Intel Iris Xe Graphics G7 96EUs (11 - 33, n=75) | |
| HP Pavilion Aero 13 be0097nr | |
| Lenovo ThinkPad L15 G2 AMD | |
Witcher 3 FPS Chart
| låg | med. | hög | ultra | |
|---|---|---|---|---|
| GTA V (2015) | 81 | 70.5 | 27.2 | 10.6 |
| The Witcher 3 (2015) | 86.8 | 59.4 | 33.5 | 14.3 |
| Dota 2 Reborn (2015) | 103 | 61.7 | 39.8 | 39.8 |
| Final Fantasy XV Benchmark (2018) | 35 | 20 | 14.6 | |
| X-Plane 11.11 (2018) | 36 | 34.4 | 27.5 | |
| Strange Brigade (2018) | 82.8 | 32.7 | 26.3 | 23.2 |
Utsläpp
Systembrus
Den interna fläkten är tyst med 24,1 dN(A) när den går på tomgång eller surfar på webben i balanserat eller optimerat läge eller lägre. Den kan ibland hoppa upp till 25,8 dB(A), men det märks inte i de flesta miljöer. Användare kan nå det maximala fläktljudet på strax under 40 dB(A) när de kör högre belastningar som spel.
Fläktljudet kommer att pulsera oftare om det är inställt på läget High Performance när du surfar eller streamar video. Se därför till att ställa in strömprofilen på lämpligt sätt om fläktljudet är ett problem.
Ljudnivå
| Låg belastning |
| 24.1 / 24.1 / 25.8 dB(A) |
| Hög belastning |
| 34.2 / 39.6 dB(A) |
 | ||
30 dB tyst 40 dB(A) hörbar 50 dB(A) högt ljud |
||
min: | ||
| Dell Latitude 15 9520 2-in-1 Iris Xe G7 96EUs, i7-1185G7, Toshiba KBG40ZNS512G NVMe | Dell Latitude 9510 2-in-1 UHD Graphics 620, i7-10810U, Toshiba KBG40ZNS512G NVMe | HP EliteBook 850 G8 3C7Z8EA Iris Xe G7 96EUs, i7-1165G7, Samsung PM981a MZVLB1T0HBLR | Lenovo ThinkPad L15 G2 AMD Vega 7, R5 5600U, SK Hynix HFS512 GDE9X081N | MSI Summit B15 A11M Iris Xe G7 96EUs, i7-1165G7, Kingston OM8PCP31024F | Microsoft Surface Laptop 4 15 AMD TFF_00028 Vega 8, R7 4980U, SK Hynix BC511 HFM512GDJTNI | |
|---|---|---|---|---|---|---|
| Noise | -7% | 0% | 6% | -1% | -2% | |
| av / miljö * (dB) | 24 | 27.2 -13% | 26 -8% | 24.22 -1% | 25.2 -5% | 24.2 -1% |
| Idle Minimum * (dB) | 24.1 | 27.2 -13% | 26 -8% | 24.22 -0% | 26.4 -10% | 24.2 -0% |
| Idle Average * (dB) | 24.1 | 27.2 -13% | 26 -8% | 24.22 -0% | 26.4 -10% | 24.2 -0% |
| Idle Maximum * (dB) | 25.8 | 27.2 -5% | 26.2 -2% | 24.22 6% | 26.4 -2% | 24.2 6% |
| Load Average * (dB) | 34.2 | 33.4 2% | 29.5 14% | 25.84 24% | 26.8 22% | 39.9 -17% |
| Witcher 3 ultra * (dB) | 39.6 | 28 29% | 39.9 -1% | |||
| Load Maximum * (dB) | 39.6 | 39.5 -0% | 34 14% | 36.02 9% | 52.6 -33% | 39.9 -1% |
* ... mindre är bättre
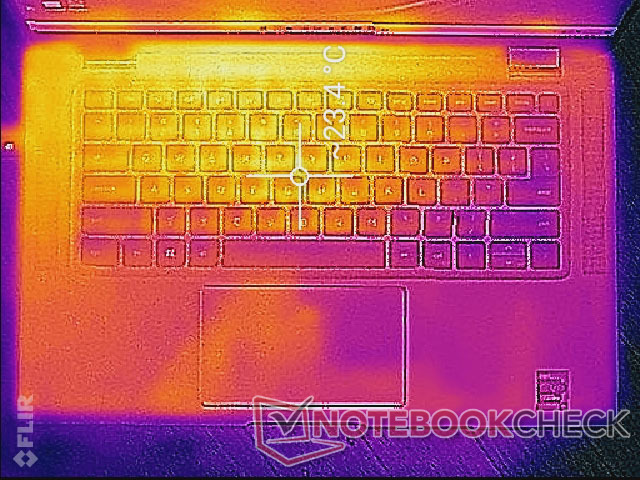
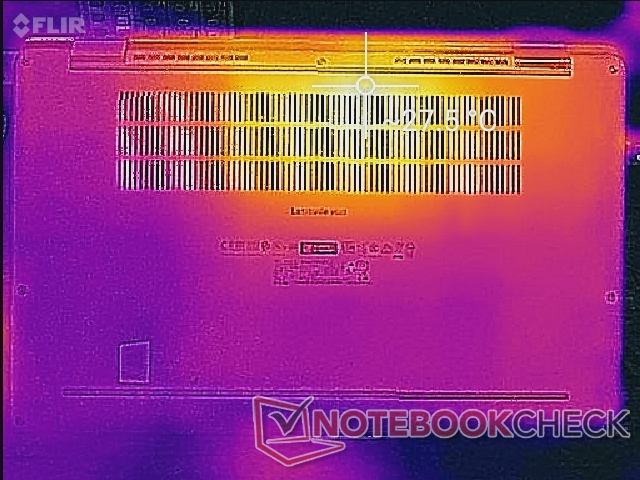
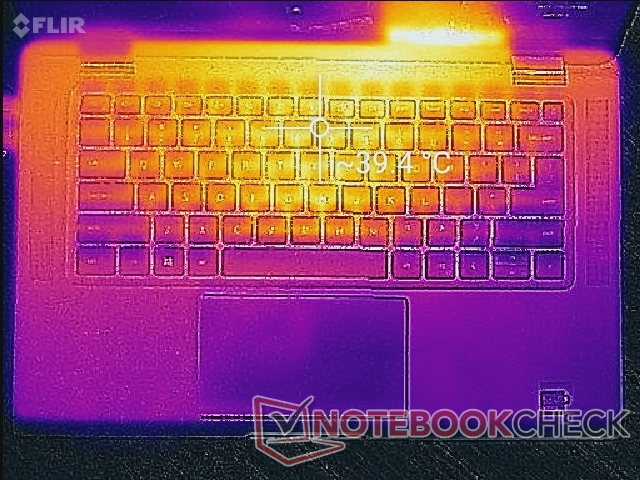
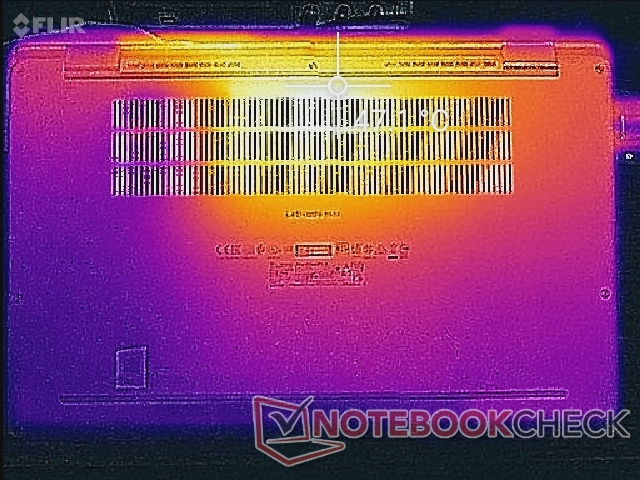
Temperatur
Yttemperaturen är liknande den för Latitude 9510 2-in-1 när den körs med låg till medelhög belastning. Om du kör högre belastningar, till exempel spel, kan dock den nedre värmepunkten på Latitude 9520 2-in-1 vara några grader varmare än på den äldre modellen.
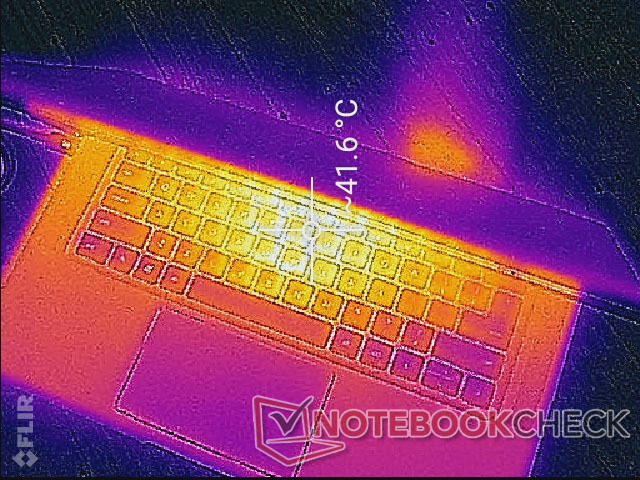
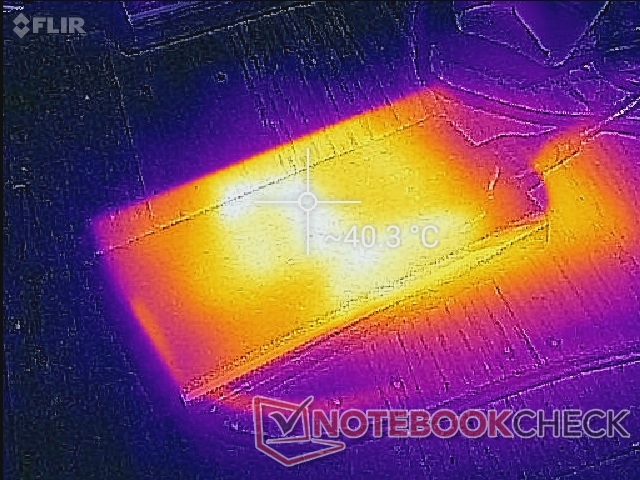
(±) Den maximala temperaturen på ovansidan är 40 °C / 104 F, jämfört med genomsnittet av 34.3 °C / 94 F , allt från 21.2 till 62.5 °C för klassen Office.
(-) Botten värms upp till maximalt 47.2 °C / 117 F, jämfört med genomsnittet av 36.8 °C / 98 F
(+) Vid tomgångsbruk är medeltemperaturen för ovansidan 22.5 °C / 73 F, jämfört med enhetsgenomsnittet på 29.5 °C / ### class_avg_f### F.
(+) Handledsstöden och pekplattan är kallare än hudtemperaturen med maximalt 28.6 °C / 83.5 F och är därför svala att ta på.
(±) Medeltemperaturen för handledsstödsområdet på liknande enheter var 27.5 °C / 81.5 F (-1.1 °C / -2 F).
| Dell Latitude 15 9520 2-in-1 Intel Core i7-1185G7, Intel Iris Xe Graphics G7 96EUs | Dell Latitude 9510 2-in-1 Intel Core i7-10810U, Intel UHD Graphics 620 | HP EliteBook 850 G8 3C7Z8EA Intel Core i7-1165G7, Intel Iris Xe Graphics G7 96EUs | Lenovo ThinkPad L15 G2 AMD AMD Ryzen 5 5600U, AMD Radeon RX Vega 7 | MSI Summit B15 A11M Intel Core i7-1165G7, Intel Iris Xe Graphics G7 96EUs | Microsoft Surface Laptop 4 15 AMD TFF_00028 AMD Ryzen 7 4980U, AMD Radeon RX Vega 8 (Ryzen 4000/5000) | |
|---|---|---|---|---|---|---|
| Heat | -9% | -3% | -8% | -8% | 4% | |
| Maximum Upper Side * (°C) | 40 | 42.8 -7% | 37.9 5% | 42.8 -7% | 42.8 -7% | 41.8 -5% |
| Maximum Bottom * (°C) | 47.2 | 41.8 11% | 39 17% | 46 3% | 52.2 -11% | 44.8 5% |
| Idle Upper Side * (°C) | 23.4 | 29.2 -25% | 31 -32% | 26.9 -15% | 26 -11% | 23 2% |
| Idle Bottom * (°C) | 27.4 | 31 -13% | 27.8 -1% | 31.1 -14% | 28.2 -3% | 23.6 14% |
* ... mindre är bättre
Stresstest
Den instabila prestandan vid körning Witcher 3 som nämns ovan kan tillskrivas den instabila klockfrekvensen när CPU och GPU belastas samtidigt. GPU-klockfrekvensen växlar mellan 500 MHz och 1200 MHz när spelet körs, medan de flesta andra bärbara Iris Xe-datorer förblir stabila vid fasta klockfrekvenser för jämnare prestanda. MSI Summit B15skulle till exempel ha en stabil GPU-klockfrekvens på 1300 MHz under samma spelförhållanden som vår Dell. Detta oönskade GPU-beteende gör Latitude 9520 2-in-1 till ett jämförelsevis sämre val för grafikintensiva uppgifter.
Om endast CPU:n belastas via Prime95 skulle klockfrekvensen öka till 3,2 GHz bara under de första sekunderna vid en kärntemperatur på 98 C. Därefter skulle klockfrekvensen sjunka till låga 2 GHz för att bibehålla en svalare kärntemperatur på cirka 75 C. Strömgränserna för multitråds PL1 på lång sikt och PL2 på kort sikt ligger på 22 W respektive 45 W när systemet är i läget High Performance.
Att köra på batteri begränsar inte prestandan eftersom 3DMark 11-resultaten är nästan identiska mellan nät och batterier.
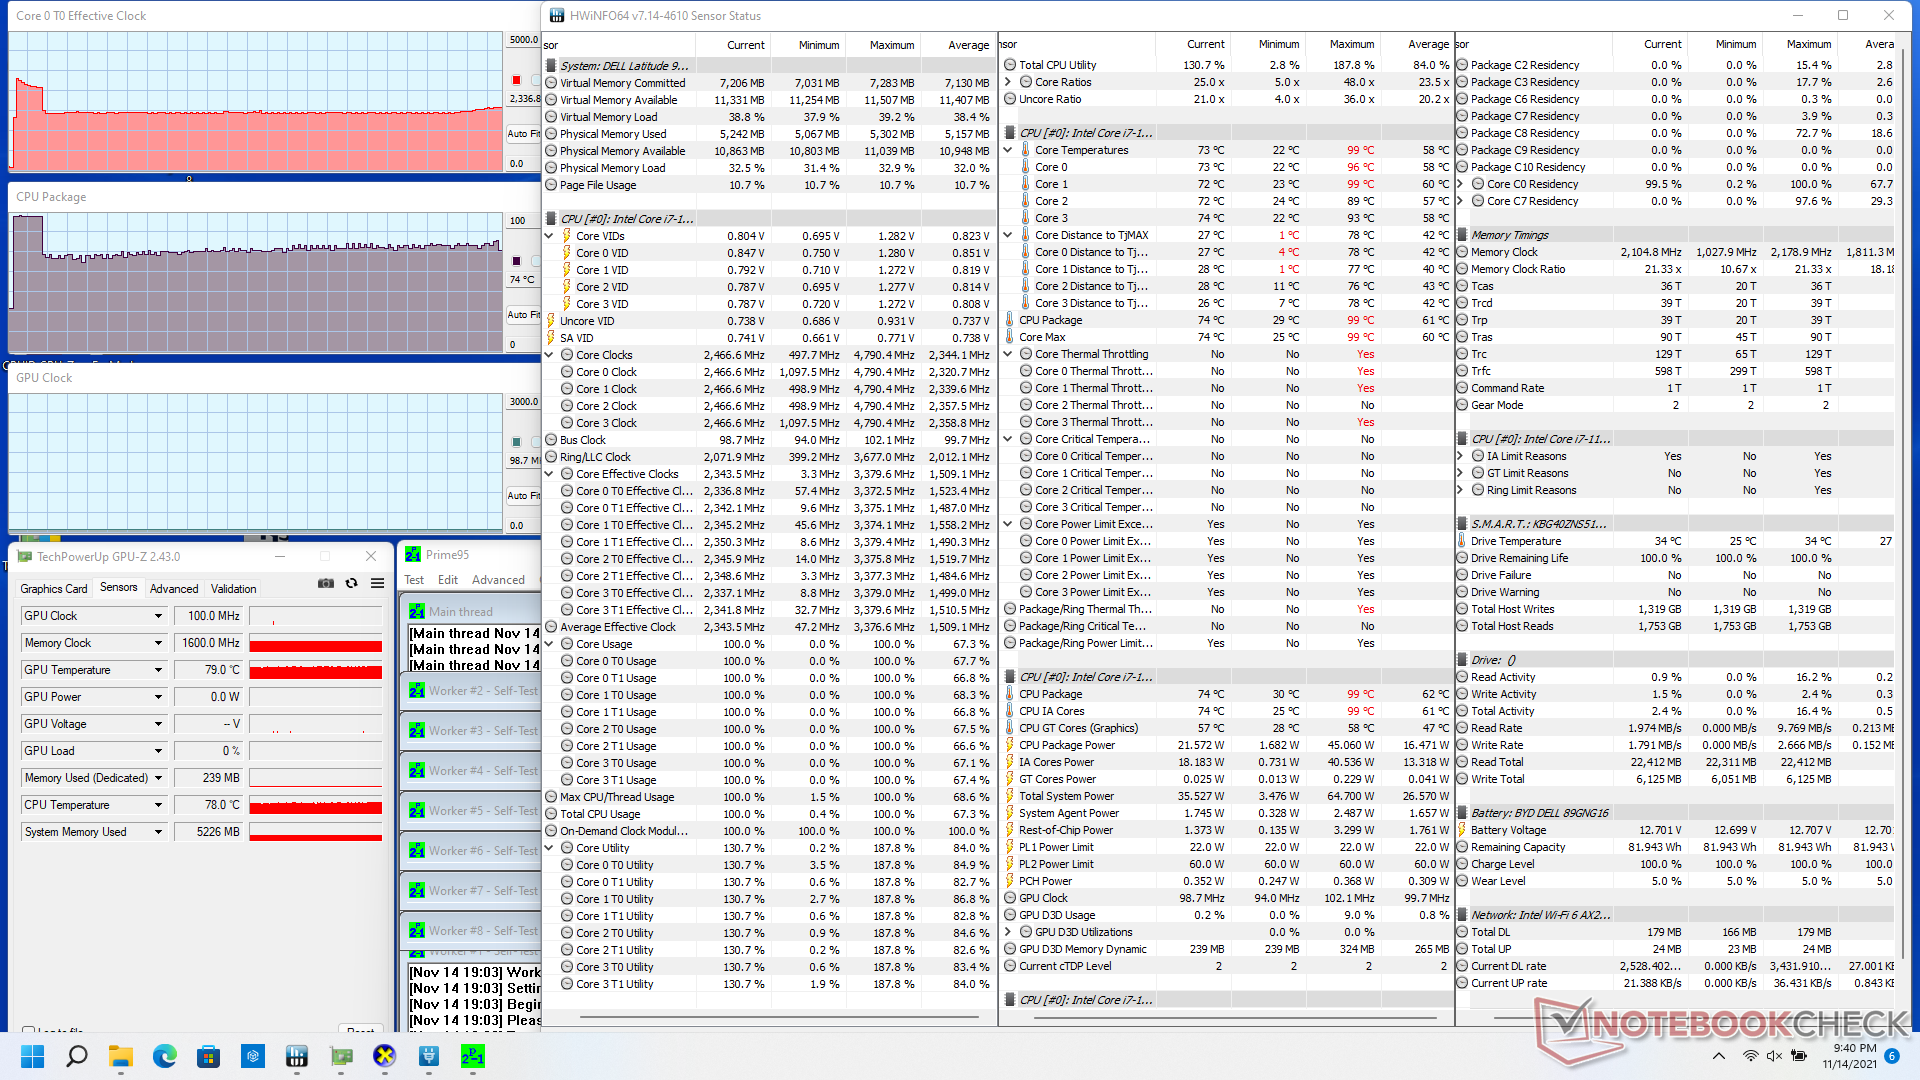
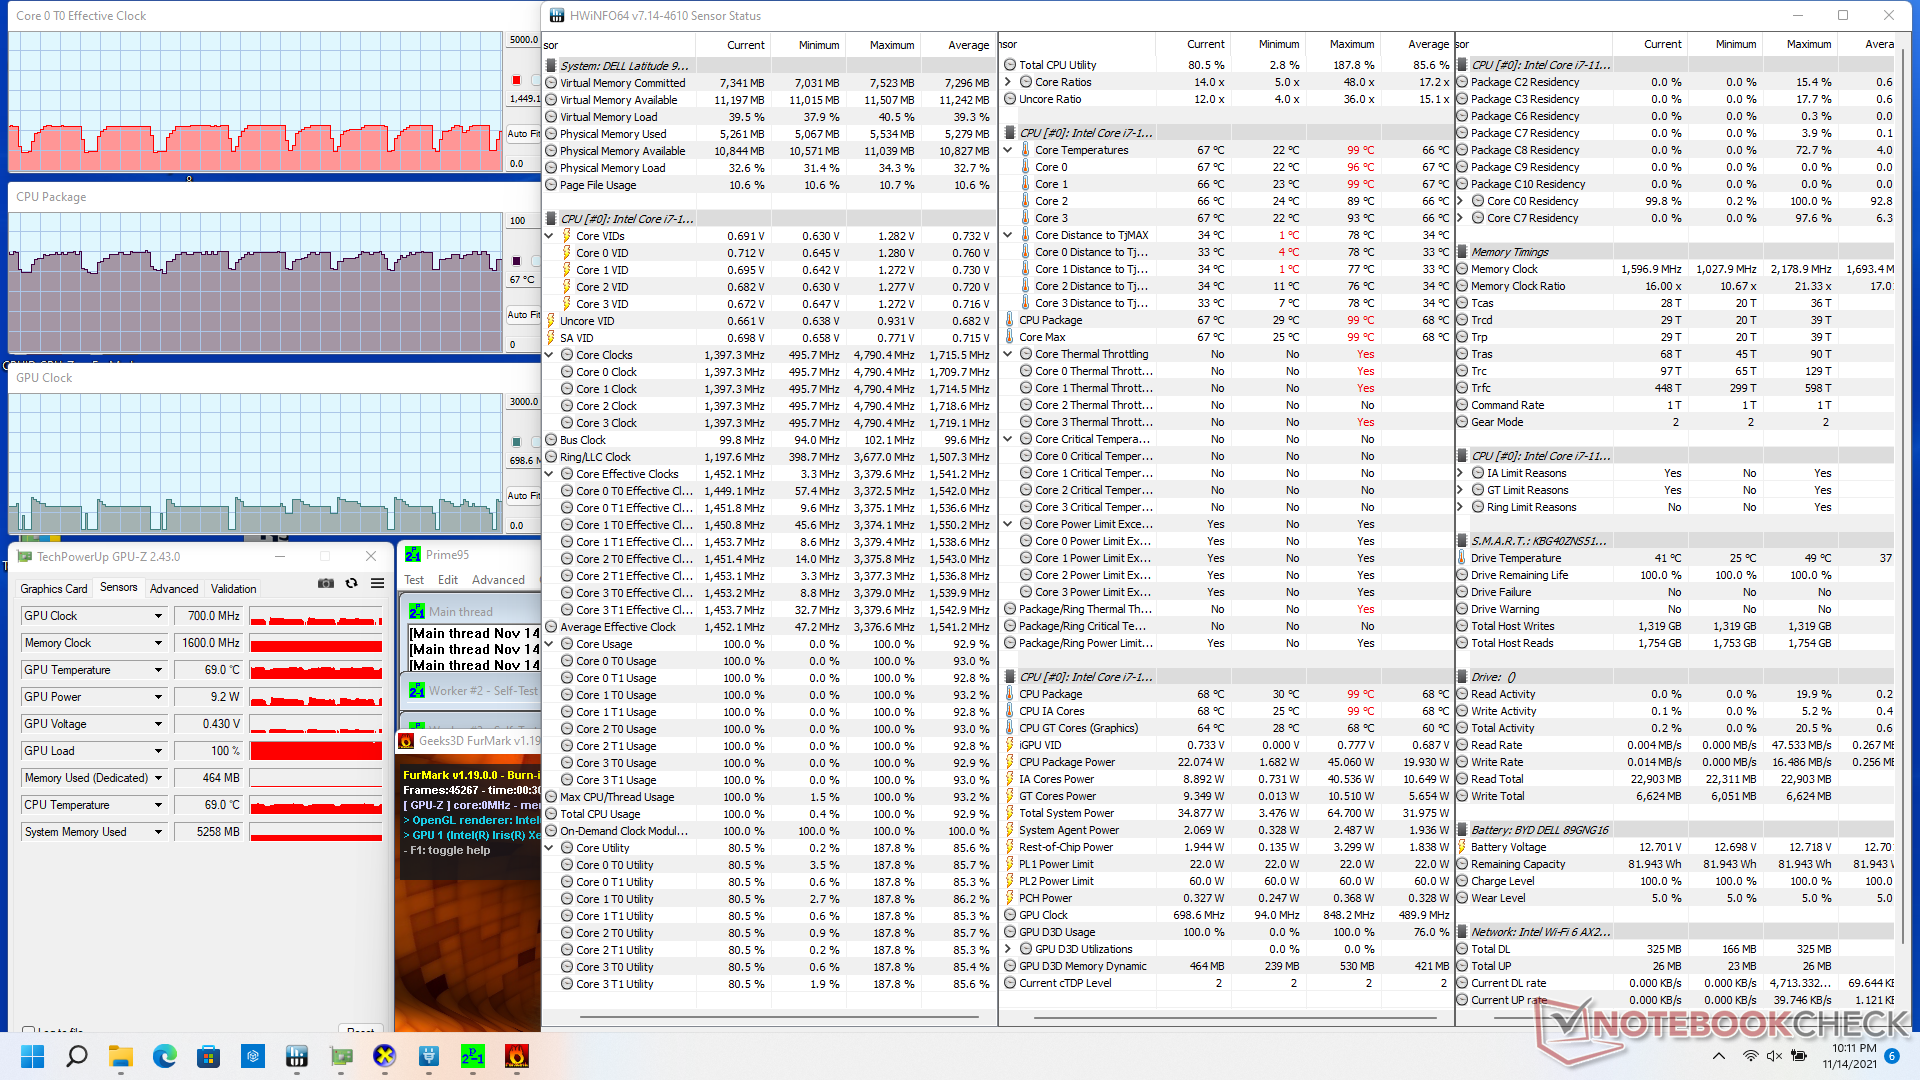
| CPU-klocka (GHz) | GPU-klocka (MHz) | GenomsnittligCPU-temperatur (°C) | |
| Systemets tomgång | ---- | ---- | 30 |
| Prime95 Stress | 2.2 | ---- | 75 |
| Prime95 + FurMark Stress | 0,6 - 1,7 | 100 - 800 | 58 - 73 |
| Witcher 3 Stress | 0,5 - 1,3 | 500 - 1200 | 57 - 66 |
Högtalare
Dell Latitude 15 9520 2-in-1 ljudanalys
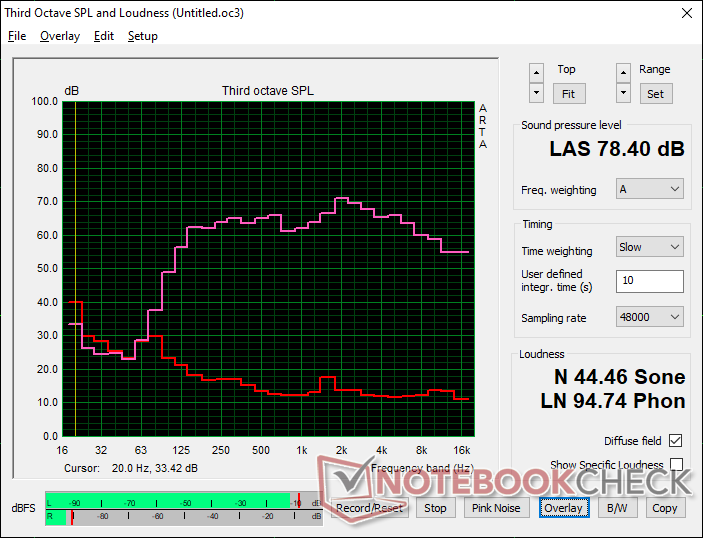
(±) | högtalarljudstyrkan är genomsnittlig men bra (78.4 dB)
Bas 100 - 315 Hz
(+) | bra bas - bara 4.4% från medianen
(±) | linjäriteten för basen är genomsnittlig (9.4% delta till föregående frekvens)
Mellan 400 - 2000 Hz
(+) | balanserad mellan - endast 2.3% från medianen
(+) | mids är linjära (4.5% delta till föregående frekvens)
Högsta 2 - 16 kHz
(+) | balanserade toppar - endast 3.3% från medianen
(+) | toppar är linjära (3.9% delta till föregående frekvens)
Totalt 100 - 16 000 Hz
(+) | det totala ljudet är linjärt (9.5% skillnad mot median)
Jämfört med samma klass
» 1% av alla testade enheter i den här klassen var bättre, 0% liknande, 99% sämre
» Den bästa hade ett delta på 7%, genomsnittet var 21%, sämst var 53%
Jämfört med alla testade enheter
» 4% av alla testade enheter var bättre, 1% liknande, 95% sämre
» Den bästa hade ett delta på 4%, genomsnittet var 24%, sämst var 134%
Apple MacBook 12 (Early 2016) 1.1 GHz ljudanalys
(+) | högtalare kan spela relativt högt (83.6 dB)
Bas 100 - 315 Hz
(±) | reducerad bas - i genomsnitt 11.3% lägre än medianen
(±) | linjäriteten för basen är genomsnittlig (14.2% delta till föregående frekvens)
Mellan 400 - 2000 Hz
(+) | balanserad mellan - endast 2.4% från medianen
(+) | mids är linjära (5.5% delta till föregående frekvens)
Högsta 2 - 16 kHz
(+) | balanserade toppar - endast 2% från medianen
(+) | toppar är linjära (4.5% delta till föregående frekvens)
Totalt 100 - 16 000 Hz
(+) | det totala ljudet är linjärt (10.2% skillnad mot median)
Jämfört med samma klass
» 7% av alla testade enheter i den här klassen var bättre, 2% liknande, 91% sämre
» Den bästa hade ett delta på 5%, genomsnittet var 18%, sämst var 53%
Jämfört med alla testade enheter
» 5% av alla testade enheter var bättre, 1% liknande, 94% sämre
» Den bästa hade ett delta på 4%, genomsnittet var 24%, sämst var 134%
Energiförvaltning
Effektförbrukning
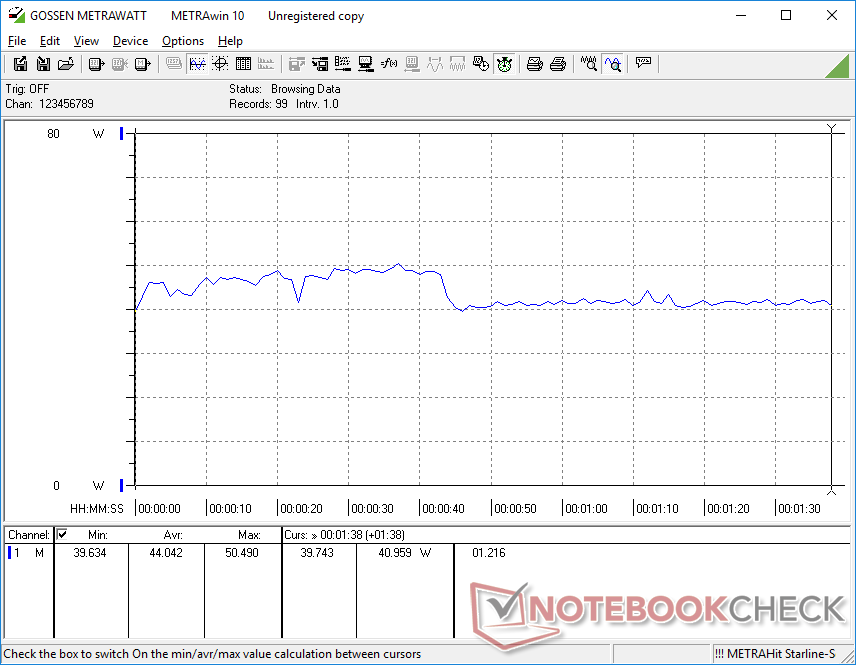
Om du kör 3DMark 06 förbrukas bara 44 W på vår Latitude 9520 2-in-1 jämfört med 46 W på Latitude 9510 2-in-1 trots den massiva ökningen av grafikprestanda på den nyare modellen. Ägarna får alltså i genomsnitt en tredubbel ökning av GPU-prestanda under samma strömförbrukning. Ökningen av prestanda per watt från år till år kan inte underskattas.
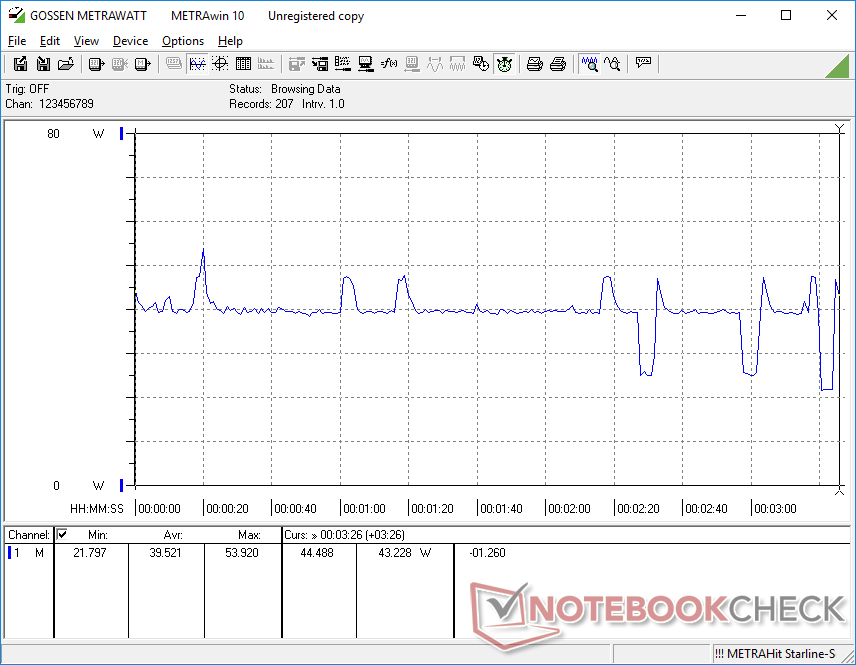
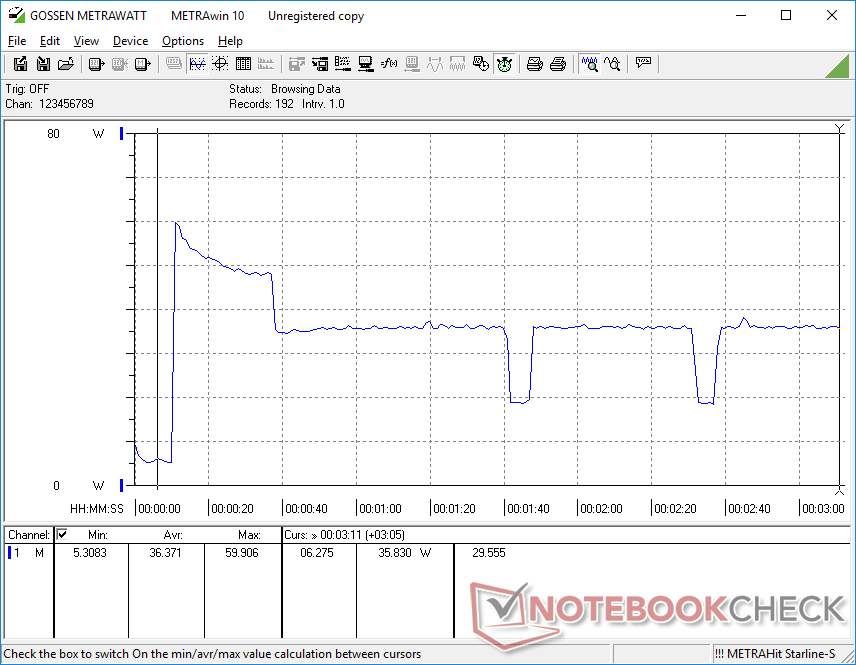
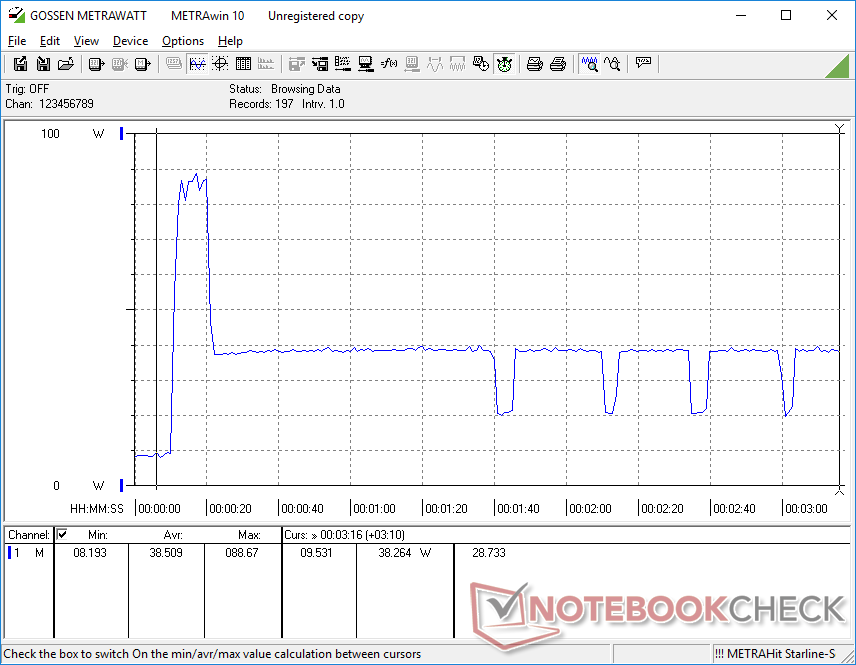
Tyvärr återspeglas den ostadiga GPU-prestanda som nämns ovan av den ostadiga strömförbrukningen, vilket framgår av våra grafer nedan. När man kör Witcher 3 för att representera spelbelastning varierar förbrukningen mellan 21 W och 40 W, medan den ligger stadigt på bara 34 W på HP EliteBook 850 G8 utrustad med en liknande Core i7-1165G7-processor.
Vi kan registrera ett maximalt uttag på 88,7 W från den lilla (~13 x 6,6 x 2,3 cm) 90 W AC-adaptern. Systemet kan inte hålla den här hastigheten längre än några sekunder på grund av termiska begränsningar.
| Av/Standby | |
| Låg belastning | |
| Hög belastning |
|
Förklaring:
min: | |
| Dell Latitude 15 9520 2-in-1 i7-1185G7, Iris Xe G7 96EUs, Toshiba KBG40ZNS512G NVMe, IPS, 1920x1080, 15" | Dell Latitude 9510 2-in-1 i7-10810U, UHD Graphics 620, Toshiba KBG40ZNS512G NVMe, IPS, 1920x1080, 15" | HP EliteBook 850 G8 3C7Z8EA i7-1165G7, Iris Xe G7 96EUs, Samsung PM981a MZVLB1T0HBLR, I, 1920x1080, 15.6" | Lenovo ThinkPad L15 G2 AMD R5 5600U, Vega 7, SK Hynix HFS512 GDE9X081N, IPS LED, 1920x1080, 15.6" | MSI Summit B15 A11M i7-1165G7, Iris Xe G7 96EUs, Kingston OM8PCP31024F, IPS, 1920x1080, 15.6" | Microsoft Surface Laptop 4 15 AMD TFF_00028 R7 4980U, Vega 8, SK Hynix BC511 HFM512GDJTNI, IPS, 2496x1664, 15" | |
|---|---|---|---|---|---|---|
| Power Consumption | 8% | -27% | -14% | -15% | -14% | |
| Idle Minimum * (Watt) | 2.6 | 2.1 19% | 5.8 -123% | 4.57 -76% | 4.2 -62% | 3.6 -38% |
| Idle Average * (Watt) | 5 | 4.6 8% | 8.4 -68% | 8.2 -64% | 7.7 -54% | 6.5 -30% |
| Idle Maximum * (Watt) | 7.1 | 5.3 25% | 9.9 -39% | 9.3 -31% | 8.4 -18% | 8.9 -25% |
| Load Average * (Watt) | 44 | 45.8 -4% | 33 25% | 31.9 27% | 37.8 14% | 46.5 -6% |
| Witcher 3 ultra * (Watt) | 39.5 | 34.3 13% | 34.5 13% | 36.6 7% | 43.4 -10% | |
| Load Maximum * (Watt) | 88.7 | 96.3 -9% | 60 32% | 47.4 47% | 67.5 24% | 64.9 27% |
* ... mindre är bättre
Power Consumption Witcher 3 / Stresstest
Batteritid
Drifttiden är några timmar kortare än vad vi noterade på förra årets modell trots att de har samma 88 Wh-batterier. Trots det är 14+ timmars användning av WLAN i verkligheten fortfarande inget att skratta åt och långt över genomsnittet för storlekskategorin
Dell erbjuder SKU:er med mindre 46 Wh-batterier för användare som inte har något emot att offra batteritid för en lättare enhet
| Dell Latitude 15 9520 2-in-1 i7-1185G7, Iris Xe G7 96EUs, 88 Wh | Dell Latitude 9510 2-in-1 i7-10810U, UHD Graphics 620, 88 Wh | HP EliteBook 850 G8 3C7Z8EA i7-1165G7, Iris Xe G7 96EUs, 56 Wh | Lenovo ThinkPad L15 G2 AMD R5 5600U, Vega 7, 45 Wh | MSI Summit B15 A11M i7-1165G7, Iris Xe G7 96EUs, 52 Wh | Microsoft Surface Laptop 4 15 AMD TFF_00028 R7 4980U, Vega 8, 47.4 Wh | |
|---|---|---|---|---|---|---|
| Batteridrifttid | 26% | -43% | -47% | -55% | -30% | |
| WiFi v1.3 (h) | 14.8 | 18.7 26% | 8.5 -43% | 7.8 -47% | 6.6 -55% | 10.4 -30% |
| Reader / Idle (h) | 59 | 18.4 | ||||
| Load (h) | 4 | 2.3 | 1 | 2.5 | ||
| H.264 (h) | 6.6 | 14.8 |
För
Emot
Dom
Latitude 9520 2-in-1 har betydande prestandafördelar jämfört med Latitude 9510 2-in-1 på papper. Den äldre UHD Graphics 620 har blivit föråldrad nu när Iris Xe blir allt vanligare. I praktiken finns det dock vissa invändningar som potentiella köpare inte bör bortse från.
För det första körs Iris Xe GPU:n i den nya Latitude med cyklande klockfrekvenser vilket resulterar i cyklande bildfrekvenser vid spel eller ostadig prestanda vid GPU-intensiva uppgifter. Bildfrekvensen skulle växla i sådana extremer att vissa program där stabila bildfrekvenser är viktiga skulle bli nästan omöjliga att spela. Vi rekommenderar att du tittar på andra bärbara datorer Tiger Lake-U som MSI Summit E13 Flip ellerHP EliteBook 840 Aero G8 om du vill ha stabilare och mer tillförlitlig GPU-prestanda.
Det främsta försäljningsargumentet för Latitude 9520 2-in-1 jämfört med 9510 2-in-1 är dess betydligt snabbare integrerade grafikprestanda. Den ovanligt ostadiga grafikprestandan på den nyare modellen kan dock vara avskräckande för många intresserade köpare.
För det andra är CPU-prestanda med flera trådar från vår Core i7-1185G7 CPU långsammare jämfört med den äldre Core i7-10810U i Latitude 9510 2-in-1. Även om denna nackdel inte är unik för Dells datorer, är i7-1185G7 i Latitude 9520 2-in-1 långsammare än på många andra bärbara datorer med samma processor. Därför förstärks prestandaförlusten för flera trådar på Dell.
Skälen för att välja Latitude 9520 2-in-1 framför 9510 2-in-1 är mindre än vad vi skulle vilja, särskilt eftersom den nyare modellen inte erbjuder något nytt när det gäller skärmkvalitet, webbkamerakvalitet eller batteritid. Förhoppningsvis kan den ojämna GPU-prestandan åtgärdas med en framtida uppdatering.
Pris och tillgänglighet
De flesta stora återförsäljare, t.ex Amazon, Walmartoch Newegg har Latitude 9520 2-in-1 i lager i olika konfigurationer. Användare kan också köpa direkt från Dell med början på 2 800 USD för Core i5-versionen.
Dell Latitude 15 9520 2-in-1
- 11/22/2021 v7 (old)
Allen Ngo
Price comparison

