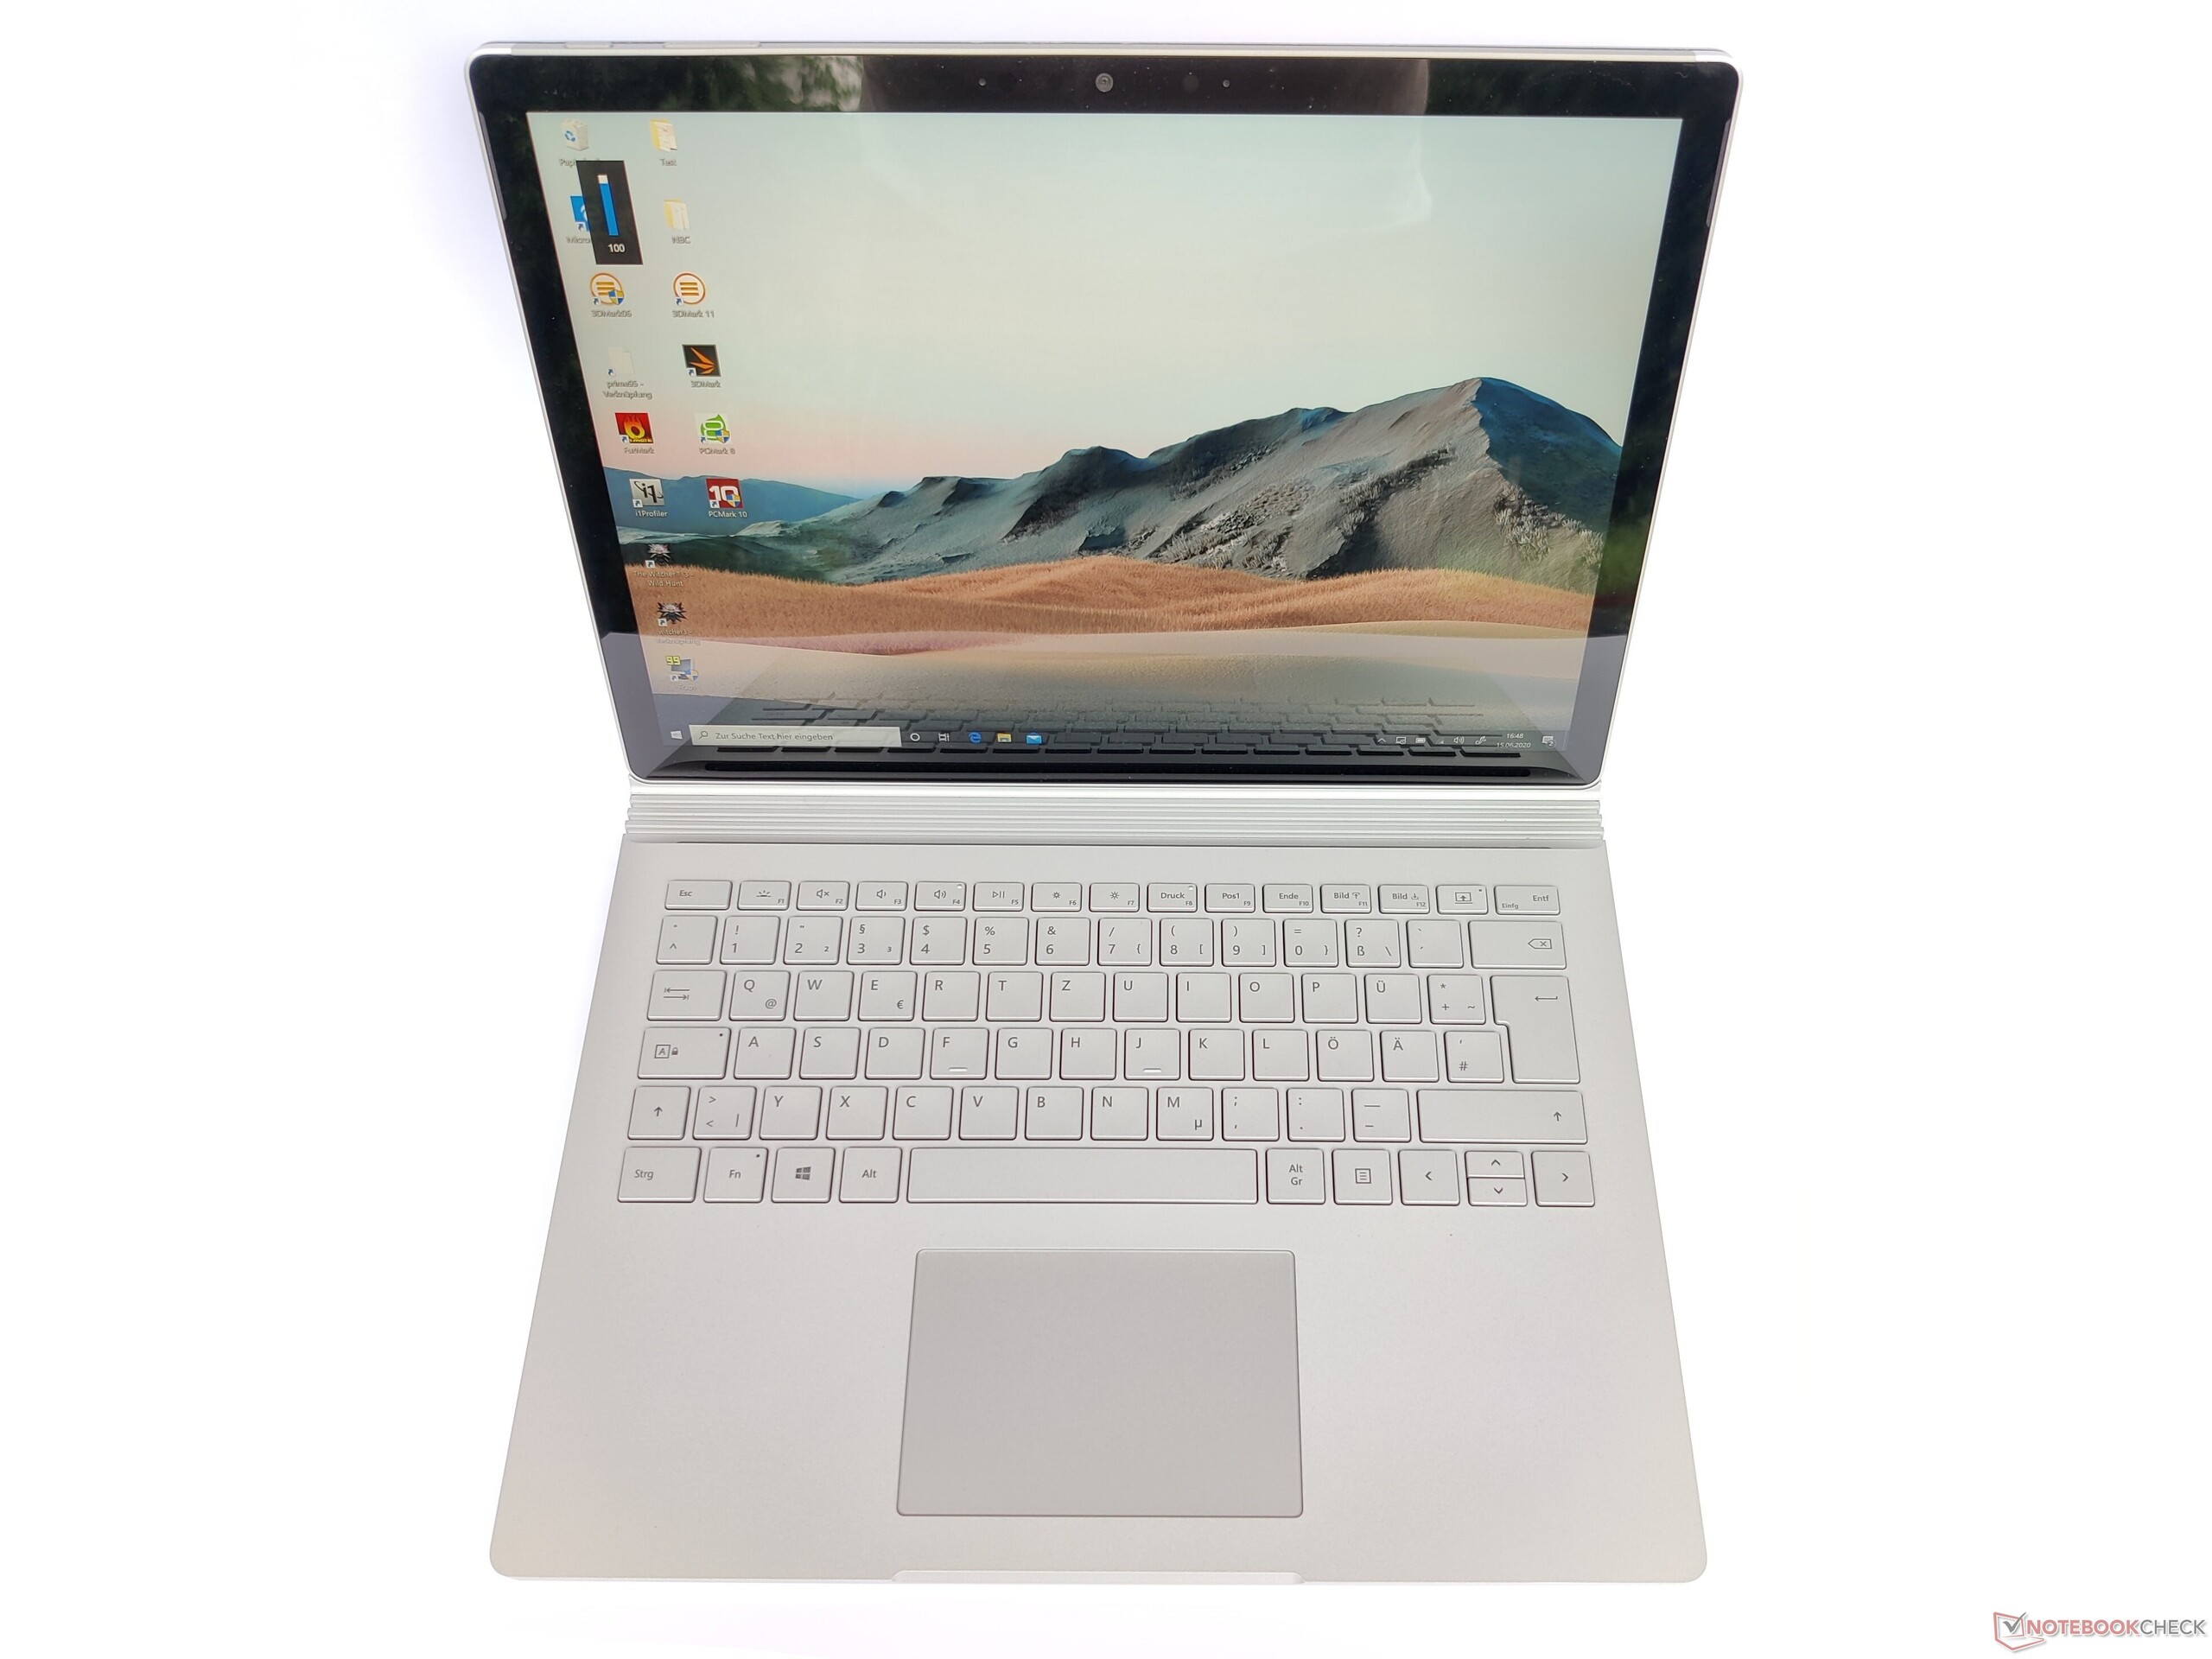
Test: Surface Book 3 13.5 - Microsofts omvandlingsbara börjar så sakteliga kännas gammal (Sammanfattning)
Gradering | Datum | Modell | Vikt | Höjd | Storlek | Upplösning | Pris |
|---|---|---|---|---|---|---|---|
| 86.9 % v7 (old) | 06/2020 | Microsoft Surface Book 3 13.5 i7-1065G7, GeForce GTX 1650 Max-Q | 1.6 kg | 23 mm | 13.50" | 3000x2000 | |
| 85 % v7 (old) | 05/2020 | Asus ZenBook Flip 14 UX463FA-AI039T i5-10210U, UHD Graphics 620 | 1.4 kg | 18 mm | 14.00" | 1920x1080 | |
| 89.8 % v7 (old) | 04/2020 | Lenovo ThinkPad X1 Yoga 20SA000GUS i7-10510U, UHD Graphics 620 | 1.3 kg | 15.5 mm | 14.00" | 2560x1440 | |
| 88.1 % v7 (old) | 02/2020 | Microsoft Surface Pro 7 i7-1065G7, Iris Plus Graphics G7 (Ice Lake 64 EU) | 790 g | 8.5 mm | 12.30" | 2736x1824 | |
| 88.4 % v7 (old) | 01/2020 | HP Spectre x360 13-aw0013dx i7-1065G7, Iris Plus Graphics G7 (Ice Lake 64 EU) | 1.2 kg | 16.9 mm | 13.30" | 1920x1080 | |
| 87.4 % v6 (old) | 12/2017 | Microsoft Surface Book 2 i7-8650U, GeForce GTX 1050 Mobile | 1.6 kg | 23 mm | 13.50" | 3000x2000 |
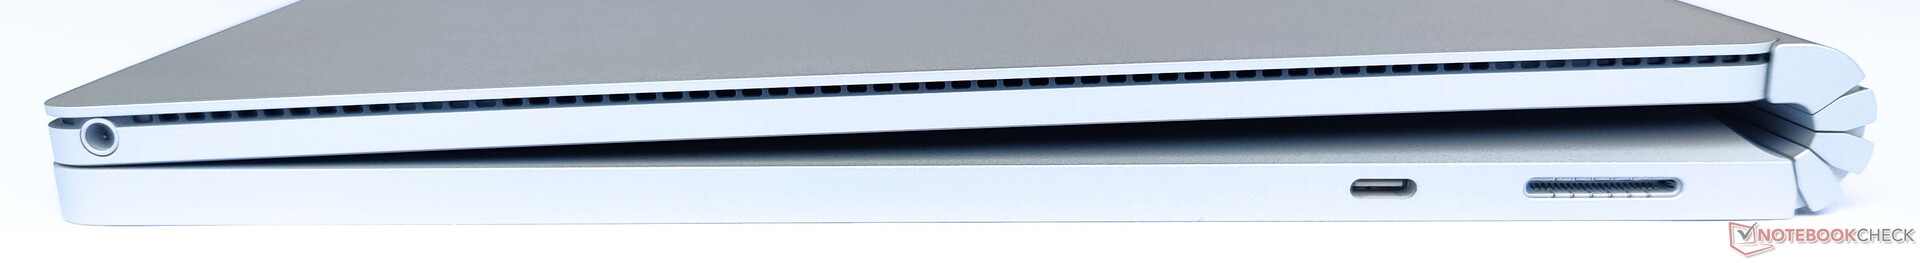
| SD Card Reader | |
| average JPG Copy Test (av. of 3 runs) | |
| HP Spectre x360 13-aw0013dx (Toshiba Exceria Pro M501 microSDXC 64GB) | |
| Microsoft Surface Book 3 13.5 (Toshiba Exceria Pro M501 microSDXC 64GB) | |
| Microsoft Surface Pro 7 (Toshiba Exceria Pro M501 microSDXC 64GB) | |
| Genomsnitt av klass Convertible (28.1 - 197, n=23, senaste 2 åren) | |
| Asus ZenBook Flip 14 UX463FA-AI039T (Toshiba Exceria Pro M501 microSDXC 64GB) | |
| maximum AS SSD Seq Read Test (1GB) | |
| Microsoft Surface Book 3 13.5 (Toshiba Exceria Pro M501 microSDXC 64GB) | |
| HP Spectre x360 13-aw0013dx (Toshiba Exceria Pro M501 microSDXC 64GB) | |
| Genomsnitt av klass Convertible (28.9 - 254, n=22, senaste 2 åren) | |
| Microsoft Surface Pro 7 (Toshiba Exceria Pro M501 microSDXC 64GB) | |
| Asus ZenBook Flip 14 UX463FA-AI039T (Toshiba Exceria Pro M501 microSDXC 64GB) | |


| |||||||||||||||||||||||||
Distribution av ljusstyrkan: 86 %
Mitt på batteriet: 391 cd/m²
Kontrast: 2058:1 (Svärta: 0.19 cd/m²)
ΔE ColorChecker Calman: 3.07 | ∀{0.5-29.43 Ø4.72}
calibrated: 1.52
ΔE Greyscale Calman: 3.6 | ∀{0.09-98 Ø4.97}
95% sRGB (Argyll 1.6.3 3D)
61% AdobeRGB 1998 (Argyll 1.6.3 3D)
65.7% AdobeRGB 1998 (Argyll 3D)
95.1% sRGB (Argyll 3D)
63.5% Display P3 (Argyll 3D)
Gamma: 2.29
CCT: 6330 K
| Microsoft Surface Book 3 13.5 Panasonic MEI96A2, IPS, 3000x2000, 13.5" | Microsoft Surface Book 2 Panasonic MEI96A2 , IPS, 3000x2000, 13.5" | Asus ZenBook Flip 14 UX463FA-AI039T AU AUO323D, IPS, 1920x1080, 14" | Lenovo ThinkPad X1 Yoga 20SA000GUS AU Optronics B140QAN02.2, IPS, 2560x1440, 14" | HP Spectre x360 13-aw0013dx AU Optronics AUO5E2D, IPS, 1920x1080, 13.3" | |
|---|---|---|---|---|---|
| Display | 5% | -7% | 3% | 8% | |
| Display P3 Coverage (%) | 63.5 | 67.9 7% | 60.1 -5% | 66.6 5% | 69.6 10% |
| sRGB Coverage (%) | 95.1 | 95.7 1% | 85.5 -10% | 95.9 1% | 98.9 4% |
| AdobeRGB 1998 Coverage (%) | 65.7 | 69.4 6% | 61.1 -7% | 67.5 3% | 71.5 9% |
| Response Times | 14% | 32% | 41% | -2% | |
| Response Time Grey 50% / Grey 80% * (ms) | 57 ? | 52.8 ? 7% | 36 ? 37% | 32 ? 44% | 60.8 ? -7% |
| Response Time Black / White * (ms) | 38 ? | 30 ? 21% | 28 ? 26% | 23.6 ? 38% | 36.8 ? 3% |
| PWM Frequency (Hz) | |||||
| Screen | 10% | -30% | -7% | -22% | |
| Brightness middle (cd/m²) | 391 | 385 -2% | 280 -28% | 284.6 -27% | 447.4 14% |
| Brightness (cd/m²) | 367 | 372 1% | 286 -22% | 269 -27% | 420 14% |
| Brightness Distribution (%) | 86 | 89 3% | 78 -9% | 86 0% | 85 -1% |
| Black Level * (cd/m²) | 0.19 | 0.21 -11% | 0.208 -9% | 0.28 -47% | 0.31 -63% |
| Contrast (:1) | 2058 | 1833 -11% | 1346 -35% | 1016 -51% | 1443 -30% |
| Colorchecker dE 2000 * | 3.07 | 1.6 48% | 3.97 -29% | 2.07 33% | 4.23 -38% |
| Colorchecker dE 2000 max. * | 4.74 | 4.5 5% | 8.29 -75% | 3.75 21% | 9.34 -97% |
| Colorchecker dE 2000 calibrated * | 1.52 | 3.42 -125% | 2.05 -35% | 1.32 13% | |
| Greyscale dE 2000 * | 3.6 | 1.5 58% | 2.83 21% | 1.7 53% | 6.1 -69% |
| Gamma | 2.29 96% | 2.22 99% | 2.34 94% | 2.17 101% | 2.11 104% |
| CCT | 6330 103% | 6502 100% | 6556 99% | 6627 98% | 6136 106% |
| Color Space (Percent of AdobeRGB 1998) (%) | 61 | 64 5% | 56 -8% | 61.7 1% | 64.8 6% |
| Color Space (Percent of sRGB) (%) | 95 | 95.9 1% | 85 -11% | 95.8 1% | 98.9 4% |
| Totalt genomsnitt (program/inställningar) | 10% /
9% | -2% /
-18% | 12% /
1% | -5% /
-14% |
* ... mindre är bättre
Visa svarstider
| ↔ Svarstid svart till vitt | ||
|---|---|---|
| 38 ms ... stiga ↗ och falla ↘ kombinerat | ↗ 22 ms stiga | 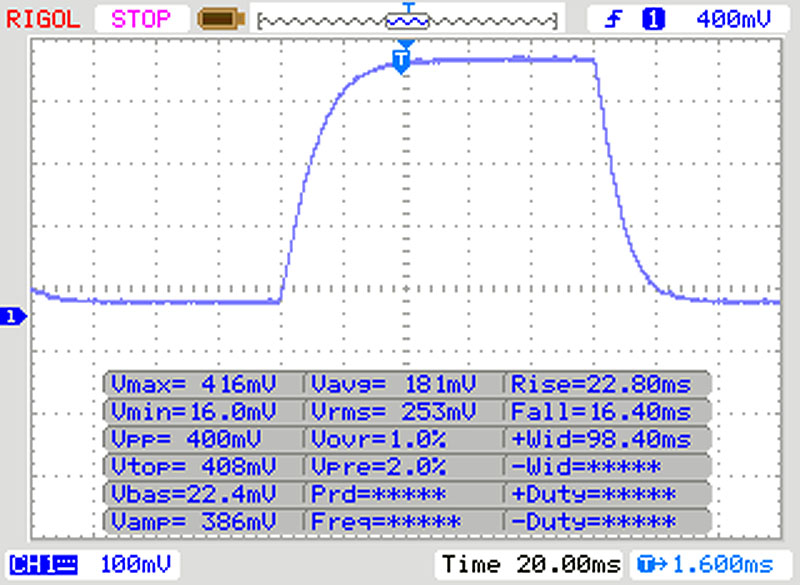 |
| ↘ 16 ms hösten | ||
| Skärmen visar långsamma svarsfrekvenser i våra tester och kommer att vara otillfredsställande för spelare. I jämförelse sträcker sig alla testade enheter från 0.1 (minst) till 240 (maximalt) ms. » 96 % av alla enheter är bättre. Detta innebär att den uppmätta svarstiden är sämre än genomsnittet av alla testade enheter (19.8 ms). | ||
| ↔ Svarstid 50 % grått till 80 % grått | ||
| 57 ms ... stiga ↗ och falla ↘ kombinerat | ↗ 28 ms stiga | 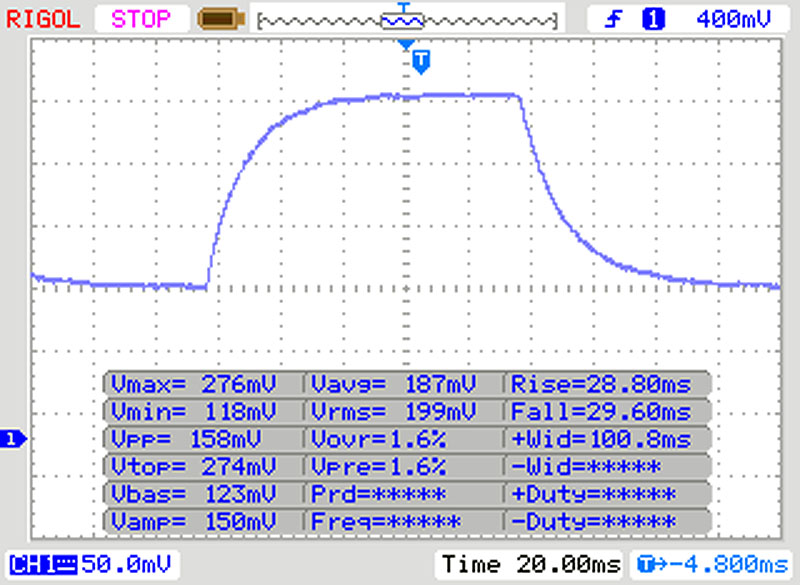 |
| ↘ 29 ms hösten | ||
| Skärmen visar långsamma svarsfrekvenser i våra tester och kommer att vara otillfredsställande för spelare. I jämförelse sträcker sig alla testade enheter från 0.165 (minst) till 636 (maximalt) ms. » 94 % av alla enheter är bättre. Detta innebär att den uppmätta svarstiden är sämre än genomsnittet av alla testade enheter (31 ms). | ||
Skärmflimmer / PWM (Puls-Width Modulation)
| Skärmflimmer / PWM upptäcktes inte |  | ||
Som jämförelse: 52 % av alla testade enheter använder inte PWM för att dämpa skärmen. Om PWM upptäcktes mättes ett medelvärde av 7778 (minst: 5 - maximum: 343500) Hz. | |||
Cinebench R15: CPU Single 64Bit | CPU Multi 64Bit
Blender: v2.79 BMW27 CPU
7-Zip 18.03: 7z b 4 -mmt1 | 7z b 4
Geekbench 5.5: Single-Core | Multi-Core
HWBOT x265 Benchmark v2.2: 4k Preset
LibreOffice : 20 Documents To PDF
R Benchmark 2.5: Overall mean
| Cinebench R20 / CPU (Single Core) | |
| Genomsnitt av klass Convertible (273 - 834, n=50, senaste 2 åren) | |
| Microsoft Surface Pro 7 | |
| Lenovo ThinkPad X1 Yoga 20SA000GUS | |
| Genomsnitt Intel Core i7-1065G7 (358 - 474, n=31) | |
| Microsoft Surface Book 3 13.5 | |
| HP Spectre x360 13-aw0013dx | |
| Cinebench R20 / CPU (Multi Core) | |
| Genomsnitt av klass Convertible (595 - 12102, n=50, senaste 2 åren) | |
| Microsoft Surface Pro 7 | |
| HP Spectre x360 13-aw0013dx | |
| Lenovo ThinkPad X1 Yoga 20SA000GUS | |
| Genomsnitt Intel Core i7-1065G7 (1081 - 2024, n=31) | |
| Microsoft Surface Book 3 13.5 | |
| Cinebench R15 / CPU Single 64Bit | |
| Genomsnitt av klass Convertible (149.8 - 317, n=49, senaste 2 åren) | |
| Microsoft Surface Pro 7 | |
| Lenovo ThinkPad X1 Yoga 20SA000GUS | |
| Microsoft Surface Book 3 13.5 | |
| HP Spectre x360 13-aw0013dx | |
| Microsoft Surface Book 2 | |
| Genomsnitt Intel Core i7-1065G7 (141 - 190, n=35) | |
| Asus ZenBook Flip 14 UX463FA-AI039T | |
| Cinebench R15 / CPU Multi 64Bit | |
| Genomsnitt av klass Convertible (478 - 4940, n=49, senaste 2 åren) | |
| Microsoft Surface Pro 7 | |
| Lenovo ThinkPad X1 Yoga 20SA000GUS | |
| Asus ZenBook Flip 14 UX463FA-AI039T | |
| Microsoft Surface Book 2 | |
| Genomsnitt Intel Core i7-1065G7 (288 - 836, n=36) | |
| HP Spectre x360 13-aw0013dx | |
| Microsoft Surface Book 3 13.5 | |
| Blender / v2.79 BMW27 CPU | |
| Microsoft Surface Book 3 13.5 | |
| Genomsnitt Intel Core i7-1065G7 (675 - 1650, n=23) | |
| Lenovo ThinkPad X1 Yoga 20SA000GUS | |
| Genomsnitt av klass Convertible (105 - 1051, n=49, senaste 2 åren) | |
| 7-Zip 18.03 / 7z b 4 -mmt1 | |
| Genomsnitt av klass Convertible (3672 - 6655, n=49, senaste 2 åren) | |
| Lenovo ThinkPad X1 Yoga 20SA000GUS | |
| Genomsnitt Intel Core i7-1065G7 (3289 - 4589, n=24) | |
| Microsoft Surface Book 3 13.5 | |
| 7-Zip 18.03 / 7z b 4 | |
| Genomsnitt av klass Convertible (12977 - 121368, n=49, senaste 2 åren) | |
| Genomsnitt Intel Core i7-1065G7 (10406 - 22898, n=24) | |
| Lenovo ThinkPad X1 Yoga 20SA000GUS | |
| Microsoft Surface Book 3 13.5 | |
| Geekbench 5.5 / Single-Core | |
| Genomsnitt av klass Convertible (806 - 2275, n=49, senaste 2 åren) | |
| Microsoft Surface Book 3 13.5 | |
| Genomsnitt Intel Core i7-1065G7 (948 - 1348, n=18) | |
| Lenovo ThinkPad X1 Yoga 20SA000GUS | |
| Geekbench 5.5 / Multi-Core | |
| Genomsnitt av klass Convertible (1608 - 22023, n=49, senaste 2 åren) | |
| Lenovo ThinkPad X1 Yoga 20SA000GUS | |
| Genomsnitt Intel Core i7-1065G7 (2464 - 4855, n=18) | |
| Microsoft Surface Book 3 13.5 | |
| HWBOT x265 Benchmark v2.2 / 4k Preset | |
| Genomsnitt av klass Convertible (3.43 - 36.2, n=49, senaste 2 åren) | |
| Lenovo ThinkPad X1 Yoga 20SA000GUS | |
| Genomsnitt Intel Core i7-1065G7 (2.2 - 6.38, n=22) | |
| Microsoft Surface Book 3 13.5 | |
| LibreOffice / 20 Documents To PDF | |
| Microsoft Surface Book 3 13.5 | |
| Genomsnitt Intel Core i7-1065G7 (46.9 - 85.3, n=19) | |
| Genomsnitt av klass Convertible (42.5 - 84.3, n=49, senaste 2 åren) | |
| Lenovo ThinkPad X1 Yoga 20SA000GUS | |
| R Benchmark 2.5 / Overall mean | |
| Microsoft Surface Book 3 13.5 | |
| Genomsnitt Intel Core i7-1065G7 (0.661 - 0.798, n=18) | |
| Lenovo ThinkPad X1 Yoga 20SA000GUS | |
| Genomsnitt av klass Convertible (0.3915 - 0.84, n=49, senaste 2 åren) | |
* ... mindre är bättre
| PCMark 8 Home Score Accelerated v2 | 3369 poäng | |
| PCMark 8 Work Score Accelerated v2 | 4466 poäng | |
| PCMark 10 Score | 4184 poäng | |
Hjälp | ||
| DPC Latencies / LatencyMon - interrupt to process latency (max), Web, Youtube, Prime95 | |
| Lenovo ThinkPad X1 Yoga 20SA000GUS | |
| Microsoft Surface Book 3 13.5 | |
| Asus ZenBook Flip 14 UX463FA-AI039T | |
* ... mindre är bättre
| Microsoft Surface Book 3 13.5 SK Hynix BC501 HFM512GDJTNG | Microsoft Surface Book 2 Samsung PM961 MZVLW256HEHP | Asus ZenBook Flip 14 UX463FA-AI039T Kingston RBUSNS8154P3512GJ1 | Lenovo ThinkPad X1 Yoga 20SA000GUS WDC PC SN730 SDBQNTY-512GB | HP Spectre x360 13-aw0013dx Intel Optane Memory H10 with Solid State Storage 32GB + 512GB HBRPEKNX0202A(L/H) | Microsoft Surface Pro 7 Toshiba KBG40ZNS256G NVMe | Genomsnitt SK Hynix BC501 HFM512GDJTNG | |
|---|---|---|---|---|---|---|---|
| CrystalDiskMark 5.2 / 6 | 17% | -0% | 94% | 45% | 65% | 4% | |
| Write 4K (MB/s) | 88.4 | 140.6 59% | 54.6 -38% | 152 72% | 112.6 27% | 131.3 49% | 95.5 ? 8% |
| Read 4K (MB/s) | 39.53 | 43.62 10% | 28.19 -29% | 45.96 16% | 131 231% | 52.4 33% | 38.3 ? -3% |
| Write Seq (MB/s) | 691 | 343.3 -50% | 840 22% | 2069 199% | 458.9 -34% | 1613 133% | 759 ? 10% |
| Read Seq (MB/s) | 1032 | 1452 41% | 905 -12% | 1708 66% | 1355 31% | 1613 56% | 1022 ? -1% |
| Write 4K Q32T1 (MB/s) | 279.6 | 344.4 23% | 409.5 46% | 465.4 66% | 341.3 22% | 411.6 47% | 303 ? 8% |
| Read 4K Q32T1 (MB/s) | 261.6 | 457.2 75% | 292.4 12% | 410.1 57% | 320.6 23% | 415.6 59% | 317 ? 21% |
| Write Seq Q32T1 (MB/s) | 868 | 344.3 -60% | 1038 20% | 2713 213% | 1219 40% | 2340 170% | 885 ? 2% |
| Read Seq Q32T1 (MB/s) | 2075 | 2885 39% | 1607 -23% | 3399 64% | 2462 19% | 1568 -24% | 1803 ? -13% |
| Write 4K Q8T8 (MB/s) | 410.9 | 306 ? | |||||
| Read 4K Q8T8 (MB/s) | 1033 | 698 ? | |||||
| AS SSD | -22% | 38% | -37% | -19% | 4% | ||
| Seq Read (MB/s) | 1707 | 1336 -22% | 1939 14% | 1039 -39% | 1881 10% | 1323 ? -22% | |
| Seq Write (MB/s) | 510 | 653 28% | 1380 171% | 310.1 -39% | 703 38% | 697 ? 37% | |
| 4K Read (MB/s) | 38.77 | 26.65 -31% | 41.38 7% | 76 96% | 52.3 35% | 40.4 ? 4% | |
| 4K Write (MB/s) | 100.9 | 52.7 -48% | 154.9 54% | 118 17% | 154.1 53% | 100.8 ? 0% | |
| 4K-64 Read (MB/s) | 630 | 644 2% | 970 54% | 371.8 -41% | 1048 66% | 686 ? 9% | |
| 4K-64 Write (MB/s) | 707 | 482.9 -32% | 990 40% | 469.5 -34% | 703 -1% | 660 ? -7% | |
| Access Time Read * (ms) | 0.085 | 0.074 13% | 0.055 35% | 0.067 21% | 0.069 19% | 0.06071 ? 29% | |
| Access Time Write * (ms) | 0.035 | 0.072 -106% | 0.07 -100% | 0.138 -294% | 0.221 -531% | 0.037 ? -6% | |
| Score Read (Points) | 839 | 804 -4% | 1205 44% | 552 -34% | 1288 54% | 858 ? 2% | |
| Score Write (Points) | 859 | 601 -30% | 1283 49% | 618 -28% | 927 8% | 830 ? -3% | |
| Score Total (Points) | 2077 | 1786 -14% | 3083 48% | 1448 -30% | 2826 36% | 2107 ? 1% | |
| Copy ISO MB/s (MB/s) | 2074 | 764 | 1160 | 802 ? | |||
| Copy Program MB/s (MB/s) | 630 | 465.8 | 454.7 | 265 ? | |||
| Copy Game MB/s (MB/s) | 1326 | 764 | 991 | 487 ? | |||
| Totalt genomsnitt (program/inställningar) | 17% /
17% | -11% /
-13% | 66% /
62% | 4% /
-2% | 23% /
16% | 4% /
4% |
* ... mindre är bättre

Kontinuerlig läsning: DiskSpd Read Loop, Queue Depth 8
| 3DMark 11 Performance | 9665 poäng | |
| 3DMark Cloud Gate Standard Score | 15476 poäng | |
| 3DMark Fire Strike Score | 6602 poäng | |
Hjälp | ||
| låg | med. | hög | ultra | |
|---|---|---|---|---|
| The Witcher 3 (2015) | 141.5 | 83.2 | 41.5 | 30.1 |
| Dota 2 Reborn (2015) | 61.2 | 85.6 | 81.6 | 68.3 |
| X-Plane 11.11 (2018) | 83.5 | 57.2 | 51.8 |
Ljudnivå
| Låg belastning |
| 30.2 / 30.2 / 30.2 dB(A) |
| Hög belastning |
| 32.4 / 33.6 dB(A) |
 | ||
30 dB tyst 40 dB(A) hörbar 50 dB(A) högt ljud |
||
min: | ||
(±) Den maximala temperaturen på ovansidan är 41 °C / 106 F, jämfört med genomsnittet av 35.4 °C / 96 F , allt från 19.6 till 60 °C för klassen Convertible.
(±) Botten värms upp till maximalt 43.7 °C / 111 F, jämfört med genomsnittet av 36.9 °C / 98 F
(+) Vid tomgångsbruk är medeltemperaturen för ovansidan 27.2 °C / 81 F, jämfört med enhetsgenomsnittet på 30.3 °C / ### class_avg_f### F.
(-) När du spelar The Witcher 3 är medeltemperaturen för ovansidan 38.9 °C / 102 F, jämfört med enhetsgenomsnittet på 30.3 °C / ## #class_avg_f### F.
(-) Handledsstöden och pekplattan kan bli väldigt varma vid beröring med maximalt 41.8 °C / 107.2 F.
(-) Medeltemperaturen för handledsstödsområdet på liknande enheter var 28 °C / 82.4 F (-13.8 °C / -24.8 F).
Microsoft Surface Book 3 13.5 ljudanalys
(-) | inte särskilt höga högtalare (61.8 dB)
Bas 100 - 315 Hz
(±) | reducerad bas - i genomsnitt 10.4% lägre än medianen
(±) | linjäriteten för basen är genomsnittlig (8.2% delta till föregående frekvens)
Mellan 400 - 2000 Hz
(+) | balanserad mellan - endast 4.7% från medianen
(+) | mids är linjära (6% delta till föregående frekvens)
Högsta 2 - 16 kHz
(+) | balanserade toppar - endast 2.7% från medianen
(+) | toppar är linjära (6.8% delta till föregående frekvens)
Totalt 100 - 16 000 Hz
(±) | linjäriteten för det totala ljudet är genomsnittlig (19% skillnad mot median)
Jämfört med samma klass
» 45% av alla testade enheter i den här klassen var bättre, 7% liknande, 48% sämre
» Den bästa hade ett delta på 6%, genomsnittet var 20%, sämst var 57%
Jämfört med alla testade enheter
» 45% av alla testade enheter var bättre, 7% liknande, 48% sämre
» Den bästa hade ett delta på 4%, genomsnittet var 24%, sämst var 134%
Apple MacBook 12 (Early 2016) 1.1 GHz ljudanalys
(+) | högtalare kan spela relativt högt (83.6 dB)
Bas 100 - 315 Hz
(±) | reducerad bas - i genomsnitt 11.3% lägre än medianen
(±) | linjäriteten för basen är genomsnittlig (14.2% delta till föregående frekvens)
Mellan 400 - 2000 Hz
(+) | balanserad mellan - endast 2.4% från medianen
(+) | mids är linjära (5.5% delta till föregående frekvens)
Högsta 2 - 16 kHz
(+) | balanserade toppar - endast 2% från medianen
(+) | toppar är linjära (4.5% delta till föregående frekvens)
Totalt 100 - 16 000 Hz
(+) | det totala ljudet är linjärt (10.2% skillnad mot median)
Jämfört med samma klass
» 7% av alla testade enheter i den här klassen var bättre, 2% liknande, 91% sämre
» Den bästa hade ett delta på 5%, genomsnittet var 18%, sämst var 53%
Jämfört med alla testade enheter
» 5% av alla testade enheter var bättre, 1% liknande, 94% sämre
» Den bästa hade ett delta på 4%, genomsnittet var 24%, sämst var 134%
| Av/Standby | |
| Låg belastning | |
| Hög belastning |
|
Förklaring:
min: | |
| Microsoft Surface Book 3 13.5 i7-1065G7, GeForce GTX 1650 Max-Q, SK Hynix BC501 HFM512GDJTNG, IPS, 3000x2000, 13.5" | Microsoft Surface Book 2 i7-8650U, GeForce GTX 1050 Mobile, Samsung PM961 MZVLW256HEHP, IPS, 3000x2000, 13.5" | Asus ZenBook Flip 14 UX463FA-AI039T i5-10210U, UHD Graphics 620, Kingston RBUSNS8154P3512GJ1, IPS, 1920x1080, 14" | Lenovo ThinkPad X1 Yoga 20SA000GUS i7-10510U, UHD Graphics 620, WDC PC SN730 SDBQNTY-512GB, IPS, 2560x1440, 14" | HP Spectre x360 13-aw0013dx i7-1065G7, Iris Plus Graphics G7 (Ice Lake 64 EU), Intel Optane Memory H10 with Solid State Storage 32GB + 512GB HBRPEKNX0202A(L/H), IPS, 1920x1080, 13.3" | Microsoft Surface Pro 7 i7-1065G7, Iris Plus Graphics G7 (Ice Lake 64 EU), Toshiba KBG40ZNS256G NVMe, IPS, 2736x1824, 12.3" | Genomsnitt NVIDIA GeForce GTX 1650 Max-Q | Genomsnitt av klass Convertible | |
|---|---|---|---|---|---|---|---|---|
| Power Consumption | -9% | 29% | 35% | 36% | 20% | -31% | 25% | |
| Idle Minimum * (Watt) | 4.8 | 4.7 2% | 3.6 25% | 3.5 27% | 3.9 19% | 4.4 8% | 7.75 ? -61% | 4.24 ? 12% |
| Idle Average * (Watt) | 9.4 | 10.6 -13% | 7.5 20% | 5.6 40% | 6.3 33% | 8.7 7% | 11.8 ? -26% | 7.03 ? 25% |
| Idle Maximum * (Watt) | 11.2 | 12.3 -10% | 9.4 16% | 6.5 42% | 6.8 39% | 9.6 14% | 16.6 ? -48% | 8.61 ? 23% |
| Load Average * (Watt) | 72 | 81 -13% | 42 42% | 42.7 41% | 32.6 55% | 44 39% | 75.2 ? -4% | 43.9 ? 39% |
| Load Maximum * (Watt) | 90 | 100.3 -11% | 51 43% | 66.5 26% | 59 34% | 61 32% | 105.5 ? -17% | 67.2 ? 25% |
| Witcher 3 ultra * (Watt) | 97 | 25.6 |
* ... mindre är bättre
| Microsoft Surface Book 3 13.5 i7-1065G7, GeForce GTX 1650 Max-Q, 69 Wh | Microsoft Surface Book 2 i7-8650U, GeForce GTX 1050 Mobile, 75 Wh | Asus ZenBook Flip 14 UX463FA-AI039T i5-10210U, UHD Graphics 620, 50 Wh | Lenovo ThinkPad X1 Yoga 20SA000GUS i7-10510U, UHD Graphics 620, 51 Wh | HP Spectre x360 13-aw0013dx i7-1065G7, Iris Plus Graphics G7 (Ice Lake 64 EU), 60 Wh | Microsoft Surface Pro 7 i7-1065G7, Iris Plus Graphics G7 (Ice Lake 64 EU), 45 Wh | Genomsnitt av klass Convertible | |
|---|---|---|---|---|---|---|---|
| Batteridrifttid | 40% | 17% | 4% | 54% | -7% | 36% | |
| Reader / Idle (h) | 16.5 | 24.5 48% | 19.9 21% | 37.1 125% | 11.5 -30% | 27.7 ? 68% | |
| WiFi v1.3 (h) | 6.6 | 11.1 68% | 7.7 17% | 9.2 39% | 9.9 50% | 9.8 48% | 12.1 ? 83% |
| Load (h) | 3.1 | 3.2 3% | 1.6 -48% | 2.7 -13% | 1.9 -39% | 1.779 ? -43% | |
| Witcher 3 ultra (h) | 3.8 |
För
Emot
Omdöme - Vi förväntade oss mer från Surface Book 3
Läs den fullständiga versionen av den här recensionen på engelska här.
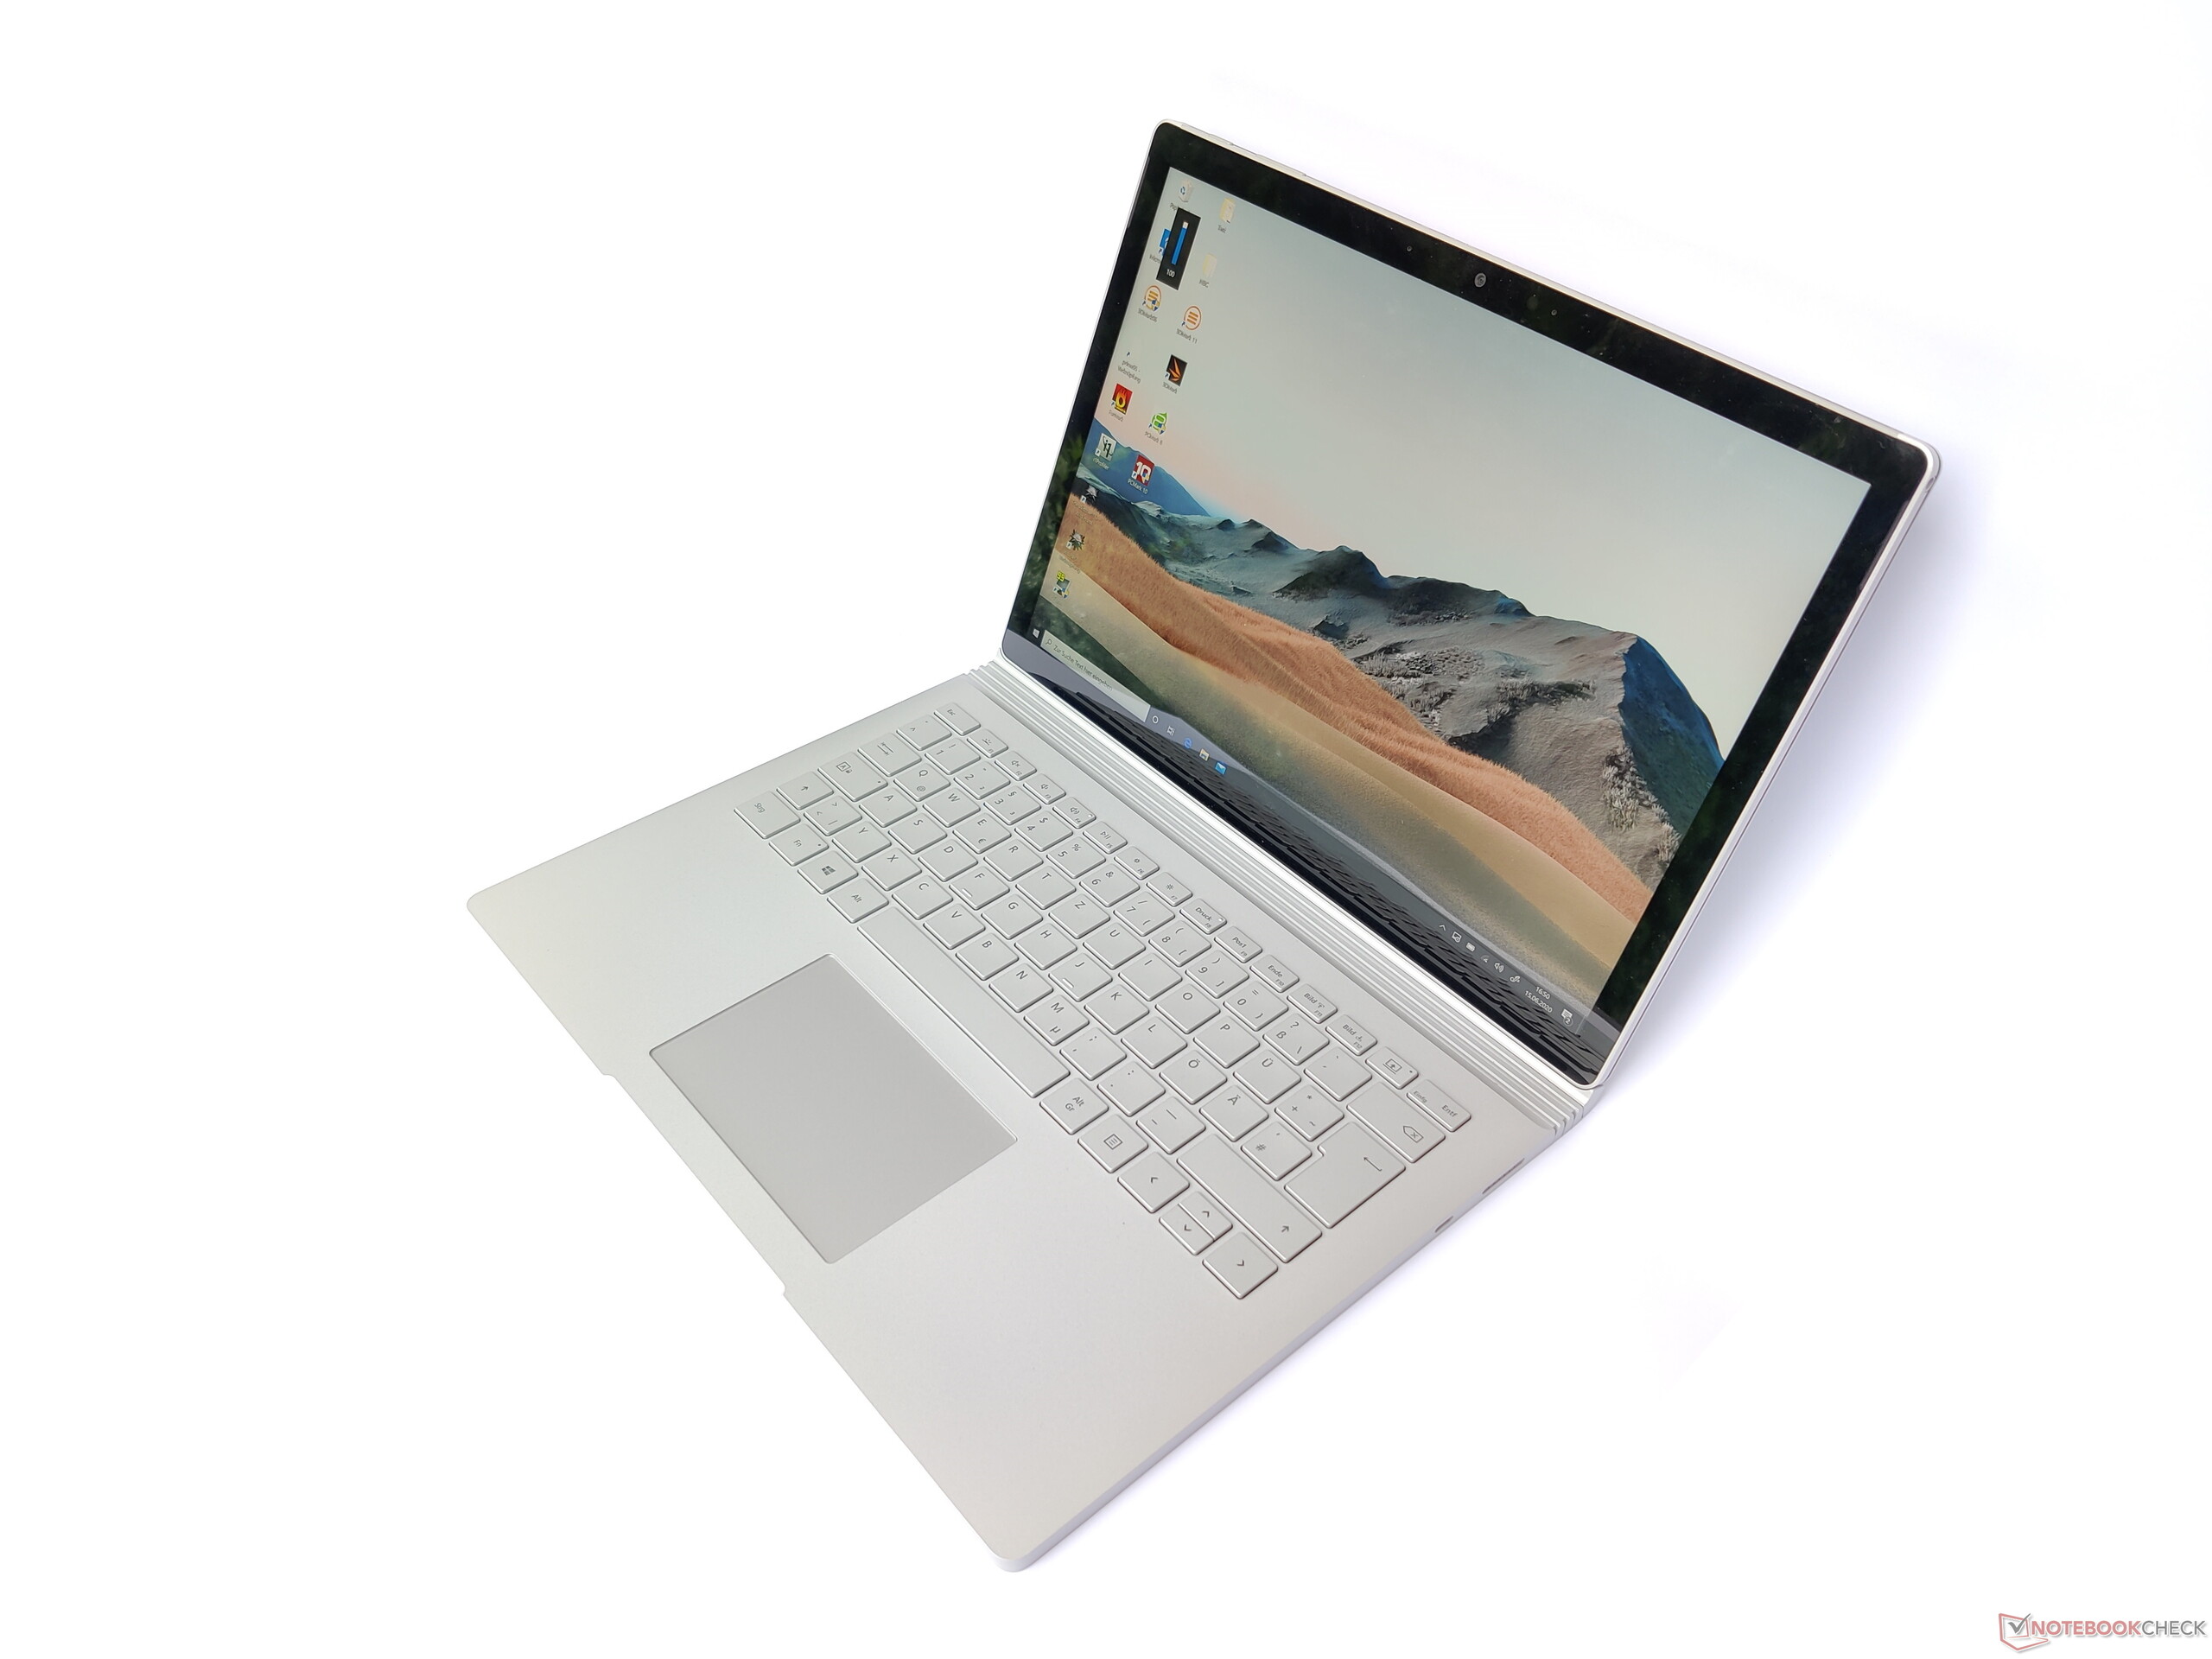
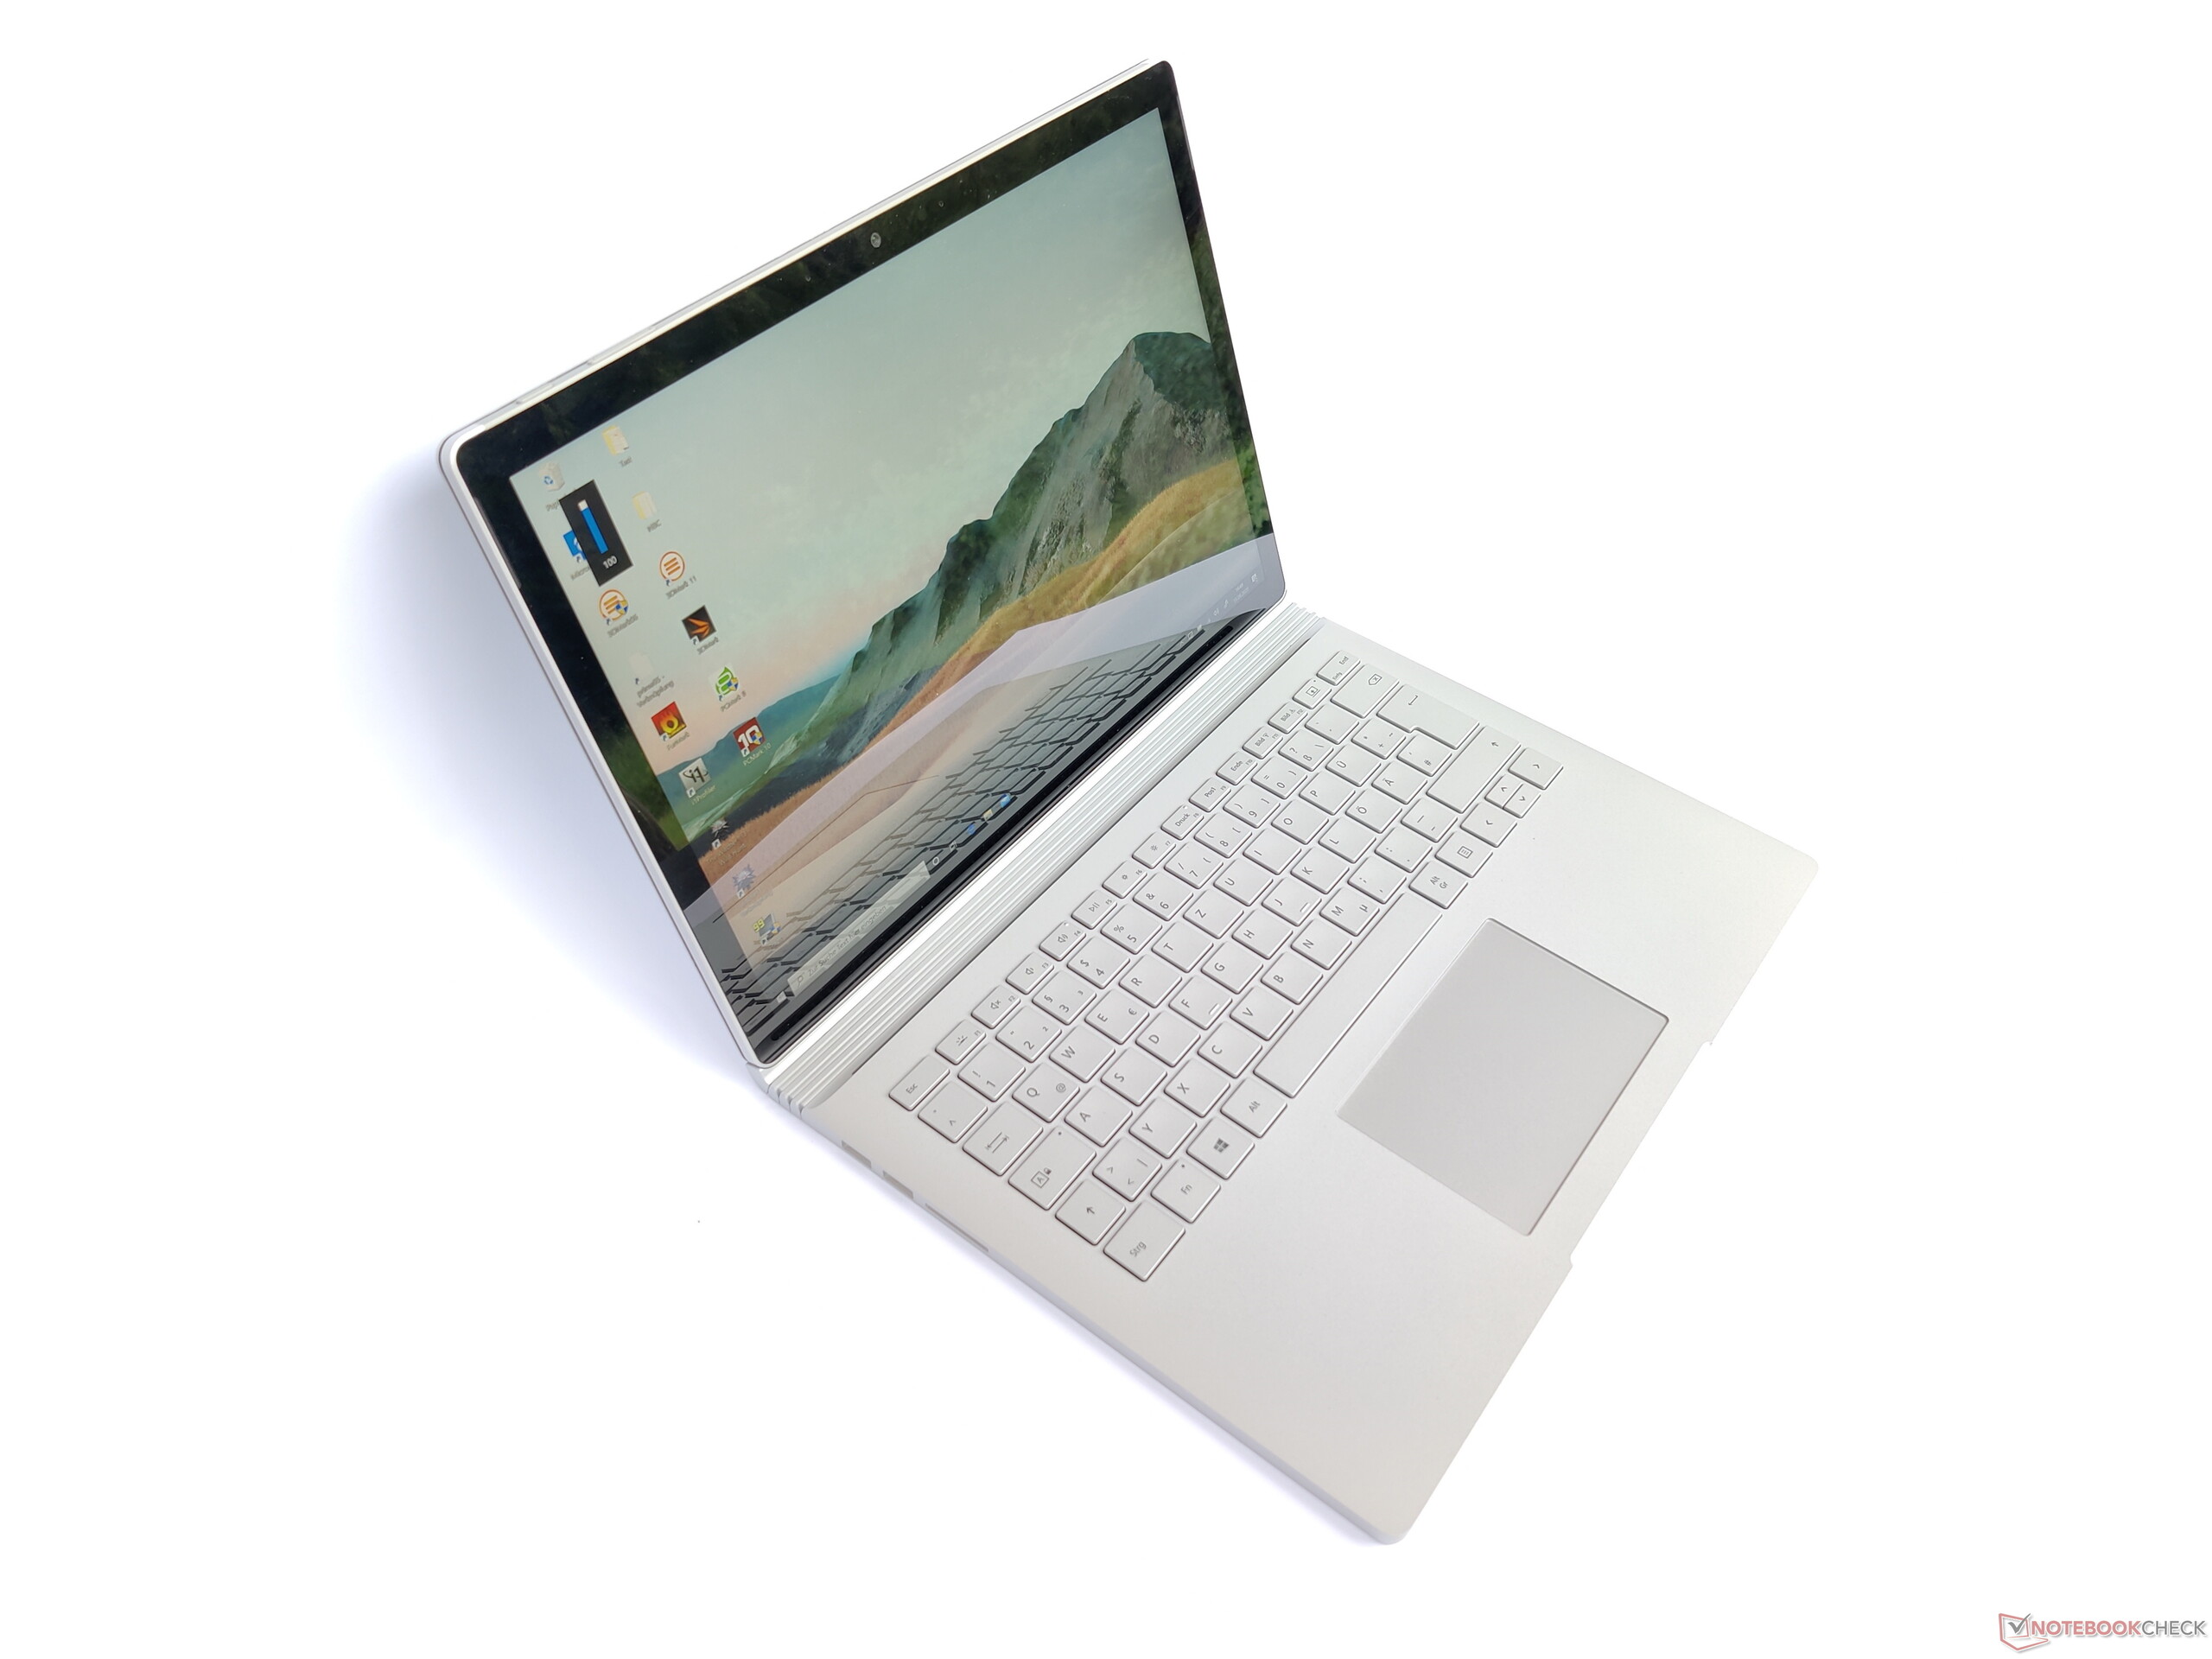
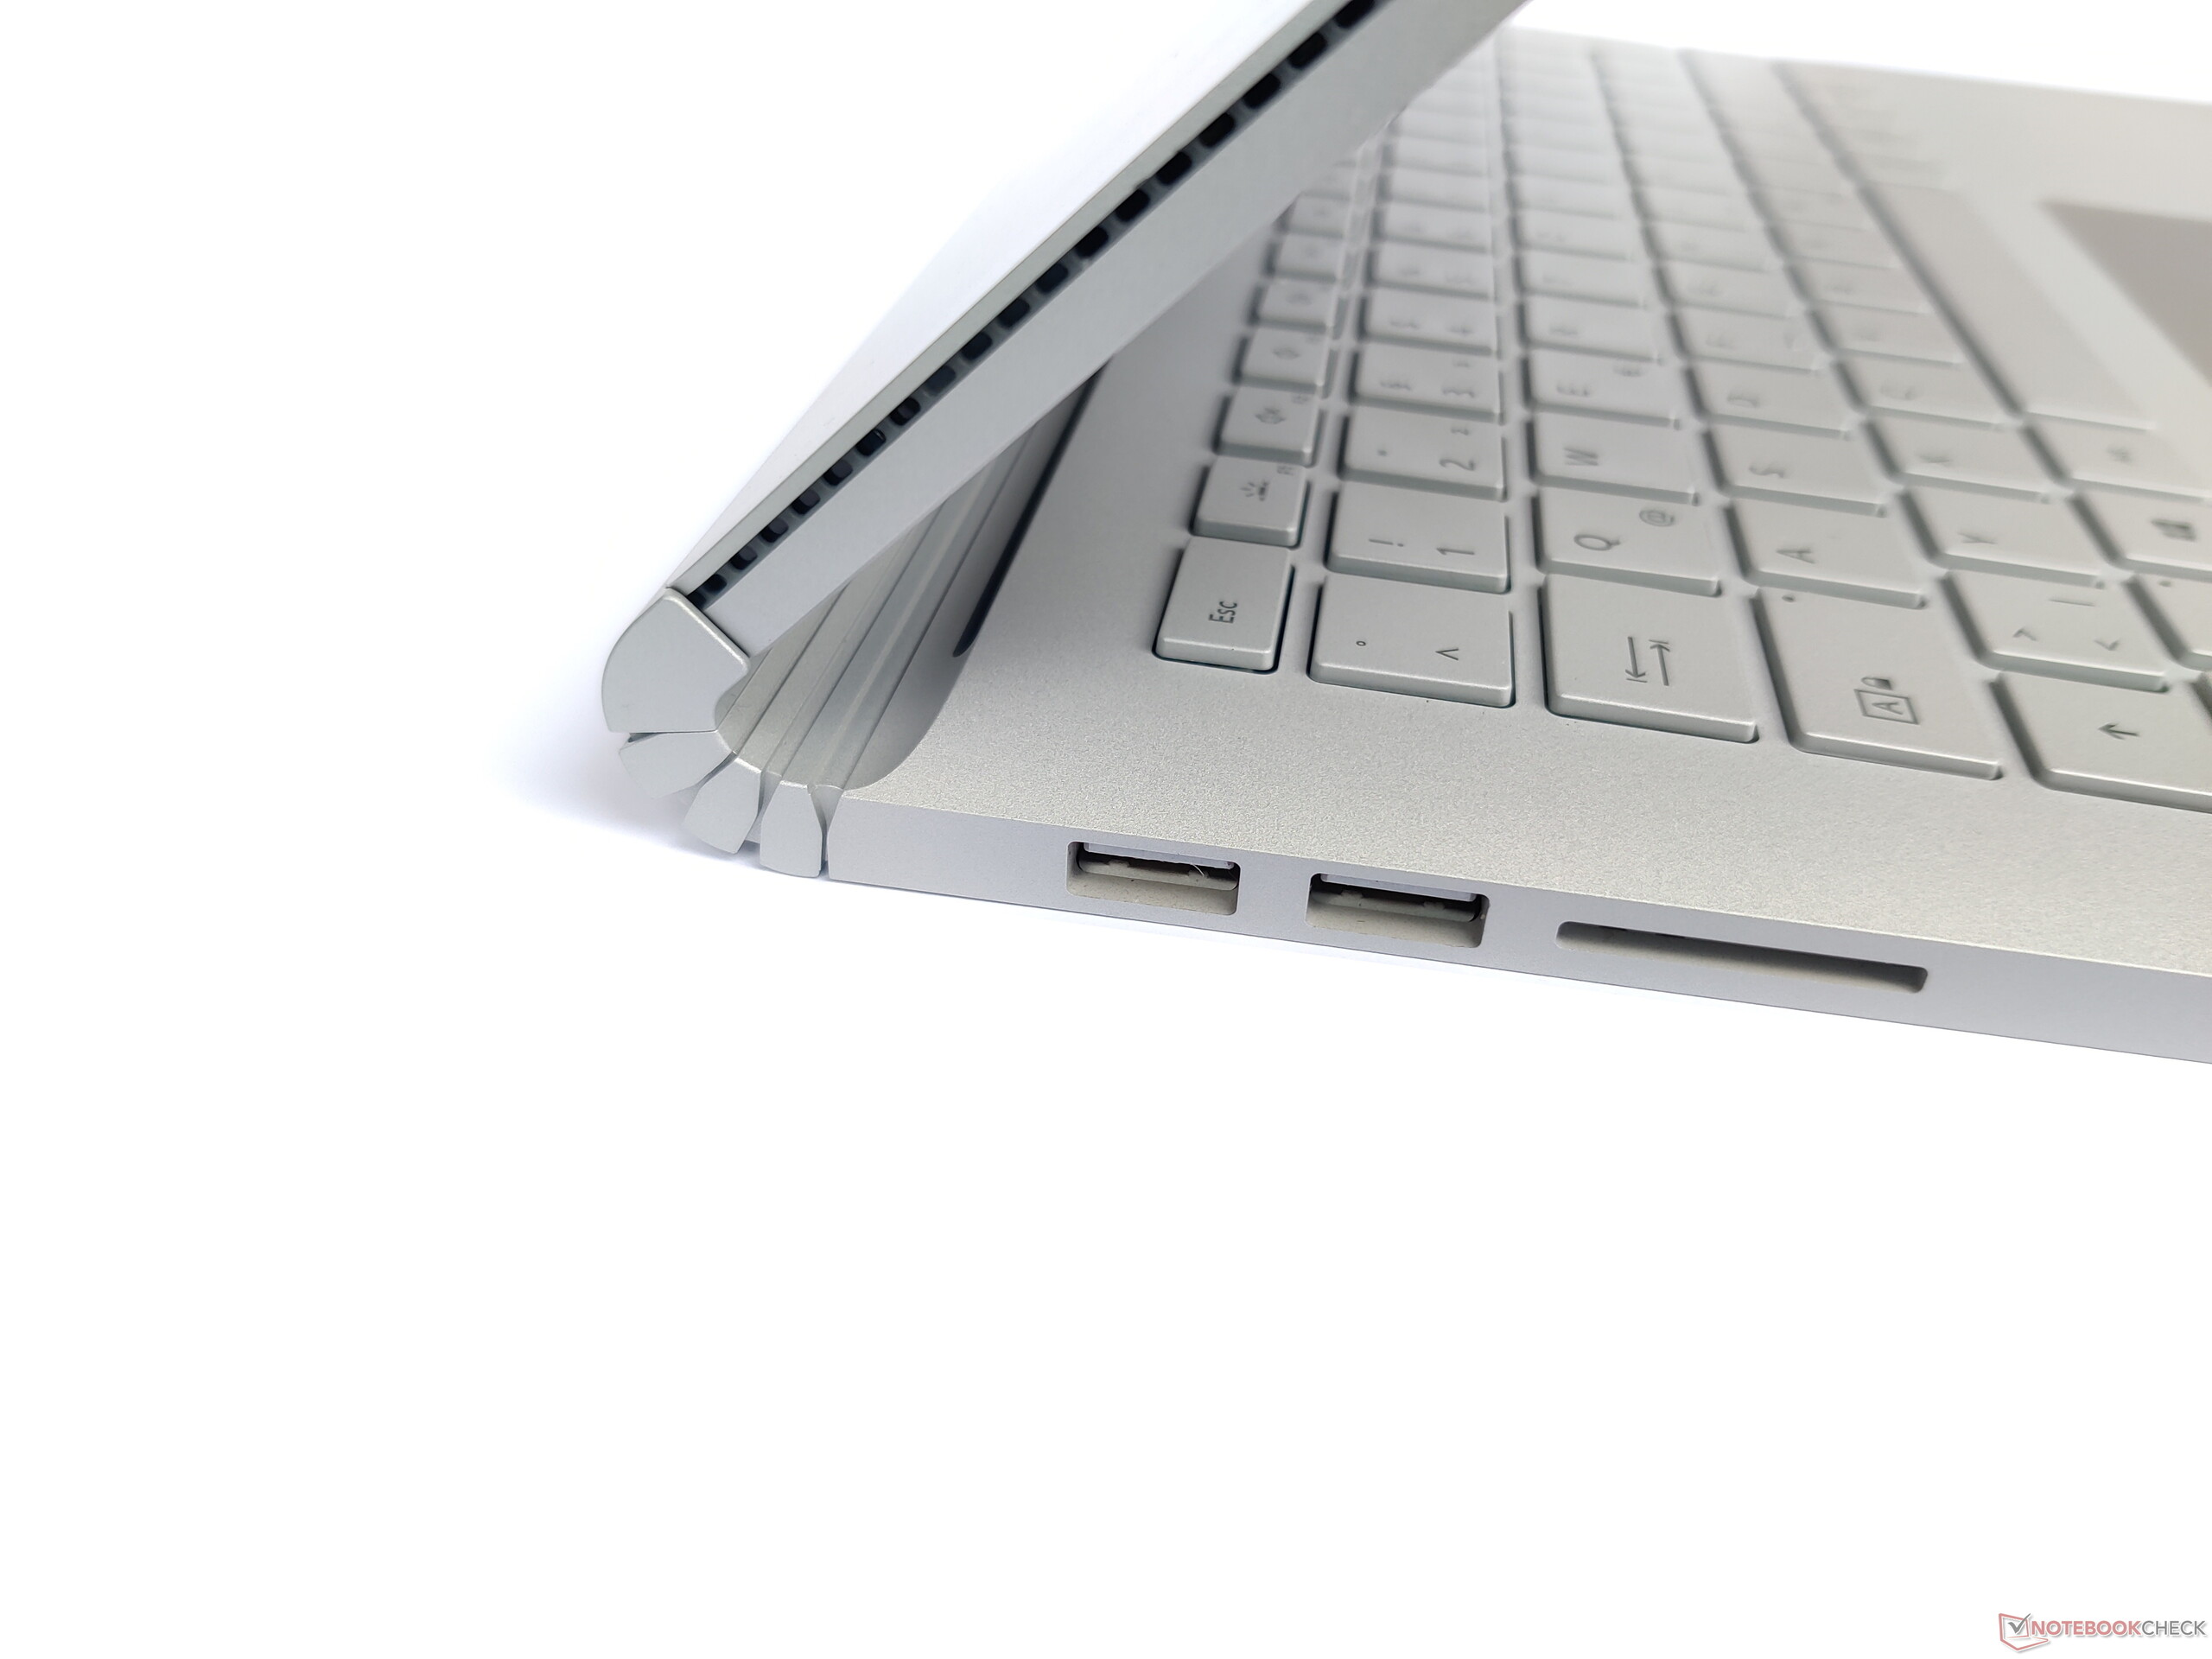
Microsoft Surface Book 3 13.5 har till stor del samma kvaliteter som den mindre omvandlingsbara modellen. Hantverket är utmärkt och gångjärnet är unikt i hur det ansluter till och håller uppe skärmen. Men det börjar ändå kännas som en vana då knappt något med Surface Book har förändrats. En uppfräschning av designen hade varit till fördel för denna Windows-enhet.
Microsoft Surface Book 3 13.5 är en högkvalitativ enhet, men prestandan används inte optimalt.
Microsoft vill uppmuntra kunder att köpa enheten med den senaste hårdvaran. Men för det första är processorn inte kraftigare än på den föregående modellen och de kraftiga prispåslagen för RAM och större SSD kommer inte direkt få plånboken att jubla av glädje. Det är därför bara värt att köpa Surface Book 3 13.5 om man verkligen gillar konceptet och kan tänka sig att betala ett högre pris för en ovanlig enhet. Har man den tidigare modellen borde man bara fundera på att byta om man är intresserad av högre grafikprestanda. I fråga om allmän systemprestanda och batteritid finns det inga fördelar.
Microsoft Surface Book 3 13.5
- 06/29/2020 v7 (old)
Mike Wobker
Price comparison
