Test: HP EliteBook 840 Aero G8 - Antagligen den tystaste Intel EVO-datorn vi sett (Sammanfattning)
Testgrupp
Gradering | Datum | Modell | Vikt | Höjd | Storlek | Upplösning | Pris |
|---|---|---|---|---|---|---|---|
| 89.8 % v7 (old) | 08/2021 | HP EliteBook 840 Aero G8 3E4Q6AA i7-1185G7, Iris Xe G7 96EUs | 1.2 kg | 17.9 mm | 14.00" | 1920x1080 | |
| 83.3 % v7 (old) | 06/2021 | HP ProBook 440 G8-2W1G4EA i7-1165G7, Iris Xe G7 96EUs | 1.4 kg | 19 mm | 14.00" | 1920x1080 | |
| 88.6 % v6 (old) | 04/2018 | HP EliteBook 840 G5-3JX66EA i5-8250U, UHD Graphics 620 | 1.5 kg | 17.9 mm | 14.00" | 1920x1080 | |
| 82.3 % v7 (old) | 09/2021 | MSI Summit E14 A11SCS i7-1185G7, GeForce GTX 1650 Ti Max-Q | 1.3 kg | 16 mm | 14.00" | 3840x2160 | |
| 83.8 % v7 (old) | 03/2021 | VAIO Z VJZ141C11L i7-11375H, Iris Xe G7 96EUs | 1 kg | 16.9 mm | 14.00" | 3840x2160 | |
| 89.4 % v7 (old) | 07/2021 | Lenovo ThinkPad T14s G2 20WM003TGE i7-1165G7, Iris Xe G7 96EUs | 1.3 kg | 16.14 mm | 14.00" | 1920x1080 |


| |||||||||||||||||||||||||
Distribution av ljusstyrkan: 84 %
Mitt på batteriet: 466.4 cd/m²
Kontrast: 1458:1 (Svärta: 0.32 cd/m²)
ΔE ColorChecker Calman: 2.84 | ∀{0.5-29.43 Ø4.71}
calibrated: 2.27
ΔE Greyscale Calman: 3.7 | ∀{0.09-98 Ø4.96}
69.3% AdobeRGB 1998 (Argyll 3D)
97.6% sRGB (Argyll 3D)
68% Display P3 (Argyll 3D)
Gamma: 2.13
CCT: 6886 K
| HP EliteBook 840 Aero G8 3E4Q6AA AU Optronics AUO068B, IPS, 14", 1920x1080 | HP ProBook 440 G8-2W1G4EA AU Optronics AUO818B, VA, 14", 1920x1080 | HP EliteBook 840 G5-3JX66EA AUO3B3D, IPS, 14", 1920x1080 | MSI Summit E14 A11SCS AU Optronics AUO123B, IPS, 14", 3840x2160 | VAIO Z VJZ141C11L BOE NE140QUM-N62, IPS, 14", 3840x2160 | Lenovo ThinkPad T14s G2 20WM003TGE NE140FHM-N61, IPS LED, 14", 1920x1080 | |
|---|---|---|---|---|---|---|
| Display | -45% | -11% | 25% | 23% | -3% | |
| Display P3 Coverage (%) | 68 | 37.02 -46% | 60.2 -11% | 87.5 29% | 95.7 41% | 68.1 0% |
| sRGB Coverage (%) | 97.6 | 55.6 -43% | 88.2 -10% | 100 2% | 99.5 2% | 91.7 -6% |
| AdobeRGB 1998 Coverage (%) | 69.3 | 38.25 -45% | 61.3 -12% | 99.4 43% | 86.4 25% | 67.1 -3% |
| Response Times | 7% | 1% | -8% | 3% | -30% | |
| Response Time Grey 50% / Grey 80% * (ms) | 48 ? | 43 ? 10% | 42.4 ? 12% | 52 ? -8% | 46.8 ? 2% | 68 ? -42% |
| Response Time Black / White * (ms) | 28.8 ? | 28 ? 3% | 31.6 ? -10% | 30.8 ? -7% | 28 ? 3% | 34 ? -18% |
| PWM Frequency (Hz) | 22730 ? | |||||
| Screen | -59% | -29% | -23% | 1% | -24% | |
| Brightness middle (cd/m²) | 466.4 | 253 -46% | 414 -11% | 593.3 27% | 368.3 -21% | 422.9 -9% |
| Brightness (cd/m²) | 426 | 230 -46% | 387 -9% | 571 34% | 361 -15% | 397 -7% |
| Brightness Distribution (%) | 84 | 82 -2% | 87 4% | 87 4% | 90 7% | 91 8% |
| Black Level * (cd/m²) | 0.32 | 0.29 9% | 0.25 22% | 0.53 -66% | 0.22 31% | 0.32 -0% |
| Contrast (:1) | 1458 | 872 -40% | 1656 14% | 1119 -23% | 1674 15% | 1322 -9% |
| Colorchecker dE 2000 * | 2.84 | 5.35 -88% | 5.5 -94% | 4.42 -56% | 3.27 -15% | 4.8 -69% |
| Colorchecker dE 2000 max. * | 4.73 | 17.08 -261% | 9.9 -109% | 7.16 -51% | 5.43 -15% | 8.7 -84% |
| Colorchecker dE 2000 calibrated * | 2.27 | 2.3 -1% | 4.3 -89% | 2.33 -3% | 1.9 16% | |
| Greyscale dE 2000 * | 3.7 | 3.75 -1% | 6.4 -73% | 3.2 14% | 2.9 22% | 6.1 -65% |
| Gamma | 2.13 103% | 2.48 89% | 2.31 95% | 2.04 108% | 2.2 100% | 2.23 99% |
| CCT | 6886 94% | 6446 101% | 7811 83% | 6737 96% | 6071 107% | 7635 85% |
| Color Space (Percent of AdobeRGB 1998) (%) | 35 | 56.9 | 76.8 | |||
| Color Space (Percent of sRGB) (%) | 55 | 88.1 | 99.5 | |||
| Totalt genomsnitt (program/inställningar) | -32% /
-46% | -13% /
-21% | -2% /
-11% | 9% /
6% | -19% /
-21% |
* ... mindre är bättre
Visa svarstider
| ↔ Svarstid svart till vitt | ||
|---|---|---|
| 28.8 ms ... stiga ↗ och falla ↘ kombinerat | ↗ 14 ms stiga | 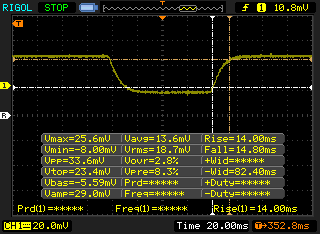 |
| ↘ 14.8 ms hösten | ||
| Skärmen visar relativt långsamma svarsfrekvenser i våra tester och kan vara för långsam för spelare. I jämförelse sträcker sig alla testade enheter från 0.1 (minst) till 240 (maximalt) ms. » 76 % av alla enheter är bättre. Detta innebär att den uppmätta svarstiden är sämre än genomsnittet av alla testade enheter (19.8 ms). | ||
| ↔ Svarstid 50 % grått till 80 % grått | ||
| 48 ms ... stiga ↗ och falla ↘ kombinerat | ↗ 23.6 ms stiga | 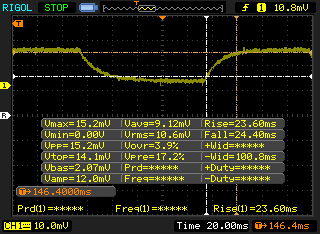 |
| ↘ 24.4 ms hösten | ||
| Skärmen visar långsamma svarsfrekvenser i våra tester och kommer att vara otillfredsställande för spelare. I jämförelse sträcker sig alla testade enheter från 0.165 (minst) till 636 (maximalt) ms. » 82 % av alla enheter är bättre. Detta innebär att den uppmätta svarstiden är sämre än genomsnittet av alla testade enheter (31 ms). | ||
Skärmflimmer / PWM (Puls-Width Modulation)
| Skärmflimmer / PWM upptäcktes inte | 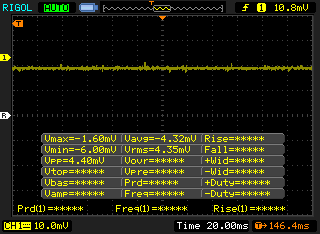 | ||
Som jämförelse: 52 % av alla testade enheter använder inte PWM för att dämpa skärmen. Om PWM upptäcktes mättes ett medelvärde av 7757 (minst: 5 - maximum: 343500) Hz. | |||
Cinebench R15 Multi Loop
Cinebench R23: Multi Core | Single Core
Cinebench R15: CPU Multi 64Bit | CPU Single 64Bit
Blender: v2.79 BMW27 CPU
7-Zip 18.03: 7z b 4 -mmt1 | 7z b 4
Geekbench 5.5: Single-Core | Multi-Core
HWBOT x265 Benchmark v2.2: 4k Preset
LibreOffice : 20 Documents To PDF
R Benchmark 2.5: Overall mean
| Cinebench R20 / CPU (Multi Core) | |
| Lenovo IdeaPad Flex 5 14ALC05 82HU002YUS | |
| HP ProBook x360 435 G8 R7-5800U | |
| Lenovo Yoga Slim 7 14ARE05 82A20008GE | |
| Lenovo ThinkPad E14 G3-20Y7003SGE | |
| MSI Prestige 15 A10SC | |
| ADATA XPG Xenia 14 | |
| Lenovo ThinkBook 14 G2 ITL 20VD008WGE | |
| Genomsnitt Intel Core i7-1185G7 (1425 - 2493, n=28) | |
| HP EliteBook 840 Aero G8 3E4Q6AA | |
| Infinix INBook X1 Pro | |
| Lenovo ThinkPad P14s Gen1 20S40009GE | |
| Acer Spin 3 SP314-54N-56S5 | |
| Asus ZenBook 14 UX434FL-DB77 | |
| Cinebench R20 / CPU (Single Core) | |
| ADATA XPG Xenia 14 | |
| Genomsnitt Intel Core i7-1185G7 (489 - 593, n=28) | |
| HP ProBook x360 435 G8 R7-5800U | |
| Lenovo ThinkBook 14 G2 ITL 20VD008WGE | |
| HP EliteBook 840 Aero G8 3E4Q6AA | |
| Lenovo IdeaPad Flex 5 14ALC05 82HU002YUS | |
| Lenovo Yoga Slim 7 14ARE05 82A20008GE | |
| Lenovo ThinkPad P14s Gen1 20S40009GE | |
| Infinix INBook X1 Pro | |
| MSI Prestige 15 A10SC | |
| Lenovo ThinkPad E14 G3-20Y7003SGE | |
| Asus ZenBook 14 UX434FL-DB77 | |
| Acer Spin 3 SP314-54N-56S5 | |
| Cinebench R23 / Multi Core | |
| Lenovo IdeaPad Flex 5 14ALC05 82HU002YUS | |
| HP ProBook x360 435 G8 R7-5800U | |
| Lenovo Yoga Slim 7 14ARE05 82A20008GE | |
| Lenovo ThinkPad E14 G3-20Y7003SGE | |
| ADATA XPG Xenia 14 | |
| Lenovo ThinkBook 14 G2 ITL 20VD008WGE | |
| Genomsnitt Intel Core i7-1185G7 (3610 - 6383, n=24) | |
| HP EliteBook 840 Aero G8 3E4Q6AA | |
| Infinix INBook X1 Pro | |
| Lenovo ThinkPad P14s Gen1 20S40009GE | |
| Acer Spin 3 SP314-54N-56S5 | |
| Cinebench R23 / Single Core | |
| ADATA XPG Xenia 14 | |
| HP EliteBook 840 Aero G8 3E4Q6AA | |
| Genomsnitt Intel Core i7-1185G7 (1251 - 1532, n=24) | |
| HP ProBook x360 435 G8 R7-5800U | |
| Lenovo ThinkBook 14 G2 ITL 20VD008WGE | |
| Lenovo IdeaPad Flex 5 14ALC05 82HU002YUS | |
| Lenovo Yoga Slim 7 14ARE05 82A20008GE | |
| Infinix INBook X1 Pro | |
| Lenovo ThinkPad P14s Gen1 20S40009GE | |
| Lenovo ThinkPad E14 G3-20Y7003SGE | |
| Acer Spin 3 SP314-54N-56S5 | |
| Cinebench R15 / CPU Multi 64Bit | |
| HP ProBook x360 435 G8 R7-5800U | |
| Lenovo IdeaPad Flex 5 14ALC05 82HU002YUS | |
| Lenovo ThinkPad E14 G3-20Y7003SGE | |
| Lenovo Yoga Slim 7 14ARE05 82A20008GE | |
| MSI Prestige 15 A10SC | |
| ADATA XPG Xenia 14 | |
| Lenovo ThinkBook 14 G2 ITL 20VD008WGE | |
| Genomsnitt Intel Core i7-1185G7 (617 - 1066, n=32) | |
| HP EliteBook 840 Aero G8 3E4Q6AA | |
| Lenovo ThinkPad P14s Gen1 20S40009GE | |
| Asus ZenBook 14 UX434FL-DB77 | |
| Infinix INBook X1 Pro | |
| Acer Spin 3 SP314-54N-56S5 | |
| Cinebench R15 / CPU Single 64Bit | |
| HP ProBook x360 435 G8 R7-5800U | |
| ADATA XPG Xenia 14 | |
| Genomsnitt Intel Core i7-1185G7 (168 - 230, n=27) | |
| HP EliteBook 840 Aero G8 3E4Q6AA | |
| Lenovo ThinkBook 14 G2 ITL 20VD008WGE | |
| MSI Prestige 15 A10SC | |
| Lenovo IdeaPad Flex 5 14ALC05 82HU002YUS | |
| Lenovo ThinkPad P14s Gen1 20S40009GE | |
| Infinix INBook X1 Pro | |
| Asus ZenBook 14 UX434FL-DB77 | |
| Lenovo Yoga Slim 7 14ARE05 82A20008GE | |
| Lenovo ThinkPad E14 G3-20Y7003SGE | |
| Acer Spin 3 SP314-54N-56S5 | |
| Blender / v2.79 BMW27 CPU | |
| Acer Spin 3 SP314-54N-56S5 | |
| Asus ZenBook 14 UX434FL-DB77 | |
| Infinix INBook X1 Pro | |
| Lenovo ThinkPad P14s Gen1 20S40009GE | |
| HP EliteBook 840 Aero G8 3E4Q6AA | |
| Genomsnitt Intel Core i7-1185G7 (478 - 745, n=28) | |
| Lenovo ThinkBook 14 G2 ITL 20VD008WGE | |
| ADATA XPG Xenia 14 | |
| Lenovo Yoga Slim 7 14ARE05 82A20008GE | |
| Lenovo ThinkPad E14 G3-20Y7003SGE | |
| Lenovo IdeaPad Flex 5 14ALC05 82HU002YUS | |
| HP ProBook x360 435 G8 R7-5800U | |
| 7-Zip 18.03 / 7z b 4 -mmt1 | |
| ADATA XPG Xenia 14 | |
| HP ProBook x360 435 G8 R7-5800U | |
| HP EliteBook 840 Aero G8 3E4Q6AA | |
| Genomsnitt Intel Core i7-1185G7 (3678 - 5507, n=27) | |
| Lenovo ThinkBook 14 G2 ITL 20VD008WGE | |
| Lenovo ThinkPad P14s Gen1 20S40009GE | |
| Lenovo IdeaPad Flex 5 14ALC05 82HU002YUS | |
| Infinix INBook X1 Pro | |
| Lenovo Yoga Slim 7 14ARE05 82A20008GE | |
| Lenovo ThinkPad E14 G3-20Y7003SGE | |
| Acer Spin 3 SP314-54N-56S5 | |
| Asus ZenBook 14 UX434FL-DB77 | |
| 7-Zip 18.03 / 7z b 4 | |
| HP ProBook x360 435 G8 R7-5800U | |
| Lenovo IdeaPad Flex 5 14ALC05 82HU002YUS | |
| Lenovo ThinkPad E14 G3-20Y7003SGE | |
| Lenovo Yoga Slim 7 14ARE05 82A20008GE | |
| ADATA XPG Xenia 14 | |
| Lenovo ThinkBook 14 G2 ITL 20VD008WGE | |
| Genomsnitt Intel Core i7-1185G7 (18812 - 27693, n=27) | |
| HP EliteBook 840 Aero G8 3E4Q6AA | |
| Infinix INBook X1 Pro | |
| Lenovo ThinkPad P14s Gen1 20S40009GE | |
| Acer Spin 3 SP314-54N-56S5 | |
| Asus ZenBook 14 UX434FL-DB77 | |
| Geekbench 5.5 / Single-Core | |
| Genomsnitt Intel Core i7-1185G7 (1398 - 1626, n=21) | |
| Lenovo ThinkBook 14 G2 ITL 20VD008WGE | |
| HP ProBook x360 435 G8 R7-5800U | |
| Acer Spin 3 SP314-54N-56S5 | |
| Lenovo ThinkPad P14s Gen1 20S40009GE | |
| Lenovo IdeaPad Flex 5 14ALC05 82HU002YUS | |
| Asus ZenBook 14 UX434FL-DB77 | |
| Lenovo Yoga Slim 7 14ARE05 82A20008GE | |
| Lenovo ThinkPad E14 G3-20Y7003SGE | |
| Geekbench 5.5 / Multi-Core | |
| Lenovo IdeaPad Flex 5 14ALC05 82HU002YUS | |
| Lenovo Yoga Slim 7 14ARE05 82A20008GE | |
| HP ProBook x360 435 G8 R7-5800U | |
| Genomsnitt Intel Core i7-1185G7 (4620 - 5944, n=21) | |
| Lenovo ThinkPad E14 G3-20Y7003SGE | |
| Lenovo ThinkBook 14 G2 ITL 20VD008WGE | |
| Acer Spin 3 SP314-54N-56S5 | |
| Lenovo ThinkPad P14s Gen1 20S40009GE | |
| Asus ZenBook 14 UX434FL-DB77 | |
| HWBOT x265 Benchmark v2.2 / 4k Preset | |
| HP ProBook x360 435 G8 R7-5800U | |
| Lenovo IdeaPad Flex 5 14ALC05 82HU002YUS | |
| Lenovo Yoga Slim 7 14ARE05 82A20008GE | |
| Lenovo ThinkPad E14 G3-20Y7003SGE | |
| ADATA XPG Xenia 14 | |
| Lenovo ThinkBook 14 G2 ITL 20VD008WGE | |
| Genomsnitt Intel Core i7-1185G7 (5.02 - 8.13, n=27) | |
| HP EliteBook 840 Aero G8 3E4Q6AA | |
| Infinix INBook X1 Pro | |
| Lenovo ThinkPad P14s Gen1 20S40009GE | |
| Asus ZenBook 14 UX434FL-DB77 | |
| Acer Spin 3 SP314-54N-56S5 | |
| LibreOffice / 20 Documents To PDF | |
| Asus ZenBook 14 UX434FL-DB77 | |
| Lenovo Yoga Slim 7 14ARE05 82A20008GE | |
| Lenovo ThinkPad E14 G3-20Y7003SGE | |
| HP ProBook x360 435 G8 R7-5800U | |
| Lenovo IdeaPad Flex 5 14ALC05 82HU002YUS | |
| Acer Spin 3 SP314-54N-56S5 | |
| Infinix INBook X1 Pro | |
| Lenovo ThinkPad P14s Gen1 20S40009GE | |
| HP EliteBook 840 Aero G8 3E4Q6AA | |
| Lenovo ThinkBook 14 G2 ITL 20VD008WGE | |
| Genomsnitt Intel Core i7-1185G7 (41.3 - 61.7, n=26) | |
| ADATA XPG Xenia 14 | |
| R Benchmark 2.5 / Overall mean | |
| Asus ZenBook 14 UX434FL-DB77 | |
| Acer Spin 3 SP314-54N-56S5 | |
| Infinix INBook X1 Pro | |
| Lenovo ThinkPad P14s Gen1 20S40009GE | |
| Lenovo ThinkBook 14 G2 ITL 20VD008WGE | |
| Lenovo ThinkPad E14 G3-20Y7003SGE | |
| Lenovo Yoga Slim 7 14ARE05 82A20008GE | |
| Lenovo IdeaPad Flex 5 14ALC05 82HU002YUS | |
| Genomsnitt Intel Core i7-1185G7 (0.55 - 0.615, n=27) | |
| HP EliteBook 840 Aero G8 3E4Q6AA | |
| ADATA XPG Xenia 14 | |
| HP ProBook x360 435 G8 R7-5800U | |
Cinebench R23: Multi Core | Single Core
Cinebench R15: CPU Multi 64Bit | CPU Single 64Bit
Blender: v2.79 BMW27 CPU
7-Zip 18.03: 7z b 4 -mmt1 | 7z b 4
Geekbench 5.5: Single-Core | Multi-Core
HWBOT x265 Benchmark v2.2: 4k Preset
LibreOffice : 20 Documents To PDF
R Benchmark 2.5: Overall mean
* ... mindre är bättre
| PCMark 10 / Score | |
| MSI Summit E14 A11SCS | |
| VAIO Z VJZ141C11L | |
| Lenovo ThinkPad T14s G2 20WM003TGE | |
| Genomsnitt Intel Core i7-1185G7, Intel Iris Xe Graphics G7 96EUs (4746 - 5561, n=20) | |
| HP EliteBook 840 Aero G8 3E4Q6AA | |
| HP ProBook 440 G8-2W1G4EA | |
| HP EliteBook 840 G5-3JX66EA | |
| PCMark 10 / Essentials | |
| VAIO Z VJZ141C11L | |
| Lenovo ThinkPad T14s G2 20WM003TGE | |
| Genomsnitt Intel Core i7-1185G7, Intel Iris Xe Graphics G7 96EUs (8279 - 10664, n=20) | |
| HP EliteBook 840 Aero G8 3E4Q6AA | |
| MSI Summit E14 A11SCS | |
| HP ProBook 440 G8-2W1G4EA | |
| HP EliteBook 840 G5-3JX66EA | |
| PCMark 10 / Productivity | |
| MSI Summit E14 A11SCS | |
| Lenovo ThinkPad T14s G2 20WM003TGE | |
| VAIO Z VJZ141C11L | |
| Genomsnitt Intel Core i7-1185G7, Intel Iris Xe Graphics G7 96EUs (5799 - 8770, n=20) | |
| HP EliteBook 840 Aero G8 3E4Q6AA | |
| HP ProBook 440 G8-2W1G4EA | |
| HP EliteBook 840 G5-3JX66EA | |
| PCMark 10 / Digital Content Creation | |
| MSI Summit E14 A11SCS | |
| VAIO Z VJZ141C11L | |
| Lenovo ThinkPad T14s G2 20WM003TGE | |
| Genomsnitt Intel Core i7-1185G7, Intel Iris Xe Graphics G7 96EUs (4424 - 5684, n=20) | |
| HP EliteBook 840 Aero G8 3E4Q6AA | |
| HP ProBook 440 G8-2W1G4EA | |
| HP EliteBook 840 G5-3JX66EA | |
| PCMark 10 Score | 4879 poäng | |
Hjälp | ||
| DPC Latencies / LatencyMon - interrupt to process latency (max), Web, Youtube, Prime95 | |
| HP ProBook 440 G8-2W1G4EA | |
| HP EliteBook 840 Aero G8 3E4Q6AA | |
| Lenovo ThinkPad T14s G2 20WM003TGE | |
| MSI Summit E14 A11SCS | |
| VAIO Z VJZ141C11L | |
* ... mindre är bättre
| HP EliteBook 840 Aero G8 3E4Q6AA SK Hynix PC711 512GB HFS512GDE9X073N | HP ProBook 440 G8-2W1G4EA Lite-On CL1-8D512 | HP EliteBook 840 G5-3JX66EA Toshiba XG5 KXG50ZNV256G | MSI Summit E14 A11SCS Phison 1TB SM2801T24GKBB4S-E162 | VAIO Z VJZ141C11L Samsung PM9A1 MZVL2512HCJQ | Lenovo ThinkPad T14s G2 20WM003TGE Samsung PM981a MZVLB1T0HBLR | |
|---|---|---|---|---|---|---|
| AS SSD | -74% | -98% | 92% | 112% | 10% | |
| Seq Read (MB/s) | 2857 | 1681 -41% | 1611 -44% | 3845 35% | 5533 94% | 2825 -1% |
| Seq Write (MB/s) | 1569 | 210.1 -87% | 339 -78% | 2283 46% | 3289 110% | 1288 -18% |
| 4K Read (MB/s) | 58.5 | 24.86 -58% | 29.01 -50% | 54.3 -7% | 72.5 24% | 61.2 5% |
| 4K Write (MB/s) | 131 | 73.6 -44% | 93.6 -29% | 78.5 -40% | 213.7 63% | 190.6 45% |
| 4K-64 Read (MB/s) | 1074 | 291.5 -73% | 413.3 -62% | 1341 25% | 2128 98% | 1147 7% |
| 4K-64 Write (MB/s) | 1554 | 135.2 -91% | 248.3 -84% | 2143 38% | 2032 31% | 1827 18% |
| Access Time Read * (ms) | 0.036 | 0.078 -117% | 0.321 -792% | 0.049 -36% | 0.039 -8% | 0.055 -53% |
| Access Time Write * (ms) | 0.086 | 0.152 -77% | 0.053 38% | 0.041 52% | 0.06 30% | 0.019 78% |
| Score Read (Points) | 1418 | 484 -66% | 603 -57% | 1780 26% | 2754 94% | 1491 5% |
| Score Write (Points) | 1841 | 230 -88% | 376 -80% | 2450 33% | 2574 40% | 2146 17% |
| Score Total (Points) | 3934 | 895 -77% | 1232 -69% | 5069 29% | 6629 69% | 4336 10% |
| Copy ISO MB/s (MB/s) | 822 | 319.2 -61% | 2035 148% | 2235 172% | ||
| Copy Program MB/s (MB/s) | 144.7 | 168.2 16% | 956 561% | 796 450% | ||
| Copy Game MB/s (MB/s) | 409.7 | 309.3 -25% | 1951 376% | 1652 303% | ||
| CrystalDiskMark 5.2 / 6 | -46% | -44% | 43% | 65% | 5% | |
| Write 4K (MB/s) | 143.3 | 122.4 -15% | 92.8 -35% | 314.4 119% | 236.7 65% | 149.7 4% |
| Read 4K (MB/s) | 58.1 | 24.99 -57% | 30.67 -47% | 55.9 -4% | 78.6 35% | 64.5 11% |
| Write Seq (MB/s) | 2003 | 653 -67% | 353.2 -82% | 2402 20% | 3689 84% | 1933 -3% |
| Read Seq (MB/s) | 2062 | 1686 -18% | 1937 -6% | 2408 17% | 4340 110% | 2512 22% |
| Write 4K Q32T1 (MB/s) | 455.7 | 298.9 -34% | 358 -21% | 840 84% | 646 42% | 514 13% |
| Read 4K Q32T1 (MB/s) | 481.6 | 266.2 -45% | 253.1 -47% | 925 92% | 717 49% | 475.9 -1% |
| Write Seq Q32T1 (MB/s) | 3175 | 460.9 -85% | 359.6 -89% | 2405 -24% | 4396 38% | 2968 -7% |
| Read Seq Q32T1 (MB/s) | 3518 | 1998 -43% | 2613 -26% | 4927 40% | 6804 93% | 3542 1% |
| Totalt genomsnitt (program/inställningar) | -60% /
-62% | -71% /
-79% | 68% /
74% | 89% /
95% | 8% /
8% |
* ... mindre är bättre

DiskSpd Read Loop, Queue Depth 8
| 3DMark 11 Performance | 6691 poäng | |
| 3DMark Cloud Gate Standard Score | 16705 poäng | |
| 3DMark Fire Strike Score | 4442 poäng | |
| 3DMark Time Spy Score | 1642 poäng | |
Hjälp | ||
Witcher 3 FPS-tabell
| låg | med. | hög | ultra | |
|---|---|---|---|---|
| GTA V (2015) | 76.1 | 61.9 | 22.1 | 8.49 |
| The Witcher 3 (2015) | 85.6 | 52.7 | 27.7 | 13.6 |
| Dota 2 Reborn (2015) | 82.1 | 65 | 46 | 44 |
| Final Fantasy XV Benchmark (2018) | 37.1 | 20.9 | 15.3 | |
| X-Plane 11.11 (2018) | 23.4 | 33.6 | 29.2 | |
| Strange Brigade (2018) | 83.3 | 33.9 | 28.3 | 23.1 |
| HP EliteBook 840 Aero G8 3E4Q6AA Iris Xe G7 96EUs, i7-1185G7, SK Hynix PC711 512GB HFS512GDE9X073N | HP ProBook 440 G8-2W1G4EA Iris Xe G7 96EUs, i7-1165G7, Lite-On CL1-8D512 | HP EliteBook 840 G5-3JX66EA UHD Graphics 620, i5-8250U, Toshiba XG5 KXG50ZNV256G | MSI Summit E14 A11SCS GeForce GTX 1650 Ti Max-Q, i7-1185G7, Phison 1TB SM2801T24GKBB4S-E162 | VAIO Z VJZ141C11L Iris Xe G7 96EUs, i7-11375H, Samsung PM9A1 MZVL2512HCJQ | Lenovo ThinkPad T14s G2 20WM003TGE Iris Xe G7 96EUs, i7-1165G7, Samsung PM981a MZVLB1T0HBLR | |
|---|---|---|---|---|---|---|
| Noise | -13% | -24% | -32% | -32% | -10% | |
| av / miljö * (dB) | 24.1 | 26 -8% | 28.8 -20% | 23.9 1% | 26.1 -8% | 24.81 -3% |
| Idle Minimum * (dB) | 24.2 | 26 -7% | 28.8 -19% | 24.2 -0% | 26.1 -8% | 24.81 -3% |
| Idle Average * (dB) | 24.2 | 26 -7% | 28.8 -19% | 24.2 -0% | 26.1 -8% | 24.81 -3% |
| Idle Maximum * (dB) | 24.2 | 26 -7% | 33.1 -37% | 24.2 -0% | 29.9 -24% | 24.81 -3% |
| Load Average * (dB) | 26.9 | 36.2 -35% | 35.2 -31% | 50.2 -87% | 36.3 -35% | 35.14 -31% |
| Witcher 3 ultra * (dB) | 27.9 | 47 -68% | 43.7 -57% | |||
| Load Maximum * (dB) | 29.9 | 34.6 -16% | 35.2 -18% | 51.7 -73% | 55.4 -85% | 35.14 -18% |
* ... mindre är bättre
Ljudnivå
| Låg belastning |
| 24.2 / 24.2 / 24.2 dB(A) |
| Hög belastning |
| 26.9 / 29.9 dB(A) |
 | ||
30 dB tyst 40 dB(A) hörbar 50 dB(A) högt ljud |
||
min: | ||
(+) Den maximala temperaturen på ovansidan är 39.2 °C / 103 F, jämfört med genomsnittet av 34.3 °C / 94 F , allt från 21.2 till 62.5 °C för klassen Office.
(-) Botten värms upp till maximalt 51.2 °C / 124 F, jämfört med genomsnittet av 36.8 °C / 98 F
(+) Vid tomgångsbruk är medeltemperaturen för ovansidan 29.8 °C / 86 F, jämfört med enhetsgenomsnittet på 29.5 °C / ### class_avg_f### F.
(+) Handledsstöden och pekplattan är kallare än hudtemperaturen med maximalt 29.2 °C / 84.6 F och är därför svala att ta på.
(±) Medeltemperaturen för handledsstödsområdet på liknande enheter var 27.5 °C / 81.5 F (-1.7 °C / -3.1 F).
HP EliteBook 840 Aero G8 3E4Q6AA ljudanalys
(±) | högtalarljudstyrkan är genomsnittlig men bra (78.6 dB)
Bas 100 - 315 Hz
(±) | reducerad bas - i genomsnitt 11% lägre än medianen
(±) | linjäriteten för basen är genomsnittlig (10.6% delta till föregående frekvens)
Mellan 400 - 2000 Hz
(+) | balanserad mellan - endast 4.3% från medianen
(+) | mids är linjära (3% delta till föregående frekvens)
Högsta 2 - 16 kHz
(+) | balanserade toppar - endast 2.5% från medianen
(+) | toppar är linjära (4.3% delta till föregående frekvens)
Totalt 100 - 16 000 Hz
(+) | det totala ljudet är linjärt (12.6% skillnad mot median)
Jämfört med samma klass
» 6% av alla testade enheter i den här klassen var bättre, 2% liknande, 93% sämre
» Den bästa hade ett delta på 7%, genomsnittet var 21%, sämst var 53%
Jämfört med alla testade enheter
» 11% av alla testade enheter var bättre, 3% liknande, 86% sämre
» Den bästa hade ett delta på 4%, genomsnittet var 23%, sämst var 134%
Apple MacBook 12 (Early 2016) 1.1 GHz ljudanalys
(+) | högtalare kan spela relativt högt (83.6 dB)
Bas 100 - 315 Hz
(±) | reducerad bas - i genomsnitt 11.3% lägre än medianen
(±) | linjäriteten för basen är genomsnittlig (14.2% delta till föregående frekvens)
Mellan 400 - 2000 Hz
(+) | balanserad mellan - endast 2.4% från medianen
(+) | mids är linjära (5.5% delta till föregående frekvens)
Högsta 2 - 16 kHz
(+) | balanserade toppar - endast 2% från medianen
(+) | toppar är linjära (4.5% delta till föregående frekvens)
Totalt 100 - 16 000 Hz
(+) | det totala ljudet är linjärt (10.2% skillnad mot median)
Jämfört med samma klass
» 7% av alla testade enheter i den här klassen var bättre, 2% liknande, 90% sämre
» Den bästa hade ett delta på 5%, genomsnittet var 18%, sämst var 53%
Jämfört med alla testade enheter
» 5% av alla testade enheter var bättre, 1% liknande, 94% sämre
» Den bästa hade ett delta på 4%, genomsnittet var 23%, sämst var 134%
| Av/Standby | |
| Låg belastning | |
| Hög belastning |
|
Förklaring:
min: | |
| HP EliteBook 840 Aero G8 3E4Q6AA i7-1185G7, Iris Xe G7 96EUs, SK Hynix PC711 512GB HFS512GDE9X073N, IPS, 1920x1080, 14" | HP ProBook 440 G8-2W1G4EA i7-1165G7, Iris Xe G7 96EUs, Lite-On CL1-8D512, VA, 1920x1080, 14" | HP EliteBook 840 G5-3JX66EA i5-8250U, UHD Graphics 620, Toshiba XG5 KXG50ZNV256G, IPS, 1920x1080, 14" | MSI Summit E14 A11SCS i7-1185G7, GeForce GTX 1650 Ti Max-Q, Phison 1TB SM2801T24GKBB4S-E162, IPS, 3840x2160, 14" | VAIO Z VJZ141C11L i7-11375H, Iris Xe G7 96EUs, Samsung PM9A1 MZVL2512HCJQ, IPS, 3840x2160, 14" | Lenovo ThinkPad T14s G2 20WM003TGE i7-1165G7, Iris Xe G7 96EUs, Samsung PM981a MZVLB1T0HBLR, IPS LED, 1920x1080, 14" | |
|---|---|---|---|---|---|---|
| Power Consumption | 2% | -10% | -151% | -87% | 7% | |
| Idle Minimum * (Watt) | 3.2 | 4 -25% | 3.2 -0% | 9.9 -209% | 9.5 -197% | 2.2 31% |
| Idle Average * (Watt) | 5.4 | 6.2 -15% | 6.6 -22% | 17.4 -222% | 13.7 -154% | 5.5 -2% |
| Idle Maximum * (Watt) | 6.9 | 7.5 -9% | 9.5 -38% | 22.5 -226% | 14.4 -109% | 6.1 12% |
| Load Average * (Watt) | 38.9 | 34.7 11% | 36.2 7% | 85.6 -120% | 54.3 -40% | 41.3 -6% |
| Witcher 3 ultra * (Watt) | 37 | 70.9 -92% | 46.1 -25% | 34.5 7% | ||
| Load Maximum * (Watt) | 66.5 | 34 49% | 65.6 1% | 91.1 -37% | 65.5 2% | 67.3 -1% |
* ... mindre är bättre
Energiförbrukning - Witcher 3 / Stress-test
| HP EliteBook 840 Aero G8 3E4Q6AA i7-1185G7, Iris Xe G7 96EUs, 53 Wh | HP ProBook 440 G8-2W1G4EA i7-1165G7, Iris Xe G7 96EUs, 45 Wh | HP EliteBook 840 G5-3JX66EA i5-8250U, UHD Graphics 620, 50 Wh | MSI Summit E14 A11SCS i7-1185G7, GeForce GTX 1650 Ti Max-Q, 52 Wh | VAIO Z VJZ141C11L i7-11375H, Iris Xe G7 96EUs, 53 Wh | Lenovo ThinkPad T14s G2 20WM003TGE i7-1165G7, Iris Xe G7 96EUs, 57 Wh | |
|---|---|---|---|---|---|---|
| Batteridrifttid | 3% | -18% | -65% | -38% | -30% | |
| Reader / Idle (h) | 24.8 | 19 -23% | 6.6 -73% | |||
| WiFi v1.3 (h) | 11.4 | 7.5 -34% | 7.5 -34% | 4.5 -61% | 7.1 -38% | 9.7 -15% |
| Load (h) | 2.5 | 3.5 40% | 2.6 4% | 1 -60% | 1.4 -44% |
För
Emot
Omdöme – Längtar efter den där uppgraderingen till 16:10
Läs den fullständiga versionen av den här recensionen på engelska här.
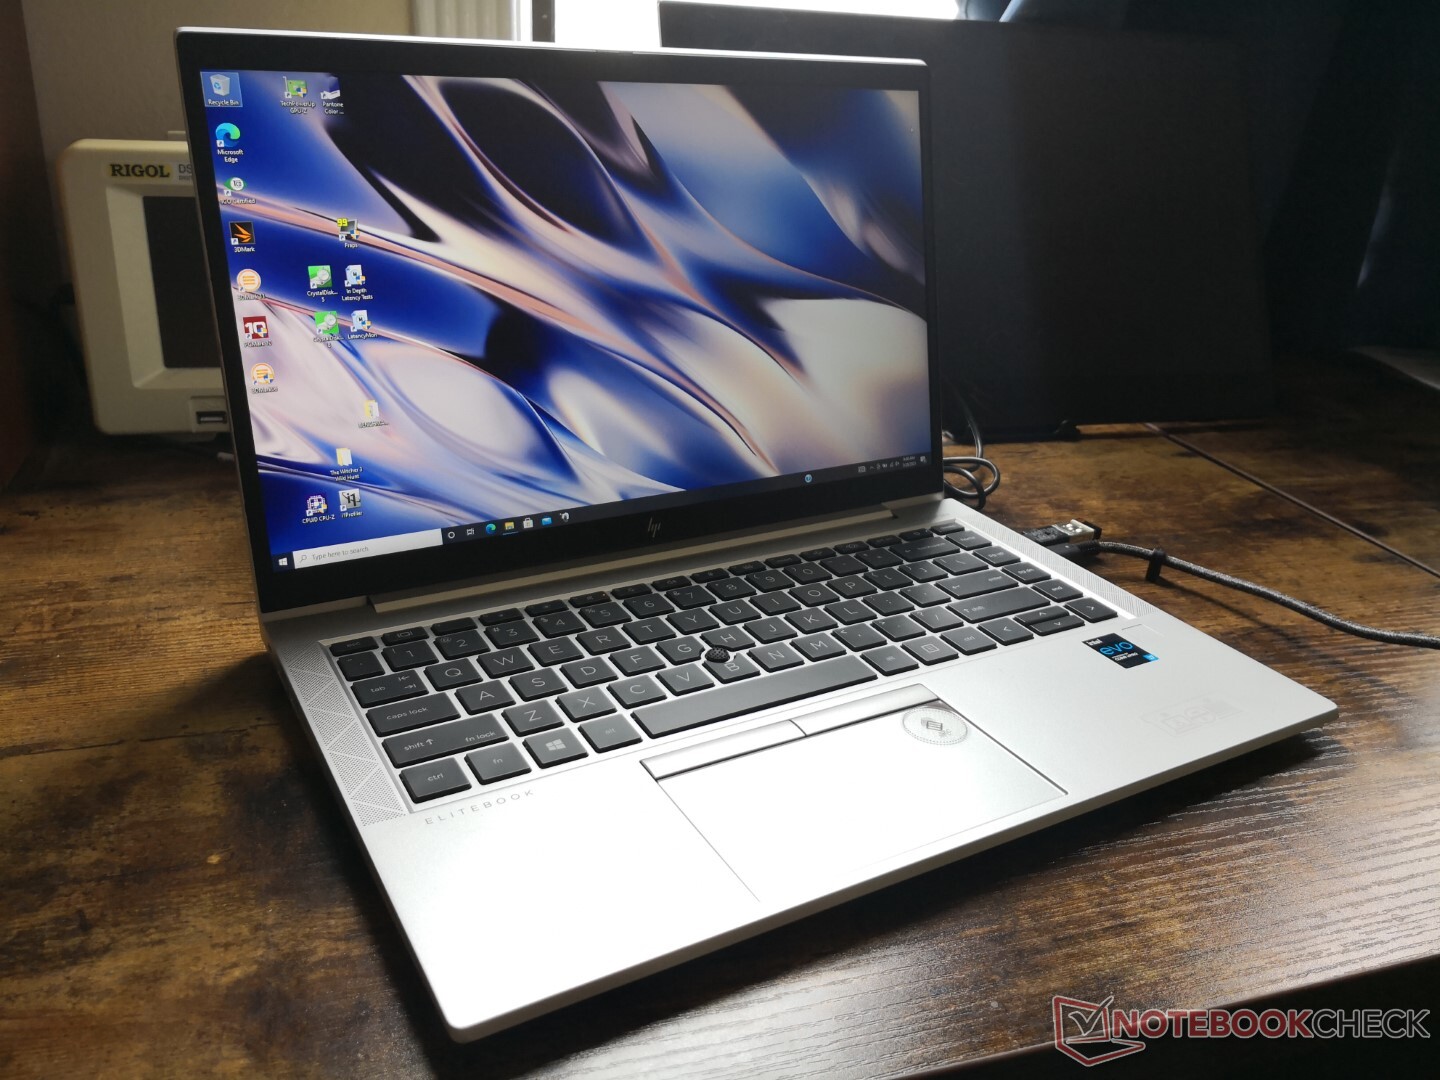
HP har verkligen lyckats bra med EliteBook 840 G8. Den är fullmatad med funktioner inklusive NFC, 5G, Thunderbolt 4, Smart Card samt en skärm på 1000 nits som finns som tillval, något varken Dell eller Lenovo kan erbjuda på någon av sina aktuella kontorslaptops. Utmärkt tangentbord och klickplatta, lätt att uppgradera, lång batteritid och en förvånansvärt tyst fläkt gör detta till en av de bästa EliteBook-modellerna du kan köpa. Alternativ som Vaio Z eller ThinkPad T14s G2 låter betydligt mer vid hög belastning.
Det bästa alternativet om du letar efter den tystaste EVO-datorn med Tiger Lake U. Vill du ha bästa möjliga prestanda från Tiger Lake U får du däremot leta någon annanstans.
Den tysta fläkten kommer på bekostnad av processorns prestanda. Förmågan att upprätthålla Turbo Boost blir lidande, så den generella processorprestandan hamnar runt 15 till 20 procent lägre än på en genomsnittlig laptop utrustad med samma Core i7-1185G7 CPU. Vi hade föredragit en mjukvaru- eller BIOS-inställning för att öka fläktens maxtak och således få ut högre prestanda, men vi misstänker att de flesta föredrar en tystare fläkt.
Till den oundvikliga G9-modellen förutspår vi att HP kommer gå över till en ny 16:10-formfaktor, vilket snabbt börjar bli en trend för kontorslaptops. I övrigt imponerar den här enheten på nästan alla fronter.
HP EliteBook 840 Aero G8 3E4Q6AA
- 08/03/2021 v7 (old)
Allen Ngo
Price comparison
