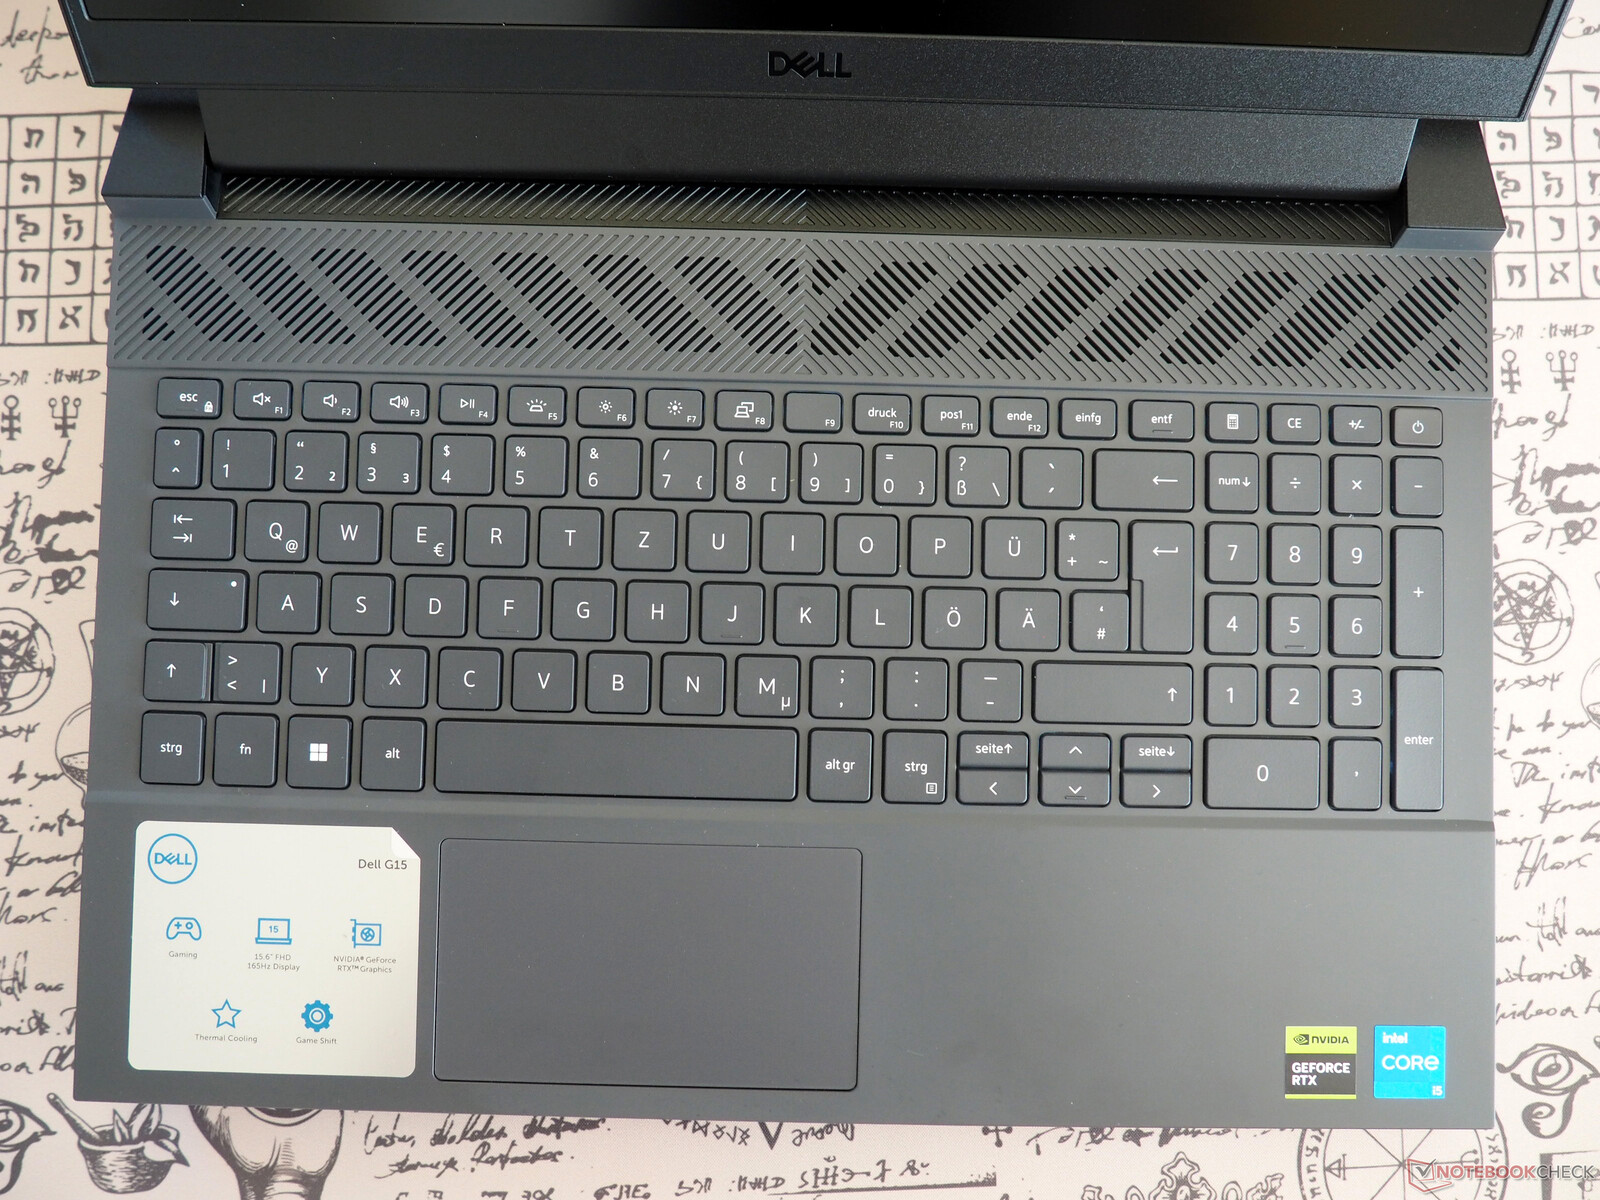
Dell G15 5530 recension: RTX 4050 gaminglaptop i Dark Shadow Gray

Efter att ha testat G15 med en Core i7-13650HX och GeForce RTX 4060 för några månader sedan (se artikel), kollar vi nu in den billigare versionen (med några hundra euro) med en Core i5-13450HX och GeForce RTX 4050. Denna variant är på samma sätt utrustad med 16 GB DDR-4800 RAM, en 512 GB-enhet och en 165Hz IPS-skärm, även om olika modeller ibland används för dessa komponenter. Paketet avrundas med operativsystemet Windows 11 Home 64 Bit.
G15 är upp mot andra RTX 4050-baserade 15-tums bärbara speldatorer som Medion Erazer Crawler E40, den Lenovo LOQ 15IRH8 och Asus TUF A15 FA507som alla visas i tabellerna nedan för jämförelseändamål.
Eftersom chassit är identiskt med G15 som vi tidigare har granskat bortsett från dess färgschema (grå istället för vit) och tangentbordsspråk, kommer vi bara att kortfattat täcka höljet, specifikationerna och inmatningsenheterna i den här artikeln.
Potentiella konkurrenter i jämförelse
Gradering | Datum | Modell | Vikt | Höjd | Storlek | Upplösning | Pris |
|---|---|---|---|---|---|---|---|
| 84.7 % v7 (old) | 01/2024 | Dell G15 5530, i5-13450HX RTX 4050 i5-13450HX, GeForce RTX 4050 Laptop GPU | 2.7 kg | 27 mm | 15.60" | 1920x1080 | |
| 85.4 % v7 (old) | 12/2023 | Medion Erazer Crawler E40 - MD 62518 i5-13500H, GeForce RTX 4050 Laptop GPU | 2.3 kg | 28 mm | 15.60" | 1920x1080 | |
| 85.9 % v7 (old) | 10/2023 | Lenovo LOQ 15IRH8 Core i7 i7-13620H, GeForce RTX 4050 Laptop GPU | 2.4 kg | 25.2 mm | 15.60" | 2560x1440 | |
| 86.3 % v7 (old) | 06/2023 | Asus TUF A15 FA507 R7 7735HS, GeForce RTX 4050 Laptop GPU | 2.2 kg | 24.9 mm | 15.60" | 1920x1080 | |
| 84.2 % v7 (old) | 06/2023 | Dell G15 5530 i7-13650HX, GeForce RTX 4060 Laptop GPU | 3 kg | 26.95 mm | 15.60" | 1920x1080 |
Fall
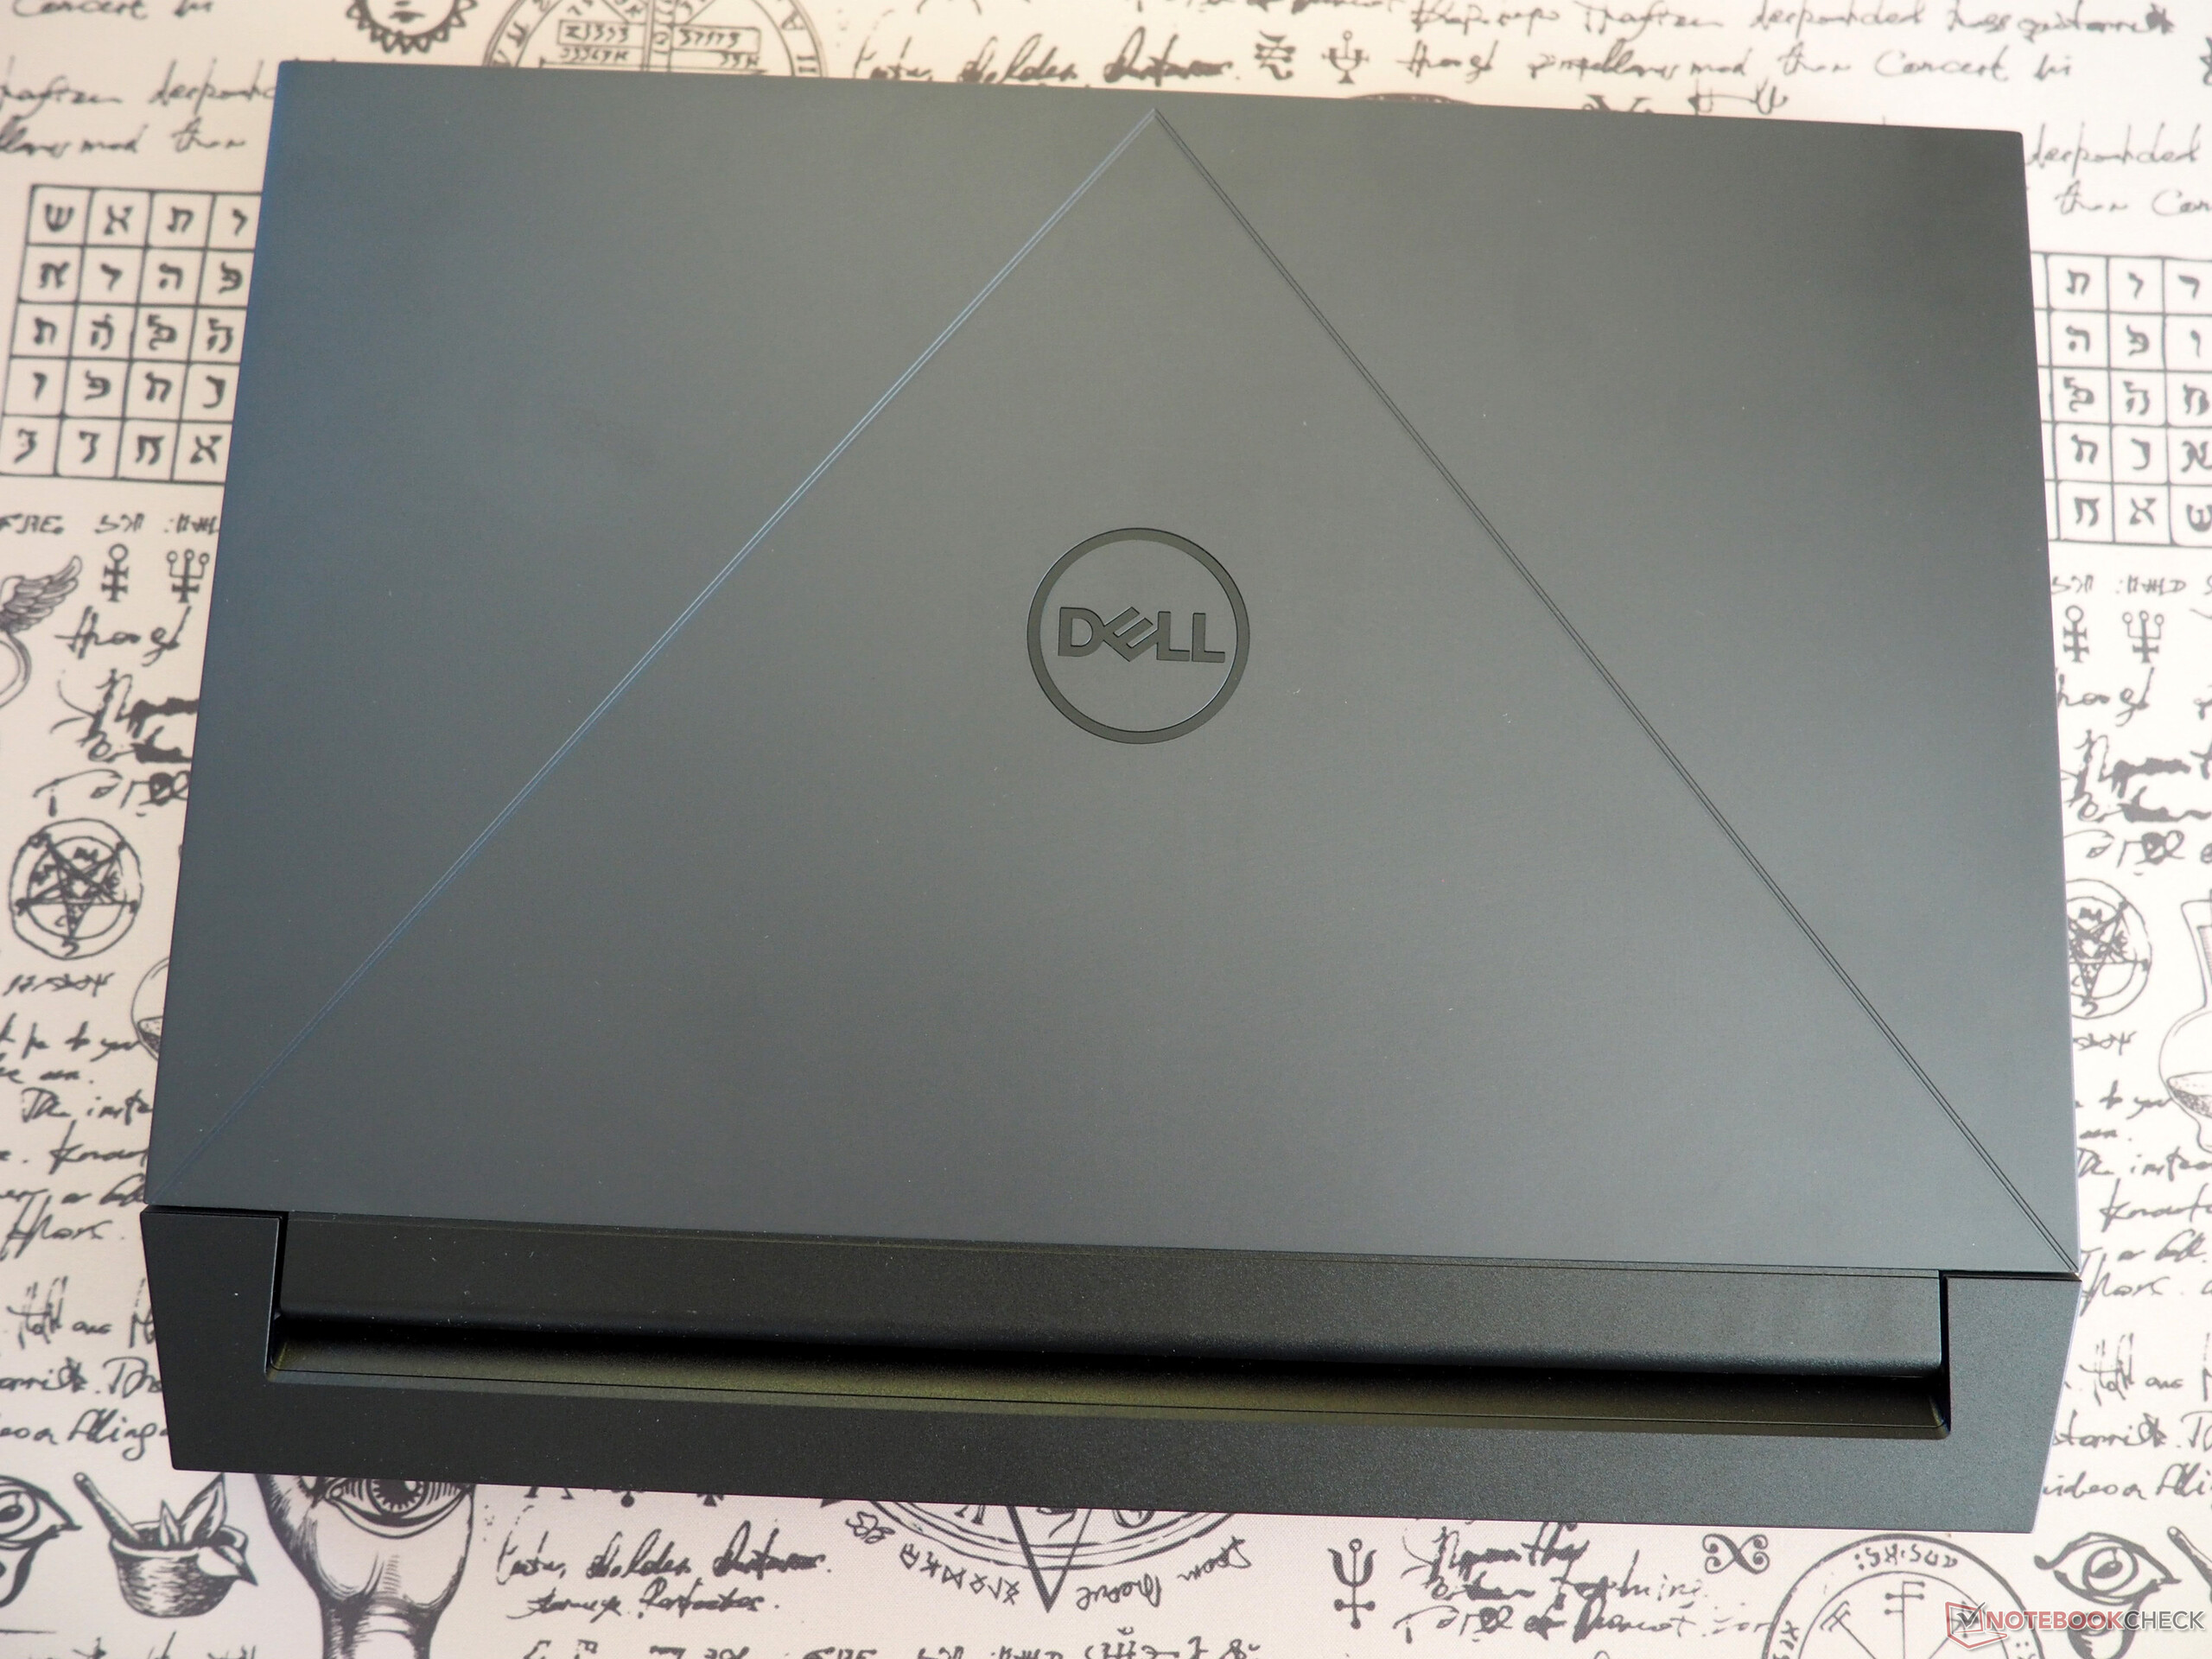
G15 visar sig vara en notebook med en klassisk konstruktion, vilket innebär att den varken är särskilt tunn (2,7 cm, eller 1,06 in) eller särskilt lätt (2,7 kg, eller 5,95 lb). Konkurrenterna erbjuder mer modern design, men det behöver inte alltid vara en bra sak (nyckelord: utsläpp). När det gäller estetik är den bärbara datorns design särskilt iögonfallande, men som många andra tillverkare gör i den här prisklassen har Dell valt en utsida helt i plast som har en tendens att skramla på vissa ställen. Kvaliteten på passform och finish är däremot bra. Gångjärnsmekanismen gör ett anständigt jobb; den bärbara datorn kan enkelt öppnas med en hand.
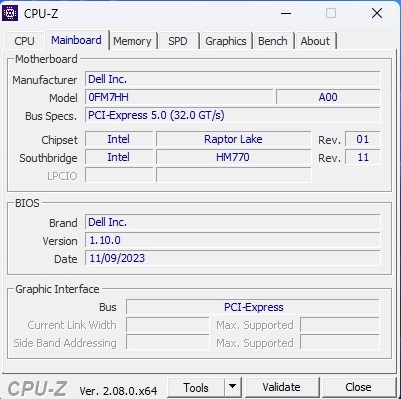
Specifikationer
Gränssnitt
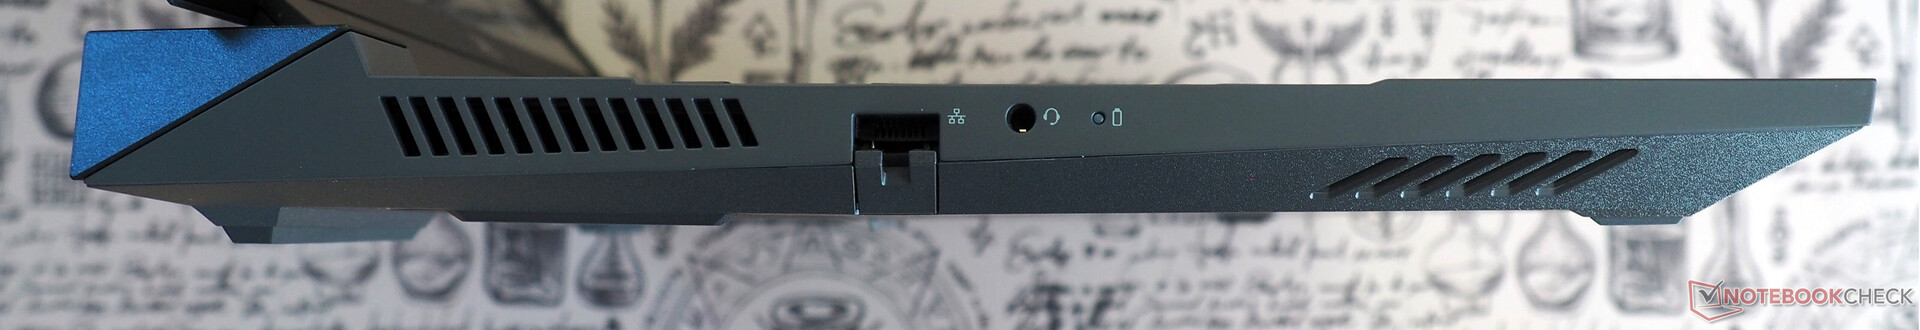
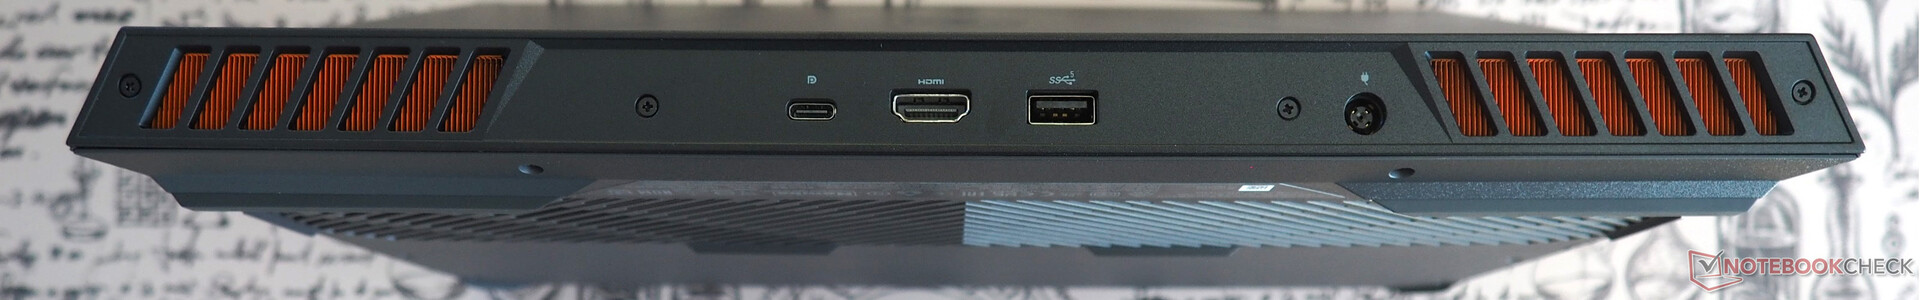
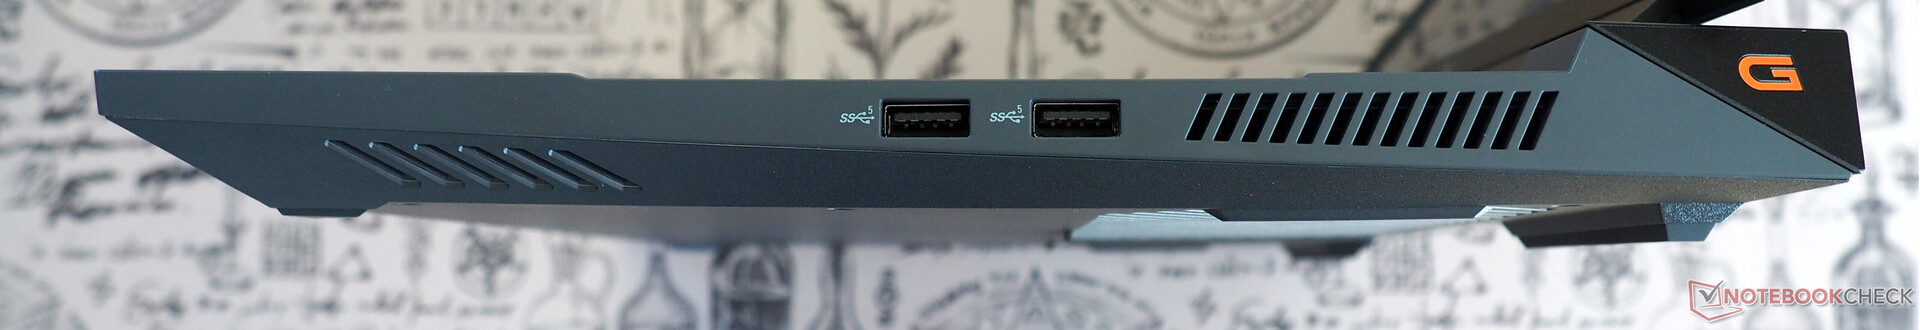
Portutbudet är ganska föråldrat och glest. Du hittar till exempel inte en enda USB4-port på enheten. Istället levereras den bara med en USB. 3.2 Gen 2 (typ C) och tre USB 3.2 Gen 1 (typ A)-portar. Användarna får också klara sig utan en kortläsare och en Kensington-plats. Men enheten har åtminstone en HDMI 2.1-utgång, en Ethernet-port och ett ljuduttag.
Anslutningsmöjligheter
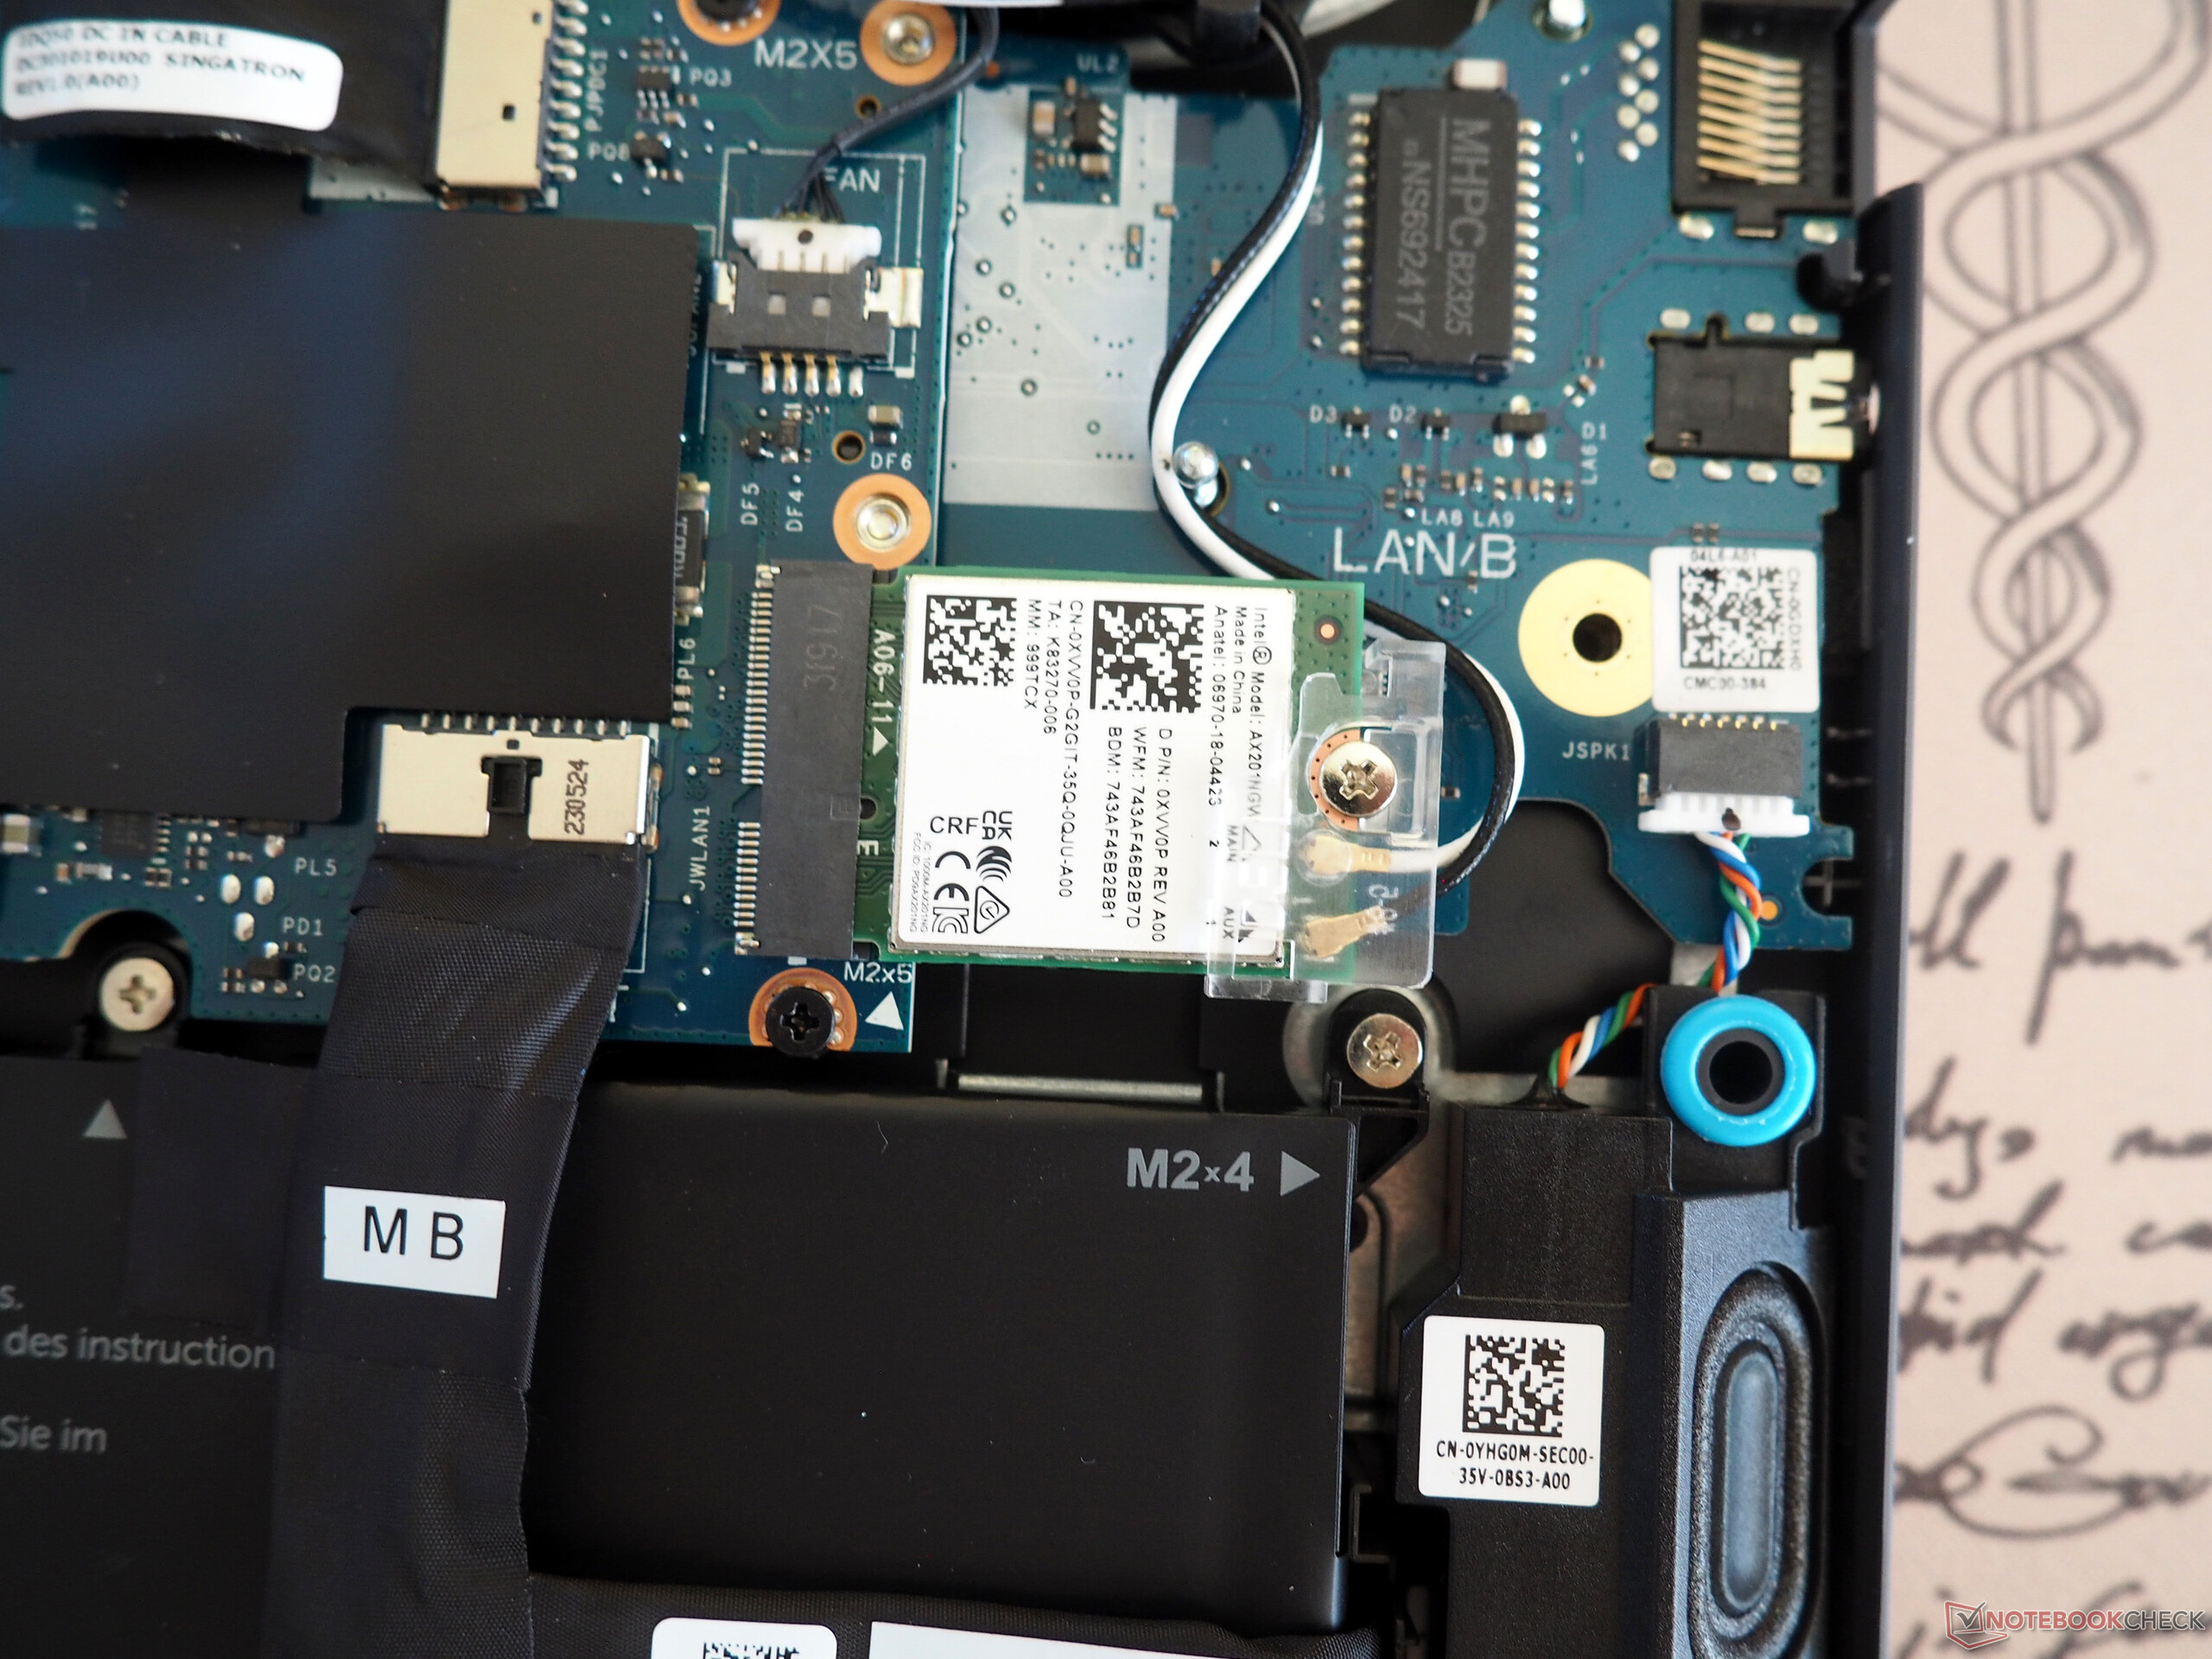
G15:s trådlösa prestanda är i nivå med (skicka) eller högre än (ta emot) det genomsnitt vi har sett hittills från denna klass av bärbara datorer. Det inbyggda trådlösa kortet är tillverkat av Intel (Wi-Fi 6 AX201).
Webbkamera
Webbkameran är ganska medioker kvalitetsmässigt. Det finns fortfarande utrymme för förbättringar när det gäller färgåtergivning och bildskärpa.


Tillbehör
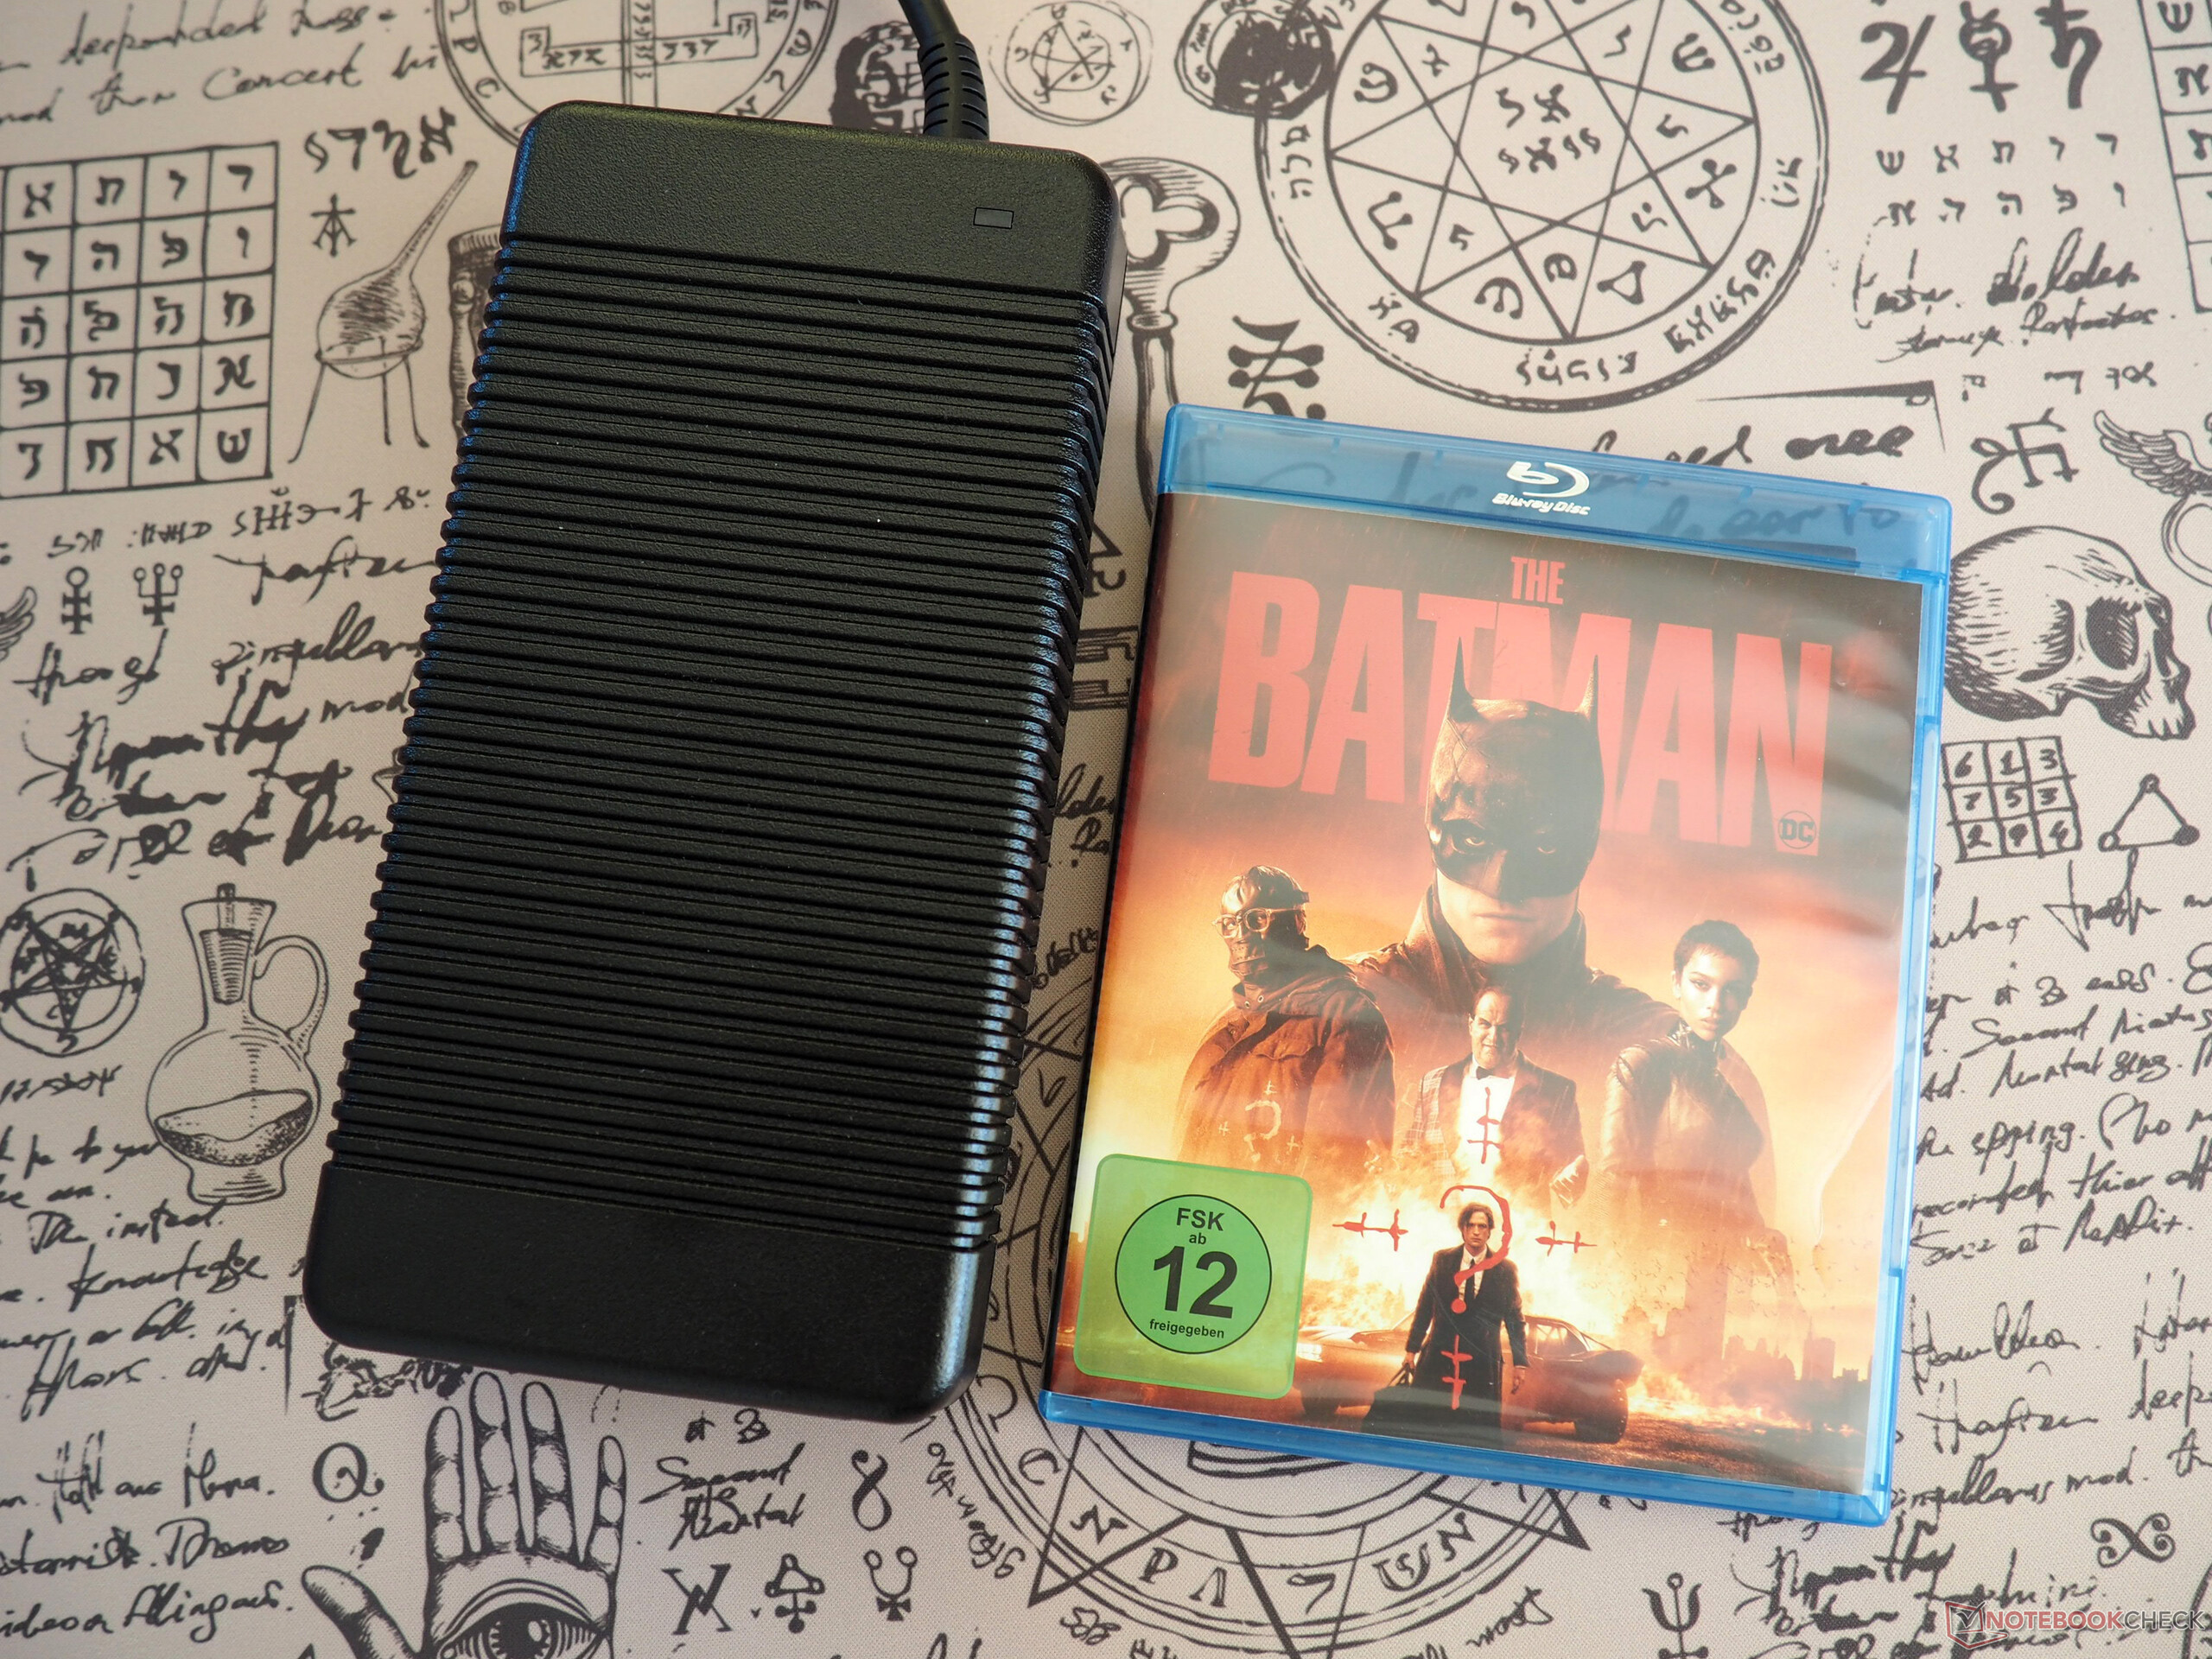
Med tanke på den prestandanivå som erbjuds levereras G15 med en absurt stor och tung nätadapter (inkl. kabel 1,5 kg, eller 3,3 lb).
Underhåll
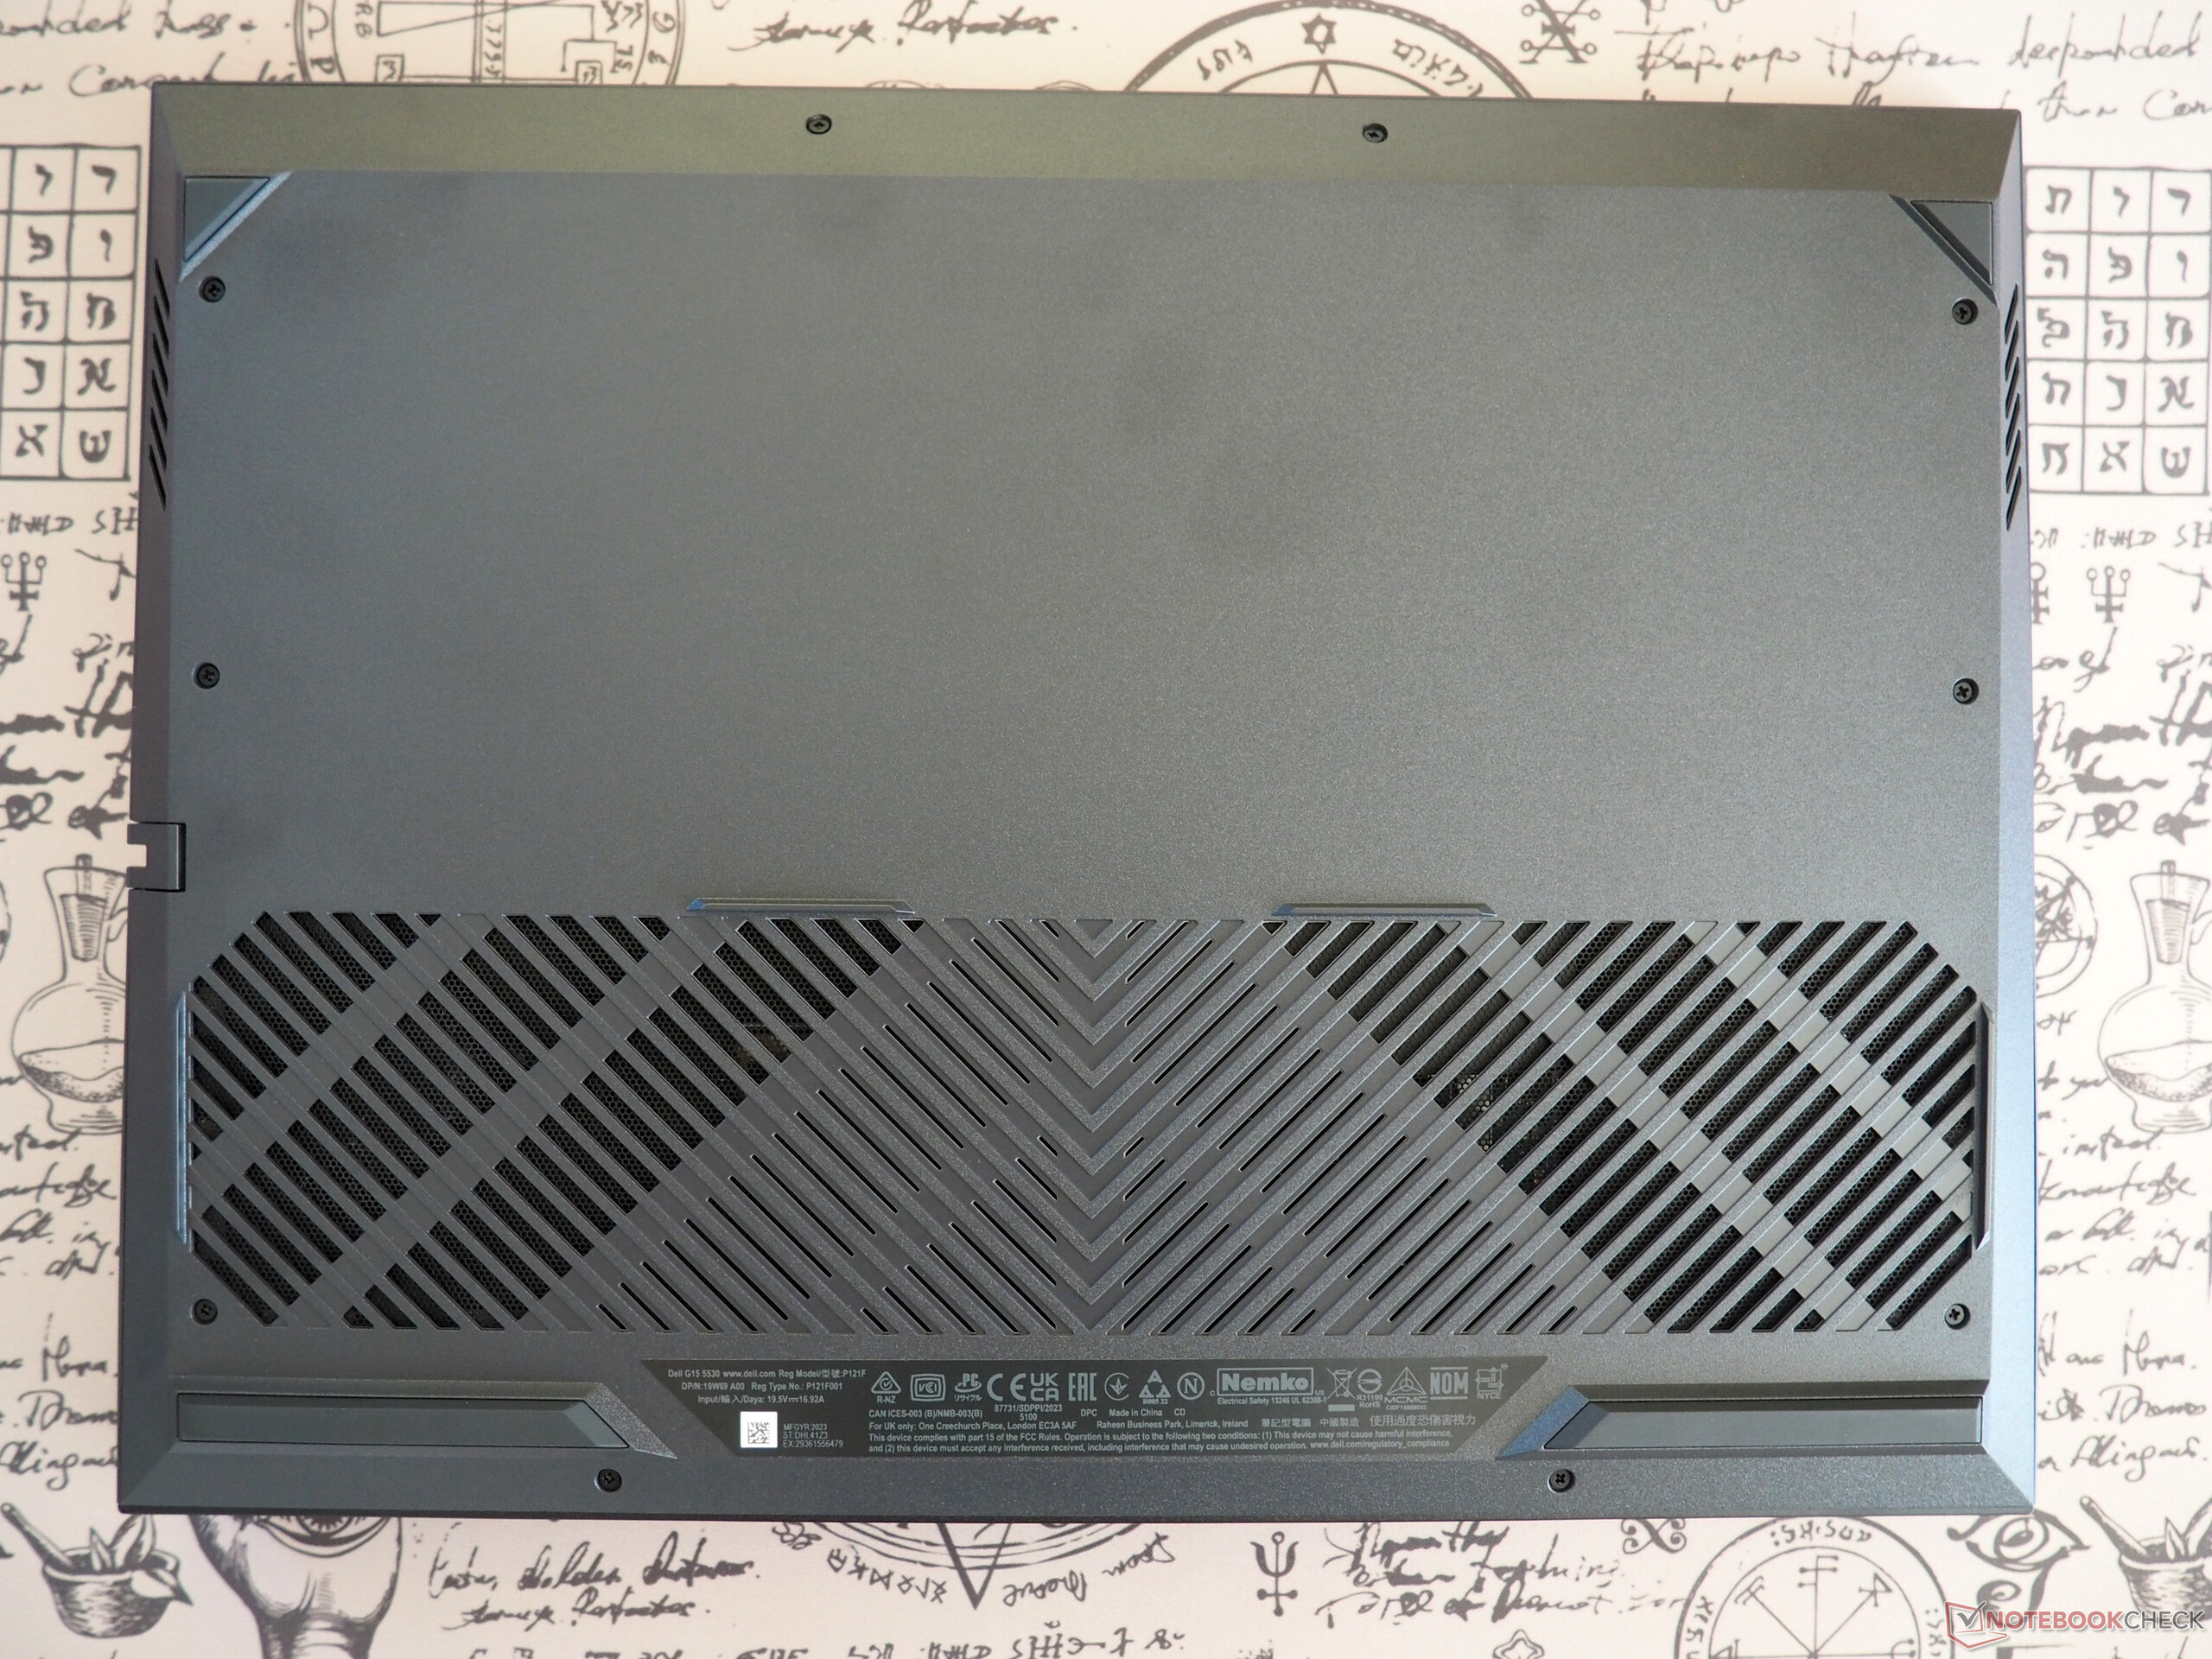
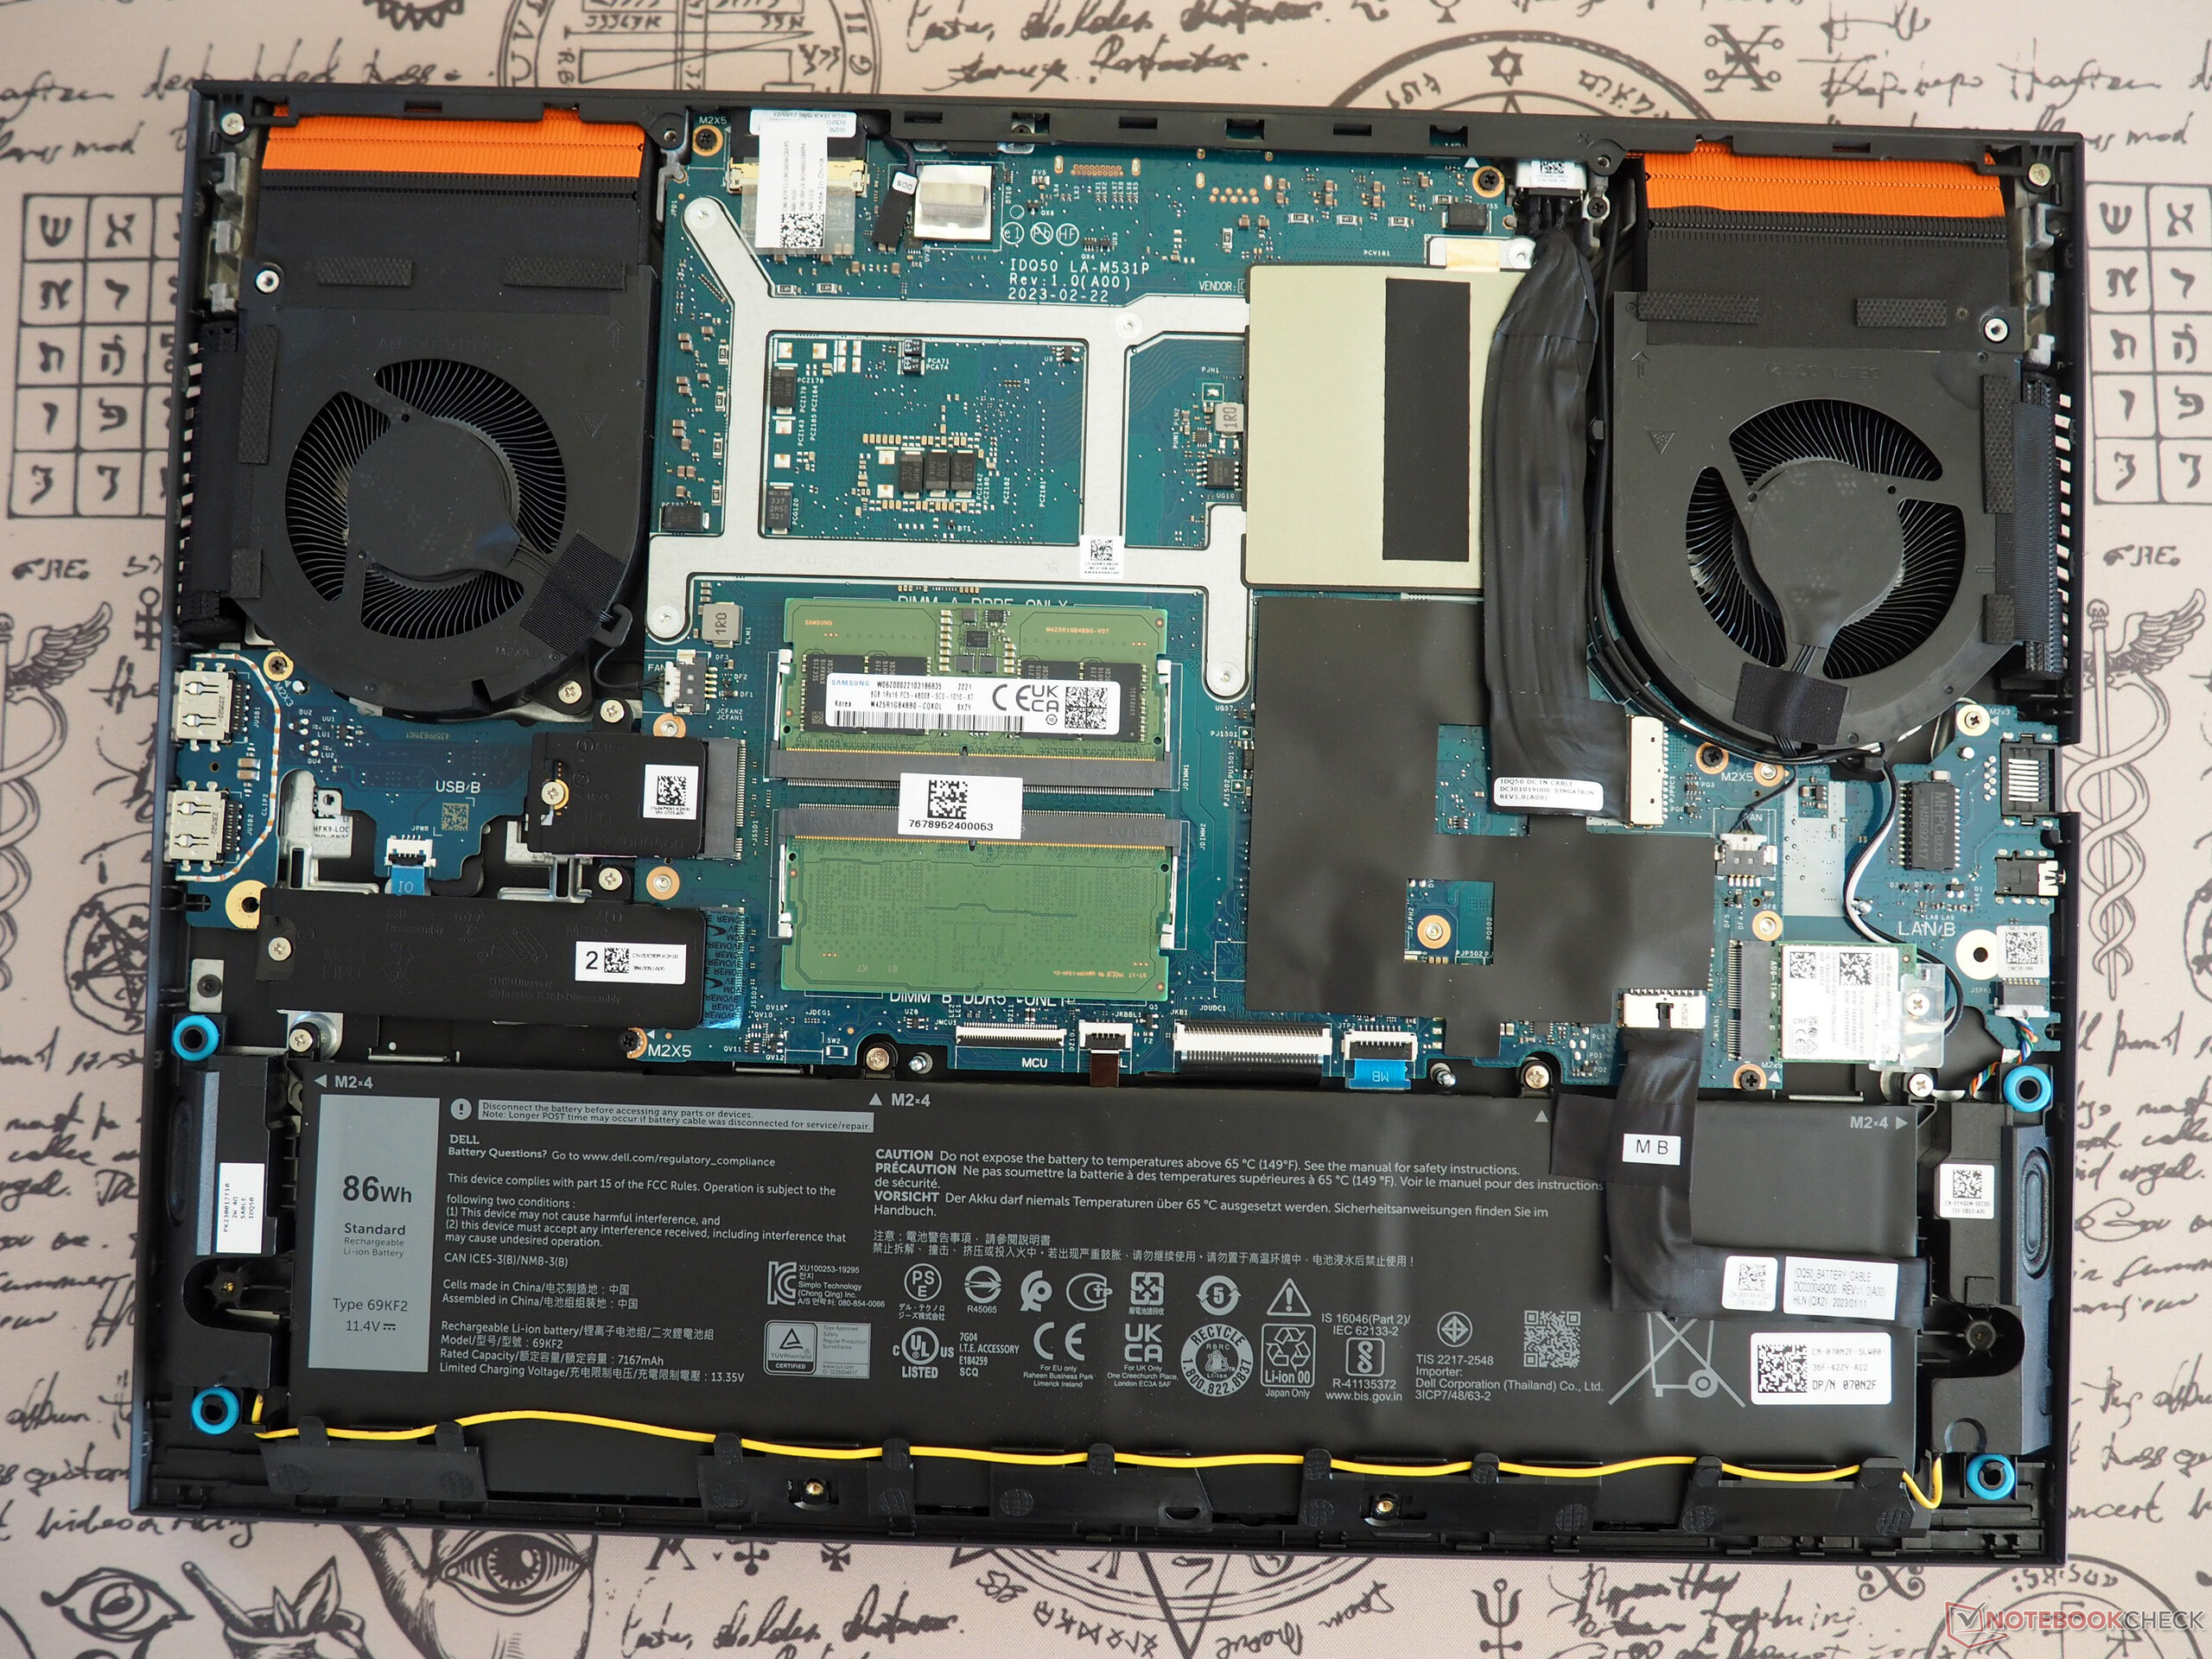
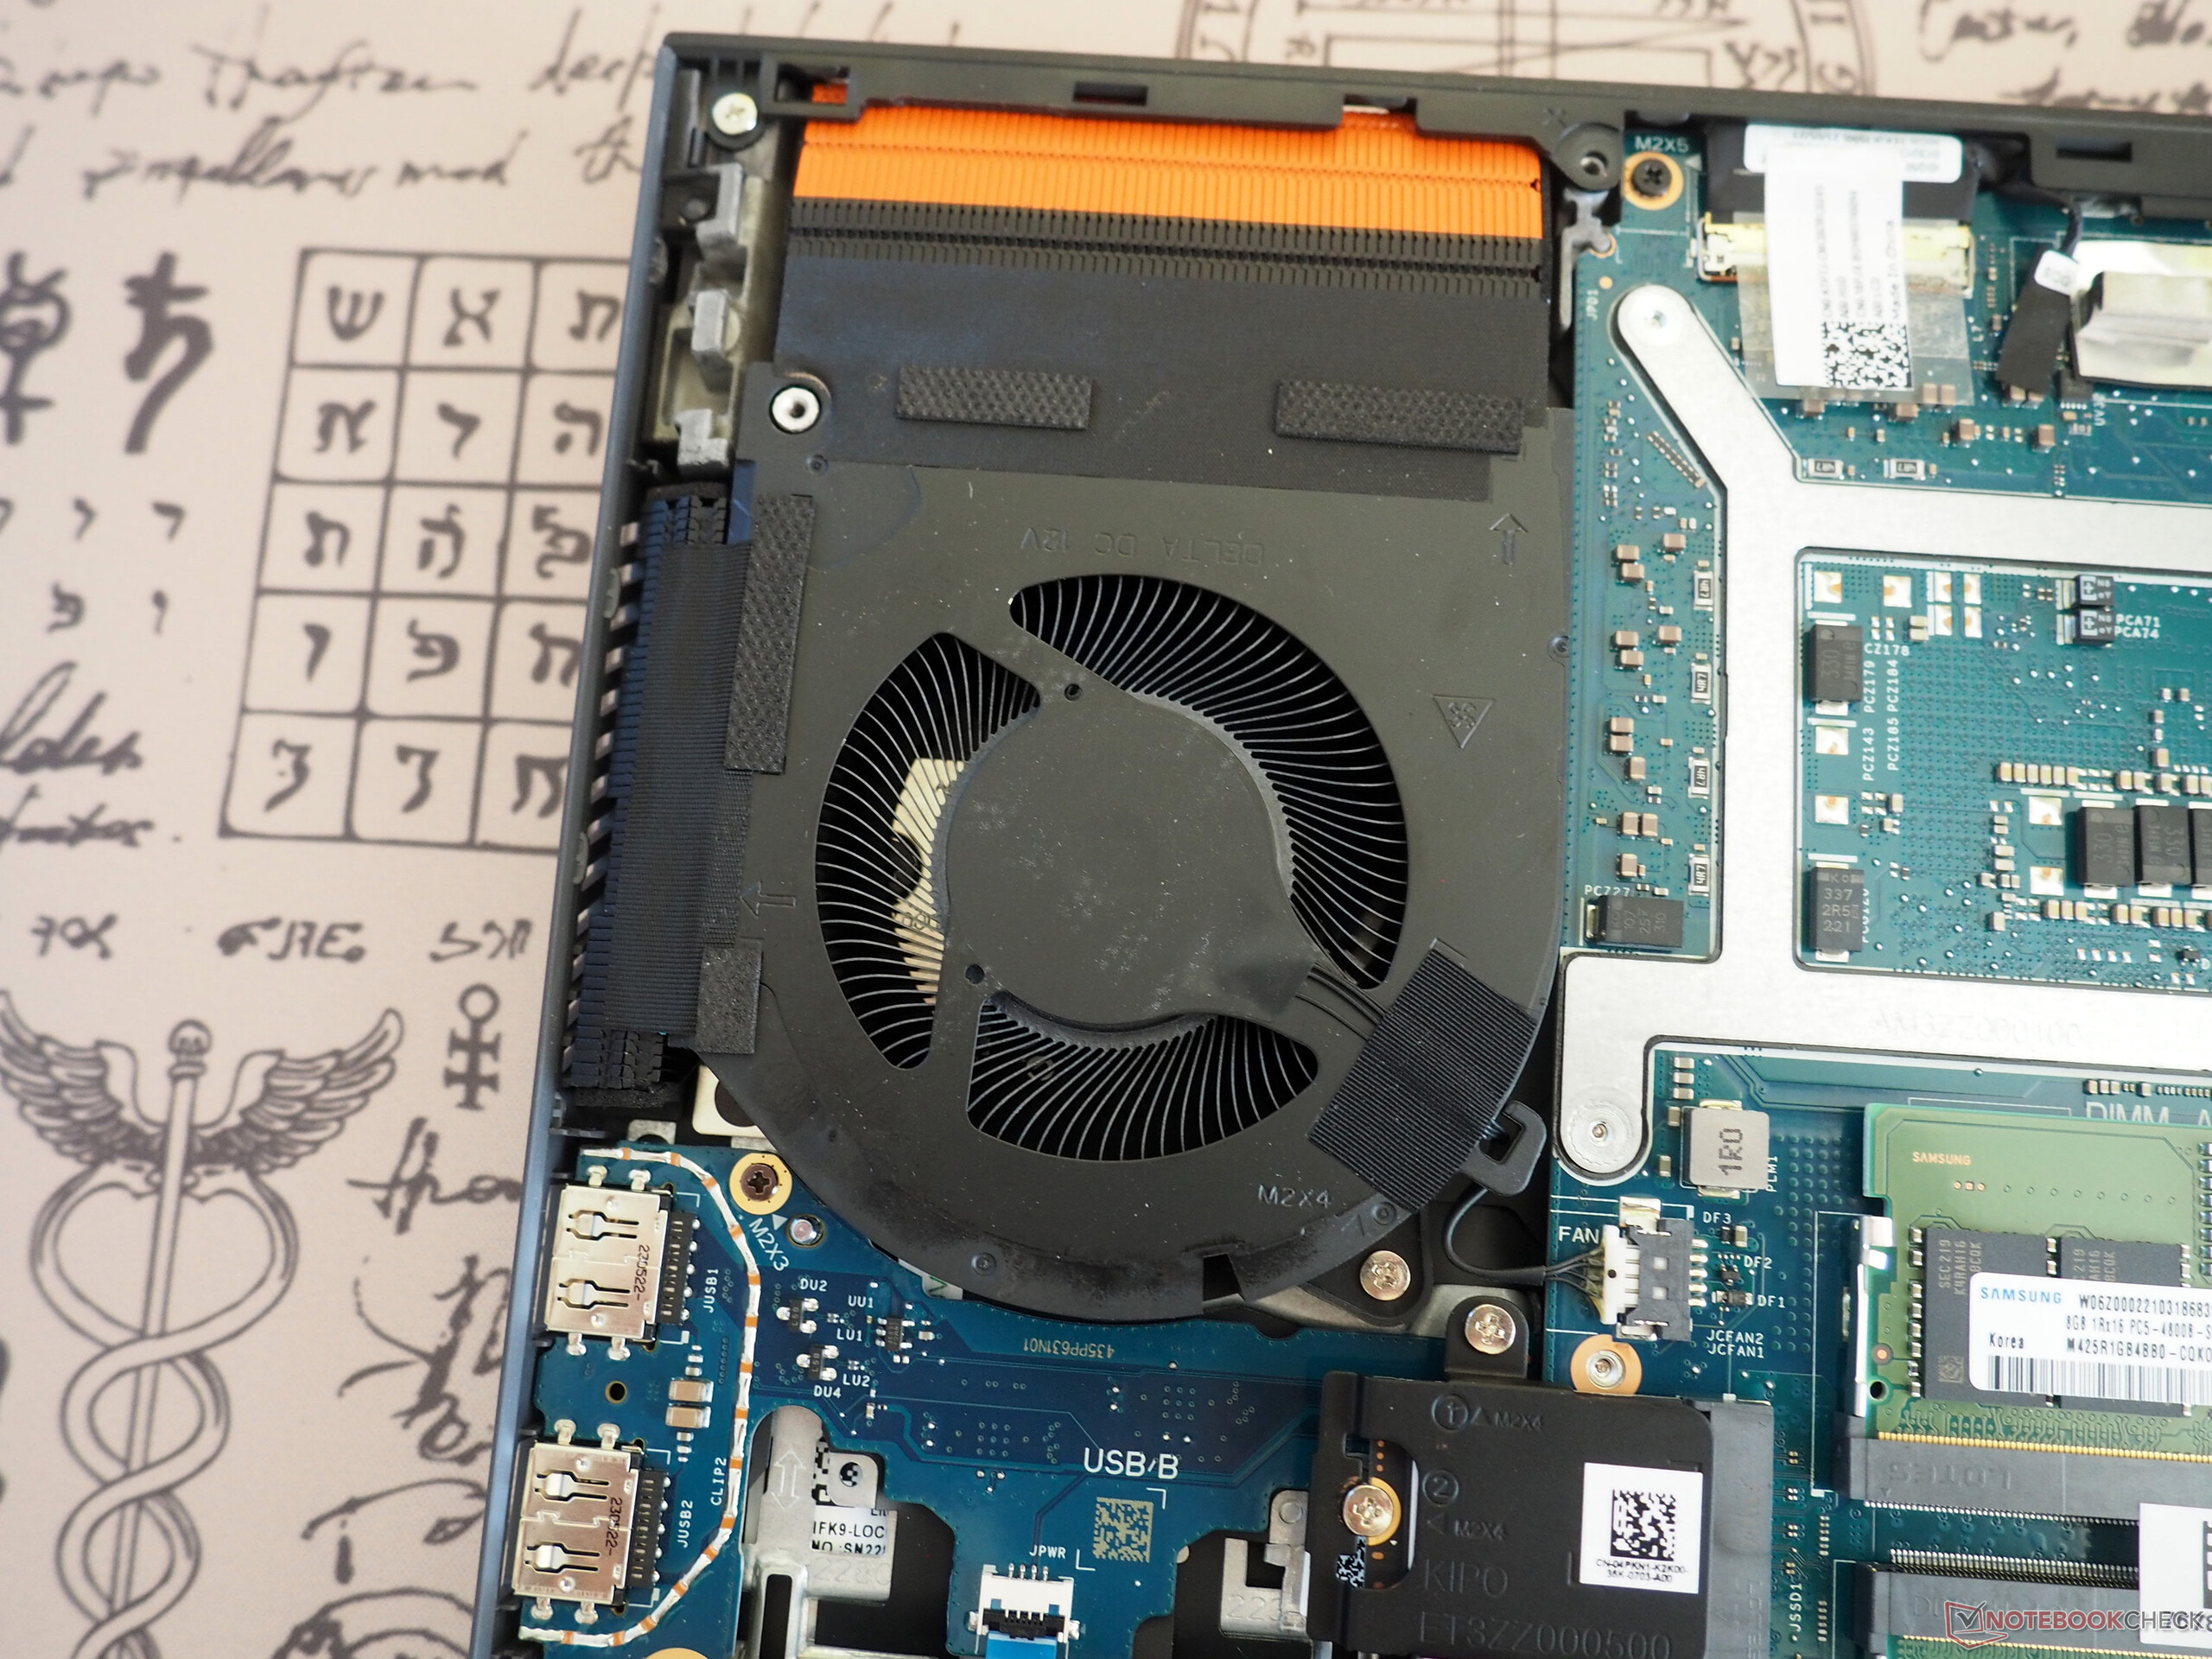
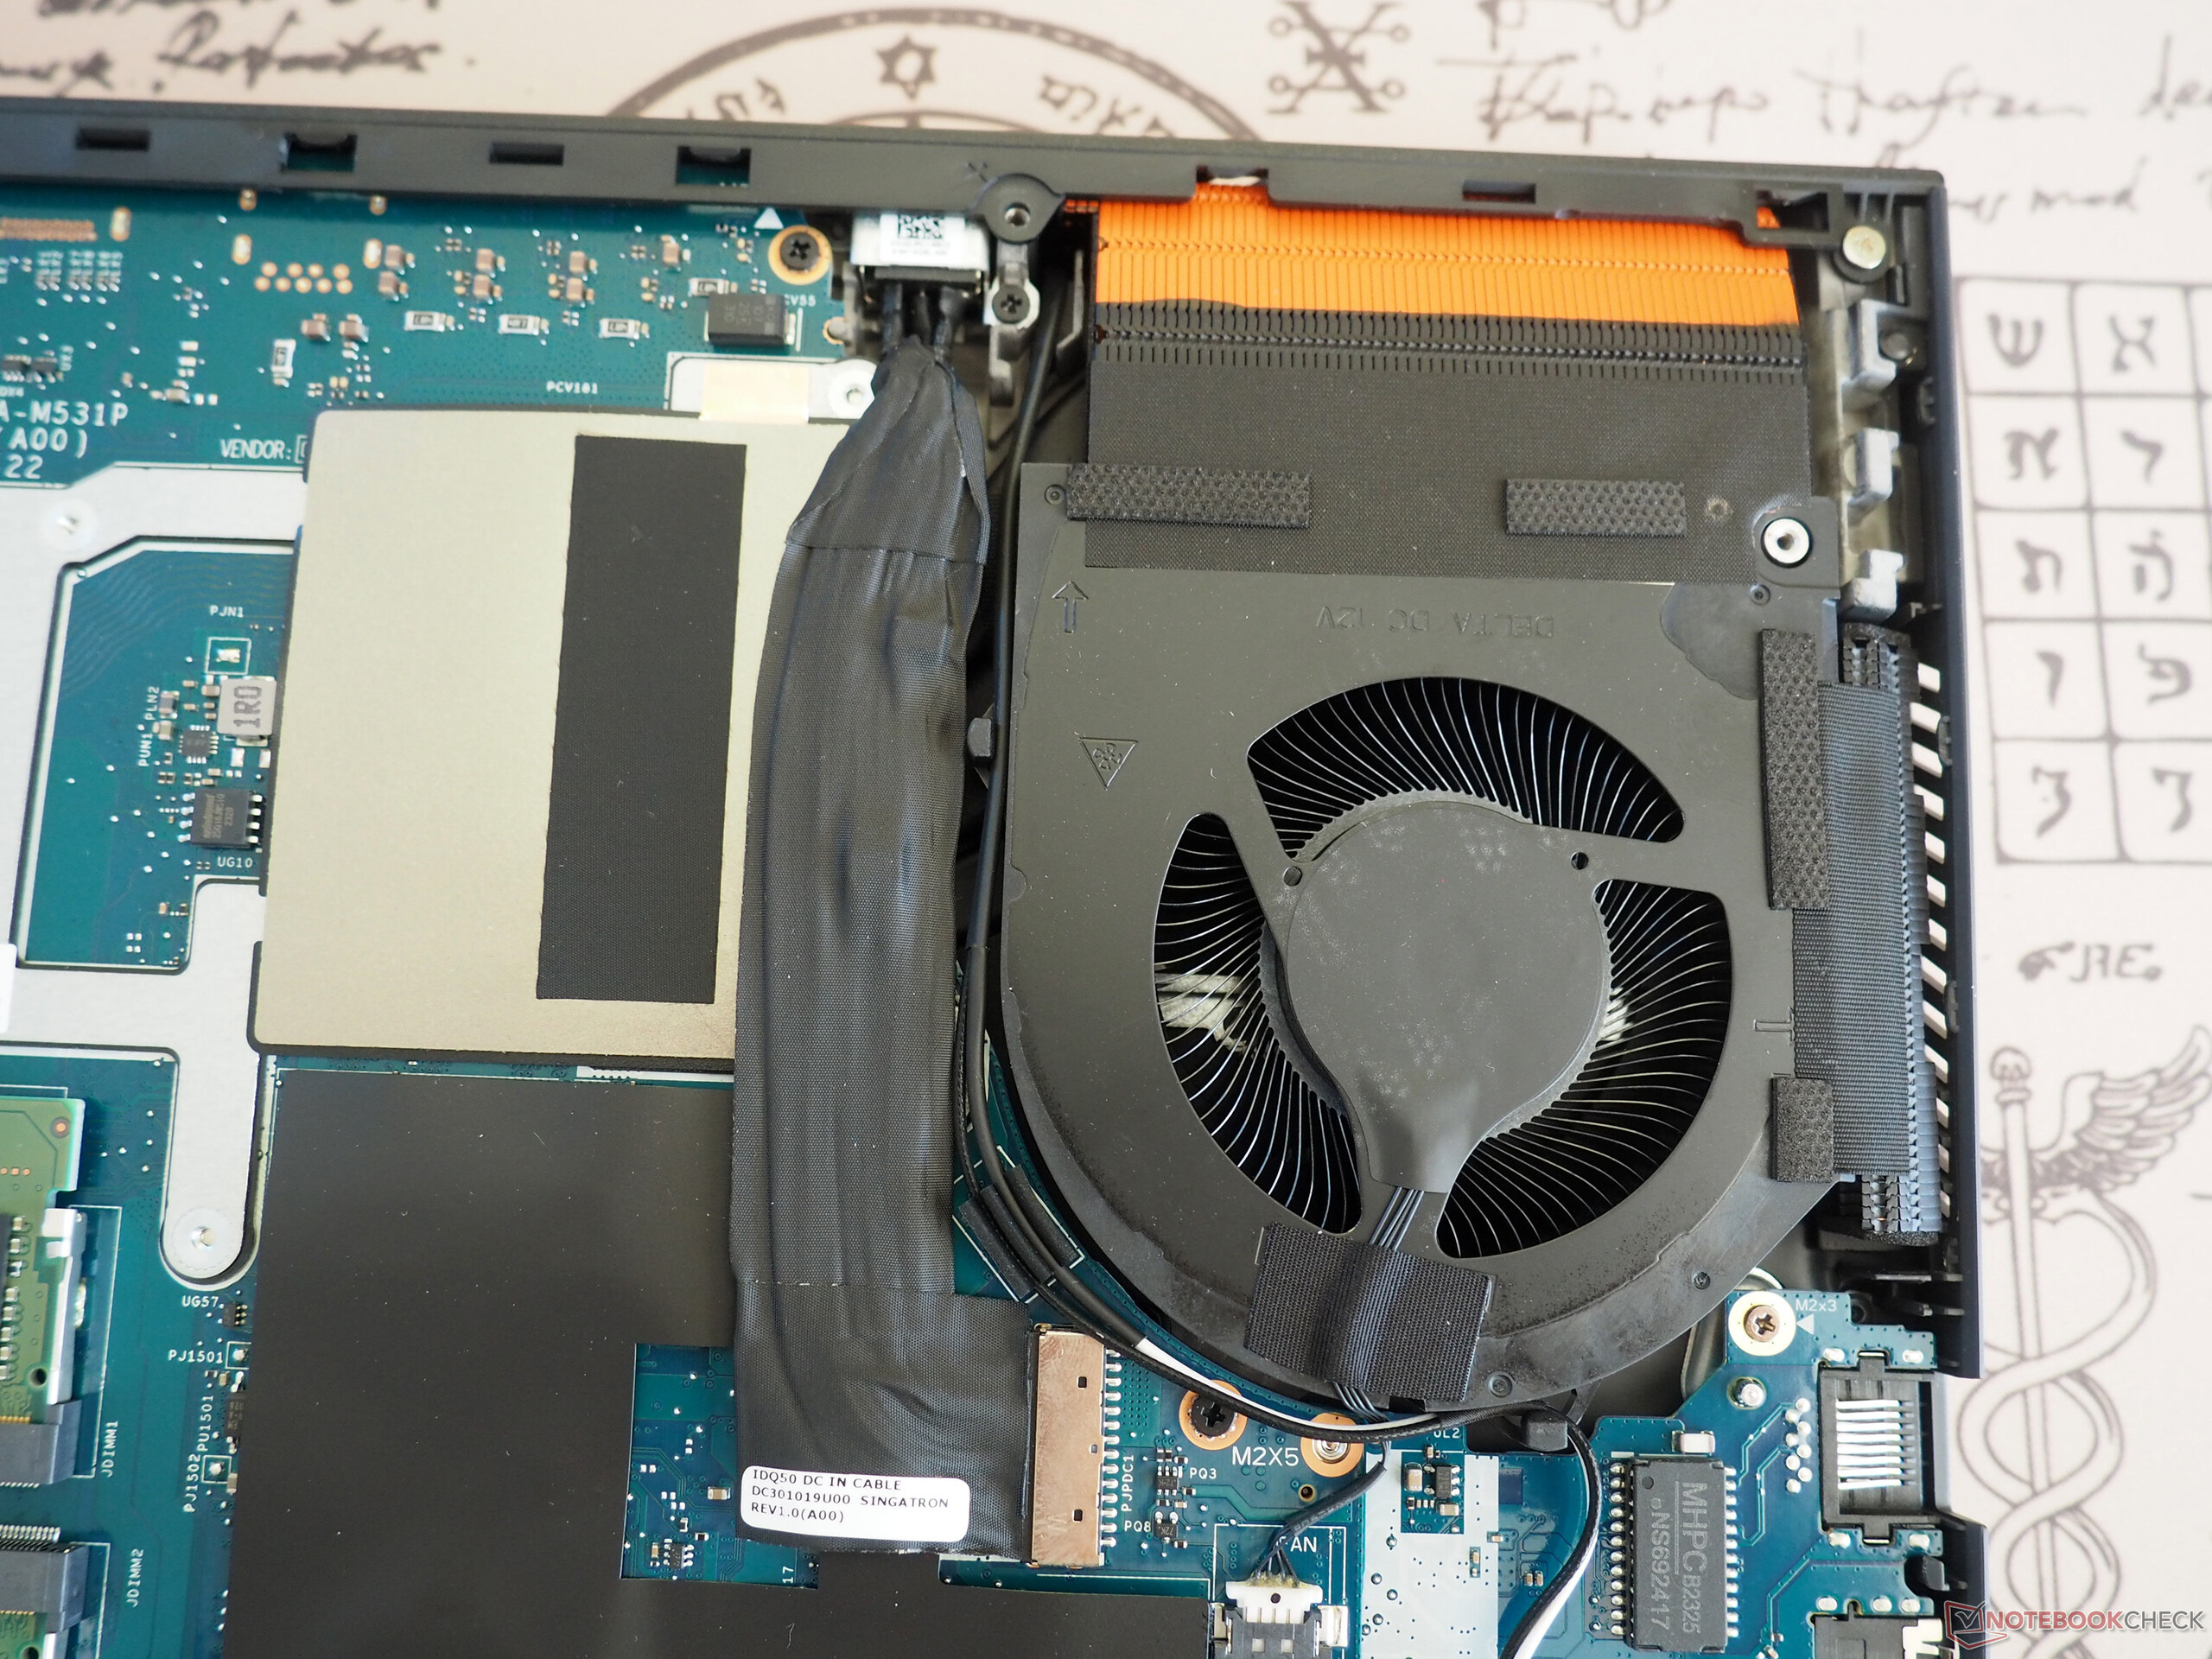
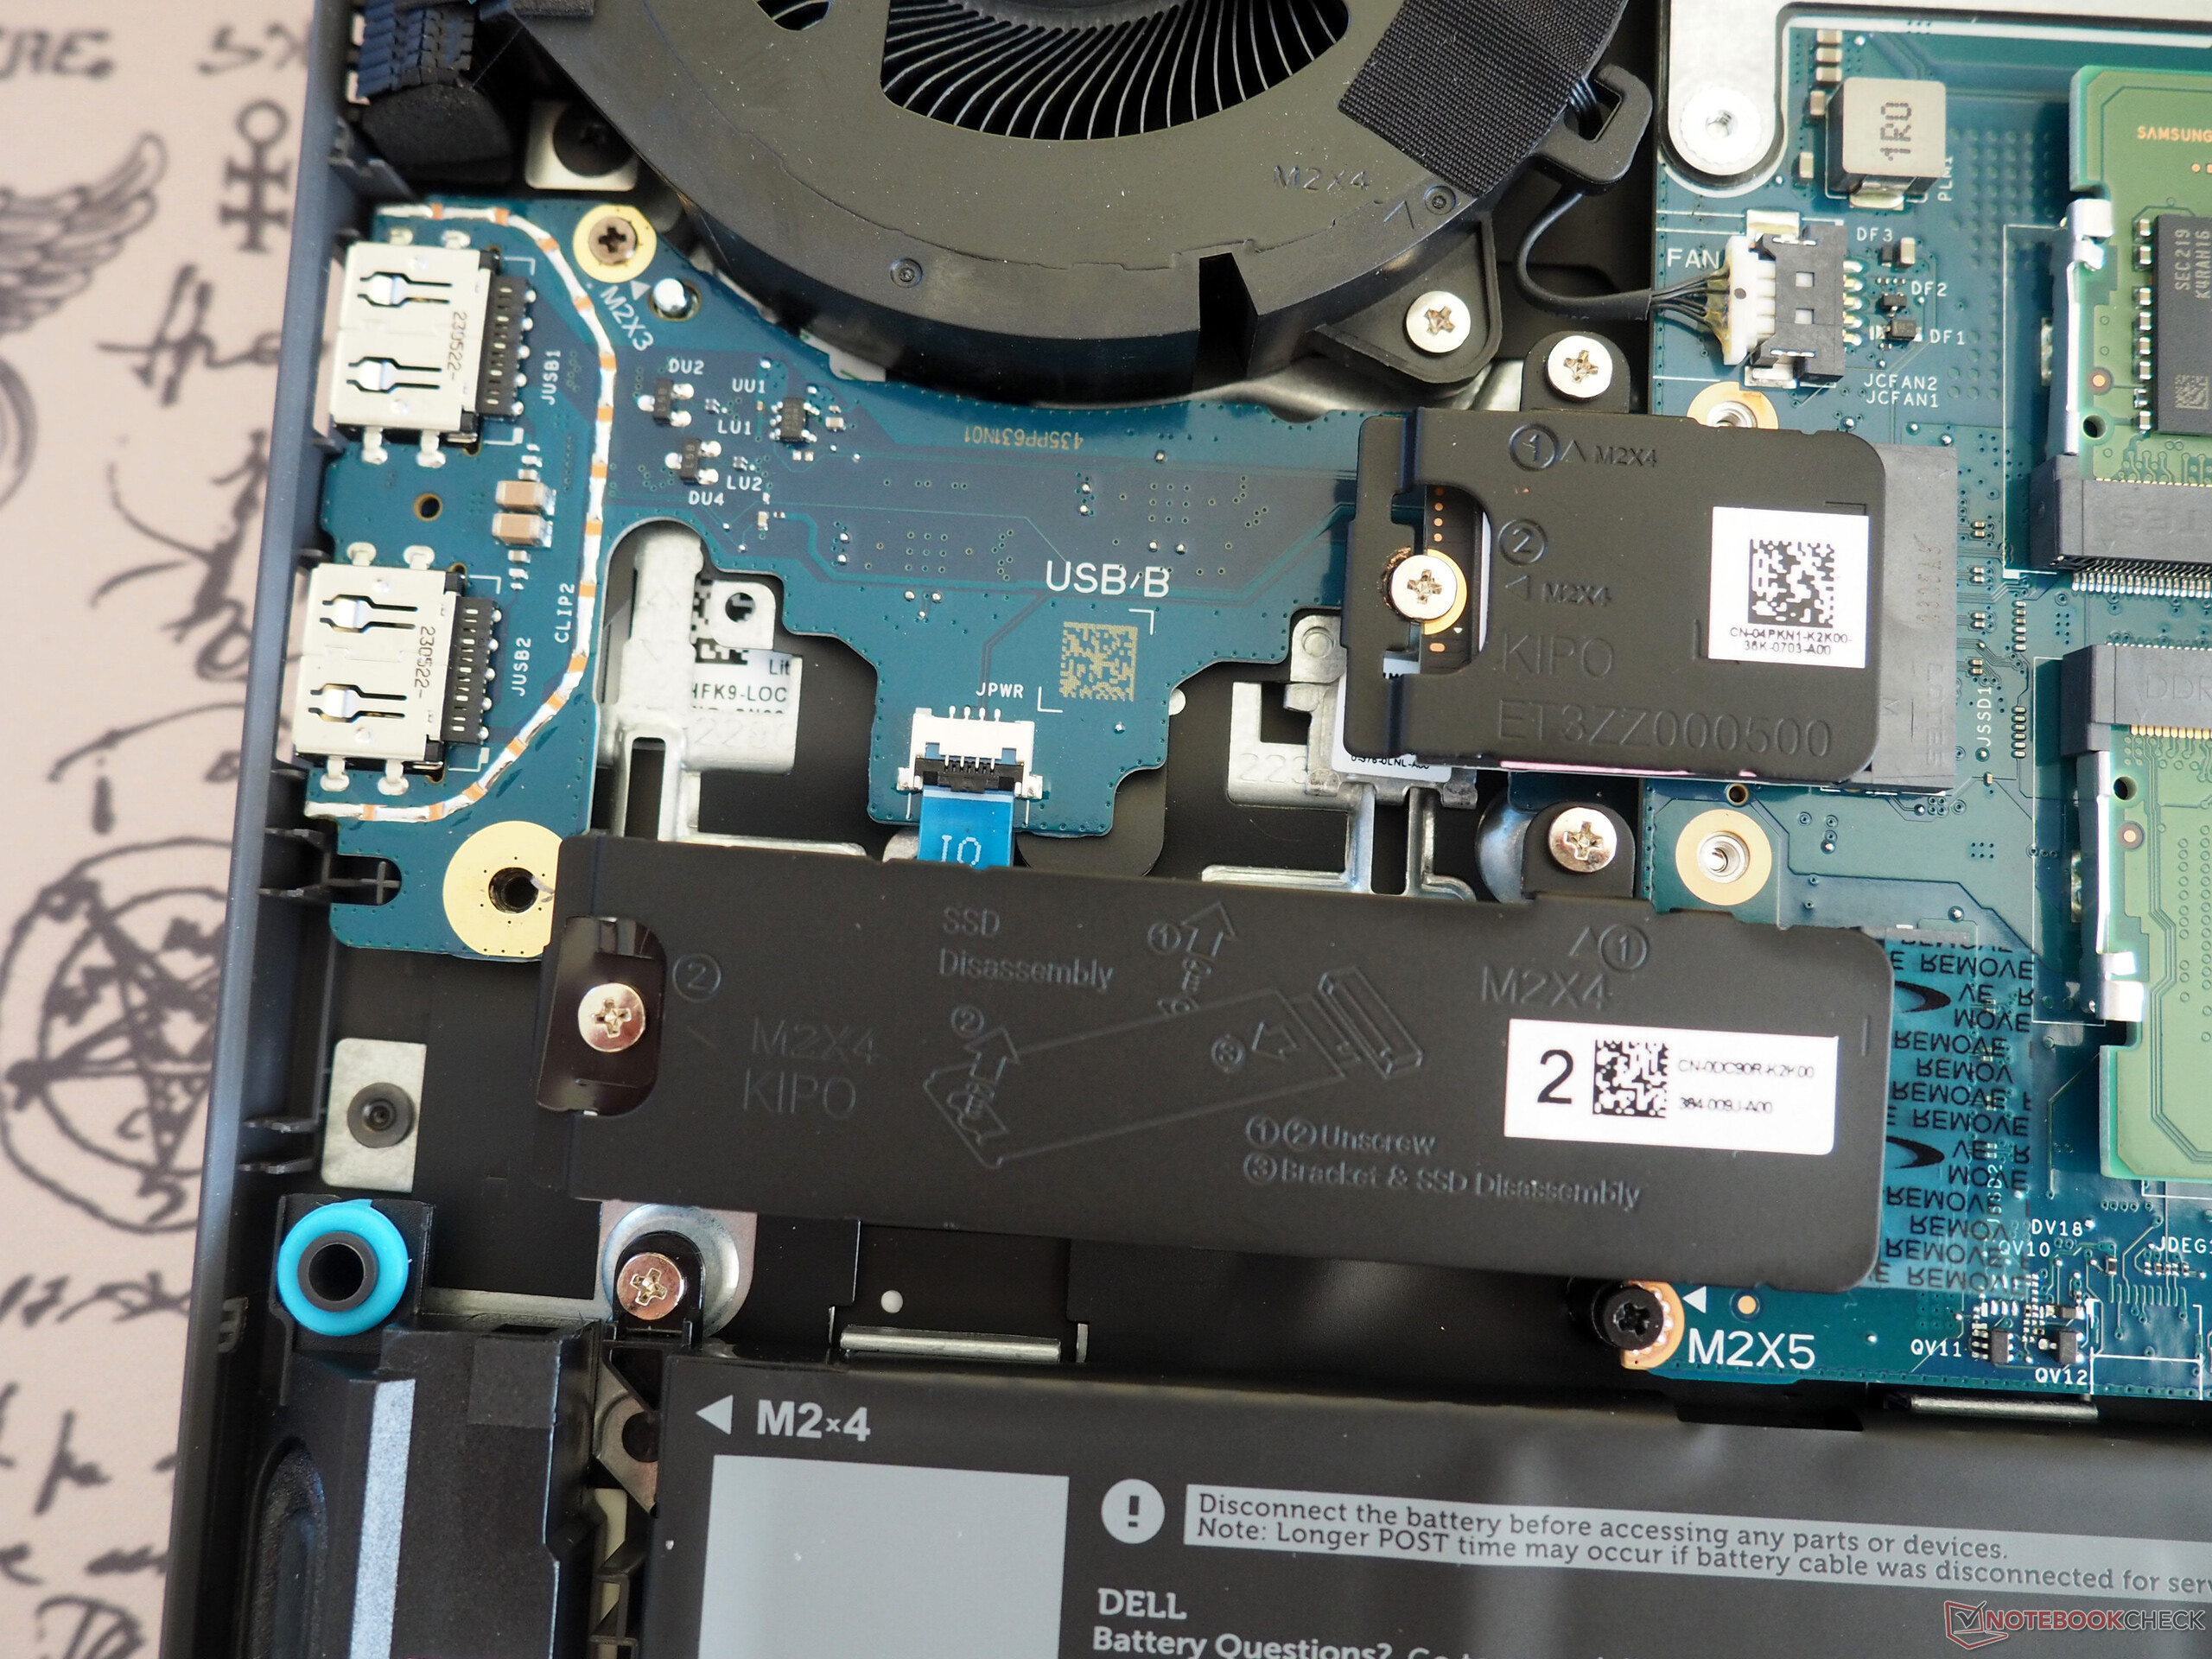
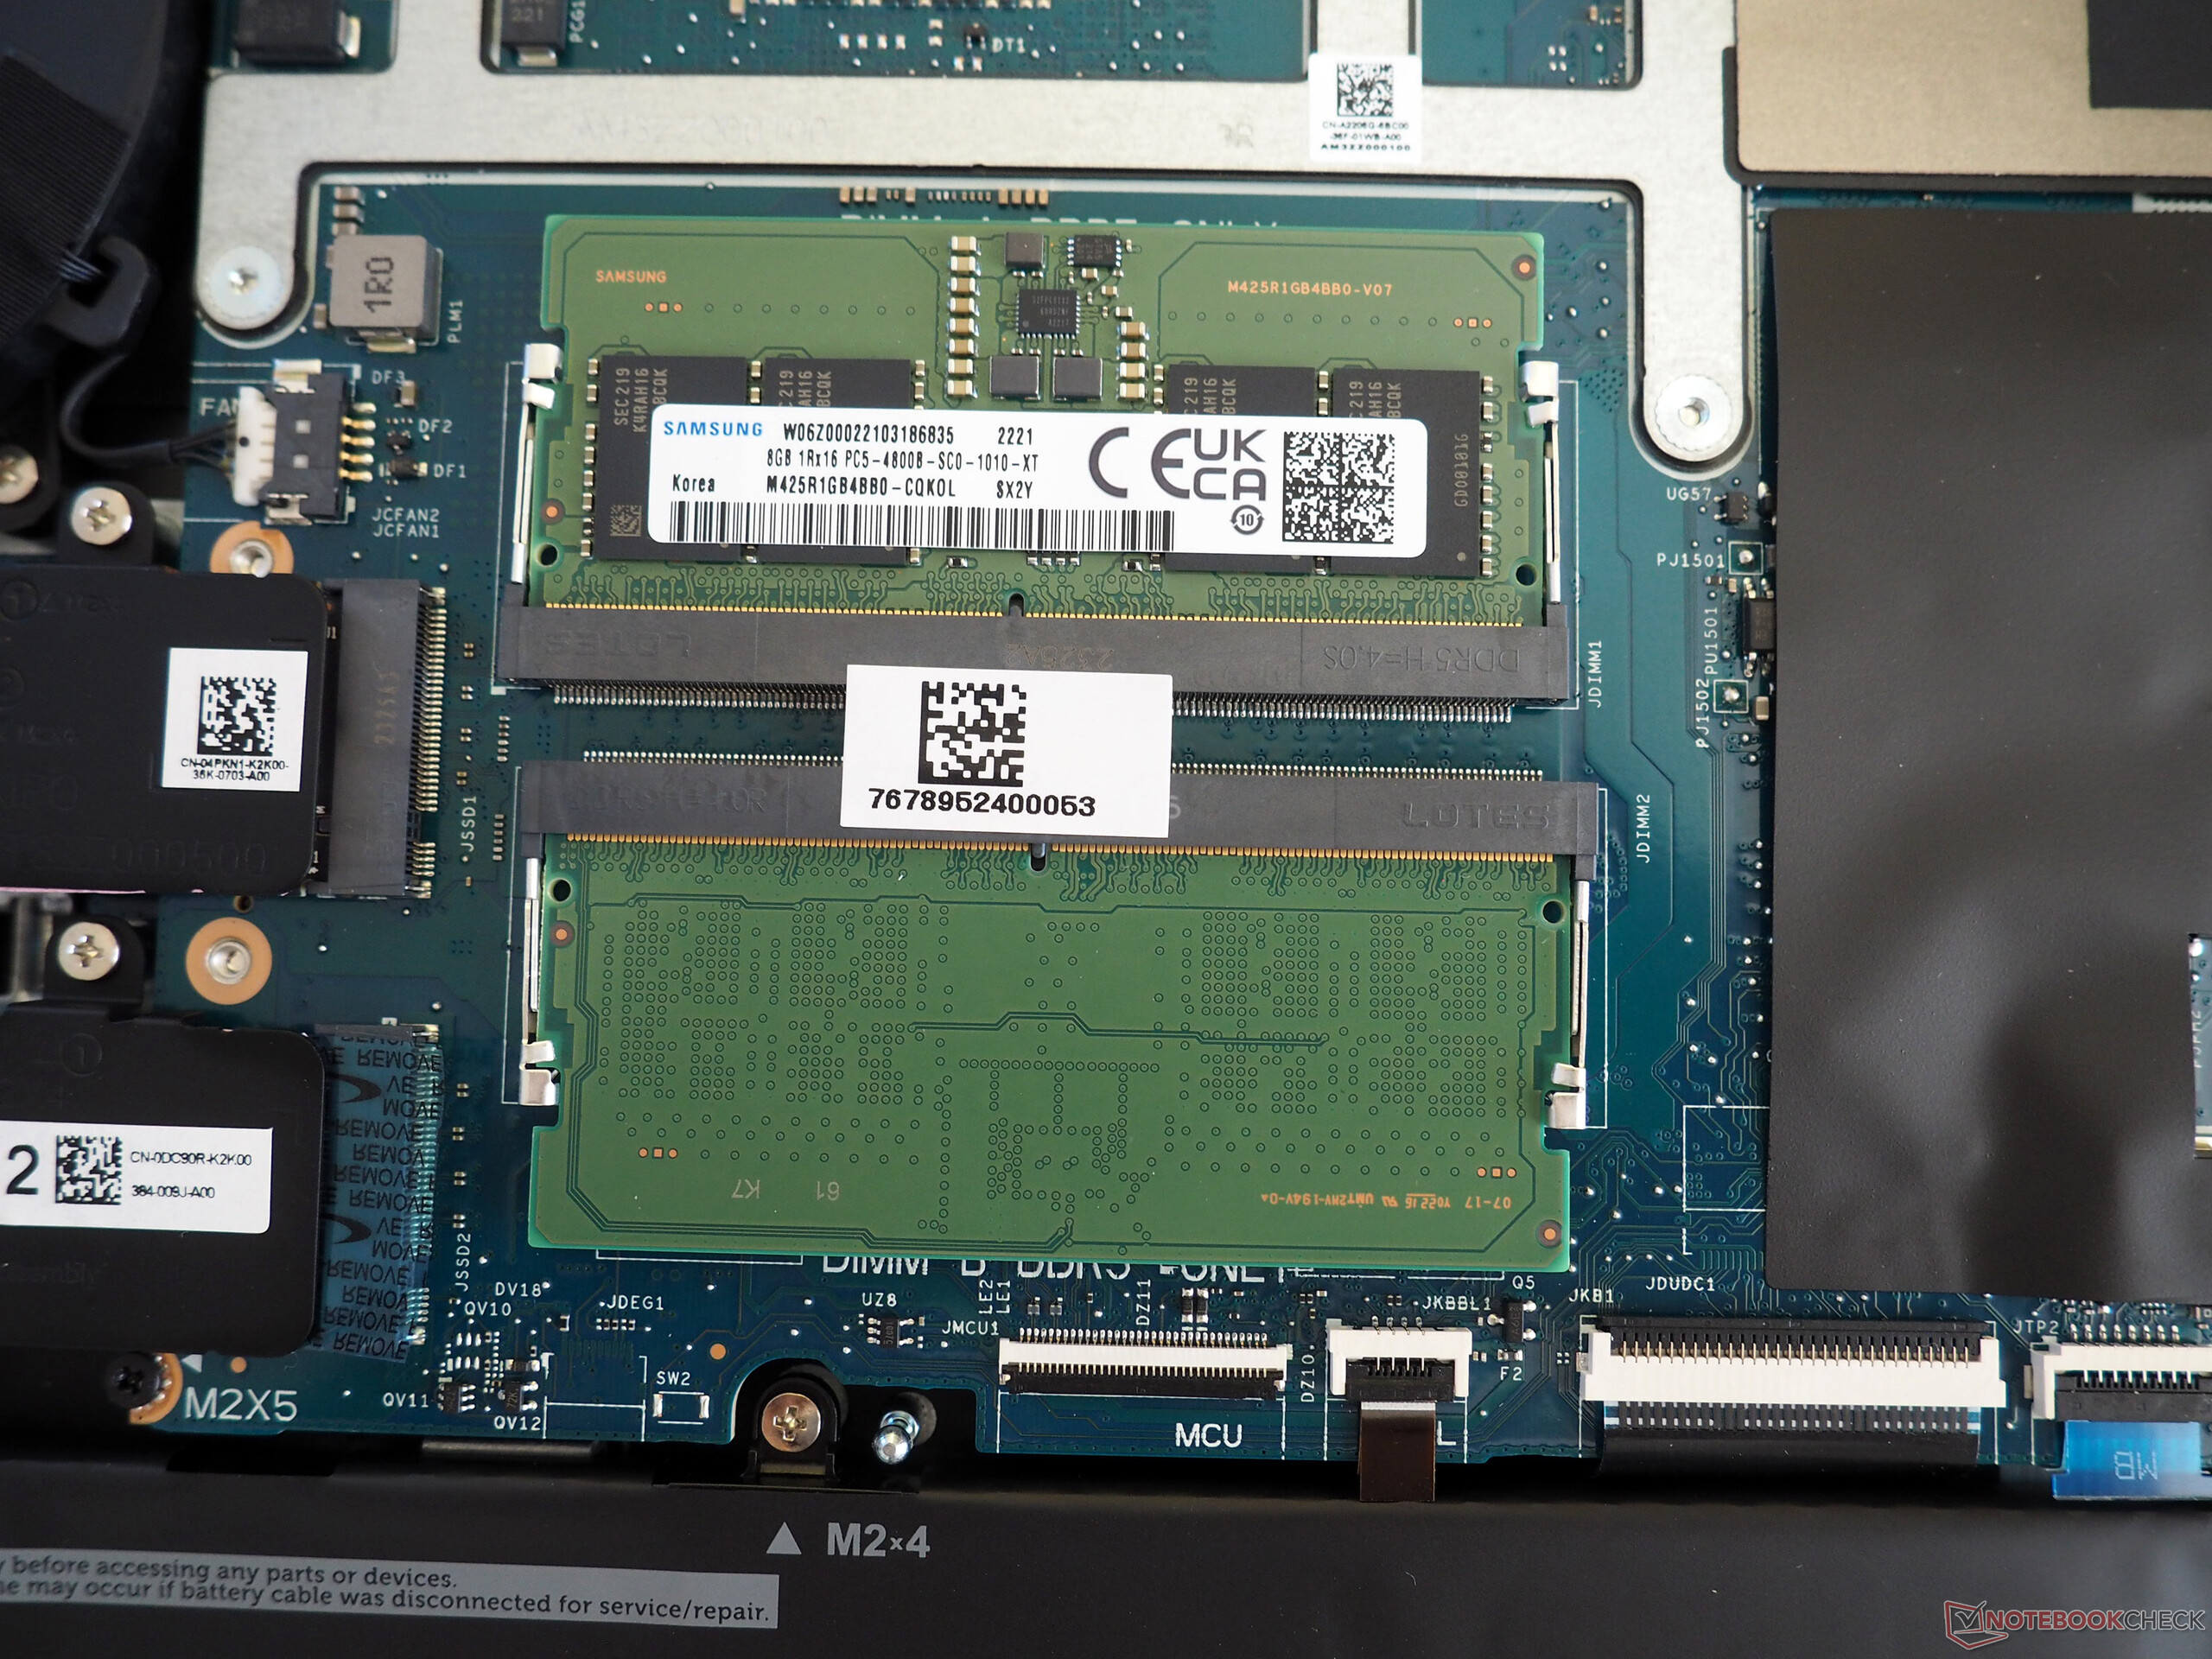
Att öppna chassit kan definitivt göras även av en genomsnittlig användare. Efter att ha tagit bort tio korsskruvar kan du lyfta ut bottenpanelen ur hållaren. Under huven väntar kylningsenheten, batteriet, Wi-Fi-modulen, två upptagna minnesplatser, en M.2 2230-plats som används och en ledig M.2 2280-plats för lagringsuppgradering.
Garanti
Dell tillhandahåller endast en 12-månaders garanti som standard i Tyskland. Garantiperioden kan dock variera beroende på region.
Inmatningsenheter
Tangentbord
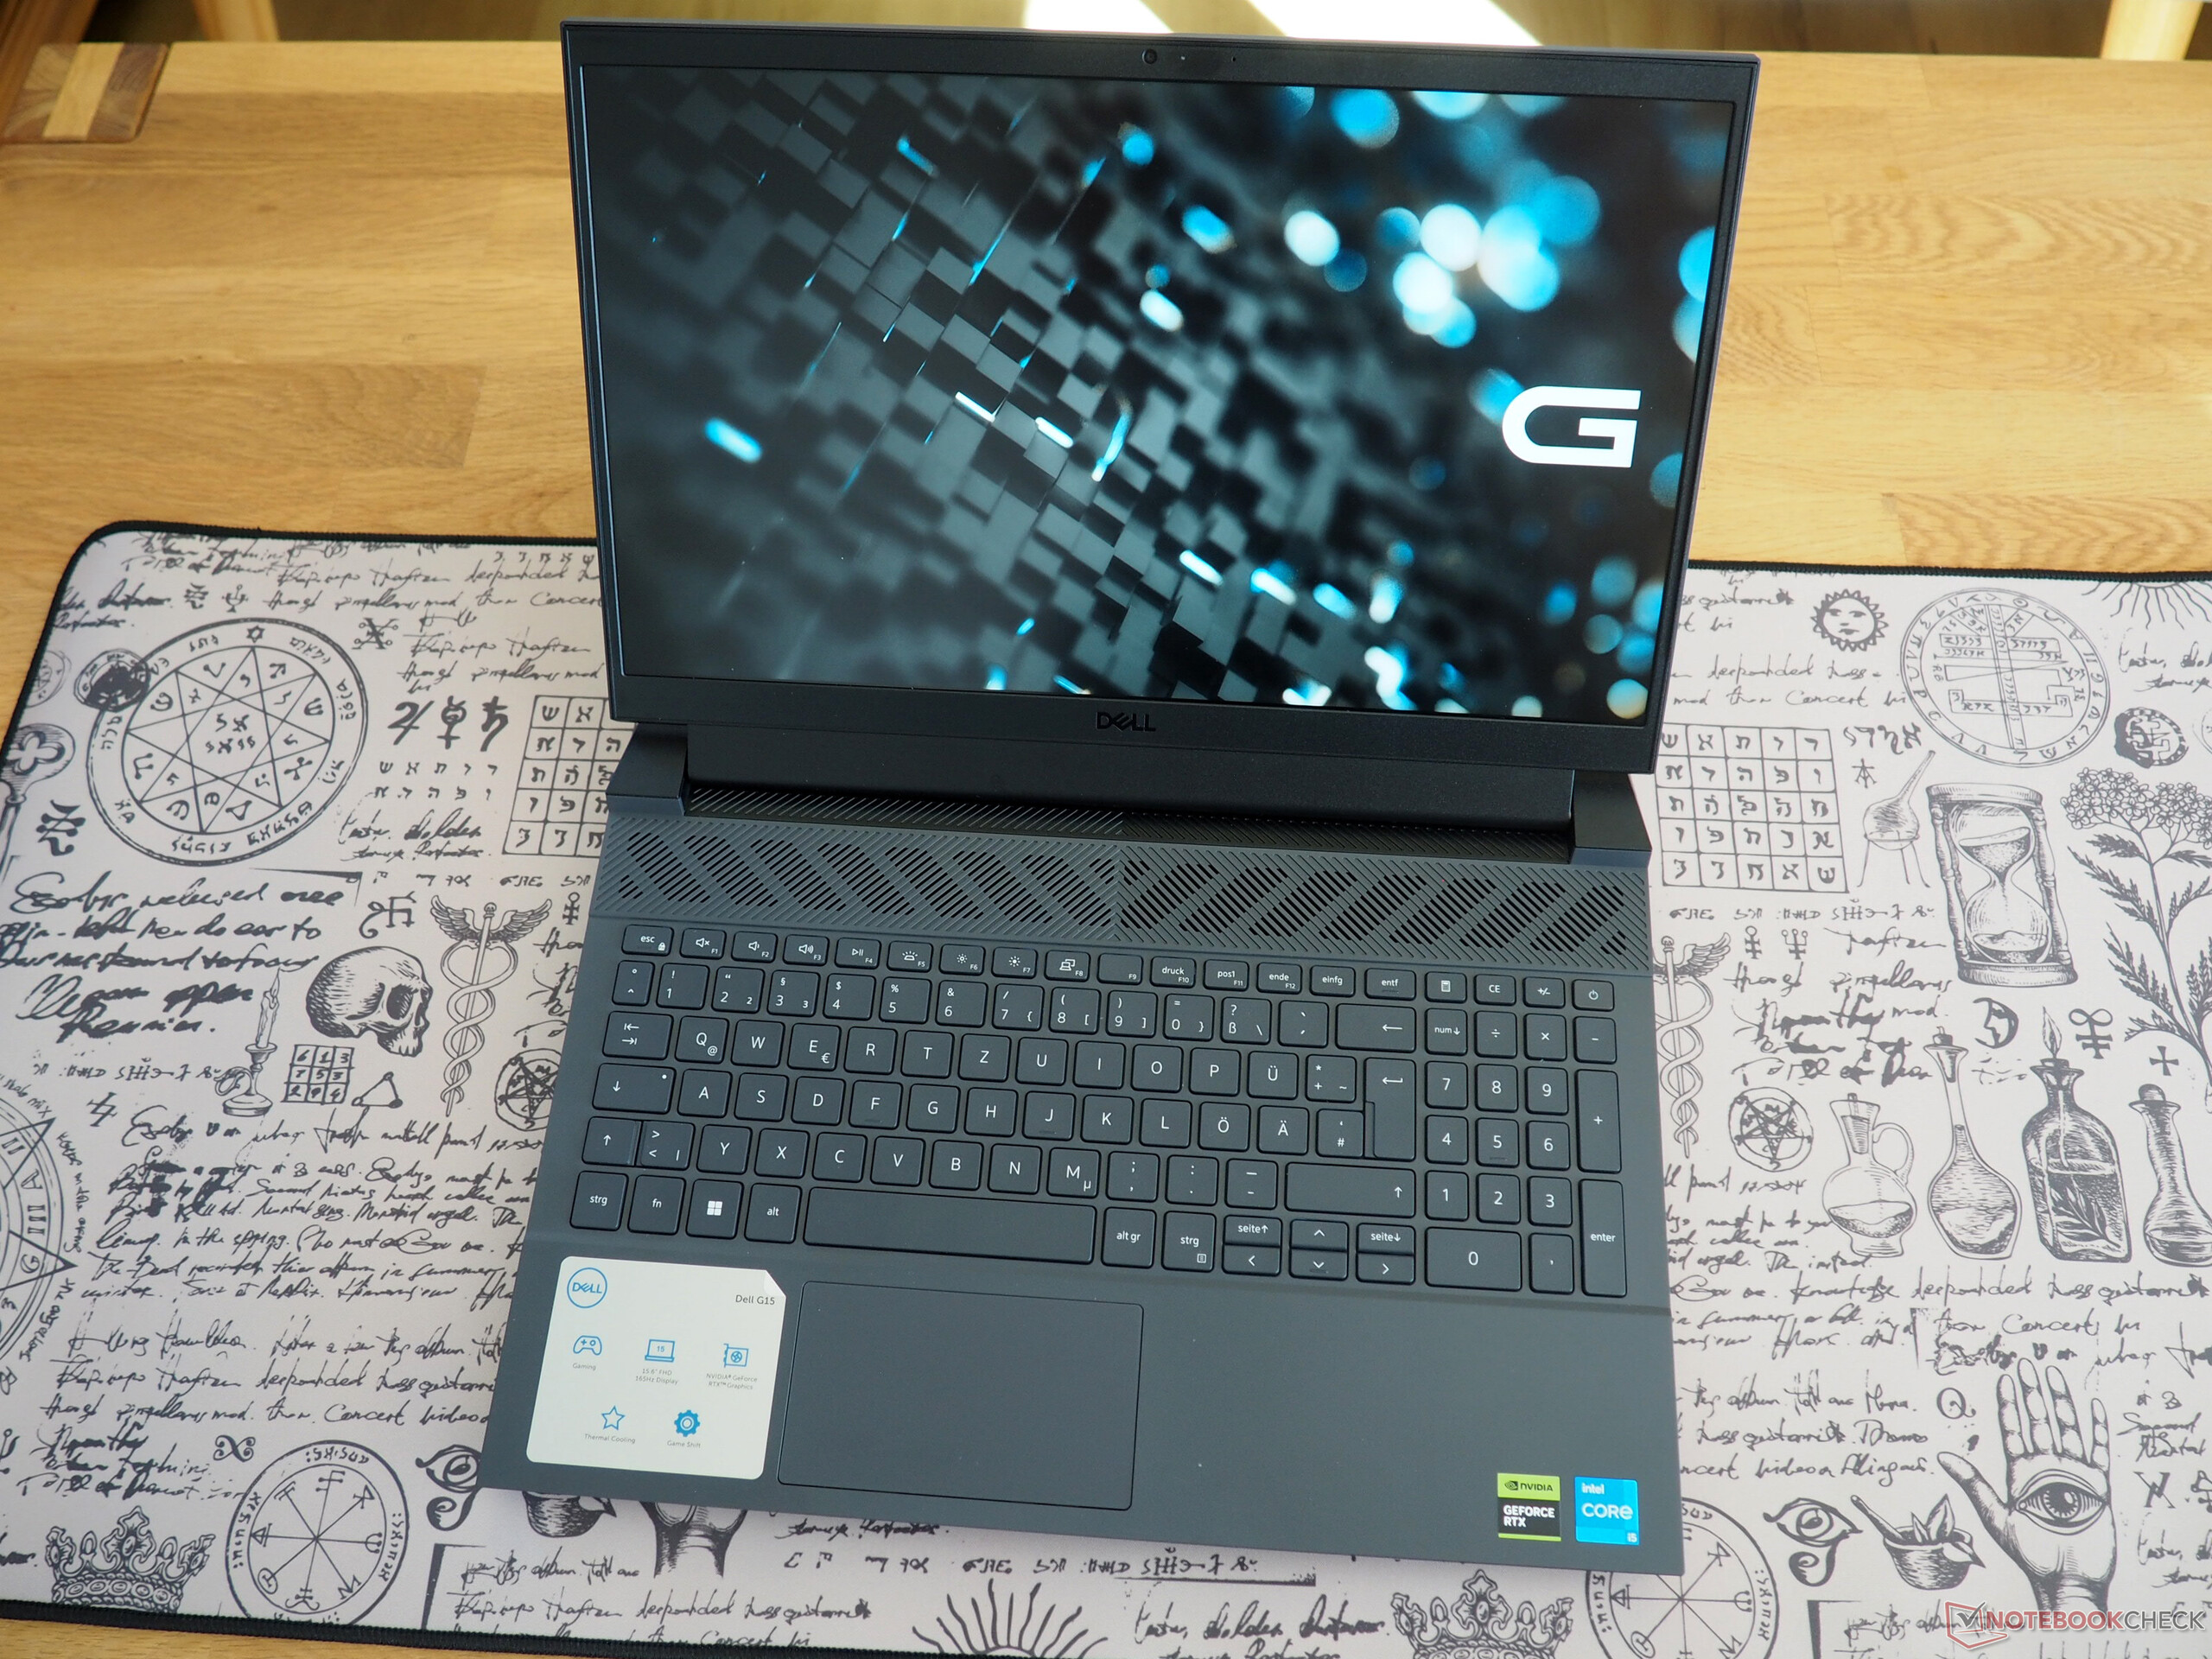
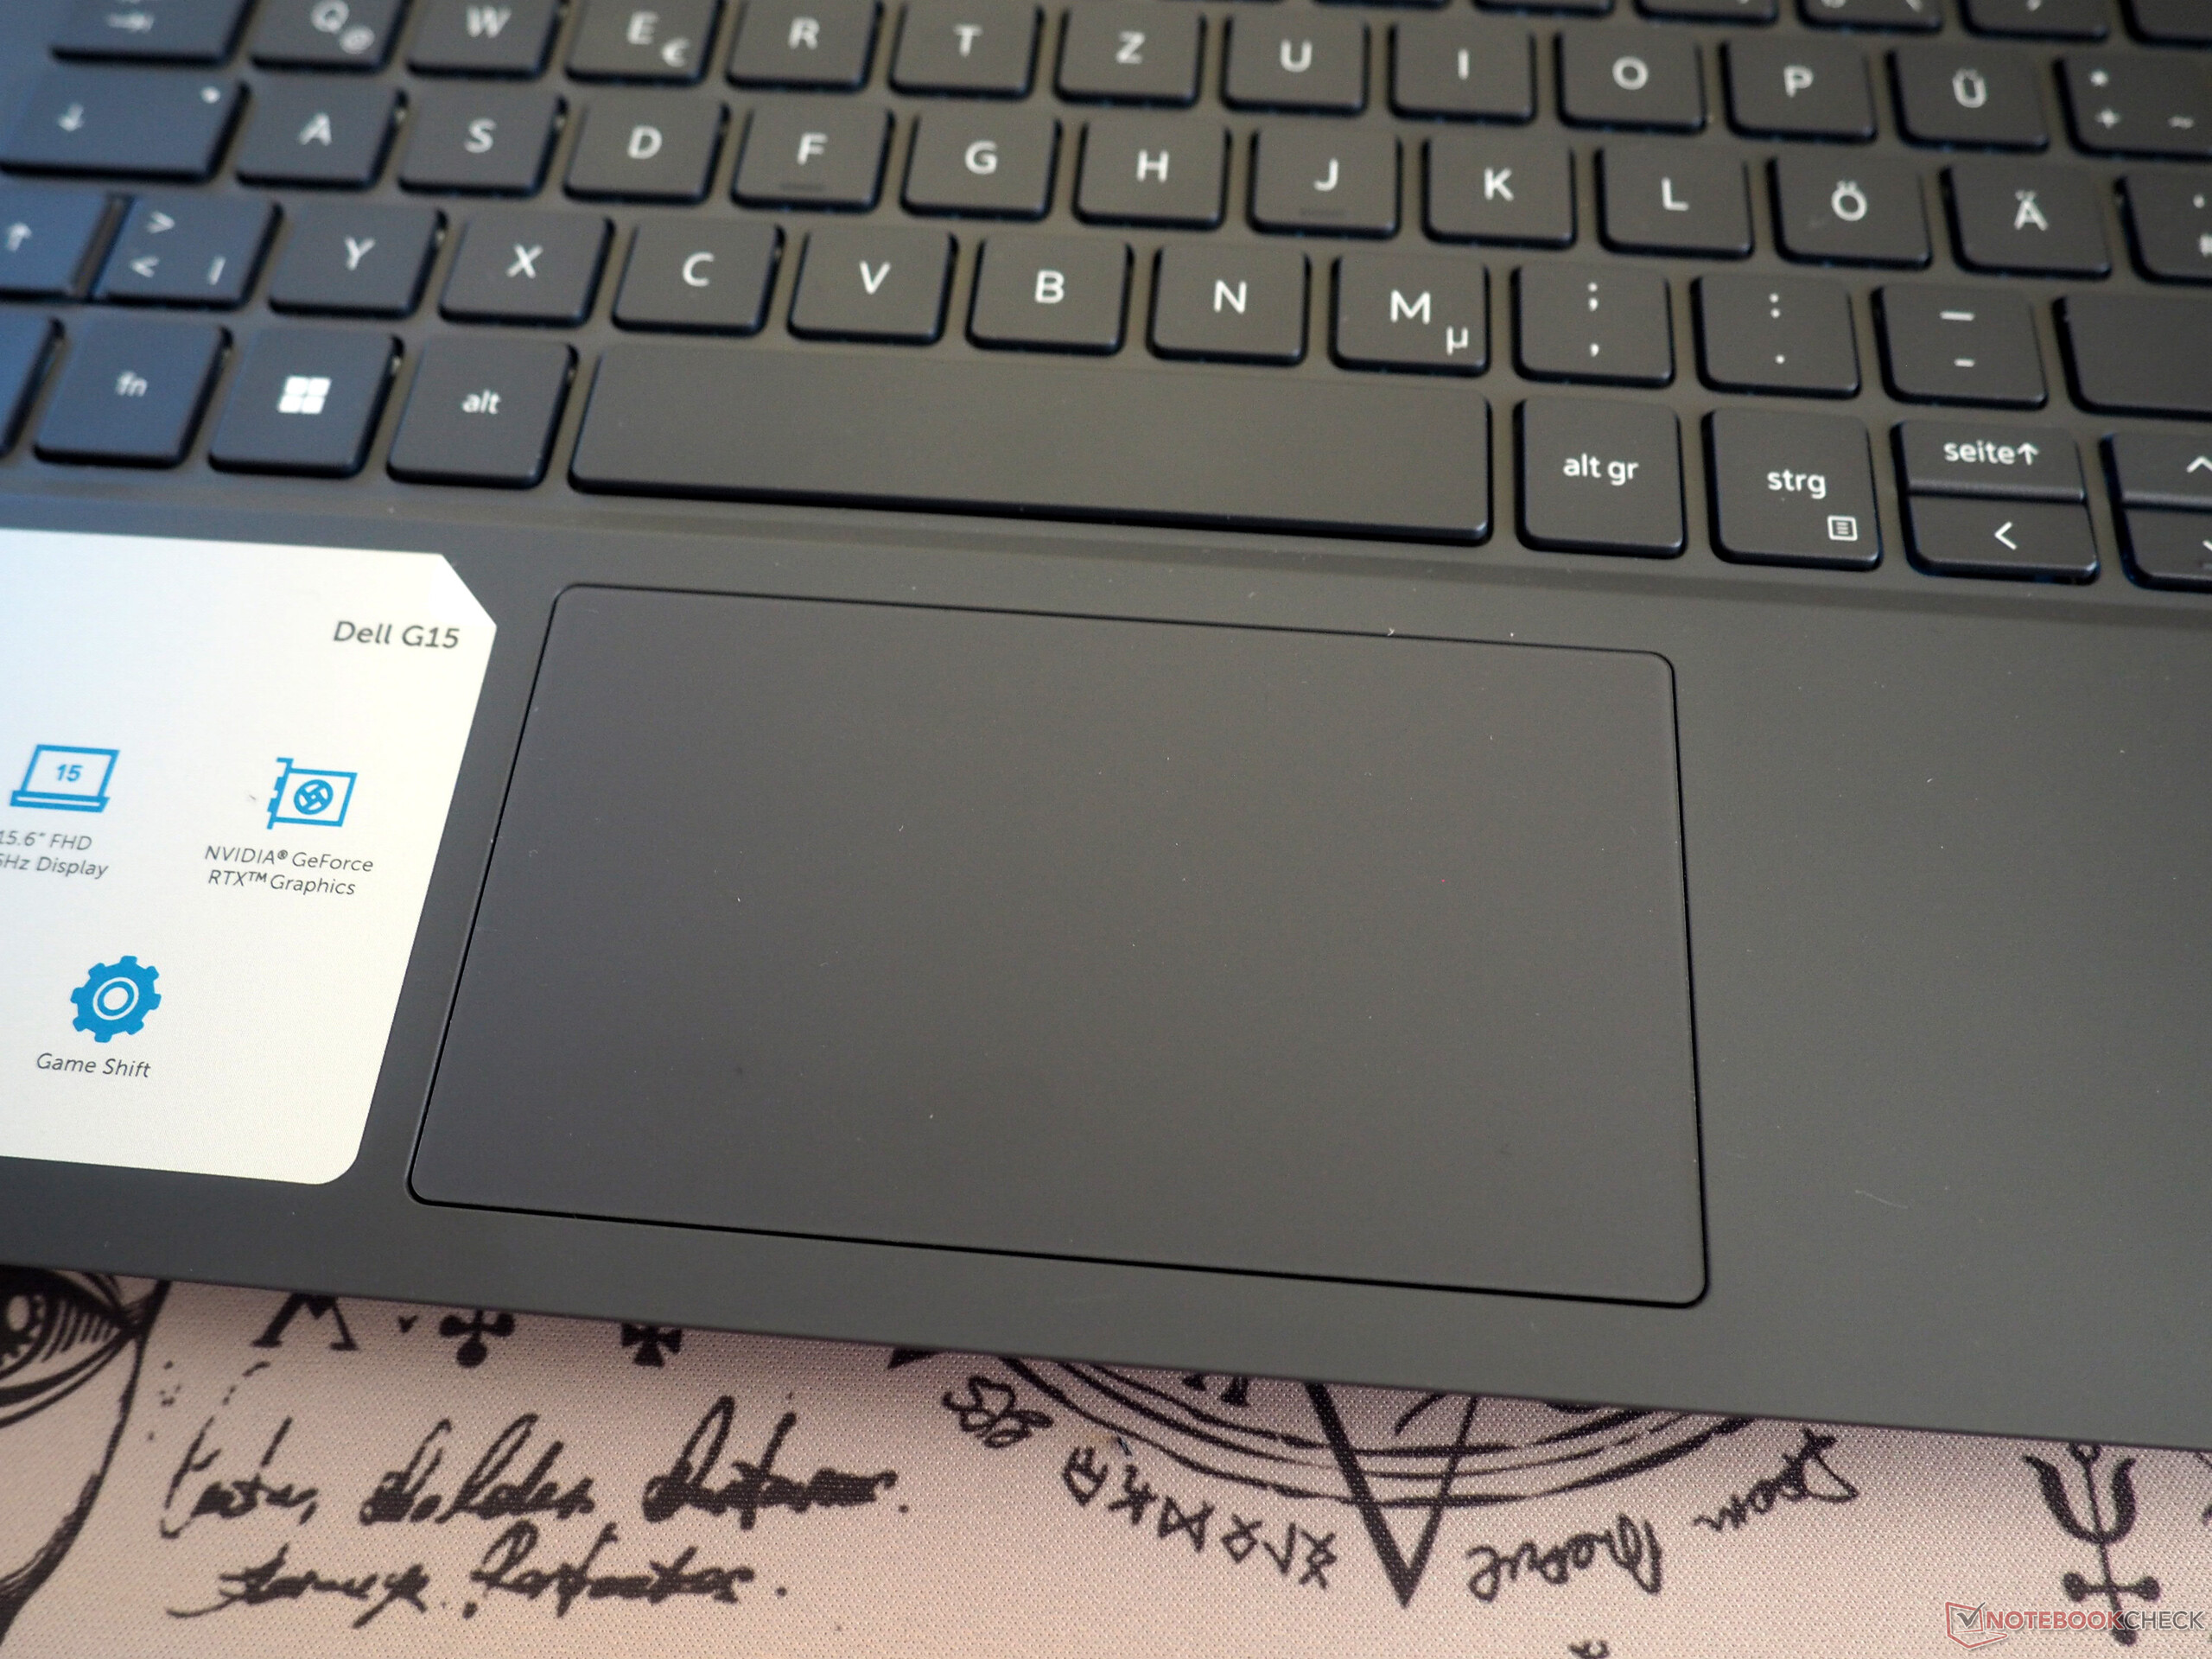
Inmatningsenheterna är solida utan att egentligen vara fantastiska. Trots de små piltangenterna gillar vi särskilt layouten på det tyska tangentbordet, som till stor del håller sig till standardarrangemanget och erbjuder en fullstor numpad. Skrivkänslan är ganska medioker och skulle kunna vara ännu fastare enligt vår åsikt. Den vita bakgrundsbelysningen med två ljusstyrkenivåer underlättar skrivandet i en mörk miljö.
Pekplatta
Pekplattan skulle också behöva lite arbete från Dell. Förutom den något blygsamma storleken (ca 10,5 x 6 cm, 4,1 x 2,4 in) har vi till exempel också synpunkter på den mycket lösa ytan. Med detta sagt ger pekplattan en acceptabel nivå av jämnhet och precision.
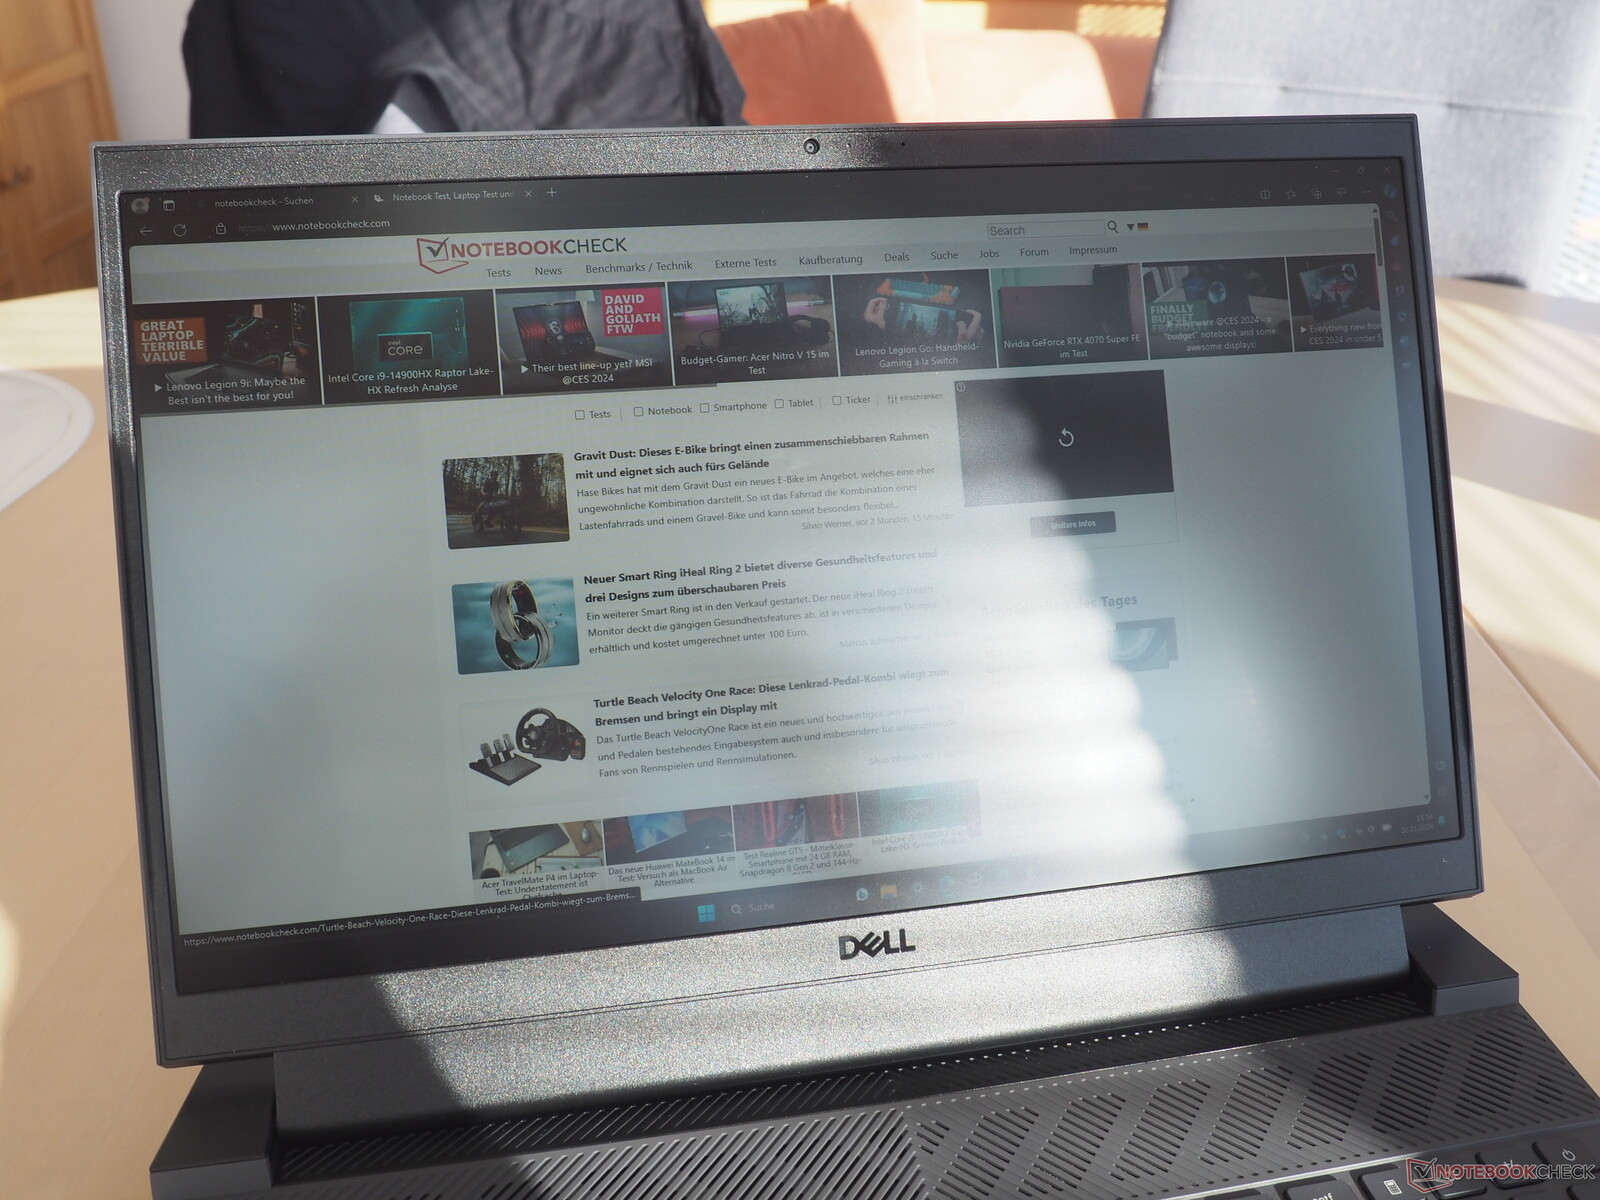
Display
Den bärbara datorn levereras också med en 165Hz-skärm. Panelen skiljer sig dock från den som används på G15 som vi tidigare har granskat (se tabell). Detta förklarar också varför vissa av de resultat som erhållits för de två skärmarna skiljer sig från varandra.
| |||||||||||||||||||||||||
Distribution av ljusstyrkan: 89 %
Mitt på batteriet: 389 cd/m²
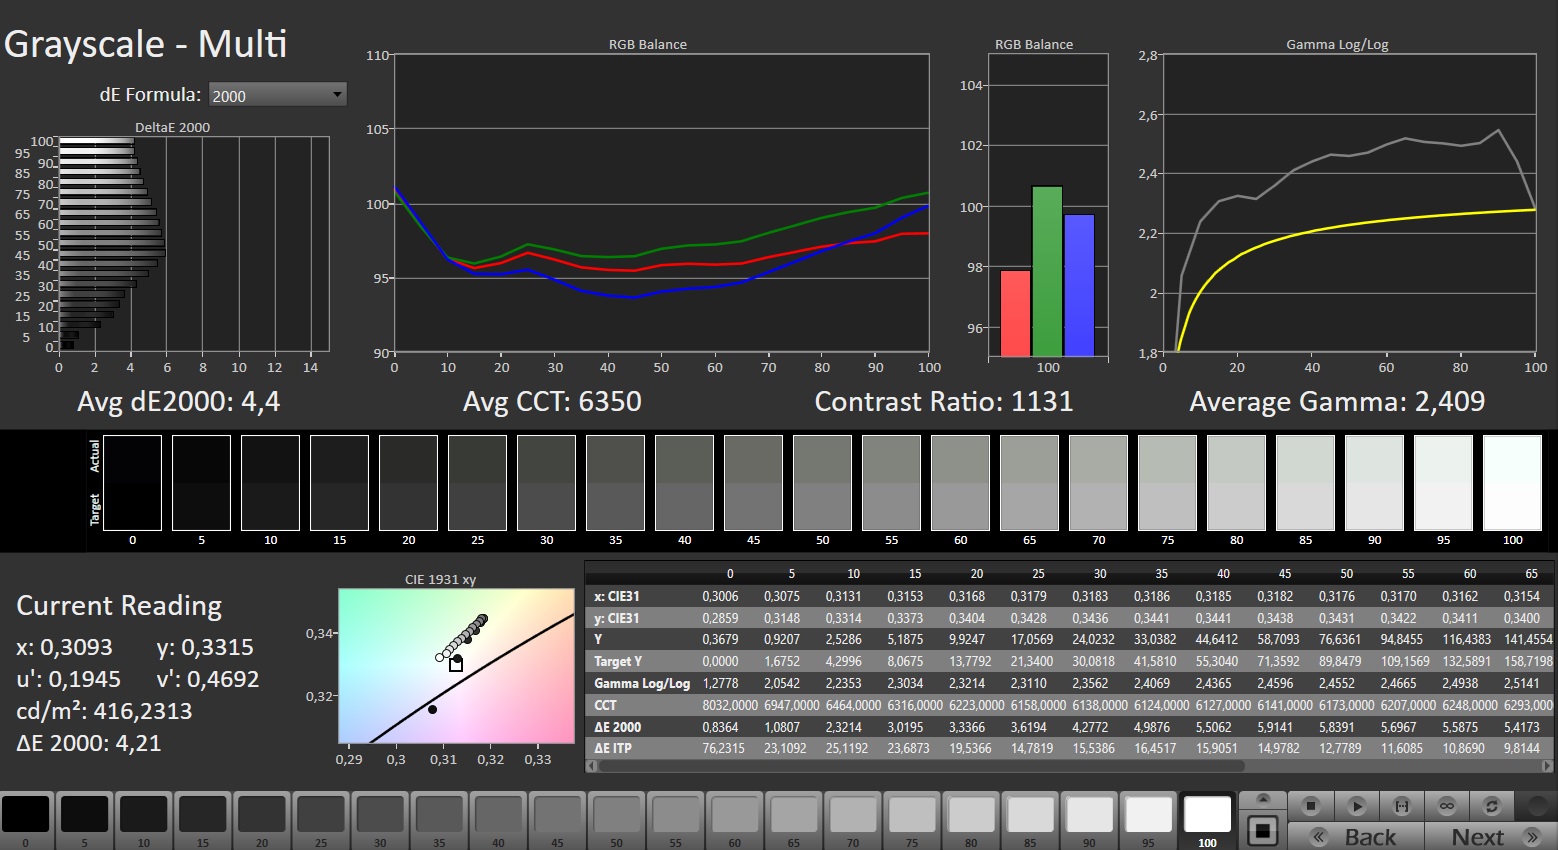
Kontrast: 1111:1 (Svärta: 0.35 cd/m²)
ΔE ColorChecker Calman: 3.08 | ∀{0.5-29.43 Ø4.71}
calibrated: 1.17
ΔE Greyscale Calman: 4.4 | ∀{0.09-98 Ø4.96}
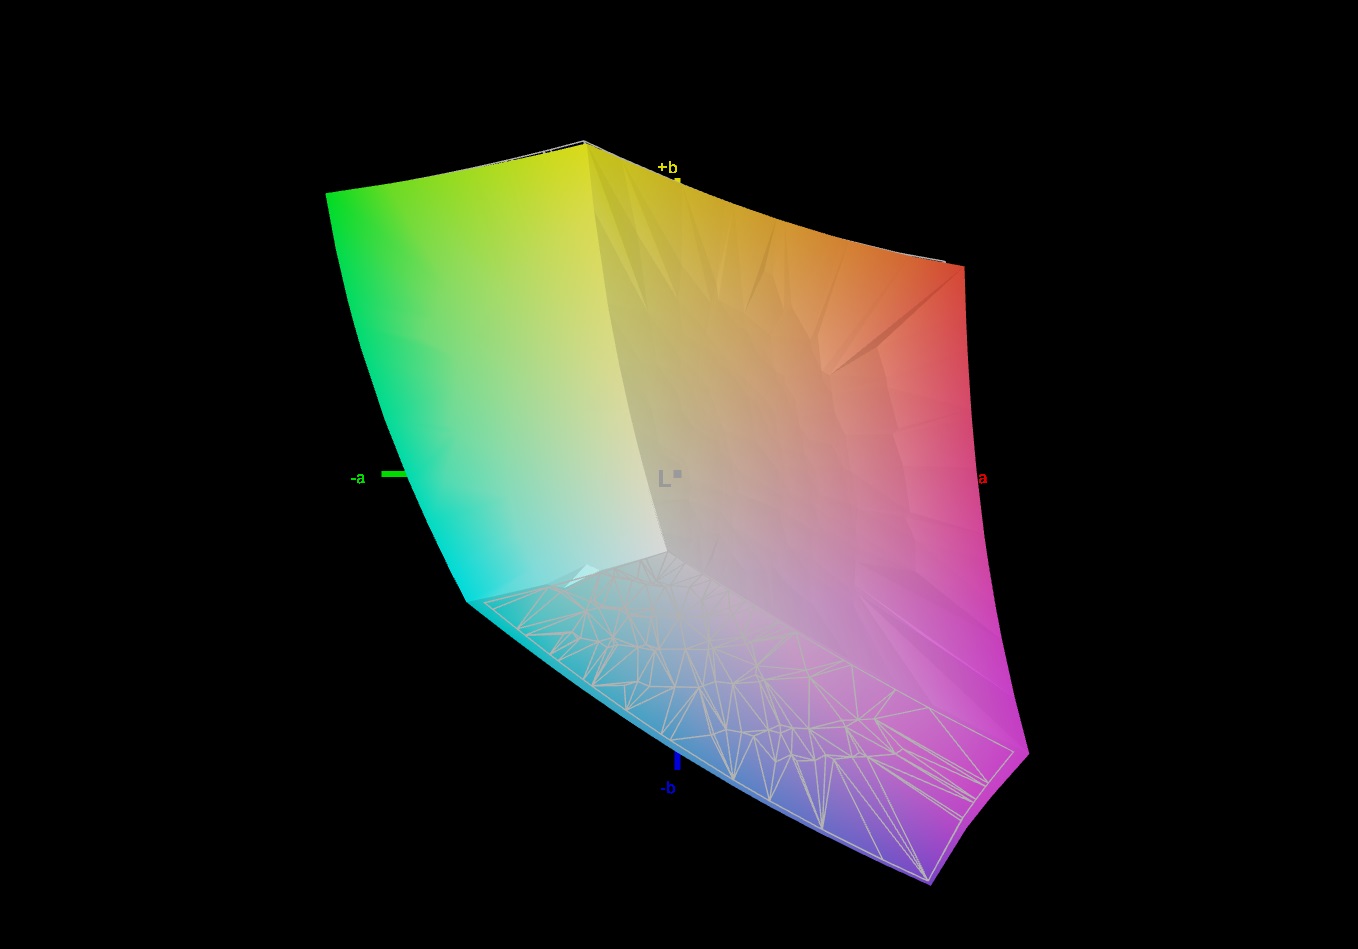
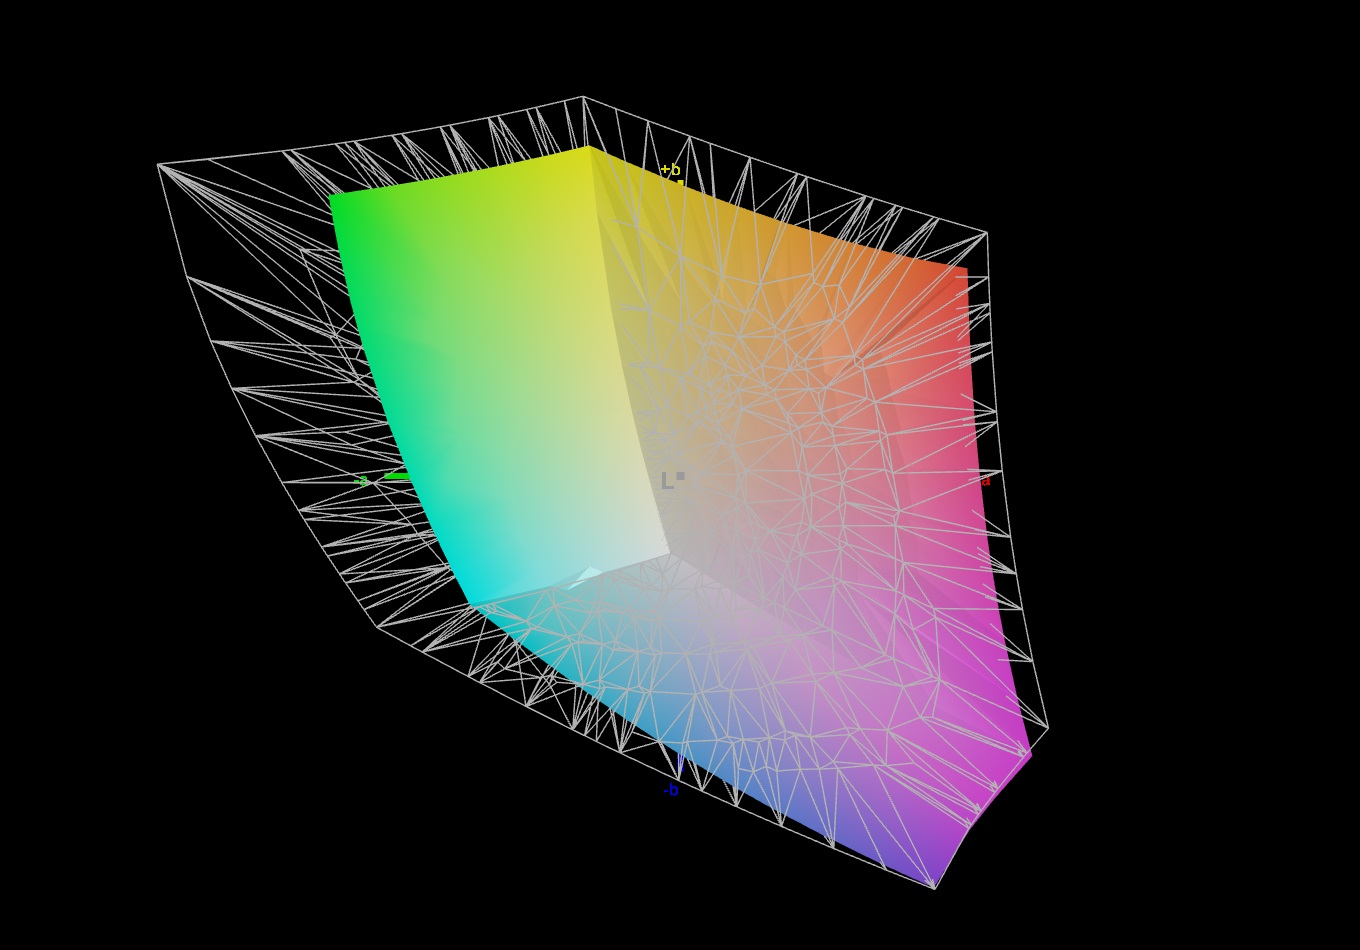
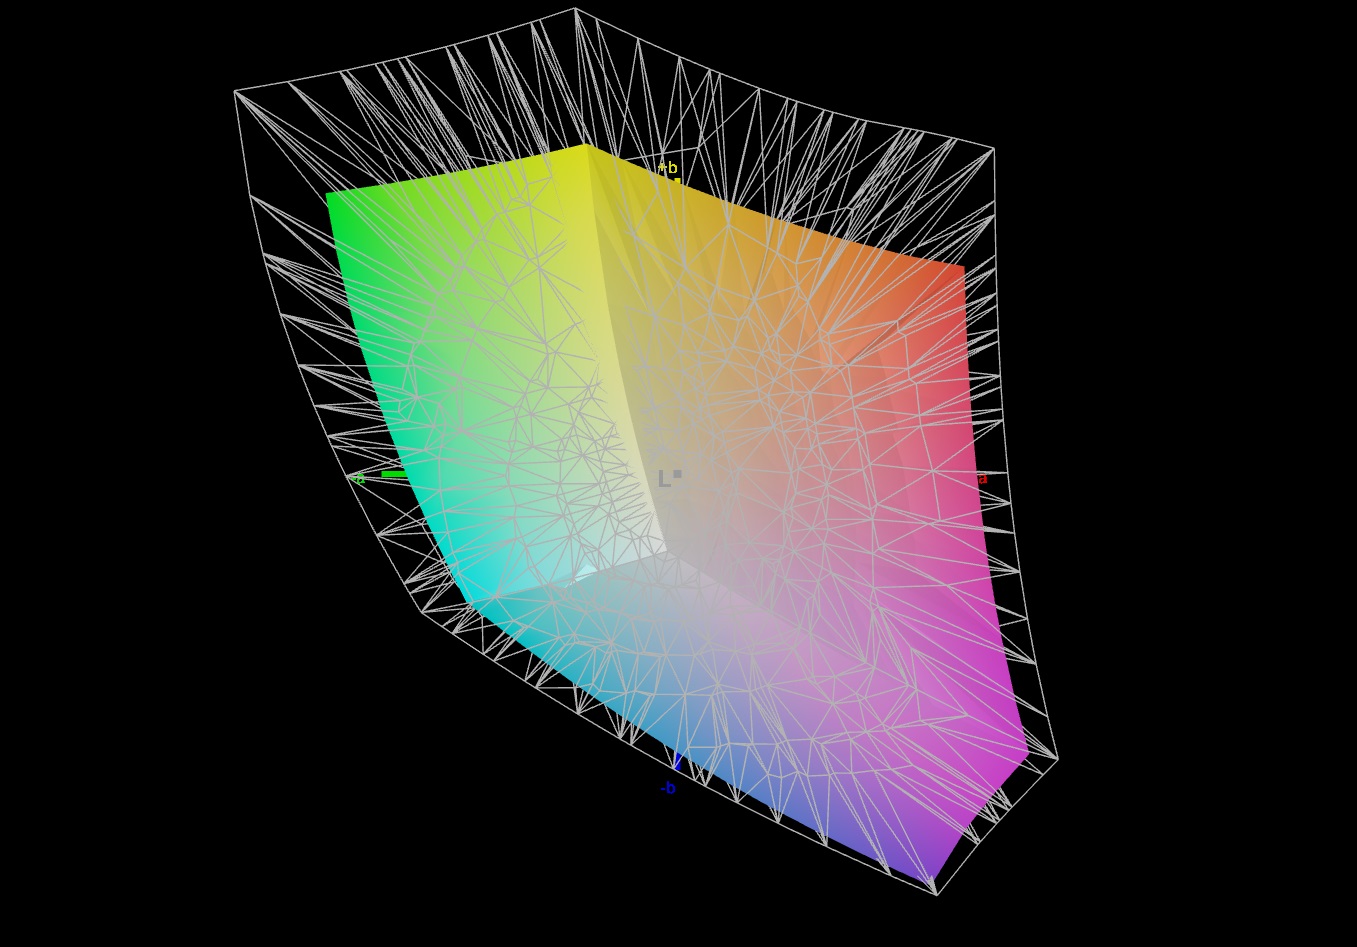
71.4% AdobeRGB 1998 (Argyll 3D)
99.3% sRGB (Argyll 3D)
71.1% Display P3 (Argyll 3D)
Gamma: 2.409
CCT: 6350 K
| Dell G15 5530, i5-13450HX RTX 4050 BOEhydis NV15NY9 (Dell 18PJX), IPS, 1920x1080, 15.6" | Medion Erazer Crawler E40 - MD 62518 BOE HF NV156FHM-N4G, IPS, 1920x1080, 15.6" | Lenovo LOQ 15IRH8 Core i7 BOE CQ NE156QHM-NY4, IPS, 2560x1440, 15.6" | Asus TUF A15 FA507 N156HMA-GA1, IPS, 1920x1080, 15.6" | Dell G15 5530 AUO B156HAN, IPS, 1920x1080, 15.6" | |
|---|---|---|---|---|---|
| Display | -12% | -5% | -6% | 2% | |
| Display P3 Coverage (%) | 71.1 | 61.4 -14% | 66.3 -7% | 64.9 -9% | 73.1 3% |
| sRGB Coverage (%) | 99.3 | 89.7 -10% | 96.6 -3% | 96.5 -3% | 98.4 -1% |
| AdobeRGB 1998 Coverage (%) | 71.4 | 63.2 -11% | 67.7 -5% | 66.6 -7% | 74.4 4% |
| Response Times | -19% | 8% | -234% | 40% | |
| Response Time Grey 50% / Grey 80% * (ms) | 8.5 ? | 8 ? 6% | 5 ? 41% | 30.4 ? -258% | 3.39 ? 60% |
| Response Time Black / White * (ms) | 6.7 ? | 9.6 ? -43% | 8.41 ? -26% | 20.8 ? -210% | 5.35 ? 20% |
| PWM Frequency (Hz) | 21620 ? | ||||
| Screen | -13% | -10% | 21% | -17% | |
| Brightness middle (cd/m²) | 389 | 364 -6% | 373 -4% | 288 -26% | 320 -18% |
| Brightness (cd/m²) | 374 | 351 -6% | 365 -2% | 271 -28% | 316 -16% |
| Brightness Distribution (%) | 89 | 91 2% | 90 1% | 91 2% | 94 6% |
| Black Level * (cd/m²) | 0.35 | 0.43 -23% | 0.33 6% | 0.17 51% | 0.21 40% |
| Contrast (:1) | 1111 | 847 -24% | 1130 2% | 1694 52% | 1524 37% |
| Colorchecker dE 2000 * | 3.08 | 3.98 -29% | 4.19 -36% | 1.9 38% | 4.55 -48% |
| Colorchecker dE 2000 max. * | 5.44 | 6.38 -17% | 8.47 -56% | 3.3 39% | 9.83 -81% |
| Colorchecker dE 2000 calibrated * | 1.17 | 1.36 -16% | 1.07 9% | 0.9 23% | 1.51 -29% |
| Greyscale dE 2000 * | 4.4 | 4.39 -0% | 5 -14% | 2.7 39% | 6.2 -41% |
| Gamma | 2.409 91% | 2.58 85% | 1.93 114% | 2.32 95% | 2.07 106% |
| CCT | 6350 102% | 7316 89% | 7520 86% | 6535 99% | 6479 100% |
| Totalt genomsnitt (program/inställningar) | -15% /
-14% | -2% /
-7% | -73% /
-21% | 8% /
-5% |
* ... mindre är bättre
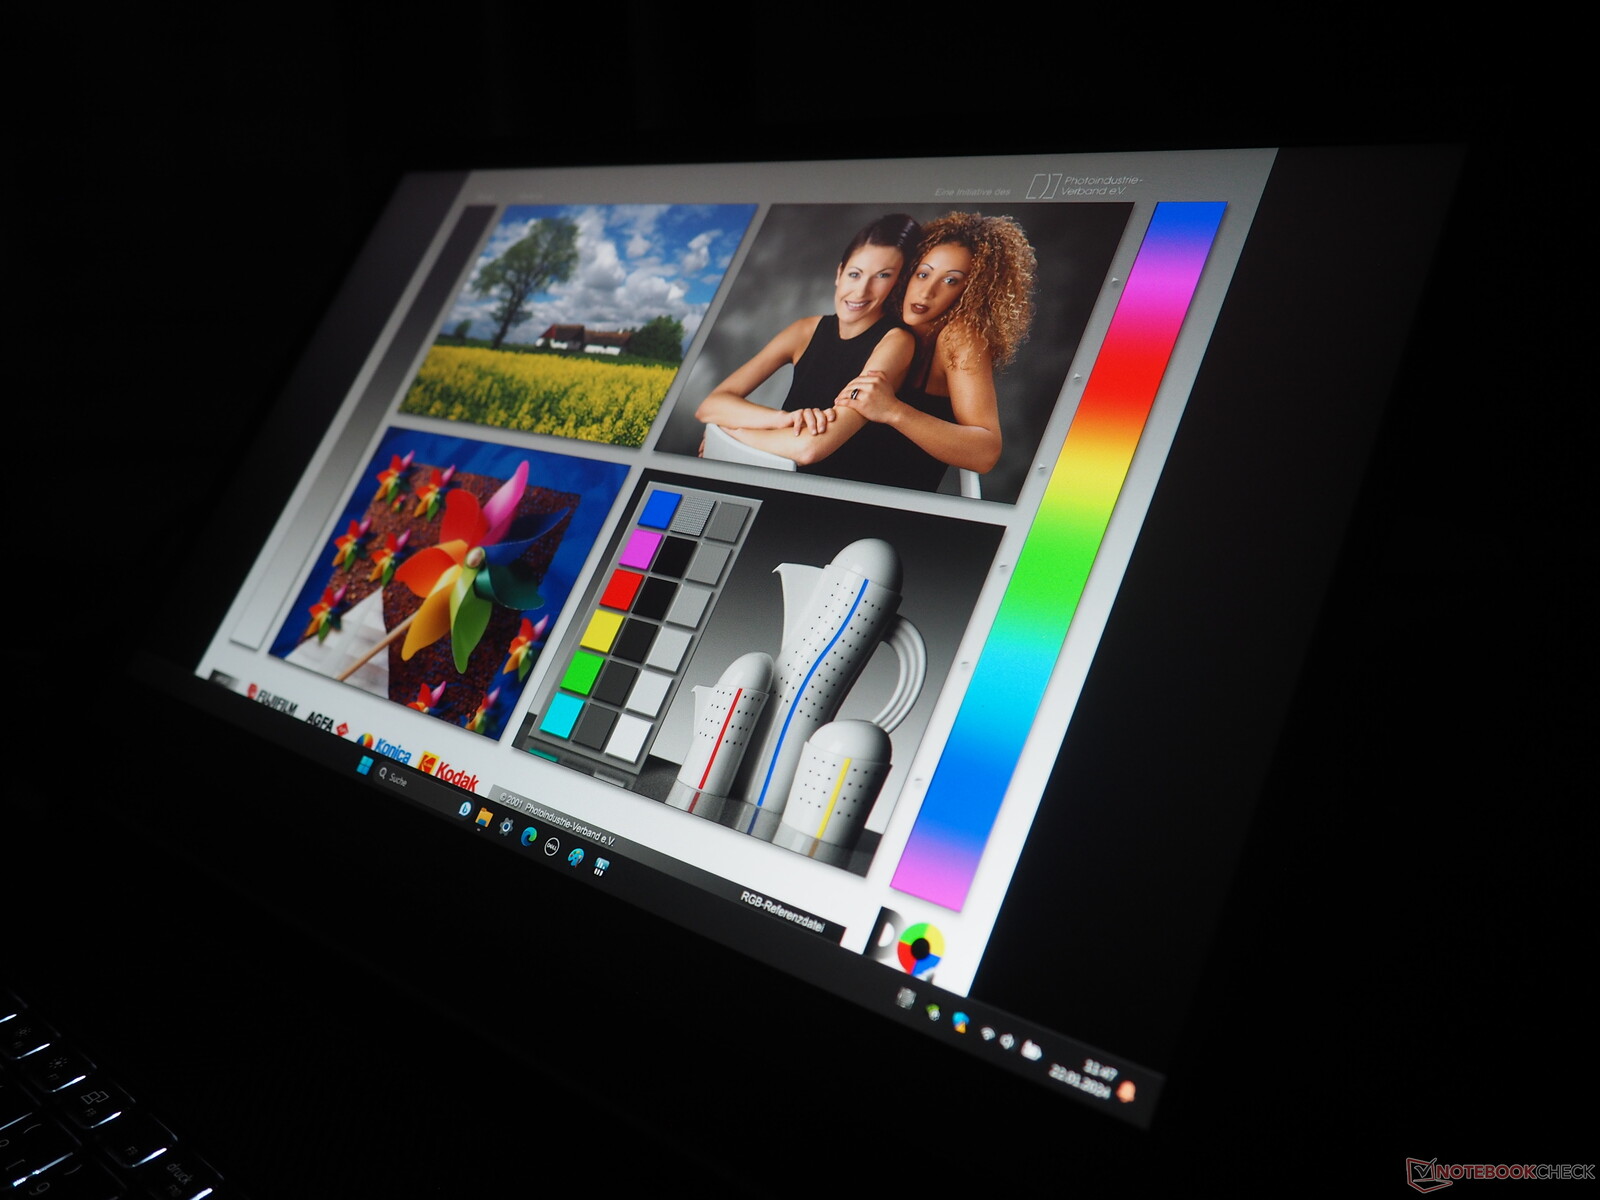
Medan den nuvarande panelen har en något sämre svartnivå (0,35 jämfört med 0,21 cd/m²), är dess genomsnittliga maximala ljusstyrka en aning högre (374 jämfört med 316 cd/m²). Den andra G15-modellen har bättre kontrast och responstid än testpanelen. Trots detta är en kontrast på 1 111:1 och en grå-till-grå responstid på 8,5 ms respektabelt för en IPS-panel.
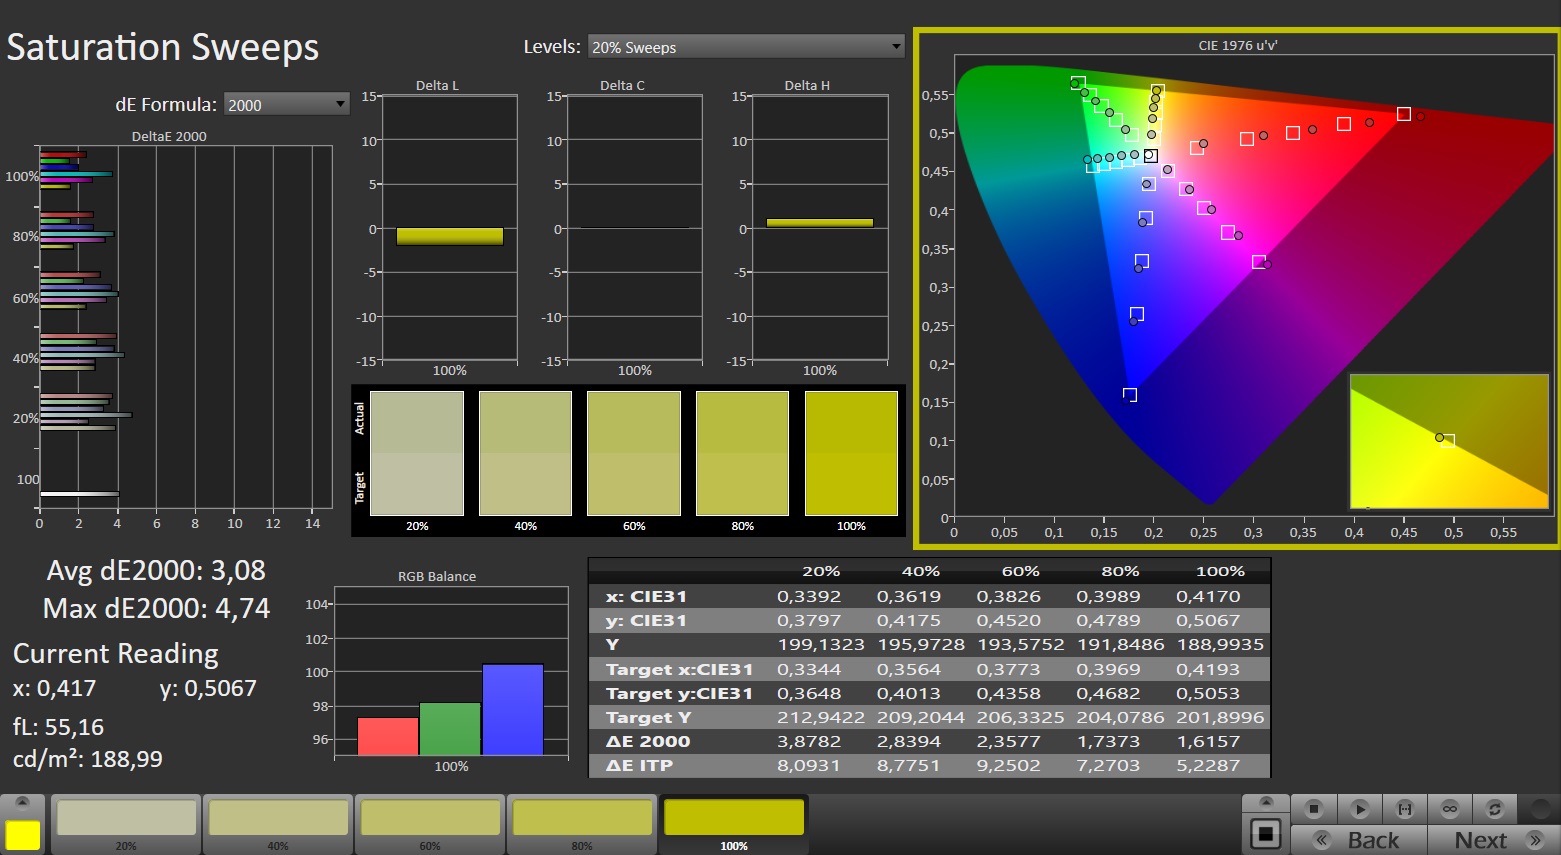
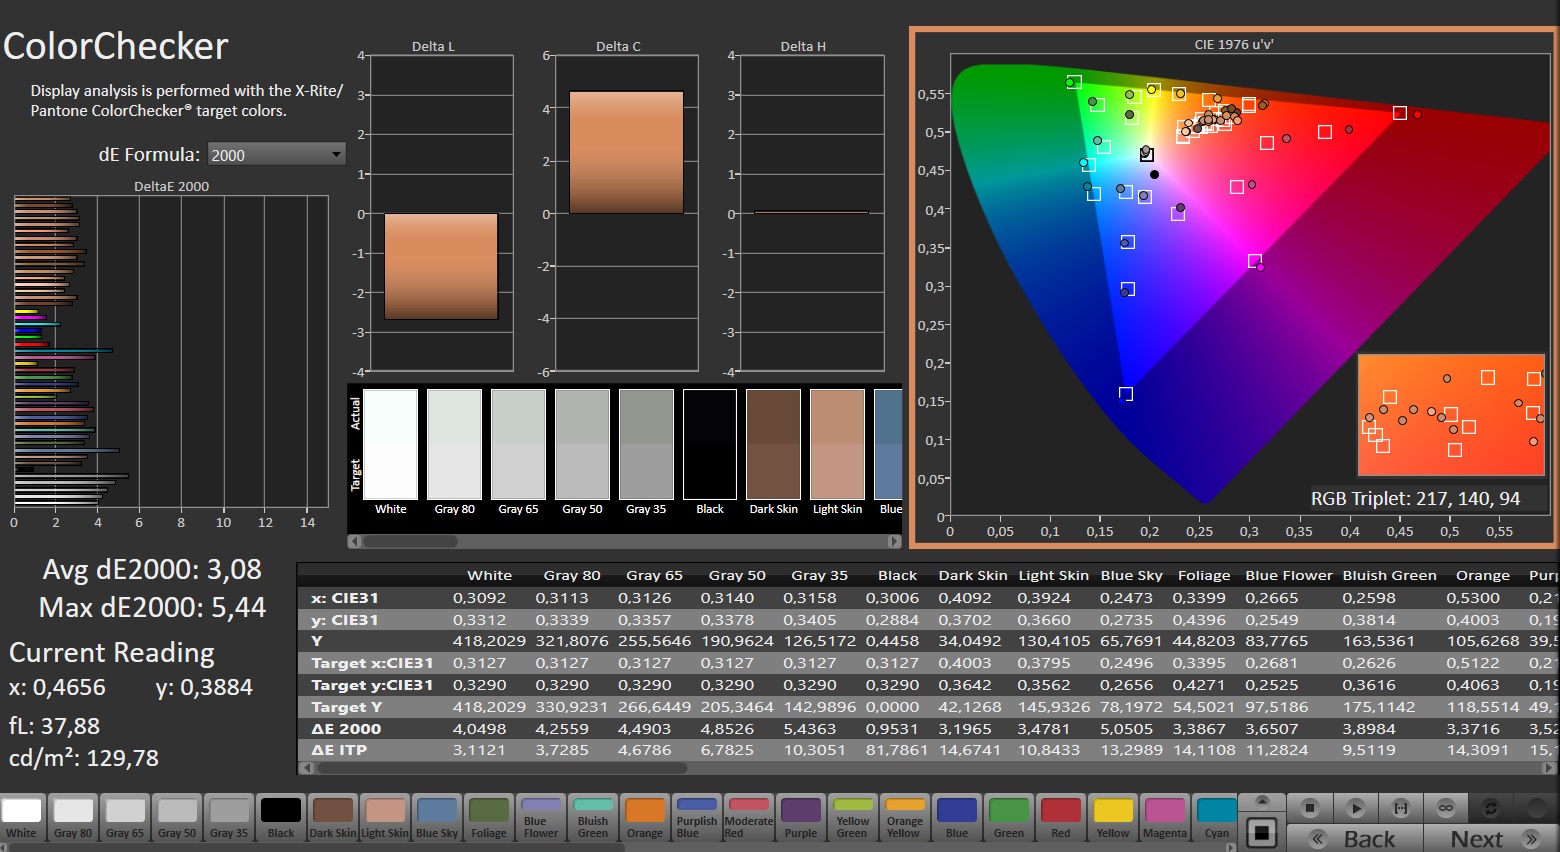
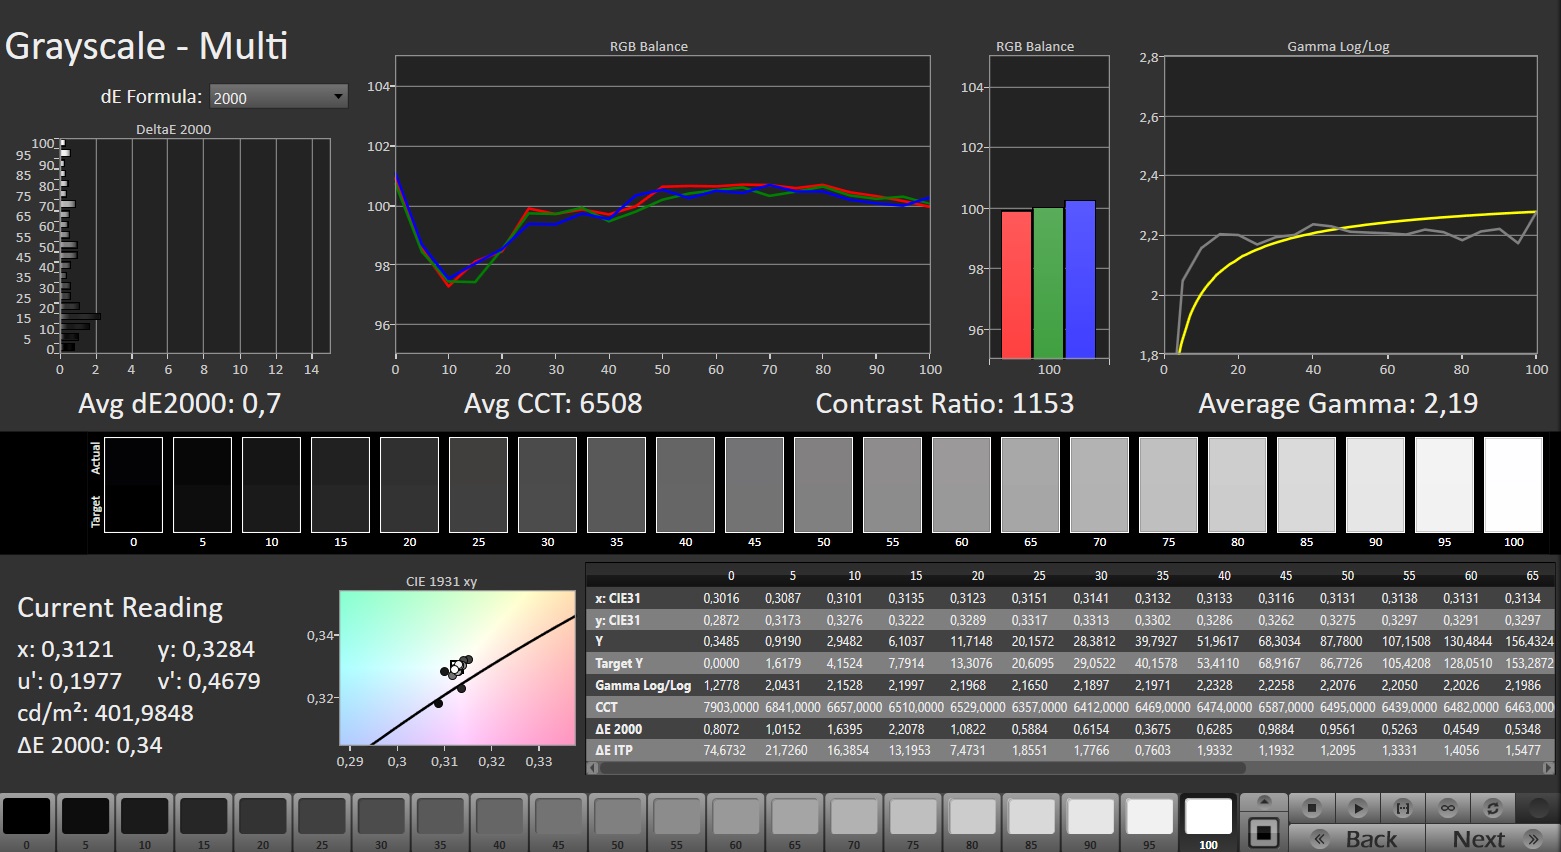
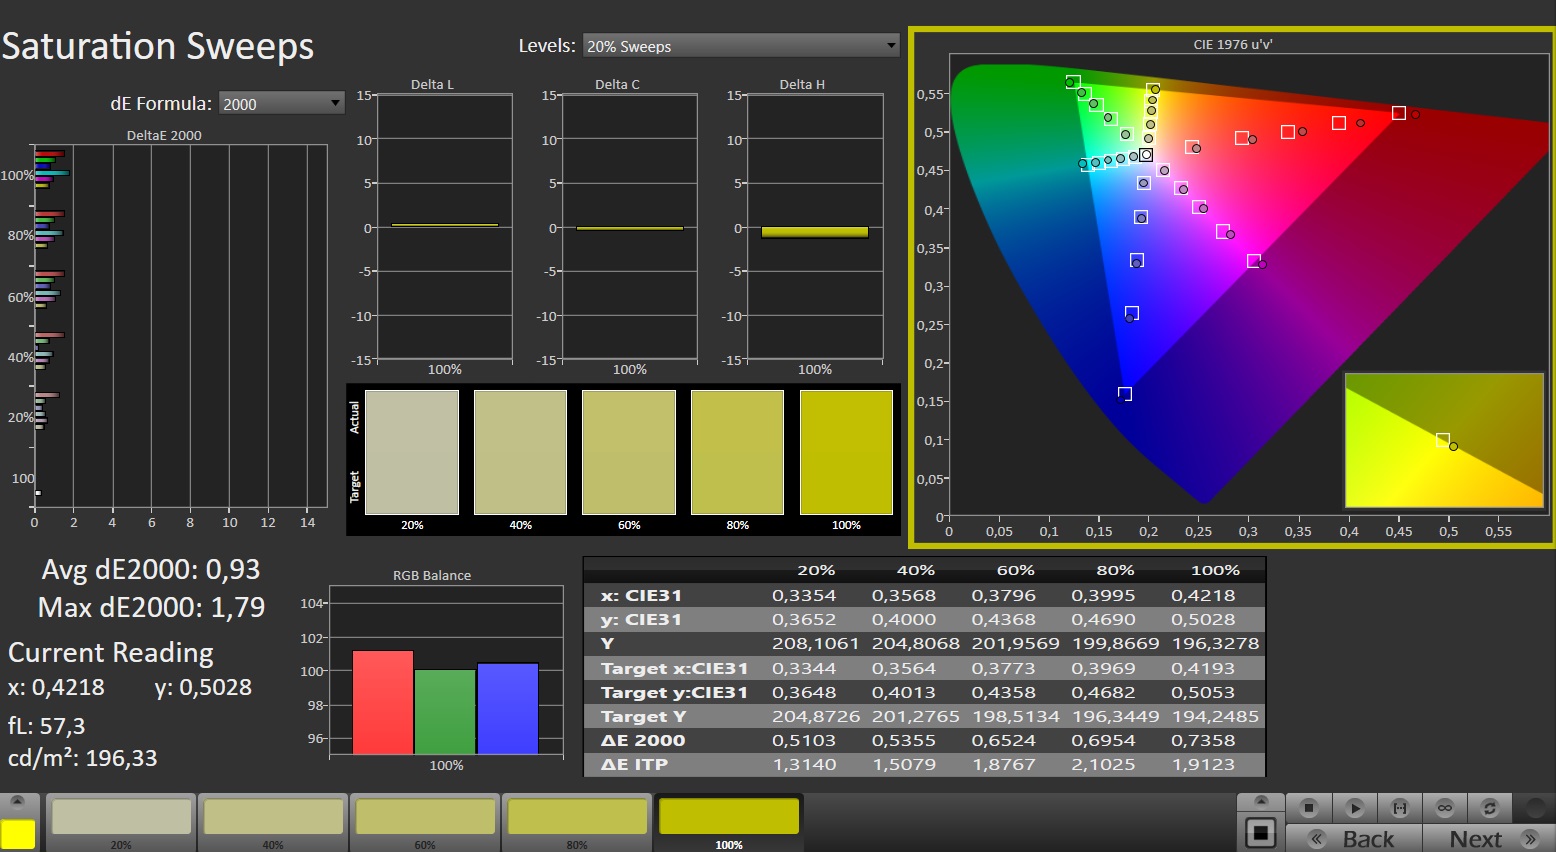
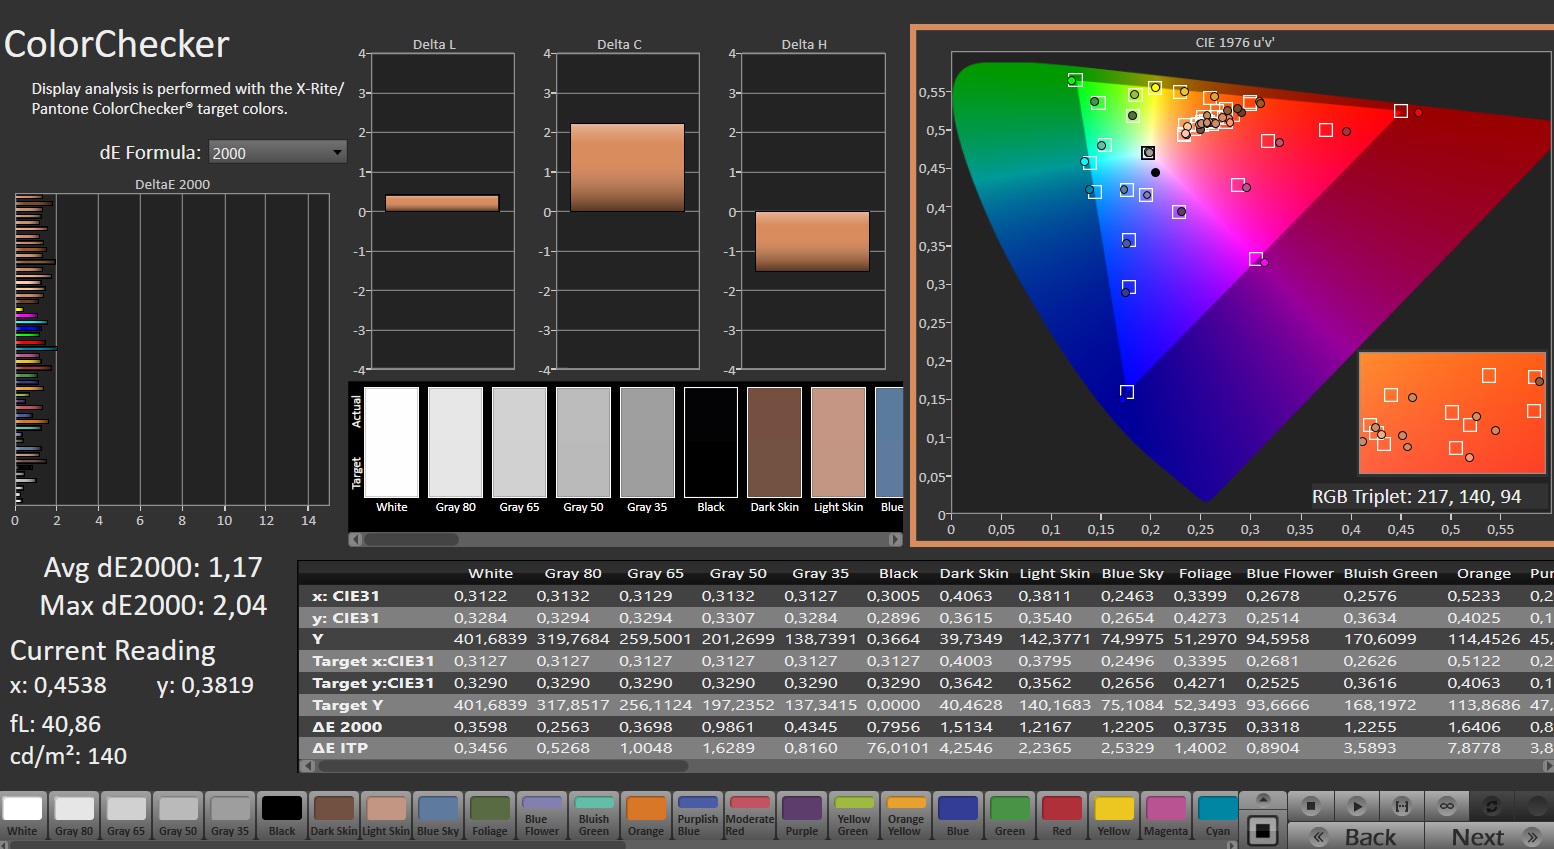
"Respektabel" är också en passande beskrivning för färgtäckningen: även om 15-tumsdatorn inte helt kan återge DCI-P3- och AdobeRGB-färgrymderna, är det inte självklart att ha nästan 100 % sRGB-täckning i prisklassen 1 000 euro (1 090 USD), vilket visas av Acer Nitro V 15 som vi nyligen recenserade, till exempel.
Betraktningsvinkeln är ganska typisk för en IPS-skärm, dvs. ganska bra. De flesta köpare bör också vara nöjda med färgåtergivningen.
Visa svarstider
| ↔ Svarstid svart till vitt | ||
|---|---|---|
| 6.7 ms ... stiga ↗ och falla ↘ kombinerat | ↗ 3.1 ms stiga | 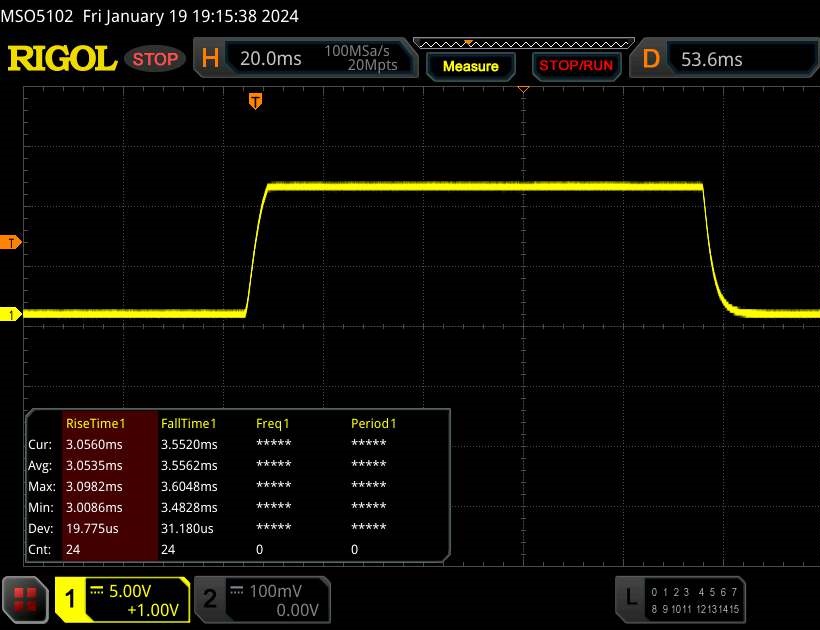 |
| ↘ 3.6 ms hösten | ||
| Skärmen visar väldigt snabba svarsfrekvenser i våra tester och borde vara mycket väl lämpad för fartfyllt spel. I jämförelse sträcker sig alla testade enheter från 0.1 (minst) till 240 (maximalt) ms. » 21 % av alla enheter är bättre. Det betyder att den uppmätta svarstiden är bättre än genomsnittet av alla testade enheter (19.8 ms). | ||
| ↔ Svarstid 50 % grått till 80 % grått | ||
| 8.5 ms ... stiga ↗ och falla ↘ kombinerat | ↗ 4.2 ms stiga | 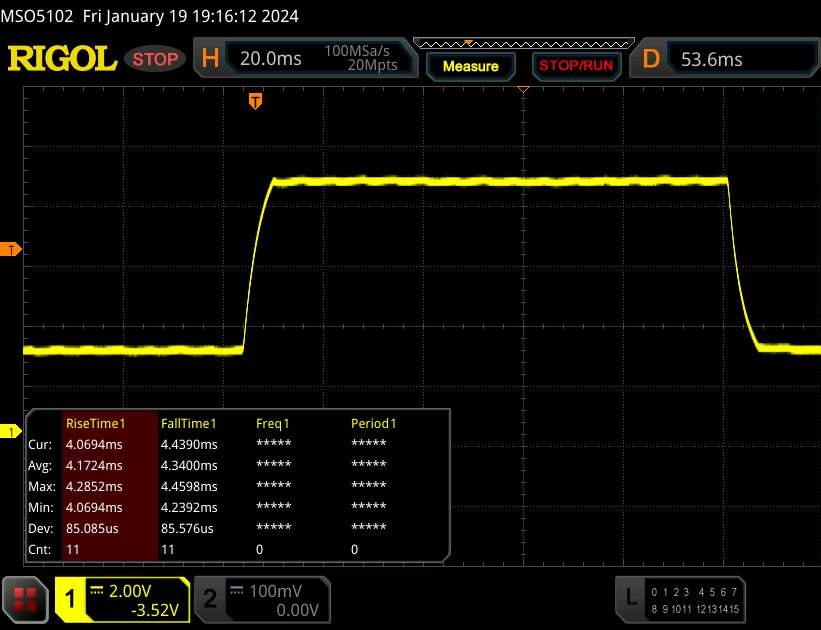 |
| ↘ 4.3 ms hösten | ||
| Skärmen visar snabba svarsfrekvenser i våra tester och bör passa för spel. I jämförelse sträcker sig alla testade enheter från 0.165 (minst) till 636 (maximalt) ms. » 22 % av alla enheter är bättre. Det betyder att den uppmätta svarstiden är bättre än genomsnittet av alla testade enheter (31 ms). | ||
Skärmflimmer / PWM (Puls-Width Modulation)
| Skärmflimmer / PWM upptäcktes inte | 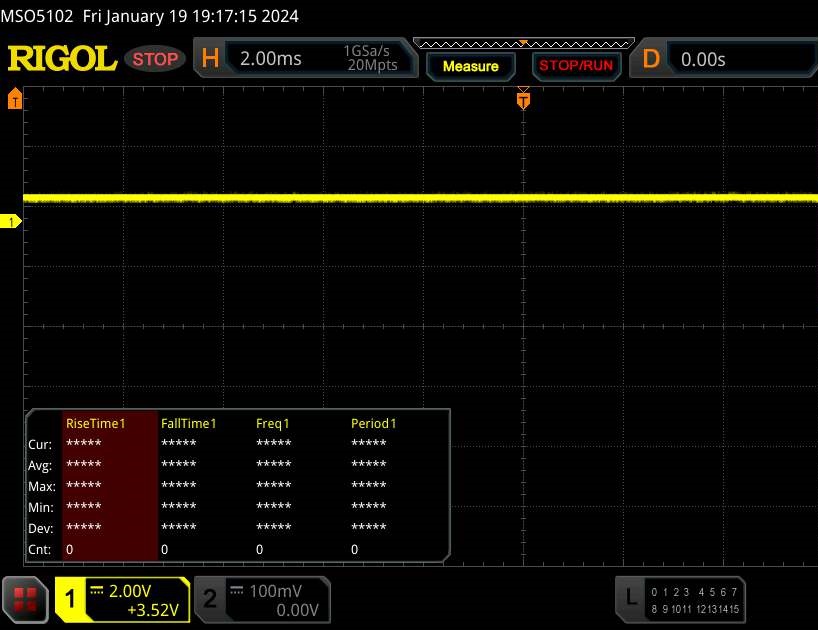 | ||
Som jämförelse: 52 % av alla testade enheter använder inte PWM för att dämpa skärmen. Om PWM upptäcktes mättes ett medelvärde av 7757 (minst: 5 - maximum: 343500) Hz. | |||
Prestanda
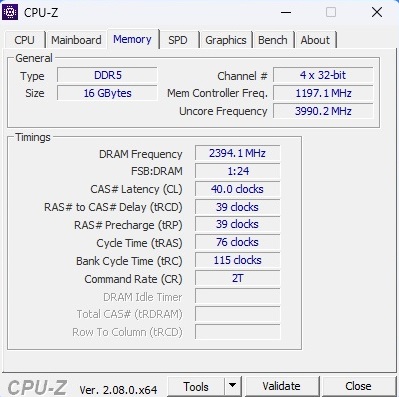
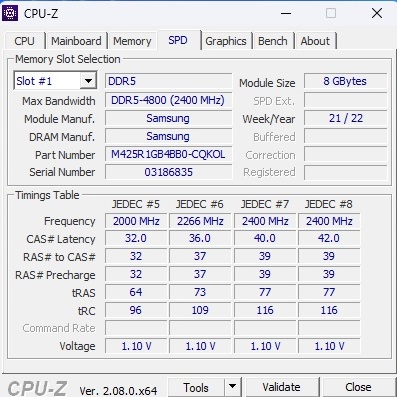
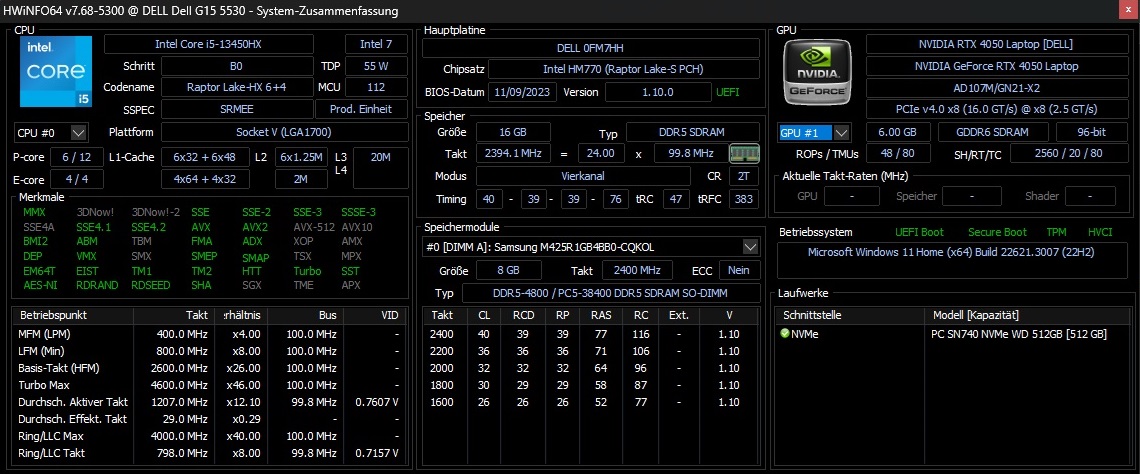
Oavsett om den har en RTX 4050 eller RTX 4060 inuti, är Dell G15 5530 fortfarande en bärbar dator i mellanklassen. De 16 GB DDR5-minne är absolut tillräckligt för speländamål för tillfället; som nämnts ovan kan den något magra 512 GB SSD-lagringen utökas genom att lägga till en större M.2-enhet.
Testvillkor
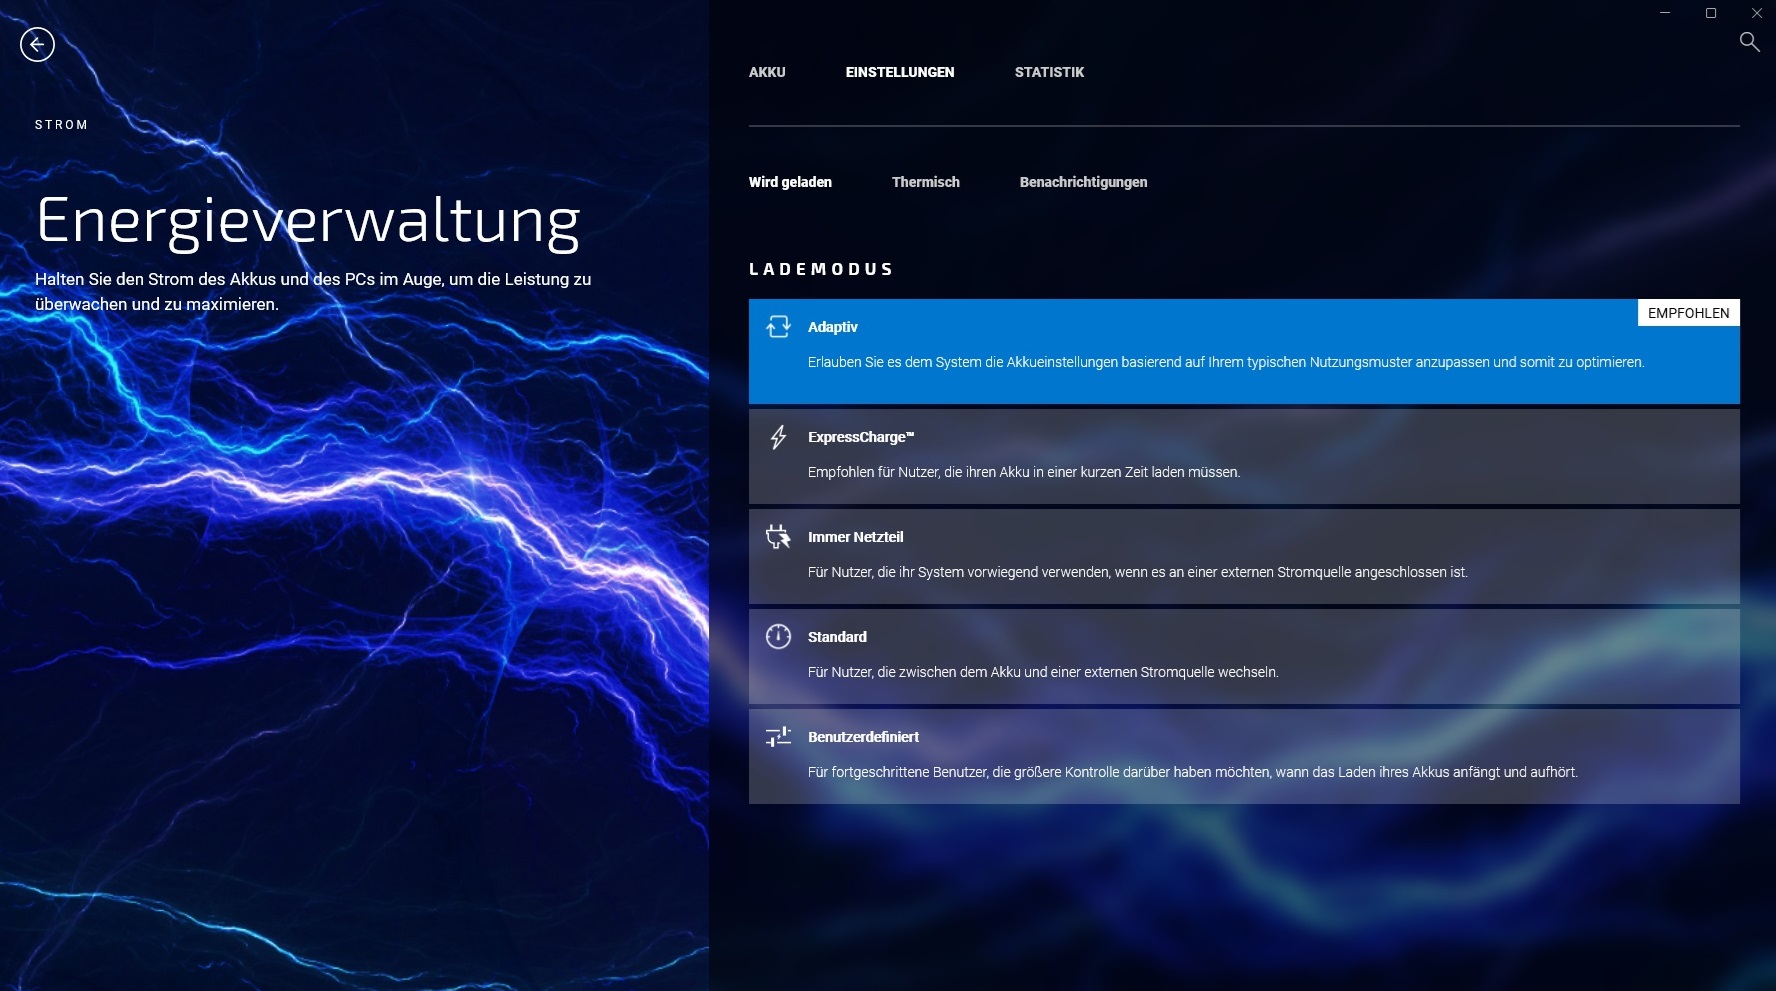
Det finns flera strömlägen dolda bakom olika menyer i den förinstallerade Dell-programvaran. Enligt våra mätningar har dessa lägen inte någon inverkan på 3D-prestandan, utan påverkar främst hur högt datorn låter (se tabell). Alla våra tester utfördes således i "Optimerat" läge, vilket är aktiverat som standard direkt ur lådan. Alternativt erbjuder Alienware Command Center också en hel mängd anpassningsalternativ.
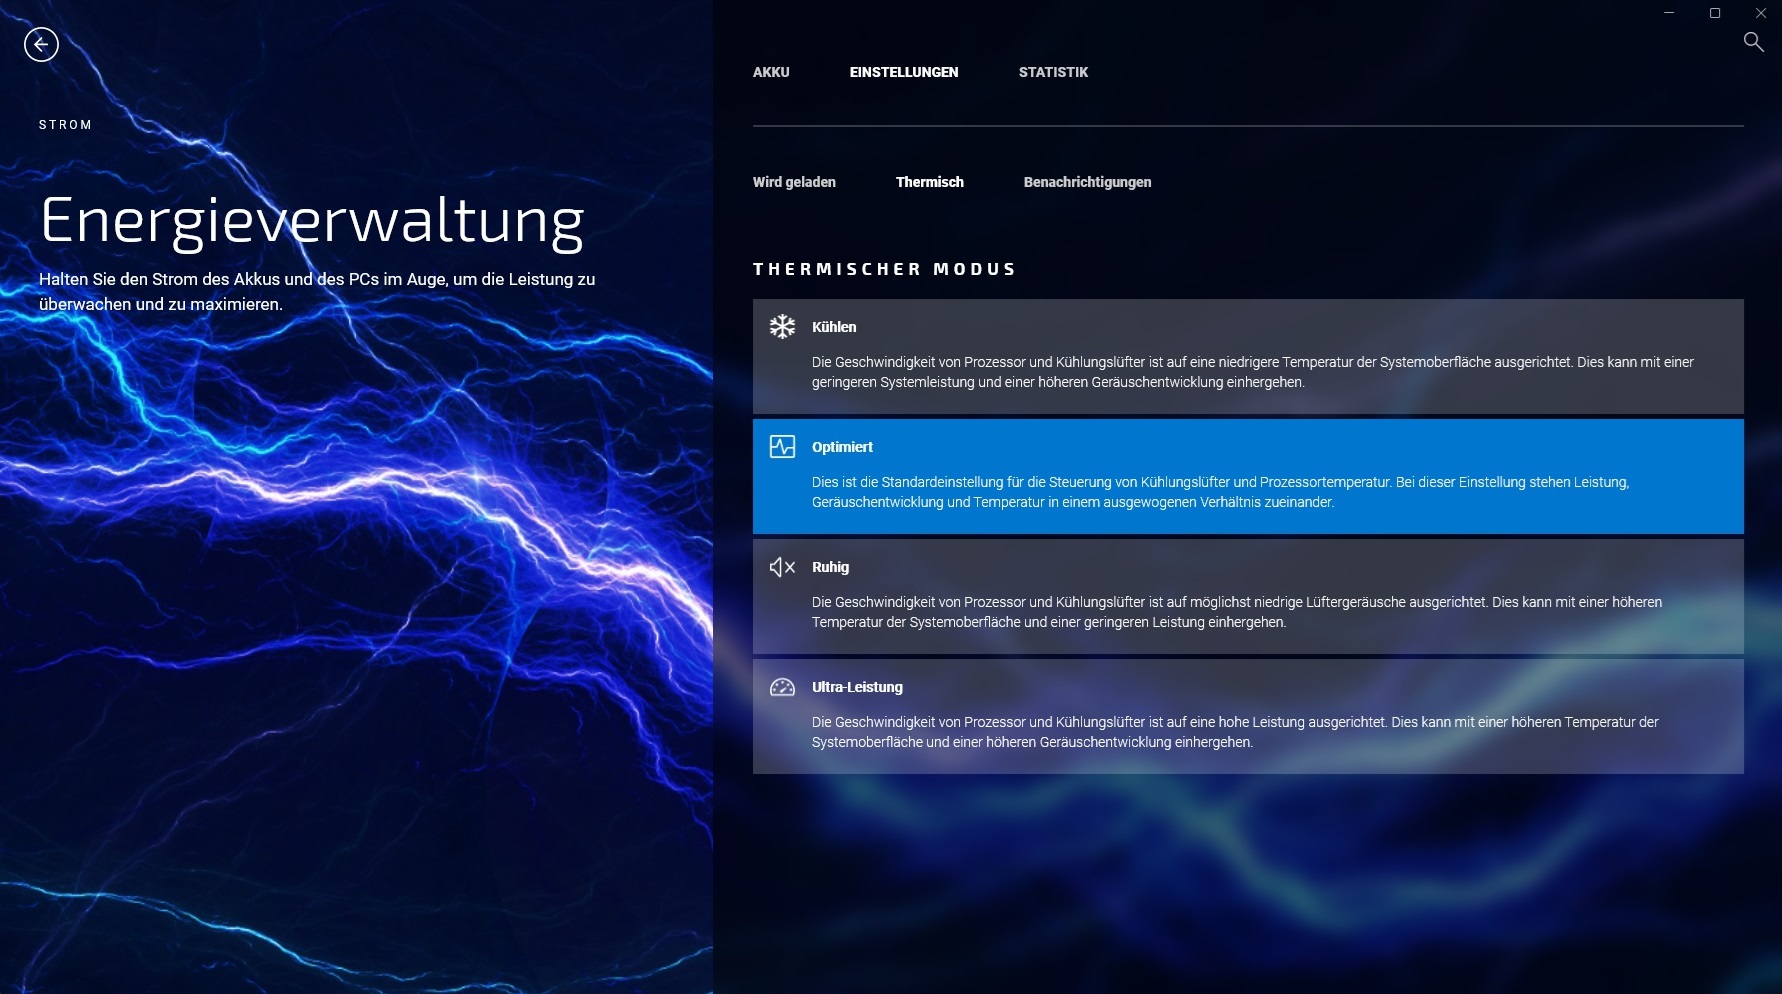
| Witcher 3 (FHD/Ultra) | Tyst | Optimerad | Kylning | Ultraprestanda |
| Buller | 40 - 41 dB(A) | 43 - 44 dB(A) | 46 - 47 dB(A) | 49 - 50 dB(A) |
| Prestanda | 84 fps | 84 fps | 84 fps | 84 fps |
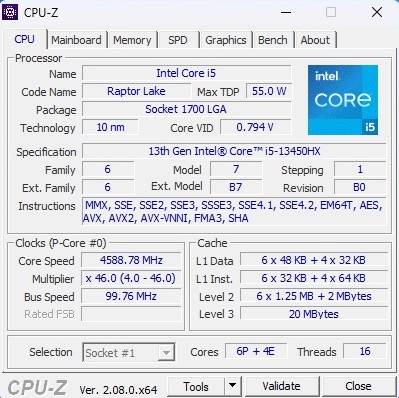
Processor
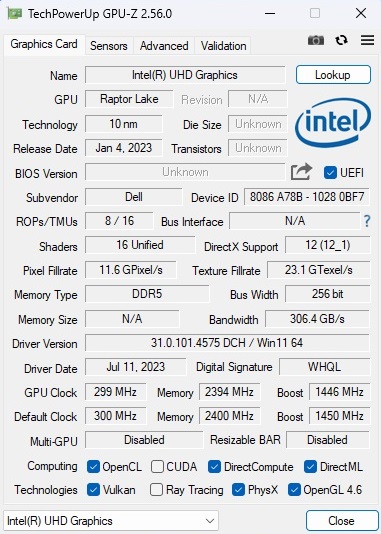
Jämfört med Core i7-13650HX har Core i5-13450HX endast fyra istället för åtta effektivitetskärnor, men antalet prestandakärnor förblir detsamma på sex. Båda processorerna är från Raptor Lake-generationen och tillverkade med den förbättrade 10 nm-processen. Med hänsyn till alla CPU-riktmärken är Core i5-13450HX ungefär 15% långsammare än sitt dyrare syskon och faller någonstans mellan Core i5-13500H (Medion Erazer Crawler E40) och Core i7-13620H (Lenovo LOQ 15IRH8). Poängen minskade något över tid under vårt Cinebench loop-test, men det fanns inga drastiska prestandaförluster.
Cinebench R15 Multi Sustained Load
* ... mindre är bättre
AIDA64: FP32 Ray-Trace | FPU Julia | CPU SHA3 | CPU Queen | FPU SinJulia | FPU Mandel | CPU AES | CPU ZLib | FP64 Ray-Trace | CPU PhotoWorxx
| Performance rating | |
| Genomsnitt av klass Gaming | |
| Dell G15 5530 | |
| Asus TUF A15 FA507 | |
| Dell G15 5530, i5-13450HX RTX 4050 | |
| Genomsnitt Intel Core i5-13450HX | |
| Medion Erazer Crawler E40 - MD 62518 | |
| Lenovo LOQ 15IRH8 Core i7 | |
| AIDA64 / FP32 Ray-Trace | |
| Genomsnitt av klass Gaming (10227 - 85542, n=105, senaste 2 åren) | |
| Dell G15 5530 | |
| Dell G15 5530, i5-13450HX RTX 4050 | |
| Asus TUF A15 FA507 | |
| Genomsnitt Intel Core i5-13450HX (13747 - 17767, n=3) | |
| Medion Erazer Crawler E40 - MD 62518 | |
| Lenovo LOQ 15IRH8 Core i7 | |
| AIDA64 / FPU Julia | |
| Genomsnitt av klass Gaming (51376 - 238426, n=105, senaste 2 åren) | |
| Asus TUF A15 FA507 | |
| Dell G15 5530 | |
| Dell G15 5530, i5-13450HX RTX 4050 | |
| Genomsnitt Intel Core i5-13450HX (71834 - 83862, n=3) | |
| Medion Erazer Crawler E40 - MD 62518 | |
| Lenovo LOQ 15IRH8 Core i7 | |
| AIDA64 / CPU SHA3 | |
| Genomsnitt av klass Gaming (2180 - 10115, n=105, senaste 2 åren) | |
| Dell G15 5530 | |
| Genomsnitt Intel Core i5-13450HX (3519 - 3530, n=3) | |
| Dell G15 5530, i5-13450HX RTX 4050 | |
| Medion Erazer Crawler E40 - MD 62518 | |
| Asus TUF A15 FA507 | |
| Lenovo LOQ 15IRH8 Core i7 | |
| AIDA64 / CPU Queen | |
| Genomsnitt av klass Gaming (49785 - 173351, n=90, senaste 2 åren) | |
| Dell G15 5530 | |
| Asus TUF A15 FA507 | |
| Genomsnitt Intel Core i5-13450HX (85888 - 86148, n=3) | |
| Dell G15 5530, i5-13450HX RTX 4050 | |
| Medion Erazer Crawler E40 - MD 62518 | |
| Lenovo LOQ 15IRH8 Core i7 | |
| AIDA64 / FPU SinJulia | |
| Genomsnitt av klass Gaming (4424 - 33636, n=105, senaste 2 åren) | |
| Asus TUF A15 FA507 | |
| Dell G15 5530 | |
| Genomsnitt Intel Core i5-13450HX (9325 - 9354, n=3) | |
| Dell G15 5530, i5-13450HX RTX 4050 | |
| Medion Erazer Crawler E40 - MD 62518 | |
| Lenovo LOQ 15IRH8 Core i7 | |
| AIDA64 / FPU Mandel | |
| Genomsnitt av klass Gaming (25115 - 128721, n=105, senaste 2 åren) | |
| Asus TUF A15 FA507 | |
| Dell G15 5530 | |
| Dell G15 5530, i5-13450HX RTX 4050 | |
| Genomsnitt Intel Core i5-13450HX (34956 - 42825, n=3) | |
| Medion Erazer Crawler E40 - MD 62518 | |
| Lenovo LOQ 15IRH8 Core i7 | |
| AIDA64 / CPU AES | |
| Genomsnitt av klass Gaming (39258 - 247074, n=105, senaste 2 åren) | |
| Dell G15 5530 | |
| Dell G15 5530, i5-13450HX RTX 4050 | |
| Genomsnitt Intel Core i5-13450HX (70296 - 70680, n=3) | |
| Asus TUF A15 FA507 | |
| Medion Erazer Crawler E40 - MD 62518 | |
| Lenovo LOQ 15IRH8 Core i7 | |
| AIDA64 / CPU ZLib | |
| Genomsnitt av klass Gaming (574 - 2531, n=105, senaste 2 åren) | |
| Dell G15 5530 | |
| Dell G15 5530, i5-13450HX RTX 4050 | |
| Medion Erazer Crawler E40 - MD 62518 | |
| Genomsnitt Intel Core i5-13450HX (977 - 1002, n=3) | |
| Lenovo LOQ 15IRH8 Core i7 | |
| Asus TUF A15 FA507 | |
| AIDA64 / FP64 Ray-Trace | |
| Genomsnitt av klass Gaming (5509 - 45446, n=105, senaste 2 åren) | |
| Dell G15 5530 | |
| Dell G15 5530, i5-13450HX RTX 4050 | |
| Genomsnitt Intel Core i5-13450HX (7428 - 9561, n=3) | |
| Asus TUF A15 FA507 | |
| Medion Erazer Crawler E40 - MD 62518 | |
| Lenovo LOQ 15IRH8 Core i7 | |
| AIDA64 / CPU PhotoWorxx | |
| Genomsnitt av klass Gaming (12271 - 89891, n=105, senaste 2 åren) | |
| Dell G15 5530 | |
| Medion Erazer Crawler E40 - MD 62518 | |
| Genomsnitt Intel Core i5-13450HX (36014 - 36764, n=3) | |
| Dell G15 5530, i5-13450HX RTX 4050 | |
| Lenovo LOQ 15IRH8 Core i7 | |
| Asus TUF A15 FA507 | |
Systemets prestanda
Alla enheter i vår jämförelse ligger ganska nära varandra när det gäller systemprestanda. I PCMark 10 uppnådde granskningsenheten nästan samma övergripande poäng som den dyrare G15-modellen.
CrossMark: Overall | Productivity | Creativity | Responsiveness
WebXPRT 3: Overall
WebXPRT 4: Overall
Mozilla Kraken 1.1: Total
| PCMark 10 / Score | |
| Genomsnitt av klass Gaming (5828 - 12414, n=93, senaste 2 åren) | |
| Lenovo LOQ 15IRH8 Core i7 | |
| Medion Erazer Crawler E40 - MD 62518 | |
| Asus TUF A15 FA507 | |
| Dell G15 5530 | |
| Dell G15 5530, i5-13450HX RTX 4050 | |
| Genomsnitt Intel Core i5-13450HX, NVIDIA GeForce RTX 4050 Laptop GPU (n=1) | |
| PCMark 10 / Essentials | |
| Dell G15 5530 | |
| Lenovo LOQ 15IRH8 Core i7 | |
| Genomsnitt av klass Gaming (8810 - 11935, n=97, senaste 2 åren) | |
| Asus TUF A15 FA507 | |
| Medion Erazer Crawler E40 - MD 62518 | |
| Dell G15 5530, i5-13450HX RTX 4050 | |
| Genomsnitt Intel Core i5-13450HX, NVIDIA GeForce RTX 4050 Laptop GPU (n=1) | |
| PCMark 10 / Productivity | |
| Genomsnitt av klass Gaming (6845 - 25323, n=95, senaste 2 åren) | |
| Dell G15 5530 | |
| Lenovo LOQ 15IRH8 Core i7 | |
| Asus TUF A15 FA507 | |
| Medion Erazer Crawler E40 - MD 62518 | |
| Dell G15 5530, i5-13450HX RTX 4050 | |
| Genomsnitt Intel Core i5-13450HX, NVIDIA GeForce RTX 4050 Laptop GPU (n=1) | |
| PCMark 10 / Digital Content Creation | |
| Genomsnitt av klass Gaming (7602 - 19954, n=95, senaste 2 åren) | |
| Lenovo LOQ 15IRH8 Core i7 | |
| Medion Erazer Crawler E40 - MD 62518 | |
| Dell G15 5530, i5-13450HX RTX 4050 | |
| Genomsnitt Intel Core i5-13450HX, NVIDIA GeForce RTX 4050 Laptop GPU (n=1) | |
| Asus TUF A15 FA507 | |
| Dell G15 5530 | |
| CrossMark / Overall | |
| Genomsnitt av klass Gaming (1366 - 2409, n=94, senaste 2 åren) | |
| Lenovo LOQ 15IRH8 Core i7 | |
| Dell G15 5530 | |
| Medion Erazer Crawler E40 - MD 62518 | |
| Asus TUF A15 FA507 | |
| CrossMark / Productivity | |
| Genomsnitt av klass Gaming (1386 - 2254, n=94, senaste 2 åren) | |
| Lenovo LOQ 15IRH8 Core i7 | |
| Dell G15 5530 | |
| Medion Erazer Crawler E40 - MD 62518 | |
| Asus TUF A15 FA507 | |
| CrossMark / Creativity | |
| Genomsnitt av klass Gaming (1343 - 2786, n=94, senaste 2 åren) | |
| Dell G15 5530 | |
| Lenovo LOQ 15IRH8 Core i7 | |
| Medion Erazer Crawler E40 - MD 62518 | |
| Asus TUF A15 FA507 | |
| CrossMark / Responsiveness | |
| Lenovo LOQ 15IRH8 Core i7 | |
| Medion Erazer Crawler E40 - MD 62518 | |
| Genomsnitt av klass Gaming (1226 - 2334, n=94, senaste 2 åren) | |
| Dell G15 5530 | |
| Asus TUF A15 FA507 | |
| WebXPRT 3 / Overall | |
| Genomsnitt av klass Gaming (220 - 532, n=98, senaste 2 åren) | |
| Dell G15 5530 | |
| Asus TUF A15 FA507 | |
| Lenovo LOQ 15IRH8 Core i7 | |
| Dell G15 5530, i5-13450HX RTX 4050 | |
| Dell G15 5530, i5-13450HX RTX 4050 | |
| Genomsnitt Intel Core i5-13450HX, NVIDIA GeForce RTX 4050 Laptop GPU (281 - 281, n=2) | |
| Medion Erazer Crawler E40 - MD 62518 | |
| WebXPRT 4 / Overall | |
| Genomsnitt av klass Gaming (165 - 354, n=98, senaste 2 åren) | |
| Dell G15 5530 | |
| Lenovo LOQ 15IRH8 Core i7 | |
| Medion Erazer Crawler E40 - MD 62518 | |
| Asus TUF A15 FA507 | |
| Mozilla Kraken 1.1 / Total | |
| Asus TUF A15 FA507 | |
| Dell G15 5530, i5-13450HX RTX 4050 | |
| Dell G15 5530, i5-13450HX RTX 4050 | |
| Genomsnitt Intel Core i5-13450HX, NVIDIA GeForce RTX 4050 Laptop GPU (531 - 531, n=2) | |
| Medion Erazer Crawler E40 - MD 62518 | |
| Dell G15 5530 | |
| Lenovo LOQ 15IRH8 Core i7 | |
| Genomsnitt av klass Gaming (391 - 590, n=100, senaste 2 åren) | |
* ... mindre är bättre
| PCMark 10 Score | 6969 poäng | |
Hjälp | ||
| AIDA64 / Memory Copy | |
| Genomsnitt av klass Gaming (21750 - 129946, n=105, senaste 2 åren) | |
| Dell G15 5530 | |
| Dell G15 5530, i5-13450HX RTX 4050 | |
| Genomsnitt Intel Core i5-13450HX (58673 - 58861, n=3) | |
| Medion Erazer Crawler E40 - MD 62518 | |
| Lenovo LOQ 15IRH8 Core i7 | |
| Asus TUF A15 FA507 | |
| AIDA64 / Memory Read | |
| Genomsnitt av klass Gaming (22956 - 118858, n=105, senaste 2 åren) | |
| Genomsnitt Intel Core i5-13450HX (66626 - 69024, n=3) | |
| Dell G15 5530 | |
| Dell G15 5530, i5-13450HX RTX 4050 | |
| Medion Erazer Crawler E40 - MD 62518 | |
| Lenovo LOQ 15IRH8 Core i7 | |
| Asus TUF A15 FA507 | |
| AIDA64 / Memory Write | |
| Genomsnitt av klass Gaming (22297 - 135096, n=105, senaste 2 åren) | |
| Medion Erazer Crawler E40 - MD 62518 | |
| Dell G15 5530, i5-13450HX RTX 4050 | |
| Dell G15 5530 | |
| Genomsnitt Intel Core i5-13450HX (58540 - 60196, n=3) | |
| Asus TUF A15 FA507 | |
| Lenovo LOQ 15IRH8 Core i7 | |
| AIDA64 / Memory Latency | |
| Lenovo LOQ 15IRH8 Core i7 | |
| Genomsnitt av klass Gaming (75.3 - 259, n=105, senaste 2 åren) | |
| Medion Erazer Crawler E40 - MD 62518 | |
| Dell G15 5530, i5-13450HX RTX 4050 | |
| Genomsnitt Intel Core i5-13450HX (90 - 94.2, n=3) | |
| Dell G15 5530 | |
| Asus TUF A15 FA507 | |
* ... mindre är bättre
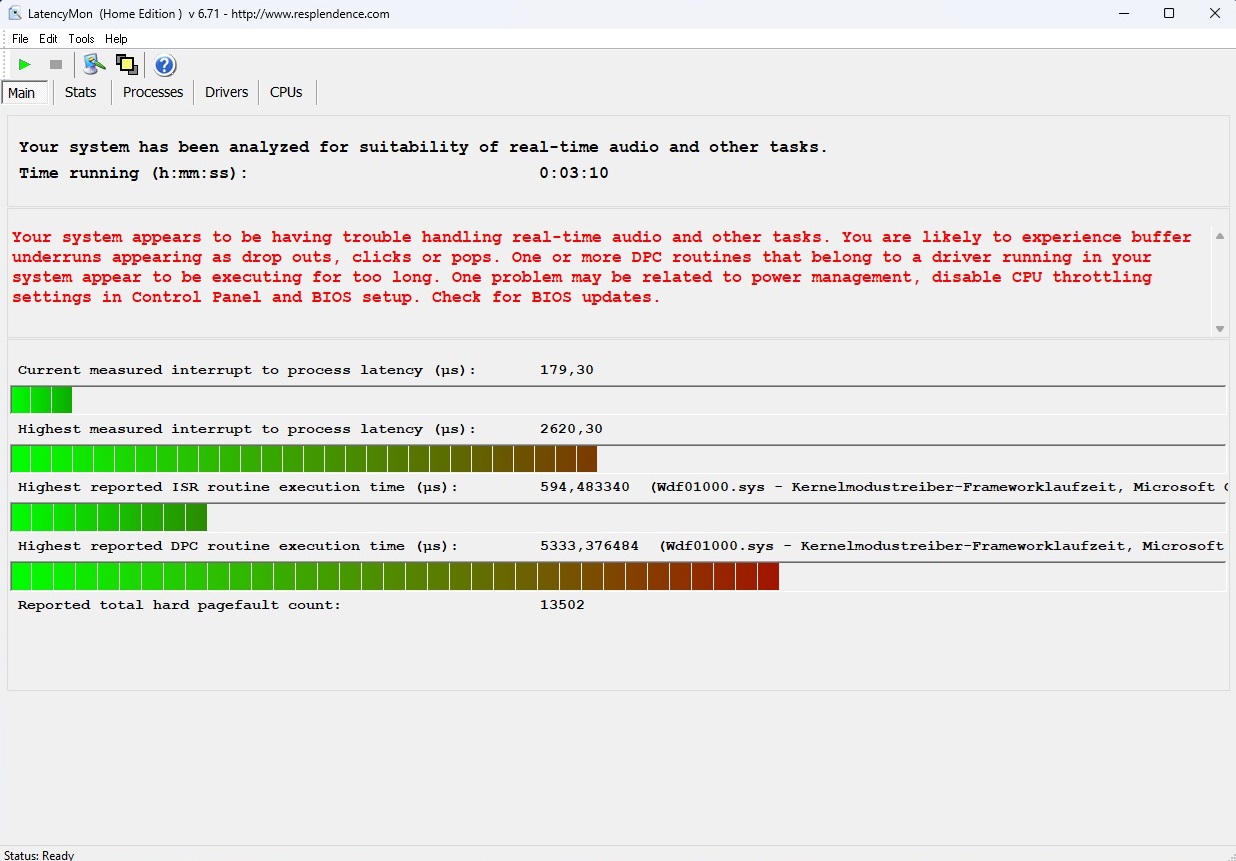
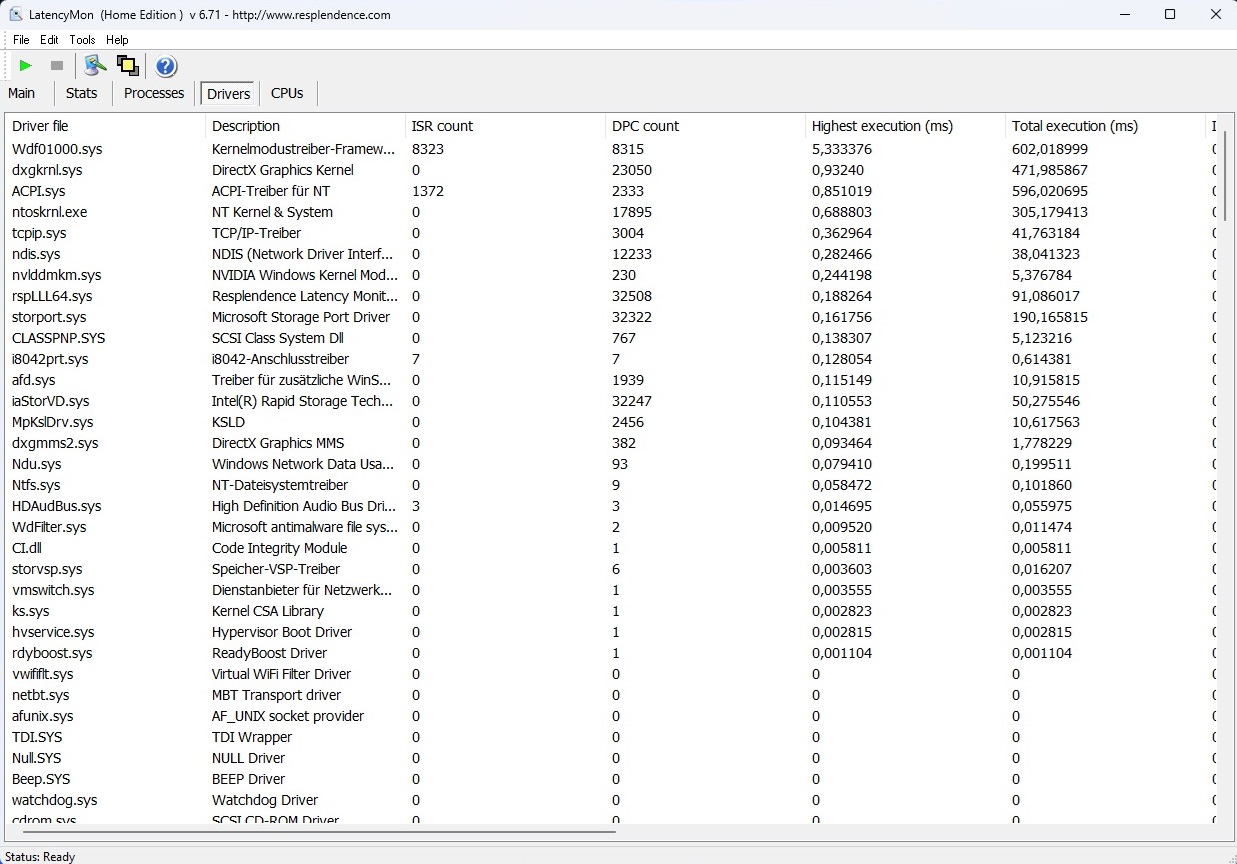
DPC-fördröjning
Den 15-tums bärbara datorn har svagheter inom latensområdet. LatencyMon rapporterade att den bärbara datorn - åtminstone direkt ur lådan - verkar ha problem med att hantera ljud- och videobearbetning i realtid. Med detta sagt bör detta endast påverka dem som avser att använda den bärbara datorn för sådana ändamål.
| DPC Latencies / LatencyMon - interrupt to process latency (max), Web, Youtube, Prime95 | |
| Dell G15 5530 | |
| Dell G15 5530, i5-13450HX RTX 4050 | |
| Medion Erazer Crawler E40 - MD 62518 | |
| Lenovo LOQ 15IRH8 Core i7 | |
* ... mindre är bättre
Masslagring
Vid första anblicken gör den bärbara datorns masslagring en utmärkt figur. Trots sin kompakta storlek hade den 512 GB M.2 2230-enheten från WDC extremt bra resultat i vår serie av riktmärken. Trots detta avslöjade vårt loop-test att enheten under långvarig belastning eller stress ibland upplevde en allvarlig nivå av strypning som inte sågs hos någon av konkurrenterna.

* ... mindre är bättre
Sustained Load Read: DiskSpd Read Loop, Queue Depth 8
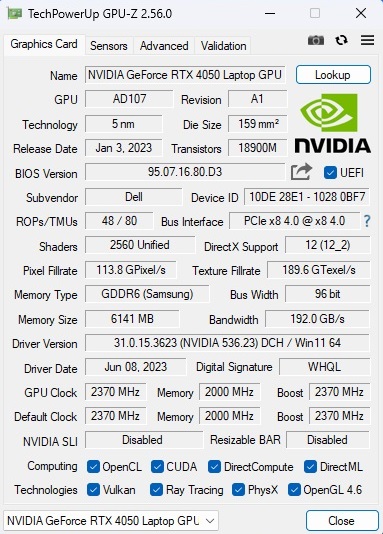
Grafikkort
GeForce RTX 4050 är en populär GPU i mellanklassen från Nvidias Ada Lovelace-serie, men 6 GB GDDR6-videominne och 96-bitars buss är ganska snålt tilltaget med dagens mått mätt. Den faktiska prestandan beror till stor del på kylsystemet och den specificerade TGP. Dell har bestämt sig för en 140-watts TGP för G15, vilket motsvarar det maximala tillåtna för RTX 4050. Det är därför knappast förvånande att 15-tums Dell-laptopen levererade prestanda över genomsnittet i 3D-benchmark, även om vi måste nämna att vissa av konkurrenterna ofta uppnådde liknande resultat vid lägre TGP och därmed är mer effektiva.
| 3DMark 11 Performance | 28326 poäng | |
| 3DMark Ice Storm Standard Score | 222203 poäng | |
| 3DMark Cloud Gate Standard Score | 58346 poäng | |
| 3DMark Fire Strike Score | 19919 poäng | |
| 3DMark Time Spy Score | 9091 poäng | |
Hjälp | ||
* ... mindre är bättre
Spelprestanda
Spelprestanda liknar det vi har sett i de syntetiska riktmärkena. RTX 4050 är i allmänhet tillräckligt snabb för att köra de flesta moderna spel smidigt vid 1080p och höga till maximala inställningar. Saker och ting blir bara ansträngda när du spelar mycket krävande titlar, som t.ex Starfield. Vi rekommenderar att du åtminstone har en GeForce RTX 4070 om du vill använda högre upplösningar (QHD eller högre).
| The Witcher 3 - 1920x1080 Ultra Graphics & Postprocessing (HBAO+) | |
| Genomsnitt av klass Gaming (104.7 - 240, n=7, senaste 2 åren) | |
| Dell G15 5530 | |
| Lenovo LOQ 15IRH8 Core i7 | |
| Dell G15 5530, i5-13450HX RTX 4050 | |
| Asus TUF A15 FA507 | |
| Medion Erazer Crawler E40 - MD 62518 | |
| Genomsnitt NVIDIA GeForce RTX 4050 Laptop GPU (18.5 - 94.7, n=40) | |
| Lies of P - 1920x1080 Best Preset | |
| XMG Focus 15 E23 | |
| Genomsnitt NVIDIA GeForce RTX 4050 Laptop GPU (101.4 - 105.7, n=3) | |
| Dell G15 5530, i5-13450HX RTX 4050 | |
| The Crew Motorfest - 1920x1080 Ultra Preset | |
| XMG Focus 15 E23 | |
| Dell G15 5530, i5-13450HX RTX 4050 | |
| Genomsnitt NVIDIA GeForce RTX 4050 Laptop GPU (59 - 59, n=3) | |
| Starfield - 1920x1080 Ultra Preset | |
| Genomsnitt av klass Gaming (n=1senaste 2 åren) | |
| Dell G15 5530, i5-13450HX RTX 4050 | |
| Genomsnitt NVIDIA GeForce RTX 4050 Laptop GPU (35.7 - 37.3, n=3) | |
| XMG Focus 15 E23 | |
| Armored Core 6 - 1920x1080 Maximum Preset | |
| XMG Focus 15 E23 | |
| Genomsnitt NVIDIA GeForce RTX 4050 Laptop GPU (79 - 87.8, n=3) | |
| Dell G15 5530, i5-13450HX RTX 4050 | |
| Genomsnitt av klass Gaming (n=1senaste 2 åren) | |
| Atlas Fallen - 1920x1080 Very High Preset | |
| Genomsnitt NVIDIA GeForce RTX 4050 Laptop GPU (81.1 - 94.2, n=3) | |
| Dell G15 5530, i5-13450HX RTX 4050 | |
| XMG Focus 15 E23 | |
| Baldur's Gate 3 - 1920x1080 Ultra Preset AA:T | |
| Genomsnitt av klass Gaming (59.4 - 246, n=104, senaste 2 åren) | |
| XMG Focus 15 E23 | |
| Dell G15 5530, i5-13450HX RTX 4050 | |
| Genomsnitt NVIDIA GeForce RTX 4050 Laptop GPU (48.3 - 81.3, n=11) | |
| Ratchet & Clank Rift Apart - 1920x1080 Very High Preset AA:T | |
| XMG Focus 15 E23 | |
| Genomsnitt NVIDIA GeForce RTX 4050 Laptop GPU (32.9 - 45.8, n=3) | |
| Dell G15 5530, i5-13450HX RTX 4050 | |
| Resident Evil 4 Remake - 1920x1080 Max Preset | |
| Dell G15 5530, i5-13450HX RTX 4050 | |
| Genomsnitt NVIDIA GeForce RTX 4050 Laptop GPU (36.8 - 53.9, n=2) | |
| XMG Focus 15 E23 | |
Vi använde Den Witcher 3 (kört i FHD/Ultra i ca 60 minuter) för att ta reda på hur varje bärbar dator presterar i 3D-applikationer under en längre period. Resultatet: bildfrekvenserna förblev ganska konsekventa på G15 5530.
Witcher 3 FPS chart
| låg | med. | hög | ultra | |
|---|---|---|---|---|
| GTA V (2015) | 178 | 168.6 | 96.6 | |
| The Witcher 3 (2015) | 84 | |||
| Dota 2 Reborn (2015) | 170 | 156.1 | 154.1 | 146.8 |
| Final Fantasy XV Benchmark (2018) | 120.3 | 84.1 | ||
| X-Plane 11.11 (2018) | 153.1 | 139.6 | 108.5 | |
| Strange Brigade (2018) | 203 | 171.4 | 145.1 | |
| Company of Heroes 3 (2023) | 127 | 70.2 | 68.7 | |
| Resident Evil 4 Remake (2023) | 88.6 | 80.9 | 53.9 | |
| Ratchet & Clank Rift Apart (2023) | 67.7 | 40.2 | 32.9 | |
| Atlas Fallen (2023) | 114.3 | 104.1 | 83.3 | |
| Armored Core 6 (2023) | 103.8 | 96.7 | 79 | |
| Starfield (2023) | 55.9 | 43.7 | 37.3 | |
| The Crew Motorfest (2023) | 60 | 60 | 59 | |
| Lies of P (2023) | 132.8 | 113.3 | 101.4 | |
| Baldur's Gate 3 (2023) | 84.4 | 71.3 | 69.3 |
Utsläpp
Utsläpp av buller
Dell G15 5530 förblir mestadels trevlig och tyst vid tomgång. Fläktarna är antingen helt stilla eller körs med en anständig ljudnivå. De går på högvarv ganska sällan, men detta kan inträffa oftare under vardagliga uppgifter som videouppspelning och webbsurfning. Trots detta, med cirka 44 dB(A), är mängden buller som produceras när du spelar i "Optimerat" läge under genomsnittet för en RTX 4050-notebook.
Ljudnivå
| Låg belastning |
| 25 / 26 / 30 dB(A) |
| Hög belastning |
| 38 / 50 dB(A) |
 | ||
30 dB tyst 40 dB(A) hörbar 50 dB(A) högt ljud |
||
min: | ||
| Dell G15 5530, i5-13450HX RTX 4050 GeForce RTX 4050 Laptop GPU, i5-13450HX | Medion Erazer Crawler E40 - MD 62518 GeForce RTX 4050 Laptop GPU, i5-13500H | Lenovo LOQ 15IRH8 Core i7 GeForce RTX 4050 Laptop GPU, i7-13620H | Asus TUF A15 FA507 GeForce RTX 4050 Laptop GPU, R7 7735HS | Dell G15 5530 GeForce RTX 4060 Laptop GPU, i7-13650HX | |
|---|---|---|---|---|---|
| Noise | -4% | -8% | 12% | 6% | |
| av / miljö * (dB) | 25 | 23 8% | 23.69 5% | 23.3 7% | 20.41 18% |
| Idle Minimum * (dB) | 25 | 23 8% | 29.03 -16% | 23.3 7% | 26.85 -7% |
| Idle Average * (dB) | 26 | 23 12% | 29.03 -12% | 23.3 10% | 26.85 -3% |
| Idle Maximum * (dB) | 30 | 28.02 7% | 29.03 3% | 23.3 22% | 26.85 10% |
| Load Average * (dB) | 38 | 50.21 -32% | 48.7 -28% | 29.6 22% | 27.65 27% |
| Witcher 3 ultra * (dB) | 44 | 51.46 -17% | 48.5 -10% | 43 2% | 47.9 -9% |
| Load Maximum * (dB) | 50 | 56.79 -14% | 48.7 3% | 43 14% | 47.86 4% |
* ... mindre är bättre
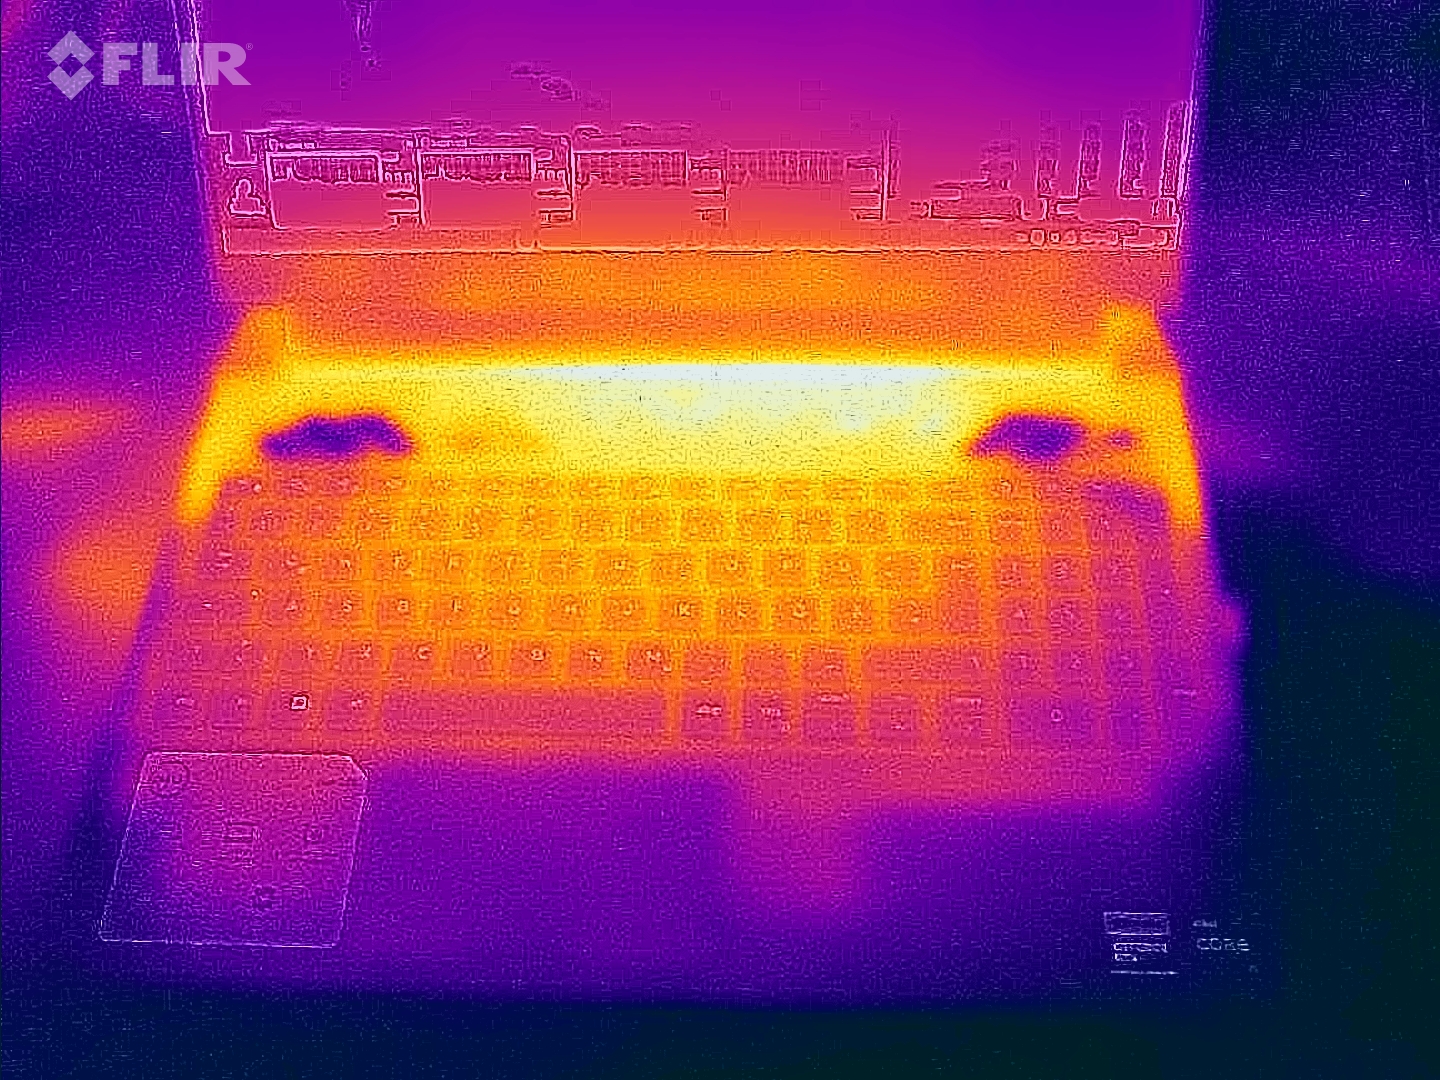
Temperatur
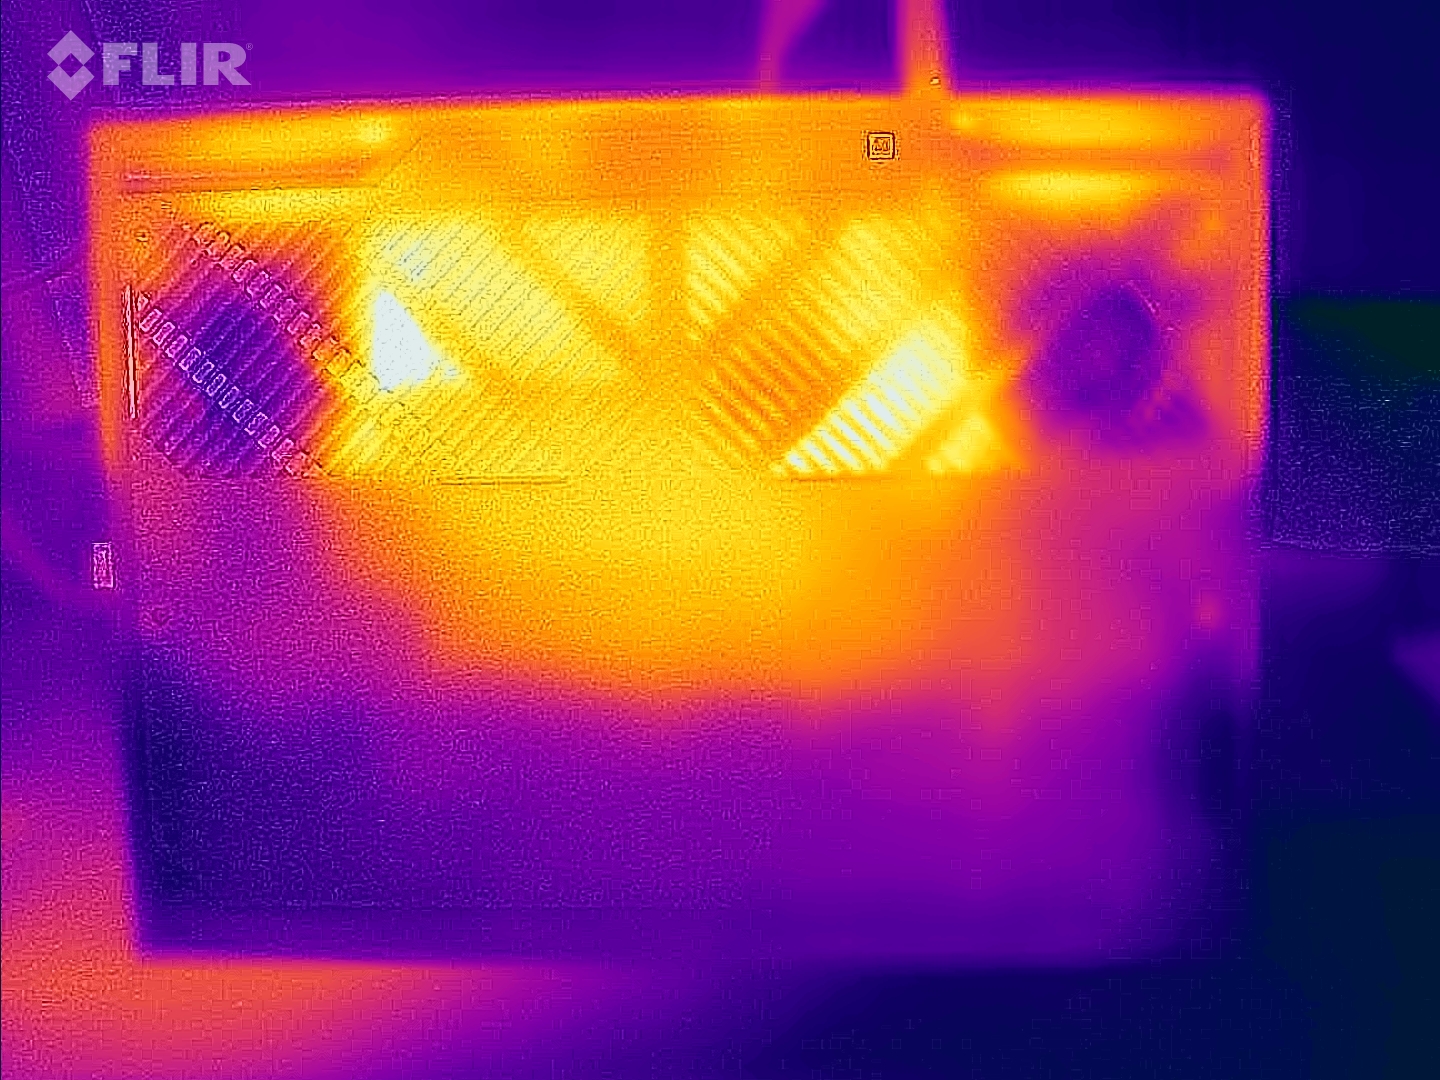
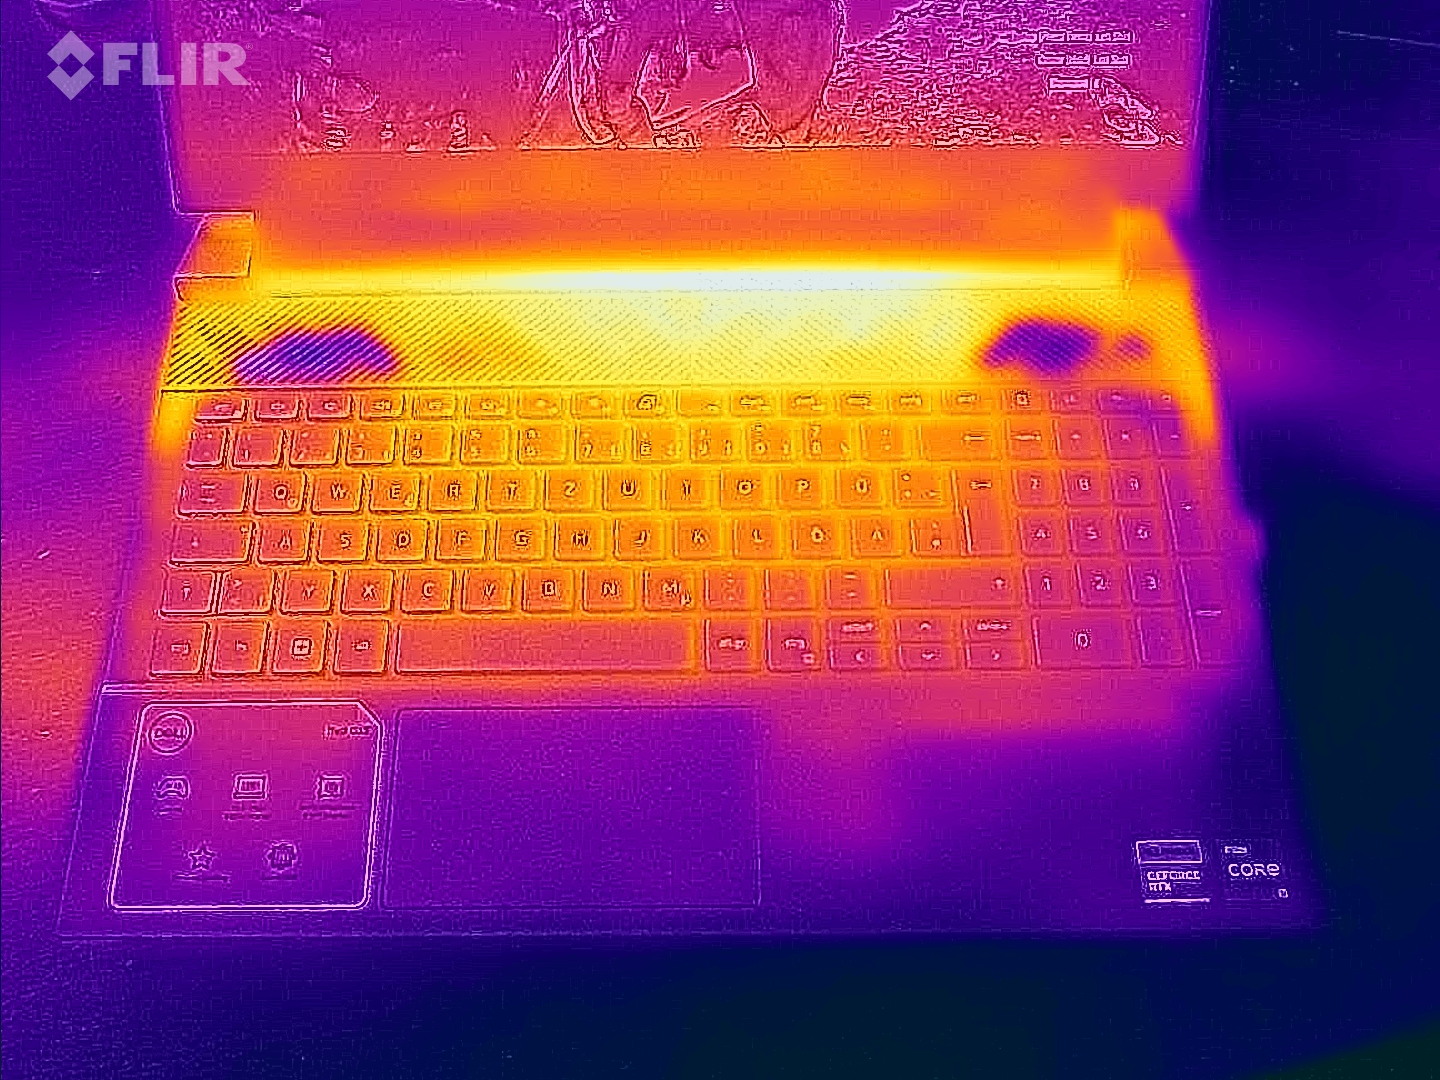
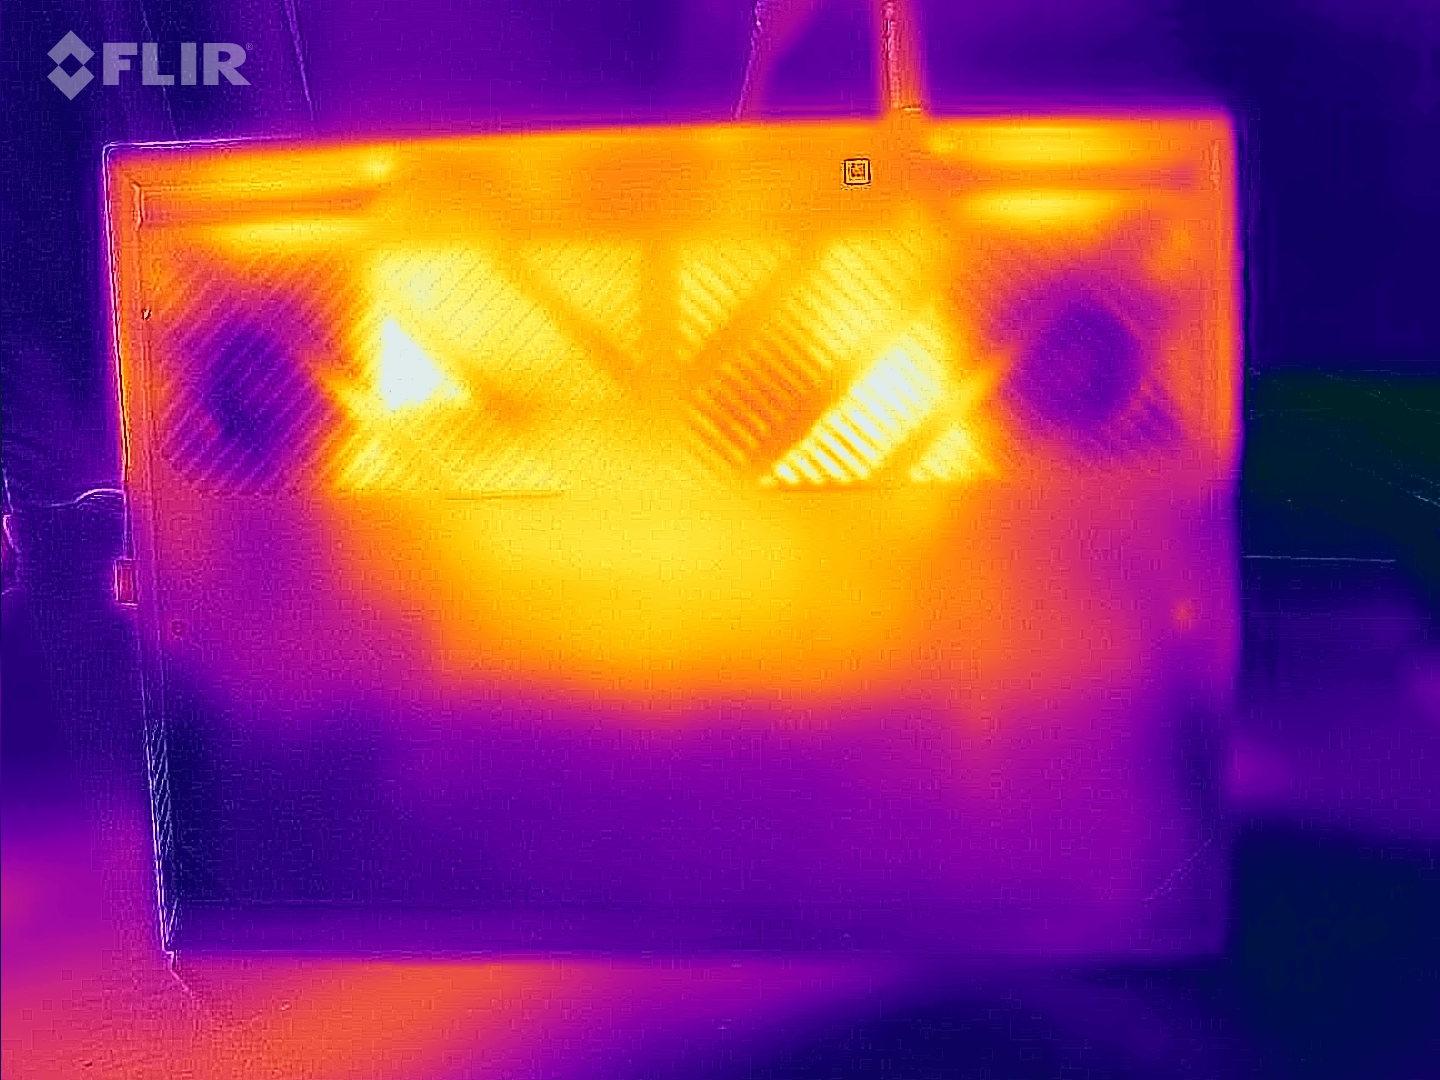
I genomsnitt är chassitemperaturerna något lägre än på den dyrare G15-modellen. Efter 60 minuters körning av The Witcher 3 var de maximala temperaturerna på tangentbordsdäcket och bottenpanelen 54°C (129,4°F) respektive 52°C (125,6°F), vilket är ganska högt i teorin. Men eftersom handflatestödet aldrig blev varmare än 32 °C (89,6 °F) bör längre spelsessioner inte vara något större problem, förutsatt att du inte placerar enheten i ditt knä.
(-) Den maximala temperaturen på ovansidan är 58 °C / 136 F, jämfört med genomsnittet av 40.4 °C / 105 F , allt från 21.2 till 68.8 °C för klassen Gaming.
(-) Botten värms upp till maximalt 57 °C / 135 F, jämfört med genomsnittet av 43.2 °C / 110 F
(+) Vid tomgångsbruk är medeltemperaturen för ovansidan 26 °C / 79 F, jämfört med enhetsgenomsnittet på 33.9 °C / ### class_avg_f### F.
(-) När du spelar The Witcher 3 är medeltemperaturen för ovansidan 41.7 °C / 107 F, jämfört med enhetsgenomsnittet på 33.9 °C / ## #class_avg_f### F.
(+) Handledsstöden och pekplattan når maximal hudtemperatur (32 °C / 89.6 F) och är därför inte varma.
(-) Medeltemperaturen för handledsstödsområdet på liknande enheter var 28.8 °C / 83.8 F (-3.2 °C / -5.8 F).
| Dell G15 5530, i5-13450HX RTX 4050 GeForce RTX 4050 Laptop GPU, i5-13450HX | Medion Erazer Crawler E40 - MD 62518 GeForce RTX 4050 Laptop GPU, i5-13500H | Lenovo LOQ 15IRH8 Core i7 GeForce RTX 4050 Laptop GPU, i7-13620H | Asus TUF A15 FA507 GeForce RTX 4050 Laptop GPU, R7 7735HS | Dell G15 5530 GeForce RTX 4060 Laptop GPU, i7-13650HX | |
|---|---|---|---|---|---|
| Heat | 24% | -6% | 13% | -7% | |
| Maximum Upper Side * (°C) | 58 | 36 38% | 46.4 20% | 48.9 16% | 54 7% |
| Maximum Bottom * (°C) | 57 | 36 37% | 59.2 -4% | 44.6 22% | 62.2 -9% |
| Idle Upper Side * (°C) | 30 | 26 13% | 34.4 -15% | 27.1 10% | 33.4 -11% |
| Idle Bottom * (°C) | 29 | 27 7% | 36.2 -25% | 27.5 5% | 33.4 -15% |
* ... mindre är bättre
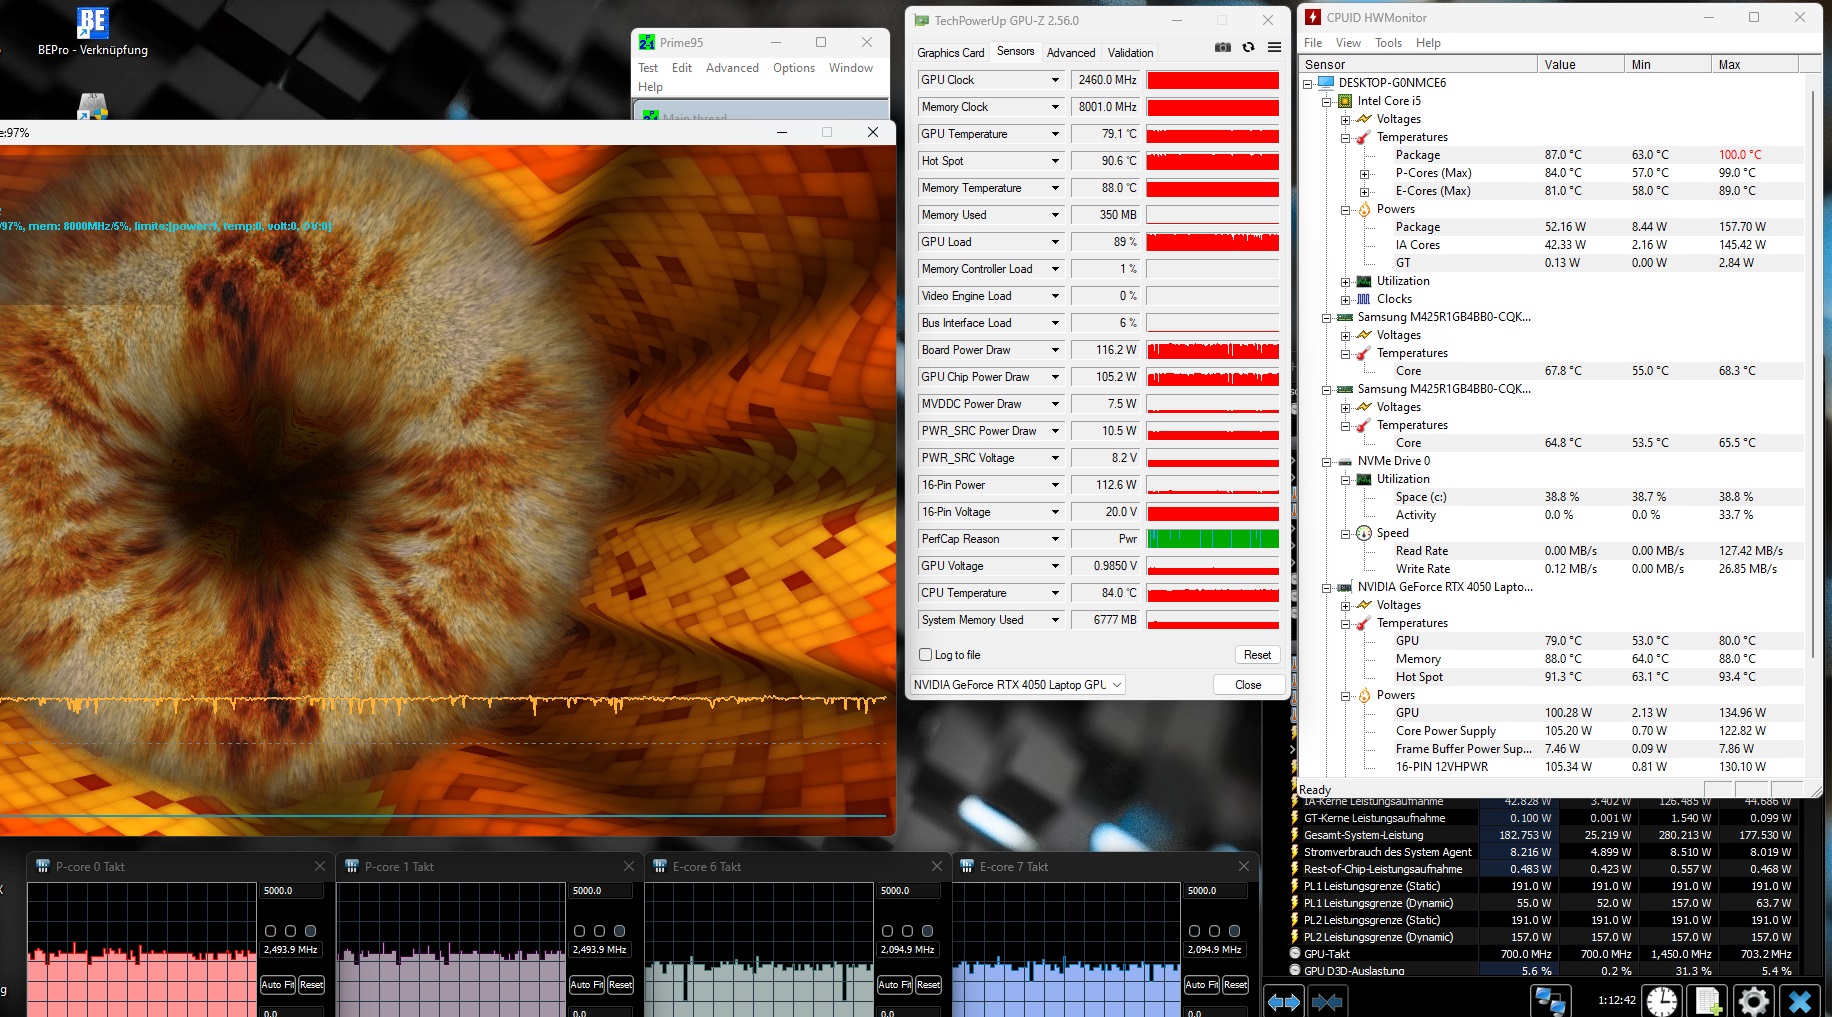
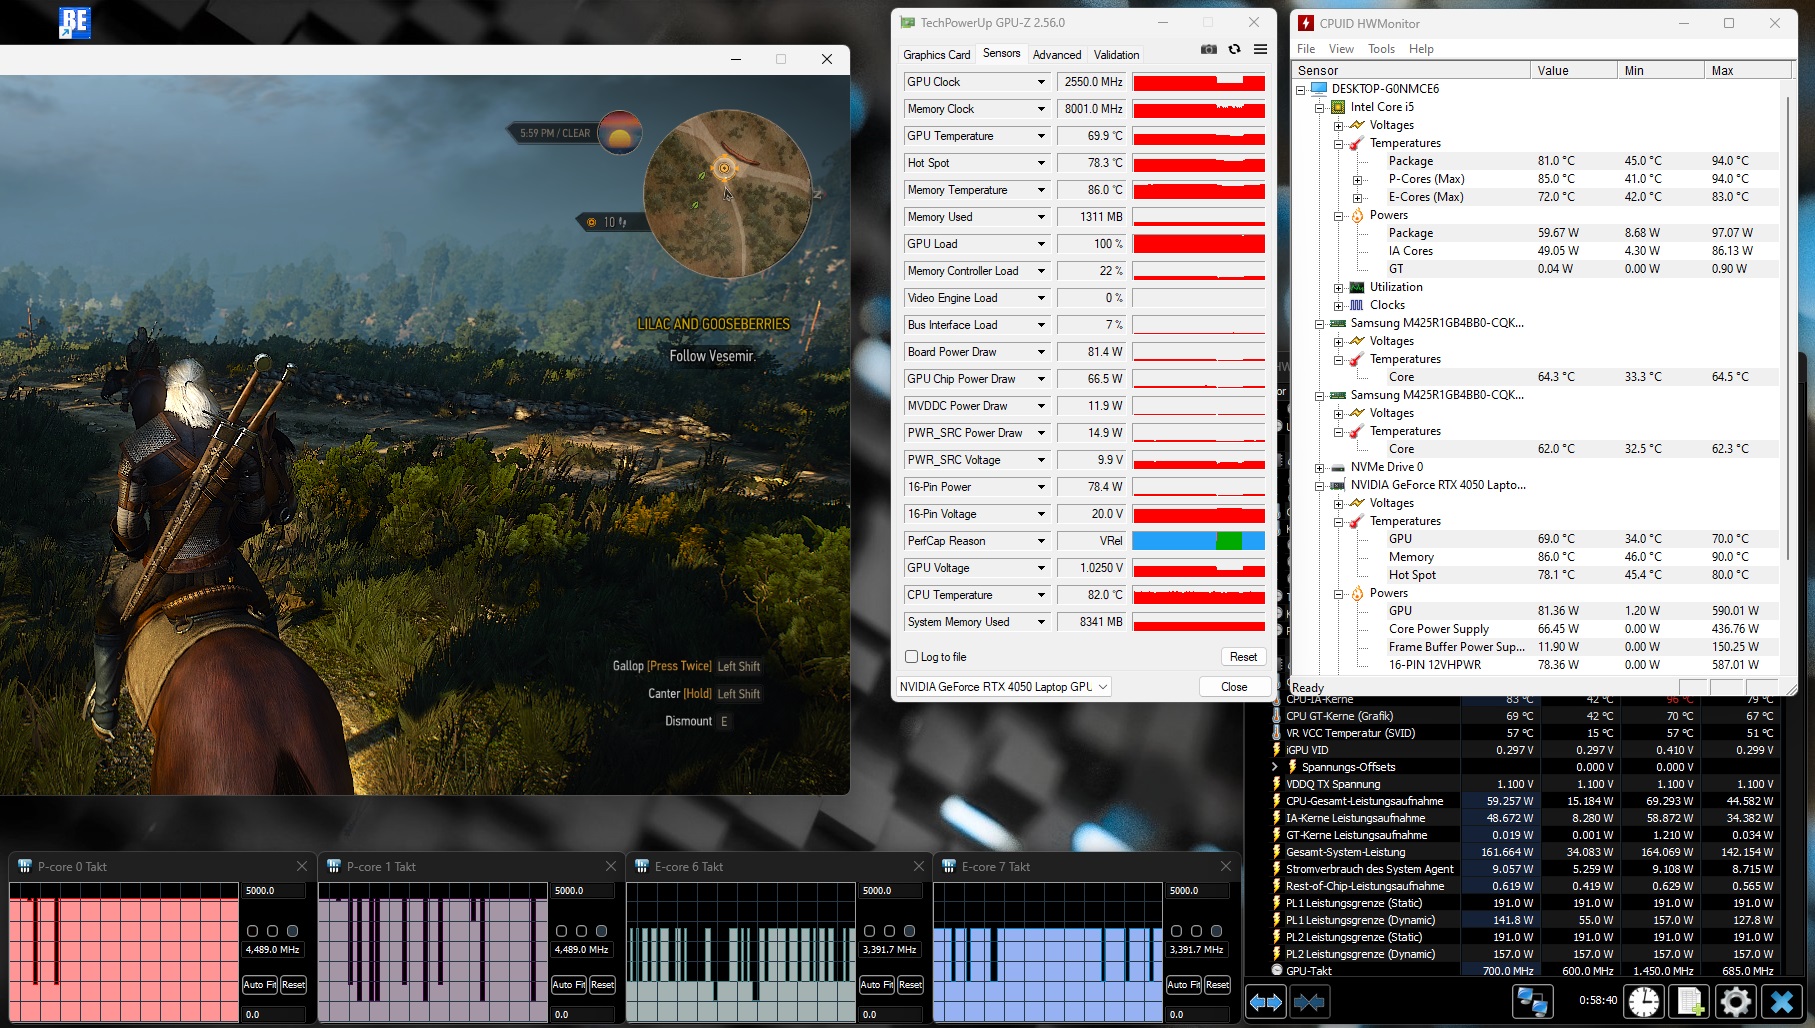
Stresstest
I synnerhet CPU:n kämpade under stresstestet som utfördes med FurMark & Prime95. Efter att kortvarigt ha nått 100°C (212°F) sänkte Core i5-13450HX sin klockhastighet, vilket fick temperaturen att plana ut på 80 till 90°C (176 till 194°F). GeForce RTX 4050 nådde "bara" 79°C (174,2°F) efter en timme, men har en hotspot-temperatur på ca 91°C (195,8°F).
Högtalare
Den bärbara datorn har medelmåttig ljudkvalitet. Högtalarna har bra maxvolym, men hålls tillbaka av sin svaga bas.
Dell G15 5530, i5-13450HX RTX 4050 ljudanalys
(+) | högtalare kan spela relativt högt (86 dB)
Bas 100 - 315 Hz
(-) | nästan ingen bas - i genomsnitt 32% lägre än medianen
(±) | linjäriteten för basen är genomsnittlig (14% delta till föregående frekvens)
Mellan 400 - 2000 Hz
(+) | balanserad mellan - endast 3.5% från medianen
(+) | mids är linjära (4.3% delta till föregående frekvens)
Högsta 2 - 16 kHz
(+) | balanserade toppar - endast 2.4% från medianen
(+) | toppar är linjära (4.2% delta till föregående frekvens)
Totalt 100 - 16 000 Hz
(±) | linjäriteten för det totala ljudet är genomsnittlig (18% skillnad mot median)
Jämfört med samma klass
» 56% av alla testade enheter i den här klassen var bättre, 9% liknande, 36% sämre
» Den bästa hade ett delta på 6%, genomsnittet var 18%, sämst var 132%
Jämfört med alla testade enheter
» 38% av alla testade enheter var bättre, 8% liknande, 54% sämre
» Den bästa hade ett delta på 4%, genomsnittet var 23%, sämst var 134%
Medion Erazer Crawler E40 - MD 62518 ljudanalys
(±) | högtalarljudstyrkan är genomsnittlig men bra (81.47 dB)
Bas 100 - 315 Hz
(-) | nästan ingen bas - i genomsnitt 32.7% lägre än medianen
(±) | linjäriteten för basen är genomsnittlig (11% delta till föregående frekvens)
Mellan 400 - 2000 Hz
(+) | balanserad mellan - endast 4.6% från medianen
(±) | linjäriteten för mids är genomsnittlig (7.1% delta till föregående frekvens)
Högsta 2 - 16 kHz
(+) | balanserade toppar - endast 3.1% från medianen
(+) | toppar är linjära (5.7% delta till föregående frekvens)
Totalt 100 - 16 000 Hz
(±) | linjäriteten för det totala ljudet är genomsnittlig (21.8% skillnad mot median)
Jämfört med samma klass
» 78% av alla testade enheter i den här klassen var bättre, 6% liknande, 16% sämre
» Den bästa hade ett delta på 6%, genomsnittet var 18%, sämst var 132%
Jämfört med alla testade enheter
» 62% av alla testade enheter var bättre, 7% liknande, 31% sämre
» Den bästa hade ett delta på 4%, genomsnittet var 23%, sämst var 134%
Energihantering
Strömförbrukning
Våra resultat är mycket delade när det gäller den bärbara datorns strömförbrukning. Även om G15 bara förbrukade i genomsnitt 12 watt på tomgång, vilket är en mycket liten mängd för en bärbar speldator, är de 100 till 262 watt som den krävde under belastning oerhört höga i förhållande till den prestanda som erbjuds.
| Av/Standby | |
| Låg belastning | |
| Hög belastning |
|
Förklaring:
min: | |
| Dell G15 5530, i5-13450HX RTX 4050 i5-13450HX, GeForce RTX 4050 Laptop GPU | Medion Erazer Crawler E40 - MD 62518 i5-13500H, GeForce RTX 4050 Laptop GPU | Lenovo LOQ 15IRH8 Core i7 i7-13620H, GeForce RTX 4050 Laptop GPU | Asus TUF A15 FA507 R7 7735HS, GeForce RTX 4050 Laptop GPU | Dell G15 5530 i7-13650HX, GeForce RTX 4060 Laptop GPU | Genomsnitt av klass Gaming | |
|---|---|---|---|---|---|---|
| Power Consumption | -58% | -148% | -30% | -53% | -122% | |
| Idle Minimum * (Watt) | 2 | 10 -400% | 18.52 -826% | 8 -300% | 8.4 -320% | 13 ? -550% |
| Idle Average * (Watt) | 12 | 15.3 -28% | 22.54 -88% | 12.1 -1% | 14.98 -25% | 19 ? -58% |
| Idle Maximum * (Watt) | 27 | 15.5 43% | 29.79 -10% | 12.5 54% | 15.56 42% | 24.6 ? 9% |
| Load Average * (Watt) | 100 | 88 12% | 94.5 5% | 74.9 25% | 96.8 3% | 110.7 ? -11% |
| Witcher 3 ultra * (Watt) | 161.9 | 155 4% | 154.4 5% | 136.6 16% | 186 -15% | |
| Load Maximum * (Watt) | 262 | 202.47 23% | 190.4 27% | 185 29% | 271.42 -4% | 259 ? 1% |
* ... mindre är bättre
Power consumption Witcher 3 / Stresstest
Power consumption with external monitor
Batteriets livslängd
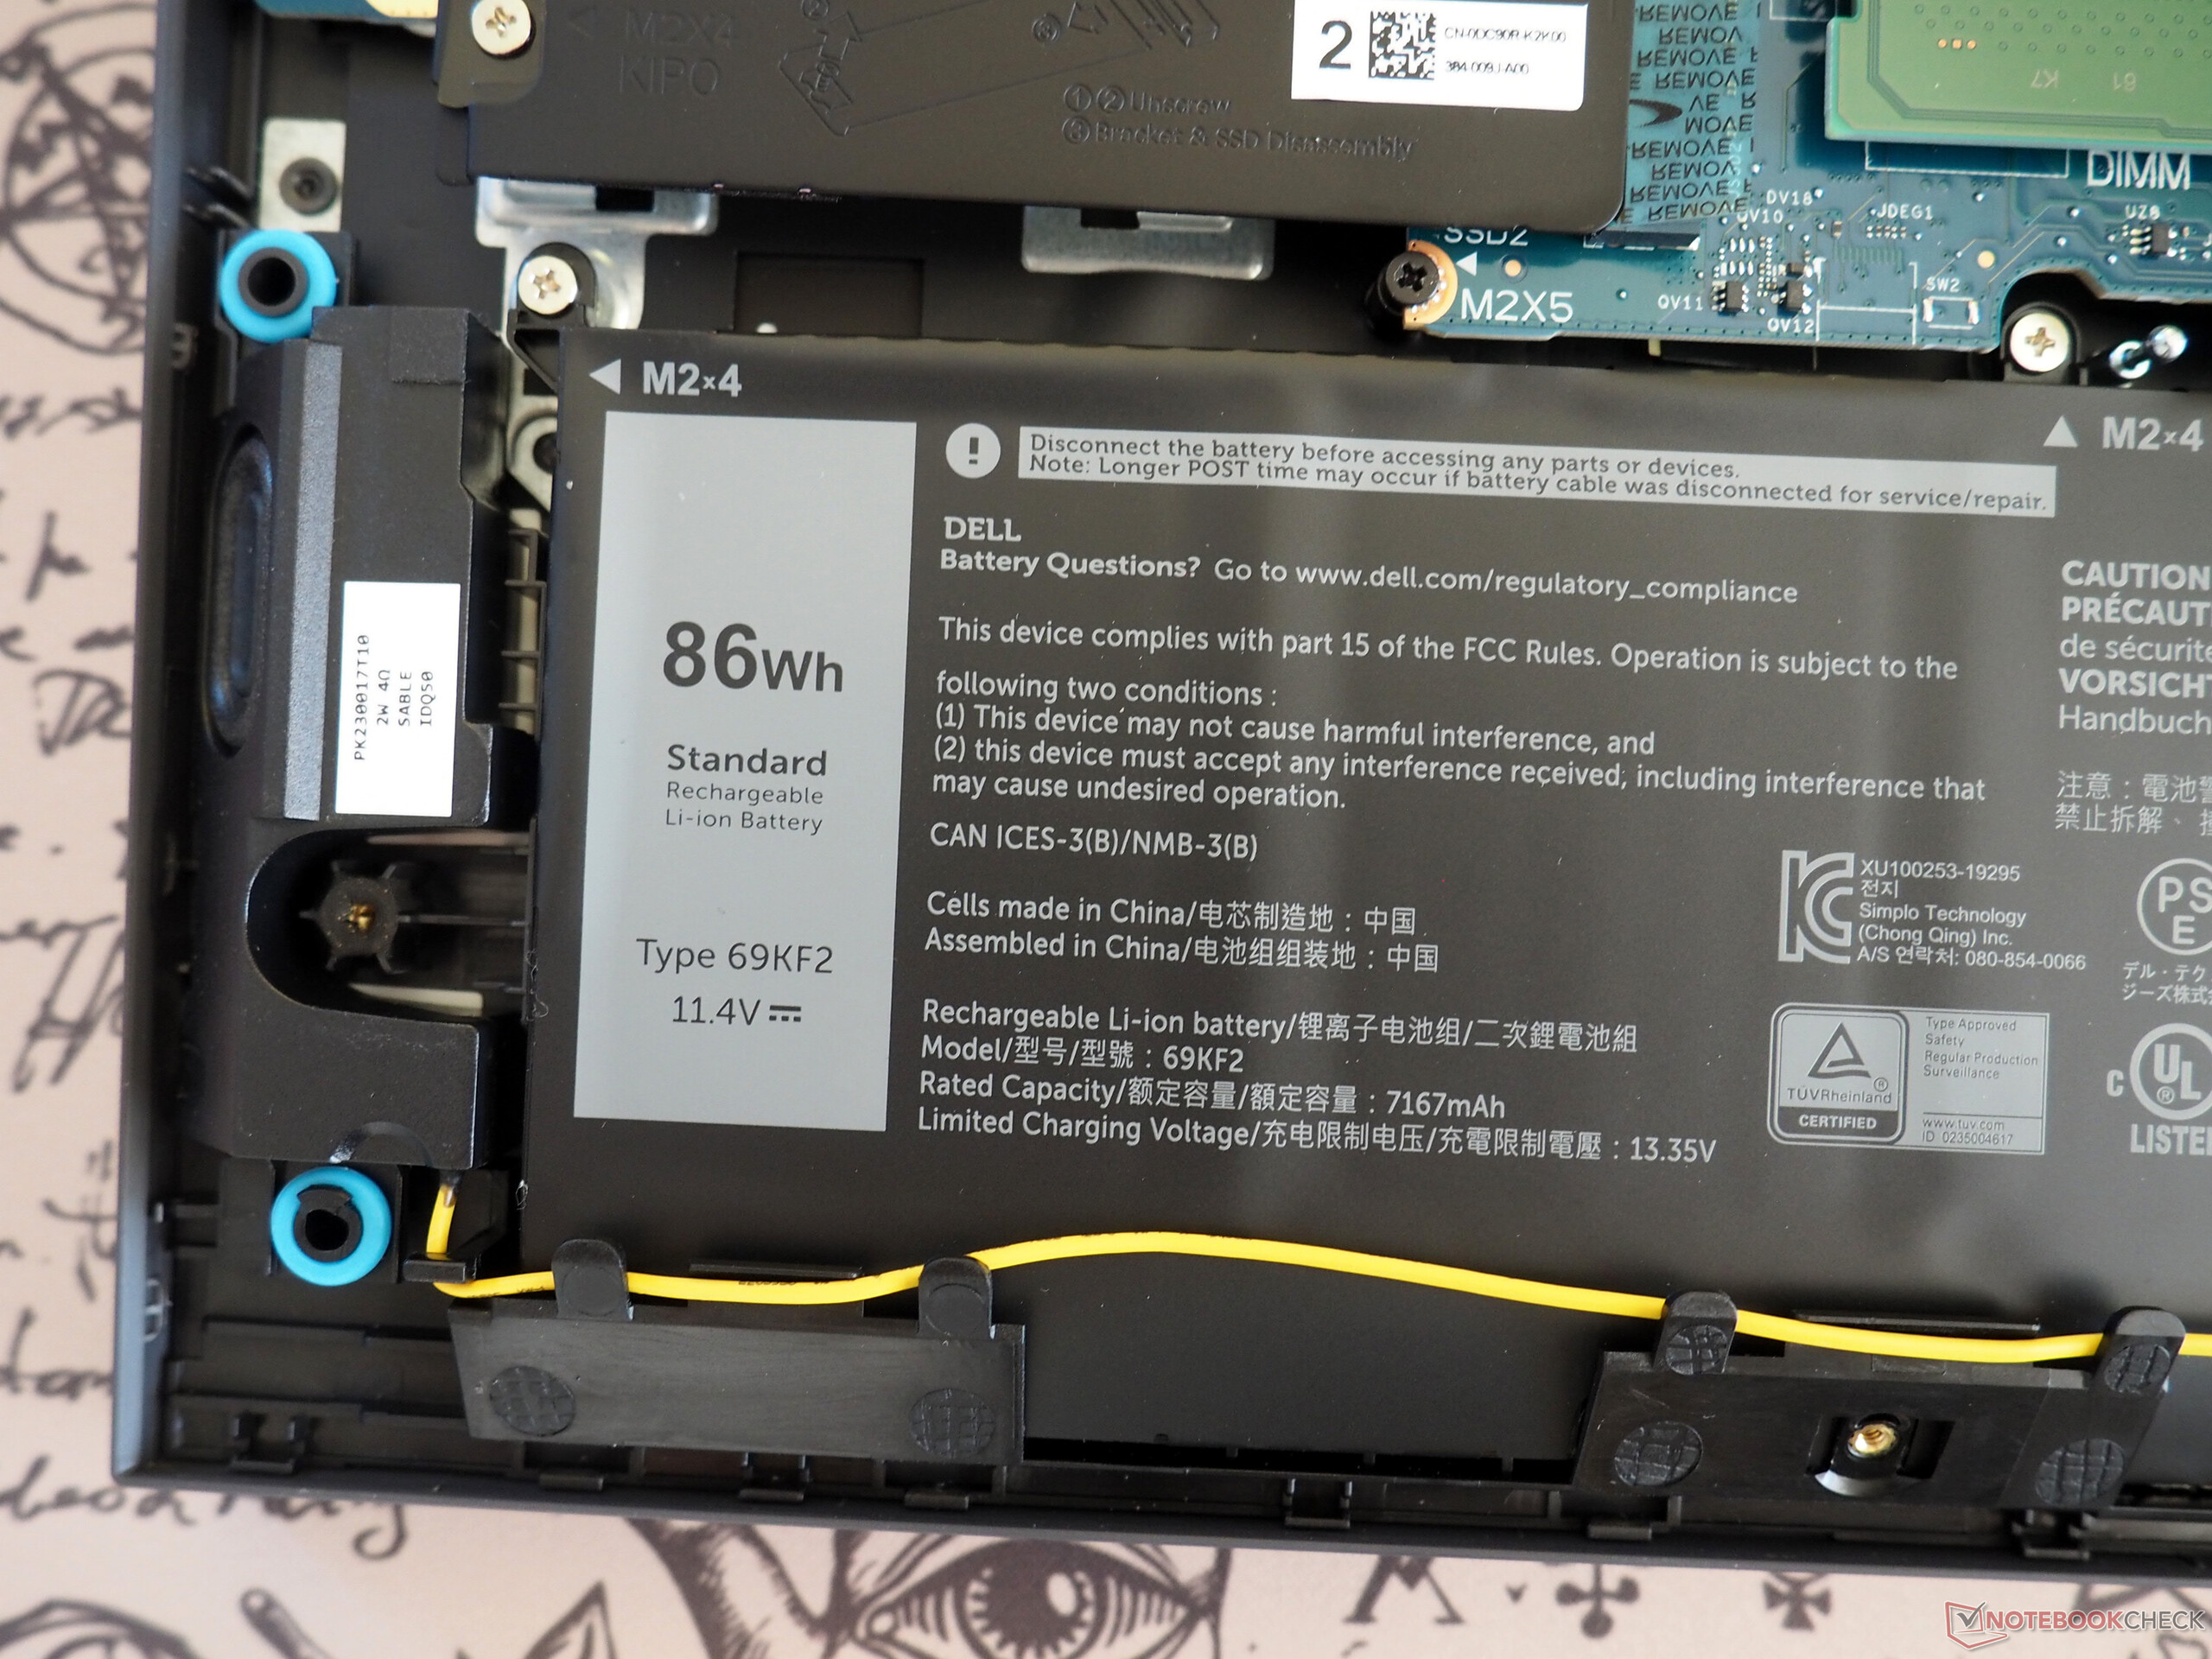
Batteritiden är mer än anständig på G15, inte minst tack vare grafikomkopplingen. I vårt Wi-Fi-test (med skärmens ljusstyrka reducerad till 150 cd/m²) lyckades vi få ut ungefär 7 timmars användning från det enorma 86 Wh-batteriet.
| Dell G15 5530, i5-13450HX RTX 4050 i5-13450HX, GeForce RTX 4050 Laptop GPU, 86 Wh | Medion Erazer Crawler E40 - MD 62518 i5-13500H, GeForce RTX 4050 Laptop GPU, 54 Wh | Lenovo LOQ 15IRH8 Core i7 i7-13620H, GeForce RTX 4050 Laptop GPU, 60 Wh | Asus TUF A15 FA507 R7 7735HS, GeForce RTX 4050 Laptop GPU, 90 Wh | Dell G15 5530 i7-13650HX, GeForce RTX 4060 Laptop GPU, 86 Wh | Genomsnitt av klass Gaming | |
|---|---|---|---|---|---|---|
| Batteridrifttid | -42% | -17% | 65% | -8% | 0% | |
| WiFi v1.3 (h) | 7.1 | 4.1 -42% | 5.9 -17% | 11.7 65% | 6.5 -8% | 7.11 ? 0% |
| H.264 (h) | 3.9 | 6.1 | 12.5 | 6.8 | 8.32 ? | |
| Load (h) | 1.2 | 1 | 0.8 | 1.502 ? | ||
| Witcher 3 ultra (h) | 0.8 |
För
Emot
Dom
Dell G15 5530 med en Core i5-13450HX och GeForce RTX 4050 ärver de flesta av styrkorna och svagheterna hos sitt dyrare syskon med en i7-13650HX och RTX 4060. På plussidan har enheten bland annat en relativt bra skärm, stabil batteritid och rimlig valuta för pengarna.
På minussidan har vi dock ett ganska tungt och klumpigt chassi, en onödigt klumpig laddare och ett bristfälligt portval (ingen USB4 och kortläsare). Dell bör också arbeta på att ta itu med den massiva SSD-strypningen under ihållande stress samt strömförbrukningen under belastning.
I vilket fall som helst är G15 5530 ett bra alternativ för budgetmedvetna spelare som letar efter en lämplig spelmaskin i prisklassen 1 000 euro (1 090 USD).
De konkurrenter som nämns i recensionen (Medion Crawler E40, Asus TUF A15 och Lenovo LOQ 15) ger i stort sett samma prestanda, men har ibland andra fördelar och nackdelar.
Pris och tillgänglighet
Dell G15 5530 med en Core i5-13450HX och GeForce RTX 4050 är för närvarande tillgänglig från Amazon Tyskland för €950. I USA kan du köpa en liknande version direkt från Dell för 900 USD eller modellen med en Core i7-13650HX och en RTX 4060 från Amazon US för 1 200 USD.
Dell G15 5530, i5-13450HX RTX 4050
- 01/23/2024 v7 (old)
Florian Glaser
Genomskinlighet
Valet av enheter som ska granskas görs av vår redaktion. Testprovet gavs till författaren som ett lån av tillverkaren eller återförsäljaren för denna recension. Långivaren hade inget inflytande på denna recension och inte heller fick tillverkaren en kopia av denna recension innan publiceringen. Det fanns ingen skyldighet att publicera denna recension. Som ett oberoende medieföretag är Notebookcheck inte föremål för auktoritet från tillverkare, återförsäljare eller förlag.
This is how Notebookcheck is testingEvery year, Notebookcheck independently reviews hundreds of laptops and smartphones using standardized procedures to ensure that all results are comparable. We have continuously developed our test methods for around 20 years and set industry standards in the process. In our test labs, high-quality measuring equipment is utilized by experienced technicians and editors. These tests involve a multi-stage validation process. Our complex rating system is based on hundreds of well-founded measurements and benchmarks, which maintains objectivity.
Price comparison

