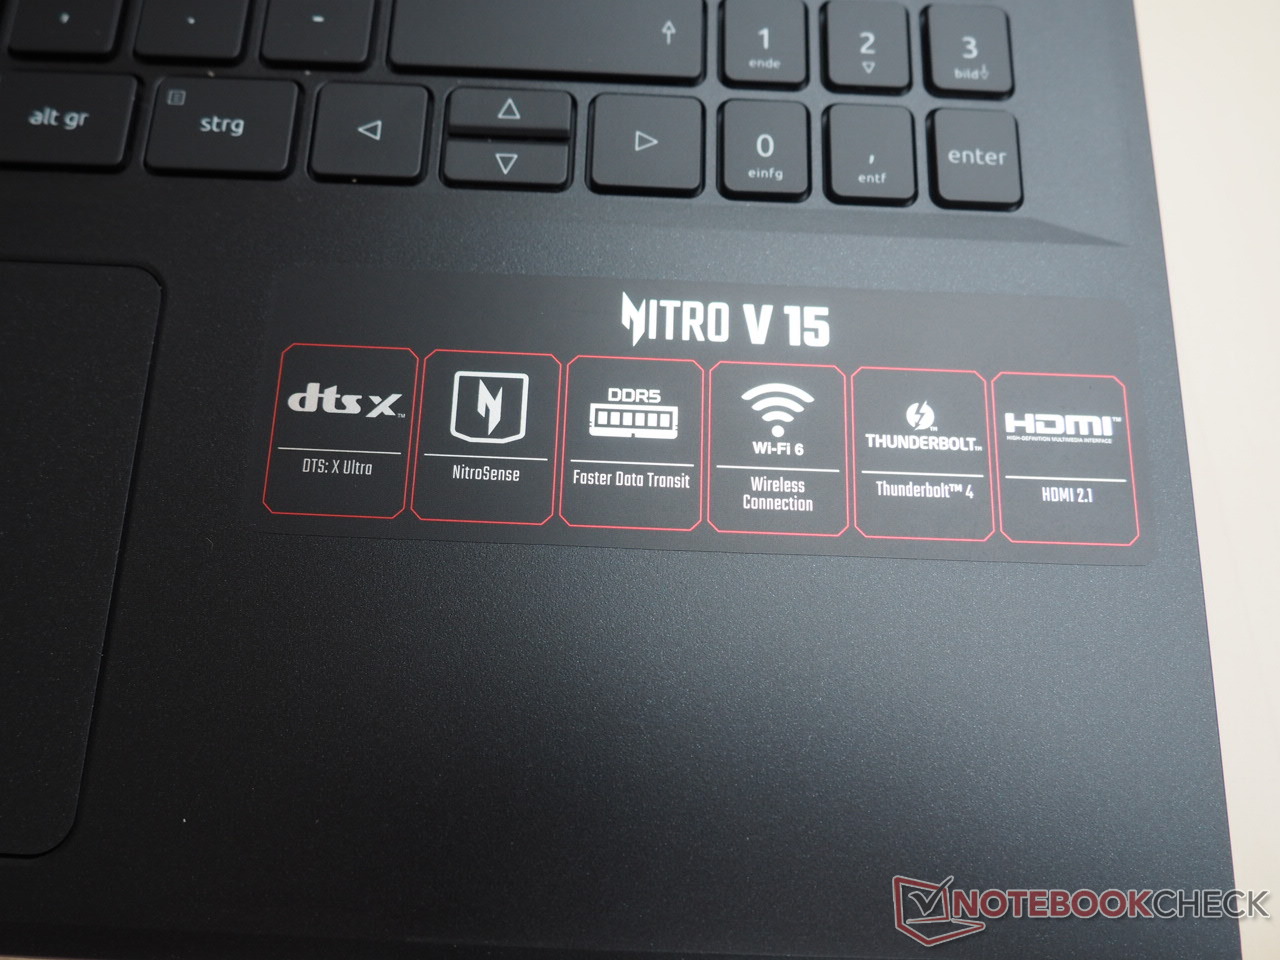
Acer Nitro V 15 ANV15-51 recension: Budgetlaptop för spel med RTX 4050
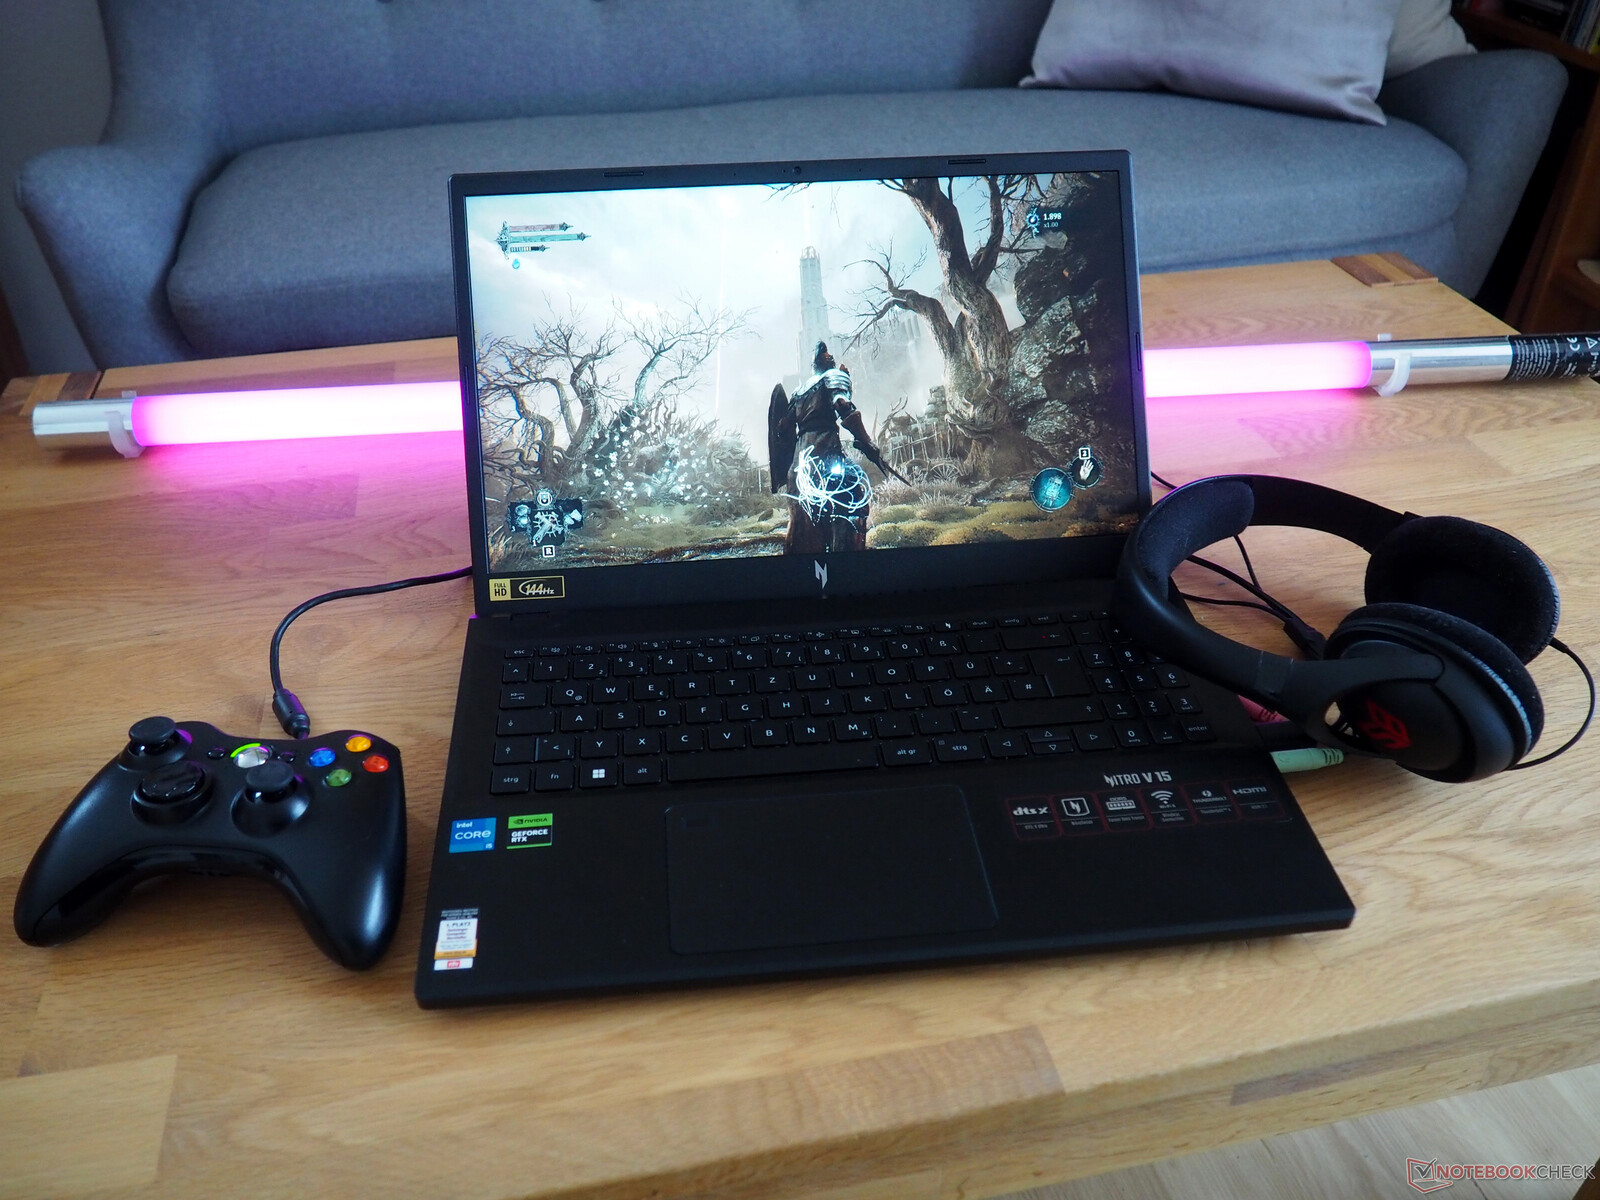
Två huvudvarianter av Nitro V 15 finns tillgängliga i Tyskland just nu. Medan basmodellen som presenteras i denna recension kostar cirka 900 € (980 USD) och levereras med en Core i5-13420H (12 trådar) och en 512 GB SSD, kommer den dyrare modellen att kosta dig ungefär 200 € (218 USD) mer och har en Core i7-13620H (16 trådar) och en 1 TB-enhet. Båda varianterna är konfigurerade med samma 16 GB DDR5 RAM-minne och en dedikerad GeForce RTX 4050. De använder också en matt IPS-skärm med den vanliga Full HD-upplösningen (1 920 x 1 080) och 144Hz-kapacitet.
Nitro V 15 konkurrerar med andra 15-tums bärbara budgetdatorer för spel med en GeForce RTX 4050, t.ex Medion Erazer Crawler E40, den Lenovo LOQ 15IRH8, Asus TUF A15 FA507 och Schenker XMG Apex 15 Late 23som alla är listade i tabellerna nedan för jämförelseändamål.
Potentiella konkurrenter i jämförelse
Gradering | Datum | Modell | Vikt | Höjd | Storlek | Upplösning | Pris |
|---|---|---|---|---|---|---|---|
| 82.8 % v7 (old) | 01/2024 | Acer Nitro V 15 ANV15-51-582S i5-13420H, GeForce RTX 4050 Laptop GPU | 2.1 kg | 23.5 mm | 15.60" | 1920x1080 | |
| 85.4 % v7 (old) | 12/2023 | Medion Erazer Crawler E40 - MD 62518 i5-13500H, GeForce RTX 4050 Laptop GPU | 2.3 kg | 28 mm | 15.60" | 1920x1080 | |
| 85.9 % v7 (old) | 10/2023 | Lenovo LOQ 15IRH8 Core i7 i7-13620H, GeForce RTX 4050 Laptop GPU | 2.4 kg | 25.2 mm | 15.60" | 2560x1440 | |
| 86.3 % v7 (old) | 06/2023 | Asus TUF A15 FA507 R7 7735HS, GeForce RTX 4050 Laptop GPU | 2.2 kg | 24.9 mm | 15.60" | 1920x1080 | |
| 86.2 % v7 (old) | 10/2023 | Schenker XMG Apex 15 (Late 23) R7 7840HS, GeForce RTX 4050 Laptop GPU | 2.2 kg | 26.7 mm | 15.60" | 2560x1440 |
Fall
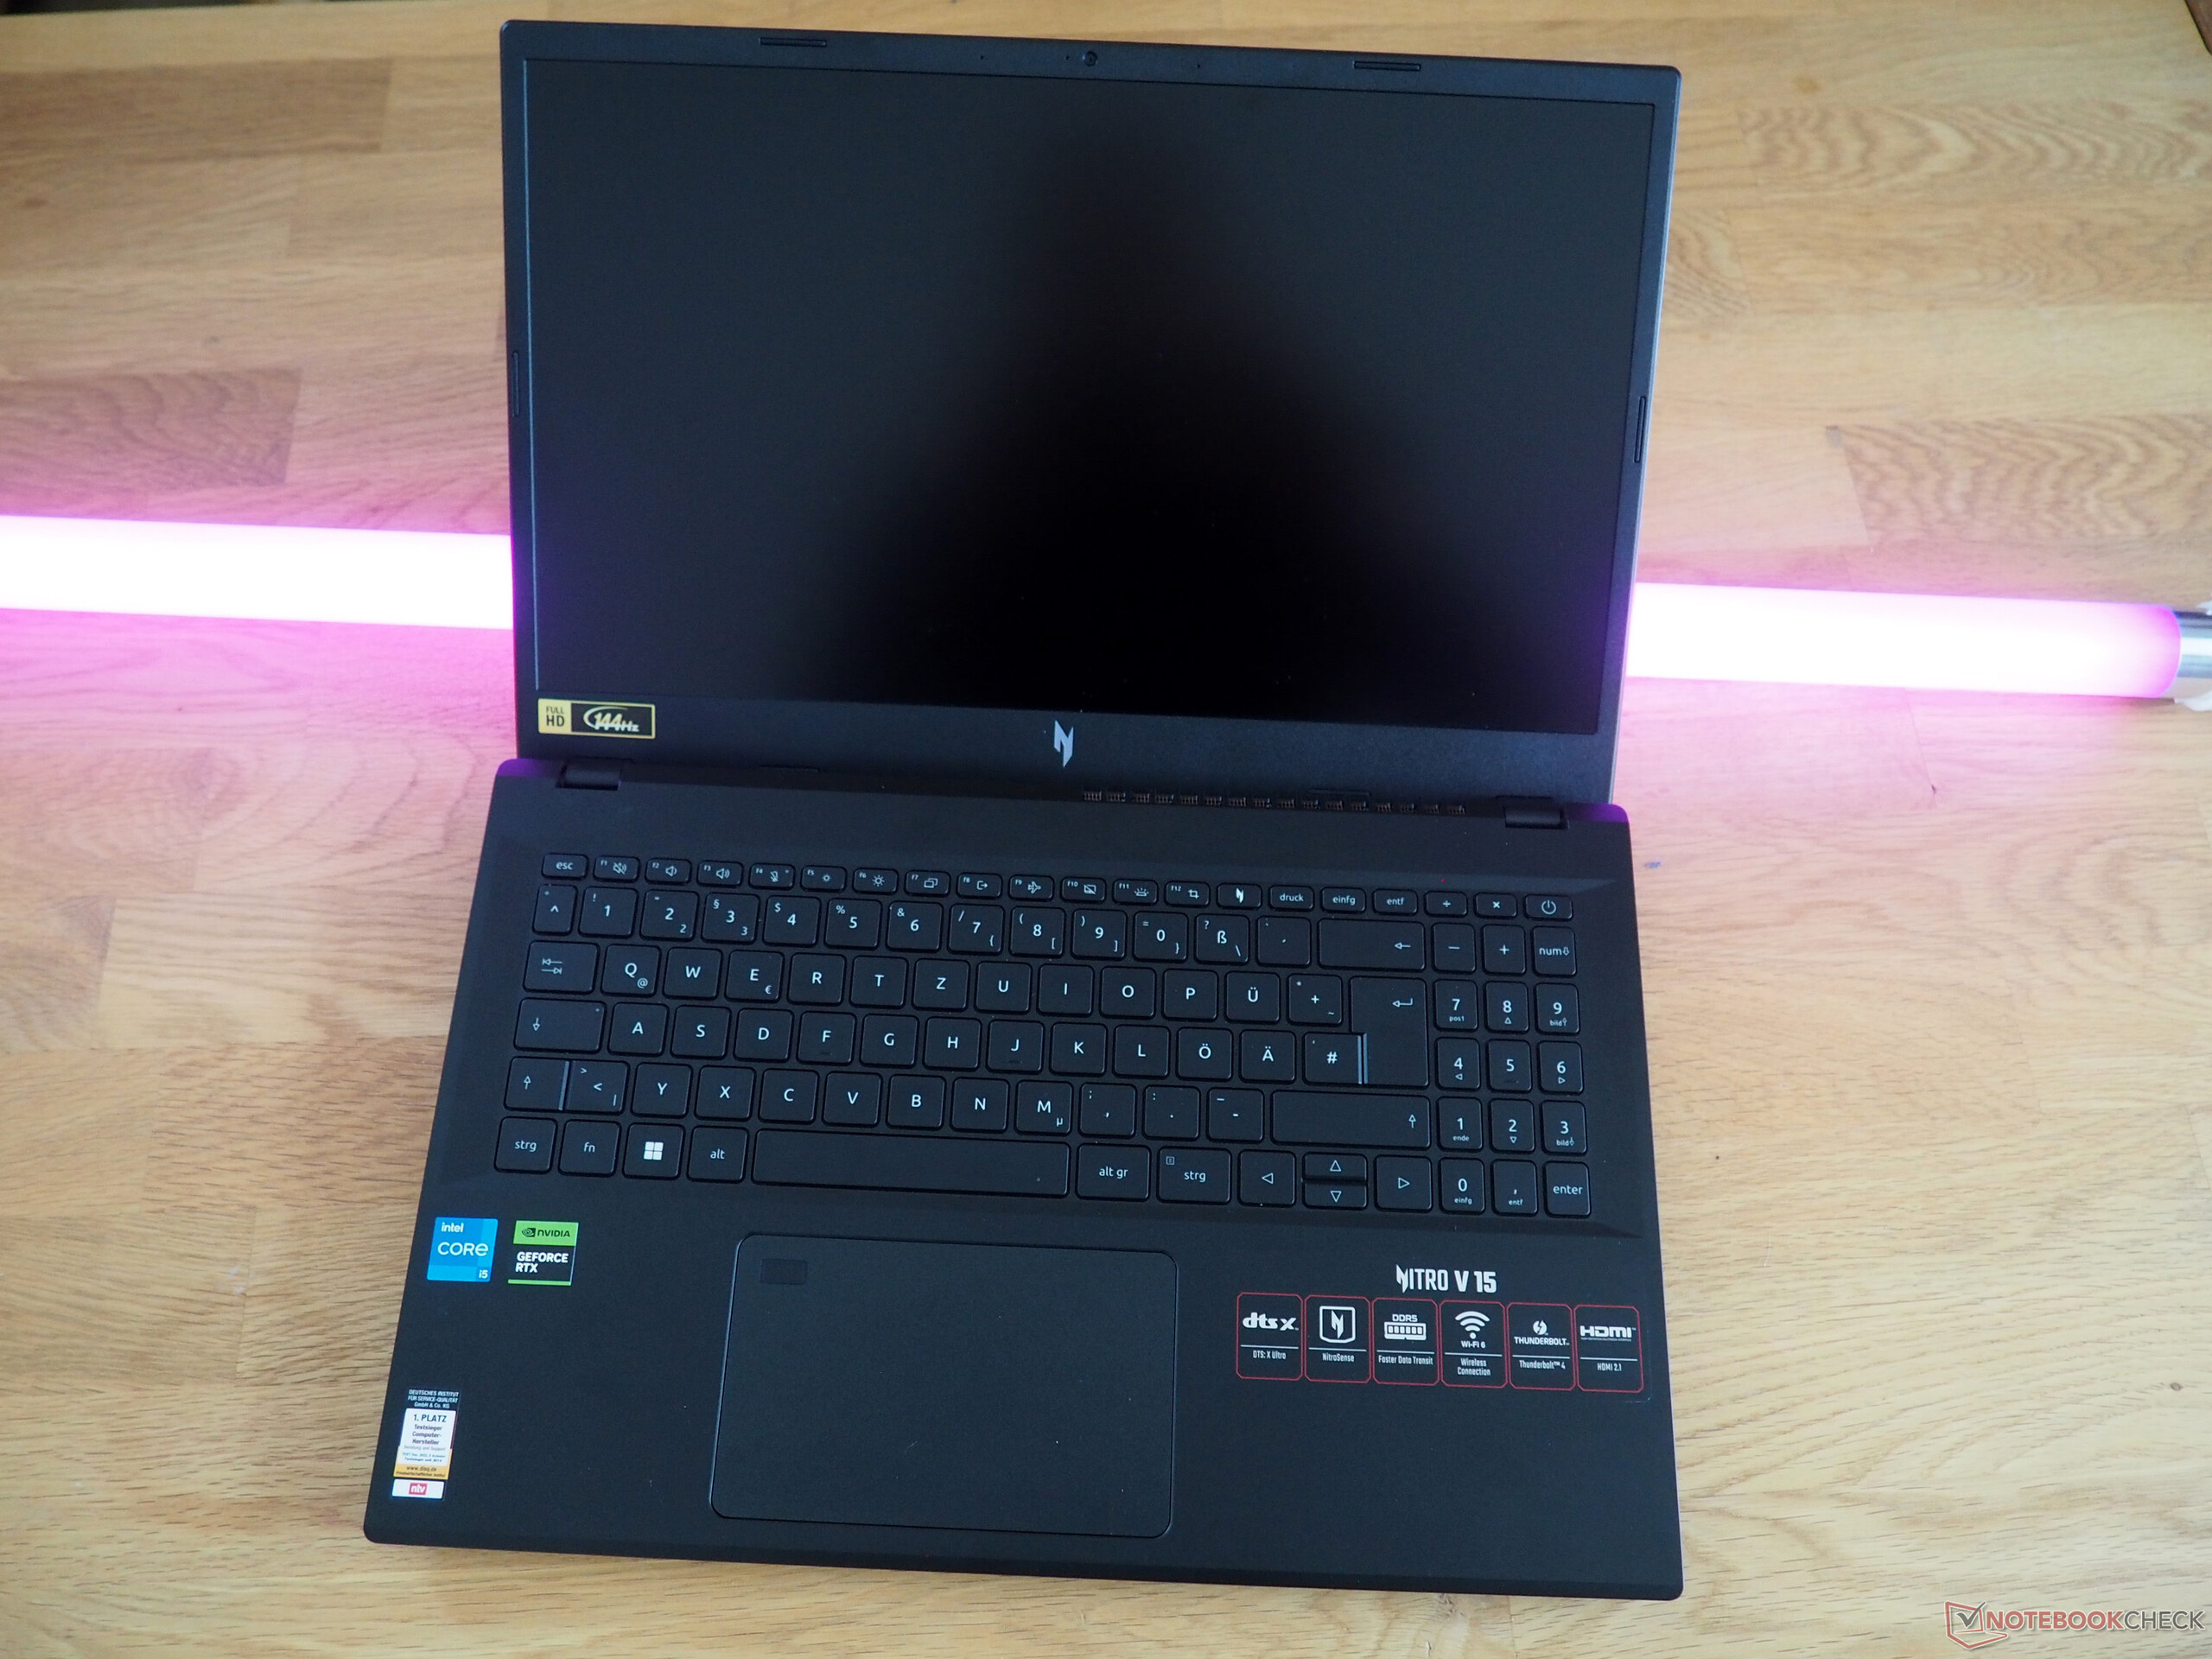
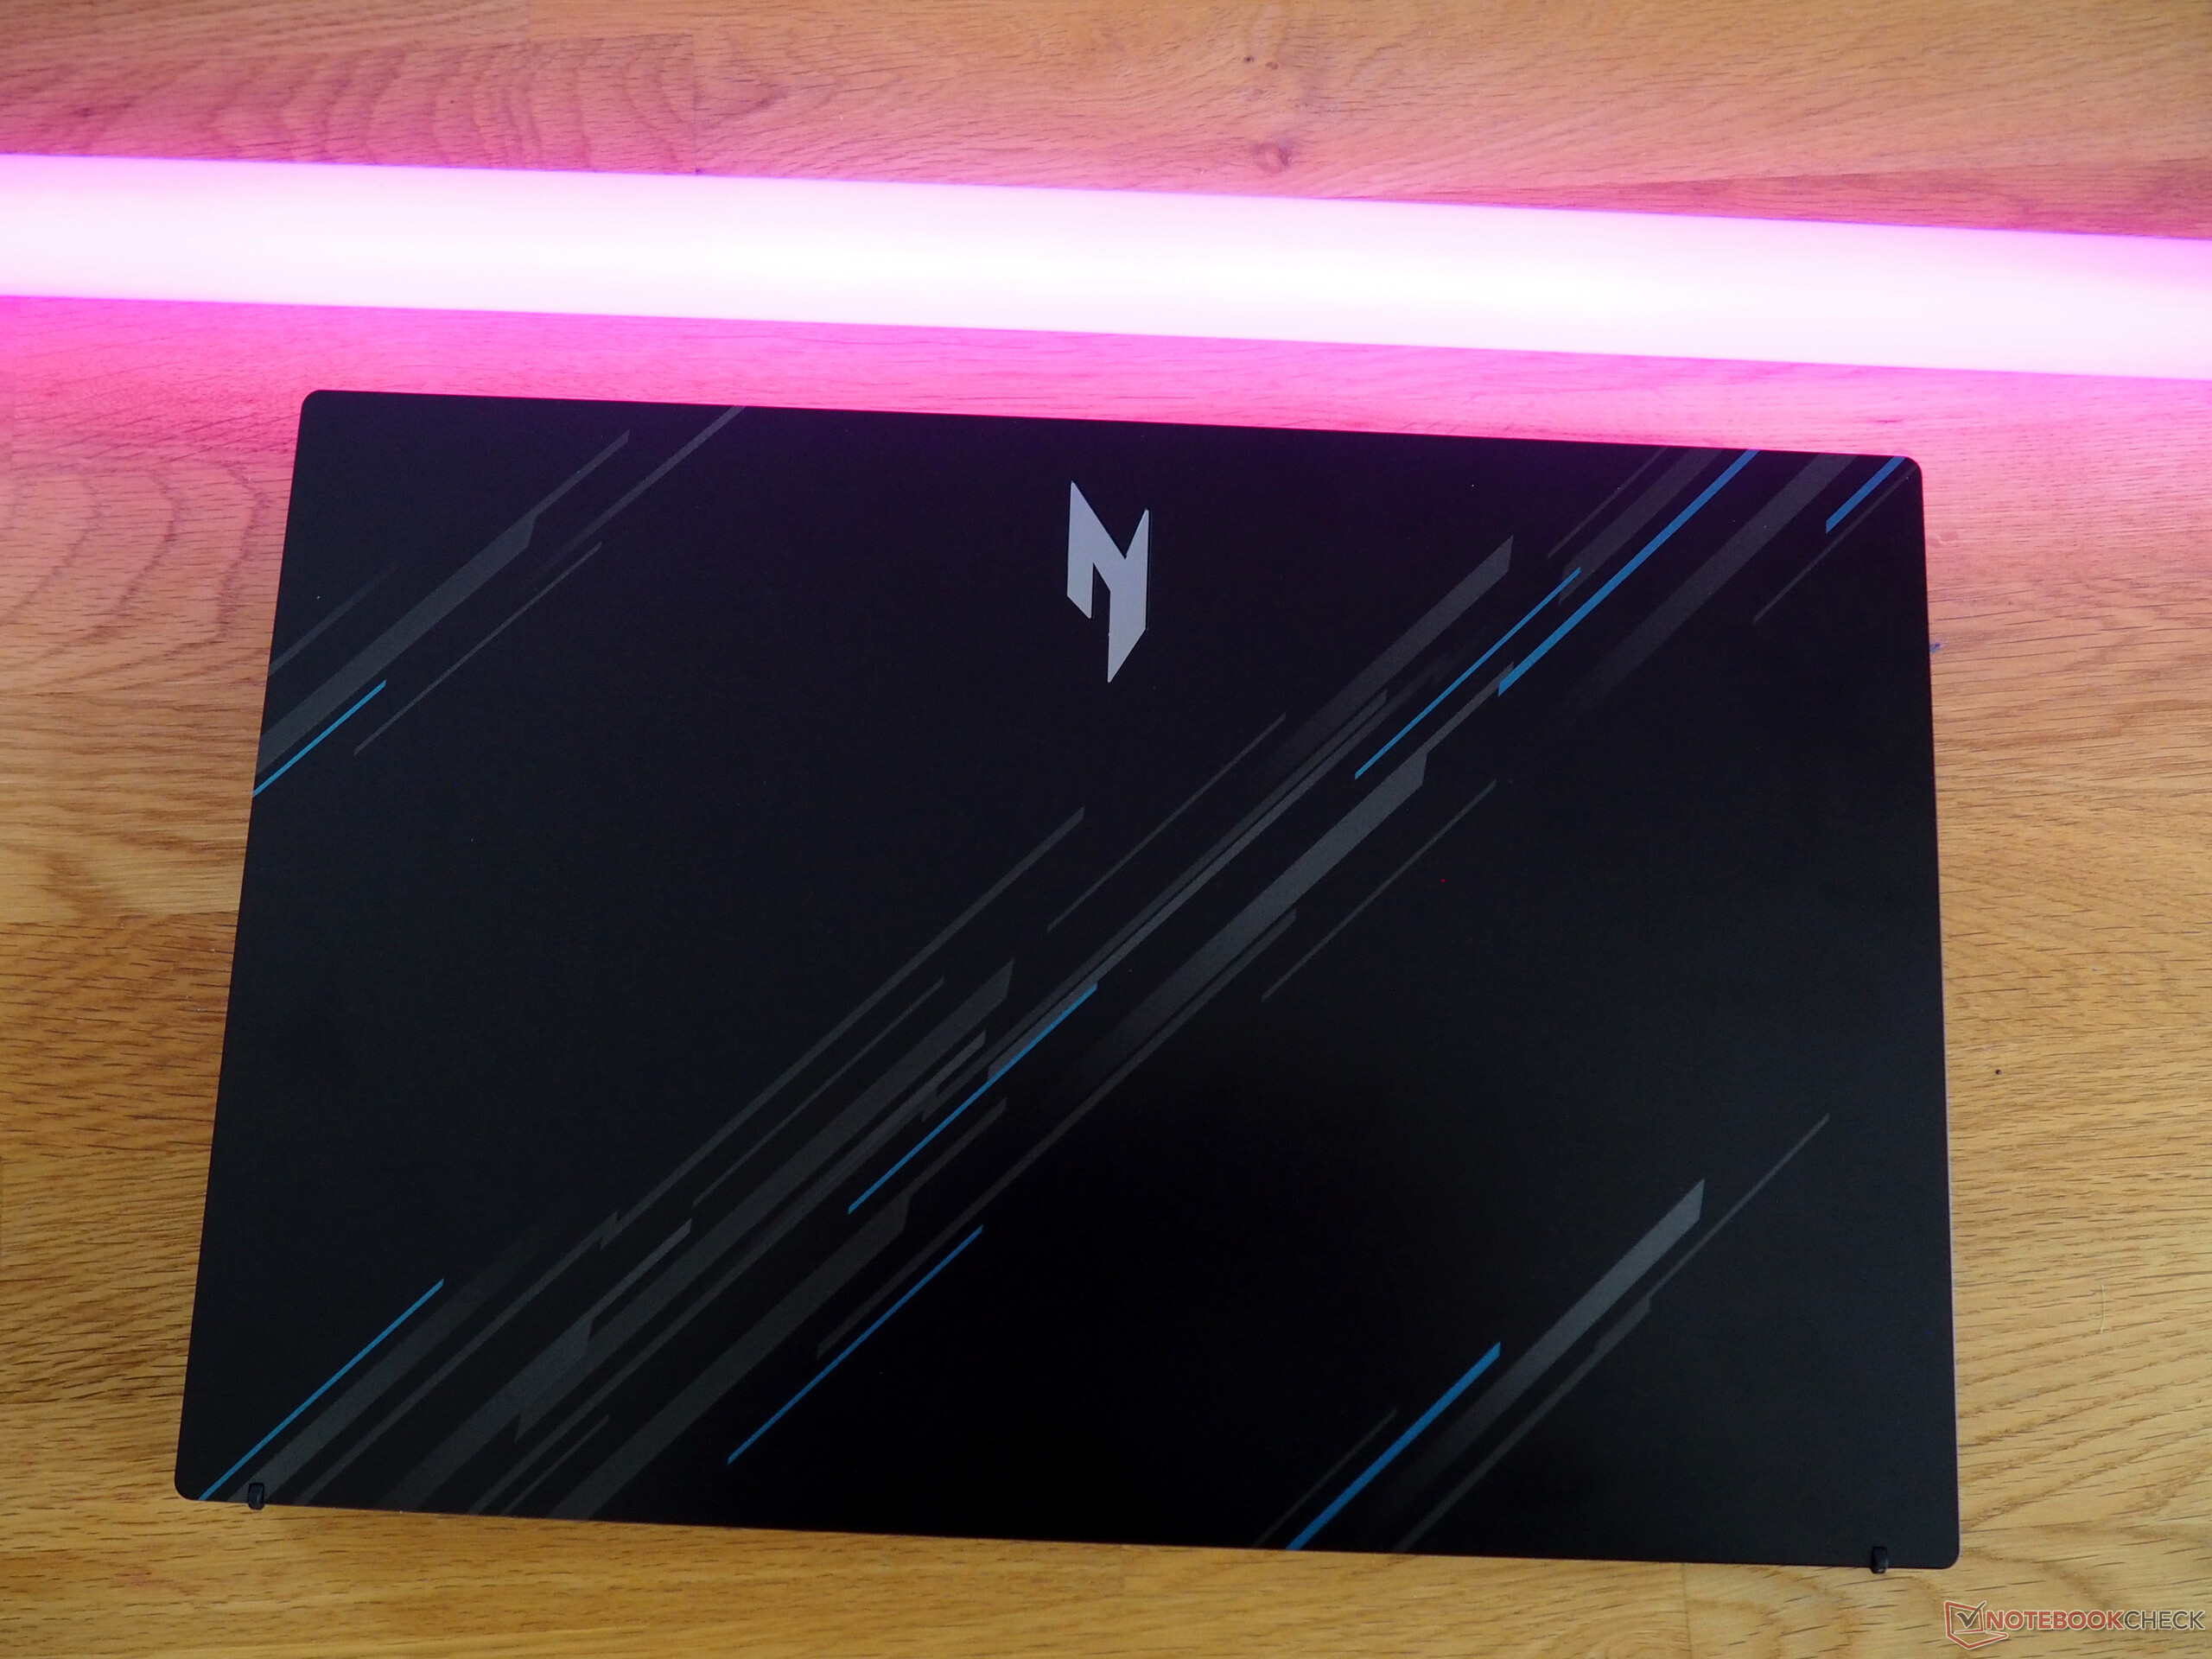
V 15 är estetiskt tilltalande. I synnerhet den gråblå designen på locket ger en frisk fläkt. Du bör dock inte förvänta dig för mycket av chassit när det gäller kvalitet. Precis som många andra enheter i den här prisklassen får köparna nöja sig med ett något bräckligt och inte särskilt robust plastchassi. Åtminstone 15-tumsdatorn har en ren passform och finish samt en solid maximal öppningsvinkel (ca 140°), även om gångjärnen kunde vara något styvare och mindre "vingliga".
En av Nitros största styrkor är dess måttliga vikt: med en vikt på ca 2,1 kg (4,6 lb) är den den lättaste enheten i vår jämförelse (konkurrenterna väger mellan 2,2 och 2,4 kg, eller 4,8 och 6,2 lb). Enheten ser inte heller skrymmande ut tack vare sin smäckra silhuett.
Specifikationer
Gränssnitt
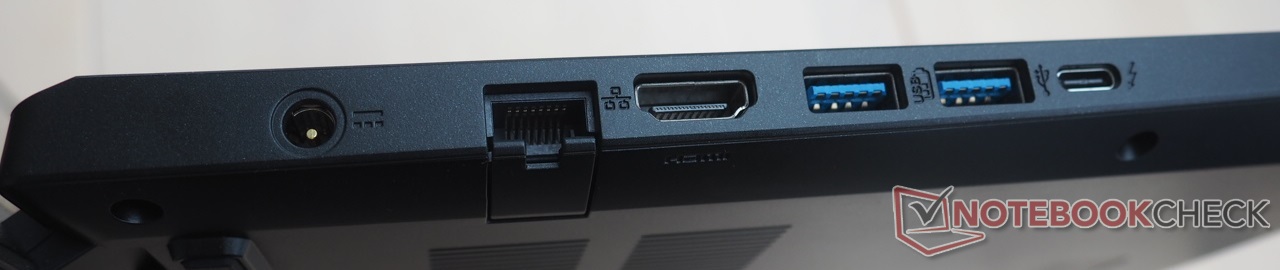
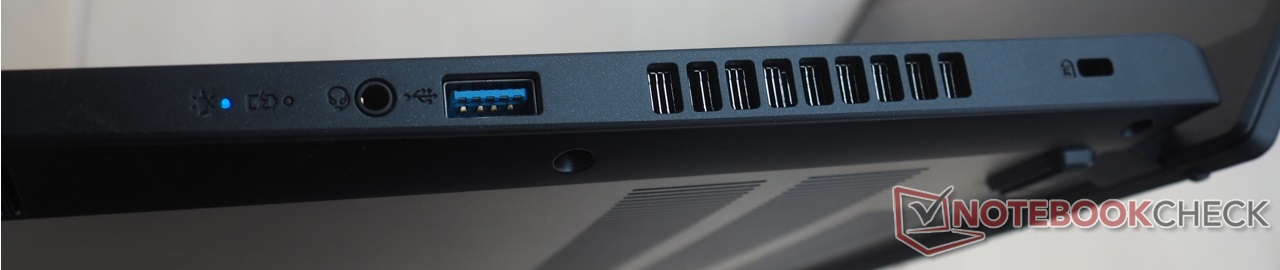
Om du ignorerar avsaknaden av en kortläsare kan portvalet beskrivas som adekvat. Även om vi skulle ha velat se ytterligare en USB-C-port är de tre USB-A 3.0- och en Thunderbolt 4-port fortfarande anständiga för en budgetlaptop för spel. Nitro V 15 har också en utfällbar Ethernet-port, en HDMI 2.1-utgång, ett ljuduttag och en Kensington-plats. Gränssnitten är ganska väl fördelade över enheten. Några av portarna kunde dock ha placerats något längre bak för att göra det enklare att använda en mus.
Anslutningsmöjligheter
Wi-Fi-prestandan är i bästa fall medioker. Den inbyggda trådlösa Intel-modulen (Wi-Fi 6 AX203) levererar inte topprestanda vid sändning och mottagning av data, men de hastigheter vi uppnådde var ganska stabila.
Webbkamera
På samma sätt får du bara en oansenlig standardwebbkamera med den bärbara datorn. Som så ofta är fallet med webbkameror till bärbara datorer saknar bilderna skärpa och färgåtergivning.


Tillbehör
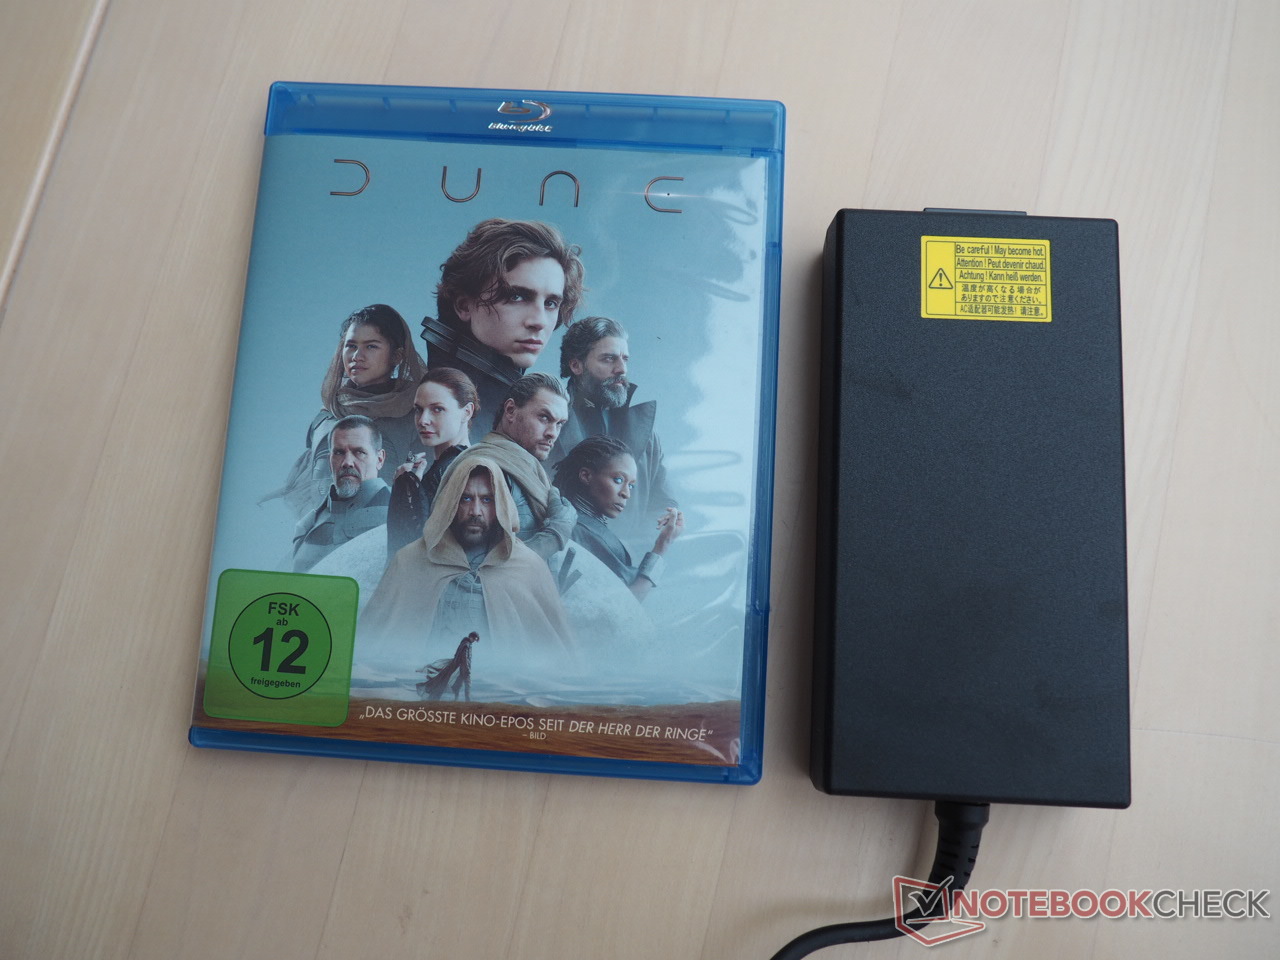
Förutom en massa dokument hittar du också en behagligt kompakt och lätt 135-watts nätadapter i kartongen.
Underhåll
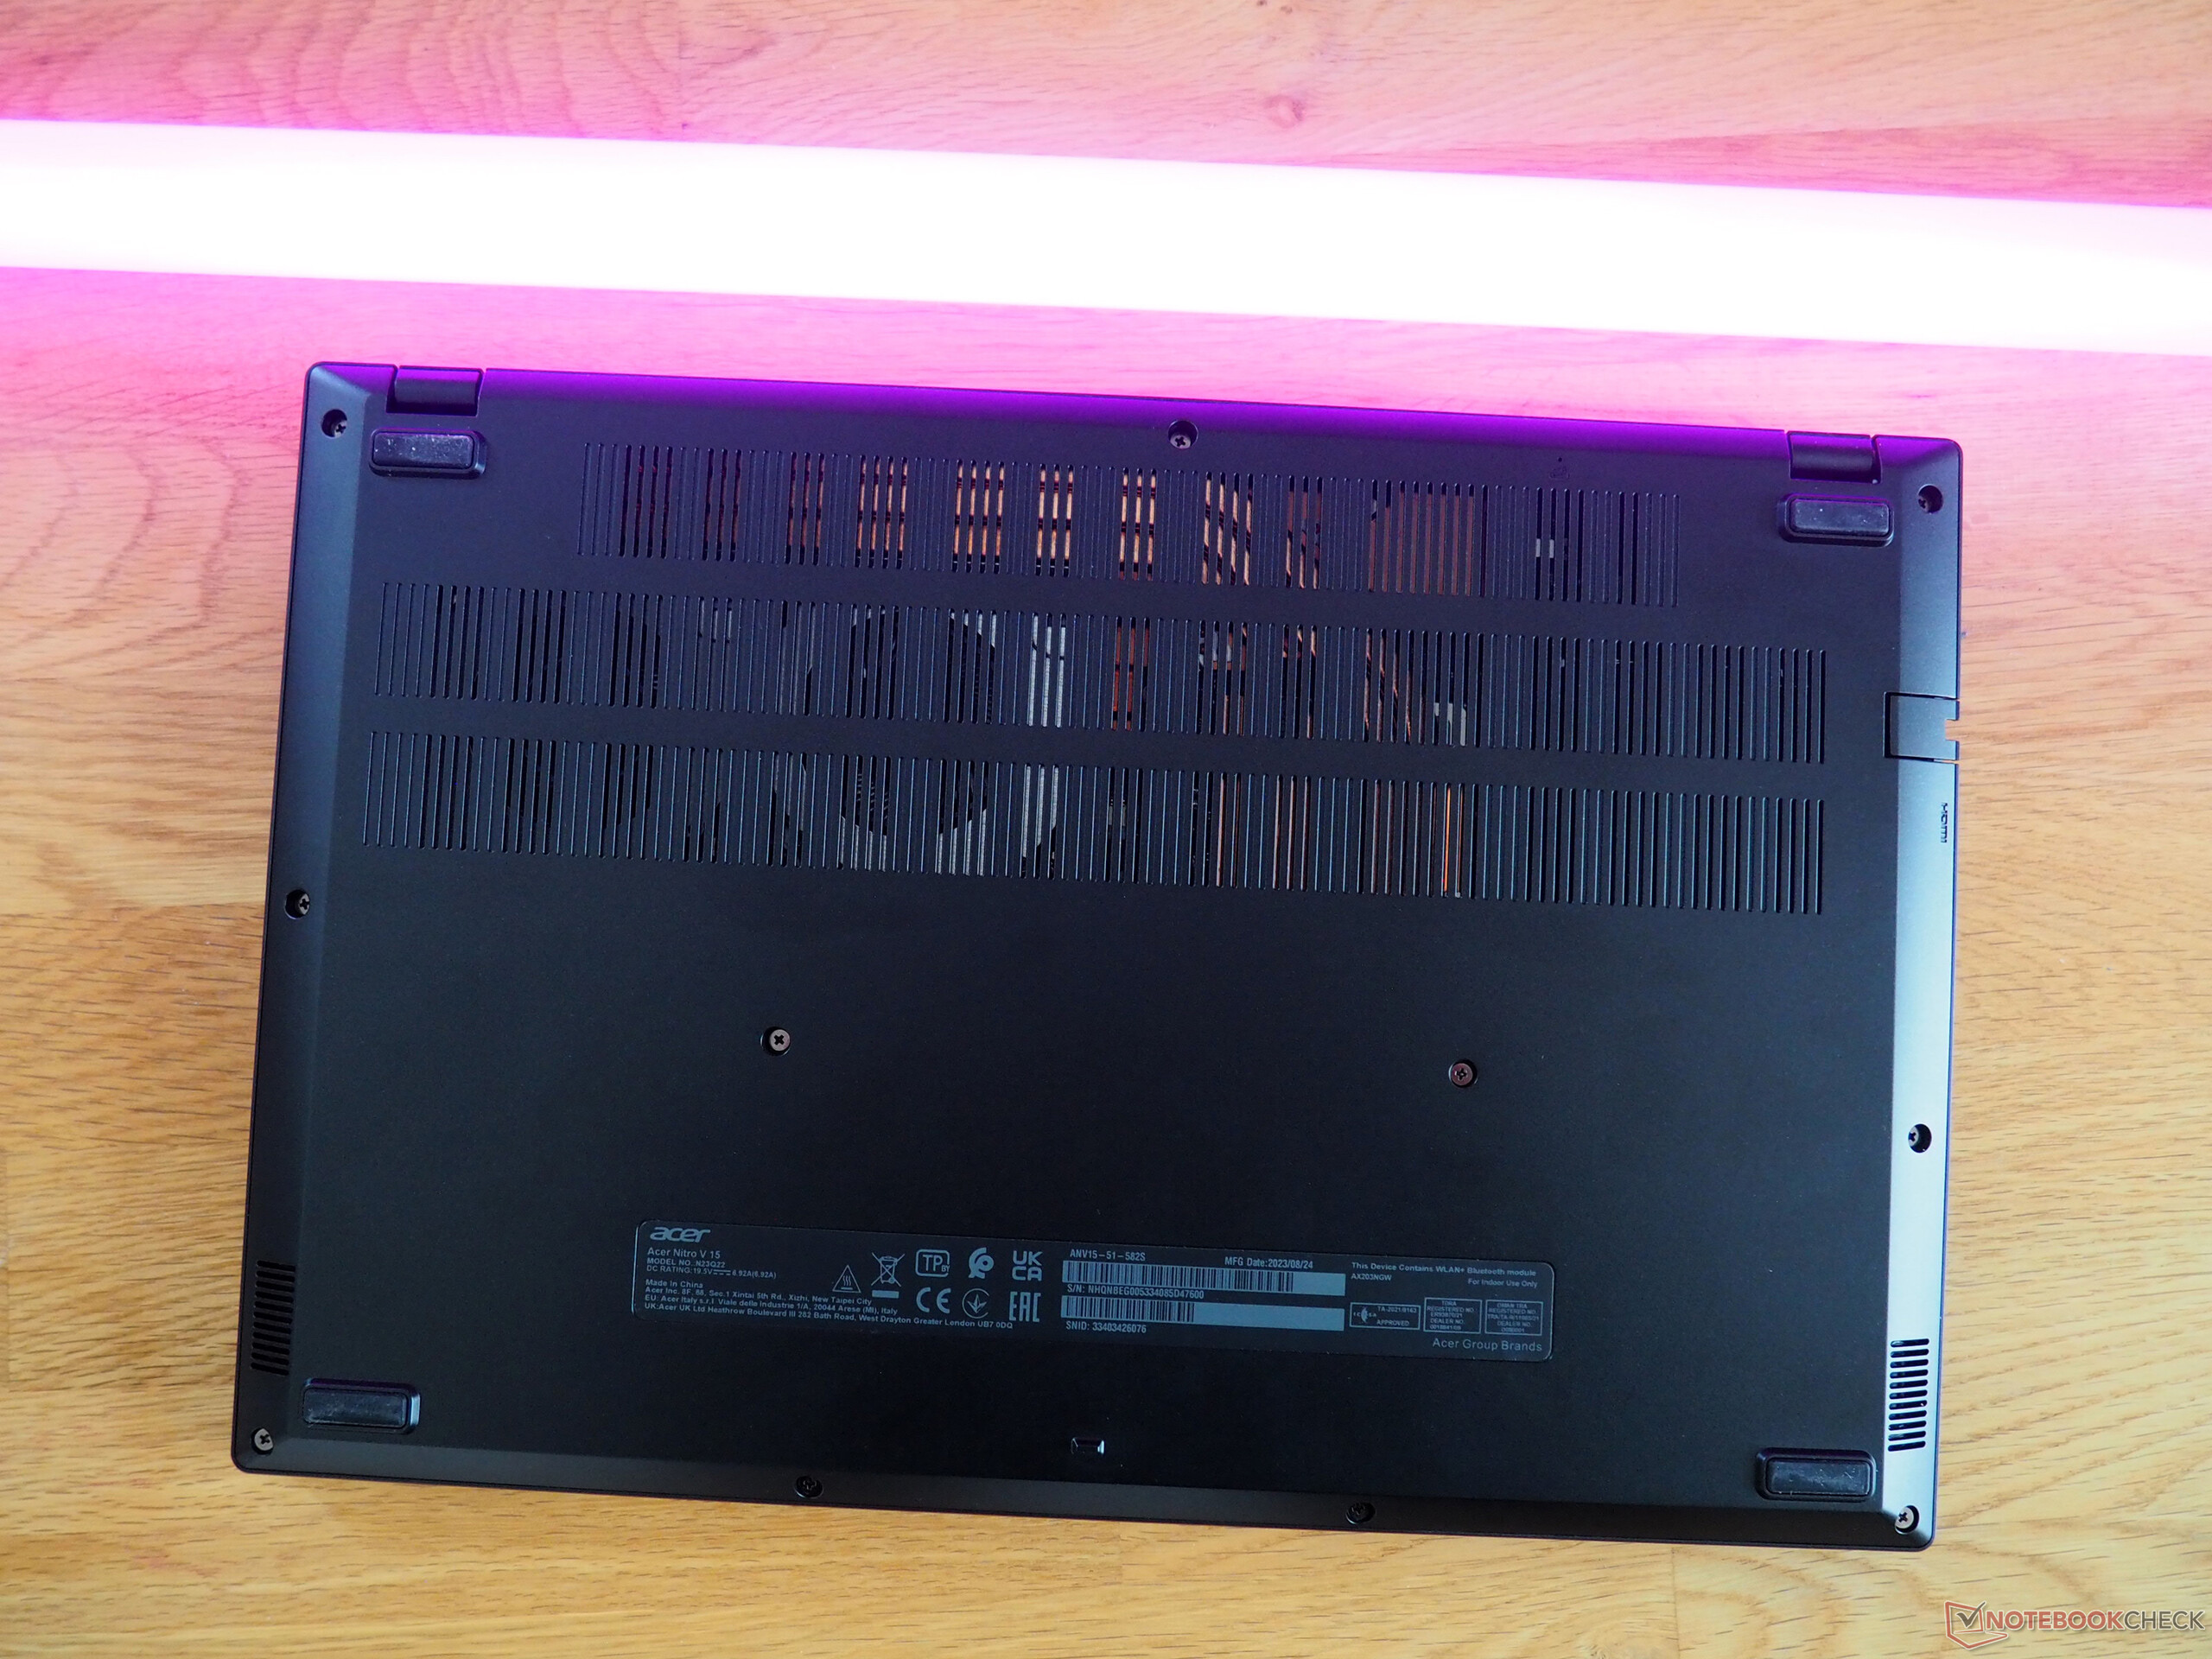
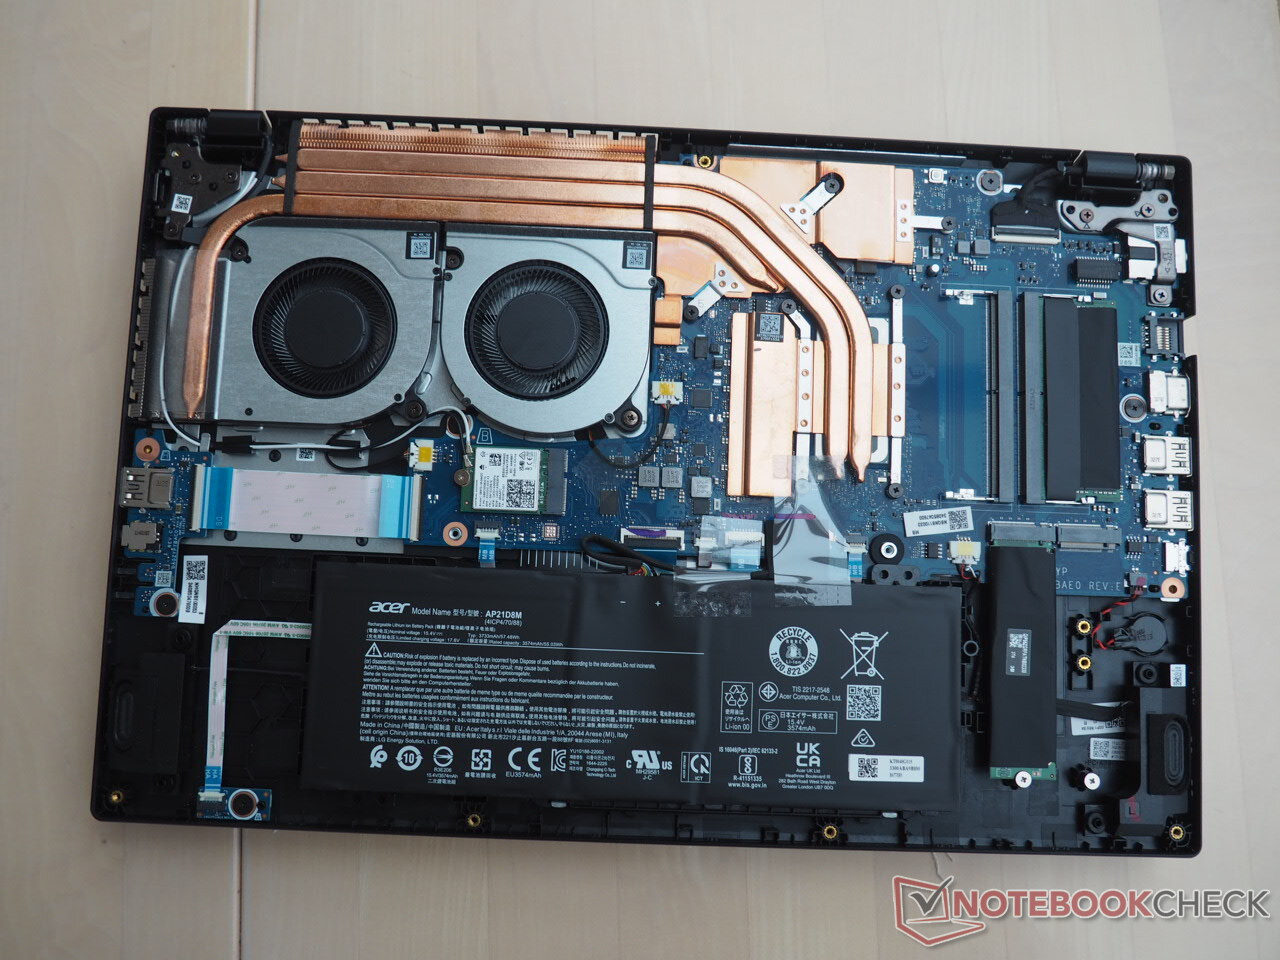
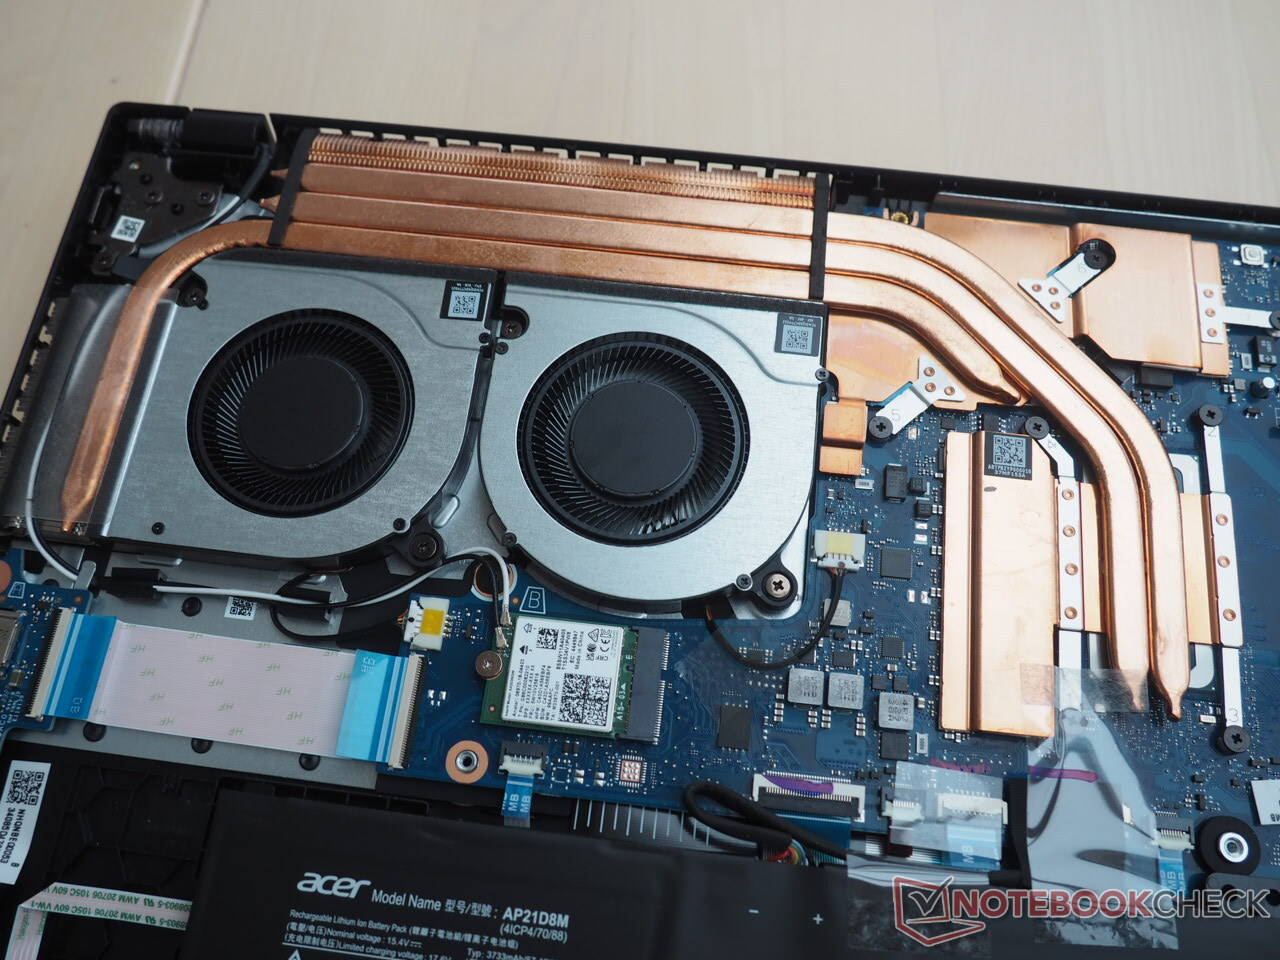
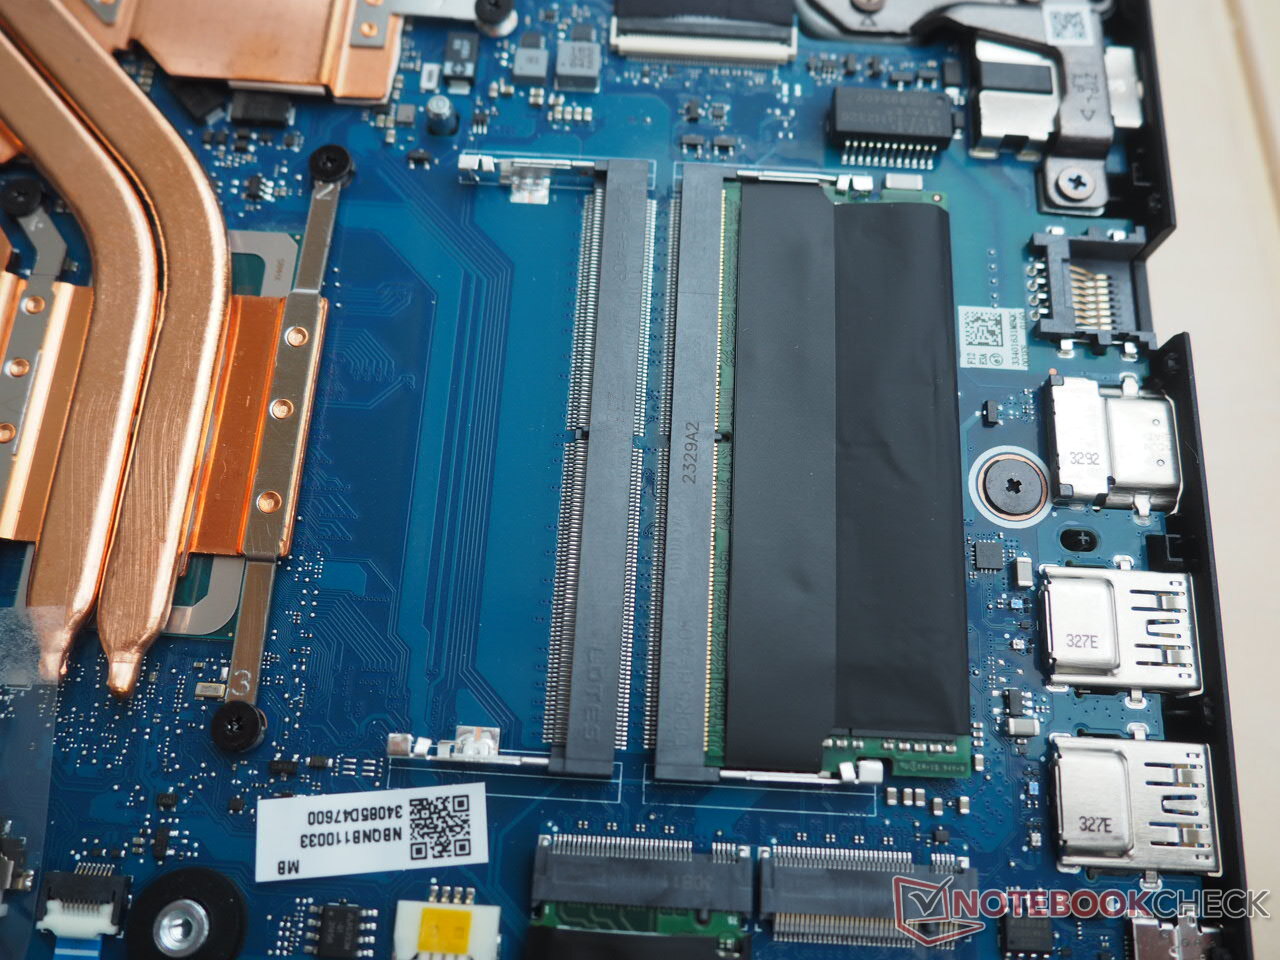
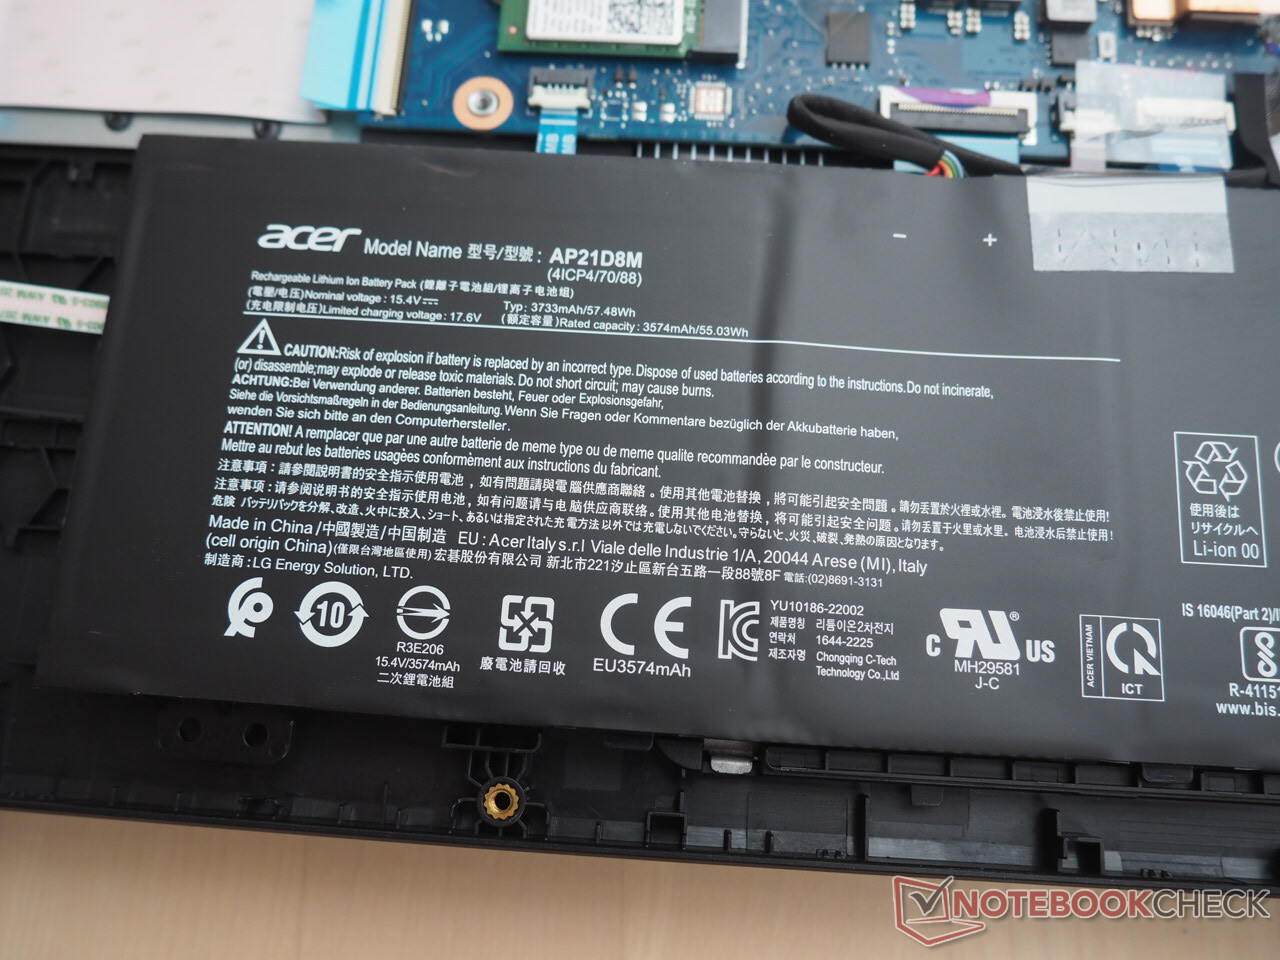
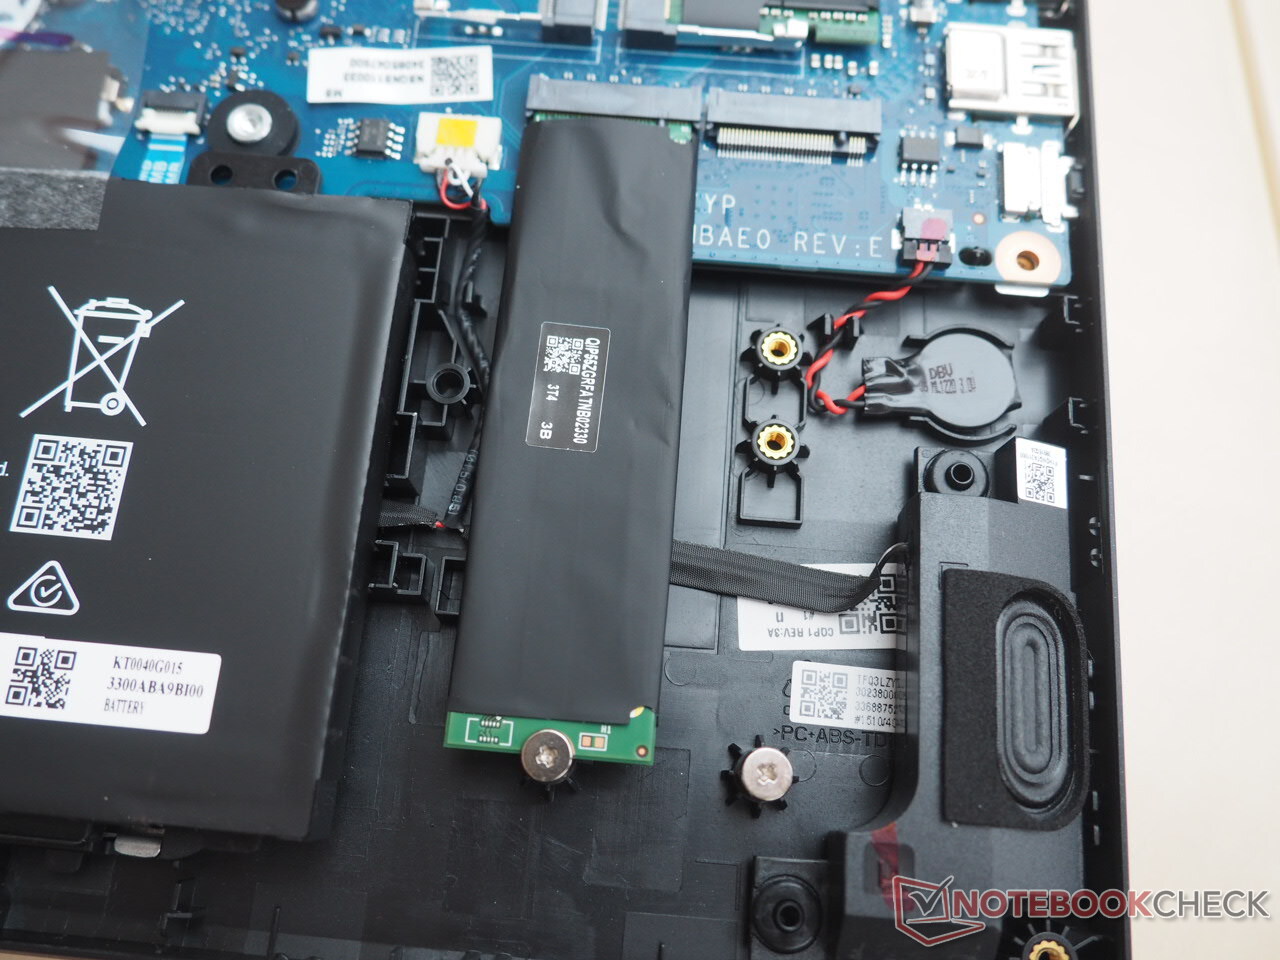
En fördel med Nitro är dess servicevänlighet. Trots att bottenlocket sitter fast ganska ordentligt även efter att de elva skruvarna har tagits bort, kommer du att ha tillgång till en ledig M.2-plats och en tom RAM-plats (se bilder) när du väl kommer in i den 15-tums bärbara datorn. Även om single-RAM-konfigurationen i vår granskningsenhet kan påverka prestandan negativt i vissa situationer. En sak att notera: batteriet är inte fastskruvat och kan teoretiskt falla ut ur chassit när du öppnar upp den bärbara datorn.
Garanti
Acer ger två års garanti på Nitro V 15 i Tyskland. Garantiperioden kan dock variera beroende på region.
Inmatningsenheter
Tangentbord
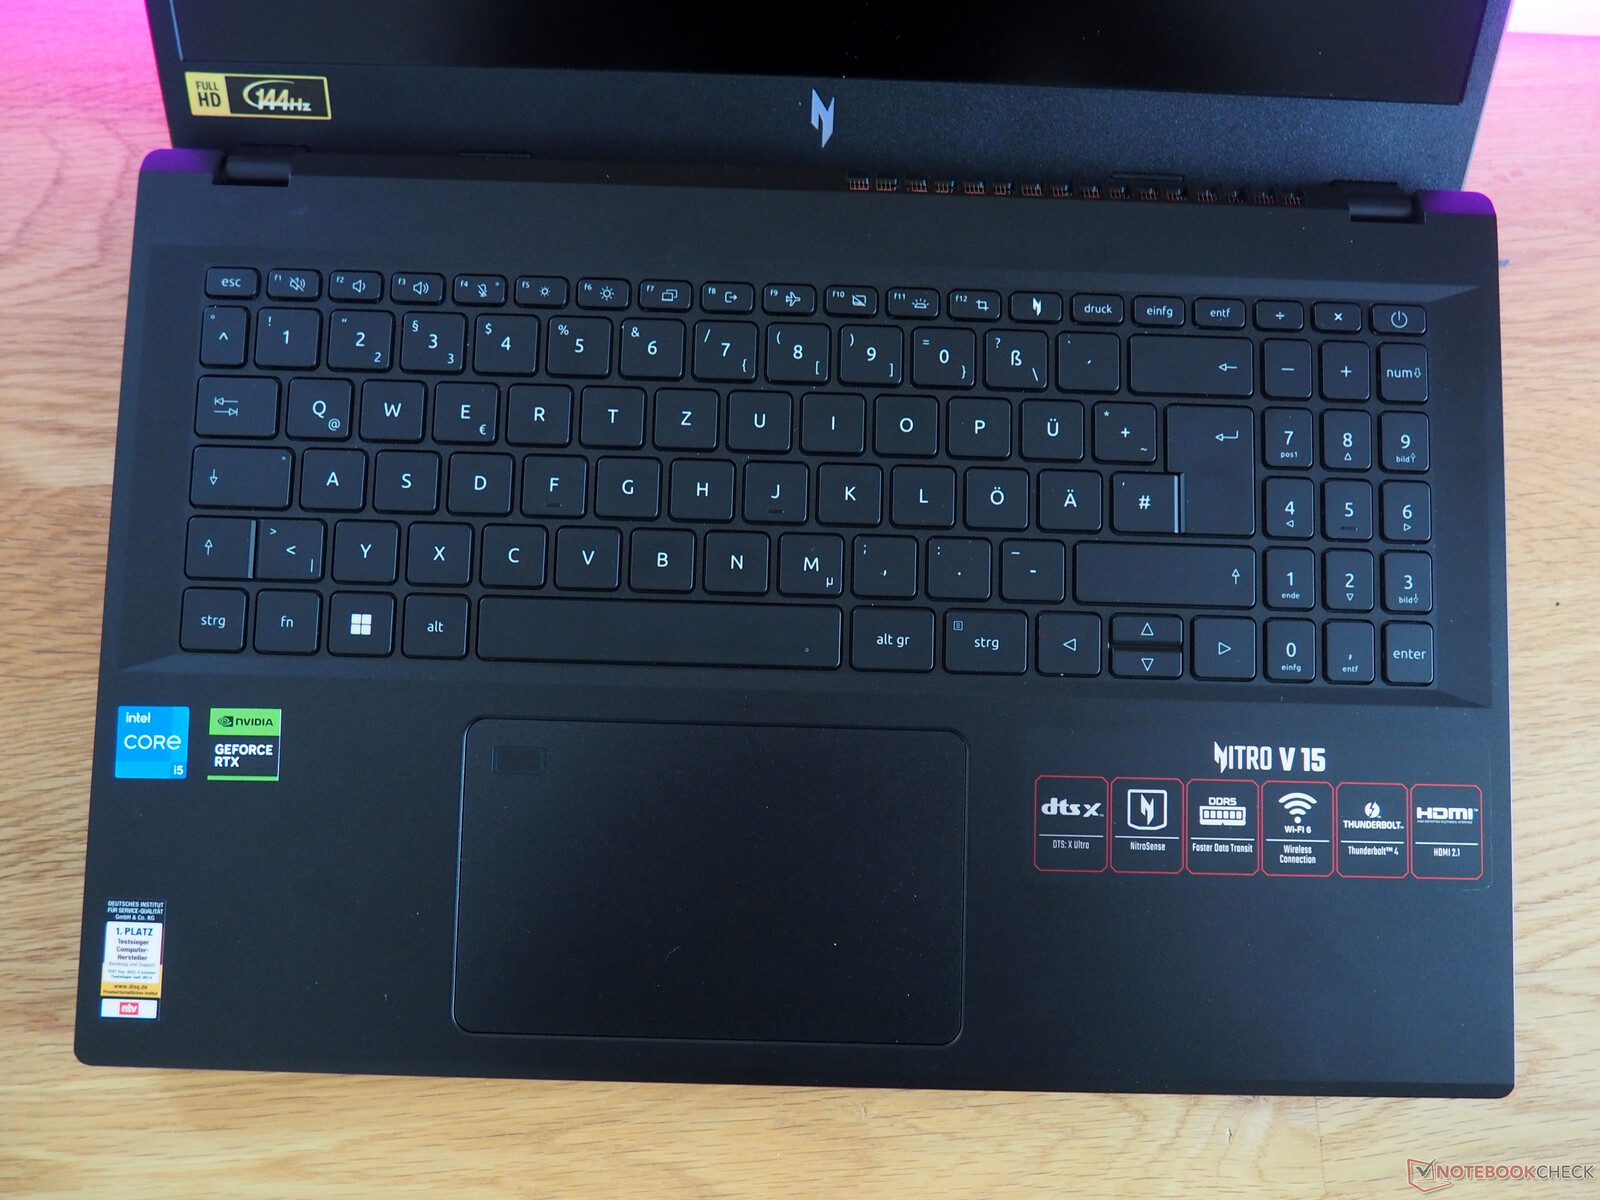
Inmatningsenheterna är varken hemska eller fantastiska. I likhet med de flesta bärbara datorer med konventionella tangentbord känns det lite mjukt att skriva på Nitro på grund av brist på taktil återkoppling. Acer kunde också ha gjort bättre ifrån sig med layouten. Det finns till exempel tillräckligt med utrymme för en vanlig numpad med fyra kolumner snarare än en med tre kolumner. Det är också synd att piltangenterna inte är bra och knappt lämpar sig för spel och att strömknappen inte är placerad separat. Att funktionstangenterna är nästan ynkliga hjälper inte heller. Positiva aspekter som är värda att nämna är den vita bakgrundsbelysningen med justerbar ljusstyrka och den dedikerade knappen för att öppna tuningprogramvaran (NitroSense).
Pekplatta
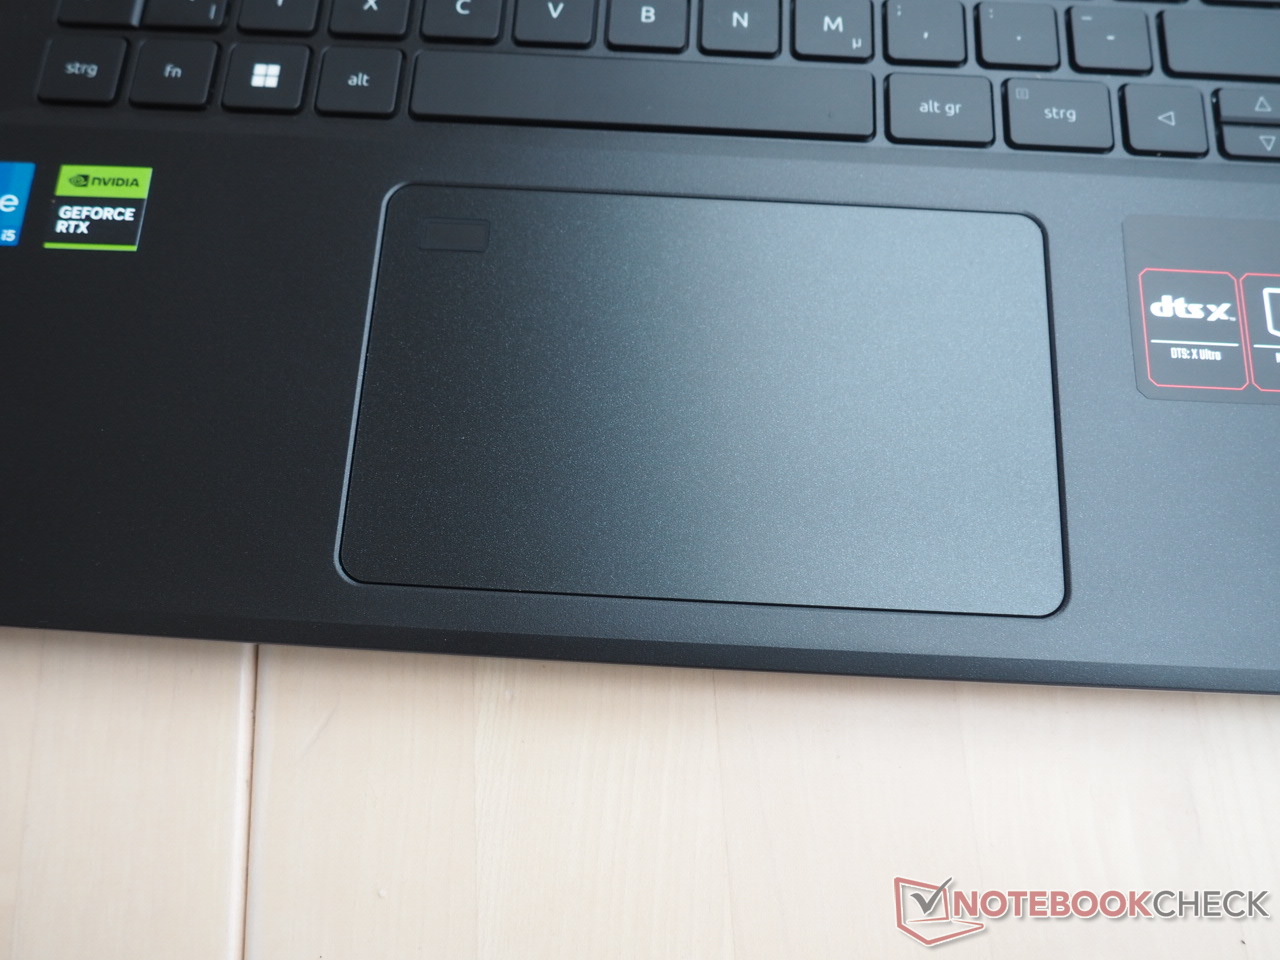
Pekplattan utmärker sig mest med den inbyggda fingeravtrycksläsaren i det övre vänstra hörnet. Musersättningen är annars ganska genomsnittlig när det gäller kvalitet. Nivån på precision och smidighet är rimlig utan att vara häpnadsväckande. Situationen är liknande med multi-touch-stödet och känslan av klickytorna. Beroende på hur hårt du trycker på pekplattan har den tyvärr en tendens att skramla.
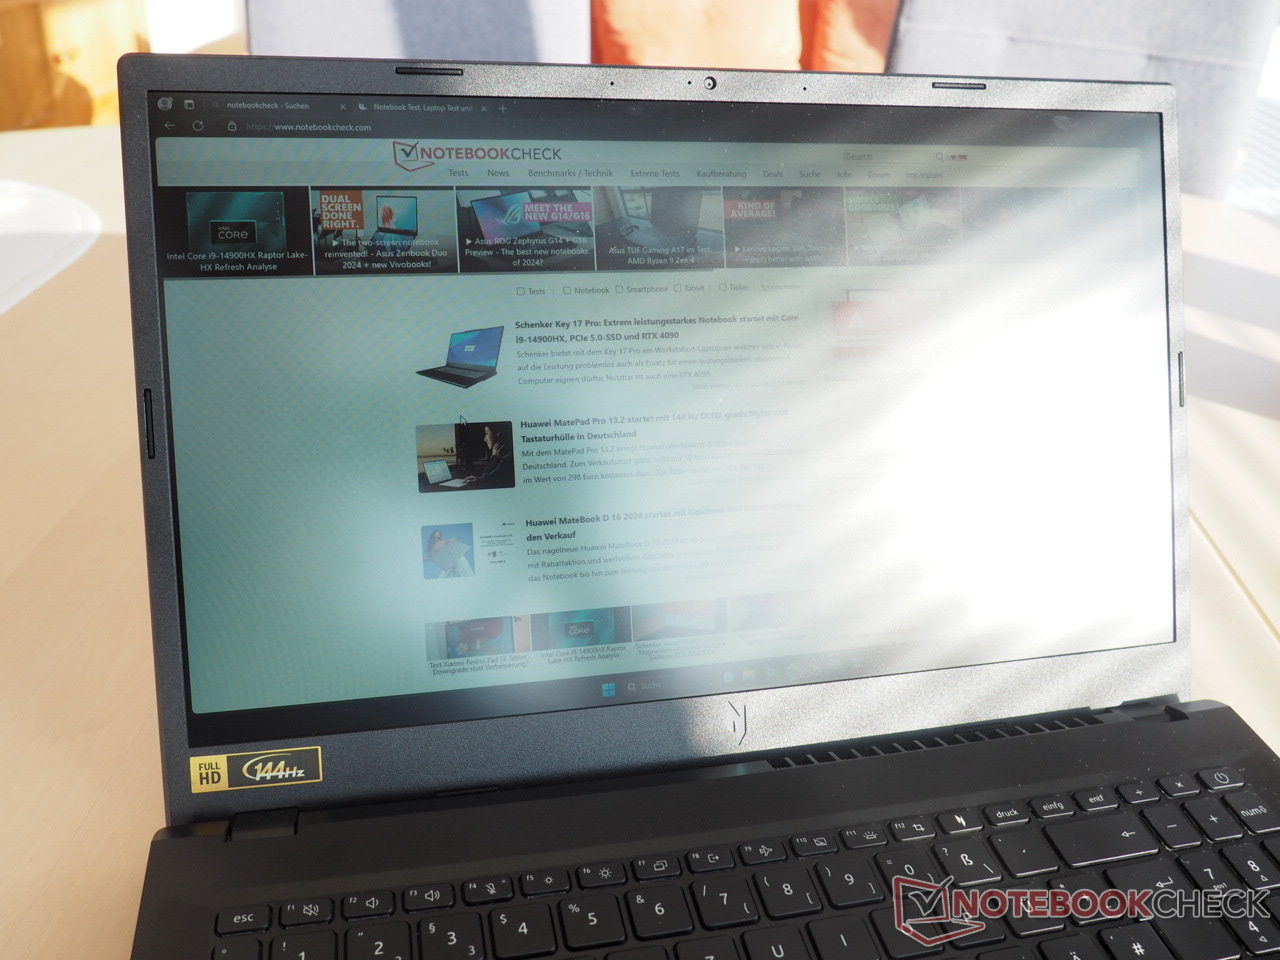
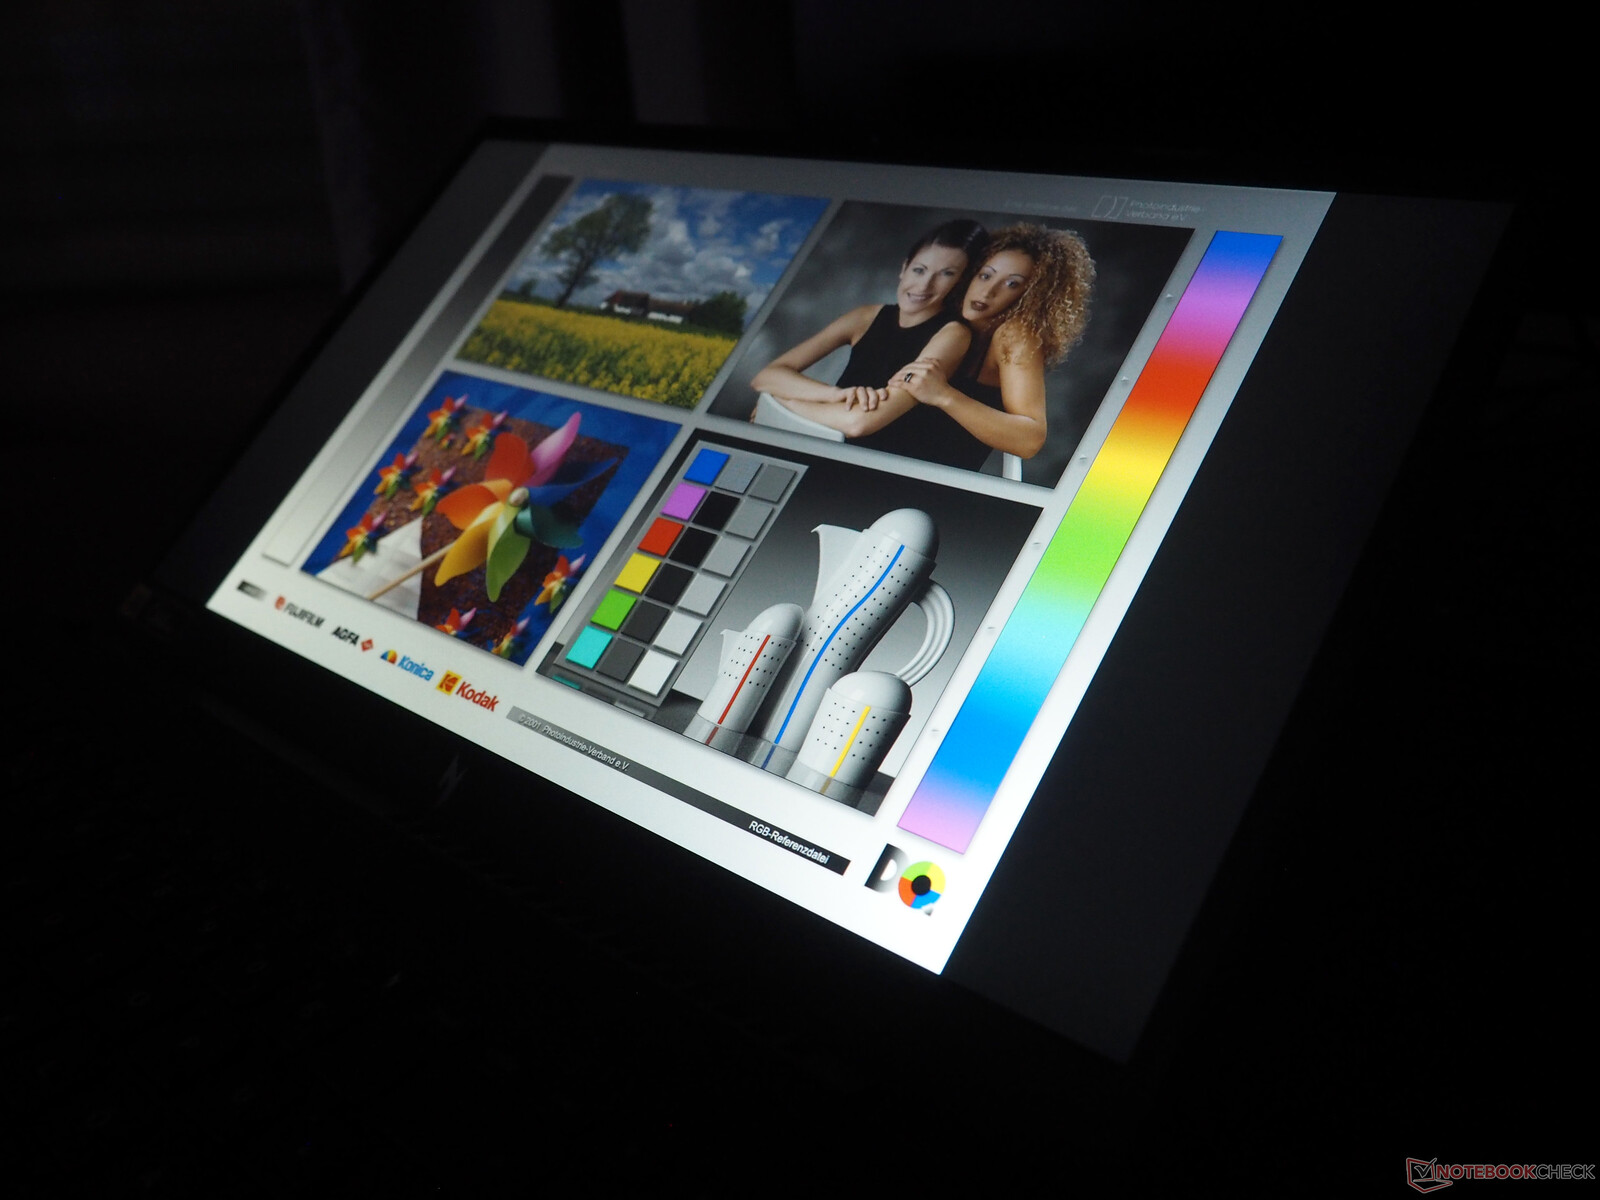
Display
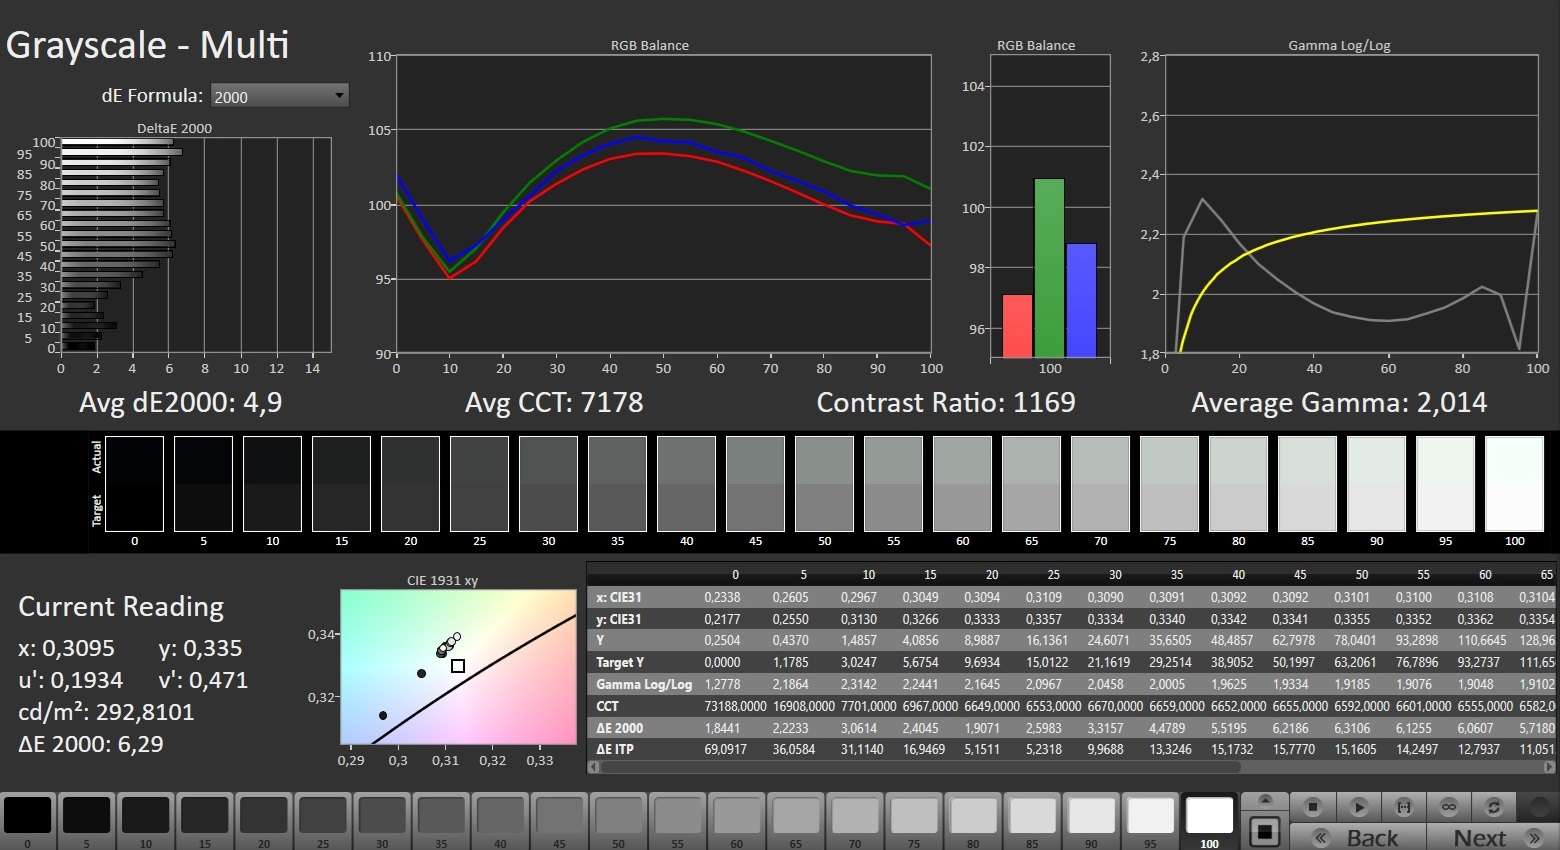
Nitro V 15:s lågkvalitativa skärm är en av dess största svagheter. Vid första anblicken verkar de erhållna resultaten inte alltför nedslående: svartnivån på 0,25 cd/m² och kontrastförhållandet på 1168:1 liknar vad du kan få från konkurrenterna eller en typisk IPS-panel. Detta gäller även för betraktningsvinkeln.
| |||||||||||||||||||||||||
Distribution av ljusstyrkan: 80 %
Mitt på batteriet: 292 cd/m²
Kontrast: 1168:1 (Svärta: 0.25 cd/m²)
ΔE ColorChecker Calman: 7.15 | ∀{0.5-29.43 Ø4.73}
calibrated: 4.13
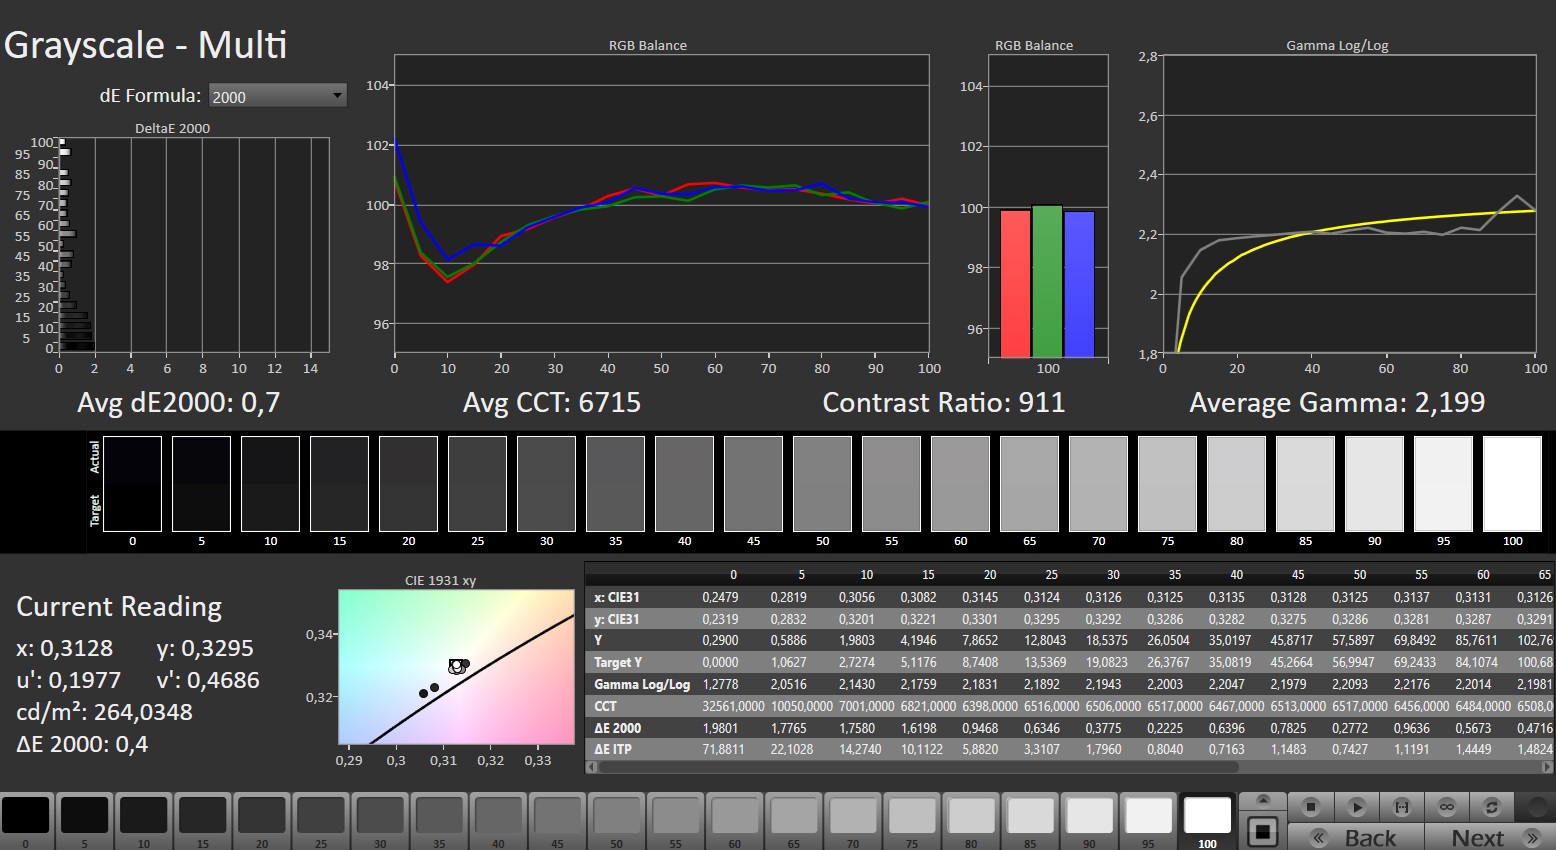
ΔE Greyscale Calman: 4.9 | ∀{0.09-98 Ø4.97}
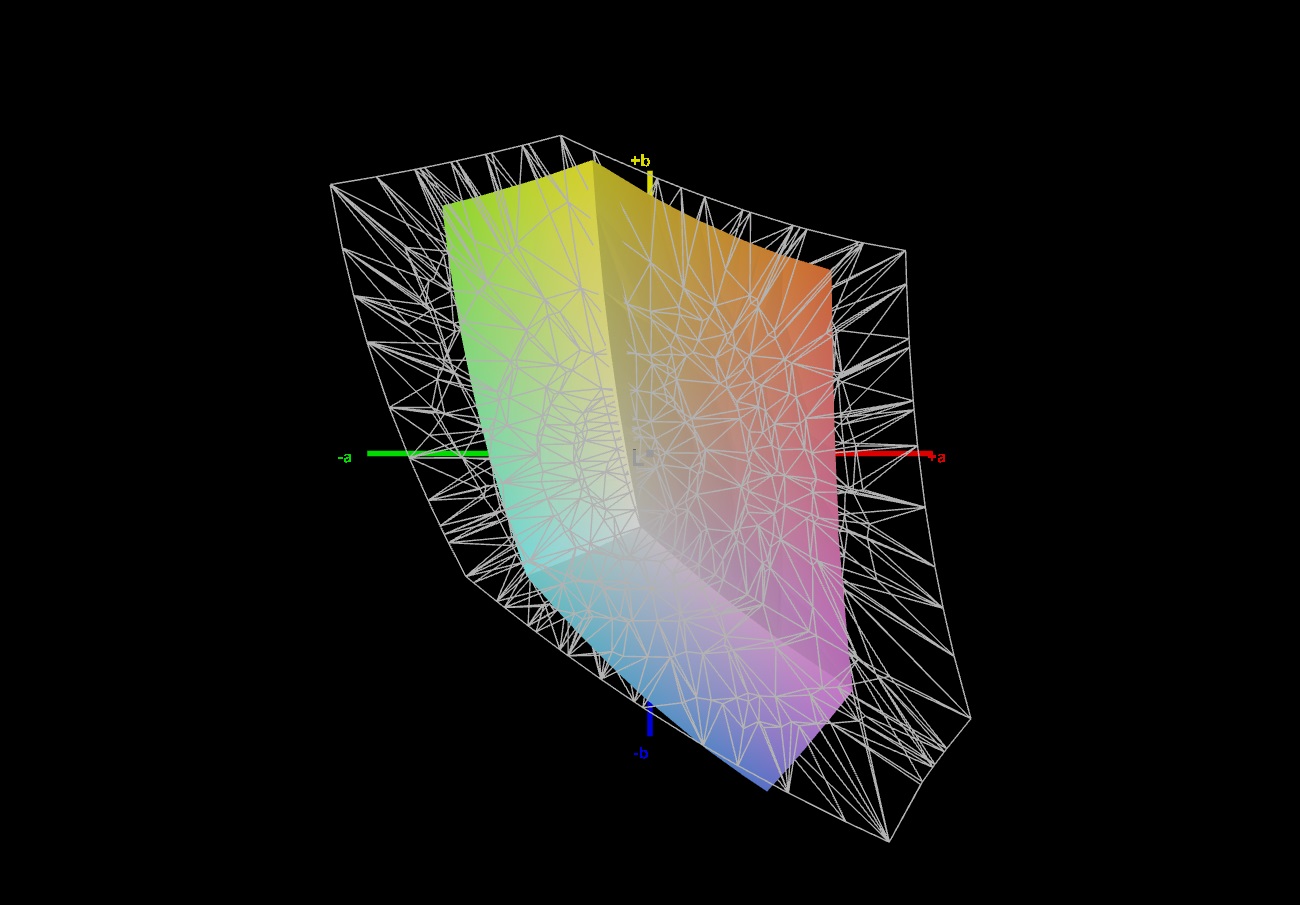
41.4% AdobeRGB 1998 (Argyll 3D)
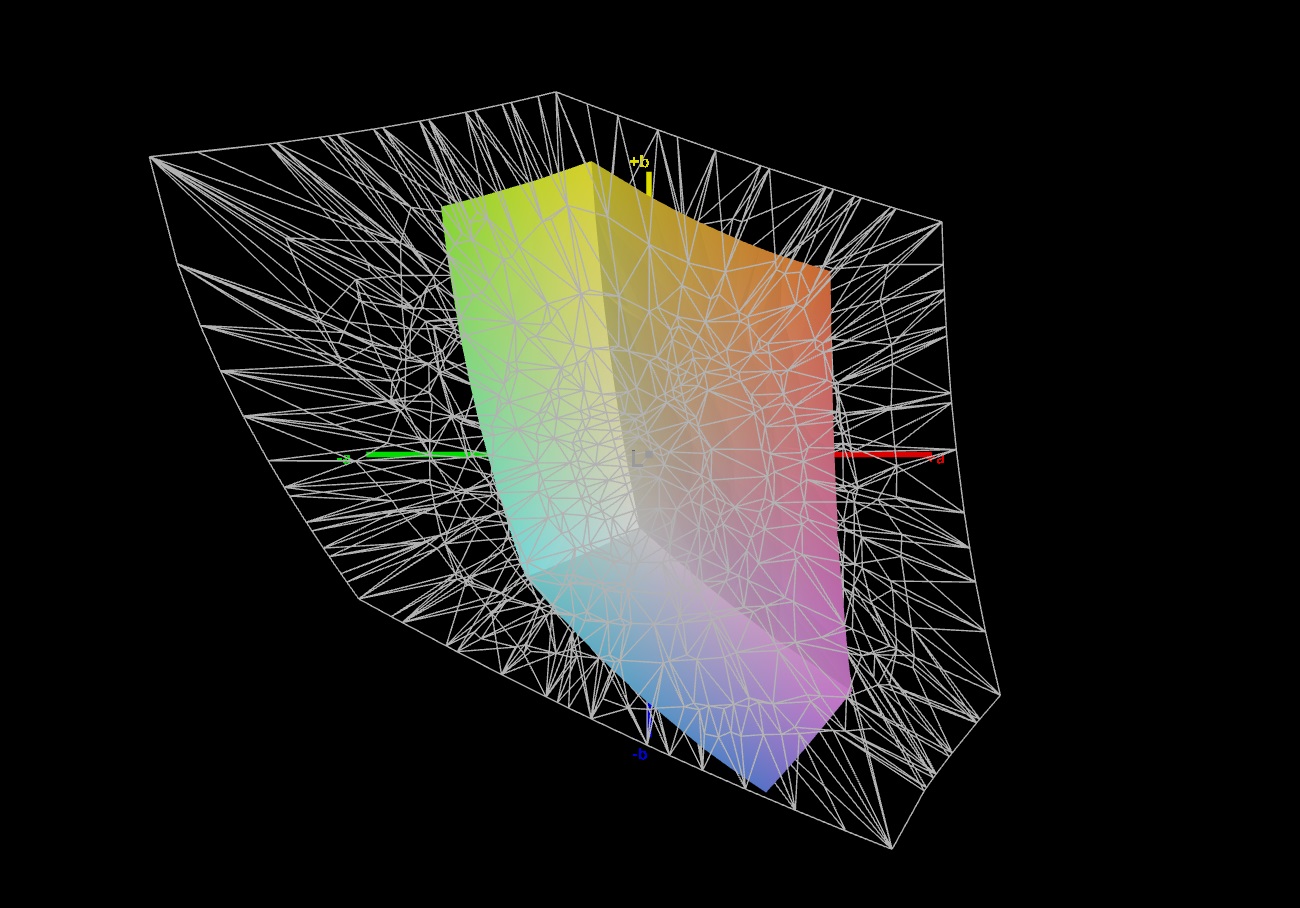
60% sRGB (Argyll 3D)
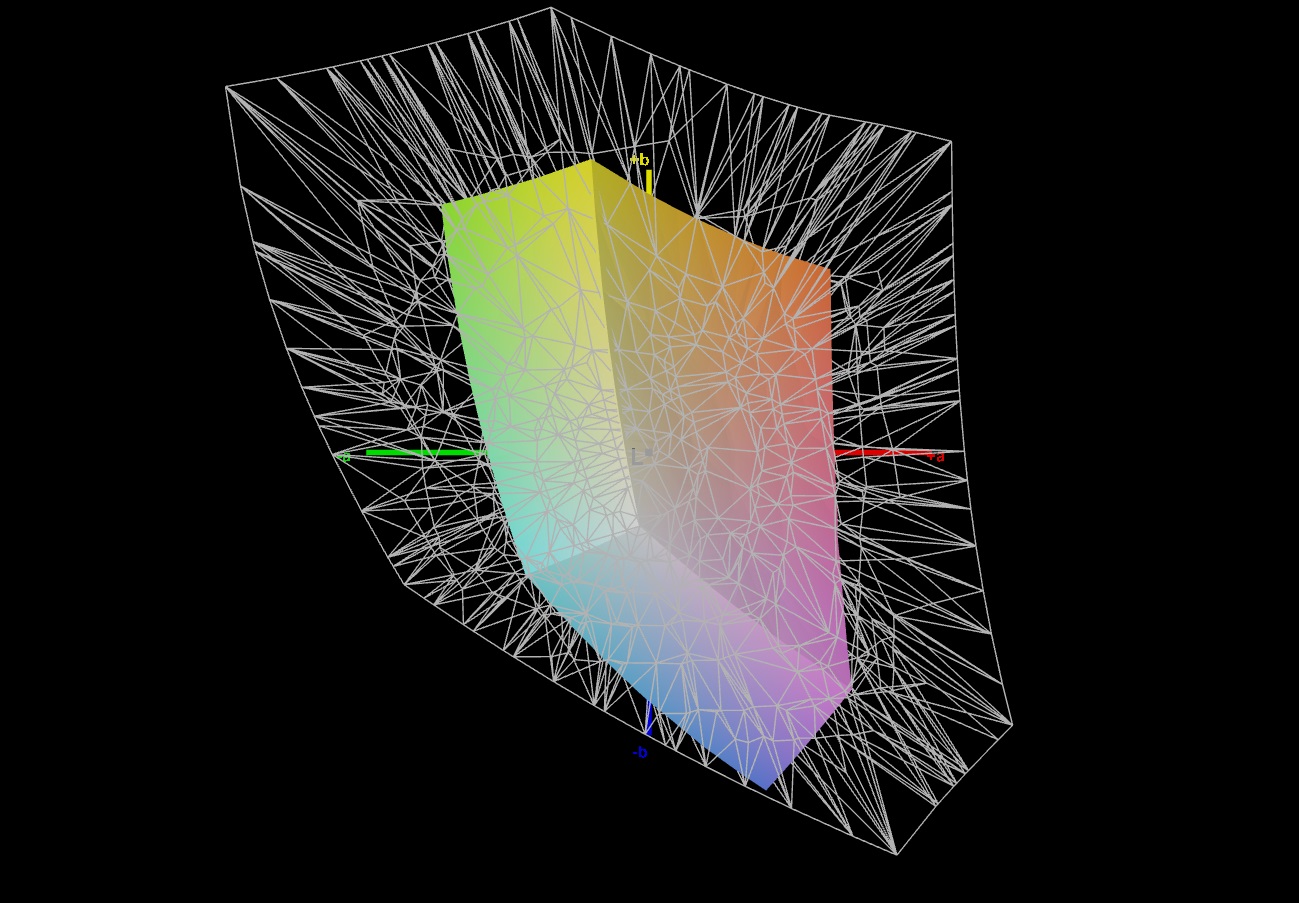
40% Display P3 (Argyll 3D)
Gamma: 2.014
CCT: 7178 K
| Acer Nitro V 15 ANV15-51-582S LG LP156WFJ-SPB4 (LGD0742), IPS, 1920x1080, 15.6" | Medion Erazer Crawler E40 - MD 62518 BOE HF NV156FHM-N4G, IPS, 1920x1080, 15.6" | Lenovo LOQ 15IRH8 Core i7 BOE CQ NE156QHM-NY4, IPS, 2560x1440, 15.6" | Asus TUF A15 FA507 N156HMA-GA1, IPS, 1920x1080, 15.6" | Schenker XMG Apex 15 (Late 23) BOE CQ NE156QHM-NY2, IPS, 2560x1440, 15.6" | |
|---|---|---|---|---|---|
| Display | 52% | 64% | 61% | 66% | |
| Display P3 Coverage (%) | 40 | 61.4 54% | 66.3 66% | 64.9 62% | 67.5 69% |
| sRGB Coverage (%) | 60 | 89.7 50% | 96.6 61% | 96.5 61% | 97.6 63% |
| AdobeRGB 1998 Coverage (%) | 41.4 | 63.2 53% | 67.7 64% | 66.6 61% | 68.9 66% |
| Response Times | 70% | 76% | 15% | 64% | |
| Response Time Grey 50% / Grey 80% * (ms) | 34.2 ? | 8 ? 77% | 5 ? 85% | 30.4 ? 11% | 13.2 ? 61% |
| Response Time Black / White * (ms) | 25.8 ? | 9.6 ? 63% | 8.41 ? 67% | 20.8 ? 19% | 8.8 ? 66% |
| PWM Frequency (Hz) | |||||
| Screen | 17% | 23% | 41% | 24% | |
| Brightness middle (cd/m²) | 292 | 364 25% | 373 28% | 288 -1% | 336 15% |
| Brightness (cd/m²) | 263 | 351 33% | 365 39% | 271 3% | 307 17% |
| Brightness Distribution (%) | 80 | 91 14% | 90 13% | 91 14% | 77 -4% |
| Black Level * (cd/m²) | 0.25 | 0.43 -72% | 0.33 -32% | 0.17 32% | 0.38 -52% |
| Contrast (:1) | 1168 | 847 -27% | 1130 -3% | 1694 45% | 884 -24% |
| Colorchecker dE 2000 * | 7.15 | 3.98 44% | 4.19 41% | 1.9 73% | 1.96 73% |
| Colorchecker dE 2000 max. * | 15.51 | 6.38 59% | 8.47 45% | 3.3 79% | 5.07 67% |
| Colorchecker dE 2000 calibrated * | 4.13 | 1.36 67% | 1.07 74% | 0.9 78% | 1.27 69% |
| Greyscale dE 2000 * | 4.9 | 4.39 10% | 5 -2% | 2.7 45% | 2.3 53% |
| Gamma | 2.014 109% | 2.58 85% | 1.93 114% | 2.32 95% | 2.017 109% |
| CCT | 7178 91% | 7316 89% | 7520 86% | 6535 99% | 6644 98% |
| Totalt genomsnitt (program/inställningar) | 46% /
32% | 54% /
39% | 39% /
42% | 51% /
39% |
* ... mindre är bättre
Men du kommer att märka några brister vid en närmare titt. Först och främst är den genomsnittliga ljusstyrkan på 263 cd/m² endast tillräcklig för inomhusbruk; 15-tumsdatorn gör ingen bra figur alls i en utomhusmiljö.
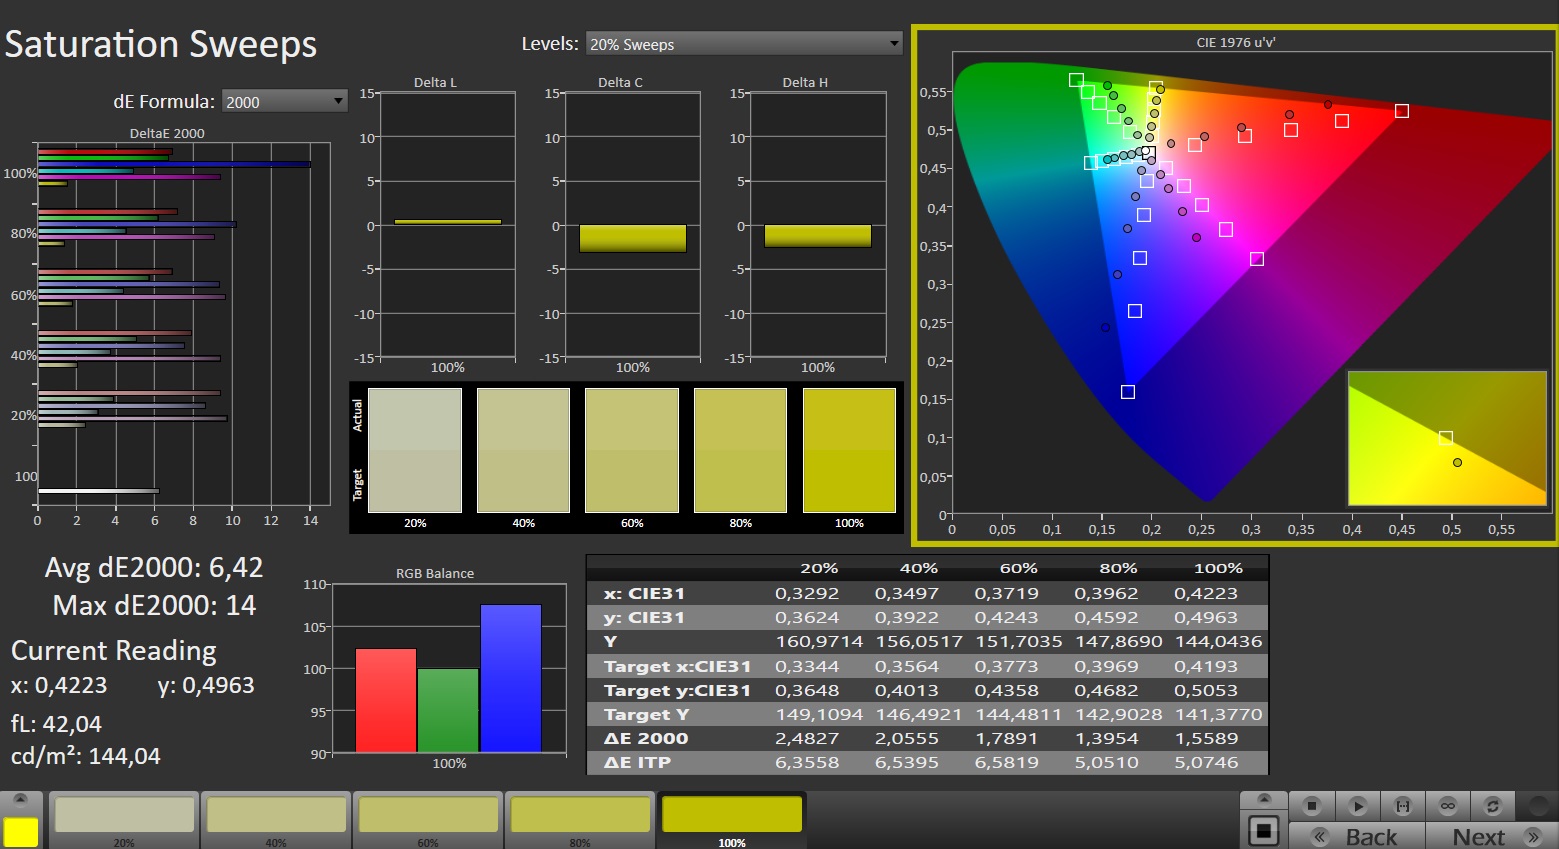
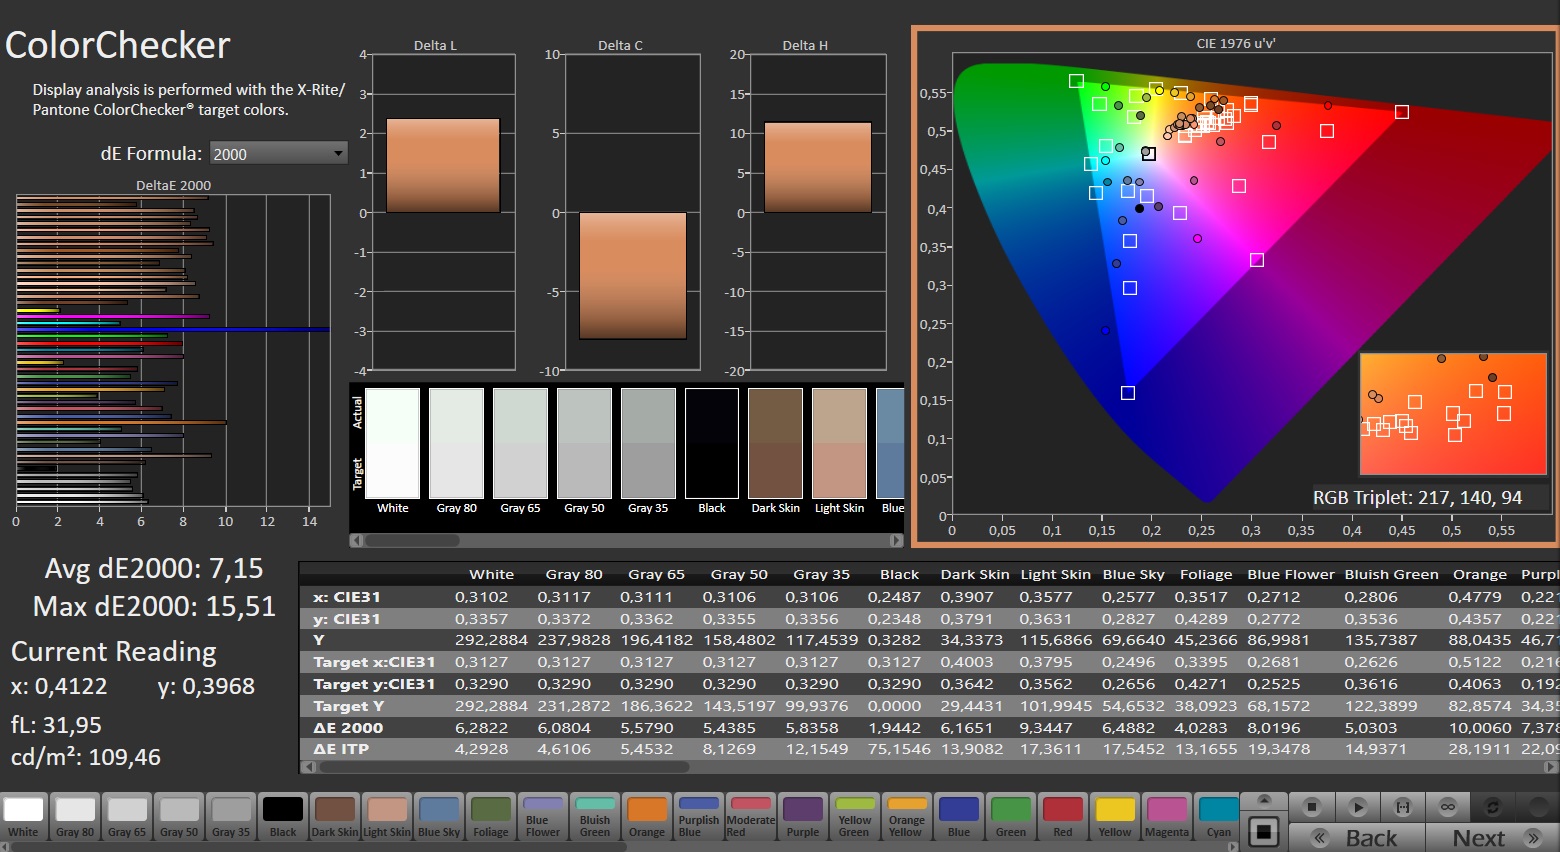
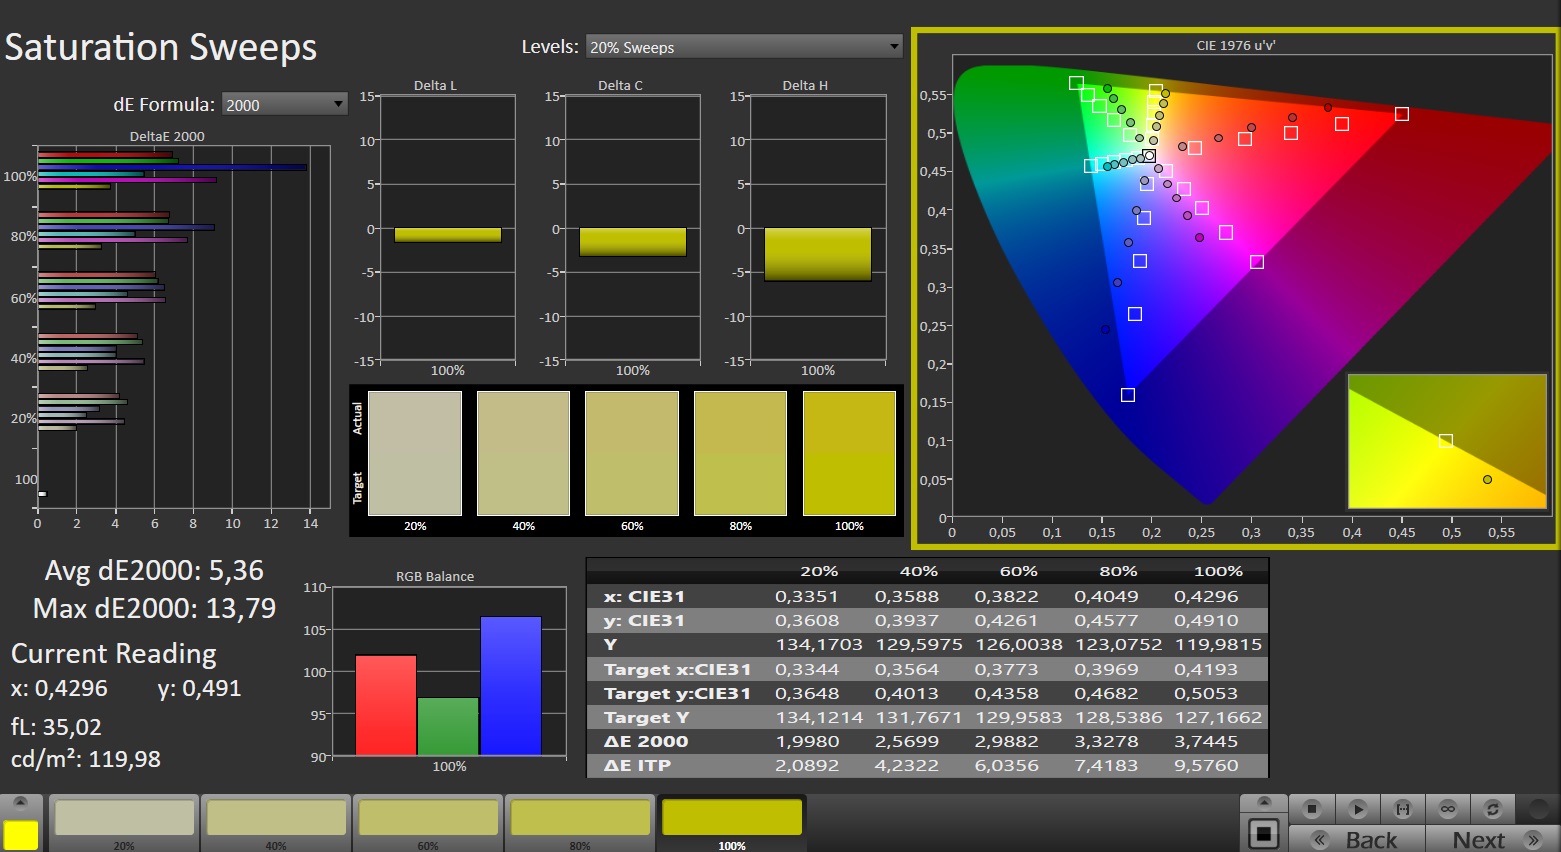
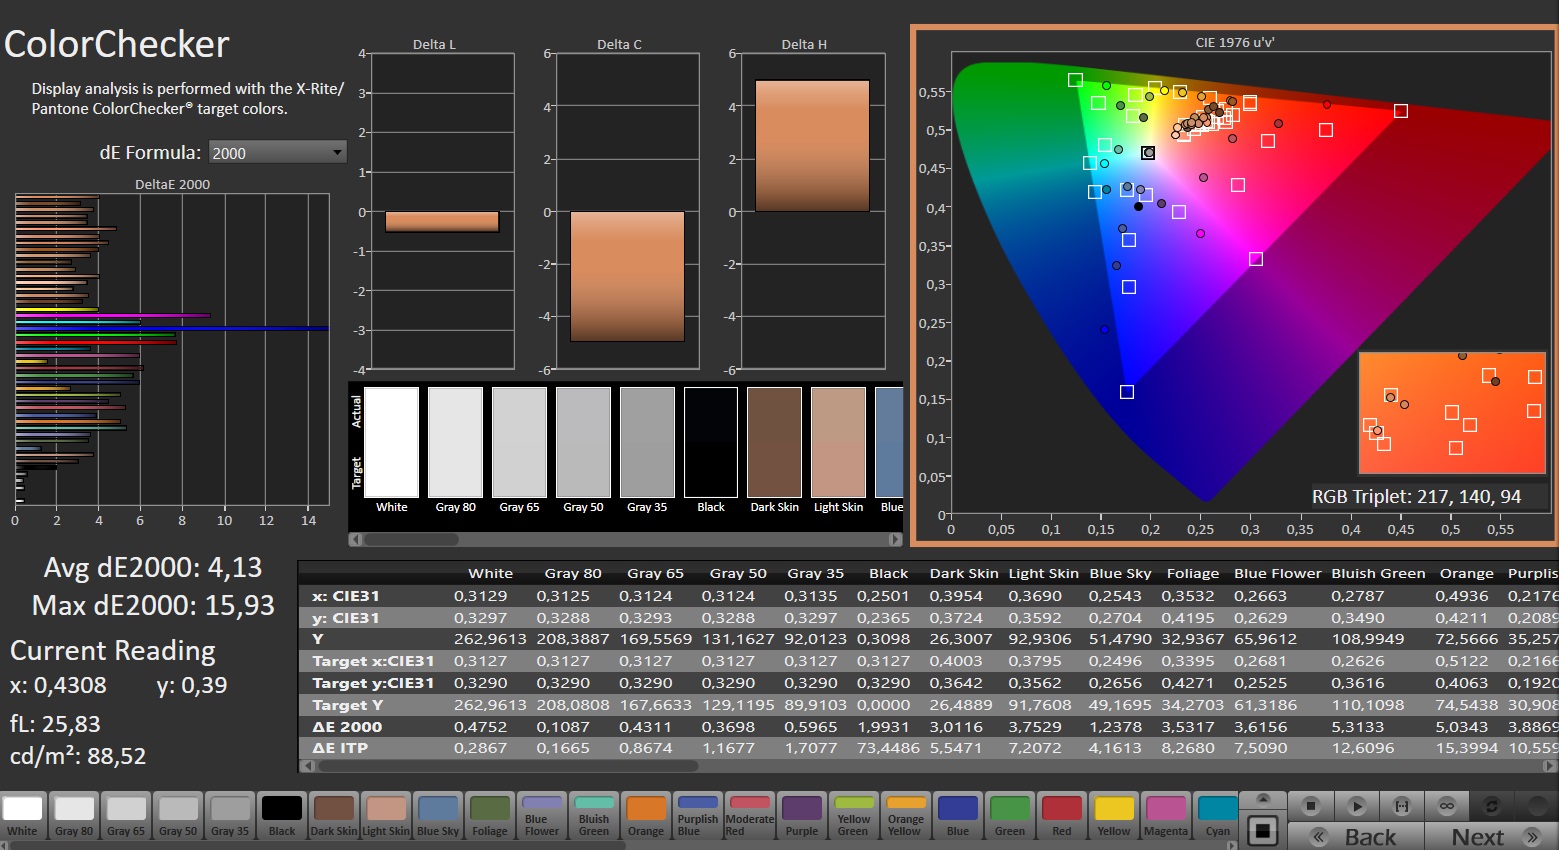
Nitro V 15 har också en mycket begränsad färgtäckning: 60% sRGB och ungefär 40% AdobeRGB och DCI-P3 kommer helt enkelt inte att räcka till år 2024, inte ens för en budget-notebook för spel.
Konkurrenterna visar hur man kan göra saker mycket bättre. Acer Nitro hamnade också på sista plats när det gäller färgnoggrannhet och svarstid.
Visa svarstider
| ↔ Svarstid svart till vitt | ||
|---|---|---|
| 25.8 ms ... stiga ↗ och falla ↘ kombinerat | ↗ 13.8 ms stiga | 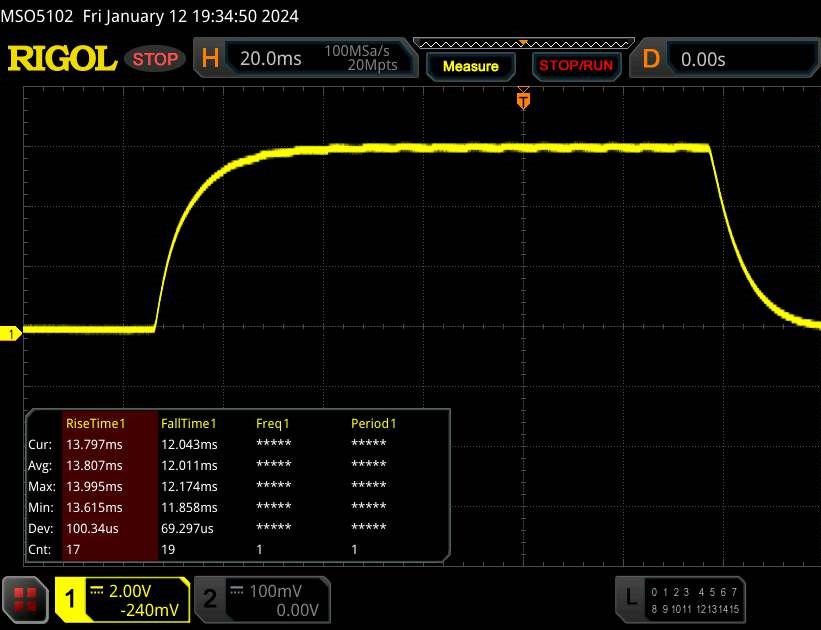 |
| ↘ 12 ms hösten | ||
| Skärmen visar relativt långsamma svarsfrekvenser i våra tester och kan vara för långsam för spelare. I jämförelse sträcker sig alla testade enheter från 0.1 (minst) till 240 (maximalt) ms. » 62 % av alla enheter är bättre. Detta innebär att den uppmätta svarstiden är sämre än genomsnittet av alla testade enheter (19.9 ms). | ||
| ↔ Svarstid 50 % grått till 80 % grått | ||
| 34.2 ms ... stiga ↗ och falla ↘ kombinerat | ↗ 15.8 ms stiga | 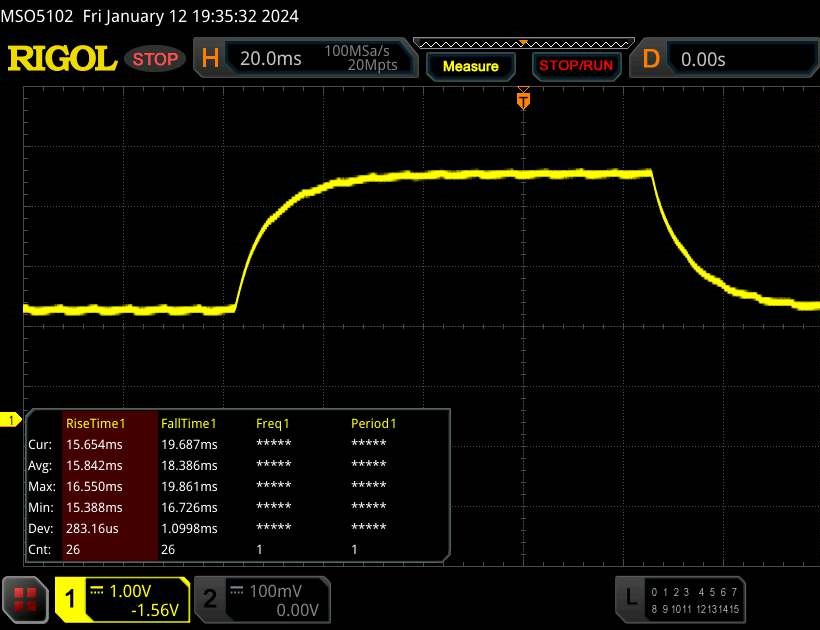 |
| ↘ 18.4 ms hösten | ||
| Skärmen visar långsamma svarsfrekvenser i våra tester och kommer att vara otillfredsställande för spelare. I jämförelse sträcker sig alla testade enheter från 0.165 (minst) till 636 (maximalt) ms. » 48 % av alla enheter är bättre. Det betyder att den uppmätta svarstiden liknar genomsnittet av alla testade enheter (31.1 ms). | ||
Skärmflimmer / PWM (Puls-Width Modulation)
| Skärmflimmer / PWM upptäcktes inte |  | ||
Som jämförelse: 52 % av alla testade enheter använder inte PWM för att dämpa skärmen. Om PWM upptäcktes mättes ett medelvärde av 7791 (minst: 5 - maximum: 343500) Hz. | |||
Prestanda
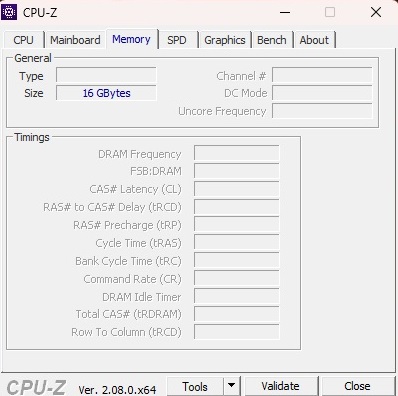
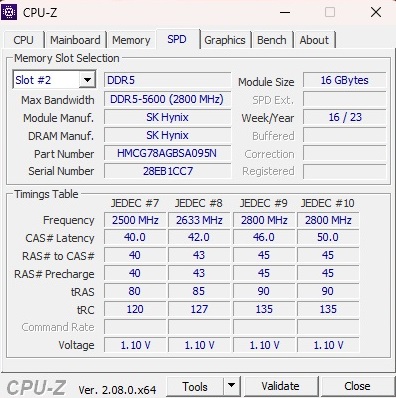
Nitro V 15 är en enhet i mellanklassen när det gäller både CPU- och GPU-prestanda. 16 GB RAM-minne är ganska rimligt med tanke på den bärbara datorns pris, men SSD-enheten faller lite kort med sin kapacitet på bara 512 GB.
Testförhållanden
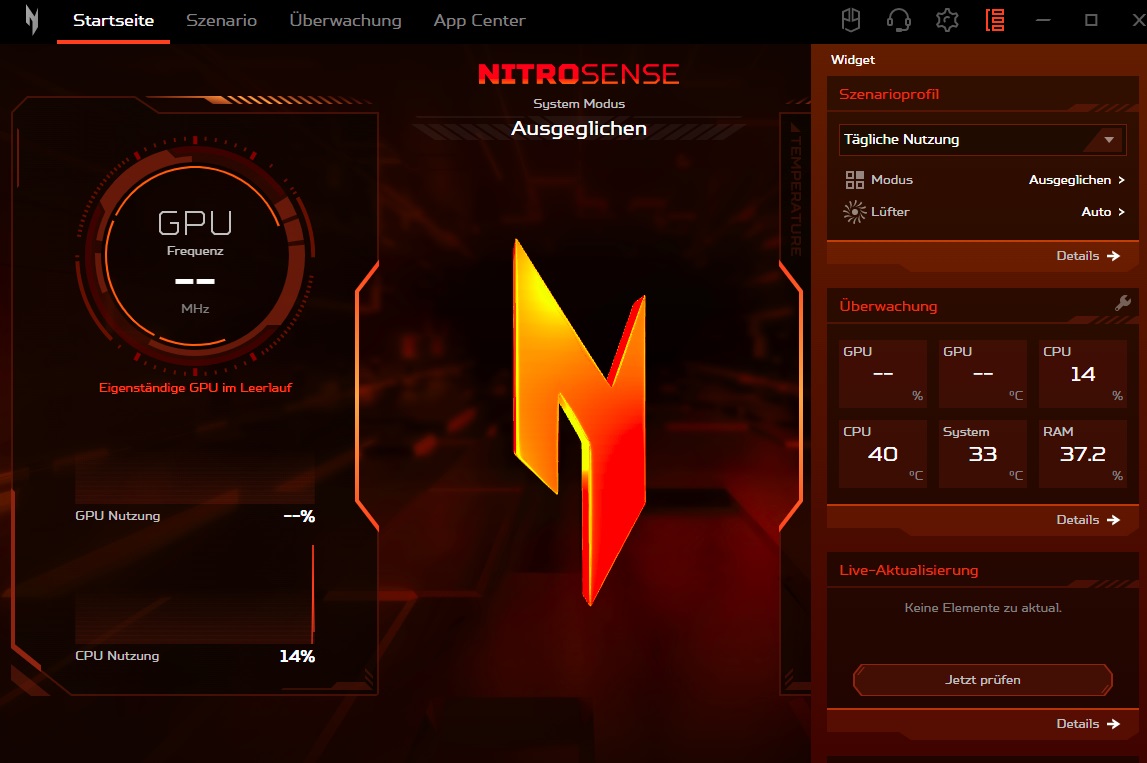
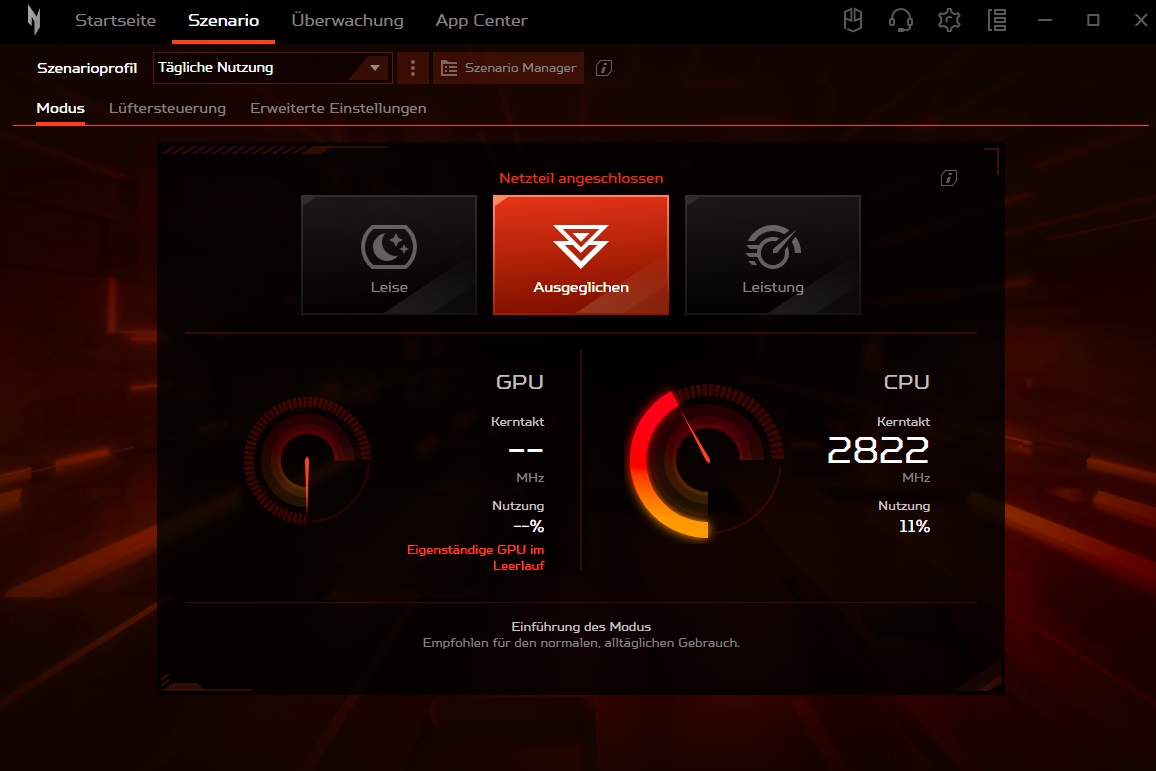
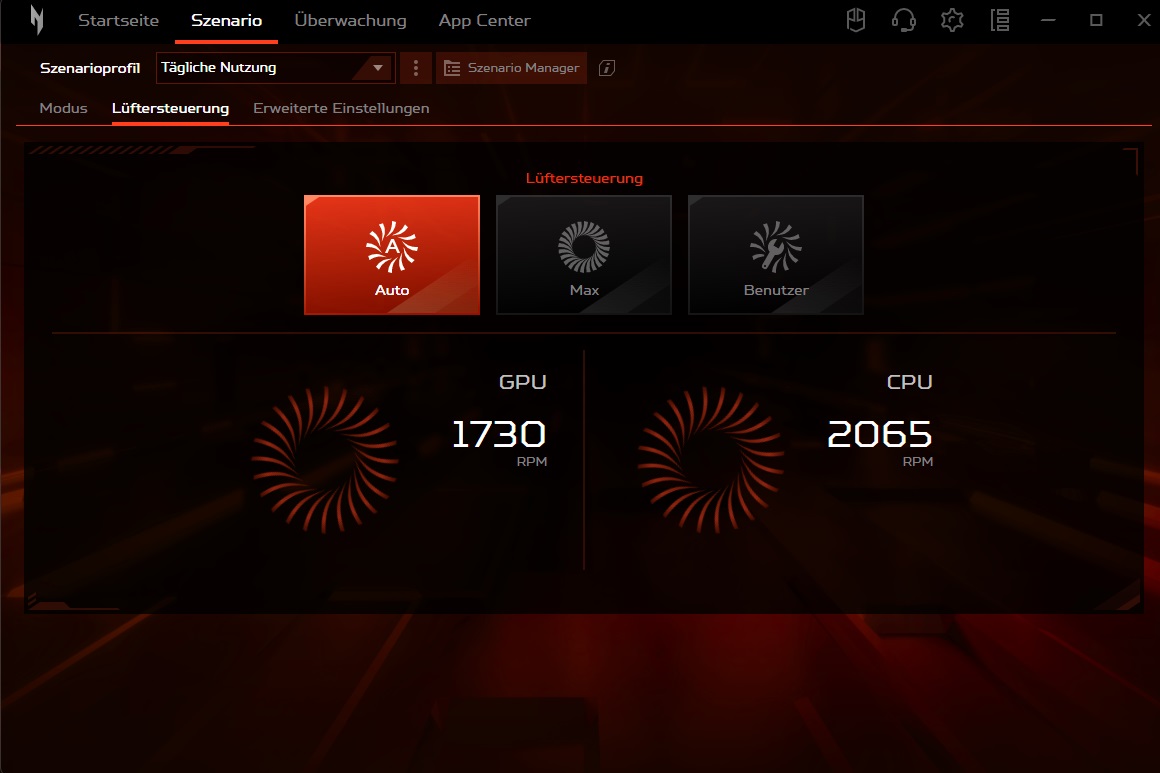
Med den förinstallerade NitroSense-appen kan användaren justera olika systeminställningar. Fliken "Scenario" är särskilt intressant för användning i verkliga livet. Här kan du ändra energiförbrukningen ("Mode"-menyn) och fläktbeteendet ("Fan Control"-menyn). Våra mätningar utfördes i balanserat läge och med automatisk fläktkontroll, eftersom datorn är betydligt mer högljudd men inte särskilt mycket snabbare i prestandaläget.
| NitroSense | Tyst | Balanserad | Prestanda |
| CPU PL1 (HWiNFO) | 35 W | 45 W | 55 W |
| CPU PL2 (HWiNFO) | 64 W | 115 W | 115 W |
| Buller (Witcher 3, FHD/Ultra) | 37 dB(A) | 49 dB(A) | 59 dB(A) |
| Prestanda (Witcher 3, FHD/Ultra) | ~62 FPS | ~78 FPS | ~82 FPS |
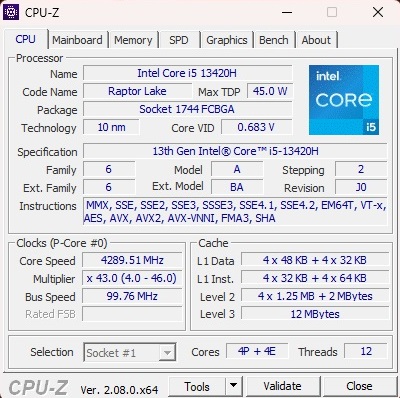
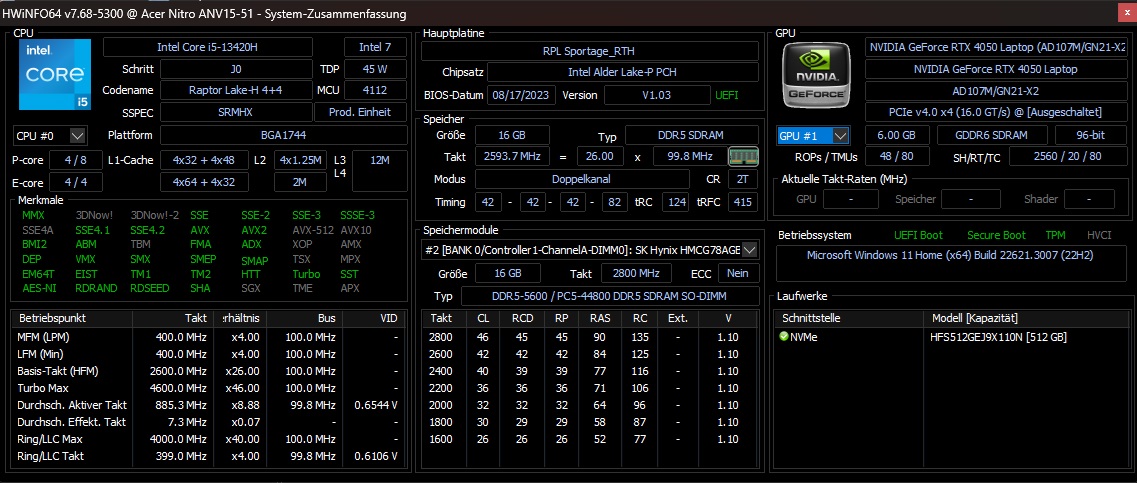
Processor
Core i5-13420H är en processor från Intels Raptor Lake-serie (10 nm) som har fyra prestandakärnor (med Hyper-Threading) och fyra effektivitetskärnor (utan HT). I vår handske av benchmarks överträffades processorn inte bara av sina dyrare syskon Core i5-13500H och Core i7-13620H som förväntat, utan också slagen av sina AMD-konkurrenter Ryzen 7 7735HS och Ryzen 7 7840HS. Med detta sagt är CPU: ns prestanda mer än tillräckligt för spel eftersom de flesta spel, som vi vet, är GPU-bundna.
Cinebench R15 Multi Sustained Load
* ... mindre är bättre
AIDA64: FP32 Ray-Trace | FPU Julia | CPU SHA3 | CPU Queen | FPU SinJulia | FPU Mandel | CPU AES | CPU ZLib | FP64 Ray-Trace | CPU PhotoWorxx
| Performance rating | |
| Genomsnitt av klass Gaming | |
| Schenker XMG Apex 15 (Late 23) | |
| Asus TUF A15 FA507 | |
| Medion Erazer Crawler E40 - MD 62518 | |
| Lenovo LOQ 15IRH8 Core i7 | |
| Acer Nitro V 15 ANV15-51-582S | |
| Genomsnitt Intel Core i5-13420H | |
| AIDA64 / FP32 Ray-Trace | |
| Genomsnitt av klass Gaming (10227 - 85542, n=107, senaste 2 åren) | |
| Schenker XMG Apex 15 (Late 23) | |
| Asus TUF A15 FA507 | |
| Medion Erazer Crawler E40 - MD 62518 | |
| Acer Nitro V 15 ANV15-51-582S | |
| Lenovo LOQ 15IRH8 Core i7 | |
| Genomsnitt Intel Core i5-13420H (7922 - 12134, n=5) | |
| AIDA64 / FPU Julia | |
| Genomsnitt av klass Gaming (51376 - 238426, n=107, senaste 2 åren) | |
| Schenker XMG Apex 15 (Late 23) | |
| Asus TUF A15 FA507 | |
| Medion Erazer Crawler E40 - MD 62518 | |
| Lenovo LOQ 15IRH8 Core i7 | |
| Acer Nitro V 15 ANV15-51-582S | |
| Genomsnitt Intel Core i5-13420H (40587 - 59715, n=5) | |
| AIDA64 / CPU SHA3 | |
| Genomsnitt av klass Gaming (2180 - 9817, n=107, senaste 2 åren) | |
| Schenker XMG Apex 15 (Late 23) | |
| Medion Erazer Crawler E40 - MD 62518 | |
| Asus TUF A15 FA507 | |
| Acer Nitro V 15 ANV15-51-582S | |
| Lenovo LOQ 15IRH8 Core i7 | |
| Genomsnitt Intel Core i5-13420H (1724 - 2634, n=5) | |
| AIDA64 / CPU Queen | |
| Genomsnitt av klass Gaming (49785 - 173351, n=98, senaste 2 åren) | |
| Schenker XMG Apex 15 (Late 23) | |
| Asus TUF A15 FA507 | |
| Medion Erazer Crawler E40 - MD 62518 | |
| Lenovo LOQ 15IRH8 Core i7 | |
| Genomsnitt Intel Core i5-13420H (69803 - 74956, n=5) | |
| Acer Nitro V 15 ANV15-51-582S | |
| AIDA64 / FPU SinJulia | |
| Schenker XMG Apex 15 (Late 23) | |
| Genomsnitt av klass Gaming (4424 - 33636, n=107, senaste 2 åren) | |
| Asus TUF A15 FA507 | |
| Medion Erazer Crawler E40 - MD 62518 | |
| Lenovo LOQ 15IRH8 Core i7 | |
| Acer Nitro V 15 ANV15-51-582S | |
| Genomsnitt Intel Core i5-13420H (5485 - 6644, n=5) | |
| AIDA64 / FPU Mandel | |
| Genomsnitt av klass Gaming (25115 - 128721, n=107, senaste 2 åren) | |
| Schenker XMG Apex 15 (Late 23) | |
| Asus TUF A15 FA507 | |
| Medion Erazer Crawler E40 - MD 62518 | |
| Lenovo LOQ 15IRH8 Core i7 | |
| Acer Nitro V 15 ANV15-51-582S | |
| Genomsnitt Intel Core i5-13420H (19684 - 30163, n=5) | |
| AIDA64 / CPU AES | |
| Schenker XMG Apex 15 (Late 23) | |
| Genomsnitt av klass Gaming (39258 - 247074, n=107, senaste 2 åren) | |
| Acer Nitro V 15 ANV15-51-582S | |
| Asus TUF A15 FA507 | |
| Medion Erazer Crawler E40 - MD 62518 | |
| Genomsnitt Intel Core i5-13420H (35531 - 93100, n=5) | |
| Lenovo LOQ 15IRH8 Core i7 | |
| AIDA64 / CPU ZLib | |
| Genomsnitt av klass Gaming (574 - 2531, n=107, senaste 2 åren) | |
| Schenker XMG Apex 15 (Late 23) | |
| Medion Erazer Crawler E40 - MD 62518 | |
| Lenovo LOQ 15IRH8 Core i7 | |
| Acer Nitro V 15 ANV15-51-582S | |
| Genomsnitt Intel Core i5-13420H (509 - 746, n=5) | |
| Asus TUF A15 FA507 | |
| AIDA64 / FP64 Ray-Trace | |
| Genomsnitt av klass Gaming (5509 - 45446, n=107, senaste 2 åren) | |
| Schenker XMG Apex 15 (Late 23) | |
| Asus TUF A15 FA507 | |
| Medion Erazer Crawler E40 - MD 62518 | |
| Lenovo LOQ 15IRH8 Core i7 | |
| Acer Nitro V 15 ANV15-51-582S | |
| Genomsnitt Intel Core i5-13420H (4283 - 6627, n=5) | |
| AIDA64 / CPU PhotoWorxx | |
| Genomsnitt av klass Gaming (12271 - 89891, n=107, senaste 2 åren) | |
| Medion Erazer Crawler E40 - MD 62518 | |
| Schenker XMG Apex 15 (Late 23) | |
| Lenovo LOQ 15IRH8 Core i7 | |
| Asus TUF A15 FA507 | |
| Acer Nitro V 15 ANV15-51-582S | |
| Genomsnitt Intel Core i5-13420H (12330 - 37044, n=5) | |
Systemets prestanda
Nitro V 15 kan inte heller riktigt matcha sina konkurrenter i systemprestanda, även om skillnaderna i PCMark 10 inte är lika stora som de i CPU-testerna.
CrossMark: Overall | Productivity | Creativity | Responsiveness
WebXPRT 3: Overall
WebXPRT 4: Overall
Mozilla Kraken 1.1: Total
| PCMark 10 / Score | |
| Genomsnitt av klass Gaming (5828 - 11574, n=94, senaste 2 åren) | |
| Schenker XMG Apex 15 (Late 23) | |
| Lenovo LOQ 15IRH8 Core i7 | |
| Medion Erazer Crawler E40 - MD 62518 | |
| Asus TUF A15 FA507 | |
| Acer Nitro V 15 ANV15-51-582S | |
| Genomsnitt Intel Core i5-13420H, NVIDIA GeForce RTX 4050 Laptop GPU (n=1) | |
| PCMark 10 / Essentials | |
| Lenovo LOQ 15IRH8 Core i7 | |
| Schenker XMG Apex 15 (Late 23) | |
| Genomsnitt av klass Gaming (8810 - 12600, n=98, senaste 2 åren) | |
| Asus TUF A15 FA507 | |
| Medion Erazer Crawler E40 - MD 62518 | |
| Acer Nitro V 15 ANV15-51-582S | |
| Genomsnitt Intel Core i5-13420H, NVIDIA GeForce RTX 4050 Laptop GPU (n=1) | |
| PCMark 10 / Productivity | |
| Genomsnitt av klass Gaming (6845 - 18766, n=96, senaste 2 åren) | |
| Schenker XMG Apex 15 (Late 23) | |
| Lenovo LOQ 15IRH8 Core i7 | |
| Asus TUF A15 FA507 | |
| Medion Erazer Crawler E40 - MD 62518 | |
| Acer Nitro V 15 ANV15-51-582S | |
| Genomsnitt Intel Core i5-13420H, NVIDIA GeForce RTX 4050 Laptop GPU (n=1) | |
| PCMark 10 / Digital Content Creation | |
| Genomsnitt av klass Gaming (7602 - 19657, n=96, senaste 2 åren) | |
| Lenovo LOQ 15IRH8 Core i7 | |
| Schenker XMG Apex 15 (Late 23) | |
| Medion Erazer Crawler E40 - MD 62518 | |
| Asus TUF A15 FA507 | |
| Acer Nitro V 15 ANV15-51-582S | |
| Genomsnitt Intel Core i5-13420H, NVIDIA GeForce RTX 4050 Laptop GPU (n=1) | |
| CrossMark / Overall | |
| Genomsnitt av klass Gaming (1366 - 2409, n=96, senaste 2 åren) | |
| Lenovo LOQ 15IRH8 Core i7 | |
| Medion Erazer Crawler E40 - MD 62518 | |
| Schenker XMG Apex 15 (Late 23) | |
| Asus TUF A15 FA507 | |
| CrossMark / Productivity | |
| Genomsnitt av klass Gaming (1386 - 2254, n=96, senaste 2 åren) | |
| Lenovo LOQ 15IRH8 Core i7 | |
| Medion Erazer Crawler E40 - MD 62518 | |
| Schenker XMG Apex 15 (Late 23) | |
| Asus TUF A15 FA507 | |
| CrossMark / Creativity | |
| Genomsnitt av klass Gaming (1343 - 2729, n=96, senaste 2 åren) | |
| Lenovo LOQ 15IRH8 Core i7 | |
| Schenker XMG Apex 15 (Late 23) | |
| Medion Erazer Crawler E40 - MD 62518 | |
| Asus TUF A15 FA507 | |
| CrossMark / Responsiveness | |
| Lenovo LOQ 15IRH8 Core i7 | |
| Medion Erazer Crawler E40 - MD 62518 | |
| Genomsnitt av klass Gaming (1226 - 2334, n=96, senaste 2 åren) | |
| Schenker XMG Apex 15 (Late 23) | |
| Asus TUF A15 FA507 | |
| WebXPRT 3 / Overall | |
| Genomsnitt av klass Gaming (242 - 532, n=99, senaste 2 åren) | |
| Schenker XMG Apex 15 (Late 23) | |
| Asus TUF A15 FA507 | |
| Lenovo LOQ 15IRH8 Core i7 | |
| Medion Erazer Crawler E40 - MD 62518 | |
| Acer Nitro V 15 ANV15-51-582S | |
| Genomsnitt Intel Core i5-13420H, NVIDIA GeForce RTX 4050 Laptop GPU (n=1) | |
| WebXPRT 4 / Overall | |
| Genomsnitt av klass Gaming (176.4 - 354, n=99, senaste 2 åren) | |
| Lenovo LOQ 15IRH8 Core i7 | |
| Acer Nitro V 15 ANV15-51-582S | |
| Genomsnitt Intel Core i5-13420H, NVIDIA GeForce RTX 4050 Laptop GPU (n=1) | |
| Medion Erazer Crawler E40 - MD 62518 | |
| Asus TUF A15 FA507 | |
| Mozilla Kraken 1.1 / Total | |
| Asus TUF A15 FA507 | |
| Acer Nitro V 15 ANV15-51-582S | |
| Genomsnitt Intel Core i5-13420H, NVIDIA GeForce RTX 4050 Laptop GPU (n=1) | |
| Medion Erazer Crawler E40 - MD 62518 | |
| Schenker XMG Apex 15 (Late 23) | |
| Lenovo LOQ 15IRH8 Core i7 | |
| Genomsnitt av klass Gaming (391 - 590, n=104, senaste 2 åren) | |
* ... mindre är bättre
| PCMark 10 Score | 6569 poäng | |
Hjälp | ||
| AIDA64 / Memory Copy | |
| Genomsnitt av klass Gaming (21750 - 129946, n=107, senaste 2 åren) | |
| Schenker XMG Apex 15 (Late 23) | |
| Medion Erazer Crawler E40 - MD 62518 | |
| Lenovo LOQ 15IRH8 Core i7 | |
| Asus TUF A15 FA507 | |
| Acer Nitro V 15 ANV15-51-582S | |
| Genomsnitt Intel Core i5-13420H (22003 - 59609, n=5) | |
| AIDA64 / Memory Read | |
| Genomsnitt av klass Gaming (22956 - 118858, n=107, senaste 2 åren) | |
| Medion Erazer Crawler E40 - MD 62518 | |
| Lenovo LOQ 15IRH8 Core i7 | |
| Schenker XMG Apex 15 (Late 23) | |
| Asus TUF A15 FA507 | |
| Acer Nitro V 15 ANV15-51-582S | |
| Genomsnitt Intel Core i5-13420H (23499 - 68085, n=5) | |
| AIDA64 / Memory Write | |
| Schenker XMG Apex 15 (Late 23) | |
| Genomsnitt av klass Gaming (22297 - 135096, n=107, senaste 2 åren) | |
| Medion Erazer Crawler E40 - MD 62518 | |
| Asus TUF A15 FA507 | |
| Lenovo LOQ 15IRH8 Core i7 | |
| Acer Nitro V 15 ANV15-51-582S | |
| Genomsnitt Intel Core i5-13420H (21429 - 62529, n=5) | |
| AIDA64 / Memory Latency | |
| Lenovo LOQ 15IRH8 Core i7 | |
| Genomsnitt av klass Gaming (75.3 - 259, n=107, senaste 2 åren) | |
| Genomsnitt Intel Core i5-13420H (90.2 - 103.6, n=5) | |
| Medion Erazer Crawler E40 - MD 62518 | |
| Acer Nitro V 15 ANV15-51-582S | |
| Schenker XMG Apex 15 (Late 23) | |
| Asus TUF A15 FA507 | |
* ... mindre är bättre
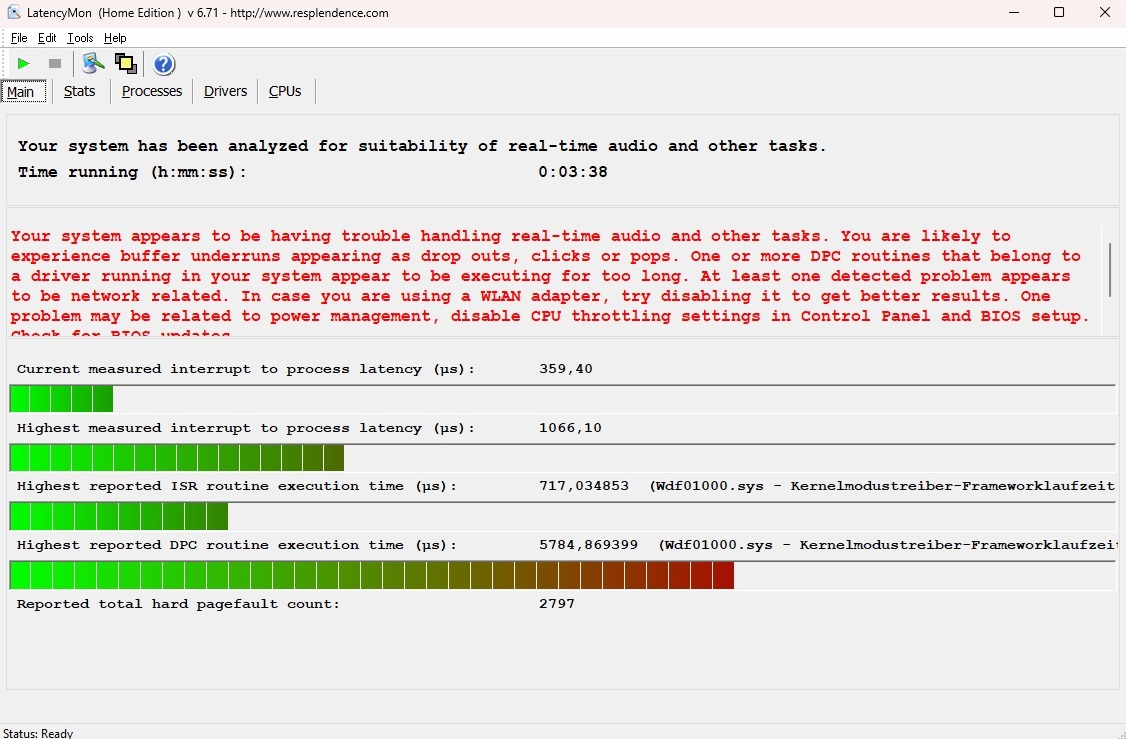
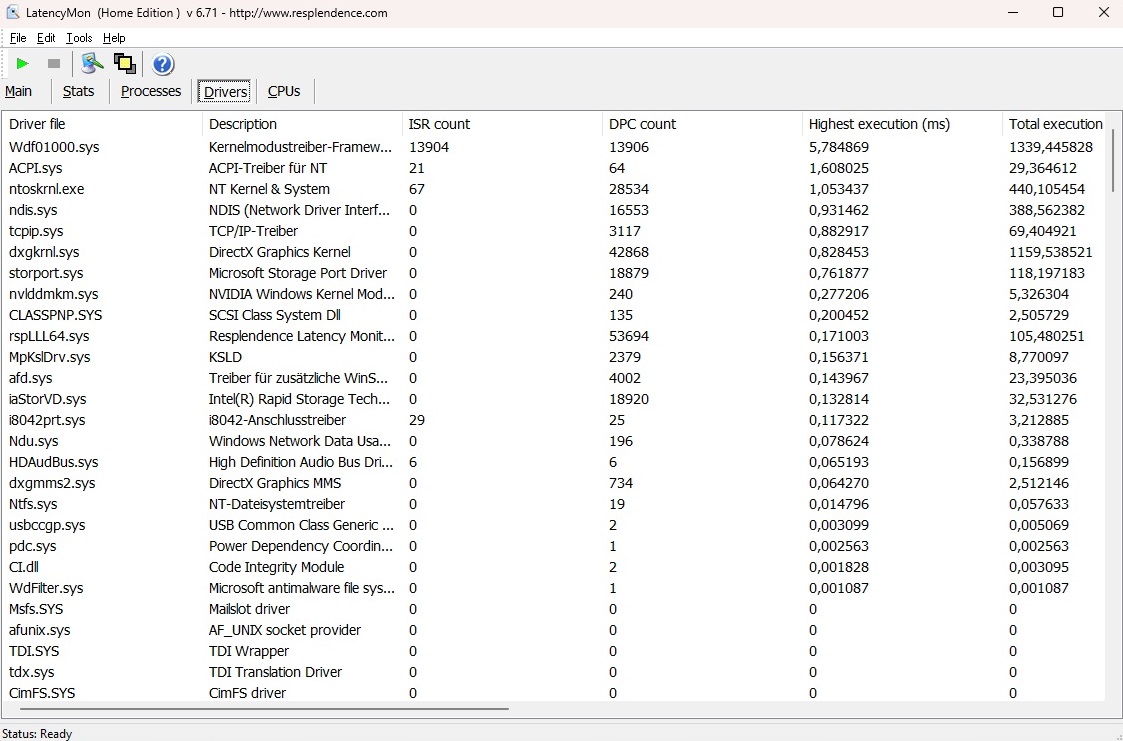
DPC-fördröjning
Enligt LatencyMon är Nitro V 15 endast delvis lämplig för latens-känsliga applikationer som ljud- och videoredigering i realtid. Detta problem påverkar dock många bärbara datorer och är endast relevant för vissa användare.
| DPC Latencies / LatencyMon - interrupt to process latency (max), Web, Youtube, Prime95 | |
| Acer Nitro V 15 ANV15-51-582S | |
| Medion Erazer Crawler E40 - MD 62518 | |
| Lenovo LOQ 15IRH8 Core i7 | |
| Schenker XMG Apex 15 (Late 23) | |
* ... mindre är bättre
Masslagring
M.2-lagringsenheten i vår granskningsenhet är tillverkad av SK hynix och levererar solid läs- och skrivprestanda för en NVMe-enhet. I likhet med SSD-enheten i Lenovo LOQ LOQ 15IRH8 lider den dock av en viss nivå av prestandaförluster och fluktuationer under ihållande belastning.

* ... mindre är bättre
Sustained Load Read: DiskSpd Read Loop, Queue Depth 8
Grafikkort
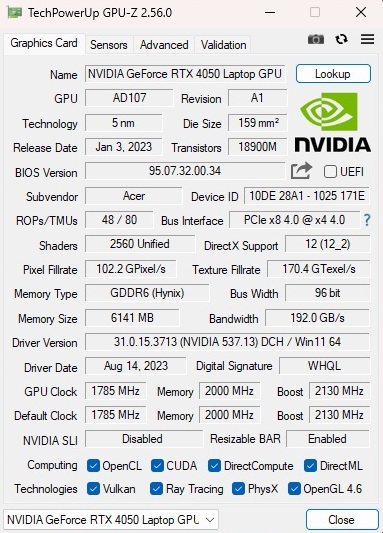
Även om konkurrenterna levererade något bättre resultat i syntetiska grafiska riktmärken, erbjuder RTX 4050 i Nitro V 15 fortfarande en prestandanivå som liknar vad vi har sett från denna GPU i genomsnitt. Mellanklassmodellen från Ada Lovelace-generationen erbjuder 2 560 shading-enheter, men har inte en särskilt generös minneskonfiguration, med bara 6 GB GDDR6 VRAM och ett 96-bitars gränssnitt. Acer har satt TGP till 75 watt (60 watt plus 15 watt Dynamic Boost), vilket är ganska lågt för en RTX 4050.
| 3DMark 11 Performance | 24506 poäng | |
| 3DMark Ice Storm Standard Score | 133723 poäng | |
| 3DMark Cloud Gate Standard Score | 50705 poäng | |
| 3DMark Fire Strike Score | 18795 poäng | |
| 3DMark Time Spy Score | 7944 poäng | |
Hjälp | ||
* ... mindre är bättre
Spelprestanda
Så länge du håller den interna upplösningen på Full HD (dvs. 1080p) och inte går till överdrift med inställningarna kan RTX 4050 också hantera moderna spel. Medium till höga inställningar bör oftast inte vara ett problem; först när du kommer till ultra-inställningar kan saker och ting bli snäva ibland (t.ex. i Lords of the Fallen eller Avatar: Pandoras gränser). I likhet med vad vi har sett i de grafiska riktmärkena, presterar andra RTX 4050-bärbara datorer med högre TGP ofta bättre än Nitro.
| The Witcher 3 - 1920x1080 Ultra Graphics & Postprocessing (HBAO+) | |
| Genomsnitt av klass Gaming (95 - 240, n=8, senaste 2 åren) | |
| Lenovo LOQ 15IRH8 Core i7 | |
| Schenker XMG Apex 15 (Late 23) | |
| Asus TUF A15 FA507 | |
| Medion Erazer Crawler E40 - MD 62518 | |
| Acer Nitro V 15 ANV15-51-582S | |
| Genomsnitt NVIDIA GeForce RTX 4050 Laptop GPU (18.5 - 94.7, n=40) | |
| Avatar Frontiers of Pandora - 1920x1080 Ultra Preset AA:T | |
| Genomsnitt av klass Gaming (n=1senaste 2 åren) | |
| Medion Erazer Scout E20 | |
| Acer Nitro V 15 ANV15-51-582S | |
| Genomsnitt NVIDIA GeForce RTX 4050 Laptop GPU (35 - 35, n=2) | |
| The Finals - 1920x1080 Epic Preset | |
| Medion Erazer Scout E20 | |
| Genomsnitt NVIDIA GeForce RTX 4050 Laptop GPU (91.8 - 99.2, n=2) | |
| Acer Nitro V 15 ANV15-51-582S | |
| Genomsnitt av klass Gaming (n=1senaste 2 åren) | |
| EA Sports WRC - 1920x1080 Ultra Preset AA:Epic AF:16x | |
| Medion Erazer Scout E20 | |
| Genomsnitt NVIDIA GeForce RTX 4050 Laptop GPU (61 - 67.3, n=2) | |
| Acer Nitro V 15 ANV15-51-582S | |
| Genomsnitt av klass Gaming (n=1senaste 2 åren) | |
| Assassin's Creed Mirage - 1920x1080 Ultra High Preset (Adaptive Quality Off) | |
| XMG Focus 15 E23 | |
| Genomsnitt NVIDIA GeForce RTX 4050 Laptop GPU (63 - 70, n=2) | |
| Acer Nitro V 15 ANV15-51-582S | |
| Ready or Not - 1920x1080 Epic Preset | |
| Medion Erazer Scout E20 | |
| Genomsnitt NVIDIA GeForce RTX 4050 Laptop GPU (95.1 - 107.1, n=2) | |
| Acer Nitro V 15 ANV15-51-582S | |
| Lords of the Fallen - 1920x1080 Ultra Preset | |
| XMG Focus 15 E23 | |
| Genomsnitt NVIDIA GeForce RTX 4050 Laptop GPU (27.3 - 32.1, n=2) | |
| Acer Nitro V 15 ANV15-51-582S | |
| Counter-Strike 2 - 1920x1080 Very High Preset | |
| Genomsnitt av klass Gaming (26.2 - 275, n=5, senaste 2 åren) | |
| Medion Erazer Scout E20 | |
| Genomsnitt NVIDIA GeForce RTX 4050 Laptop GPU (80.9 - 110.2, n=2) | |
| Acer Nitro V 15 ANV15-51-582S | |
| Total War Pharaoh - 1920x1080 Ultra Preset | |
| Genomsnitt av klass Gaming (42.9 - 161.4, n=2, senaste 2 åren) | |
| XMG Focus 15 E23 | |
| Genomsnitt NVIDIA GeForce RTX 4050 Laptop GPU (59.7 - 101, n=3) | |
| Acer Nitro V 15 ANV15-51-582S | |
Vi stötte inte på några större problem under vårt stabilitetstest (körning Den Witcher 3 på FHD/Ultra i en timme). Även om bildfrekvensen minskade något under testets gång, fanns det inga ovanliga prestandaförluster eller liknande.
Witcher 3 FPS chart
| låg | med. | hög | ultra | |
|---|---|---|---|---|
| GTA V (2015) | 177.3 | 158.2 | 86.9 | |
| The Witcher 3 (2015) | 78 | |||
| Dota 2 Reborn (2015) | 153.7 | 143.6 | 136.5 | 120.3 |
| Final Fantasy XV Benchmark (2018) | 104.3 | 76.5 | ||
| X-Plane 11.11 (2018) | 114.3 | 94.5 | 77 | |
| Far Cry 5 (2018) | 128 | 118 | 102 | |
| Strange Brigade (2018) | 189.5 | 155.2 | 135.2 | |
| Counter-Strike 2 (2023) | 127 | 112.4 | 80.9 | |
| Assassin's Creed Mirage (2023) | 89 | 84 | 63 | |
| Total War Pharaoh (2023) | 147 | 84.1 | 59.7 | |
| Lords of the Fallen (2023) | 54.1 | 38.6 | 27.3 | |
| EA Sports WRC (2023) | 71.2 | 66.6 | 61 | |
| Avatar Frontiers of Pandora (2023) | 55 | 47 | 35 | |
| The Finals (2023) | 130.2 | 113.7 | 91.8 | |
| Ready or Not (2023) | 148.3 | 134.2 | 95.1 |
Utsläpp
Utsläpp av buller
I förhållande till den mängd värme som genereras är Nitro V 15 onödigt högljudd när man kör 3D-applikationer. Vi uppmätte cirka 49 dB(A) ljudnivå under spel (balanserat läge), vilket är tydligt hörbart och kan vara tillräckligt högt för att störa vissa användare. Som sagt, den bärbara datorn skiljer sig inte alltför mycket från konkurrenterna i detta avseende. I viloläge är de två fläktarna på insidan antingen helt stilla eller körs med en måttlig ljudnivå på 29 till 30 dB(A).
Ljudnivå
| Låg belastning |
| 25 / 29 / 30 dB(A) |
| Hög belastning |
| 49 / 51 dB(A) |
 | ||
30 dB tyst 40 dB(A) hörbar 50 dB(A) högt ljud |
||
min: | ||
| Acer Nitro V 15 ANV15-51-582S GeForce RTX 4050 Laptop GPU, i5-13420H | Medion Erazer Crawler E40 - MD 62518 GeForce RTX 4050 Laptop GPU, i5-13500H | Lenovo LOQ 15IRH8 Core i7 GeForce RTX 4050 Laptop GPU, i7-13620H | Asus TUF A15 FA507 GeForce RTX 4050 Laptop GPU, R7 7735HS | Schenker XMG Apex 15 (Late 23) GeForce RTX 4050 Laptop GPU, R7 7840HS | |
|---|---|---|---|---|---|
| Noise | 4% | -0% | 18% | 3% | |
| av / miljö * (dB) | 25 | 23 8% | 23.69 5% | 23.3 7% | 24 4% |
| Idle Minimum * (dB) | 25 | 23 8% | 29.03 -16% | 23.3 7% | 25 -0% |
| Idle Average * (dB) | 29 | 23 21% | 29.03 -0% | 23.3 20% | 29 -0% |
| Idle Maximum * (dB) | 30 | 28.02 7% | 29.03 3% | 23.3 22% | 33 -10% |
| Load Average * (dB) | 49 | 50.21 -2% | 48.7 1% | 29.6 40% | 36 27% |
| Witcher 3 ultra * (dB) | 49 | 51.46 -5% | 48.5 1% | 43 12% | 48 2% |
| Load Maximum * (dB) | 51 | 56.79 -11% | 48.7 5% | 43 16% | 53 -4% |
* ... mindre är bättre
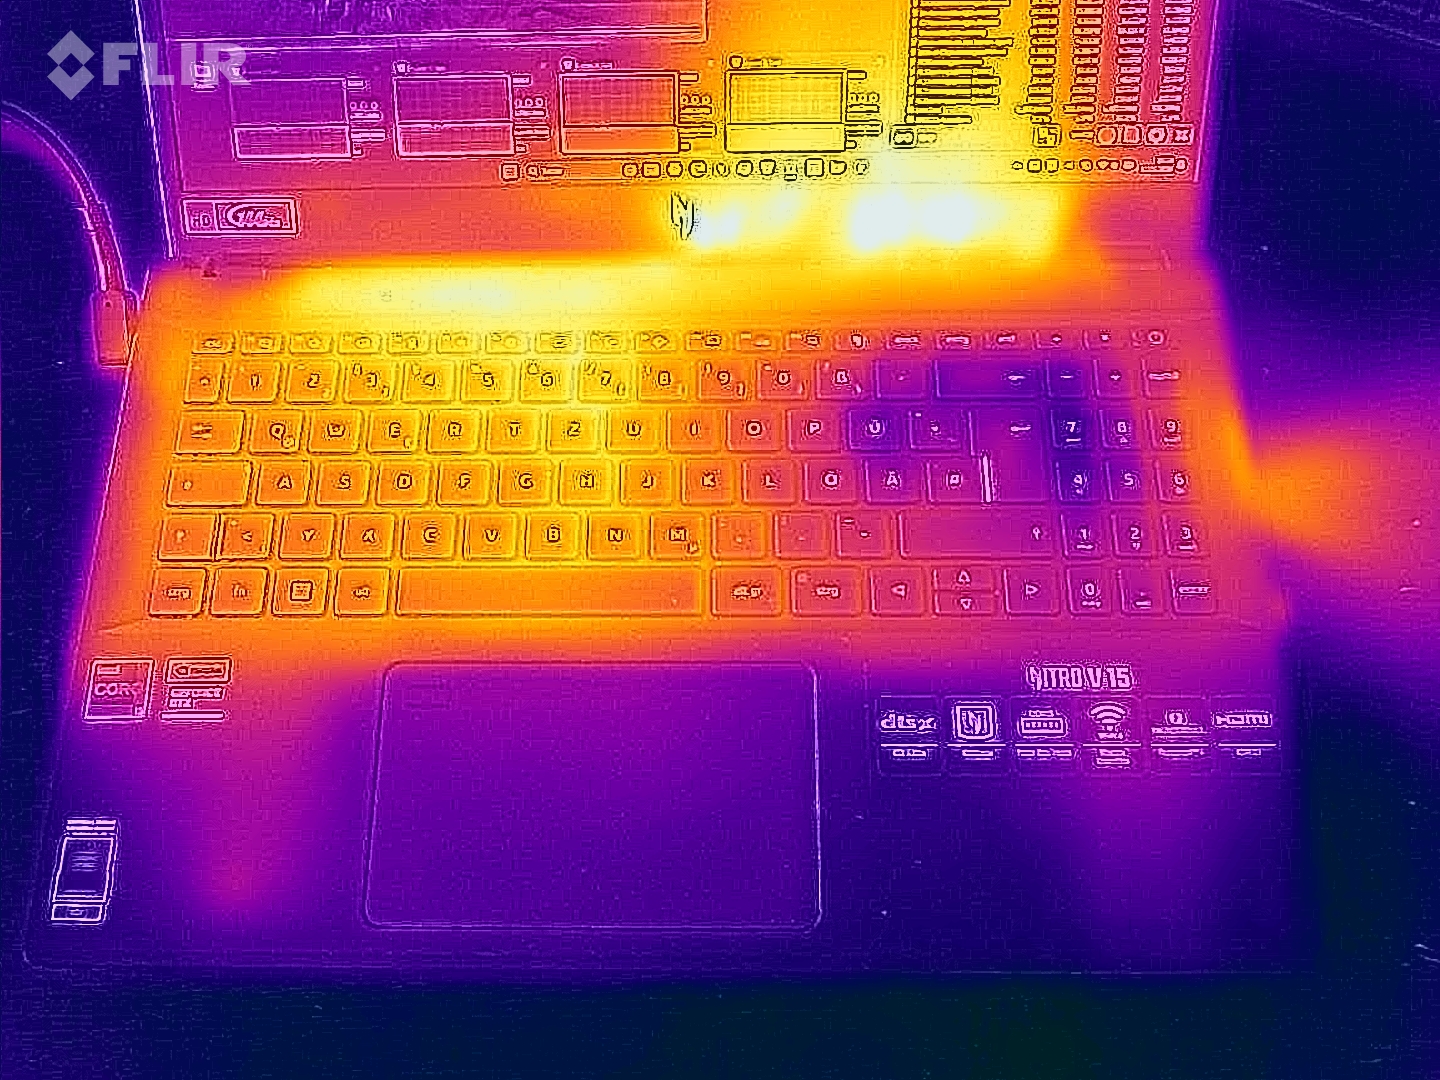
Temperatur
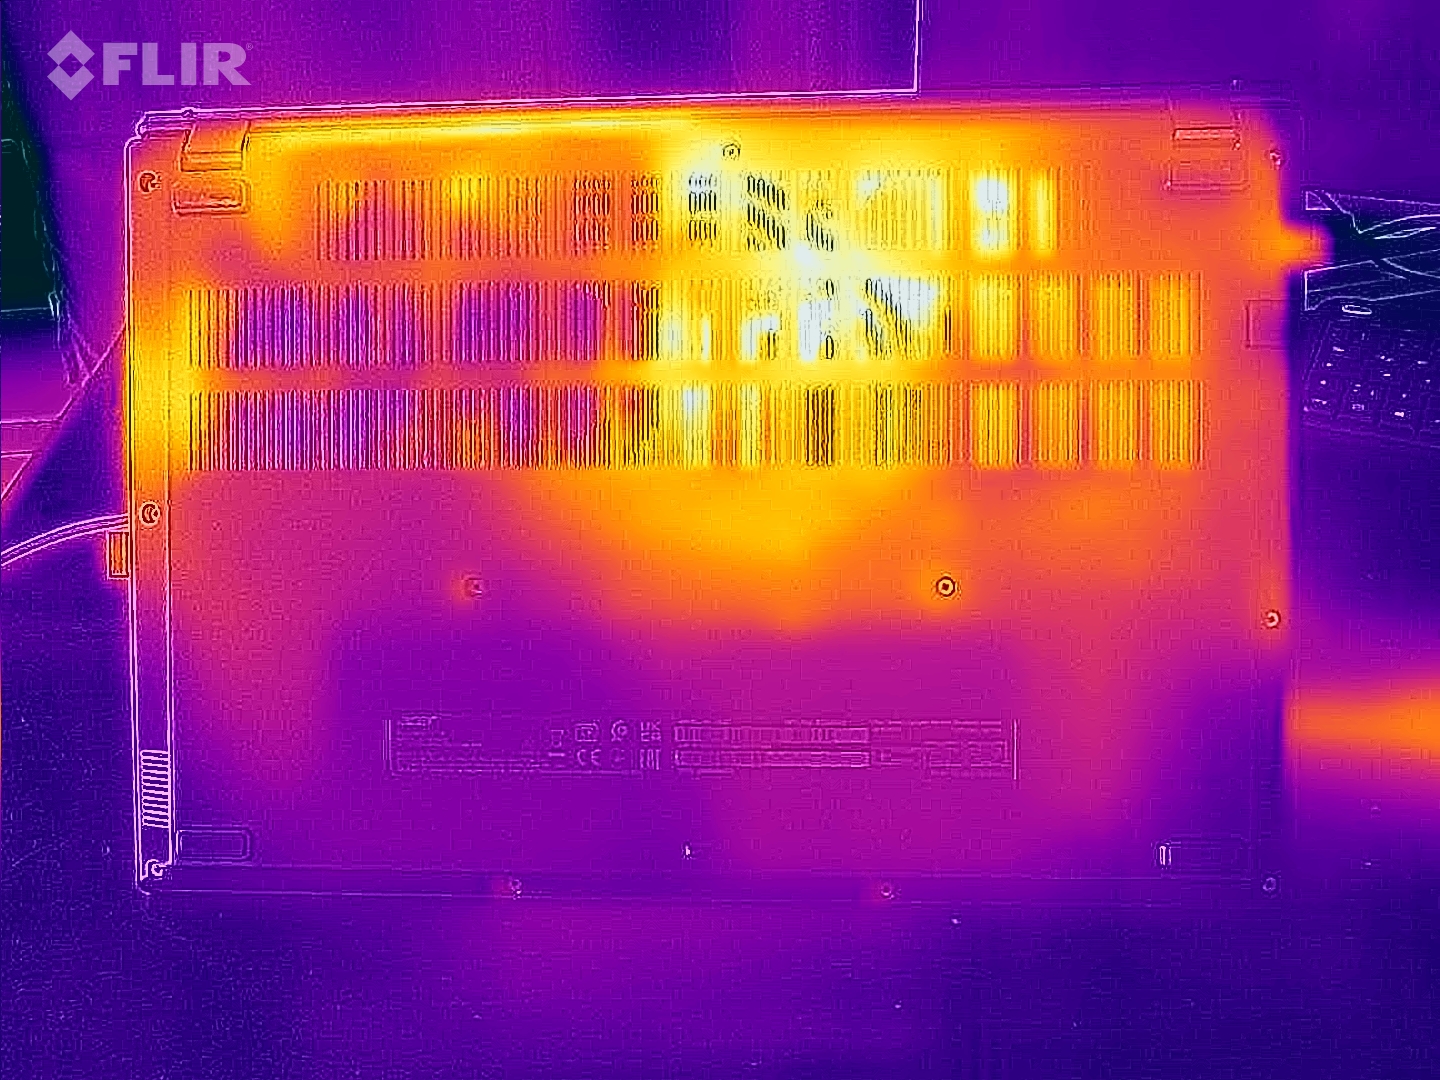
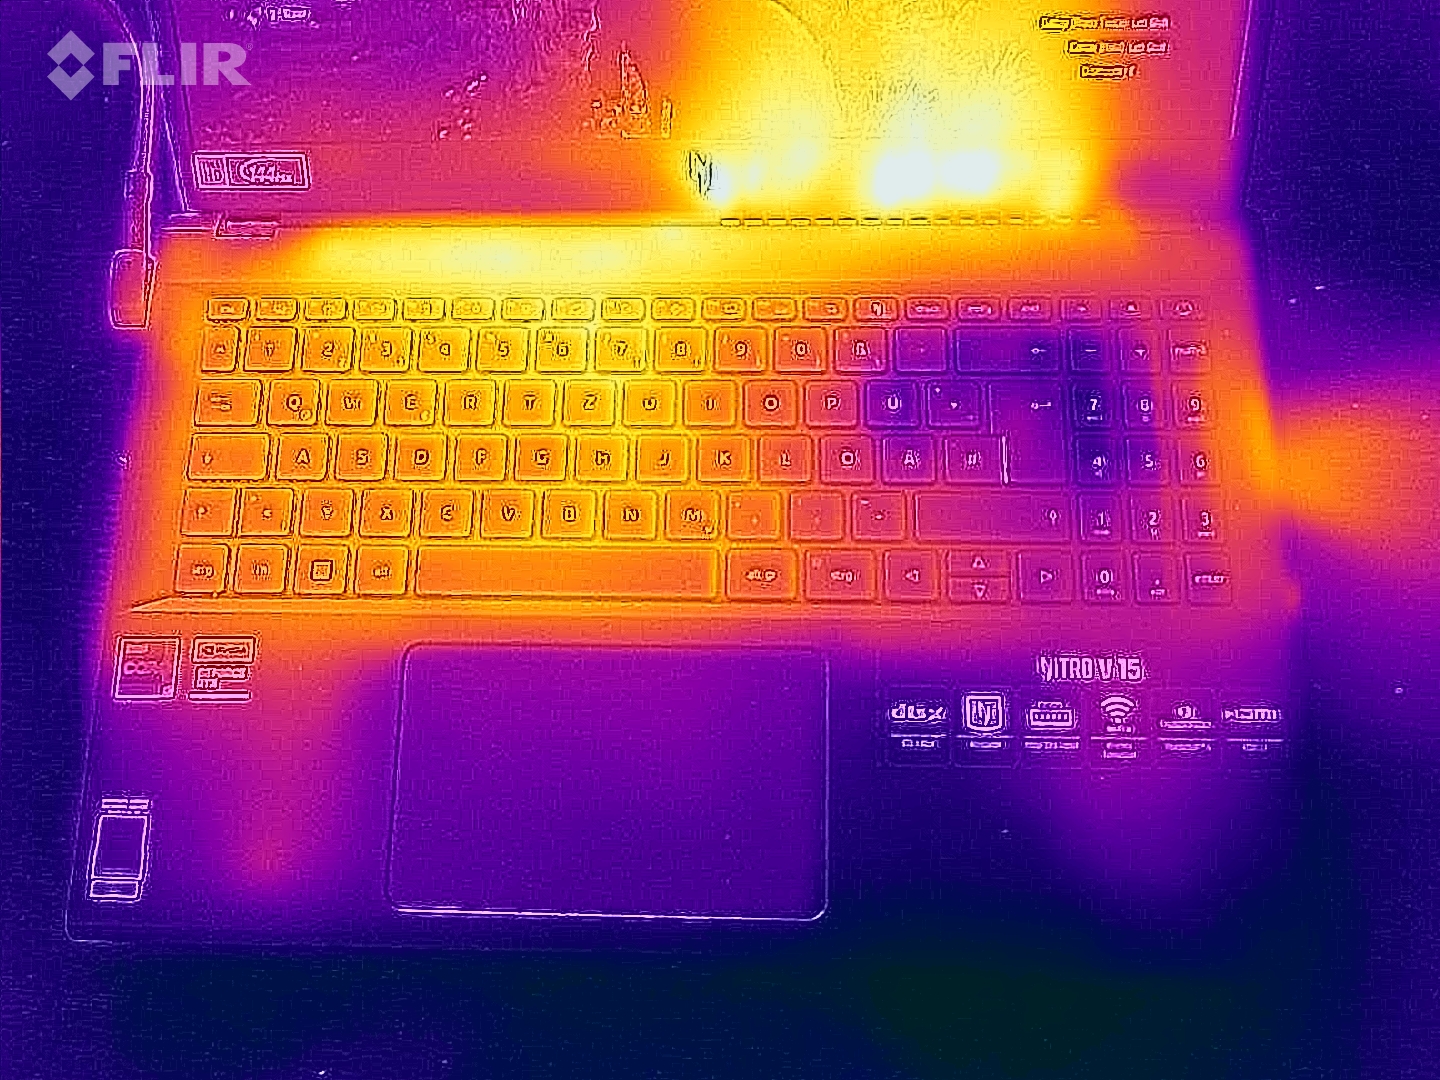
Nitro V 15 blir inte blixtrande varm. Även efter 60 minuters stresstest (med FurMark och Prime95) höll sig datorns yta under 50°C-strecket (122°F). Hela chassit hålls svalt vid viloläge - vår termometer rapporterade bara temperaturer mellan 22 och 28 °C (71,6 och 82,4 °F).
(-) Den maximala temperaturen på ovansidan är 46 °C / 115 F, jämfört med genomsnittet av 40.4 °C / 105 F , allt från 21.2 till 68.8 °C för klassen Gaming.
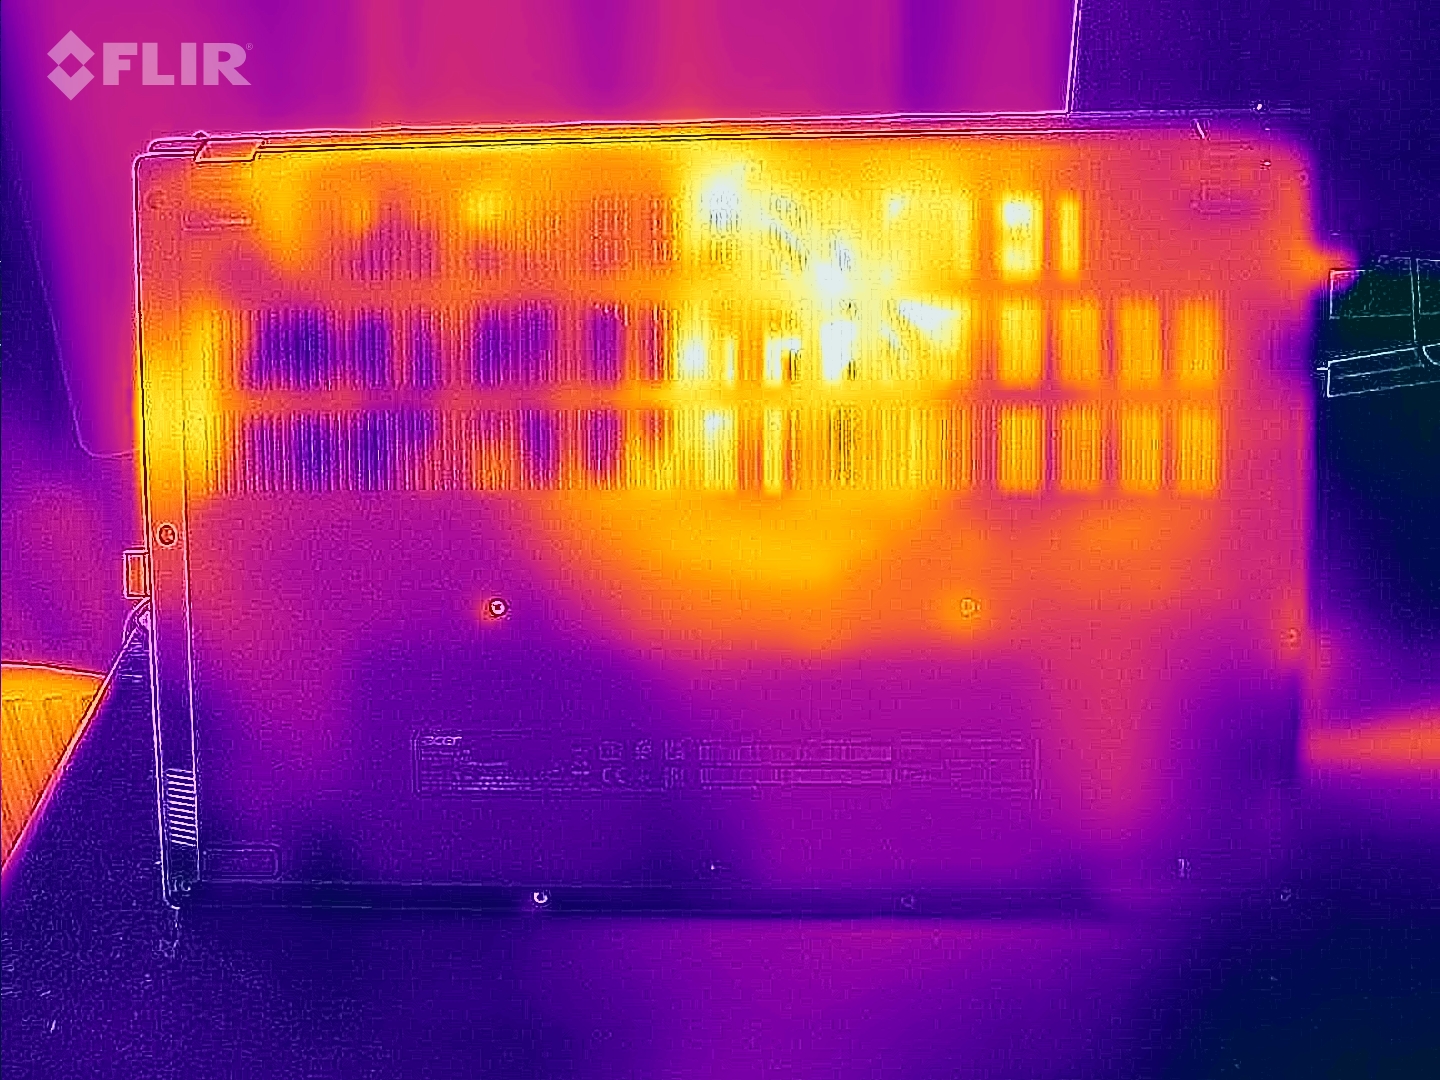
(-) Botten värms upp till maximalt 48 °C / 118 F, jämfört med genomsnittet av 43.2 °C / 110 F
(+) Vid tomgångsbruk är medeltemperaturen för ovansidan 25.1 °C / 77 F, jämfört med enhetsgenomsnittet på 33.9 °C / ### class_avg_f### F.
(-) När du spelar The Witcher 3 är medeltemperaturen för ovansidan 39.4 °C / 103 F, jämfört med enhetsgenomsnittet på 33.9 °C / ## #class_avg_f### F.
(±) Handledsstöden och pekplattan kan bli väldigt varma vid beröring med maximalt 36 °C / 96.8 F.
(-) Medeltemperaturen för handledsstödsområdet på liknande enheter var 28.8 °C / 83.8 F (-7.2 °C / -13 F).
| Acer Nitro V 15 ANV15-51-582S GeForce RTX 4050 Laptop GPU, i5-13420H | Medion Erazer Crawler E40 - MD 62518 GeForce RTX 4050 Laptop GPU, i5-13500H | Lenovo LOQ 15IRH8 Core i7 GeForce RTX 4050 Laptop GPU, i7-13620H | Asus TUF A15 FA507 GeForce RTX 4050 Laptop GPU, R7 7735HS | Schenker XMG Apex 15 (Late 23) GeForce RTX 4050 Laptop GPU, R7 7840HS | |
|---|---|---|---|---|---|
| Heat | 14% | -20% | 1% | -13% | |
| Maximum Upper Side * (°C) | 46 | 36 22% | 46.4 -1% | 48.9 -6% | 52 -13% |
| Maximum Bottom * (°C) | 48 | 36 25% | 59.2 -23% | 44.6 7% | 47 2% |
| Idle Upper Side * (°C) | 27 | 26 4% | 34.4 -27% | 27.1 -0% | 33 -22% |
| Idle Bottom * (°C) | 28 | 27 4% | 36.2 -29% | 27.5 2% | 33 -18% |
* ... mindre är bättre
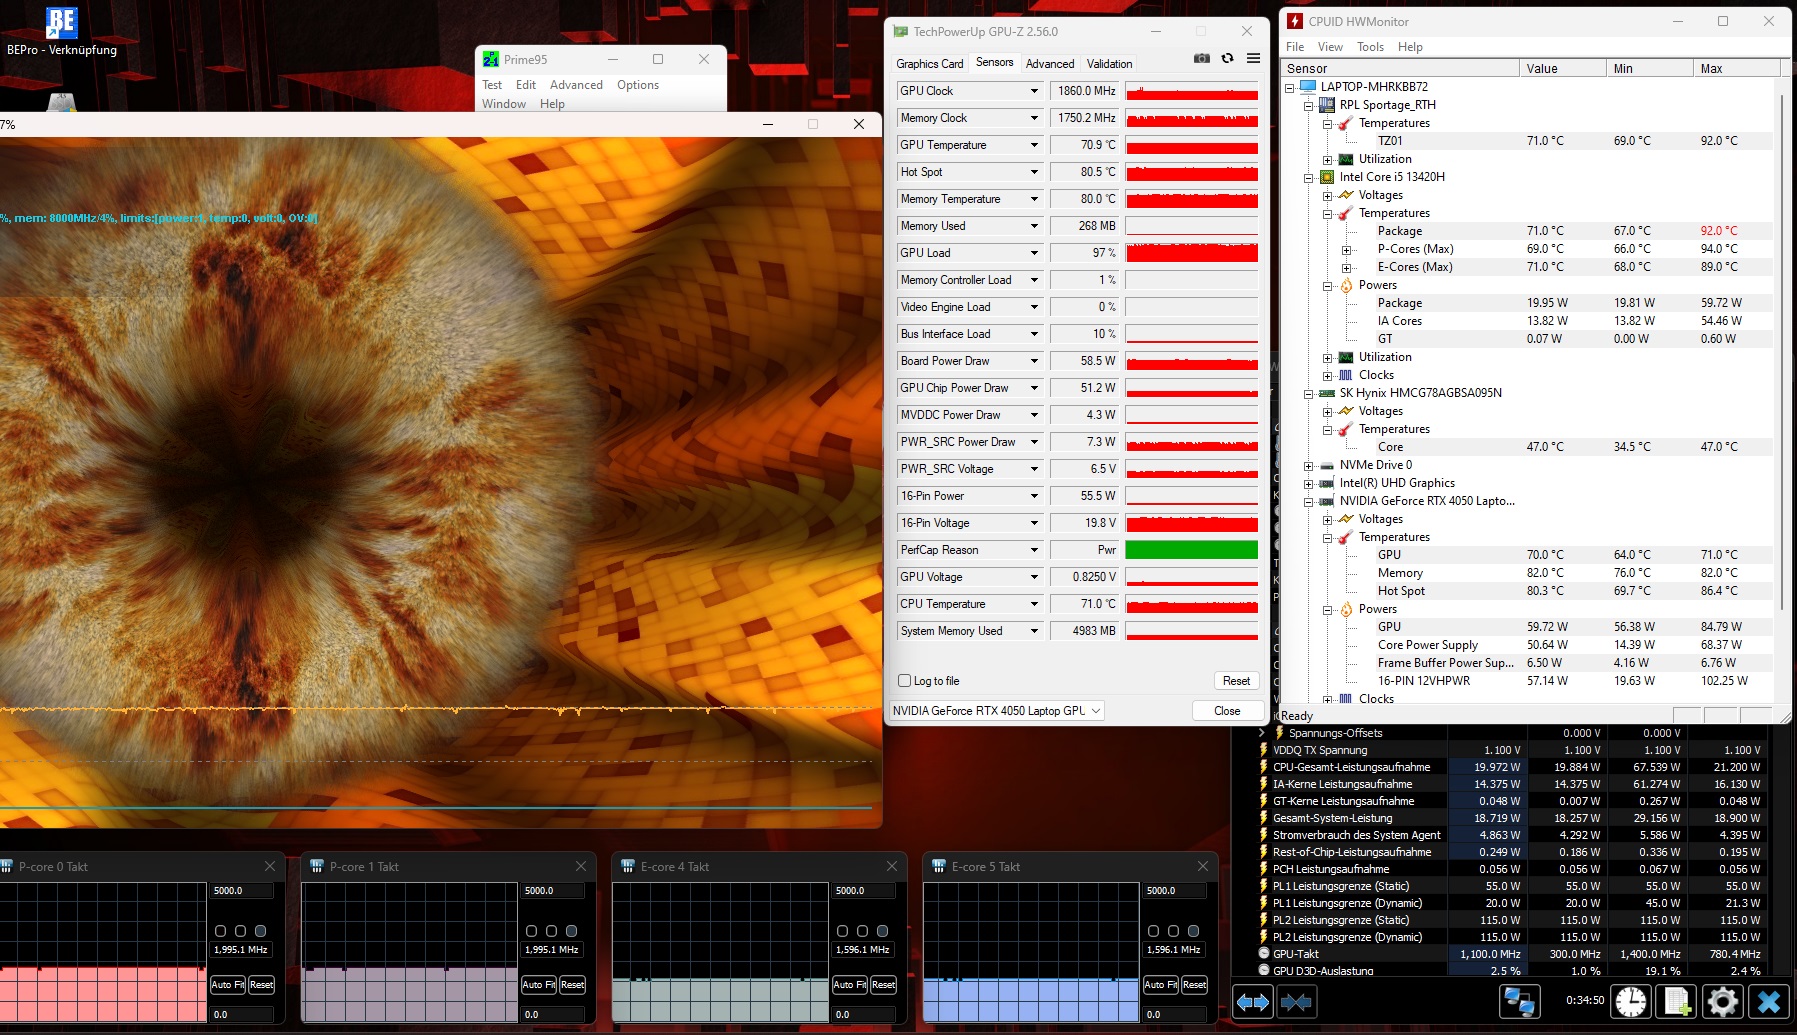
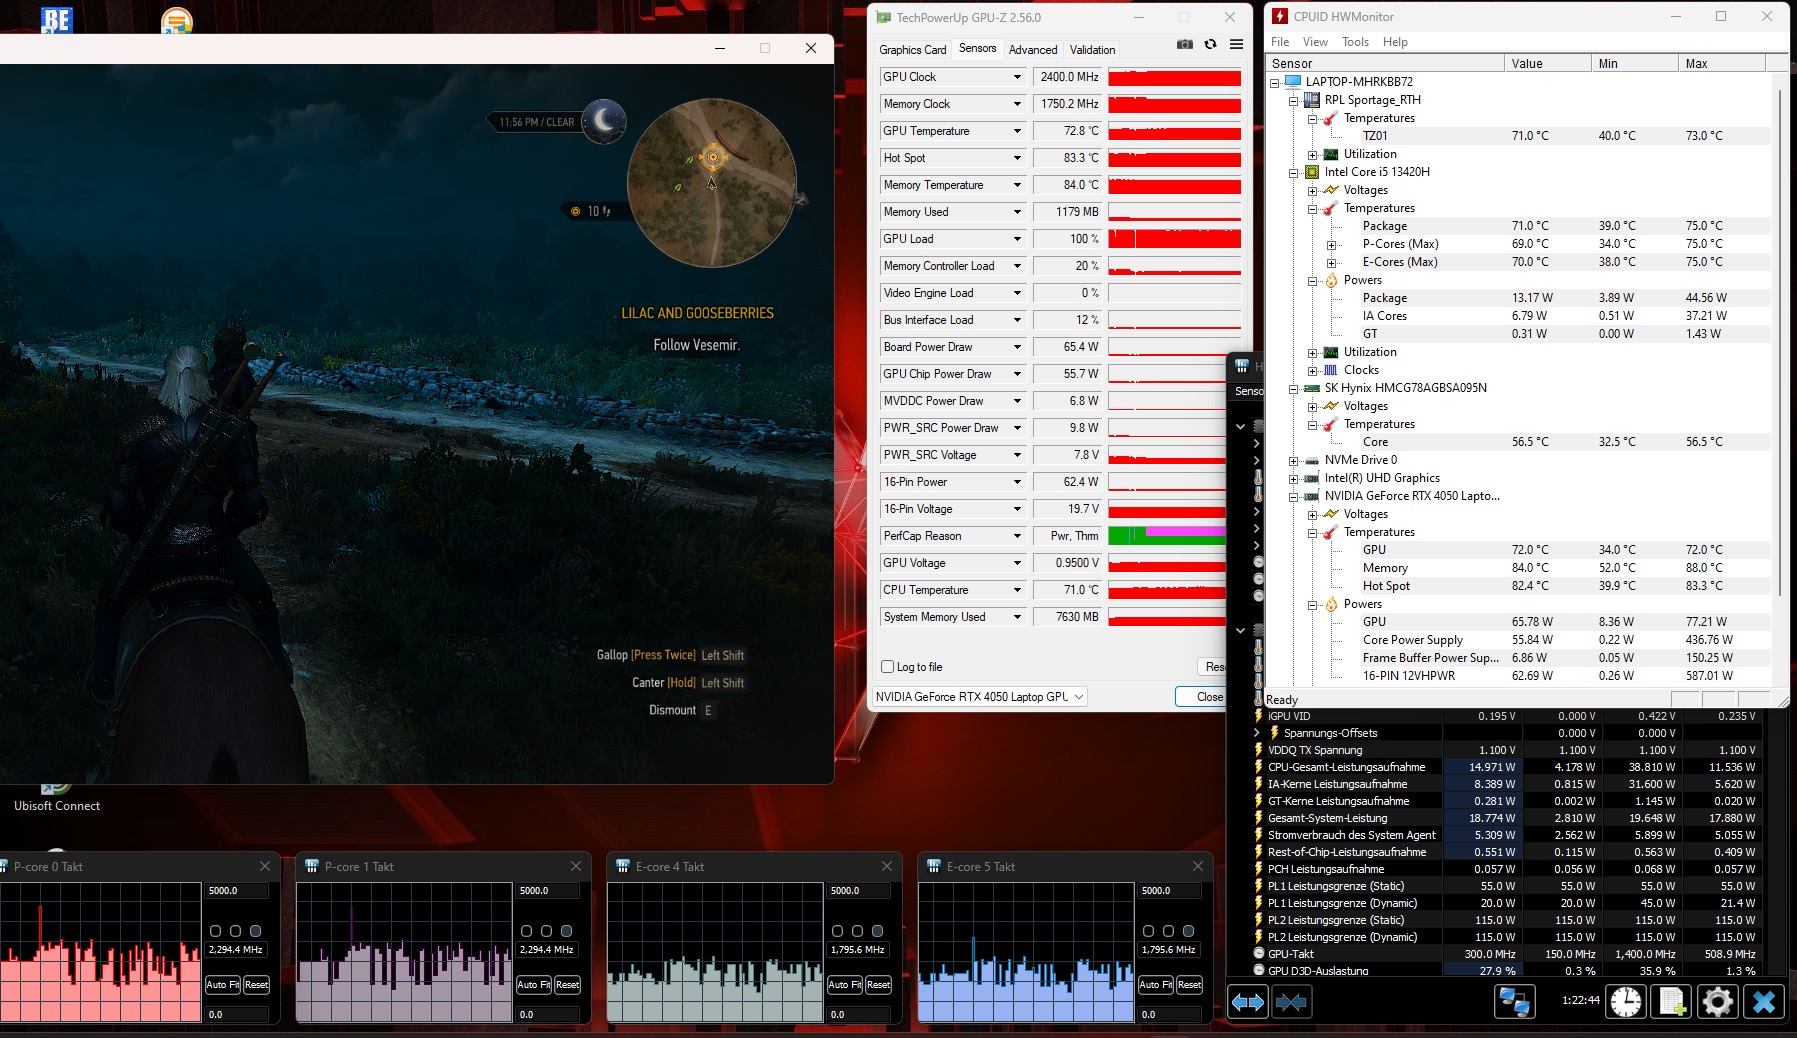
Stresstest
Den bärbara datorns komponenter överhettas inte heller vid full belastning. CPU och GPU kördes vid en genomsnittlig temperatur på 71°C (159,8°F), vilket är ett relativt bra värde som inte ger anledning till oro eller kritik. Testet på Witcher 3 under 60 minuter gav också liknande resultat.
Högtalare
Nitro V 15 erbjuder ett anständigt till bra ljud för en bärbar dator, men som ofta är fallet saknas det bas. Maxvolymen på 83 dB(A) är ändå ganska bra.
Acer Nitro V 15 ANV15-51-582S ljudanalys
(+) | högtalare kan spela relativt högt (83 dB)
Bas 100 - 315 Hz
(-) | nästan ingen bas - i genomsnitt 26.5% lägre än medianen
(±) | linjäriteten för basen är genomsnittlig (13.9% delta till föregående frekvens)
Mellan 400 - 2000 Hz
(+) | balanserad mellan - endast 3.2% från medianen
(+) | mids är linjära (4.2% delta till föregående frekvens)
Högsta 2 - 16 kHz
(+) | balanserade toppar - endast 1.6% från medianen
(+) | toppar är linjära (3.3% delta till föregående frekvens)
Totalt 100 - 16 000 Hz
(±) | linjäriteten för det totala ljudet är genomsnittlig (15.9% skillnad mot median)
Jämfört med samma klass
» 38% av alla testade enheter i den här klassen var bättre, 7% liknande, 56% sämre
» Den bästa hade ett delta på 6%, genomsnittet var 18%, sämst var 132%
Jämfört med alla testade enheter
» 25% av alla testade enheter var bättre, 5% liknande, 70% sämre
» Den bästa hade ett delta på 4%, genomsnittet var 24%, sämst var 134%
Asus TUF A15 FA507 ljudanalys
(±) | högtalarljudstyrkan är genomsnittlig men bra (79.3 dB)
Bas 100 - 315 Hz
(±) | reducerad bas - i genomsnitt 13.7% lägre än medianen
(+) | basen är linjär (6.2% delta till föregående frekvens)
Mellan 400 - 2000 Hz
(±) | högre mellan - i genomsnitt 7.6% högre än median
(±) | linjäriteten för mids är genomsnittlig (7.3% delta till föregående frekvens)
Högsta 2 - 16 kHz
(+) | balanserade toppar - endast 2.1% från medianen
(±) | linjäriteten för toppar är genomsnittlig (7.5% delta till föregående frekvens)
Totalt 100 - 16 000 Hz
(±) | linjäriteten för det totala ljudet är genomsnittlig (17.2% skillnad mot median)
Jämfört med samma klass
» 46% av alla testade enheter i den här klassen var bättre, 11% liknande, 42% sämre
» Den bästa hade ett delta på 6%, genomsnittet var 18%, sämst var 132%
Jämfört med alla testade enheter
» 32% av alla testade enheter var bättre, 8% liknande, 60% sämre
» Den bästa hade ett delta på 4%, genomsnittet var 24%, sämst var 134%
Energihantering
Strömförbrukning
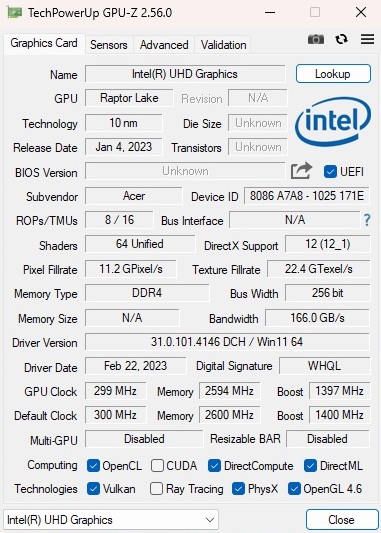
15-tumsdatorn har en relativt låg energiförbrukning, delvis tack vare grafikomkopplingen. Den har den lägsta strömförbrukningen i vår jämförelse, endast 7 till 11 watt i viloläge och 76 till 136 watt i 3D-applikationer. Vissa av de andra enheterna i jämförelsen förbrukar betydligt mer ström.
| Av/Standby | |
| Låg belastning | |
| Hög belastning |
|
Förklaring:
min: | |
| Acer Nitro V 15 ANV15-51-582S GeForce RTX 4050 Laptop GPU, i5-13420H | Medion Erazer Crawler E40 - MD 62518 GeForce RTX 4050 Laptop GPU, i5-13500H | Lenovo LOQ 15IRH8 Core i7 GeForce RTX 4050 Laptop GPU, i7-13620H | Asus TUF A15 FA507 GeForce RTX 4050 Laptop GPU, R7 7735HS | Schenker XMG Apex 15 (Late 23) GeForce RTX 4050 Laptop GPU, R7 7840HS | Genomsnitt av klass Gaming | |
|---|---|---|---|---|---|---|
| Power Consumption | -50% | -107% | -26% | -20% | -95% | |
| Idle Minimum * (Watt) | 7 | 10 -43% | 18.52 -165% | 8 -14% | 6 14% | 13.2 ? -89% |
| Idle Average * (Watt) | 8 | 15.3 -91% | 22.54 -182% | 12.1 -51% | 11 -38% | 18.9 ? -136% |
| Idle Maximum * (Watt) | 11 | 15.5 -41% | 29.79 -171% | 12.5 -14% | 14 -27% | 24.3 ? -121% |
| Load Average * (Watt) | 76 | 88 -16% | 94.5 -24% | 74.9 1% | 65 14% | 108.3 ? -43% |
| Witcher 3 ultra * (Watt) | 98.2 | 155 -58% | 154.4 -57% | 136.6 -39% | 136.5 -39% | |
| Load Maximum * (Watt) | 136 | 202.47 -49% | 190.4 -40% | 185 -36% | 195 -43% | 254 ? -87% |
* ... mindre är bättre
Power consumption Witcher 3 / Stresstest
Power consumption with external monitor
Batteriets livslängd
Nitro V 15 kan däremot leverera mycket bra batteritid och gör det trots att batteriet har en ganska blygsam kapacitet på 57 Wh. I vårt Wi-Fi-test (ljusstyrka reducerad till 150 cd/m²) klarade Acer notebook ca 9,5 timmar - ett mycket respektabelt resultat för den här klassen av bärbara datorer.
| Acer Nitro V 15 ANV15-51-582S i5-13420H, GeForce RTX 4050 Laptop GPU, 57 Wh | Medion Erazer Crawler E40 - MD 62518 i5-13500H, GeForce RTX 4050 Laptop GPU, 54 Wh | Lenovo LOQ 15IRH8 Core i7 i7-13620H, GeForce RTX 4050 Laptop GPU, 60 Wh | Asus TUF A15 FA507 R7 7735HS, GeForce RTX 4050 Laptop GPU, 90 Wh | Schenker XMG Apex 15 (Late 23) R7 7840HS, GeForce RTX 4050 Laptop GPU, 62.32 Wh | Genomsnitt av klass Gaming | |
|---|---|---|---|---|---|---|
| Batteridrifttid | -43% | -37% | -9% | -30% | -33% | |
| Reader / Idle (h) | 21.5 | 8.4 -61% | 8.71 ? -59% | |||
| WiFi v1.3 (h) | 9.4 | 4.1 -56% | 5.9 -37% | 11.7 24% | 7.1 -24% | 7.04 ? -25% |
| Load (h) | 1.7 | 1.2 -29% | 1 -41% | 1.6 -6% | 1.47 ? -14% | |
| H.264 (h) | 3.9 | 6.1 | 12.5 | 8.3 | 8.26 ? |
För
Emot
Dom
Acer Nitro V 15:s styrkor och brister blev uppenbara under våra tester.
Medan den bärbara datorn har en elegant design, ett relativt kompakt chassi och en imponerande batteritid, är skärmen inte riktigt upp till dagens standard (särskilt när det gäller färgtäckning och ljusstyrka).
Prestandan hos Core i5-13420H och GeForce RTX 4050 är ungefär vad man kan förvänta sig av en bärbar dator som kostar ca 1 000 € (1 085 USD).
Prismedvetna spelare får en solid spelplattform som kan leverera användbara bildhastigheter - åtminstone i Full HD.
Den bärbara datorn har en ledig RAM-kortplats och en andra M.2-plats som är redo för framtida uppgraderingar. Portvalet är också uppdaterat tack vare Thunderbolt 4, även om det fortfarande finns utrymme för förbättringar på vissa ställen.
Konkurrenterna som nämns i recensionen, till exempel Lenovo LOQ 15IRH8 och Asus TUF A15 FA507, har fått något högre totalpoäng på grund av sina överlägsna skärmar.
Pris och tillgänglighet
Acer Nitro V 15 ANV15-51-582S med en Core i5-13420H och GeForce RTX 4050 finns tillgänglig från olika onlinebutiker (t.ex. notebooksbilliger.de) för cirka 900 euro. På Amazon US kan modellen med den snabbare Core i7-13620H köpas för ca 950 US-DOLLAR.
Acer Nitro V 15 ANV15-51-582S
- 01/16/2024 v7 (old)
Florian Glaser
Genomskinlighet
Valet av enheter som ska granskas görs av vår redaktion. Testprovet gavs till författaren som ett lån av tillverkaren eller återförsäljaren för denna recension. Långivaren hade inget inflytande på denna recension och inte heller fick tillverkaren en kopia av denna recension innan publiceringen. Det fanns ingen skyldighet att publicera denna recension. Som ett oberoende medieföretag är Notebookcheck inte föremål för auktoritet från tillverkare, återförsäljare eller förlag.
This is how Notebookcheck is testingEvery year, Notebookcheck independently reviews hundreds of laptops and smartphones using standardized procedures to ensure that all results are comparable. We have continuously developed our test methods for around 20 years and set industry standards in the process. In our test labs, high-quality measuring equipment is utilized by experienced technicians and editors. These tests involve a multi-stage validation process. Our complex rating system is based on hundreds of well-founded measurements and benchmarks, which maintains objectivity.
Price comparison

