Granskning av XMG Pro 16 Studio (Mid 23): RTX 4070-bärbar dator för spelare och kreatörer
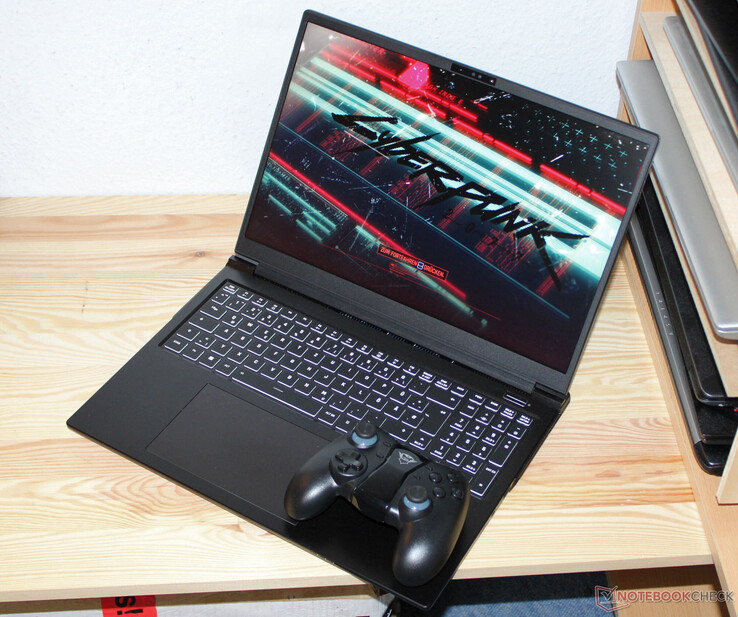
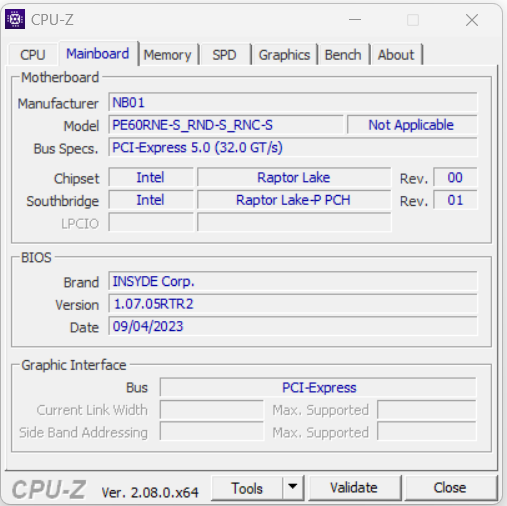
XMG Pro 16 Studio (Mid 23) - en 16-tums laptop för gamers och kreatörer - är baserad på en barebone (PE60RNE-S) från Clevo och den aktuella varianten kan för närvarande hittas för cirka 2 400 USD. Bland konkurrenterna finnsLenovo Legion Slim 7i 16 Gen 8, HP Omen Transcend 16, Asus Vivobook Pro 16X ochMSI Stealth 16 Studio A13VG.
Potentiella konkurrenter i jämförelse
Gradering | Datum | Modell | Vikt | Höjd | Storlek | Upplösning | Pris |
|---|---|---|---|---|---|---|---|
| 87.9 % v7 (old) | 10/2023 | Schenker XMG Pro 16 Studio (Mid 23) i9-13900H, GeForce RTX 4070 Laptop GPU | 2.6 kg | 19.9 mm | 16.00" | 2560x1600 | |
| 86.2 % v7 (old) | 07/2023 | Asus Vivobook Pro 16X K6604JV-MX016W i9-13980HX, GeForce RTX 4060 Laptop GPU | 2.1 kg | 22.8 mm | 16.00" | 3200x2000 | |
| 90 % v7 (old) | 07/2023 | Lenovo Legion Slim 7i 16 Gen 8 i9-13900H, GeForce RTX 4070 Laptop GPU | 2.1 kg | 19.9 mm | 16.00" | 2560x1600 | |
| 87.9 % v7 (old) | 08/2023 | HP Omen Transcend 16 i9-13900HX, GeForce RTX 4070 Laptop GPU | 2.3 kg | 19.8 mm | 16.00" | 2560x1600 | |
| 88.8 % v7 (old) | 07/2023 | MSI Stealth 16 Studio A13VG i7-13700H, GeForce RTX 4070 Laptop GPU | 2 kg | 19.95 mm | 16.00" | 2560x1600 |
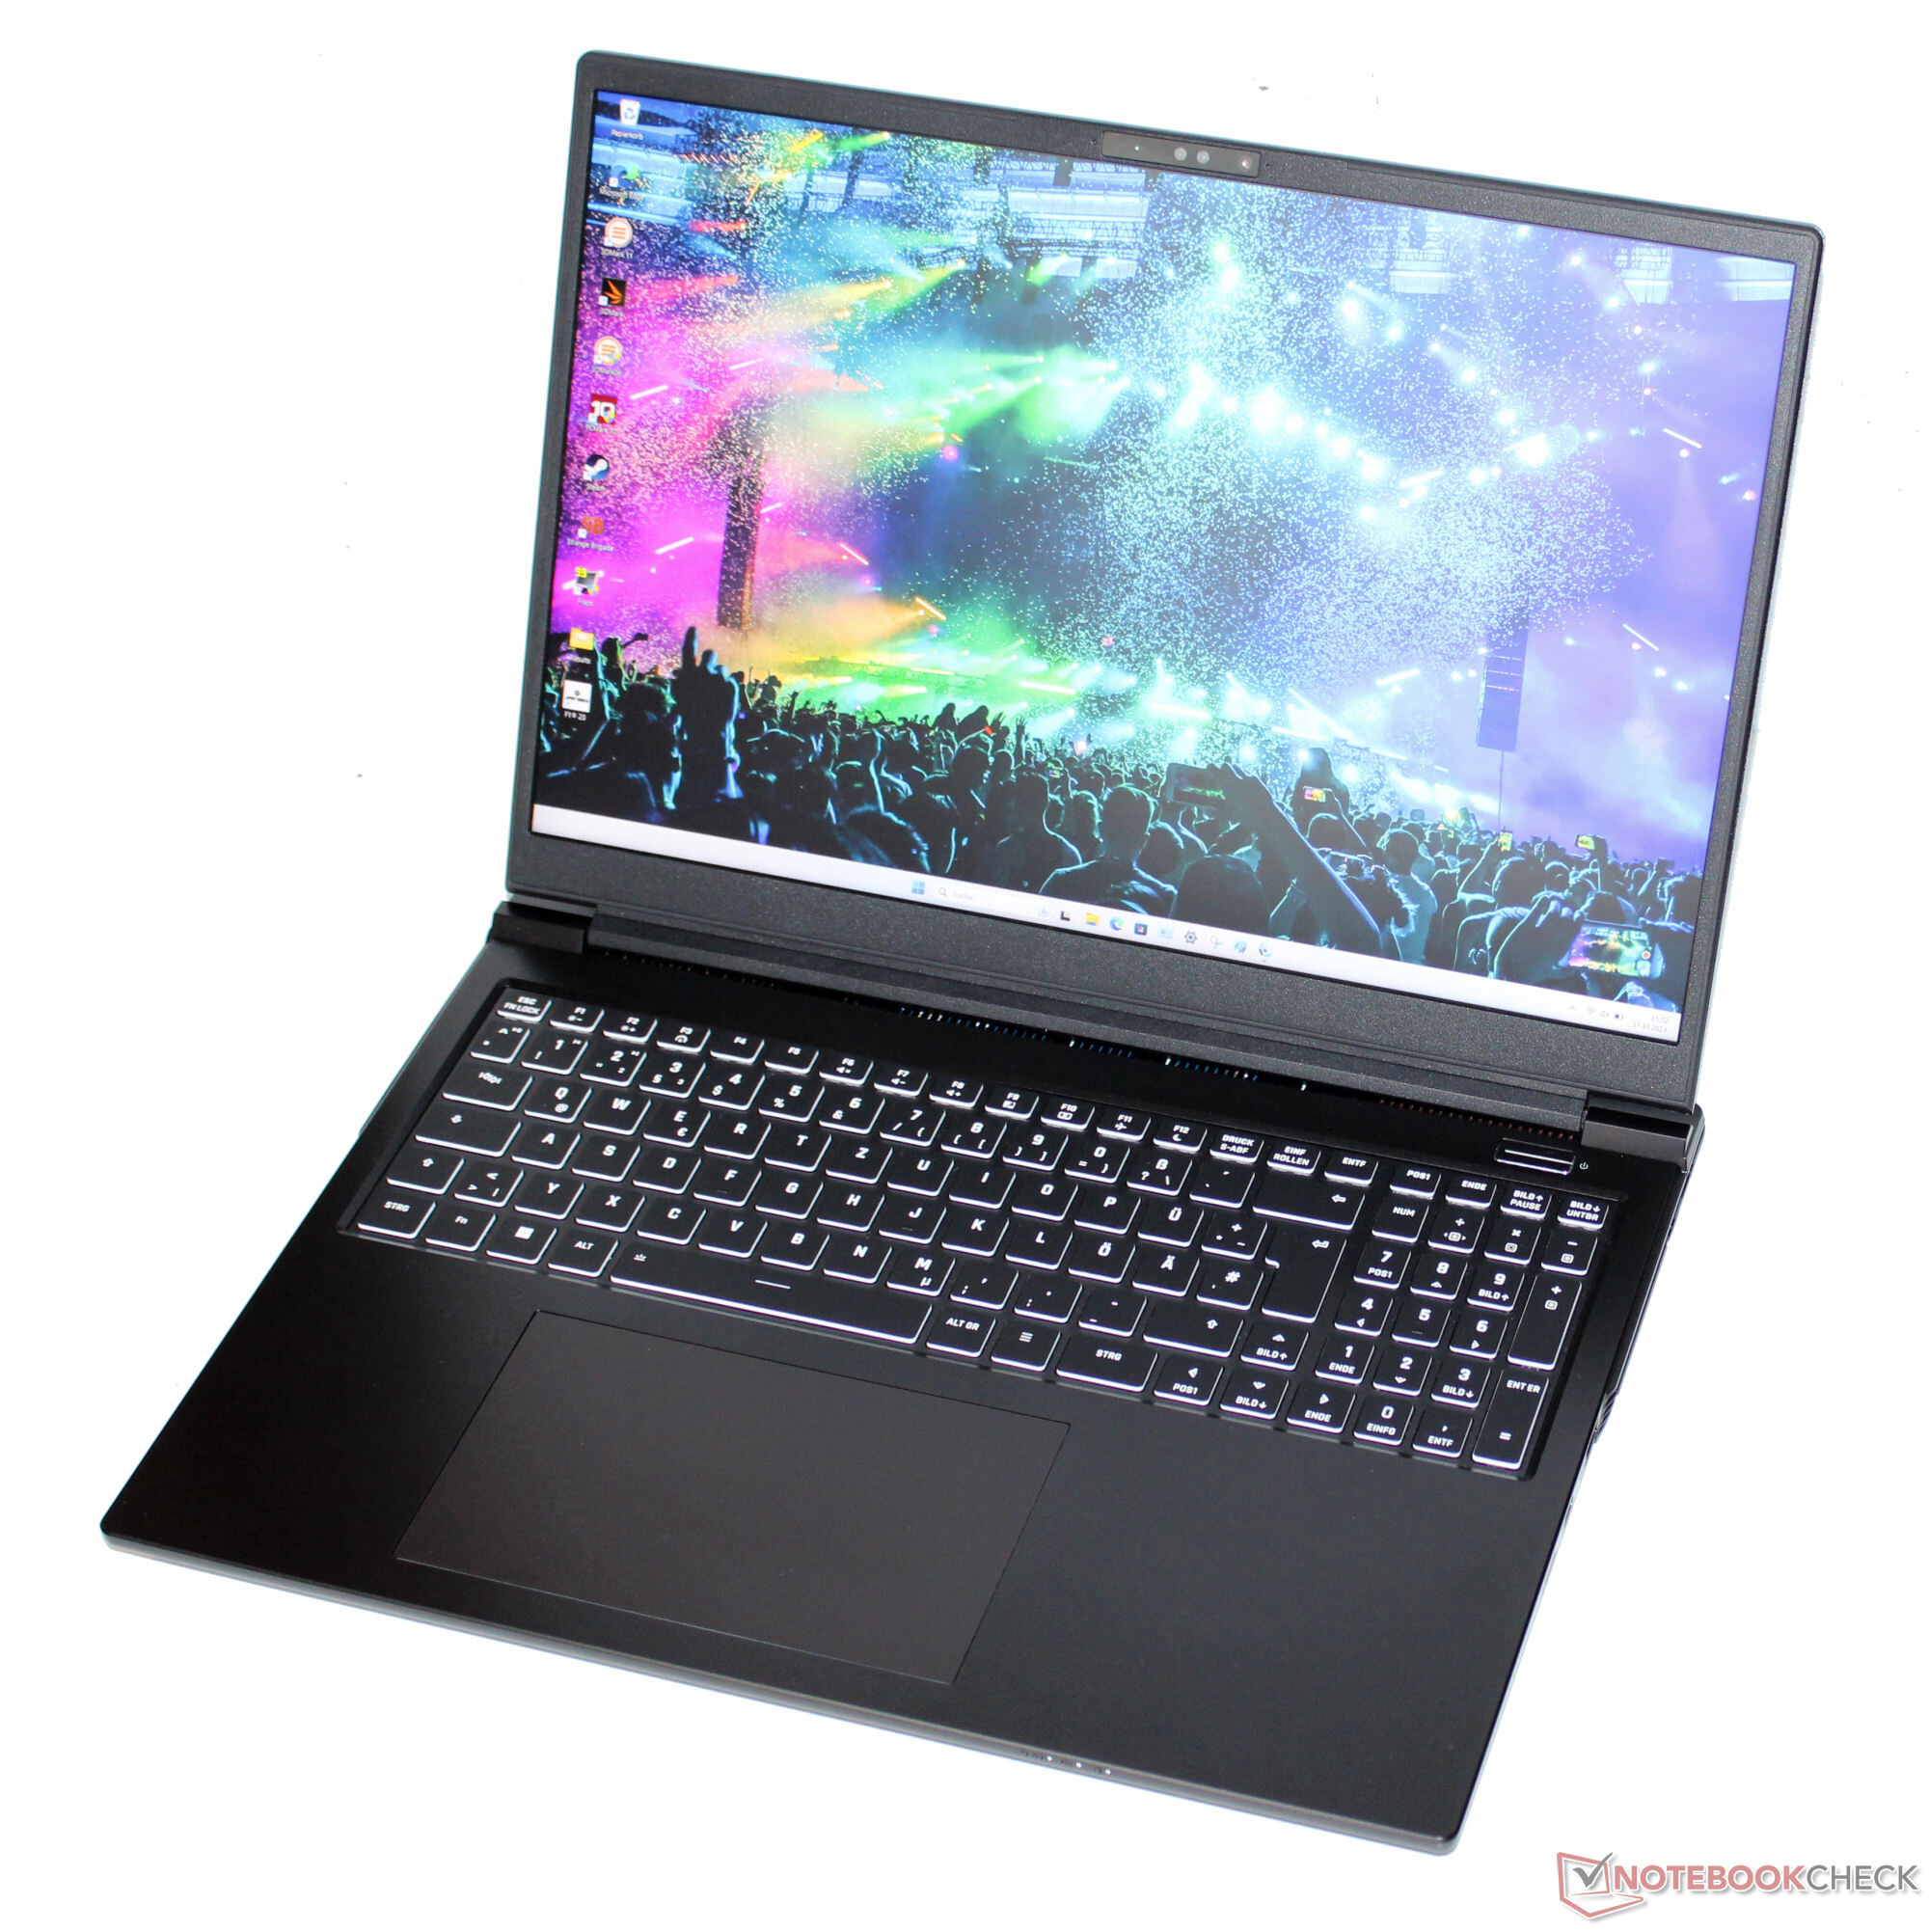
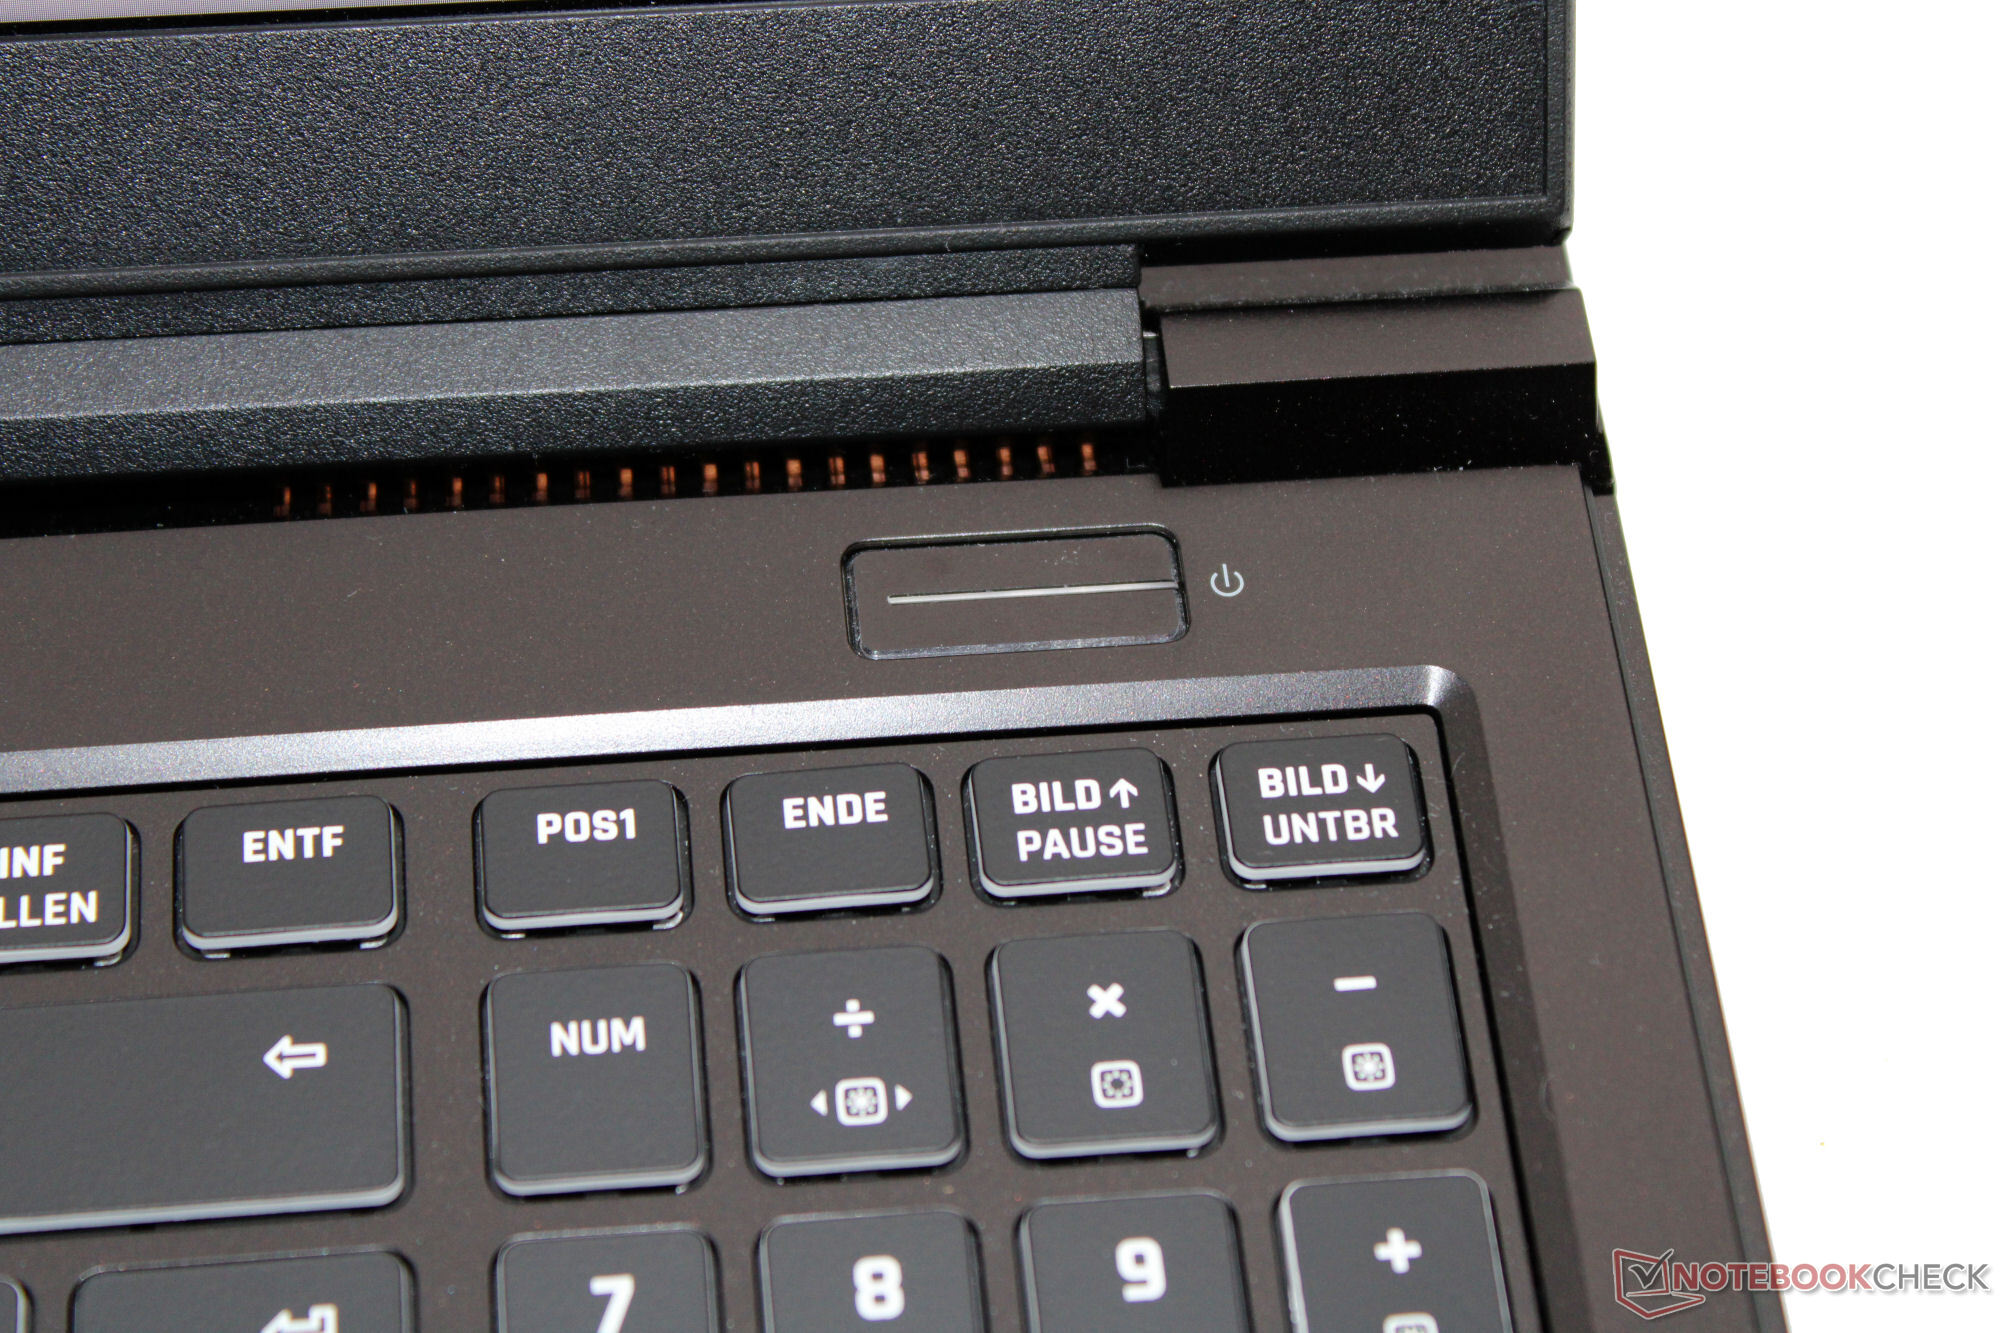
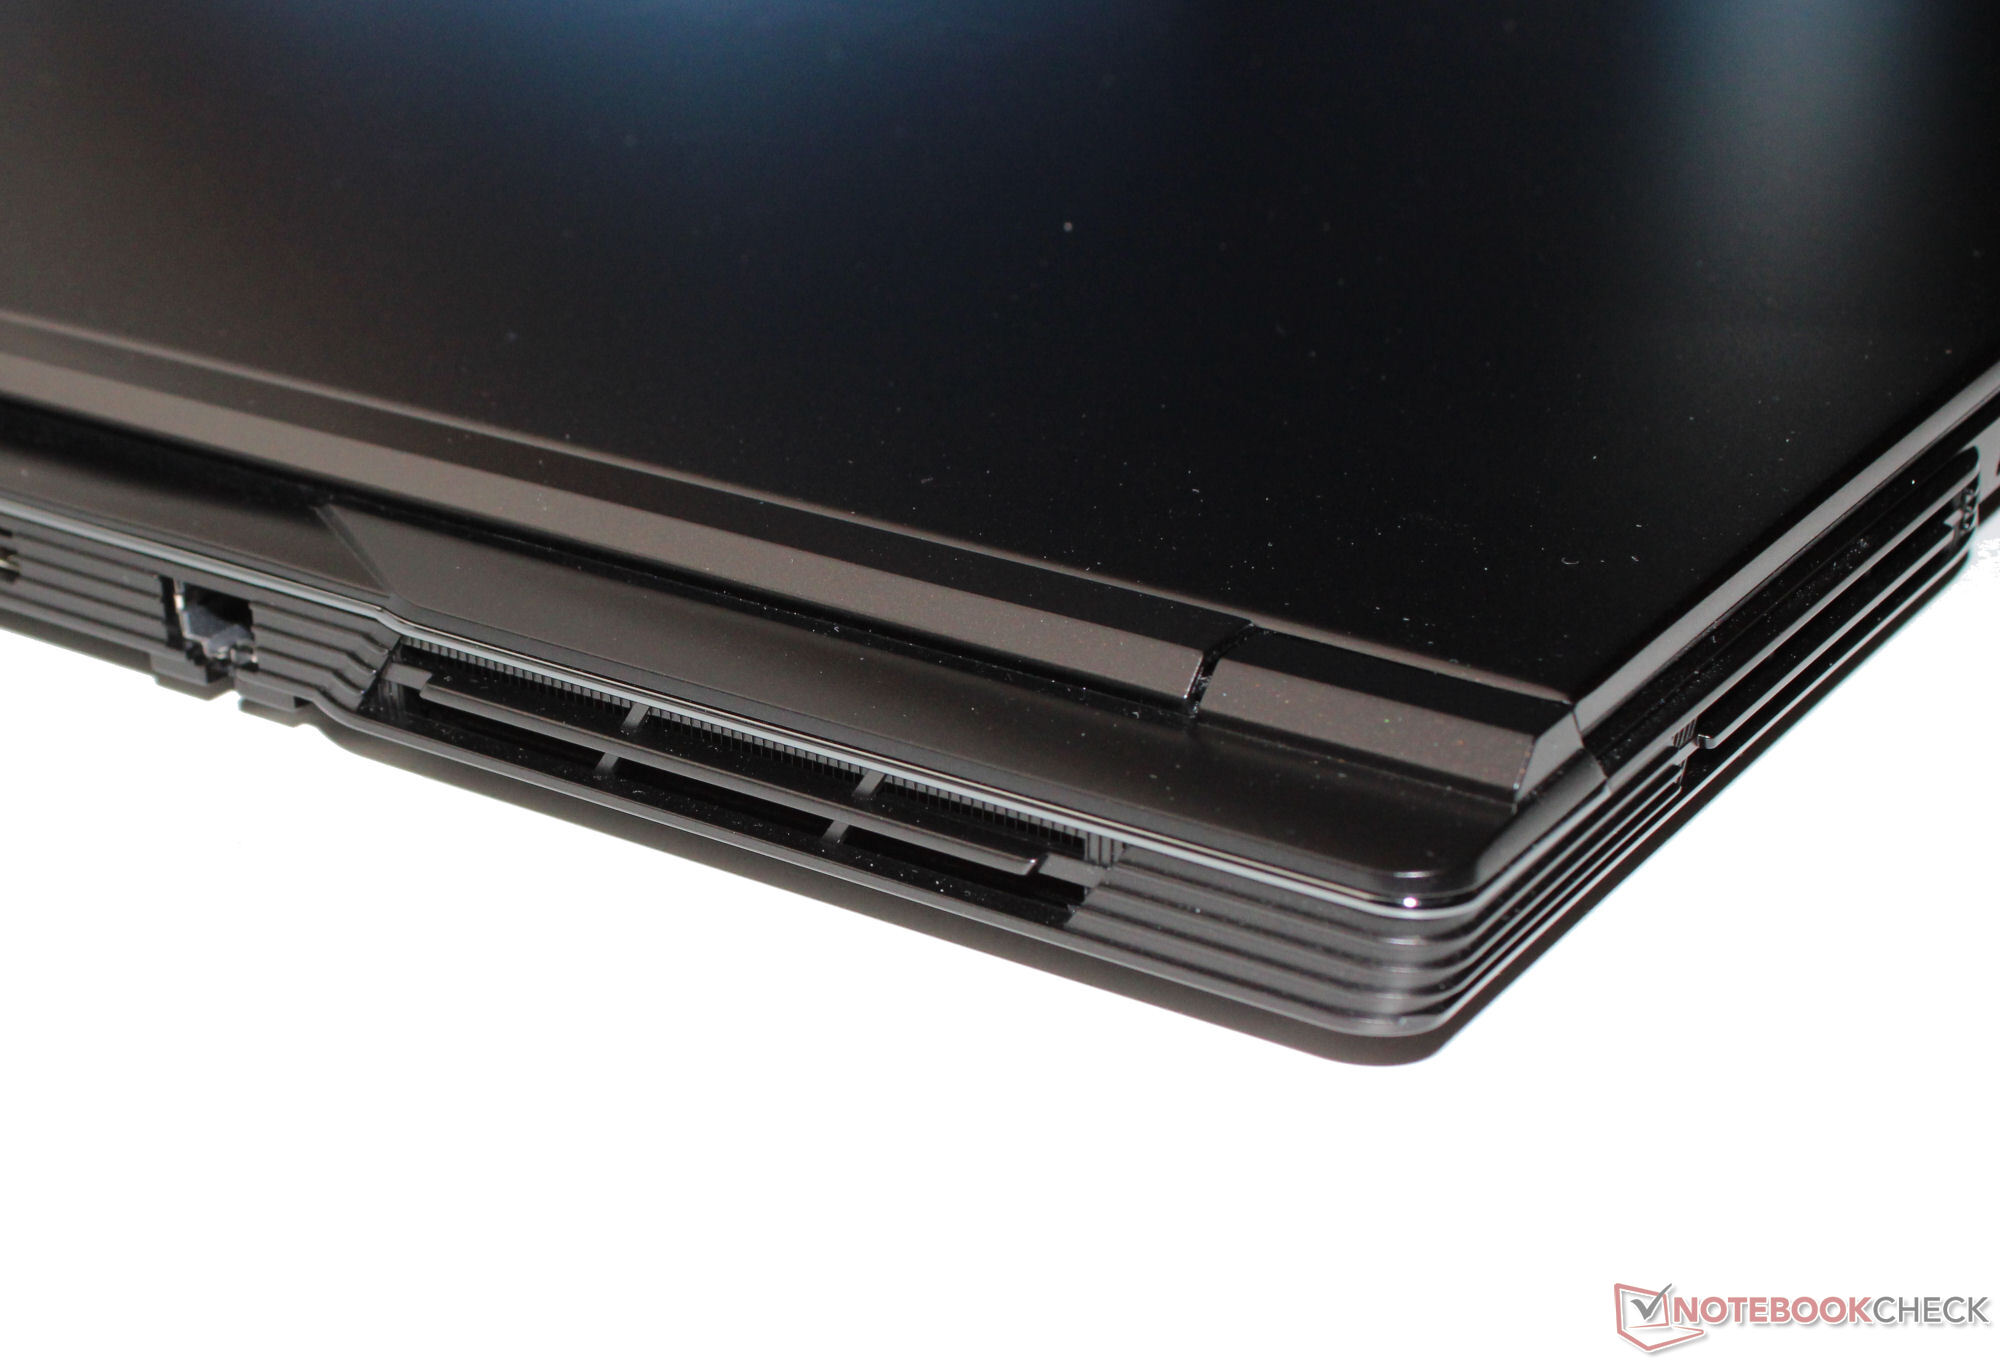
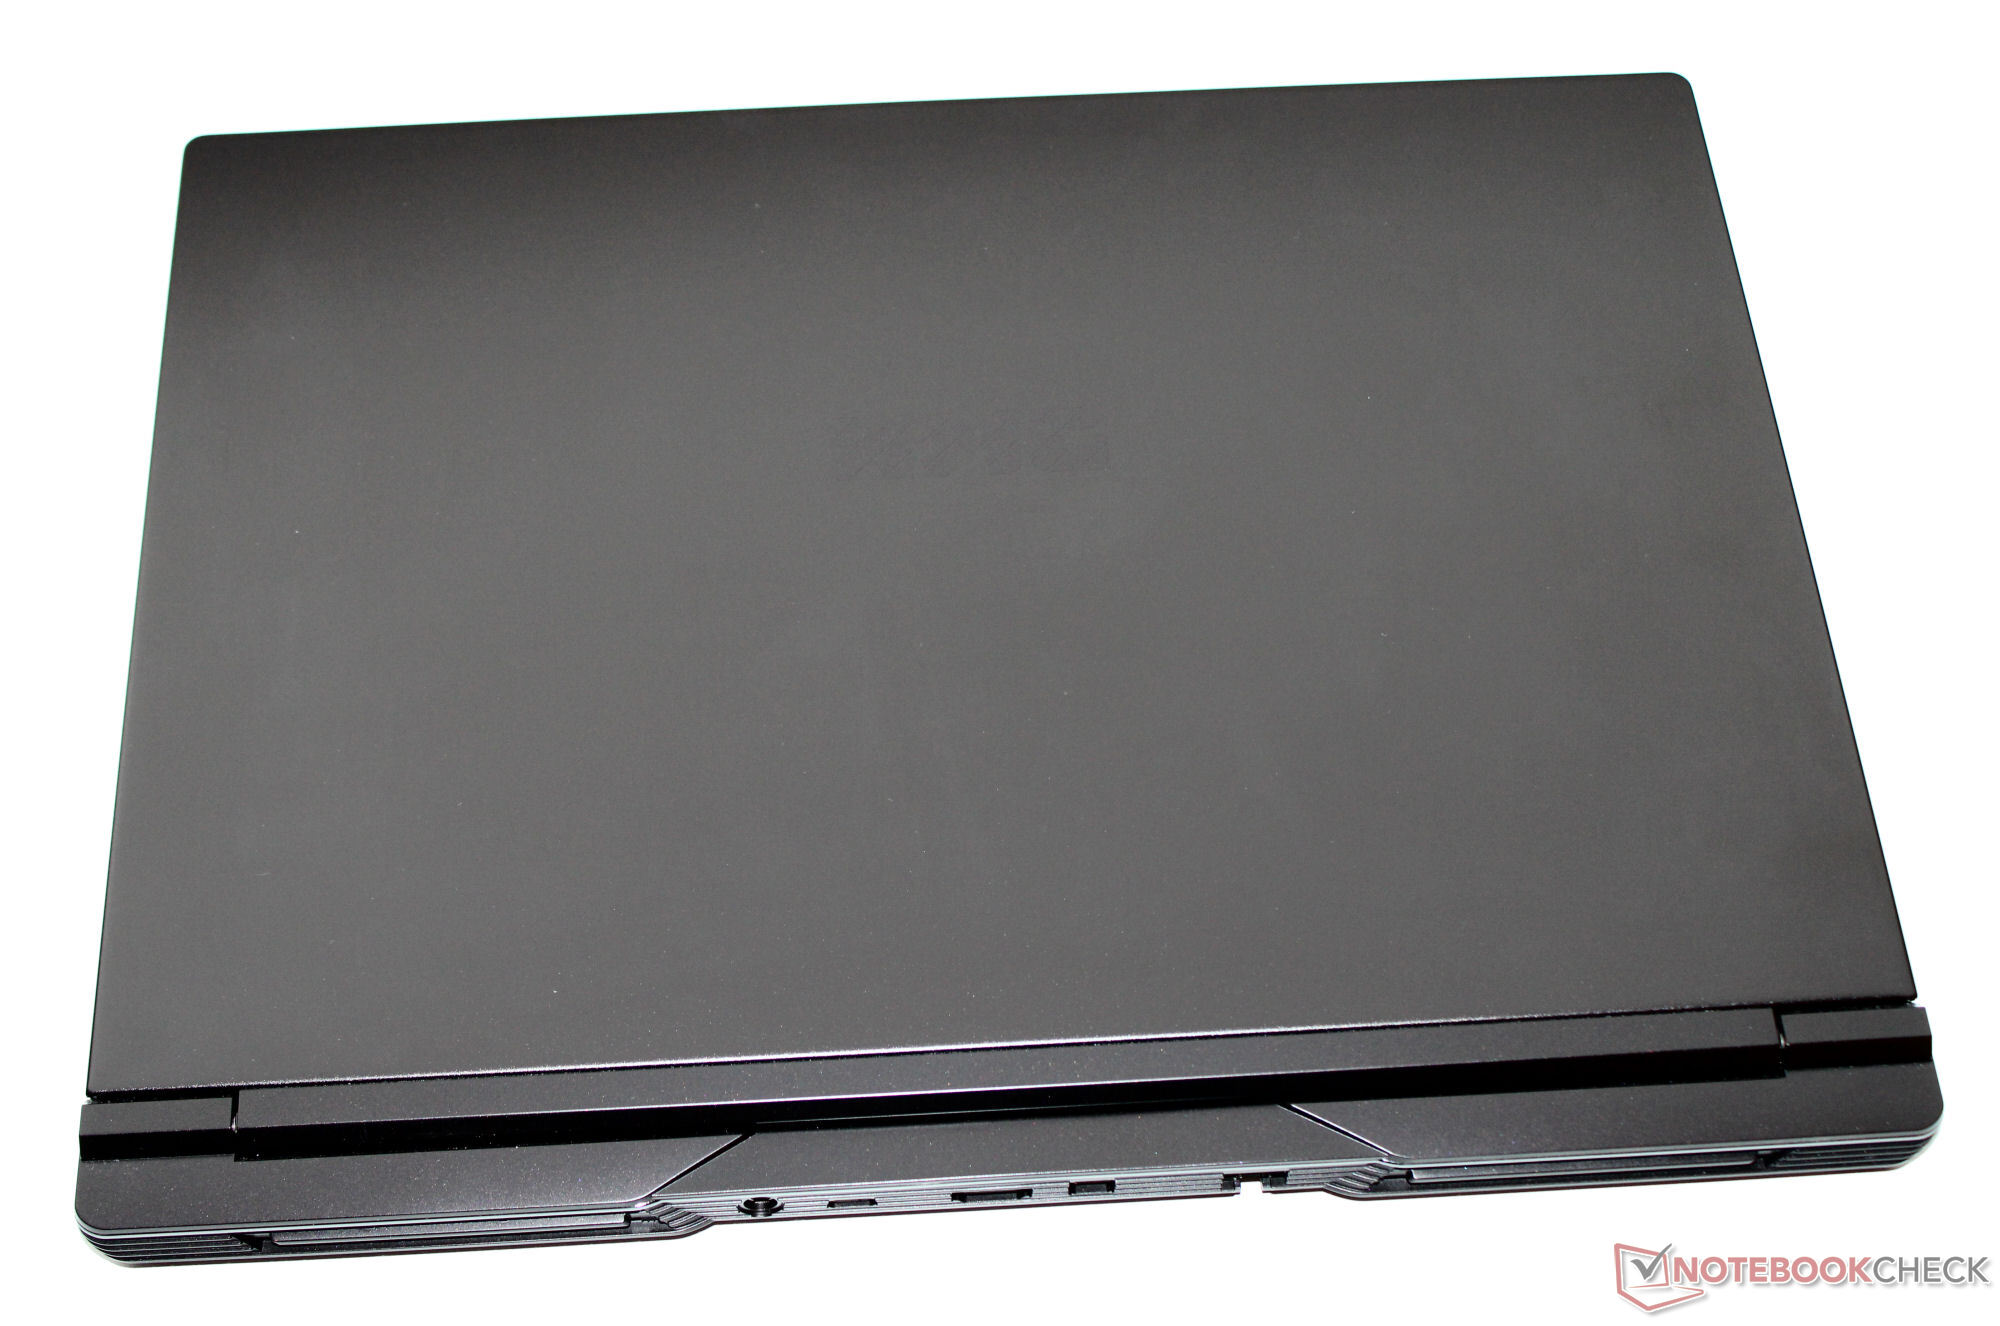
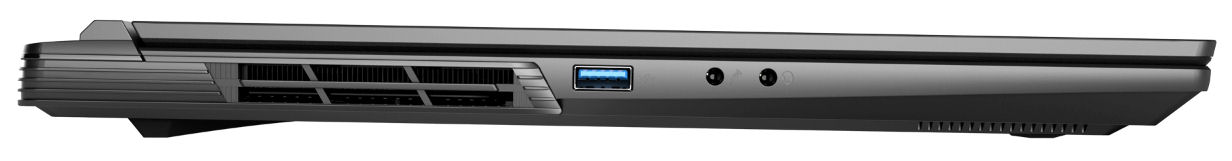
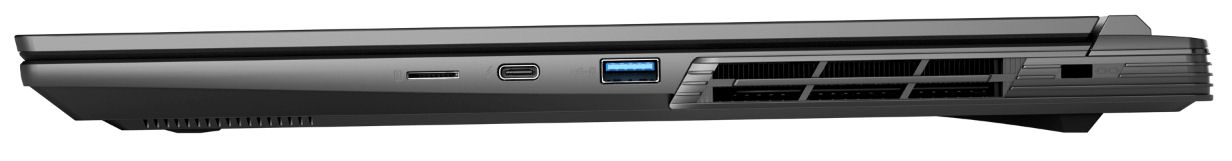
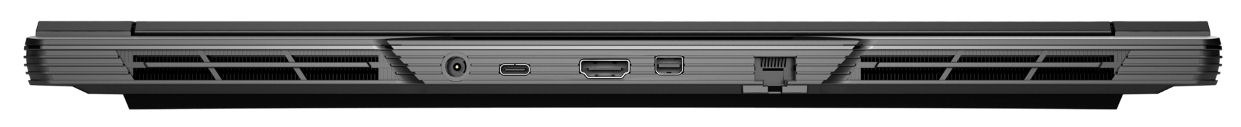
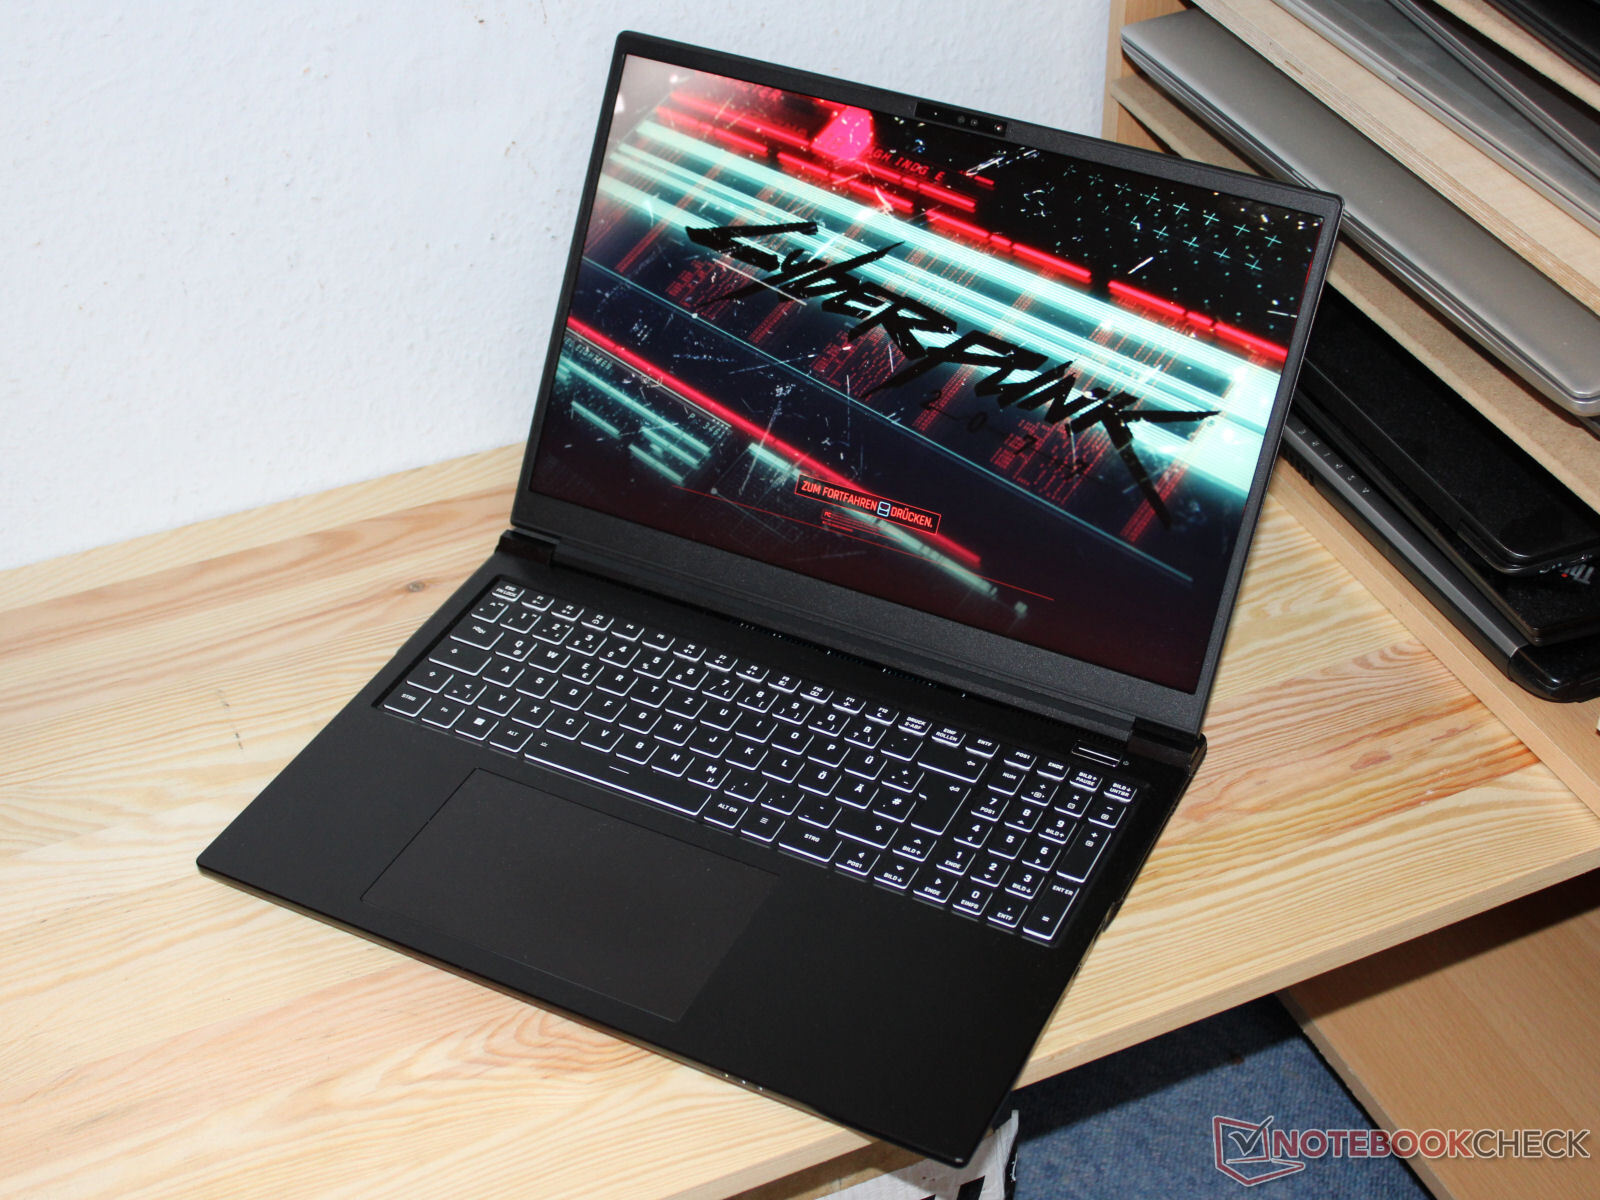
Hölje och anslutningsmöjligheter - Clevo barebone med Thunderbolt 4
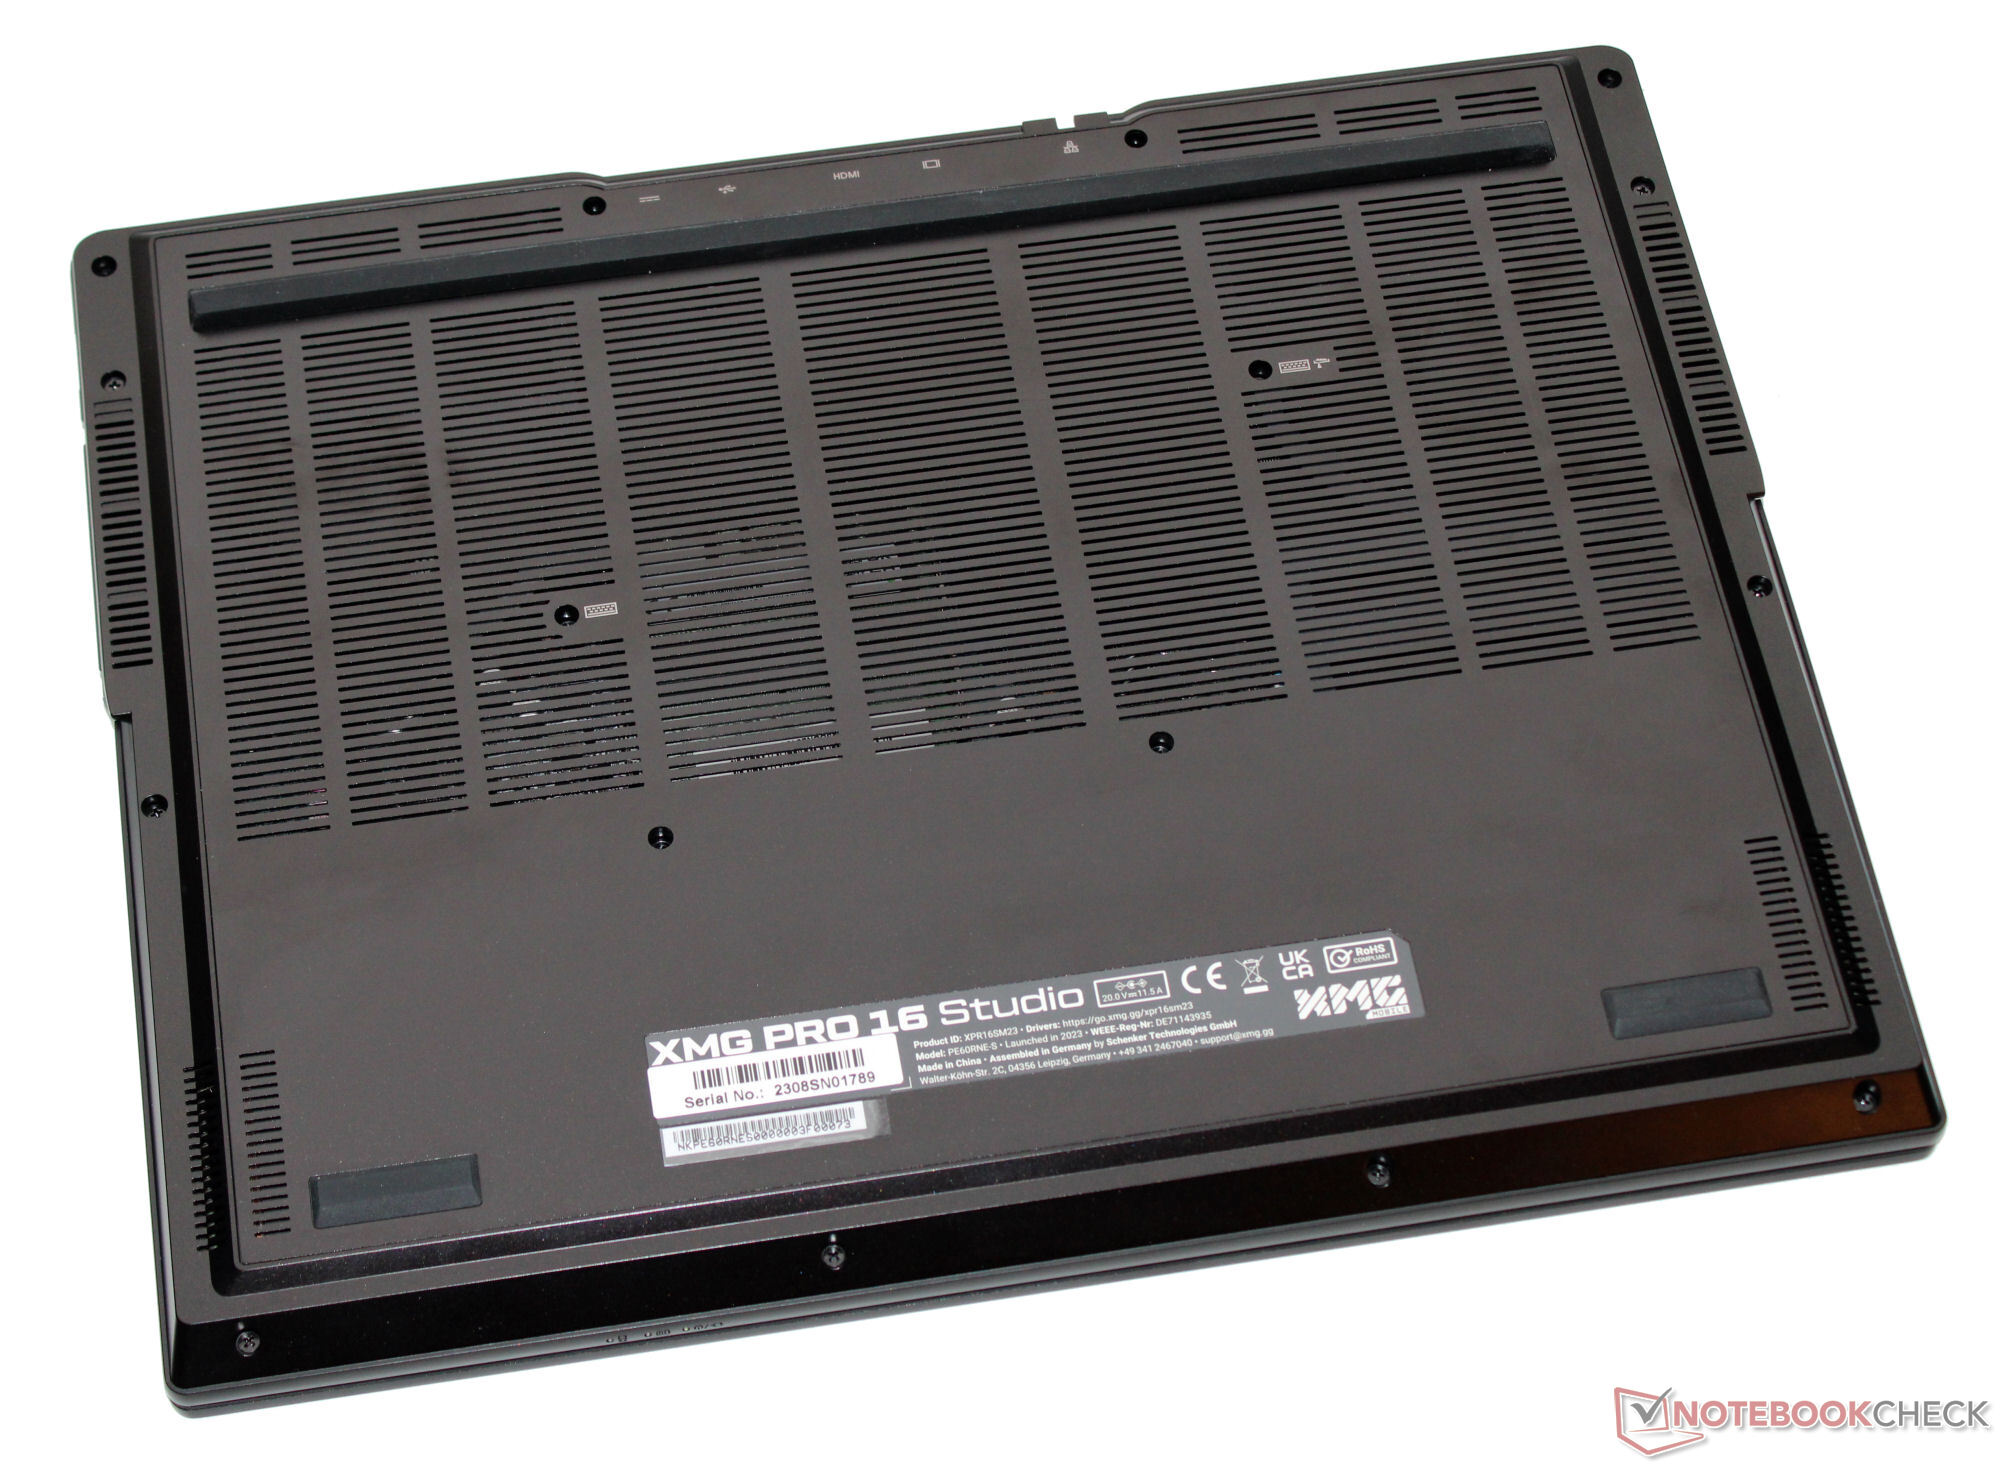
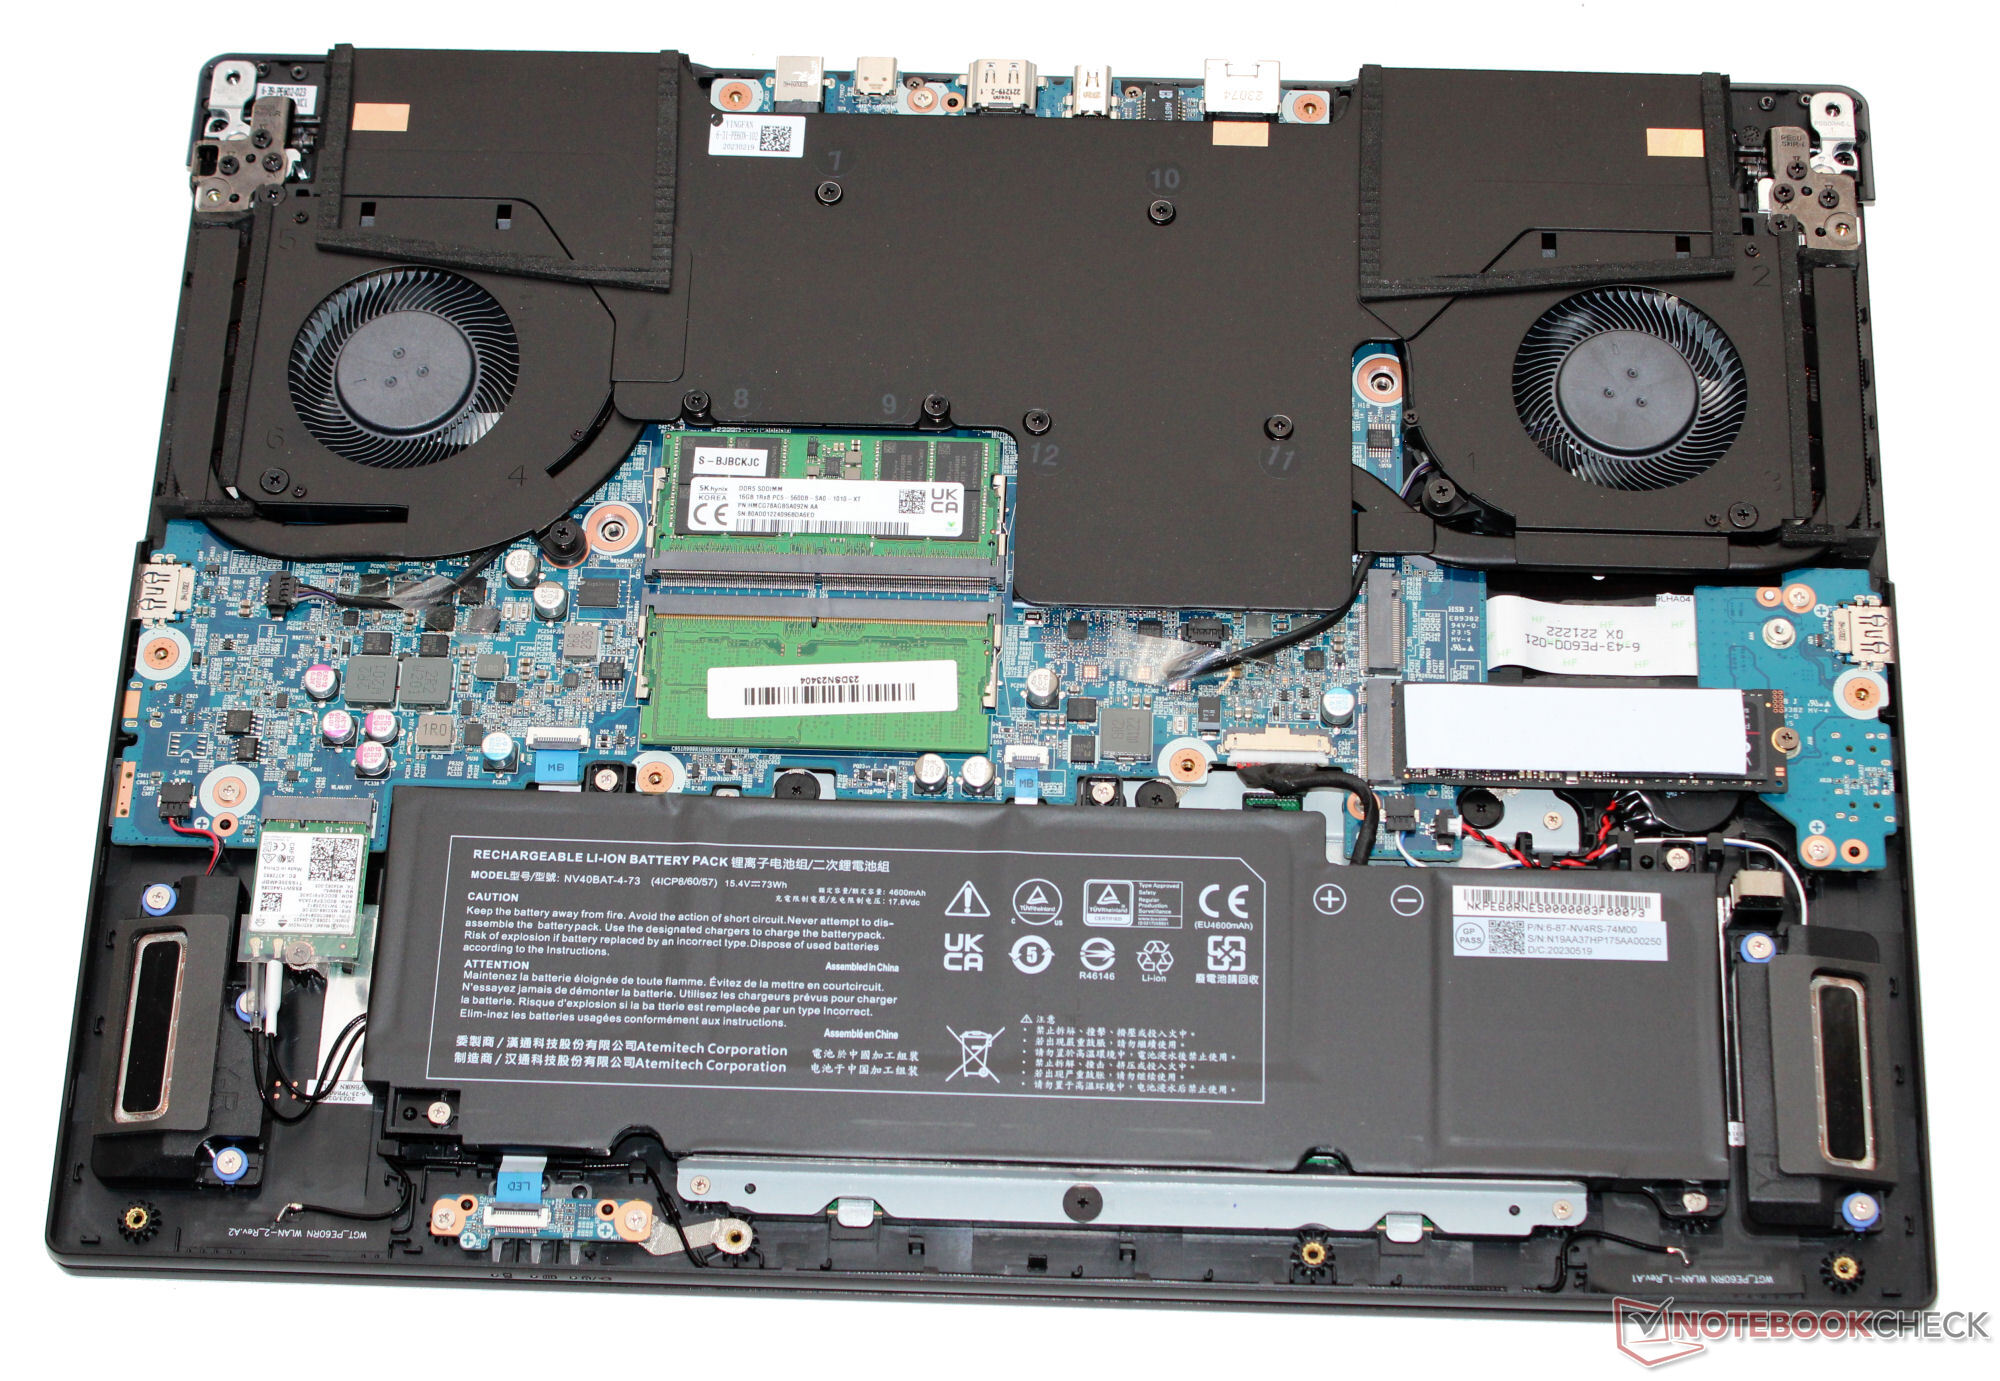
Det mattsvarta fodralets lock och botten är tillverkade av aluminium och resten är tillverkat av plast. Det subtilt designade fodralet är välbyggt. Basenheten och locket kan vridas en aning, men det är inget att oroa sig för. Batteriet (fastskruvat, inte fastlimmat) och resten av datorns insida är åtkomliga när du tar bort bottenplattan.
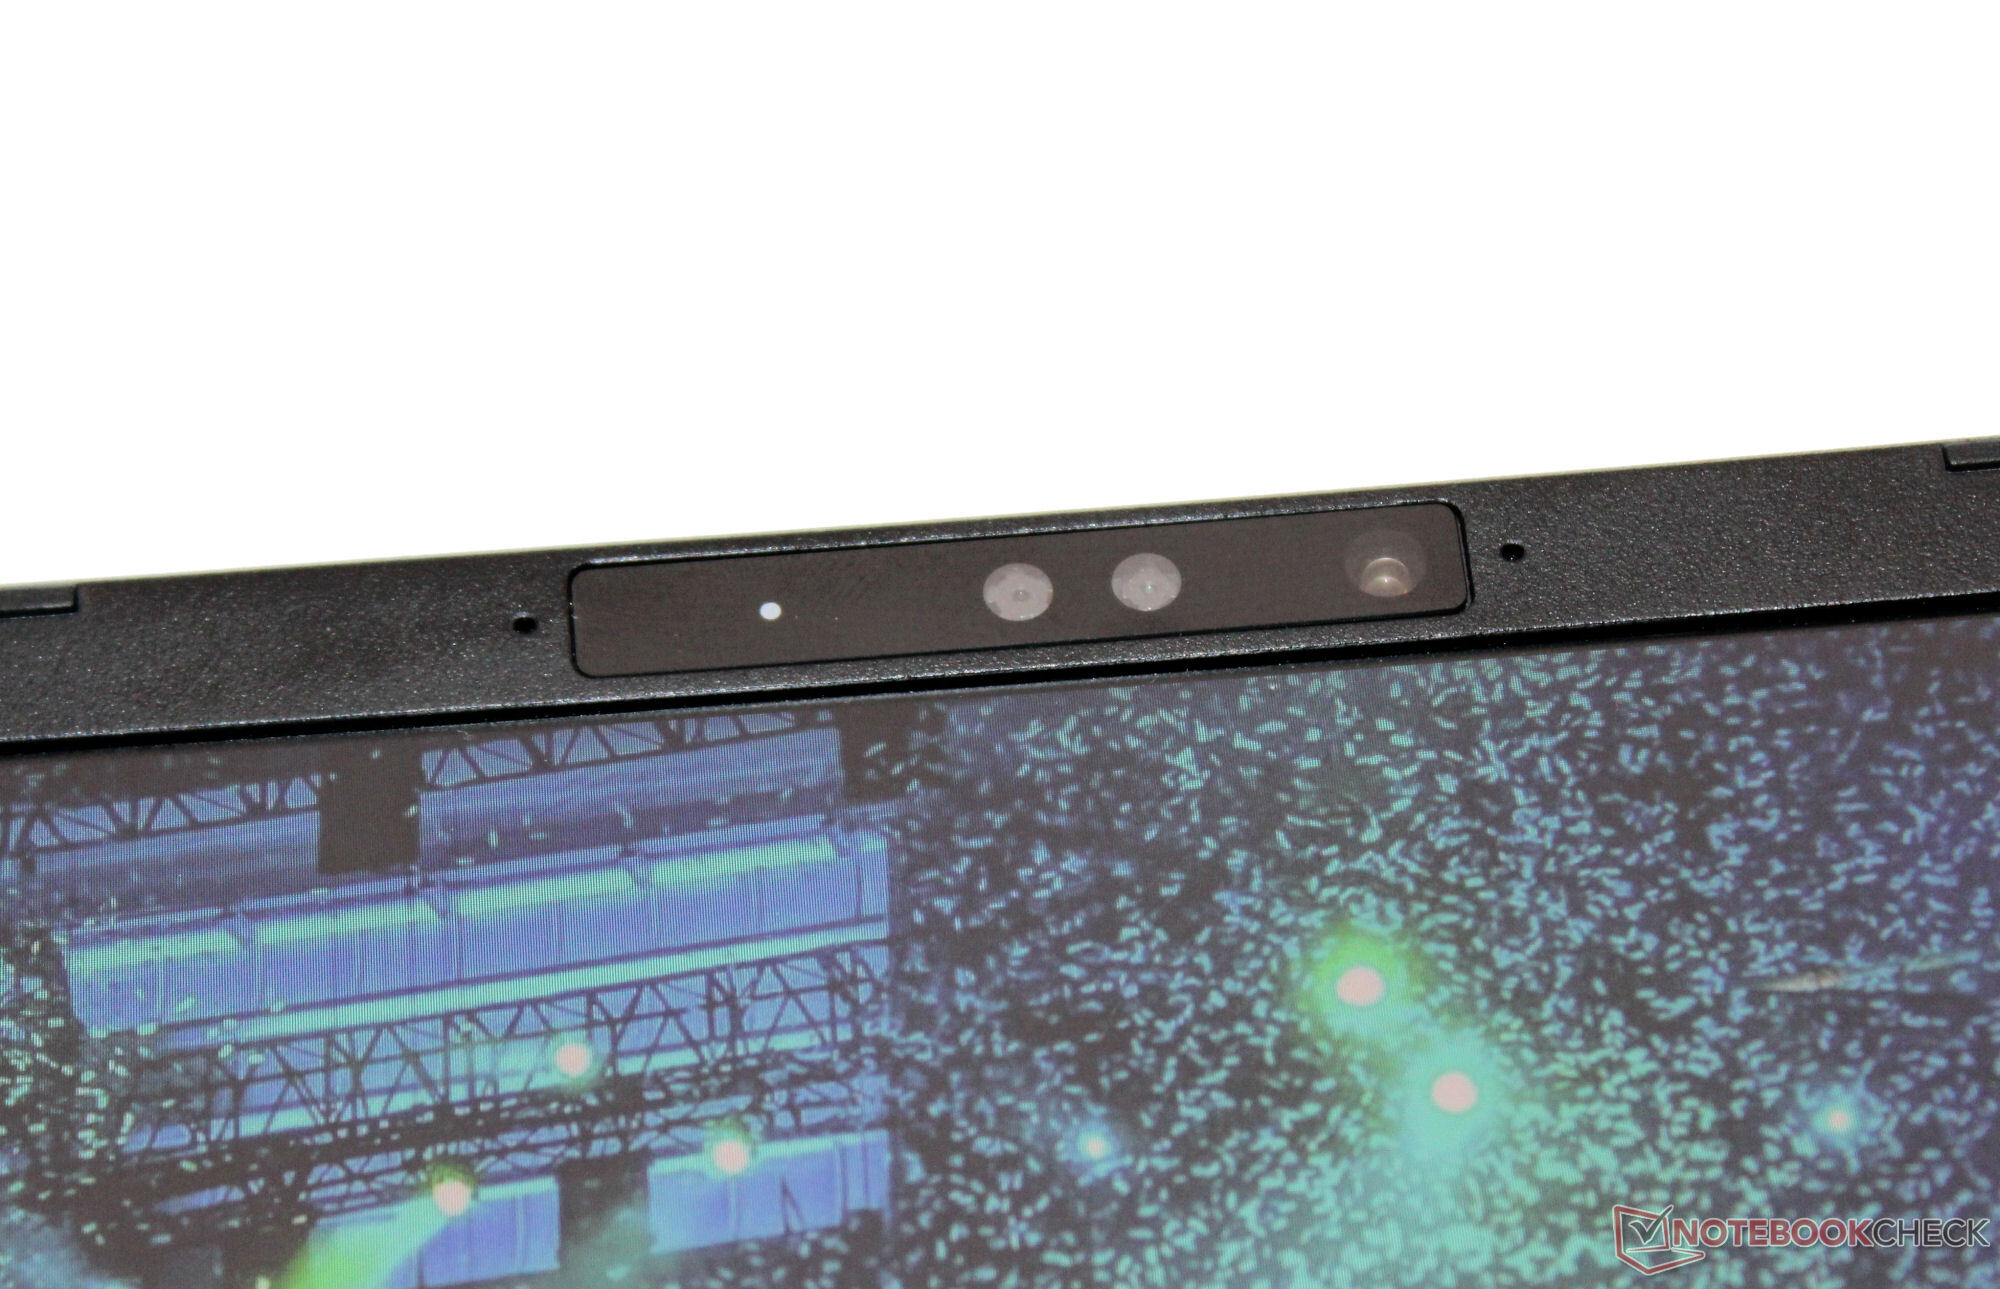
Pro har två USB-A-portar (USB 3.2 Gen 1) och två USB-C-portar (1x USB 3.2 Gen 2, 1x Thunderbolt 4). TB-4-porten har stöd för Power Delivery och kan mata ut en DisplayPort-signal. Totalt har den bärbara datorn tre videoutgångar (1x HDMI, 2x DP). Dess MicroSD-kortläsare (referenskort: AV PRO microSD 128 GB V60) kan klassas som en med medelhastighet. Webbkameran (2,1 MP, max. 1.920 x 1.080 pixlar, inget skydd) är ganska standard.
Under optimala förhållanden (inga WiFi-enheter i närheten, kort avstånd mellan den bärbara datorn och serverdatorn) uppnår den utmärkta WiFi-datahastigheter. Den bärbara datorn använder ett WiFi 6E-chip (Intel AX211), och trådbundna anslutningar hanteras av en Realtek RTL8125-styrenhet (2,5 GBit/s).
| SD Card Reader | |
| average JPG Copy Test (av. of 3 runs) | |
| MSI Stealth 16 Studio A13VG | |
| Genomsnitt av klass Gaming (20.9 - 210, n=55, senaste 2 åren) | |
| Asus Vivobook Pro 16X K6604JV-MX016W | |
| Schenker XMG Pro 16 Studio (Mid 23) (AV PRO microSD 128 GB V60) | |
| Lenovo Legion Slim 7i 16 Gen 8 (Toshiba Exceria Pro SDXC 64 GB UHS-II) | |
| maximum AS SSD Seq Read Test (1GB) | |
| MSI Stealth 16 Studio A13VG | |
| Genomsnitt av klass Gaming (25.5 - 261, n=52, senaste 2 åren) | |
| Asus Vivobook Pro 16X K6604JV-MX016W | |
| Schenker XMG Pro 16 Studio (Mid 23) (AV PRO microSD 128 GB V60) | |
| Lenovo Legion Slim 7i 16 Gen 8 (Toshiba Exceria Pro SDXC 64 GB UHS-II) | |

 GeForce RTX 4070 Laptop GPU, i9-13900H, Samsung 990 Pro 1 TB")
 GeForce RTX 4070 Laptop GPU, i9-13900H, Samsung 990 Pro 1 TB")
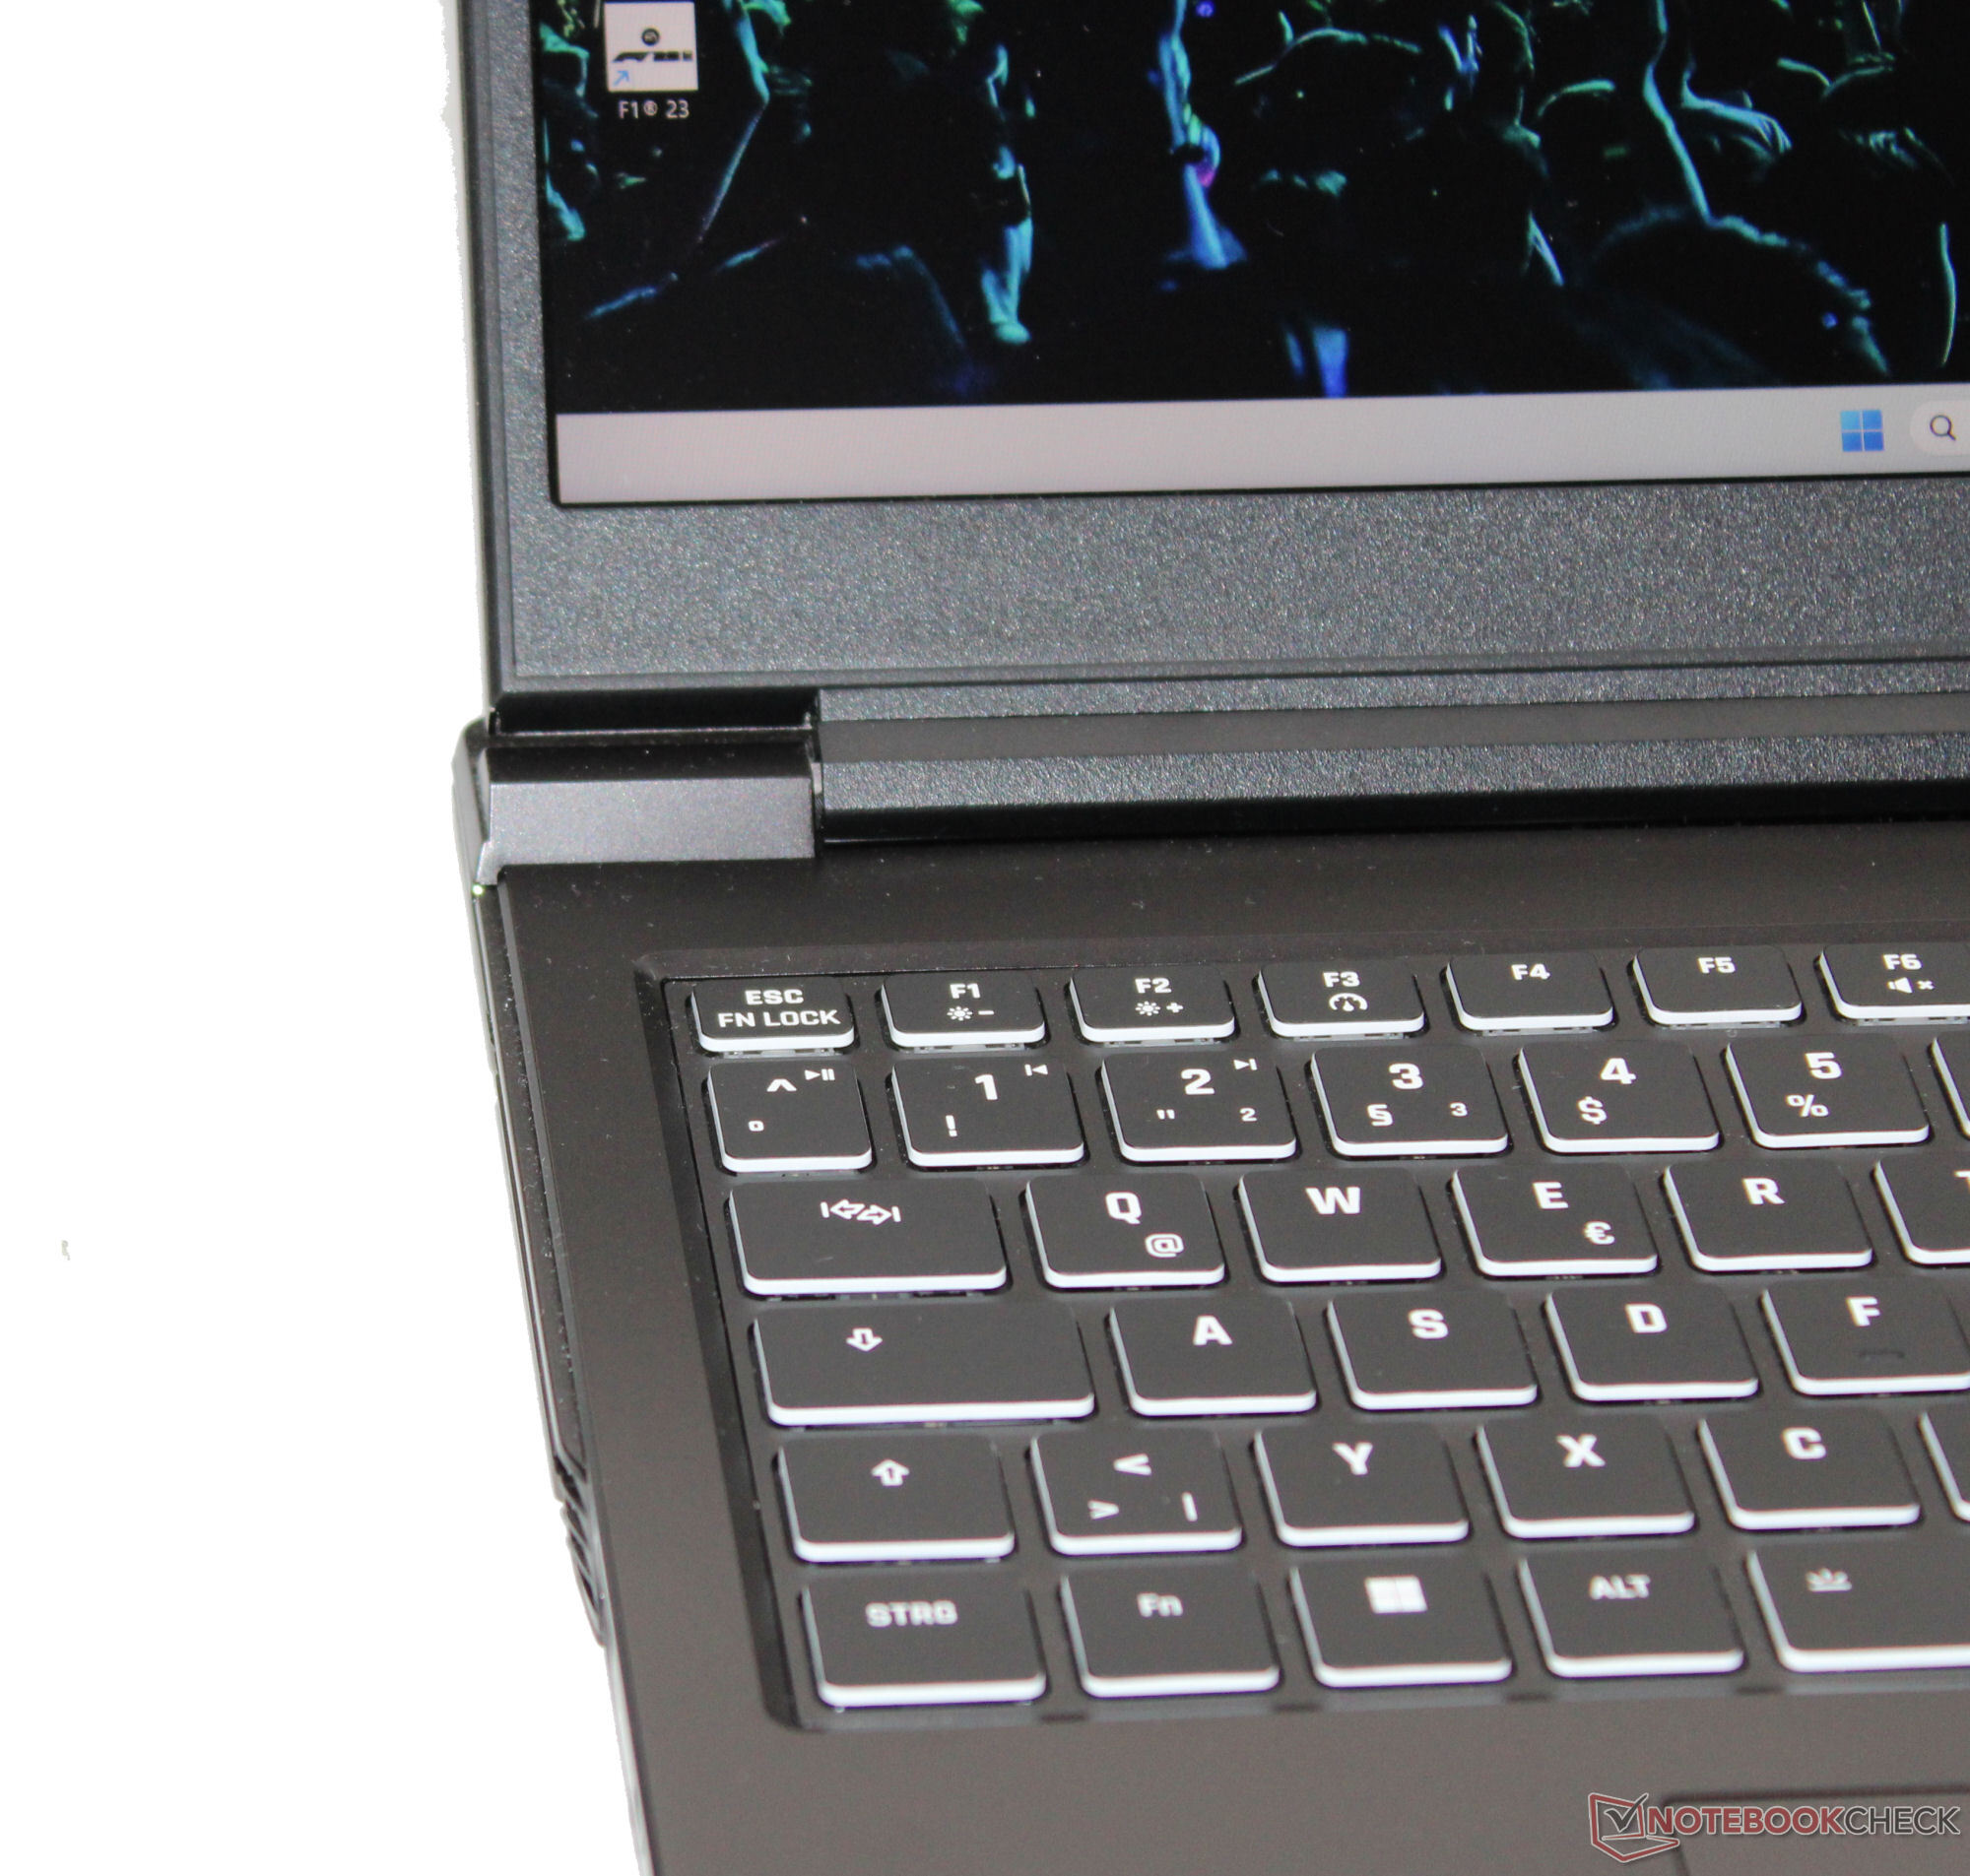
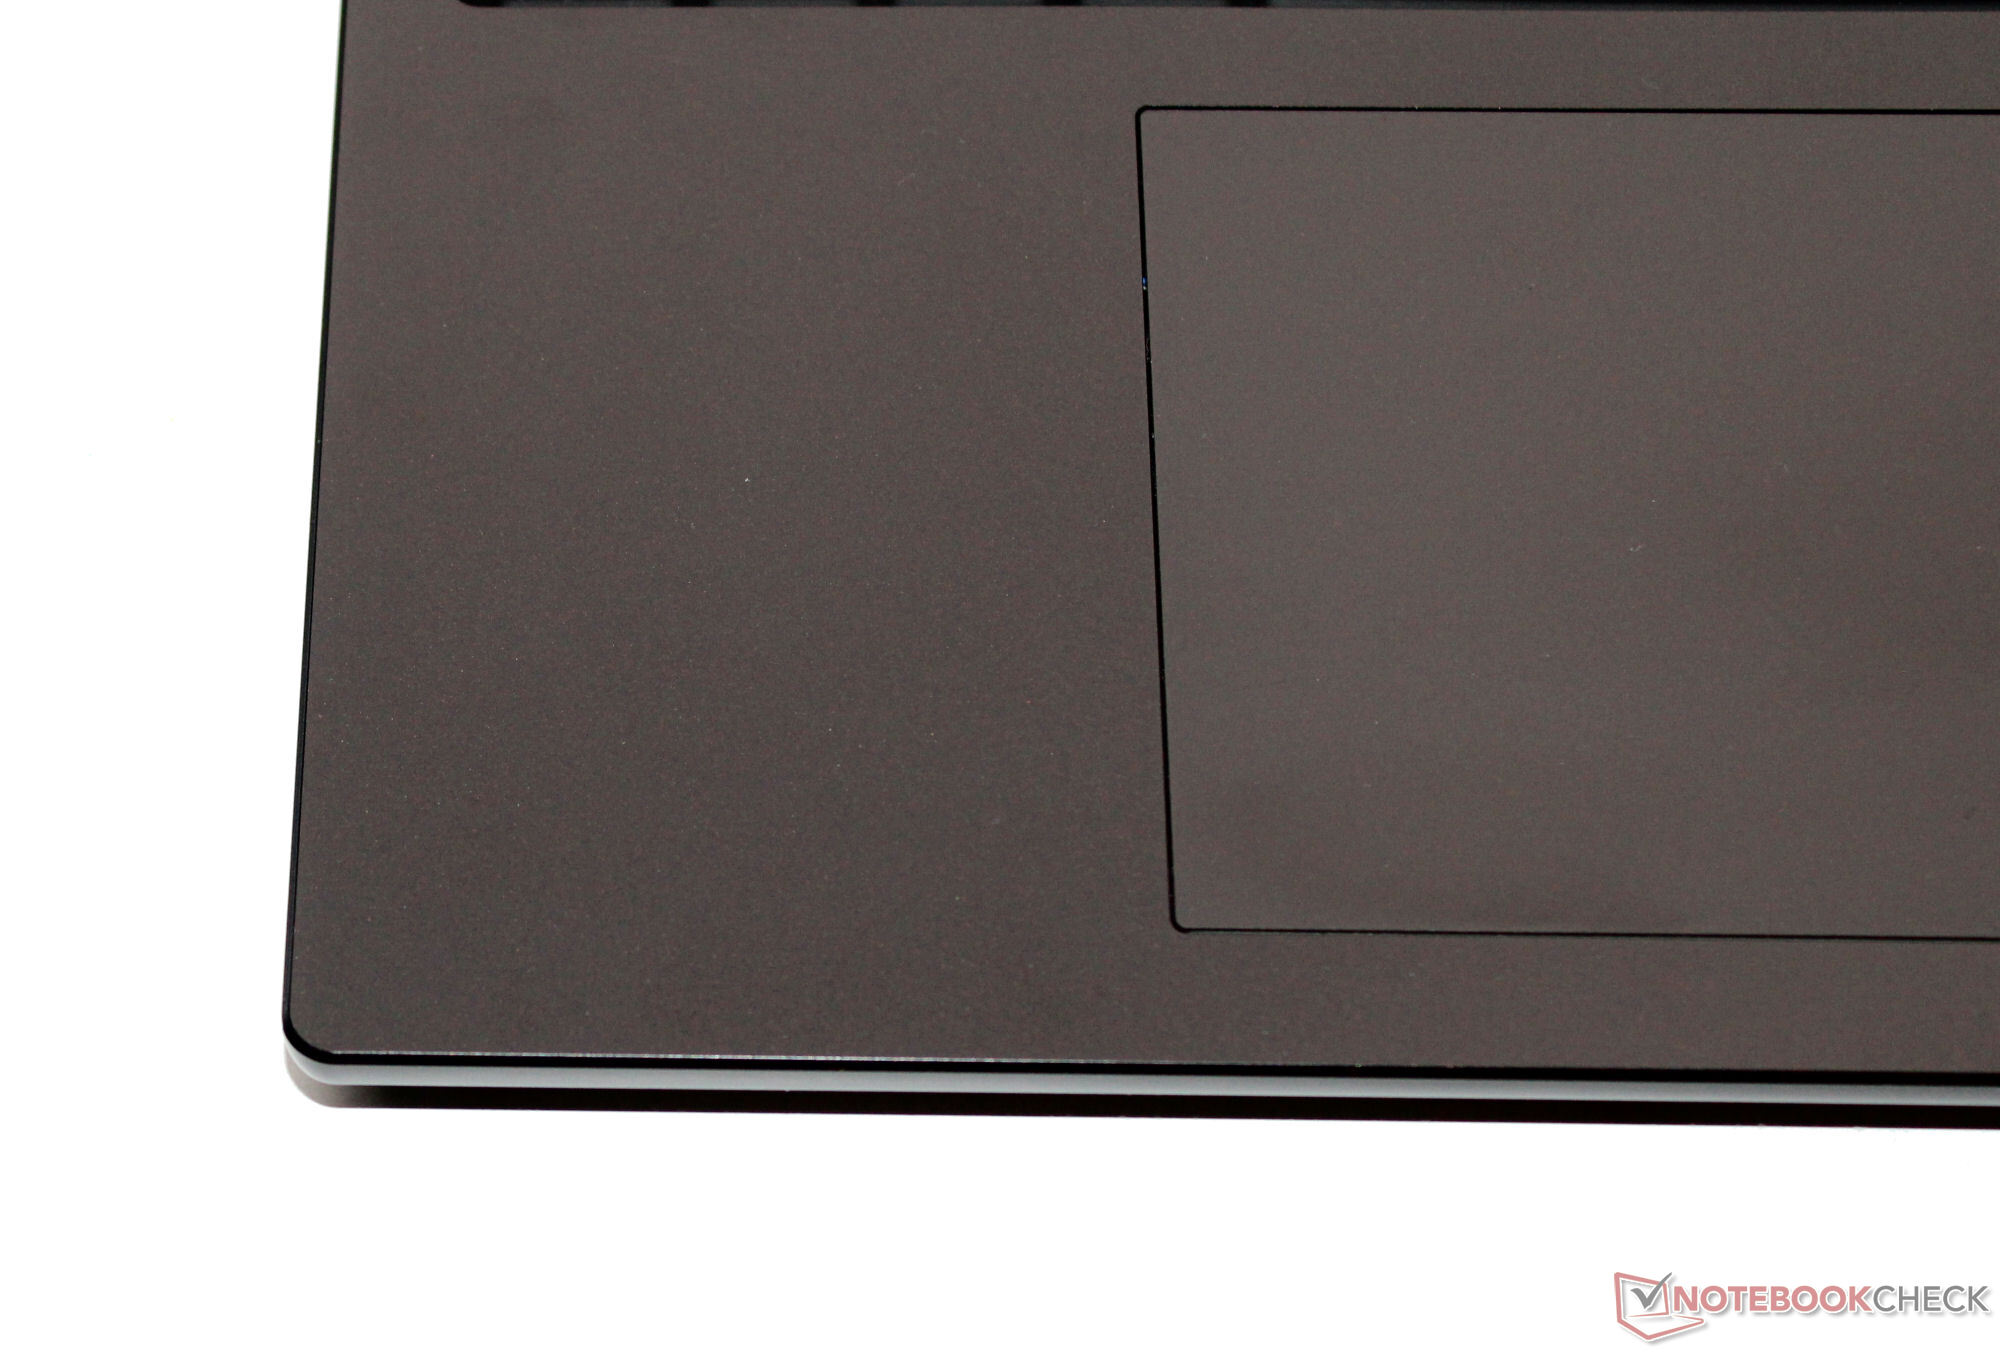
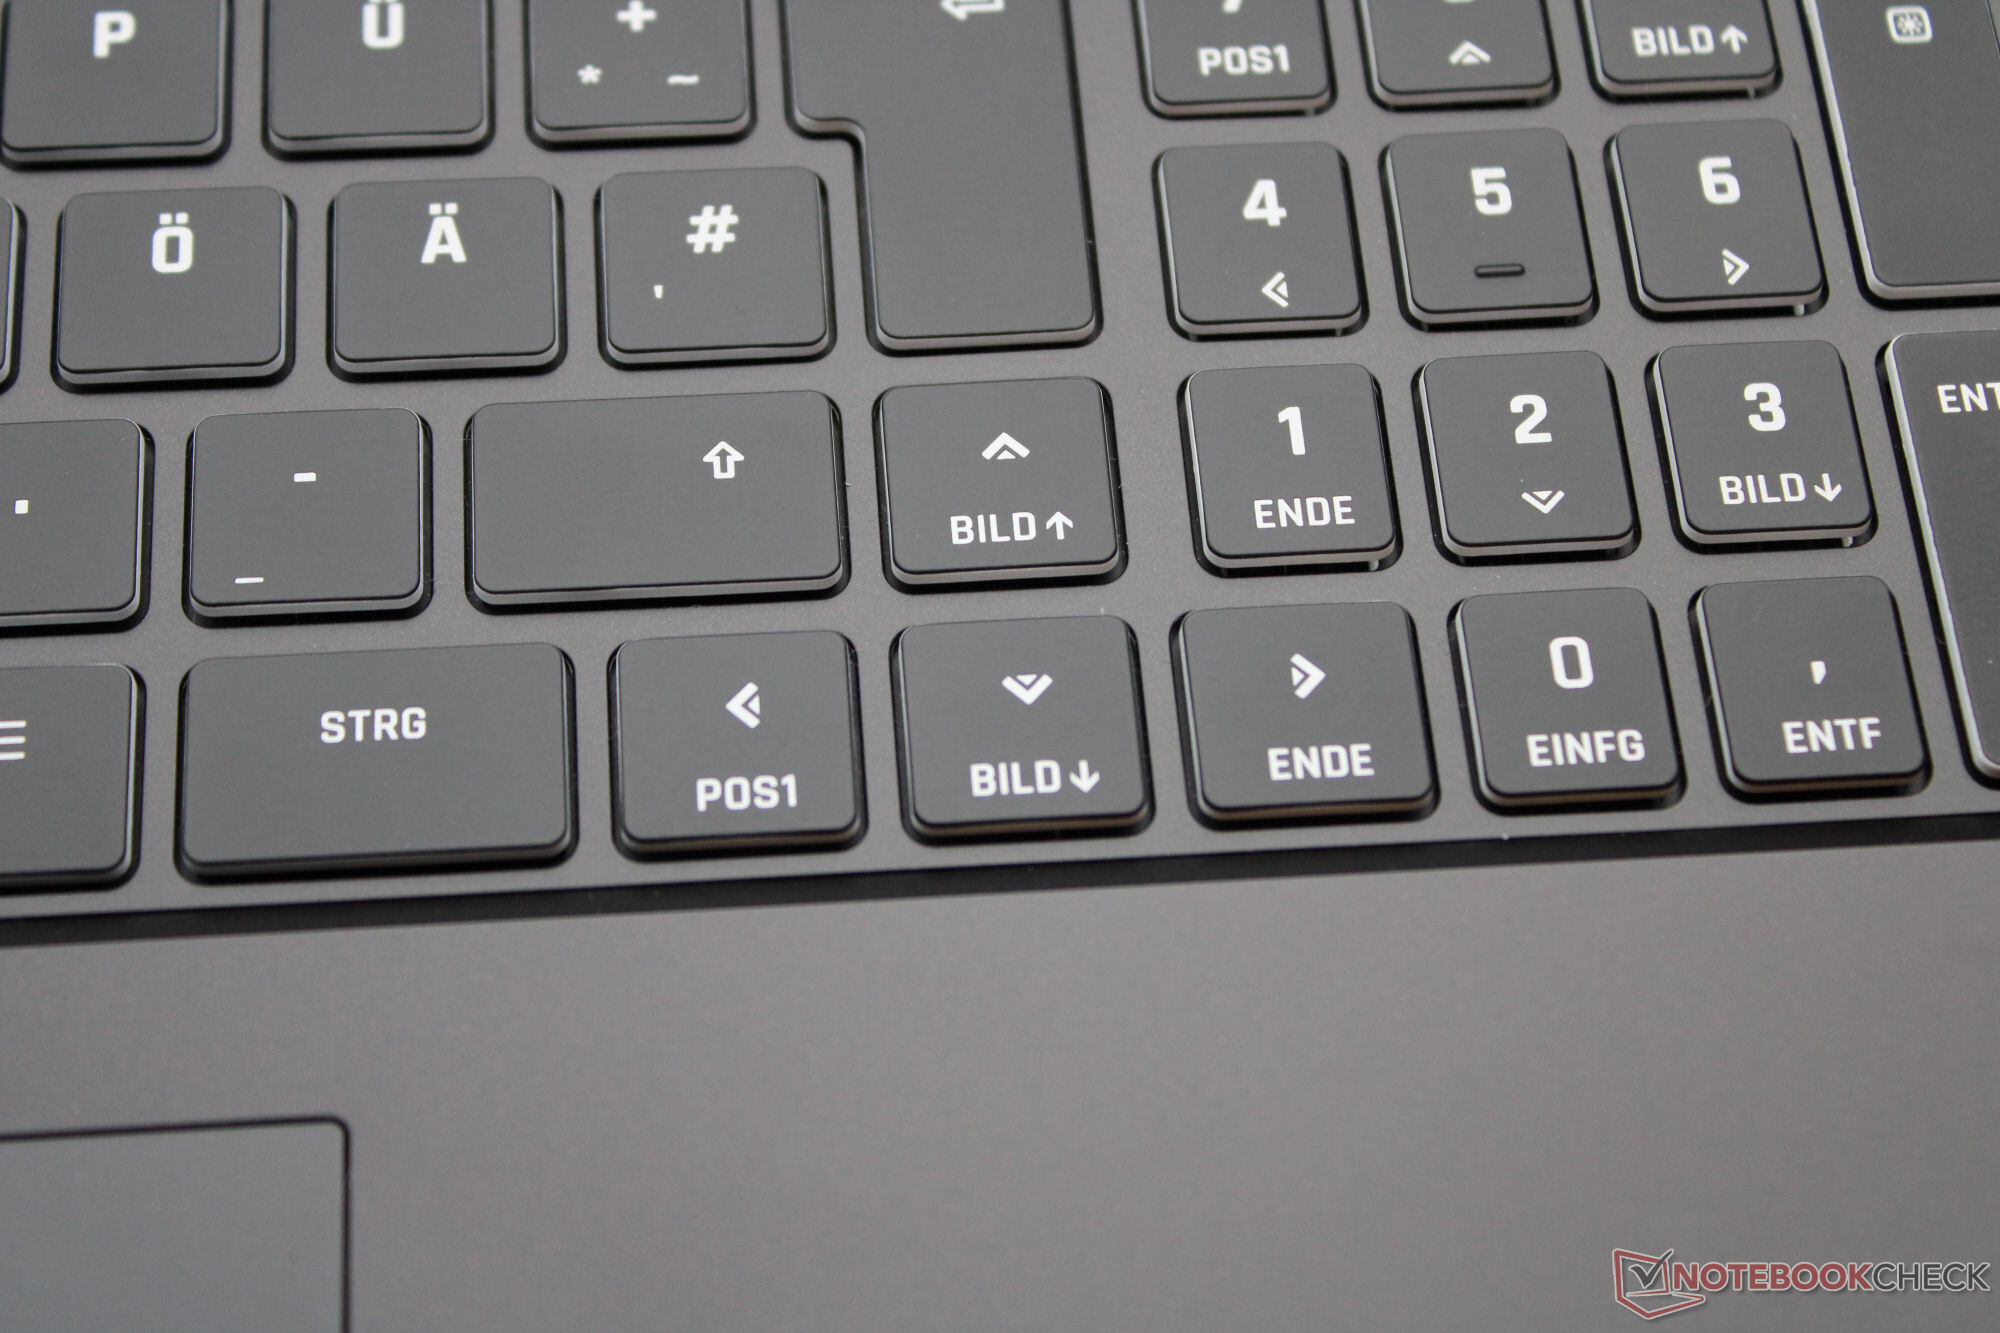
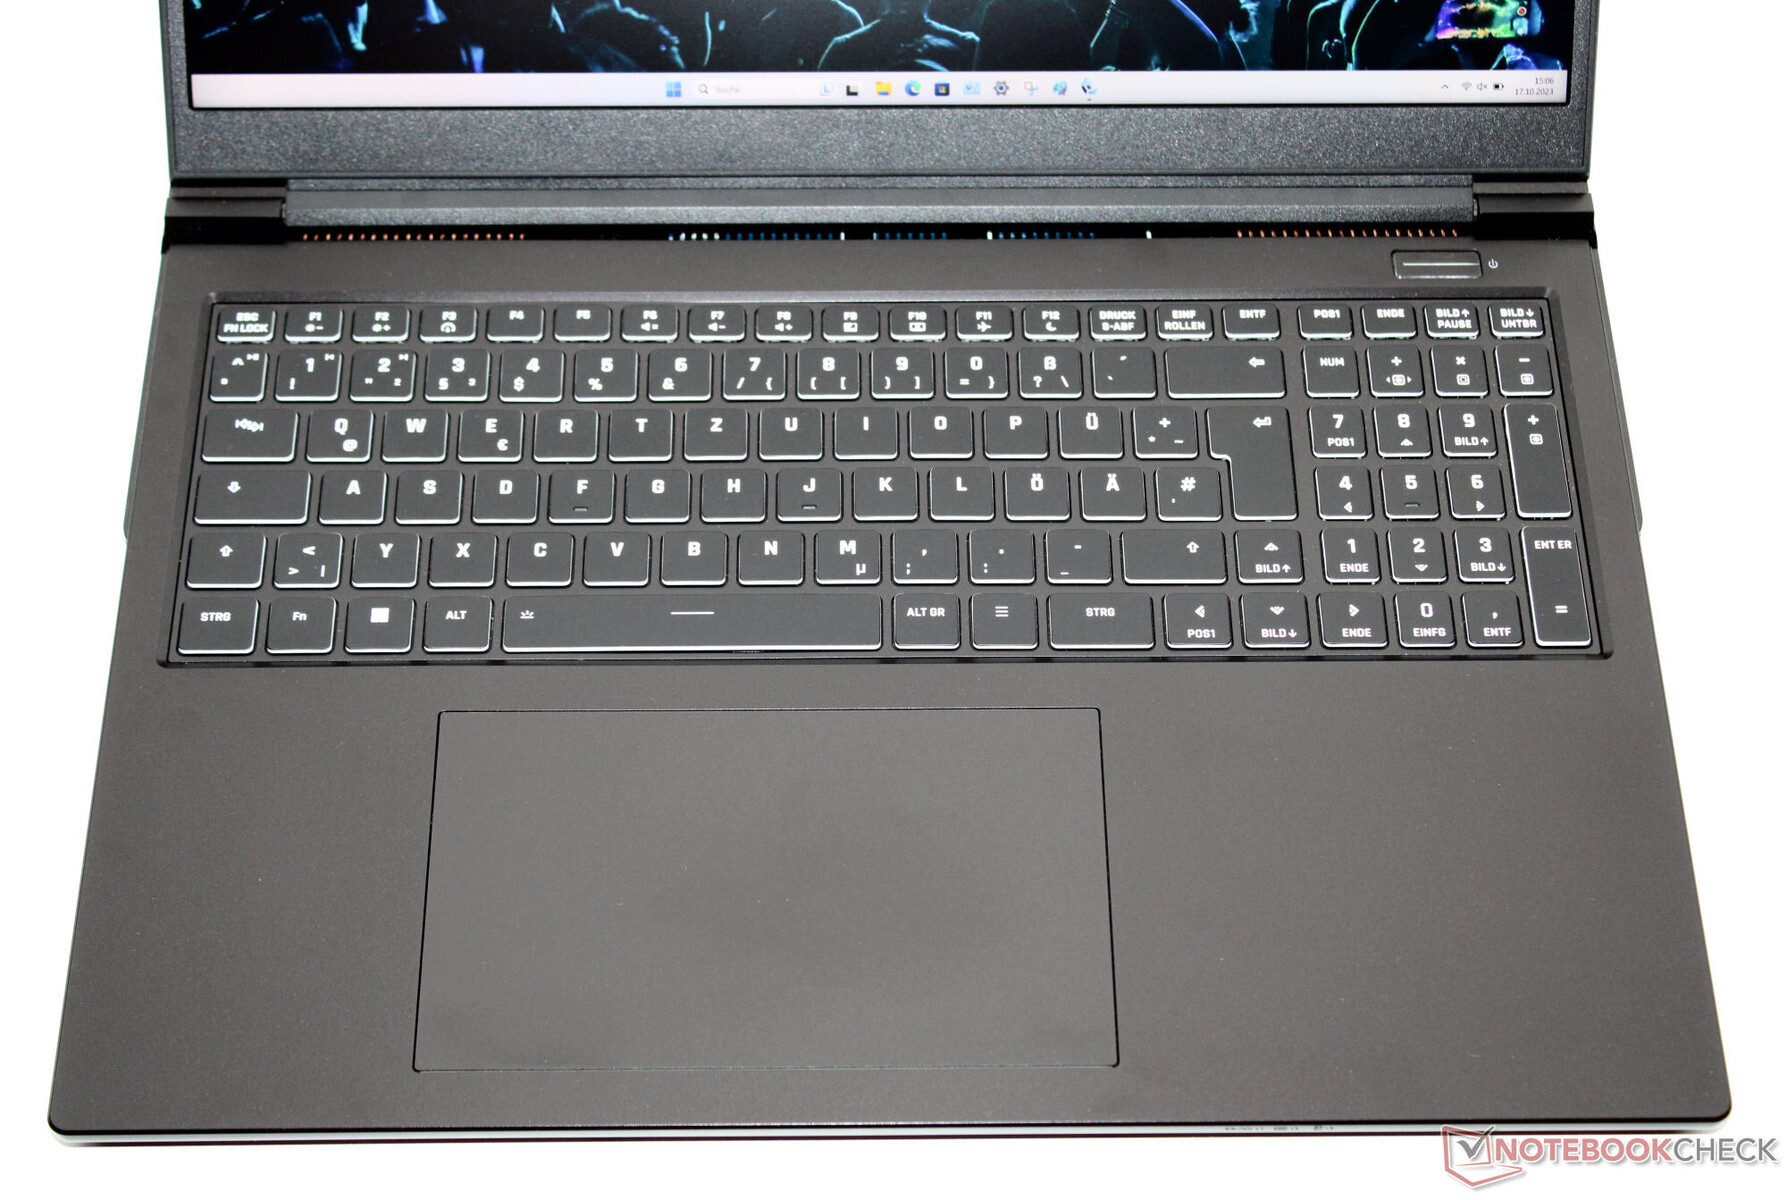
Inmatningsenheter - Den bärbara XMG-datorn har upplysta tangenter
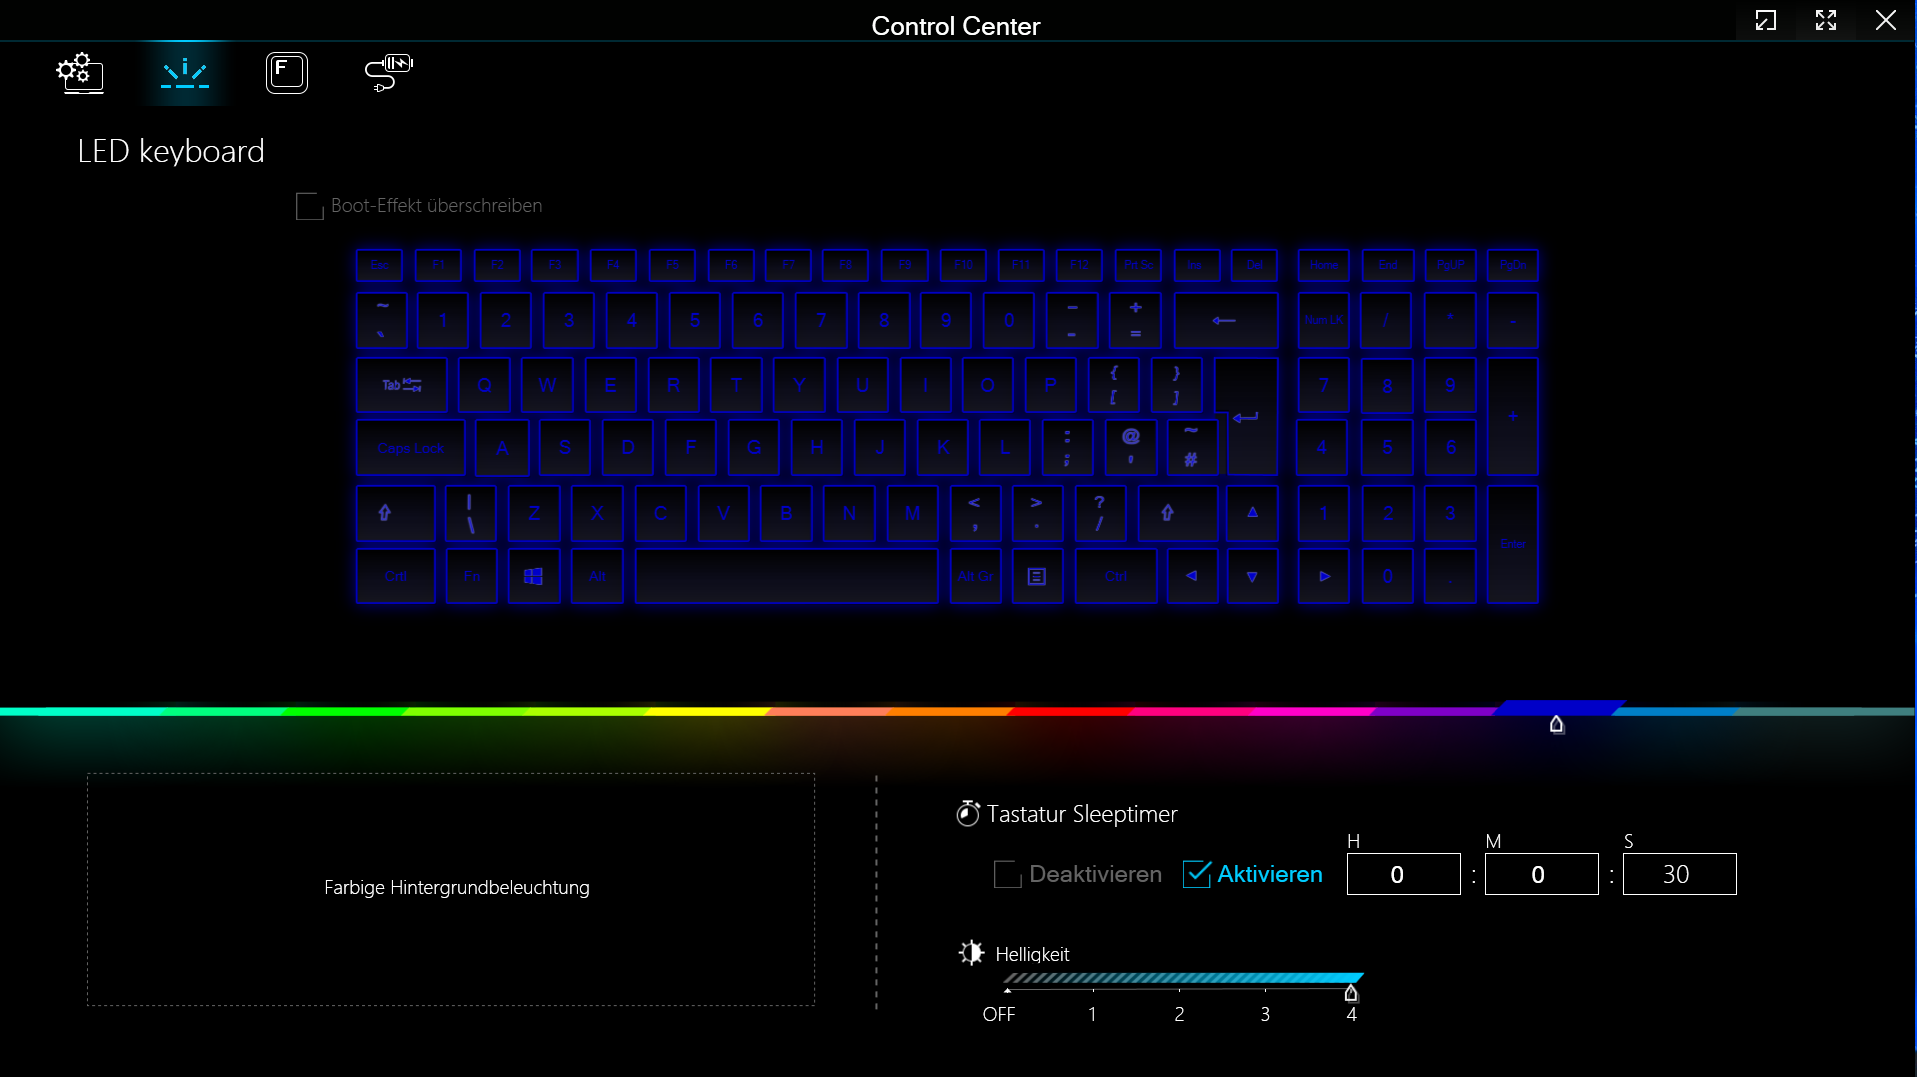
Chiclet-tangentbordets (RGB-belysning) jämna, släta tangenter har en medelhög lyftkraft och en tydlig tryckpunkt. Tangentmotståndet skulle behöva vara lite mer skarpt. Totalt sett har Schenker levererat ett tangentbord som passar för daglig användning. En klickplatta fungerar som ersättning för en mus (ca 15,1 x 9,1 cm), som har en kort lyfthöjd och en tydlig tryckpunkt.
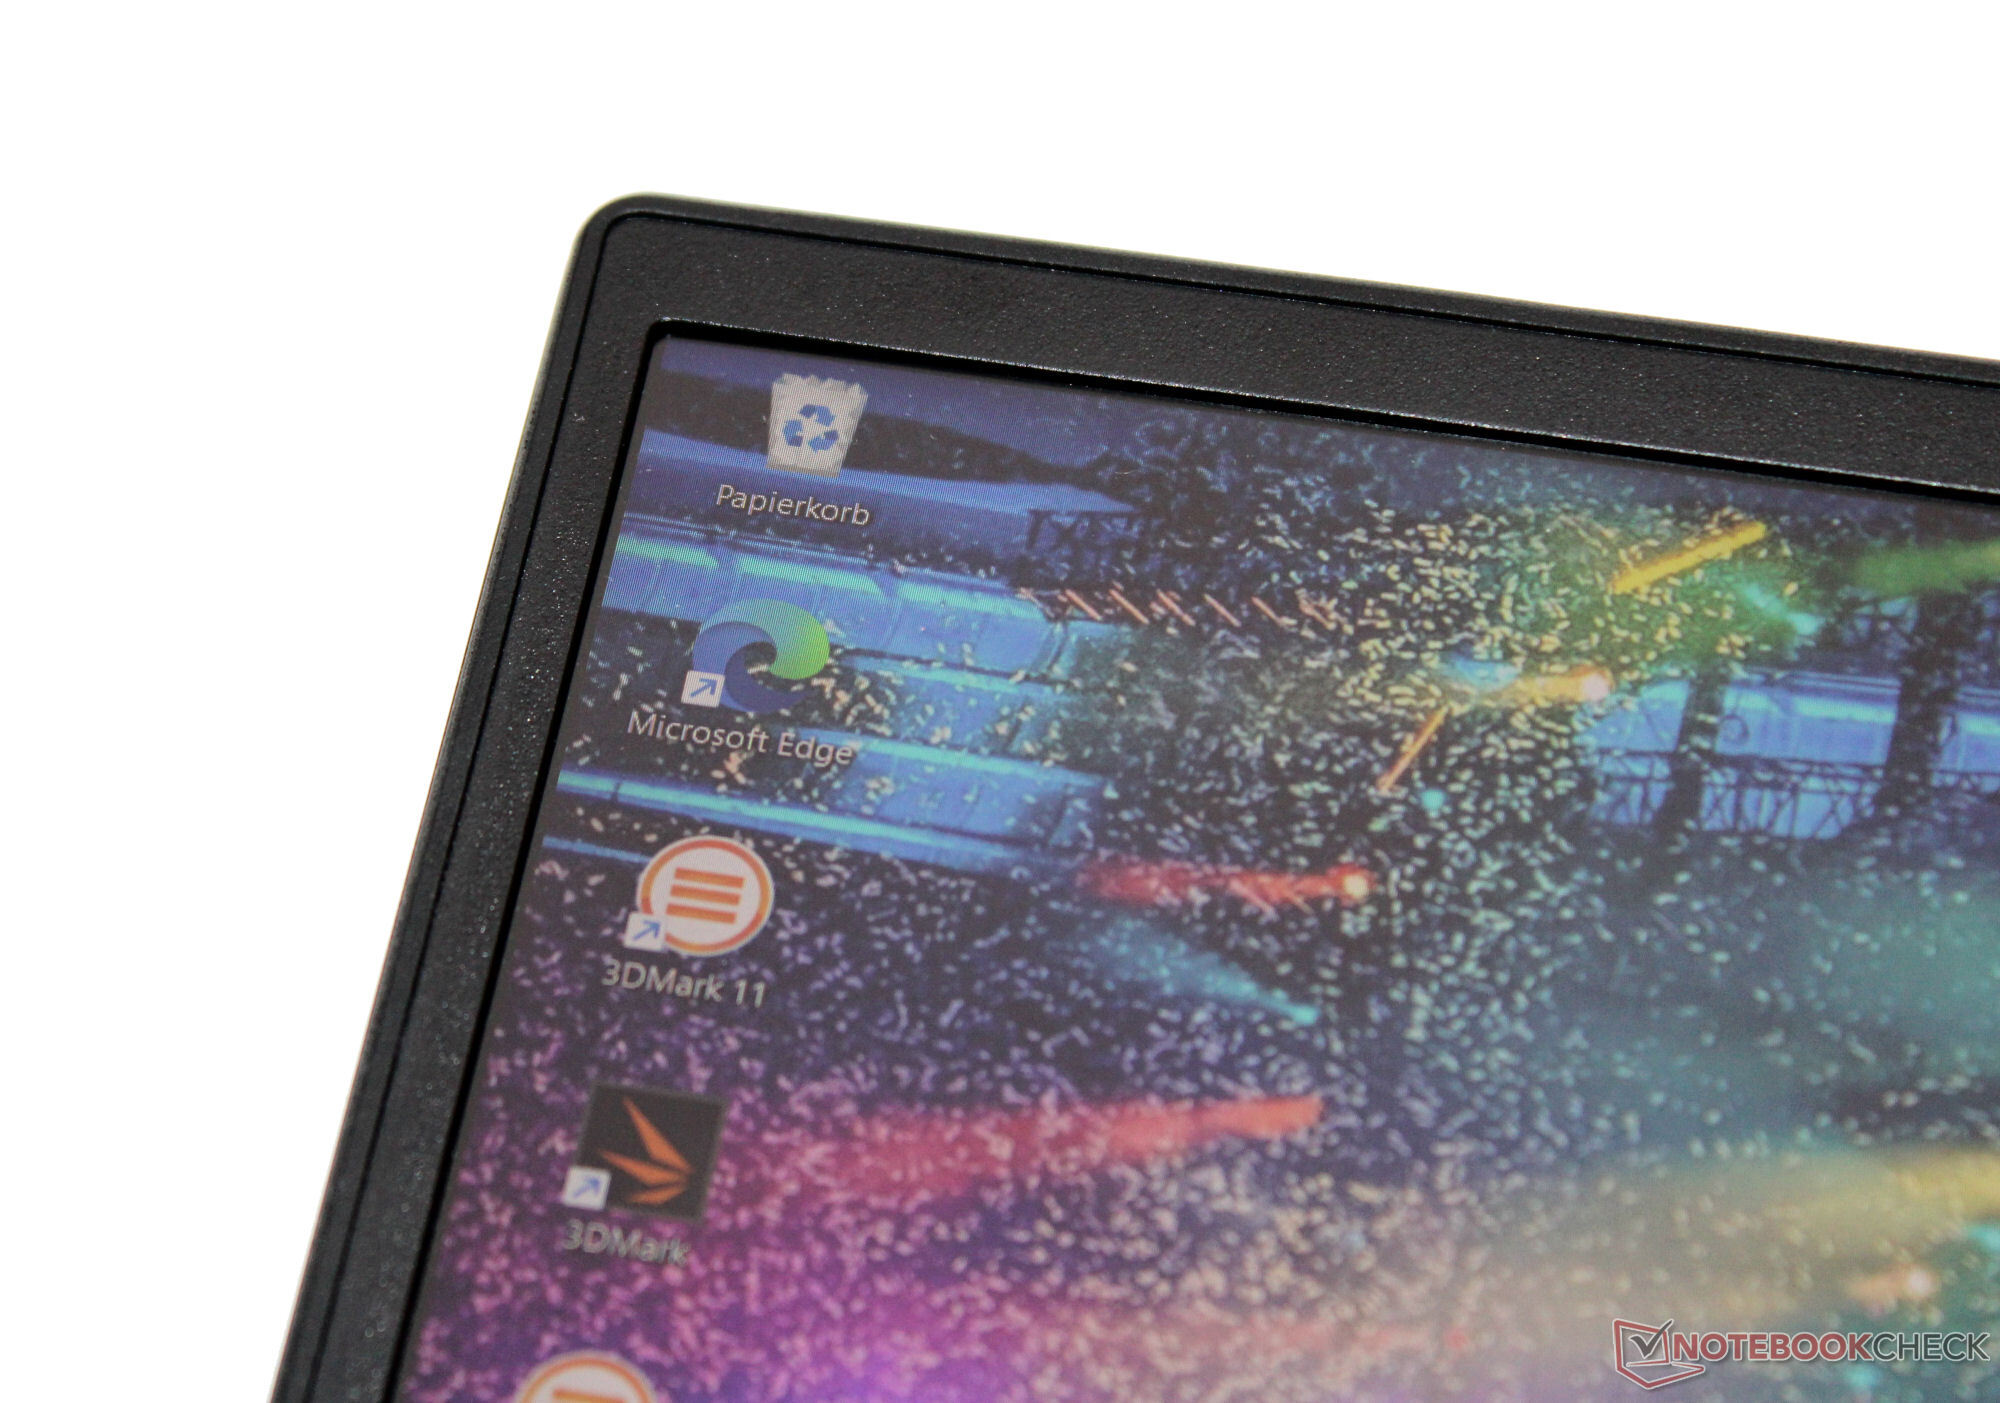
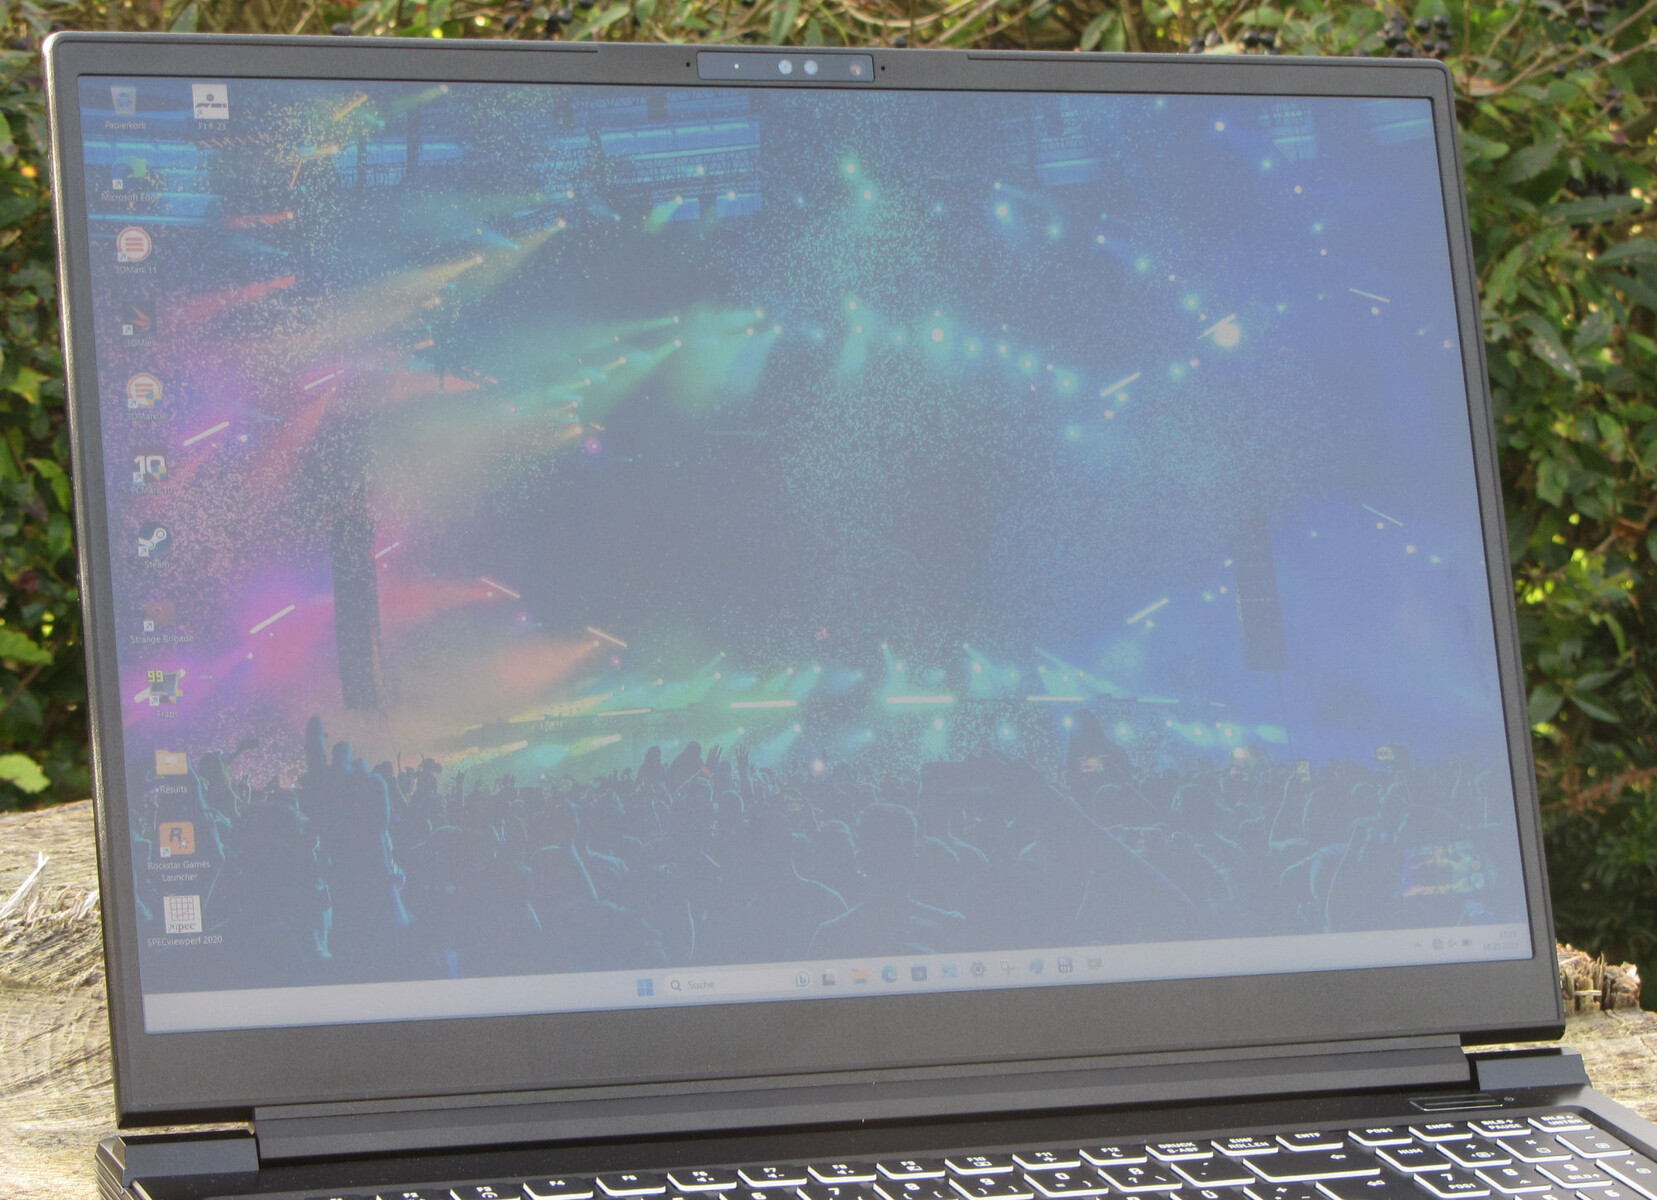
Display - En 16:10-panel med sRGB-täckning
Enhetens snabbreagerande 240 Hz-panel med ett bildförhållande på 16:10 visar inga tecken på PWM-flimmer vid någon ljusstyrka. Den matta 16-tumsskärmens (2.560 x 1.600 pixlar) ljusstyrka och kontrast når sina respektive mål (> 300 cd/m² och 1.000:1). Alternativa displayer finns inte tillgängliga.
| |||||||||||||||||||||||||
Distribution av ljusstyrkan: 93 %
Mitt på batteriet: 349 cd/m²
Kontrast: 1091:1 (Svärta: 0.32 cd/m²)
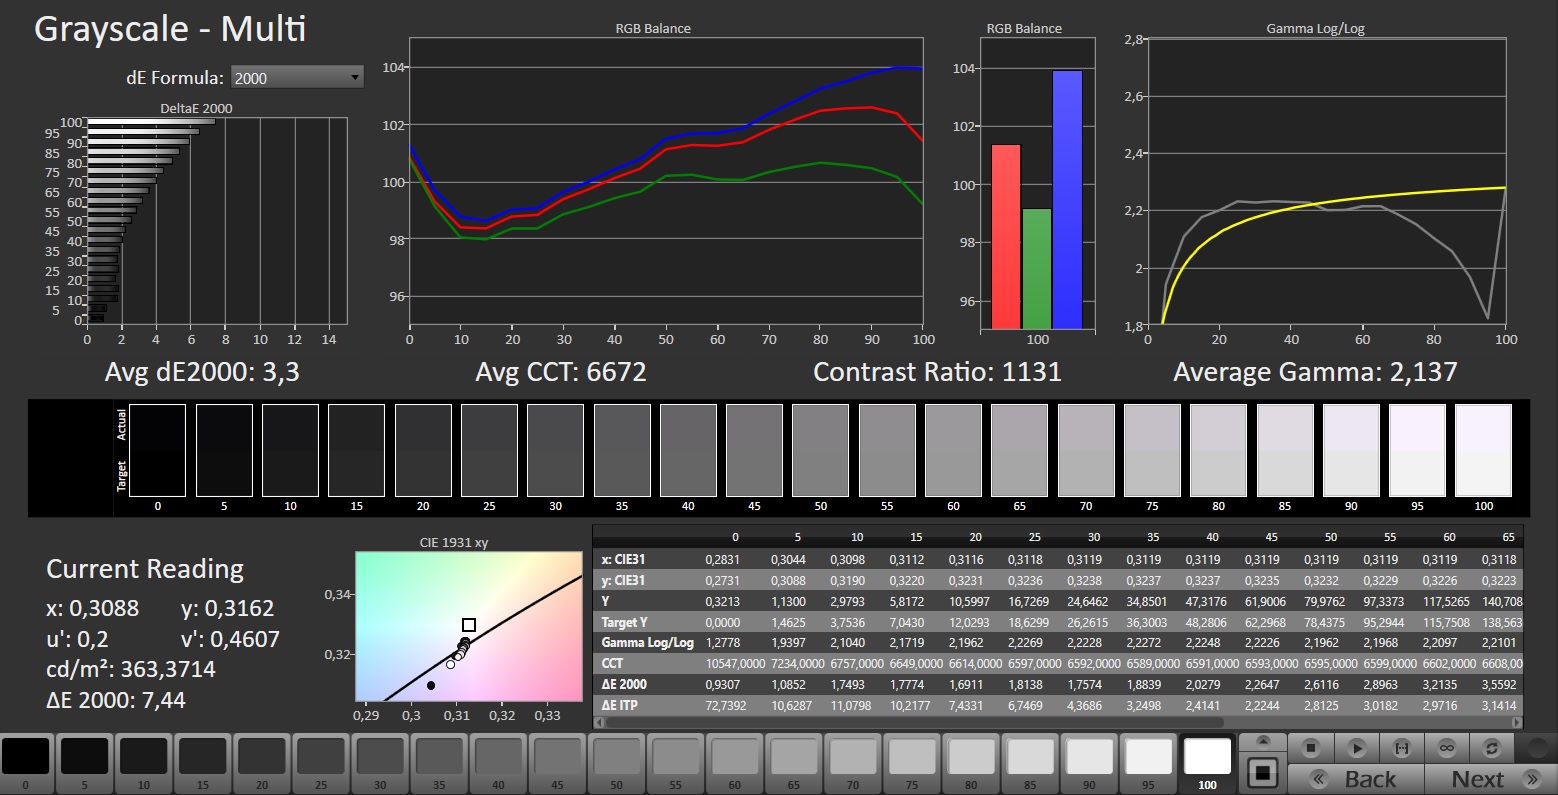
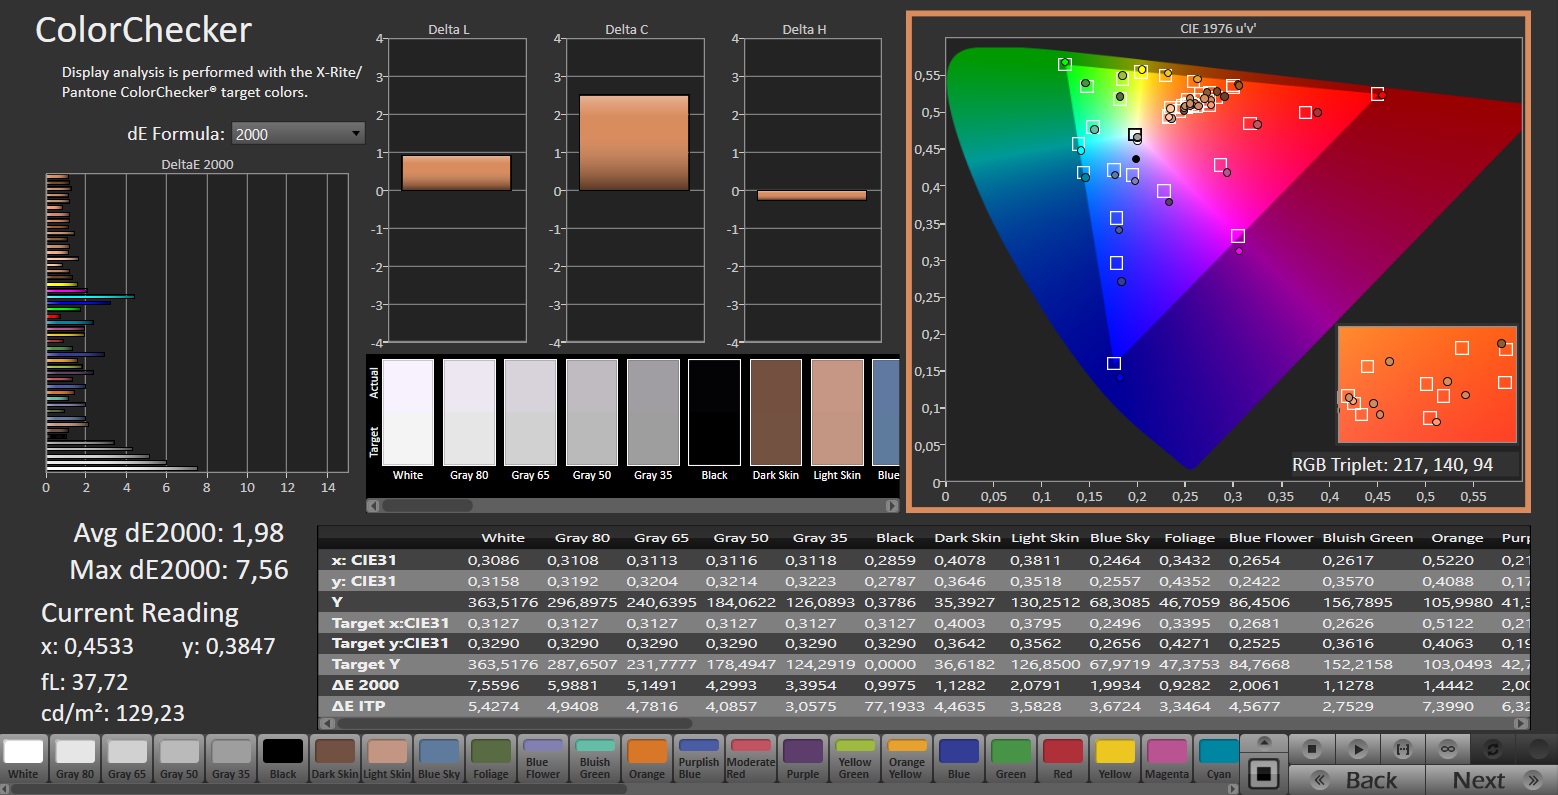
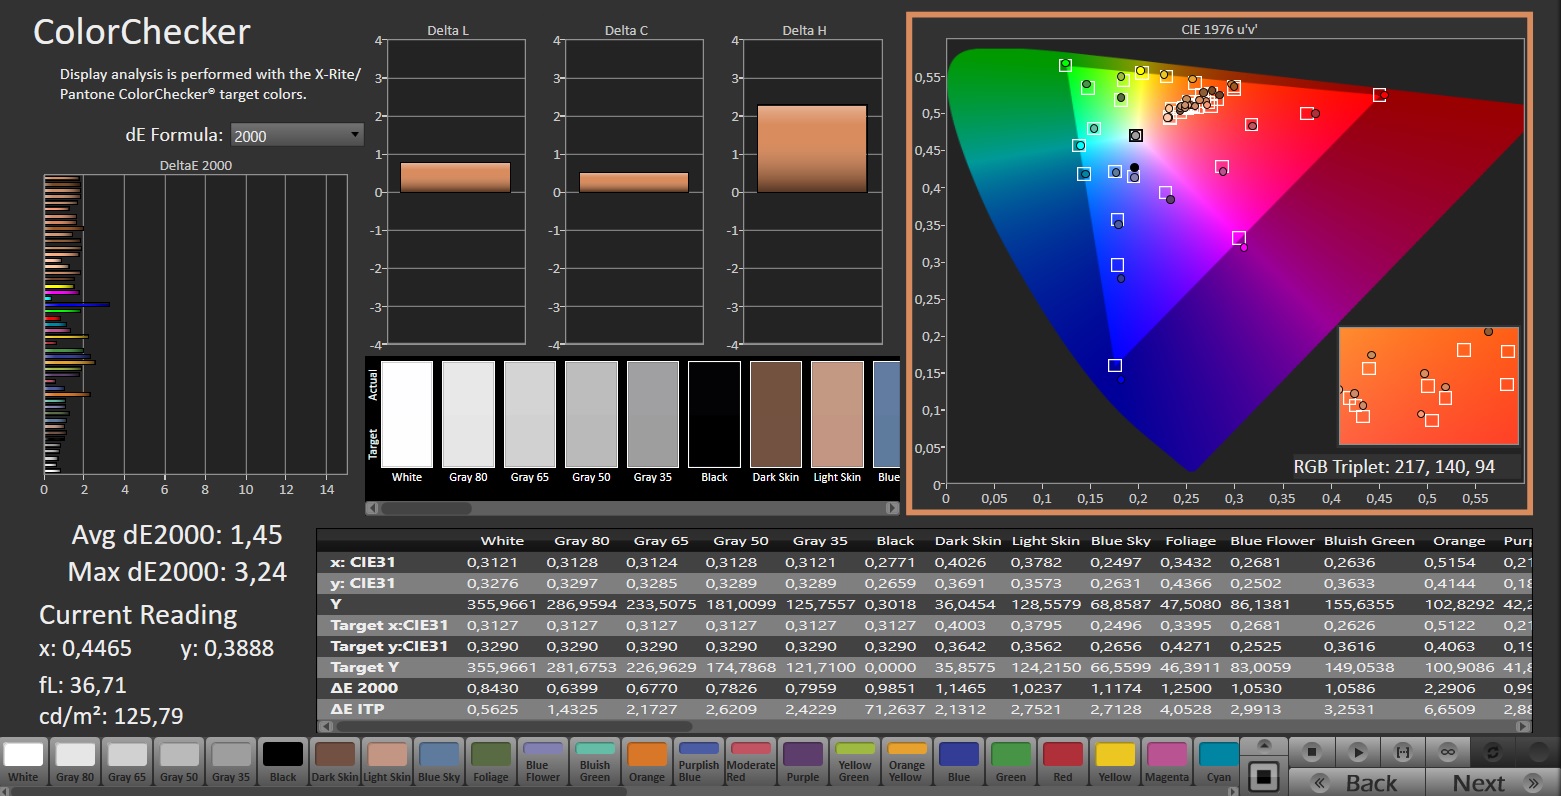
ΔE ColorChecker Calman: 1.98 | ∀{0.5-29.43 Ø4.73}
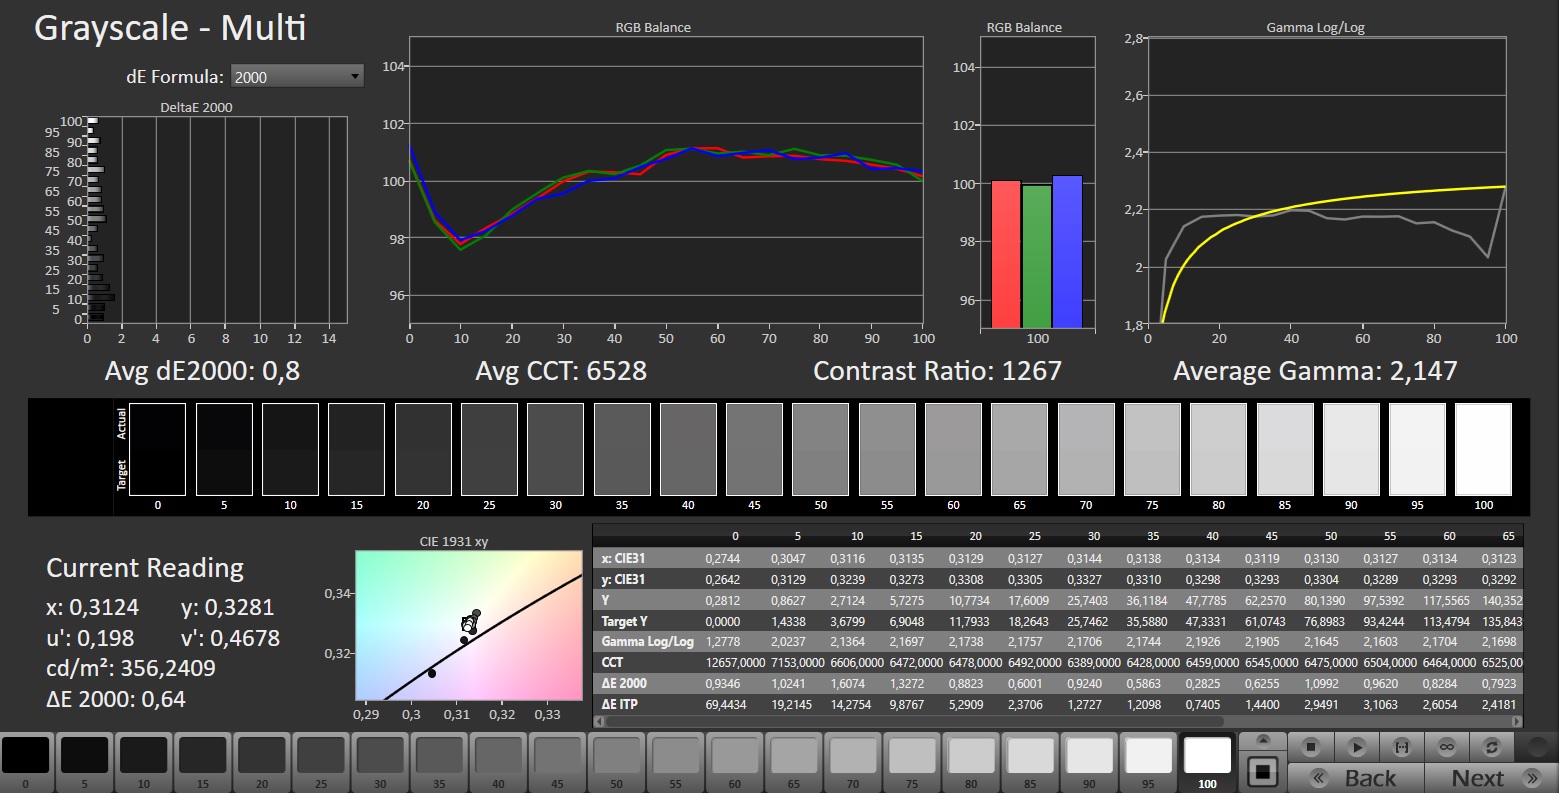
calibrated: 1.45
ΔE Greyscale Calman: 3.3 | ∀{0.09-98 Ø4.97}
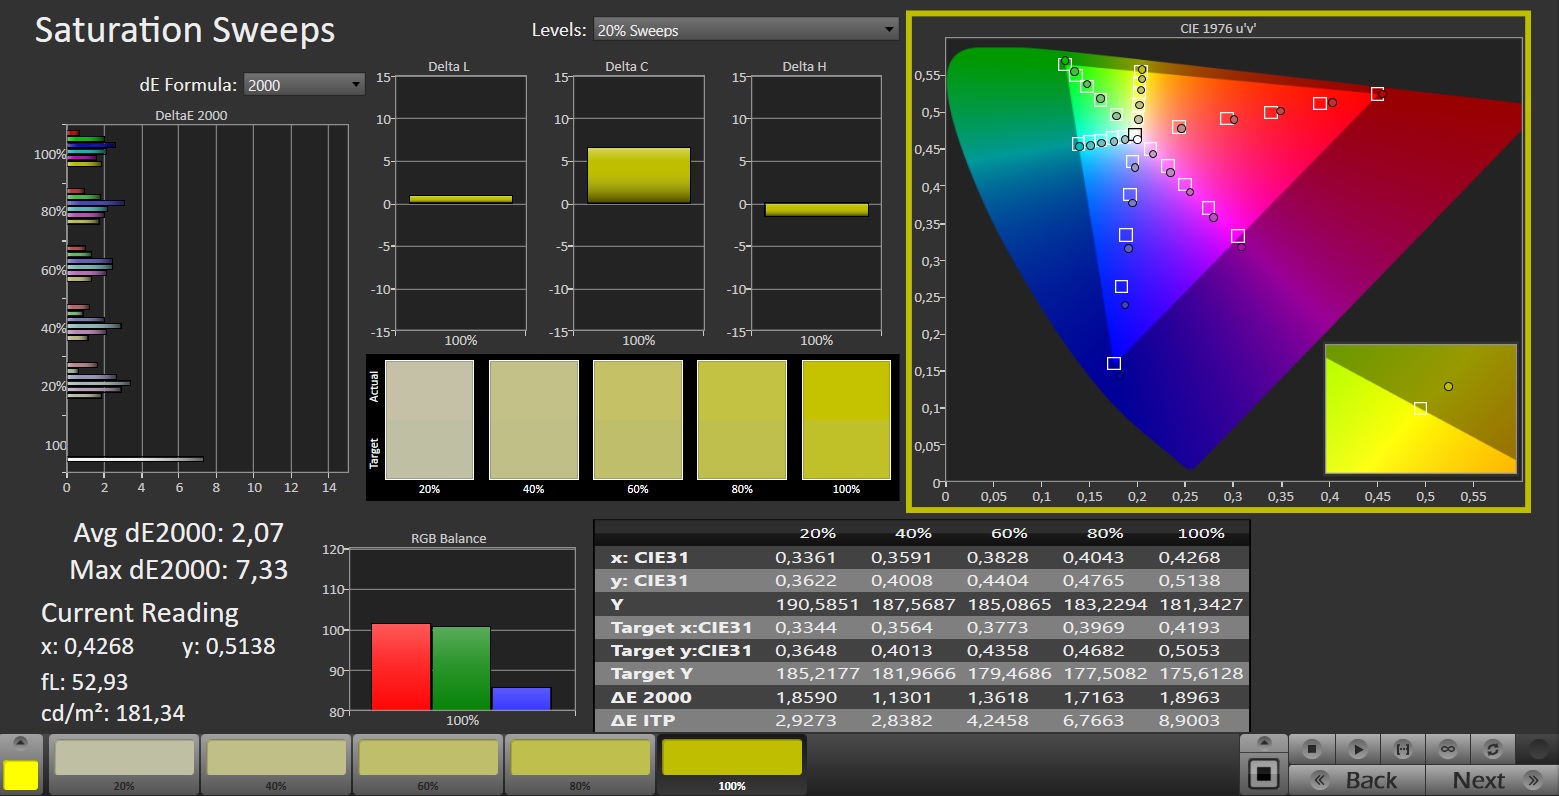
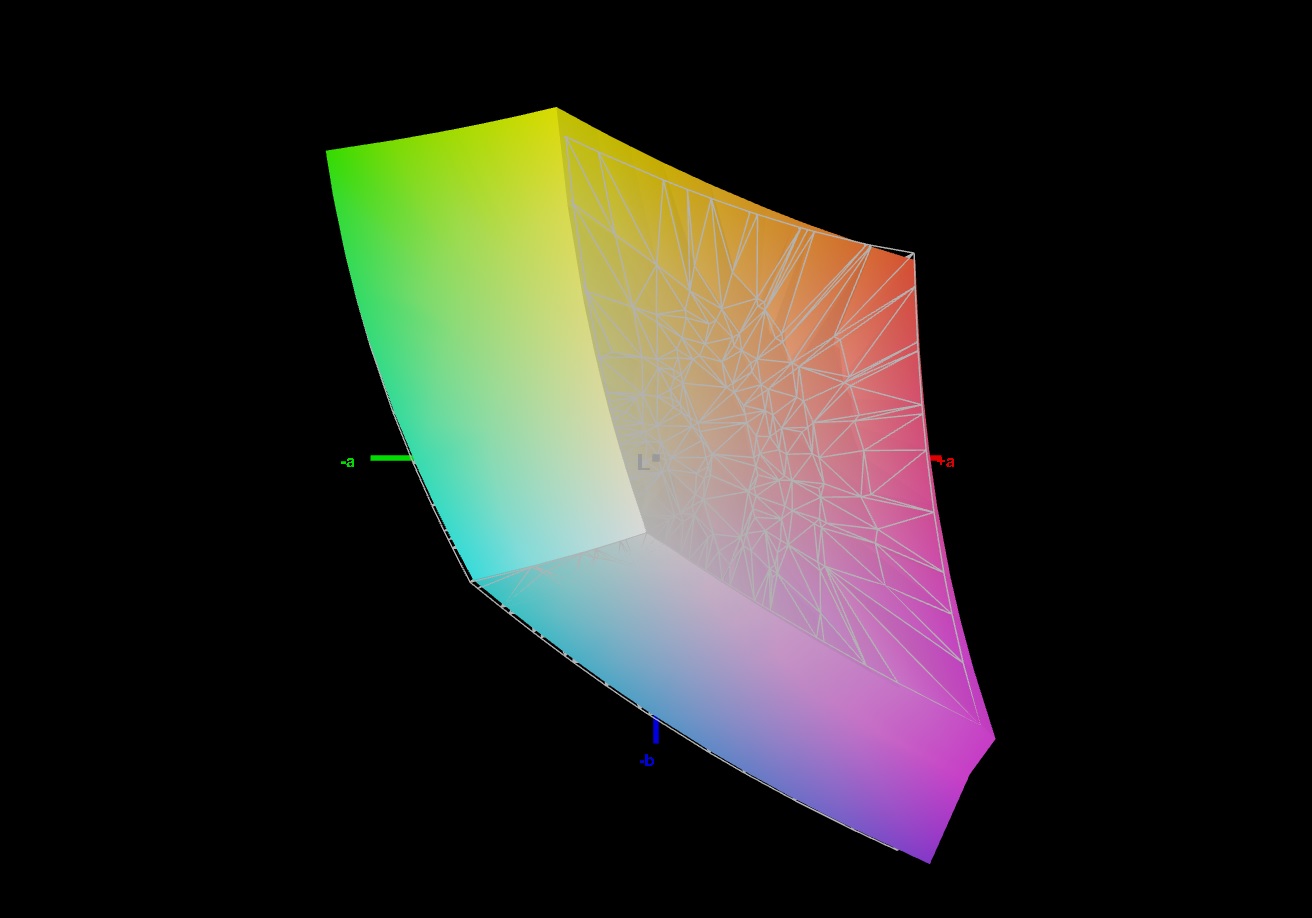
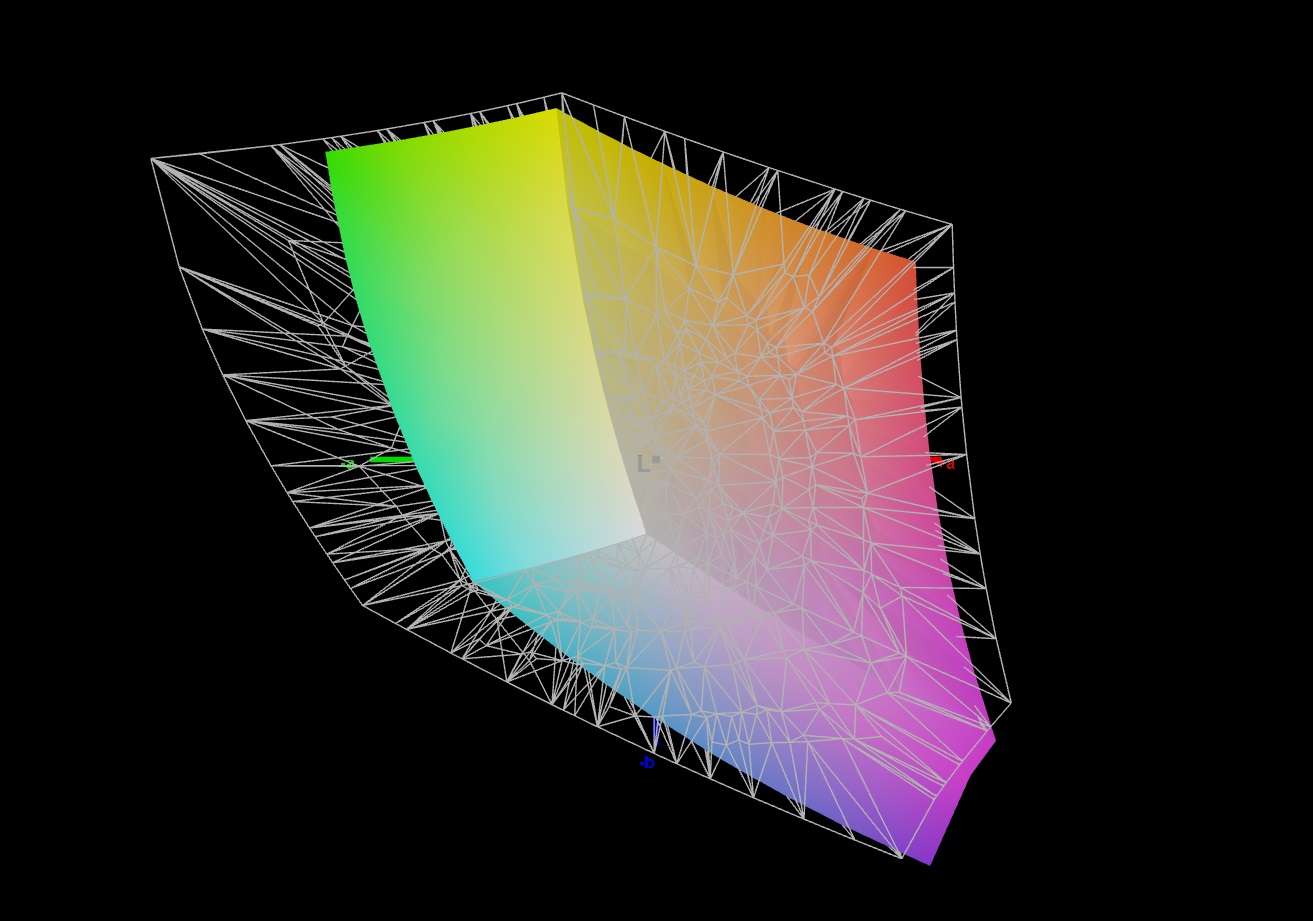
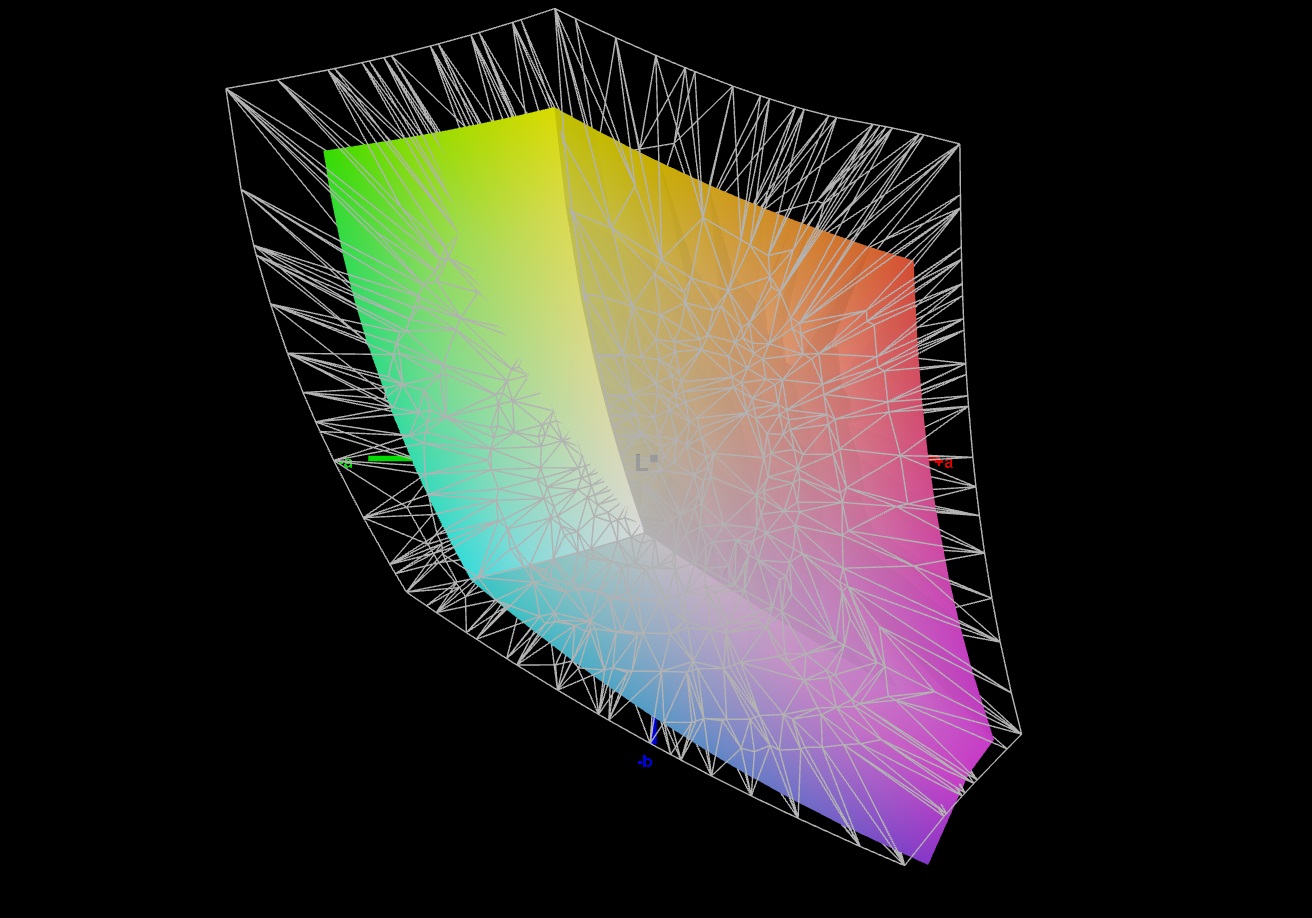
70.1% AdobeRGB 1998 (Argyll 3D)
98.2% sRGB (Argyll 3D)
69.4% Display P3 (Argyll 3D)
Gamma: 2.137
CCT: 6672 K
| Schenker XMG Pro 16 Studio (Mid 23) BOE CQ NE160QDM-NZ1, IPS, 2560x1600, 16" | Asus Vivobook Pro 16X K6604JV-MX016W Samsung SDC4178 ATNA60BX01-1, OLED, 3200x2000, 16" | Lenovo Legion Slim 7i 16 Gen 8 CSOT T3 MNG007DA2-3, IPS, 2560x1600, 16" | HP Omen Transcend 16 AUOA3A6, Mini-LED, 2560x1600, 16" | MSI Stealth 16 Studio A13VG AUO26A9, IPS, 2560x1600, 16" | |
|---|---|---|---|---|---|
| Display | 27% | 2% | 23% | 21% | |
| Display P3 Coverage (%) | 69.4 | 98.4 42% | 70.4 1% | 99.2 43% | 96.4 39% |
| sRGB Coverage (%) | 98.2 | 99.7 2% | 99.4 1% | 100 2% | 99.7 2% |
| AdobeRGB 1998 Coverage (%) | 70.1 | 95.8 37% | 72.5 3% | 87.6 25% | 84.8 21% |
| Response Times | 85% | -7% | -191% | 46% | |
| Response Time Grey 50% / Grey 80% * (ms) | 12.2 ? | 1.6 ? 87% | 12 ? 2% | 26.4 ? -116% | 4.4 ? 64% |
| Response Time Black / White * (ms) | 7.7 ? | 1.4 ? 82% | 8.9 ? -16% | 28.2 ? -266% | 5.6 ? 27% |
| PWM Frequency (Hz) | 120 ? | 3506 ? | |||
| Screen | 66% | 17% | 204% | -19% | |
| Brightness middle (cd/m²) | 349 | 347 -1% | 474.6 36% | 791.1 127% | 424 21% |
| Brightness (cd/m²) | 348 | 346 -1% | 445 28% | 800 130% | 411 18% |
| Brightness Distribution (%) | 93 | 97 4% | 86 -8% | 95 2% | 88 -5% |
| Black Level * (cd/m²) | 0.32 | 0.06 81% | 0.39 -22% | 0.04 87% | 0.37 -16% |
| Contrast (:1) | 1091 | 5783 430% | 1217 12% | 19778 1713% | 1146 5% |
| Colorchecker dE 2000 * | 1.98 | 1.89 5% | 2.12 -7% | 4.37 -121% | 3.04 -54% |
| Colorchecker dE 2000 max. * | 7.56 | 3.26 57% | 4.73 37% | 10.39 -37% | 7.5 1% |
| Colorchecker dE 2000 calibrated * | 1.45 | 1.97 -36% | 0.57 61% | 1.04 28% | 3.04 -110% |
| Greyscale dE 2000 * | 3.3 | 1.55 53% | 2.8 15% | 6.5 -97% | 4.34 -32% |
| Gamma | 2.137 103% | 2.39 92% | 2.22 99% | 2.28 96% | 2.32 95% |
| CCT | 6672 97% | 6458 101% | 6542 99% | 6000 108% | 6952 93% |
| Totalt genomsnitt (program/inställningar) | 59% /
60% | 4% /
10% | 12% /
109% | 16% /
-1% |
* ... mindre är bättre
Direkt ur lådan visar skärmen en ganska bra färgåtergivning: Med en avvikelse på cirka 2 uppnås målet (DeltaE < 3). Kalibrering av skärmen leder till en mindre avvikelse på 1,45 och mer balanserade gråtoner. Panelen kan nästan helt återge sRGB-färgrymden - men inte AdobeRGB eller DCI P3. Här har konkurrenterna ibland mer att erbjuda.

Visa svarstider
| ↔ Svarstid svart till vitt | ||
|---|---|---|
| 7.7 ms ... stiga ↗ och falla ↘ kombinerat | ↗ 4 ms stiga | 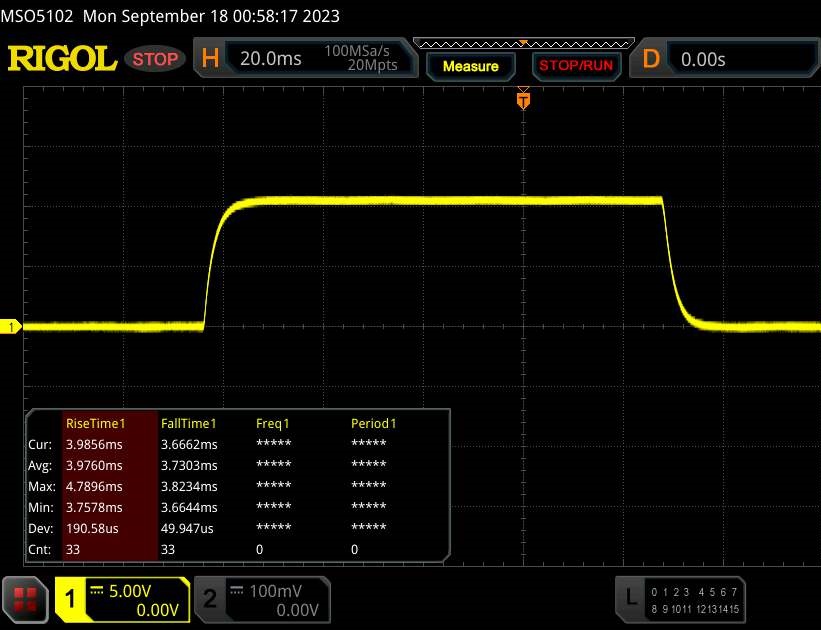 |
| ↘ 3.7 ms hösten | ||
| Skärmen visar väldigt snabba svarsfrekvenser i våra tester och borde vara mycket väl lämpad för fartfyllt spel. I jämförelse sträcker sig alla testade enheter från 0.1 (minst) till 240 (maximalt) ms. » 22 % av alla enheter är bättre. Det betyder att den uppmätta svarstiden är bättre än genomsnittet av alla testade enheter (19.9 ms). | ||
| ↔ Svarstid 50 % grått till 80 % grått | ||
| 12.2 ms ... stiga ↗ och falla ↘ kombinerat | ↗ 5.9 ms stiga | 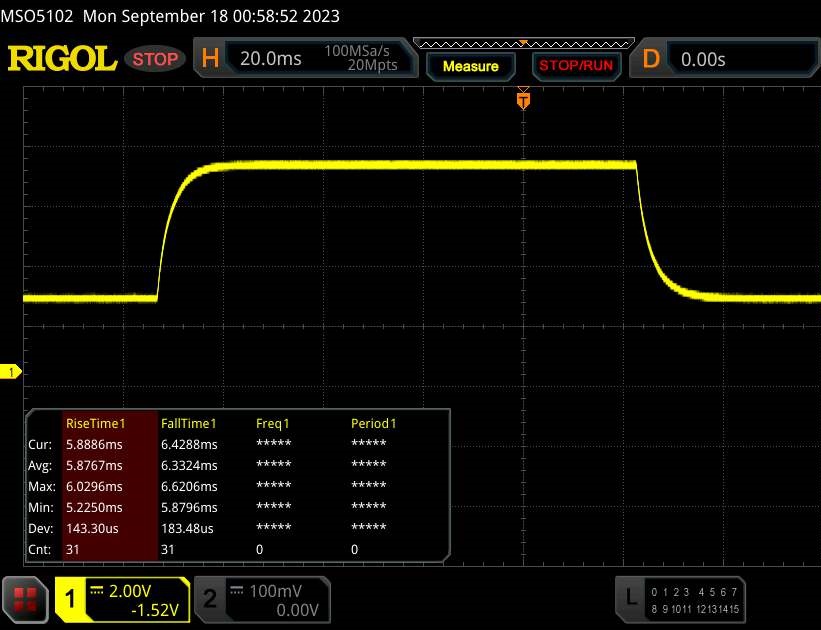 |
| ↘ 6.3 ms hösten | ||
| Skärmen visar bra svarsfrekvens i våra tester, men kan vara för långsam för konkurrenskraftiga spelare. I jämförelse sträcker sig alla testade enheter från 0.165 (minst) till 636 (maximalt) ms. » 26 % av alla enheter är bättre. Det betyder att den uppmätta svarstiden är bättre än genomsnittet av alla testade enheter (31.1 ms). | ||
Skärmflimmer / PWM (Puls-Width Modulation)
| Skärmflimmer / PWM upptäcktes inte | 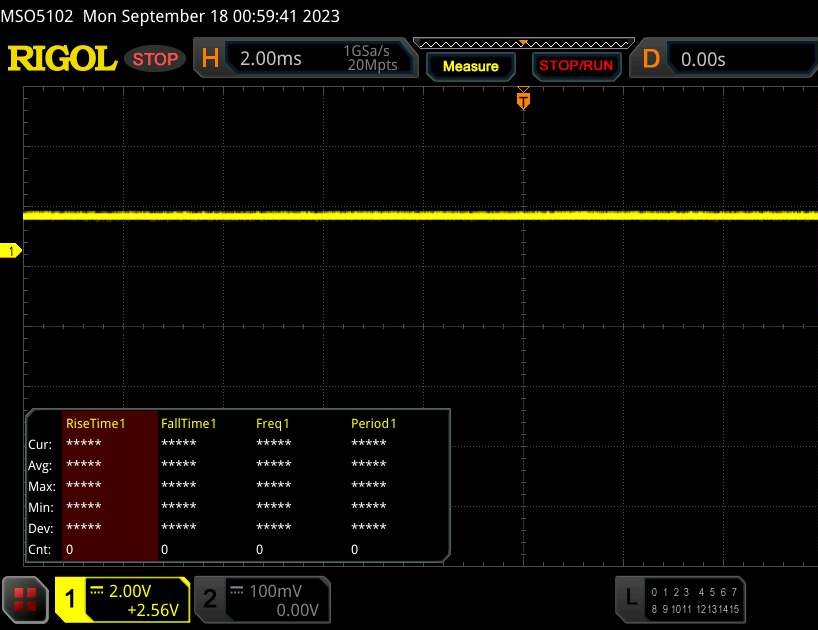 | ||
Som jämförelse: 52 % av alla testade enheter använder inte PWM för att dämpa skärmen. Om PWM upptäcktes mättes ett medelvärde av 7801 (minst: 5 - maximum: 343500) Hz. | |||
Den bärbara datorns betraktningsvinkelstabila IPS-panel är läsbar från alla vinklar. Utomhus kan du läsa på displayen så länge solen inte skiner alltför starkt.
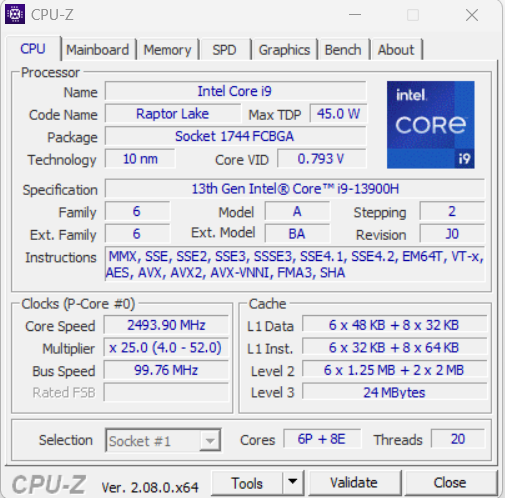
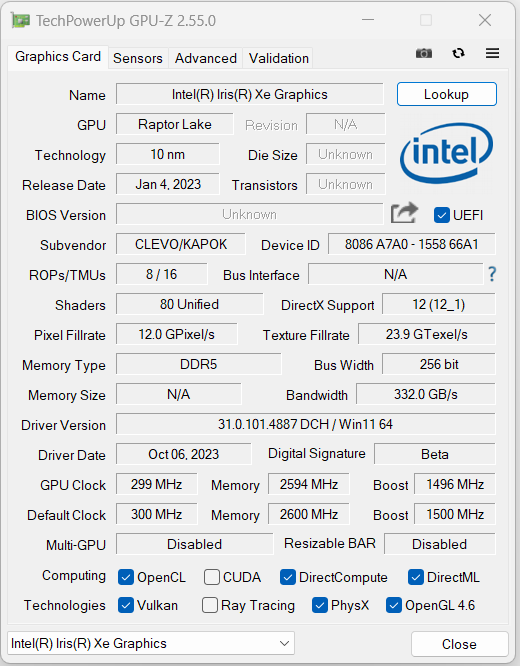
Prestanda - Schenkers bärbara dator förlitar sig på Raptor Lake och Ada Lovelace
XMG Pro 16 Studio är inriktad på spelare och kreatörer och förlitar sig på Raptor Lake och Ada Lovelace. En GeForce RTX Studio-certifiering ska garantera hög prestanda, anpassade drivrutiner, bra programvarustöd och en passande täckning av skärmens färgrymd. Den bärbara datorn kan konfigureras individuellt via Schenkers onlinebutik. Den aktuella varianten kostar ca 2 400 USD och billigare modeller kostar från ca 1 900 USD.
Villkor för testning
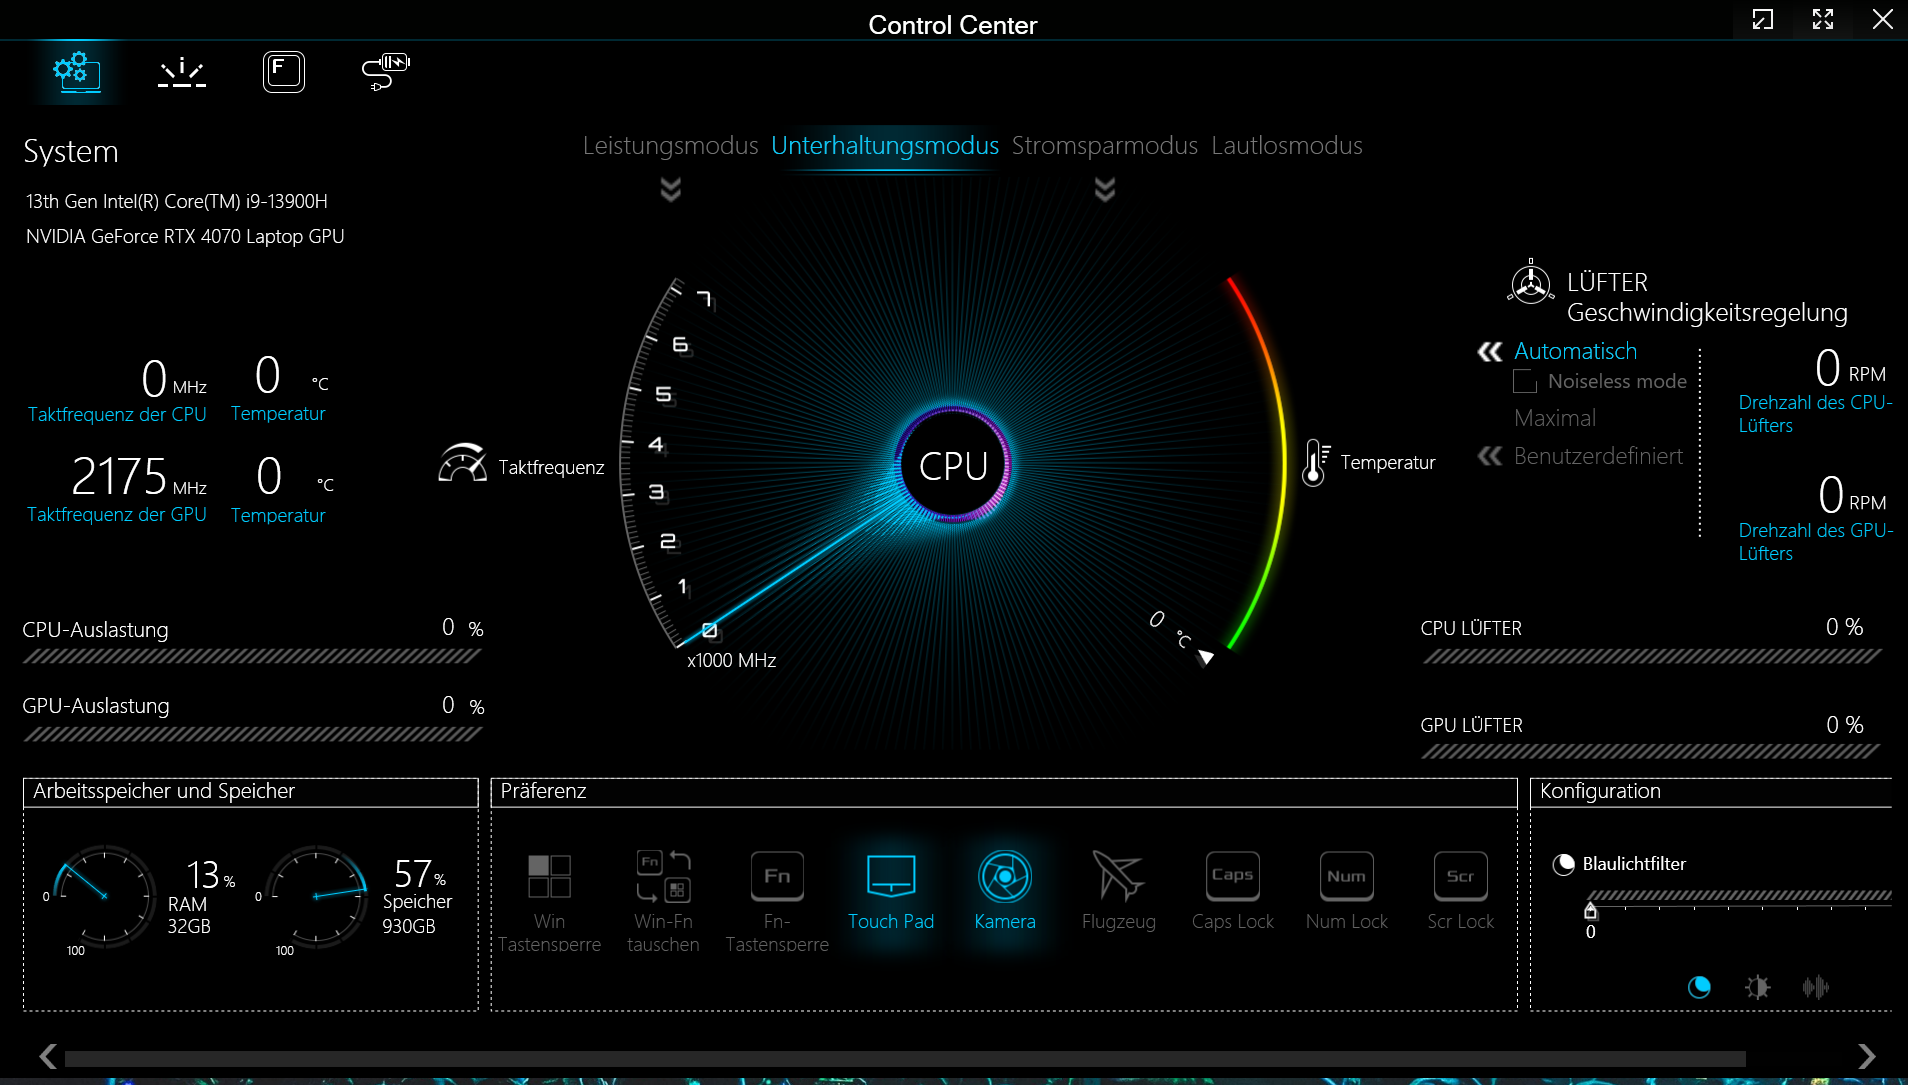
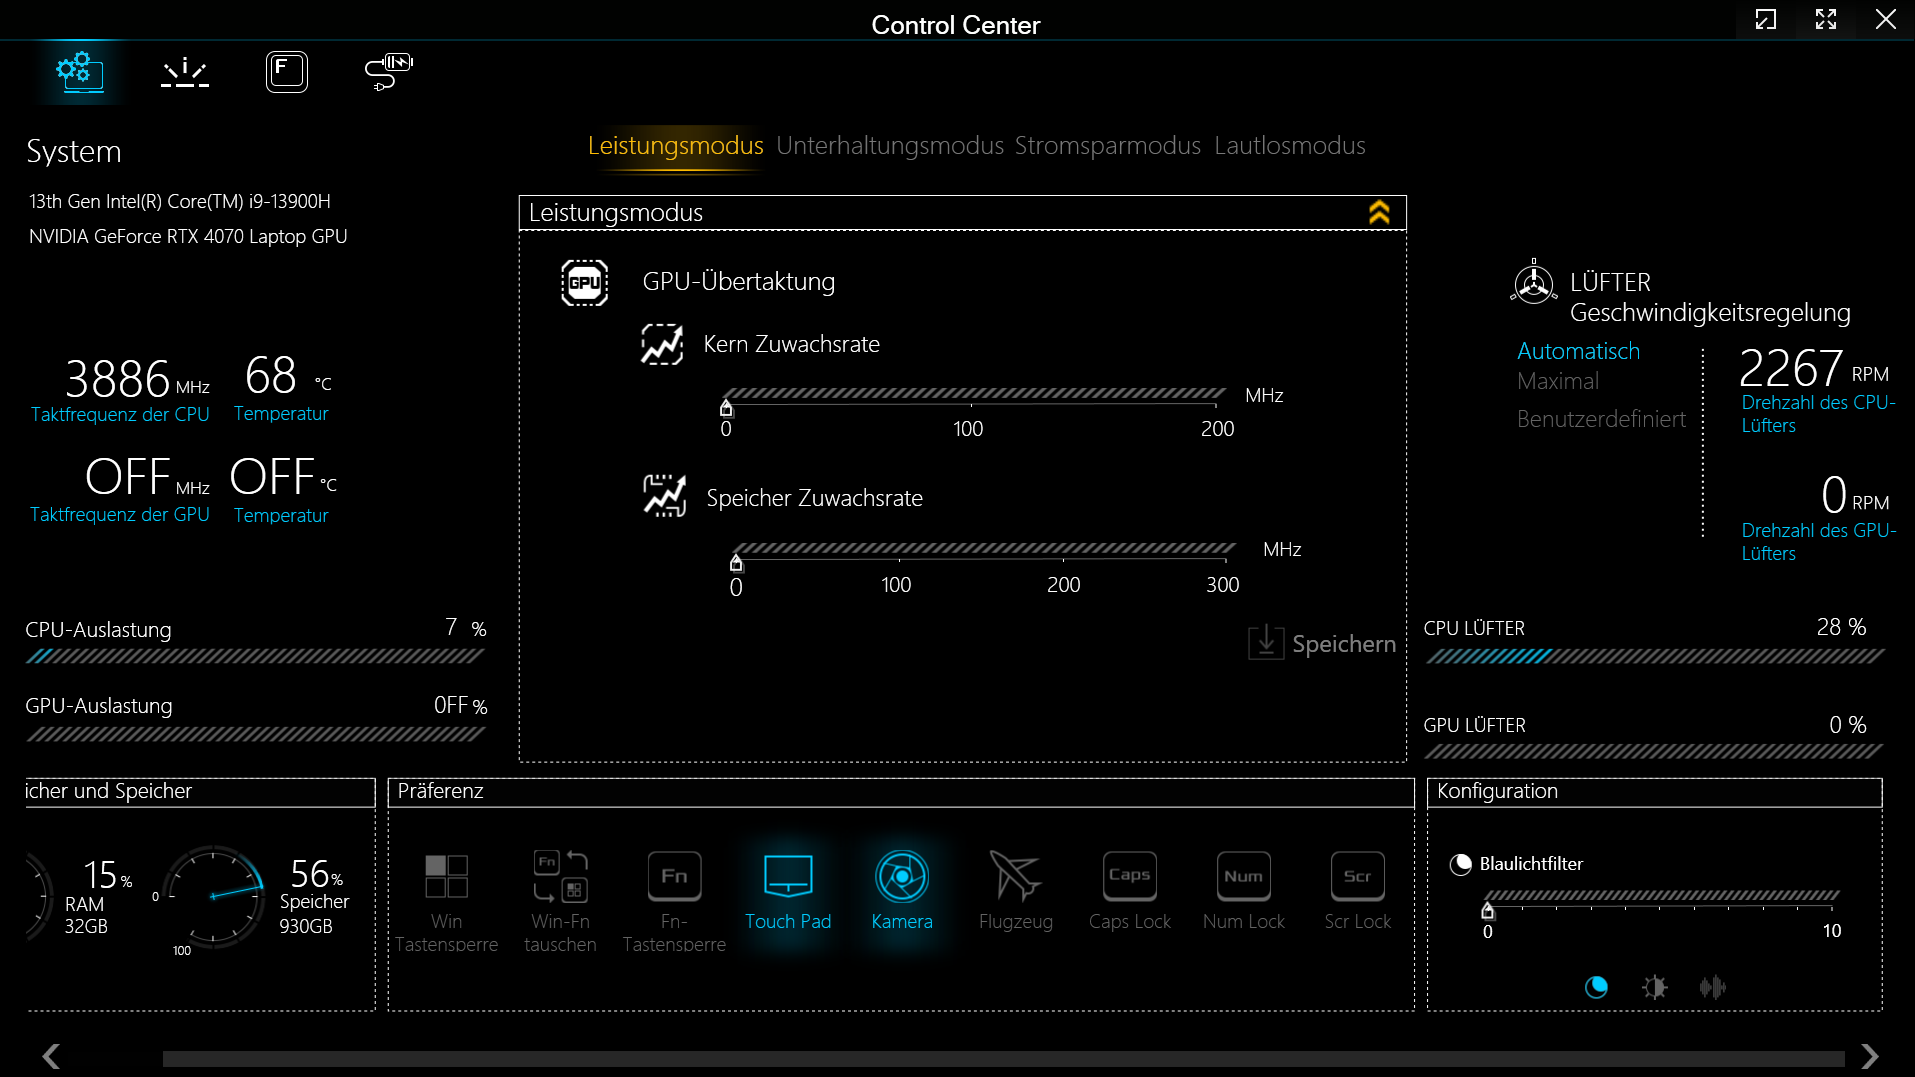
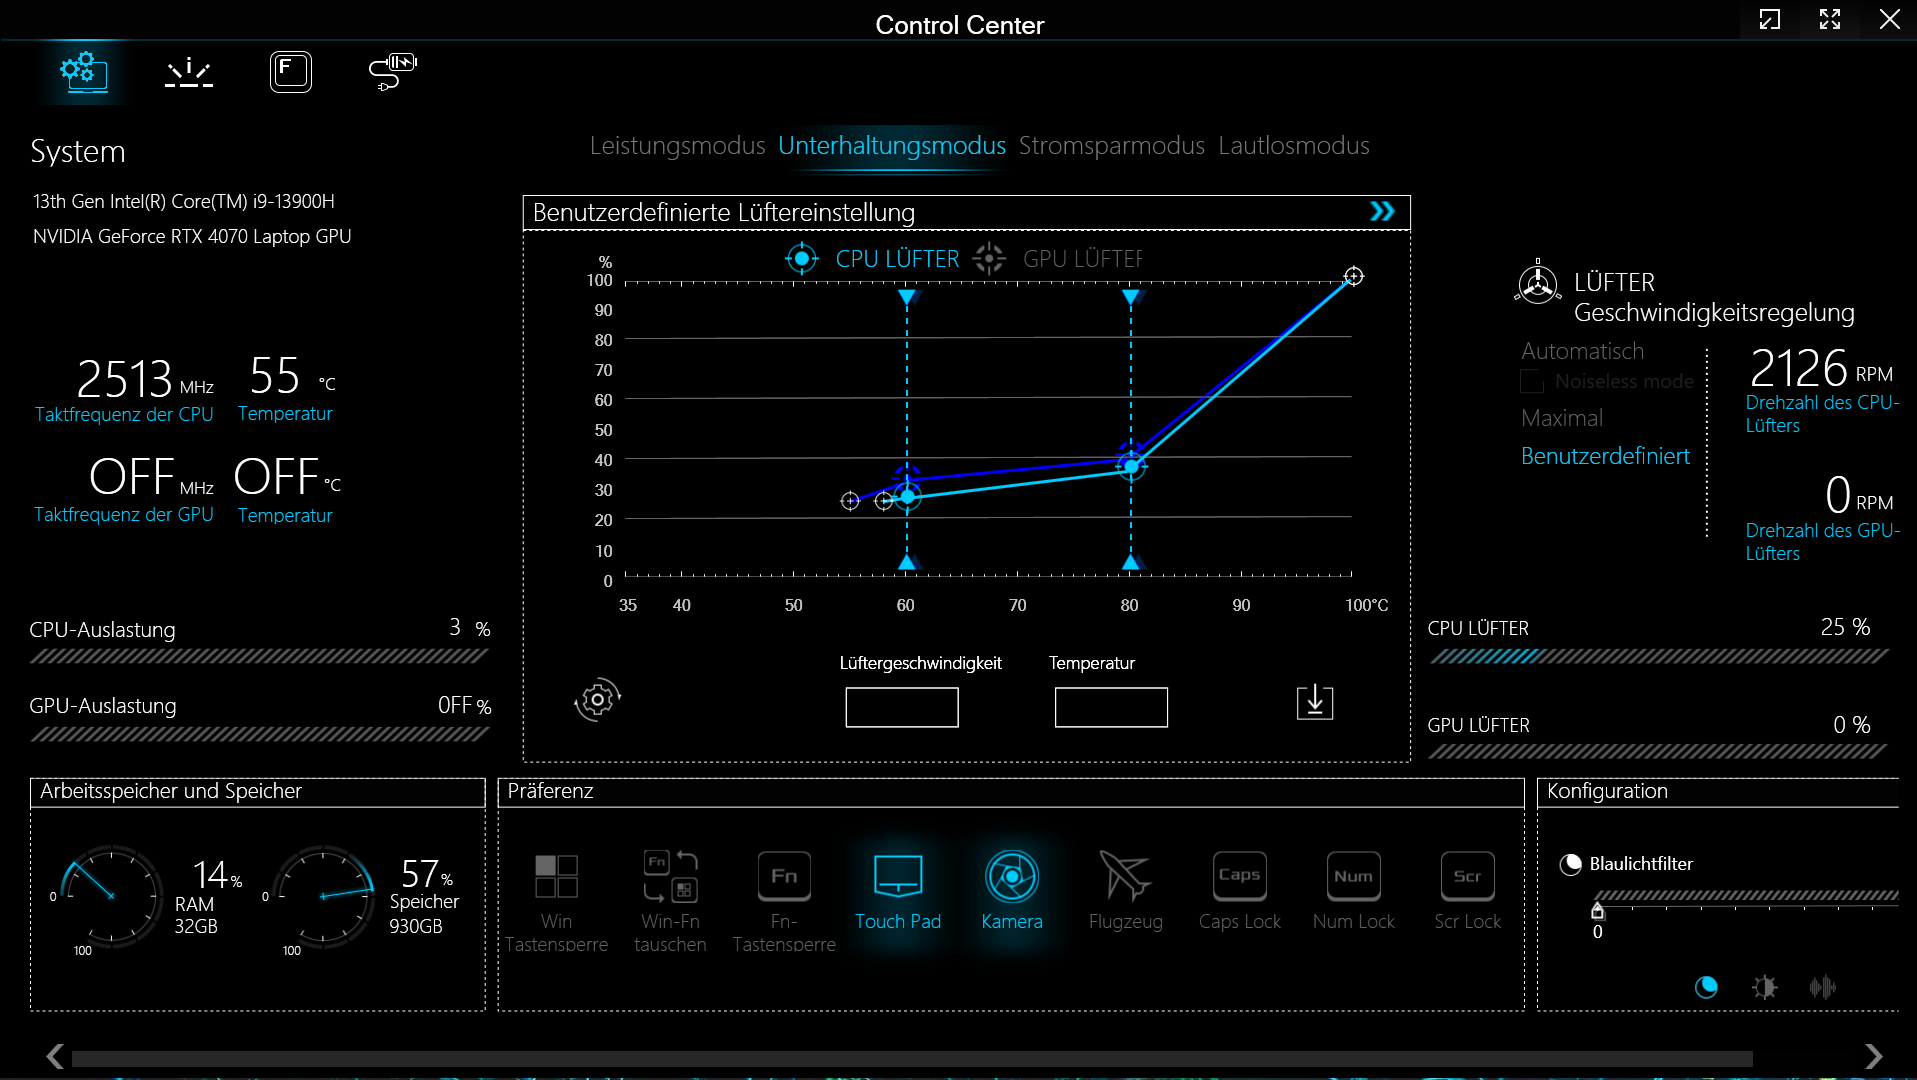
Pro erbjuder fyra tillverkarspecifika prestandalägen (se tabell) som kan växlas mellan via programvaran Control Center (den bärbara datorns kontrollcenter). "Entertainment Mode" (benchmarks) och "Power Saving Mode" (batteritester) användes. Optimus var aktivt.
| Entertainment Mode | Performance Mode | Power Saving Mode | Silent Mode | |
|---|---|---|---|---|
| Effektgräns 1 (HWInfo) | 70 watt | 100 watt | 15 watt | 15 watt |
| Effektgräns 2 (HWInfo) | 90 watt | 120 watt | 30 watt | 30 watt |
| Buller (Witcher 3) | 48 dB(A) | 55 dB (A) | - | 42 dB (A) |
| Prestanda (Witcher 3) | ~114 fps | ~118 fps | - | ~100-114 fps |
Processor
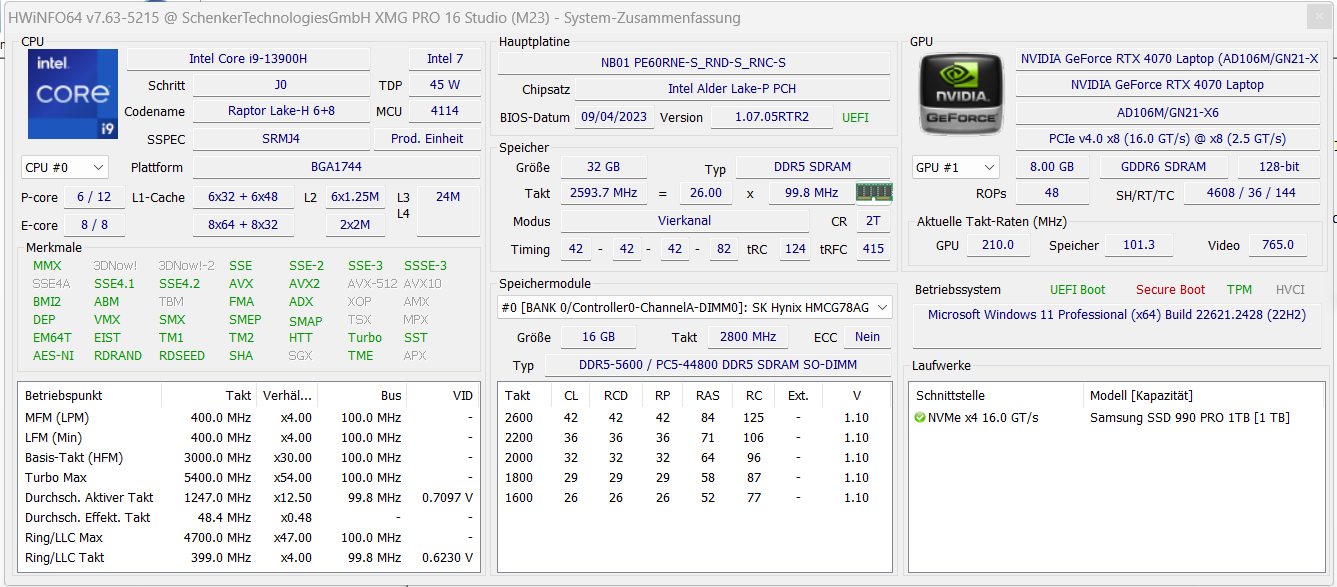
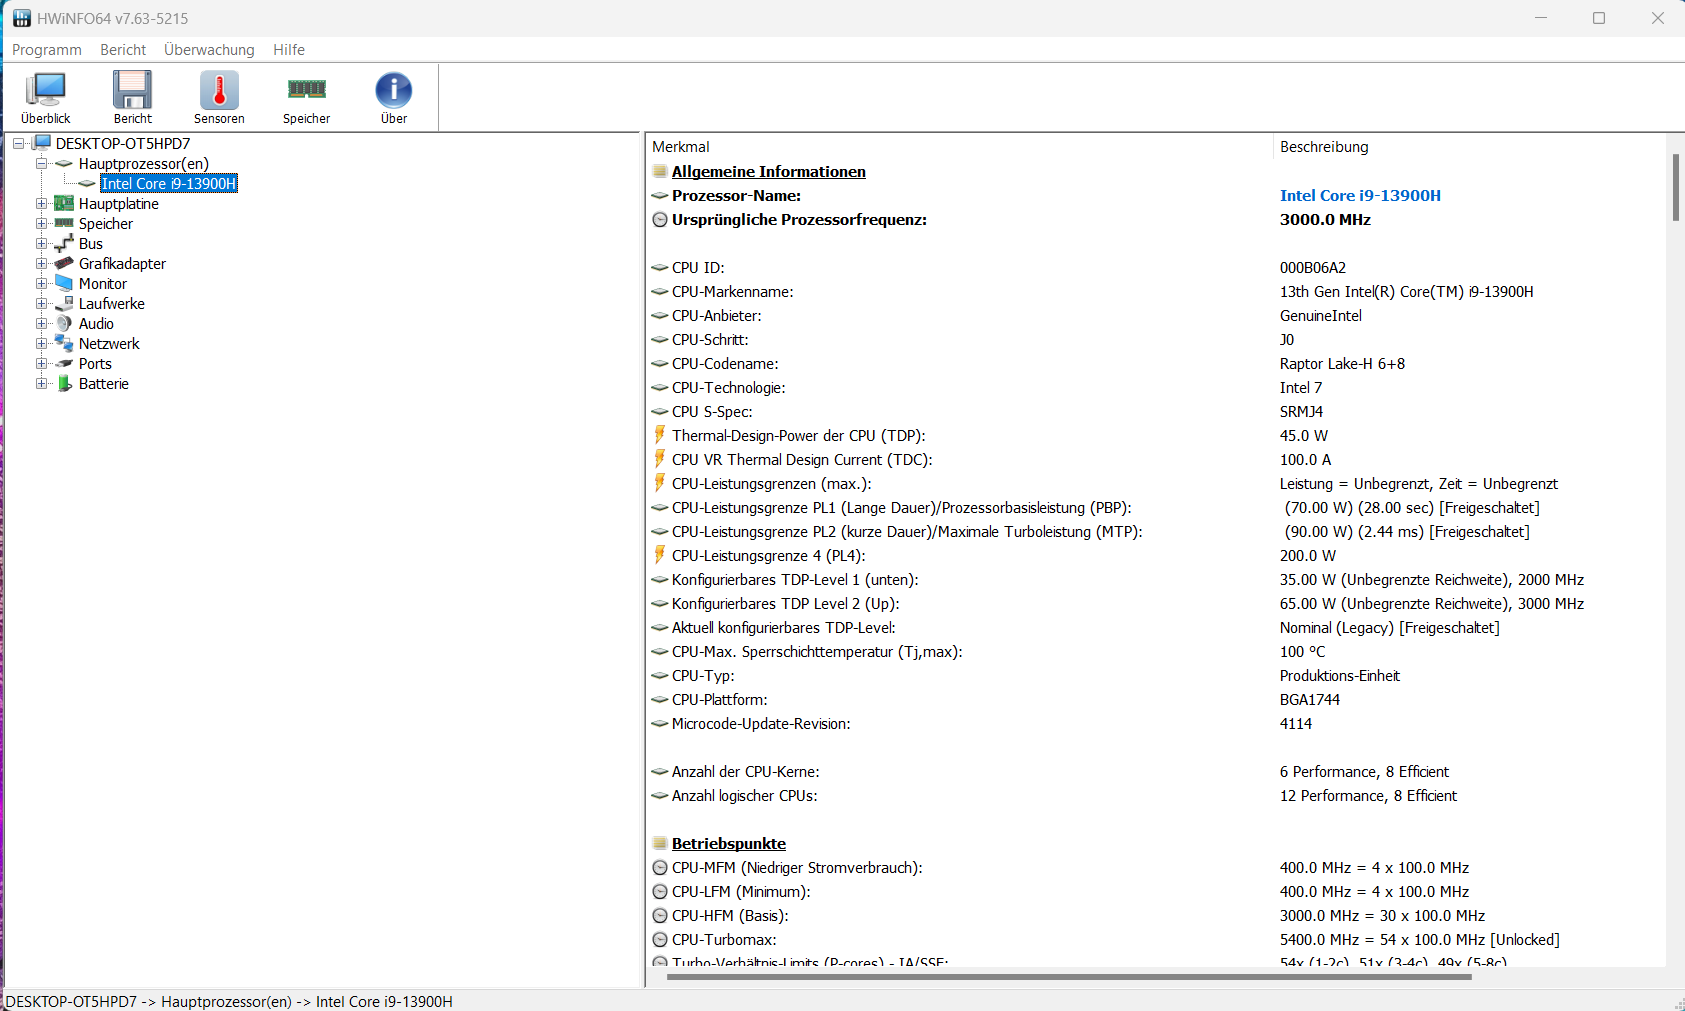
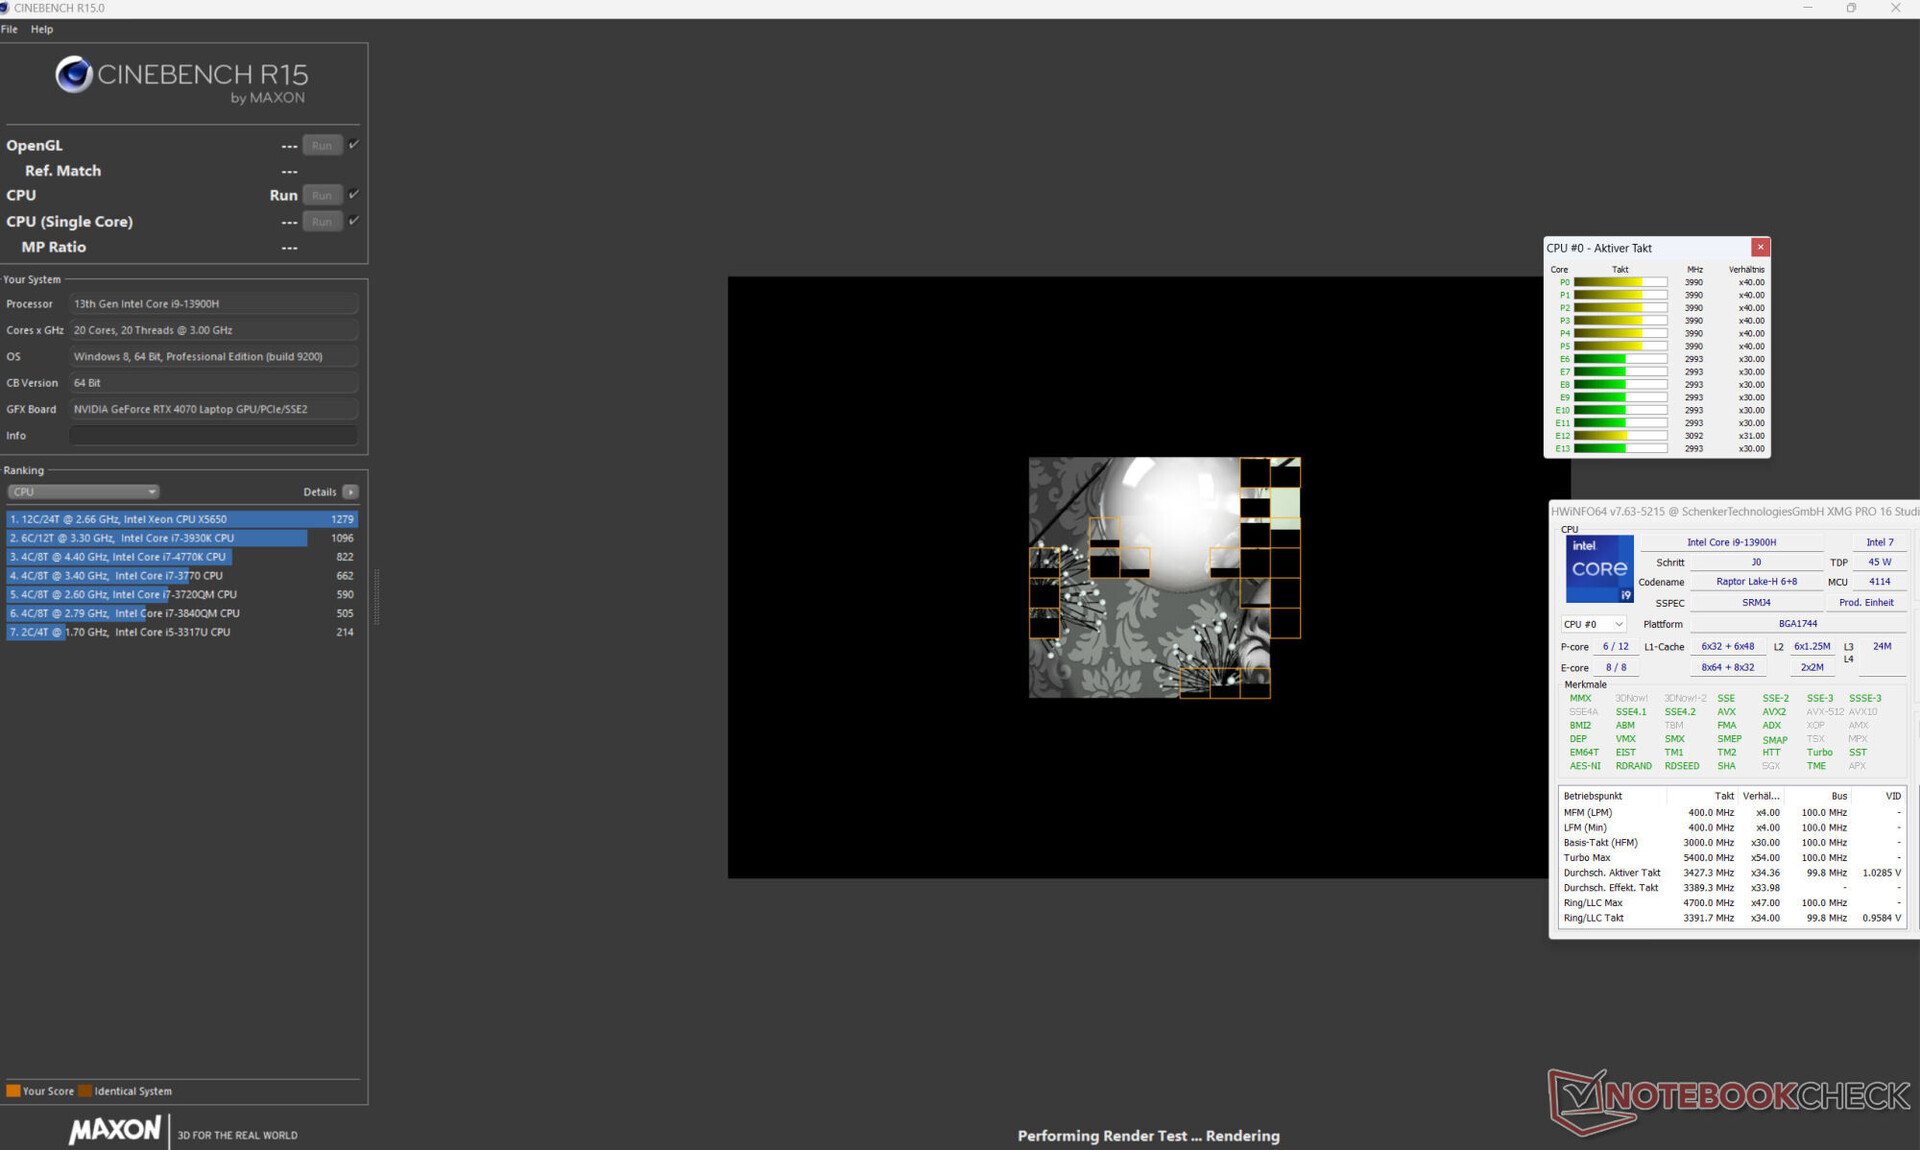
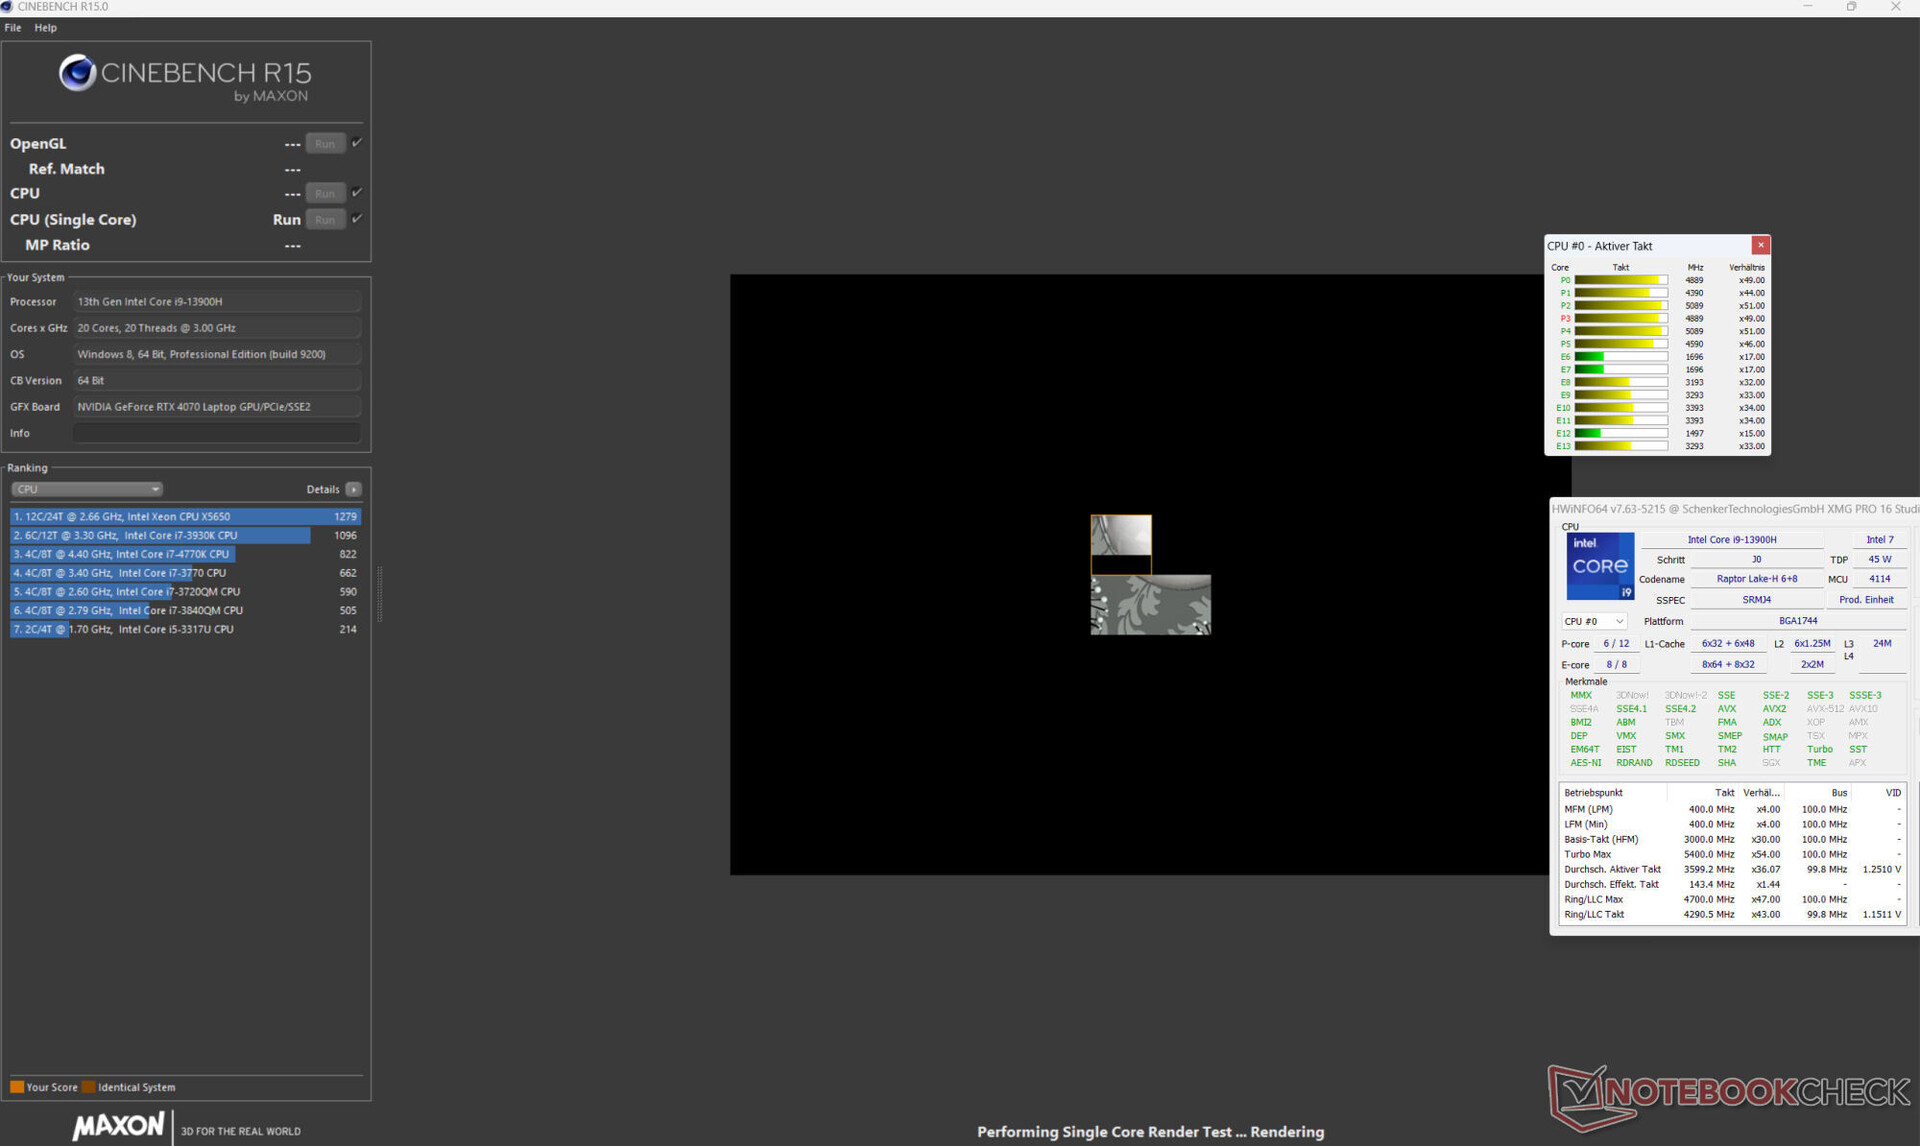
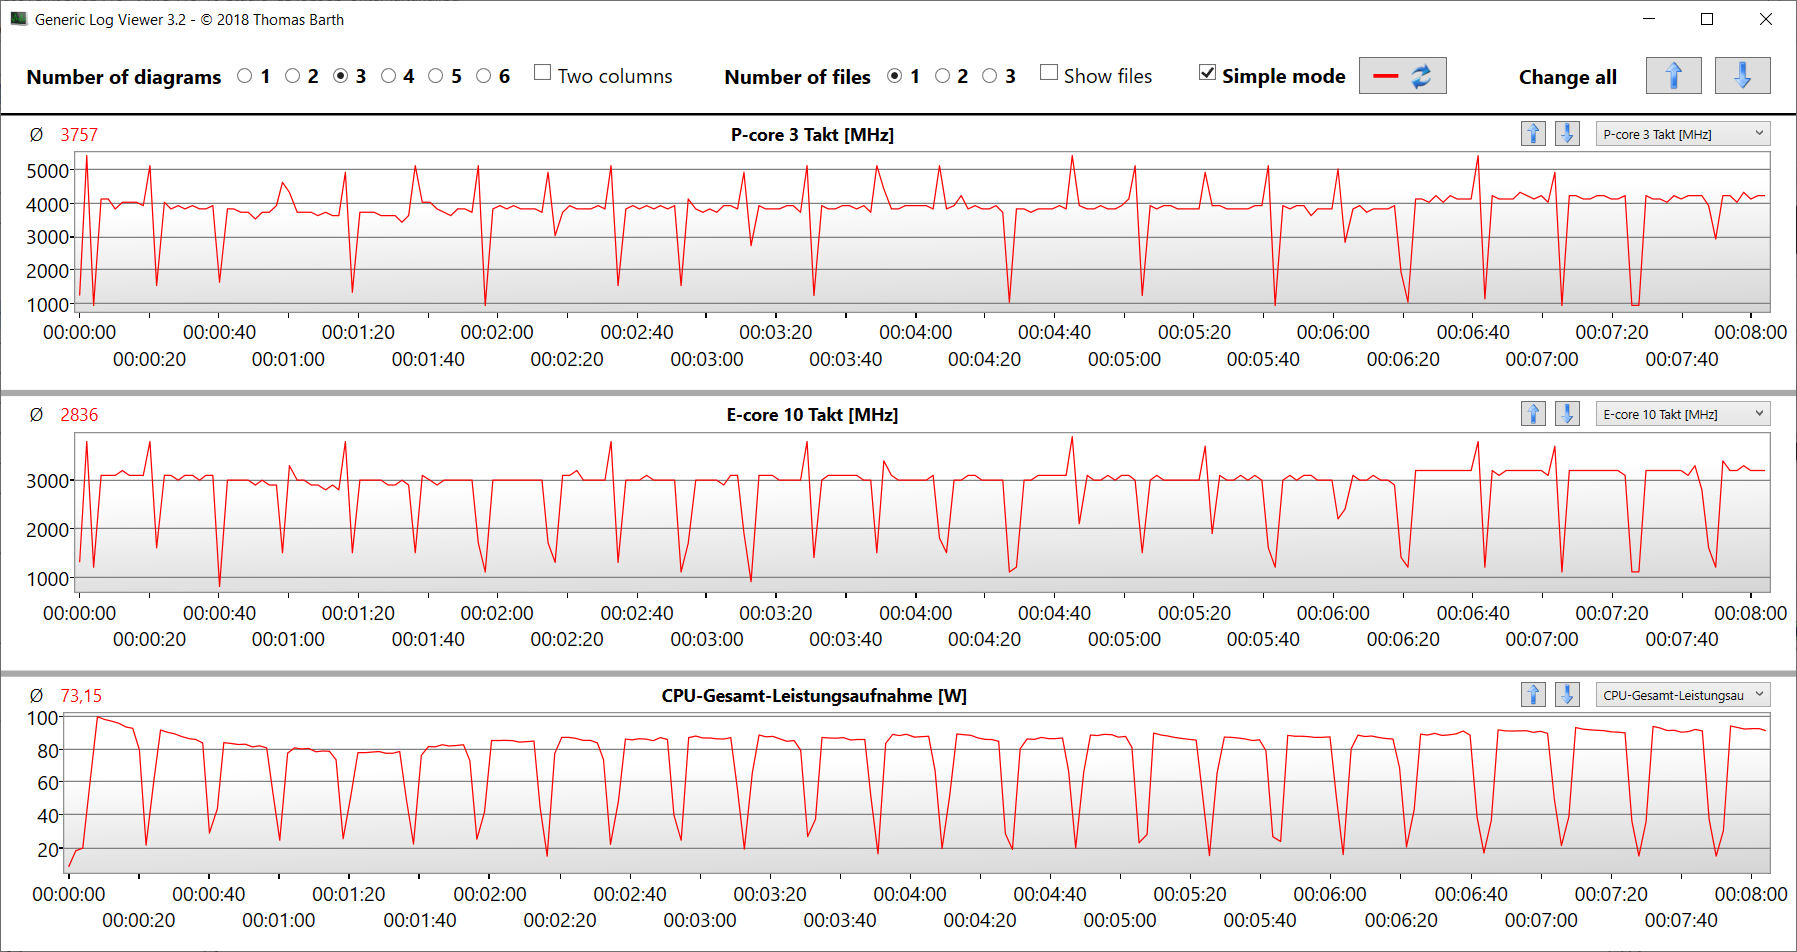
Core i9-139HCore i9-13900Hs (6P, 8E) 14 CPU-kärnor uppnår en maximal klockfrekvens på 5,4 GHz (P) och 4,1 GHz (E). Permanent flertrådsbelastning (CB15 Loop) fick klockfrekvensen att sjunka något från den första till den fjärde körningen. Efter detta förblev värdena konstanta.
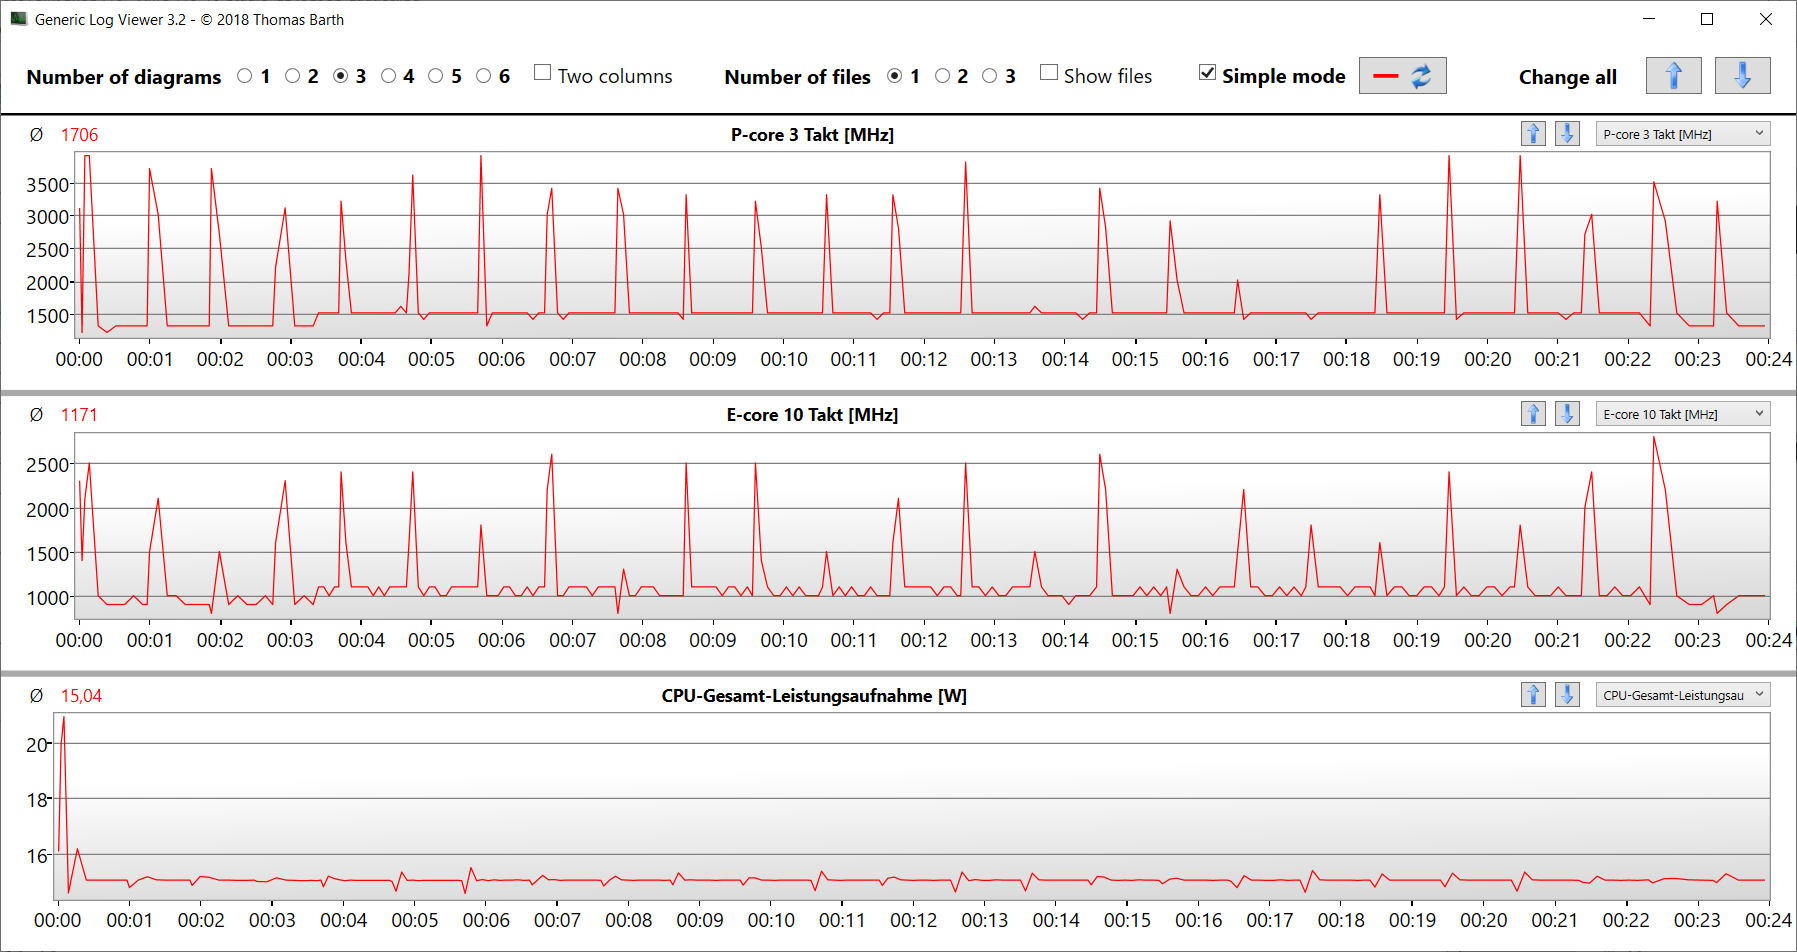
Vi uppmätte benchmarkresultat något över det tidigare fastställda CPU-genomsnittet (anslutet till elnätet). I batteriläge sjönk den mer relevanta single-thread-prestandan (158 poäng; CB15) i större utsträckning än multi-thread-prestandan (1 696 poäng; CB15).
Cinebench R15 Multi continuous test

* ... mindre är bättre
AIDA64: FP32 Ray-Trace | FPU Julia | CPU SHA3 | CPU Queen | FPU SinJulia | FPU Mandel | CPU AES | CPU ZLib | FP64 Ray-Trace | CPU PhotoWorxx
| Performance rating | |
| Genomsnitt av klass Gaming | |
| HP Omen Transcend 16 | |
| Asus Vivobook Pro 16X K6604JV-MX016W | |
| Schenker XMG Pro 16 Studio (Mid 23) | |
| MSI Stealth 16 Studio A13VG | |
| Lenovo Legion Slim 7i 16 Gen 8 | |
| Genomsnitt Intel Core i9-13900H | |
| AIDA64 / FP32 Ray-Trace | |
| Genomsnitt av klass Gaming (10227 - 85542, n=110, senaste 2 åren) | |
| HP Omen Transcend 16 | |
| Asus Vivobook Pro 16X K6604JV-MX016W | |
| MSI Stealth 16 Studio A13VG | |
| Lenovo Legion Slim 7i 16 Gen 8 | |
| Schenker XMG Pro 16 Studio (Mid 23) | |
| Genomsnitt Intel Core i9-13900H (6788 - 19557, n=25) | |
| AIDA64 / FPU Julia | |
| Genomsnitt av klass Gaming (51376 - 238426, n=110, senaste 2 åren) | |
| HP Omen Transcend 16 | |
| Asus Vivobook Pro 16X K6604JV-MX016W | |
| Lenovo Legion Slim 7i 16 Gen 8 | |
| Schenker XMG Pro 16 Studio (Mid 23) | |
| MSI Stealth 16 Studio A13VG | |
| Genomsnitt Intel Core i9-13900H (22551 - 95579, n=25) | |
| AIDA64 / CPU SHA3 | |
| Genomsnitt av klass Gaming (2180 - 9817, n=110, senaste 2 åren) | |
| HP Omen Transcend 16 | |
| Asus Vivobook Pro 16X K6604JV-MX016W | |
| MSI Stealth 16 Studio A13VG | |
| Lenovo Legion Slim 7i 16 Gen 8 | |
| Schenker XMG Pro 16 Studio (Mid 23) | |
| Genomsnitt Intel Core i9-13900H (2491 - 4270, n=25) | |
| AIDA64 / CPU Queen | |
| Asus Vivobook Pro 16X K6604JV-MX016W | |
| HP Omen Transcend 16 | |
| Lenovo Legion Slim 7i 16 Gen 8 | |
| Genomsnitt av klass Gaming (49785 - 173351, n=101, senaste 2 åren) | |
| MSI Stealth 16 Studio A13VG | |
| Genomsnitt Intel Core i9-13900H (65121 - 120936, n=25) | |
| Schenker XMG Pro 16 Studio (Mid 23) | |
| AIDA64 / FPU SinJulia | |
| Genomsnitt av klass Gaming (4424 - 33636, n=110, senaste 2 åren) | |
| Asus Vivobook Pro 16X K6604JV-MX016W | |
| HP Omen Transcend 16 | |
| Lenovo Legion Slim 7i 16 Gen 8 | |
| MSI Stealth 16 Studio A13VG | |
| Schenker XMG Pro 16 Studio (Mid 23) | |
| Genomsnitt Intel Core i9-13900H (6108 - 11631, n=25) | |
| AIDA64 / FPU Mandel | |
| Genomsnitt av klass Gaming (25115 - 128721, n=110, senaste 2 åren) | |
| HP Omen Transcend 16 | |
| Asus Vivobook Pro 16X K6604JV-MX016W | |
| Lenovo Legion Slim 7i 16 Gen 8 | |
| MSI Stealth 16 Studio A13VG | |
| Schenker XMG Pro 16 Studio (Mid 23) | |
| Genomsnitt Intel Core i9-13900H (11283 - 48474, n=25) | |
| AIDA64 / CPU AES | |
| Schenker XMG Pro 16 Studio (Mid 23) | |
| HP Omen Transcend 16 | |
| Asus Vivobook Pro 16X K6604JV-MX016W | |
| Genomsnitt av klass Gaming (39258 - 247074, n=110, senaste 2 åren) | |
| Genomsnitt Intel Core i9-13900H (3691 - 149377, n=25) | |
| MSI Stealth 16 Studio A13VG | |
| Lenovo Legion Slim 7i 16 Gen 8 | |
| AIDA64 / CPU ZLib | |
| HP Omen Transcend 16 | |
| Genomsnitt av klass Gaming (574 - 2531, n=110, senaste 2 åren) | |
| Asus Vivobook Pro 16X K6604JV-MX016W | |
| Lenovo Legion Slim 7i 16 Gen 8 | |
| Schenker XMG Pro 16 Studio (Mid 23) | |
| Genomsnitt Intel Core i9-13900H (789 - 1254, n=25) | |
| MSI Stealth 16 Studio A13VG | |
| AIDA64 / FP64 Ray-Trace | |
| Genomsnitt av klass Gaming (5509 - 45446, n=110, senaste 2 åren) | |
| HP Omen Transcend 16 | |
| Asus Vivobook Pro 16X K6604JV-MX016W | |
| MSI Stealth 16 Studio A13VG | |
| Lenovo Legion Slim 7i 16 Gen 8 | |
| Schenker XMG Pro 16 Studio (Mid 23) | |
| Genomsnitt Intel Core i9-13900H (3655 - 10716, n=25) | |
| AIDA64 / CPU PhotoWorxx | |
| HP Omen Transcend 16 | |
| Schenker XMG Pro 16 Studio (Mid 23) | |
| MSI Stealth 16 Studio A13VG | |
| Genomsnitt av klass Gaming (12271 - 89891, n=110, senaste 2 åren) | |
| Asus Vivobook Pro 16X K6604JV-MX016W | |
| Genomsnitt Intel Core i9-13900H (10871 - 50488, n=25) | |
| Lenovo Legion Slim 7i 16 Gen 8 | |
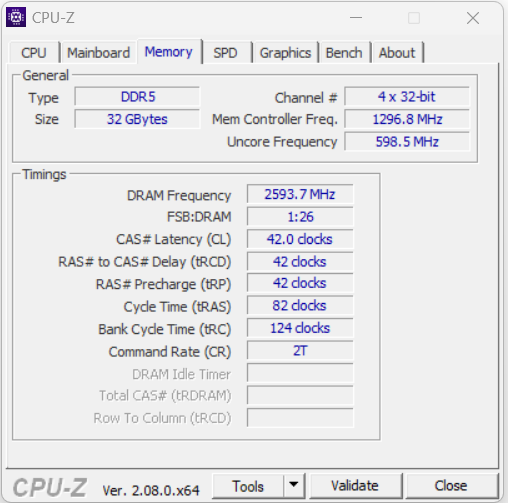
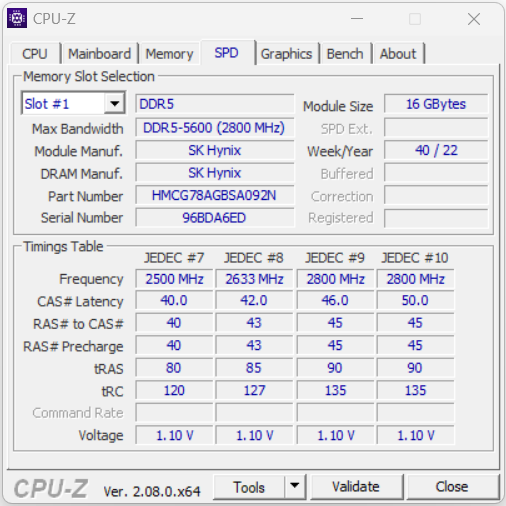
Systemets prestanda
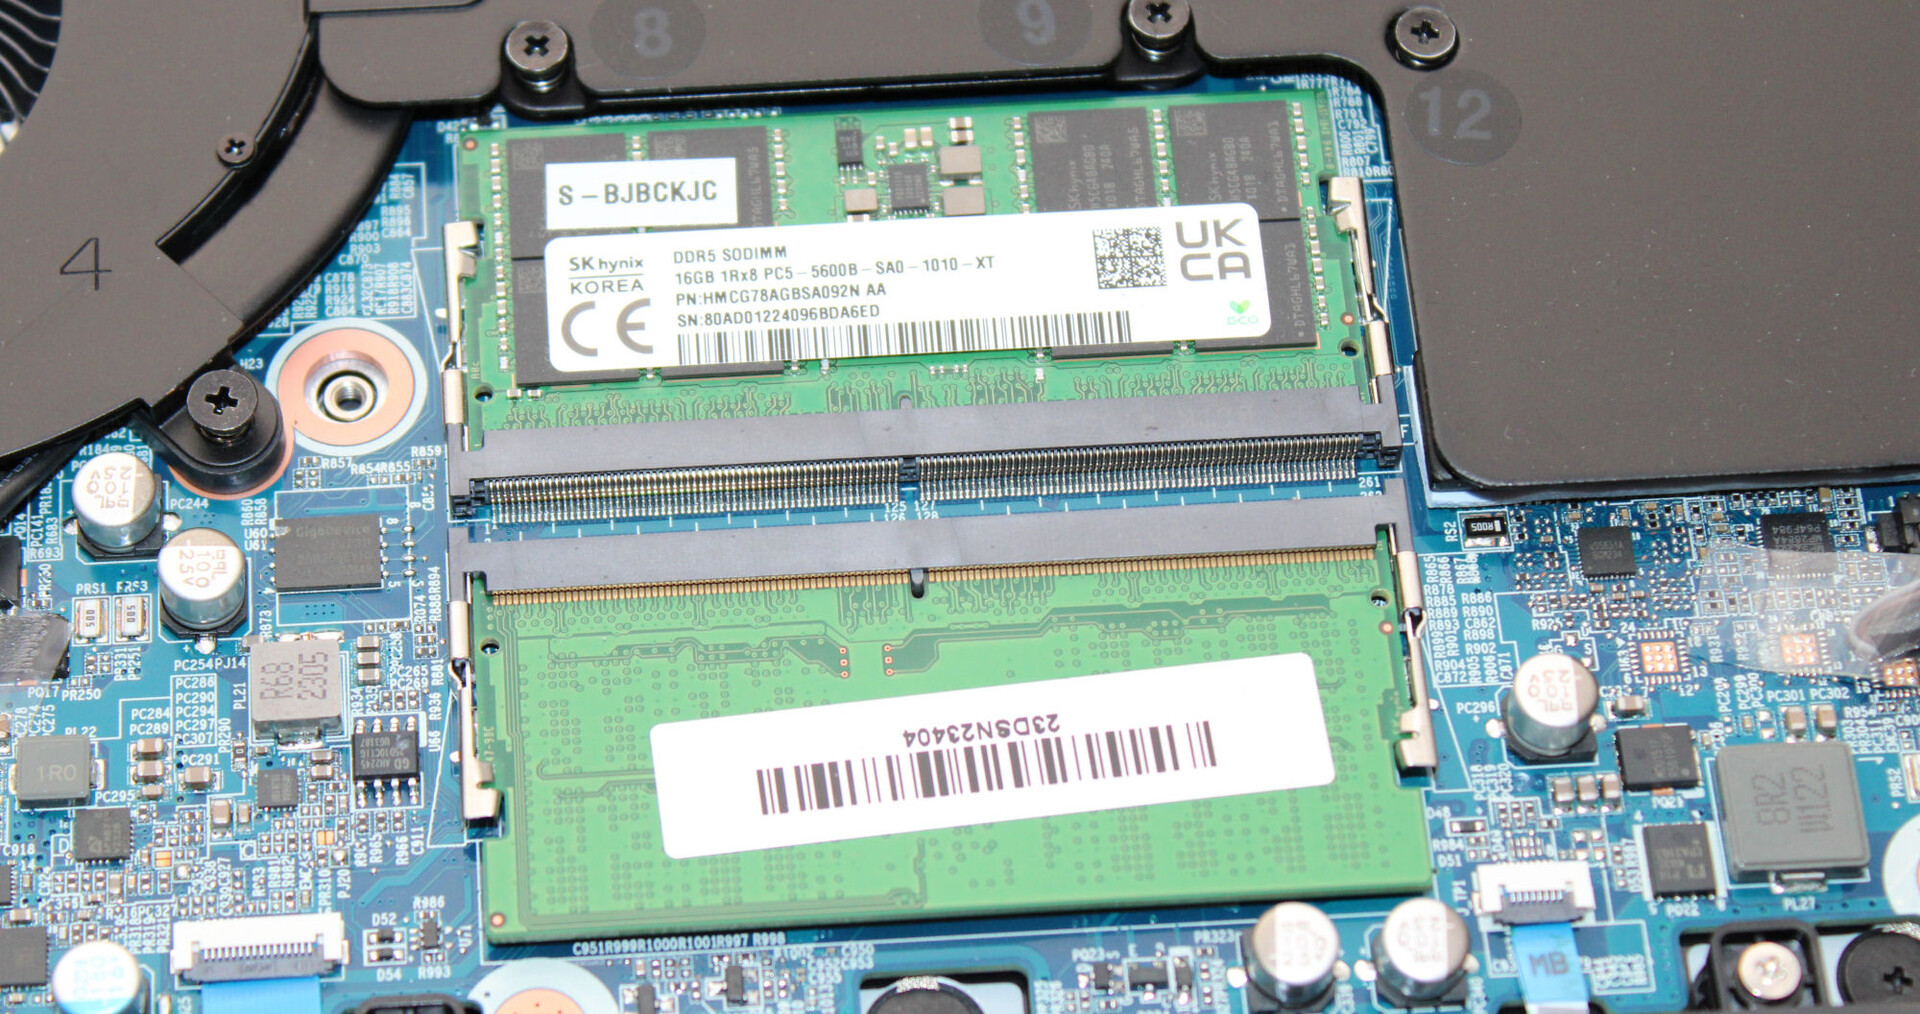
Det smidigt fungerande systemet saknar inte datorkraft. Gaming, rendering och videoredigering hör till datorns kärnkompetenser. RAM-minnets överföringshastighet ligger på en normal nivå för DDR5-5600 RAM-minne.
CrossMark: Overall | Productivity | Creativity | Responsiveness
| PCMark 10 / Score | |
| Lenovo Legion Slim 7i 16 Gen 8 | |
| Genomsnitt av klass Gaming (5828 - 11574, n=96, senaste 2 åren) | |
| HP Omen Transcend 16 | |
| Schenker XMG Pro 16 Studio (Mid 23) | |
| Genomsnitt Intel Core i9-13900H, NVIDIA GeForce RTX 4070 Laptop GPU (5855 - 8538, n=8) | |
| MSI Stealth 16 Studio A13VG | |
| Asus Vivobook Pro 16X K6604JV-MX016W | |
| PCMark 10 / Essentials | |
| Schenker XMG Pro 16 Studio (Mid 23) | |
| Lenovo Legion Slim 7i 16 Gen 8 | |
| HP Omen Transcend 16 | |
| Genomsnitt Intel Core i9-13900H, NVIDIA GeForce RTX 4070 Laptop GPU (8835 - 11940, n=8) | |
| Genomsnitt av klass Gaming (8810 - 12600, n=100, senaste 2 åren) | |
| Asus Vivobook Pro 16X K6604JV-MX016W | |
| MSI Stealth 16 Studio A13VG | |
| PCMark 10 / Productivity | |
| Lenovo Legion Slim 7i 16 Gen 8 | |
| Genomsnitt av klass Gaming (6845 - 18766, n=98, senaste 2 åren) | |
| Schenker XMG Pro 16 Studio (Mid 23) | |
| Genomsnitt Intel Core i9-13900H, NVIDIA GeForce RTX 4070 Laptop GPU (7967 - 10991, n=8) | |
| HP Omen Transcend 16 | |
| MSI Stealth 16 Studio A13VG | |
| Asus Vivobook Pro 16X K6604JV-MX016W | |
| PCMark 10 / Digital Content Creation | |
| Genomsnitt av klass Gaming (7602 - 19657, n=98, senaste 2 åren) | |
| Lenovo Legion Slim 7i 16 Gen 8 | |
| HP Omen Transcend 16 | |
| Genomsnitt Intel Core i9-13900H, NVIDIA GeForce RTX 4070 Laptop GPU (7738 - 13575, n=8) | |
| Schenker XMG Pro 16 Studio (Mid 23) | |
| MSI Stealth 16 Studio A13VG | |
| Asus Vivobook Pro 16X K6604JV-MX016W | |
| CrossMark / Overall | |
| Asus Vivobook Pro 16X K6604JV-MX016W | |
| Genomsnitt av klass Gaming (1366 - 2409, n=98, senaste 2 åren) | |
| Lenovo Legion Slim 7i 16 Gen 8 | |
| HP Omen Transcend 16 | |
| Schenker XMG Pro 16 Studio (Mid 23) | |
| Genomsnitt Intel Core i9-13900H, NVIDIA GeForce RTX 4070 Laptop GPU (1104 - 1974, n=7) | |
| MSI Stealth 16 Studio A13VG | |
| CrossMark / Productivity | |
| Asus Vivobook Pro 16X K6604JV-MX016W | |
| Lenovo Legion Slim 7i 16 Gen 8 | |
| Schenker XMG Pro 16 Studio (Mid 23) | |
| Genomsnitt av klass Gaming (1386 - 2254, n=98, senaste 2 åren) | |
| HP Omen Transcend 16 | |
| Genomsnitt Intel Core i9-13900H, NVIDIA GeForce RTX 4070 Laptop GPU (1058 - 1914, n=7) | |
| MSI Stealth 16 Studio A13VG | |
| CrossMark / Creativity | |
| Asus Vivobook Pro 16X K6604JV-MX016W | |
| HP Omen Transcend 16 | |
| Genomsnitt av klass Gaming (1343 - 2729, n=98, senaste 2 åren) | |
| Lenovo Legion Slim 7i 16 Gen 8 | |
| Schenker XMG Pro 16 Studio (Mid 23) | |
| Genomsnitt Intel Core i9-13900H, NVIDIA GeForce RTX 4070 Laptop GPU (1178 - 2254, n=7) | |
| MSI Stealth 16 Studio A13VG | |
| CrossMark / Responsiveness | |
| Schenker XMG Pro 16 Studio (Mid 23) | |
| Lenovo Legion Slim 7i 16 Gen 8 | |
| Genomsnitt av klass Gaming (1226 - 2334, n=98, senaste 2 åren) | |
| Asus Vivobook Pro 16X K6604JV-MX016W | |
| Genomsnitt Intel Core i9-13900H, NVIDIA GeForce RTX 4070 Laptop GPU (1037 - 1952, n=7) | |
| MSI Stealth 16 Studio A13VG | |
| HP Omen Transcend 16 | |
| PCMark 10 Score | 8010 poäng | |
Hjälp | ||
| AIDA64 / Memory Copy | |
| HP Omen Transcend 16 | |
| Genomsnitt av klass Gaming (21750 - 129946, n=110, senaste 2 åren) | |
| Schenker XMG Pro 16 Studio (Mid 23) | |
| MSI Stealth 16 Studio A13VG | |
| Asus Vivobook Pro 16X K6604JV-MX016W | |
| Genomsnitt Intel Core i9-13900H (37448 - 74486, n=25) | |
| Lenovo Legion Slim 7i 16 Gen 8 | |
| AIDA64 / Memory Read | |
| HP Omen Transcend 16 | |
| Asus Vivobook Pro 16X K6604JV-MX016W | |
| Schenker XMG Pro 16 Studio (Mid 23) | |
| Genomsnitt av klass Gaming (22956 - 118858, n=110, senaste 2 åren) | |
| MSI Stealth 16 Studio A13VG | |
| Genomsnitt Intel Core i9-13900H (41599 - 75433, n=25) | |
| Lenovo Legion Slim 7i 16 Gen 8 | |
| AIDA64 / Memory Write | |
| HP Omen Transcend 16 | |
| Genomsnitt av klass Gaming (22297 - 135096, n=110, senaste 2 åren) | |
| Schenker XMG Pro 16 Studio (Mid 23) | |
| MSI Stealth 16 Studio A13VG | |
| Asus Vivobook Pro 16X K6604JV-MX016W | |
| Genomsnitt Intel Core i9-13900H (36152 - 88505, n=25) | |
| Lenovo Legion Slim 7i 16 Gen 8 | |
| AIDA64 / Memory Latency | |
| Genomsnitt av klass Gaming (75.3 - 259, n=110, senaste 2 åren) | |
| Asus Vivobook Pro 16X K6604JV-MX016W | |
| Genomsnitt Intel Core i9-13900H (75.8 - 102.3, n=25) | |
| HP Omen Transcend 16 | |
| MSI Stealth 16 Studio A13VG | |
| Schenker XMG Pro 16 Studio (Mid 23) | |
| Lenovo Legion Slim 7i 16 Gen 8 | |
* ... mindre är bättre
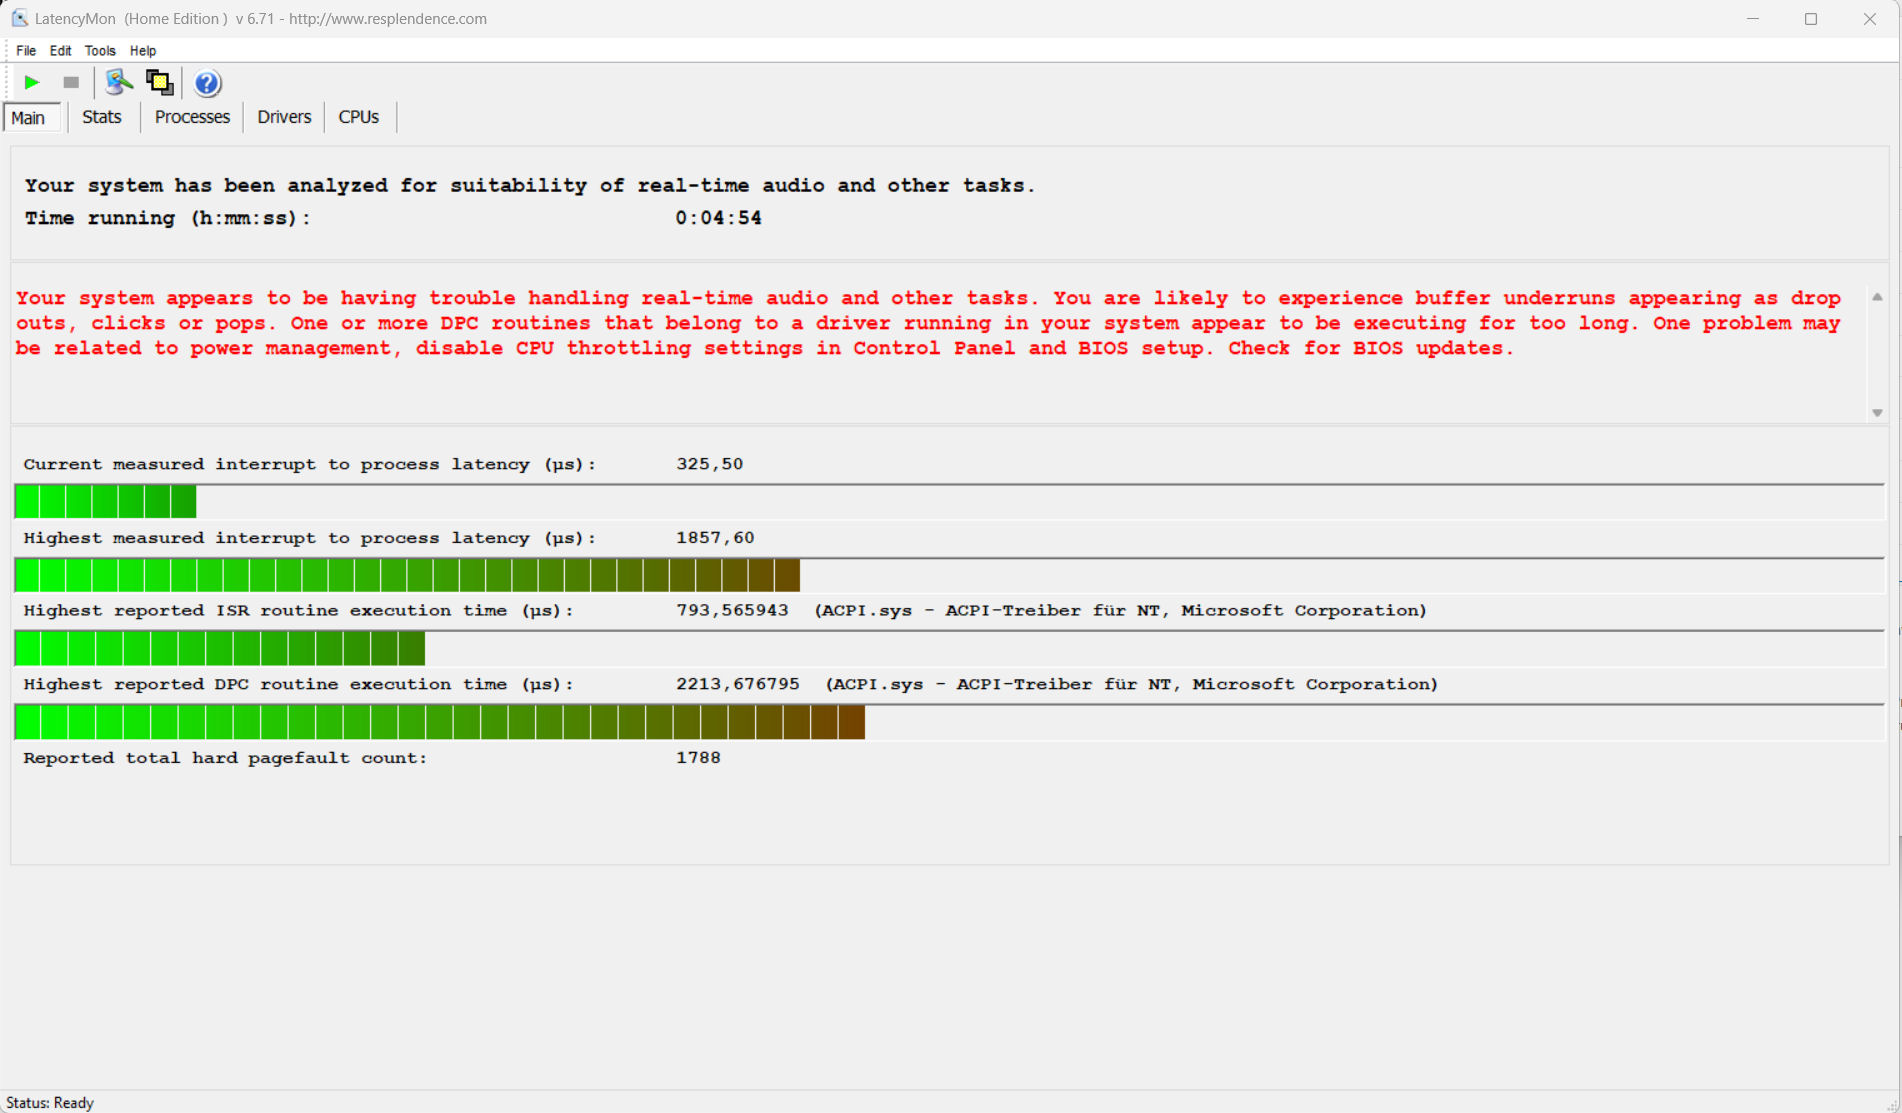
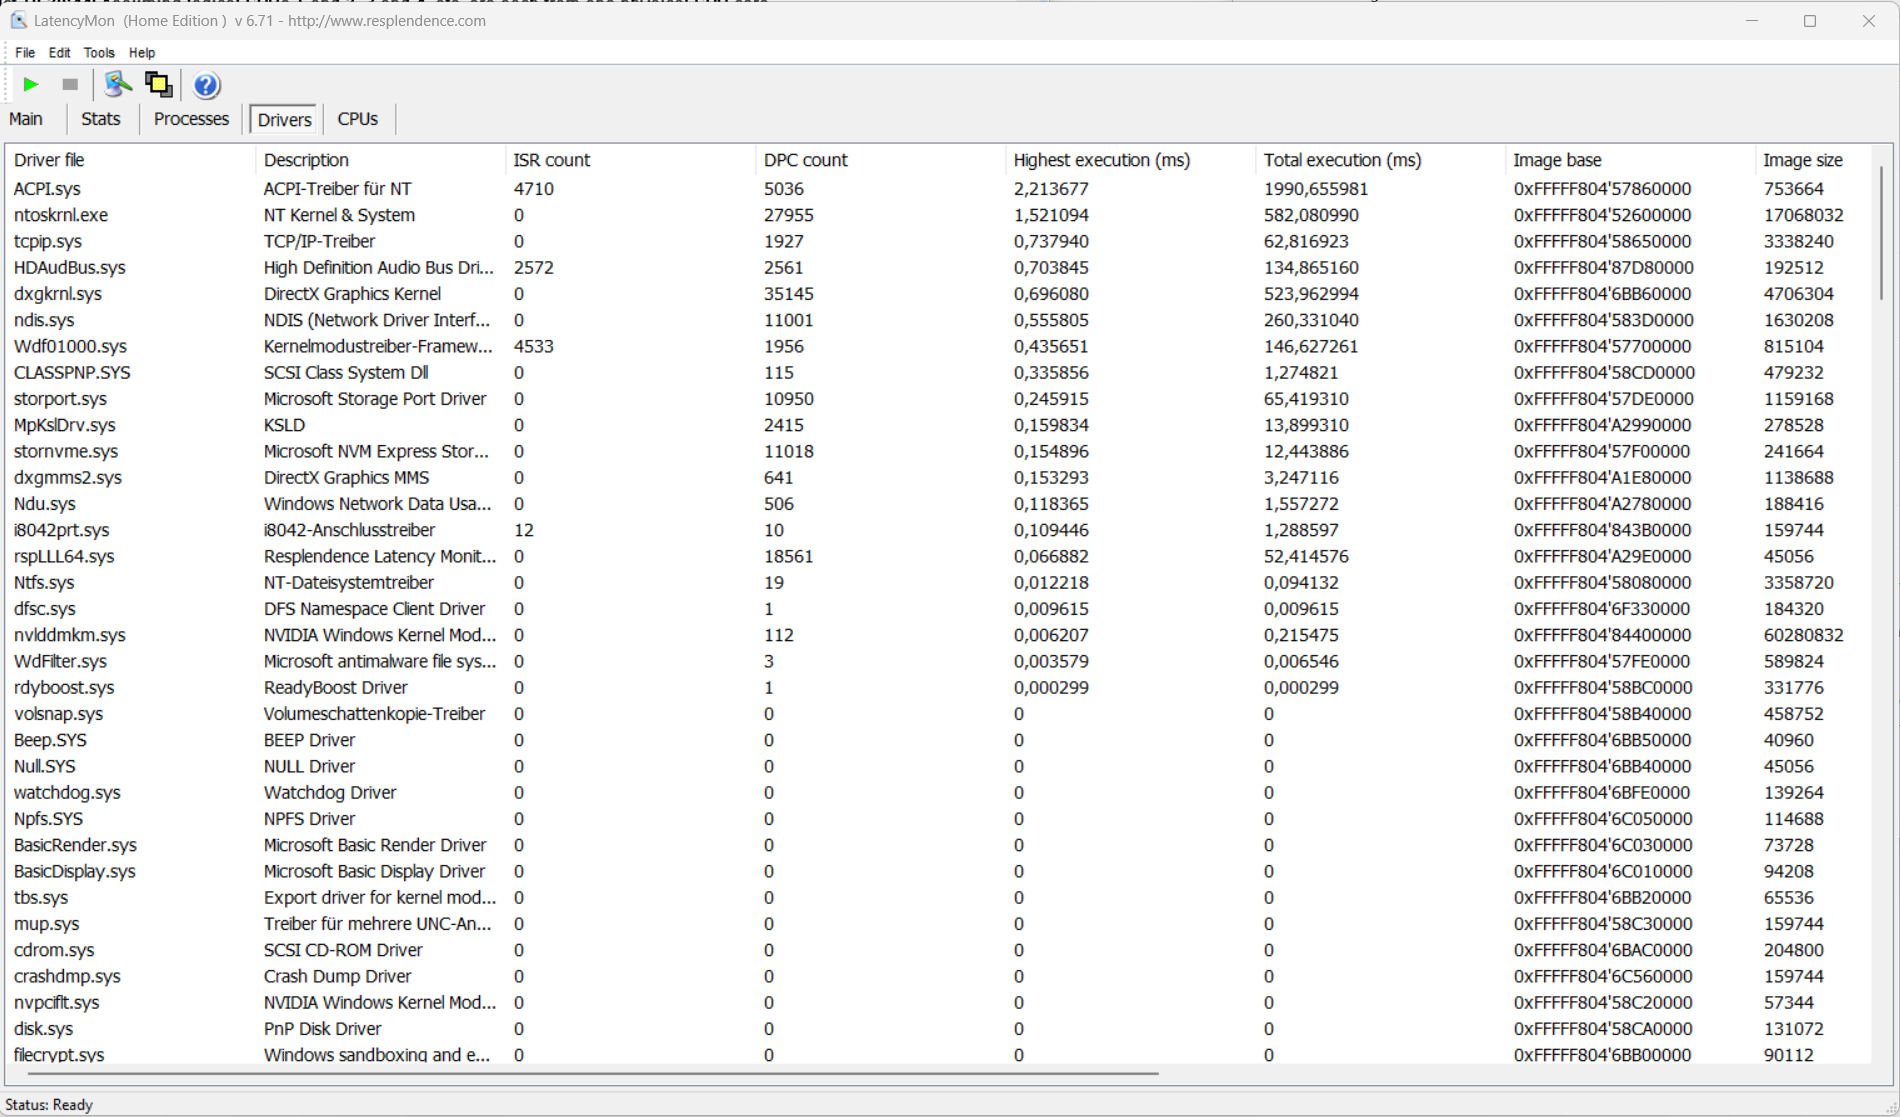
DPC-fördröjning
Det standardiserade latency monitor-testet (webbsurfning, uppspelning av 4k-video, Prime95 high-load) avslöjade några avvikelser. Systemet verkar inte vara lämpligt för video- och ljudredigering i realtid. Framtida programuppdateringar kan leda till förbättringar eller till och med försämringar.
| DPC Latencies / LatencyMon - interrupt to process latency (max), Web, Youtube, Prime95 | |
| MSI Stealth 16 Studio A13VG | |
| Lenovo Legion Slim 7i 16 Gen 8 | |
| Asus Vivobook Pro 16X K6604JV-MX016W | |
| Schenker XMG Pro 16 Studio (Mid 23) | |
| HP Omen Transcend 16 | |
* ... mindre är bättre
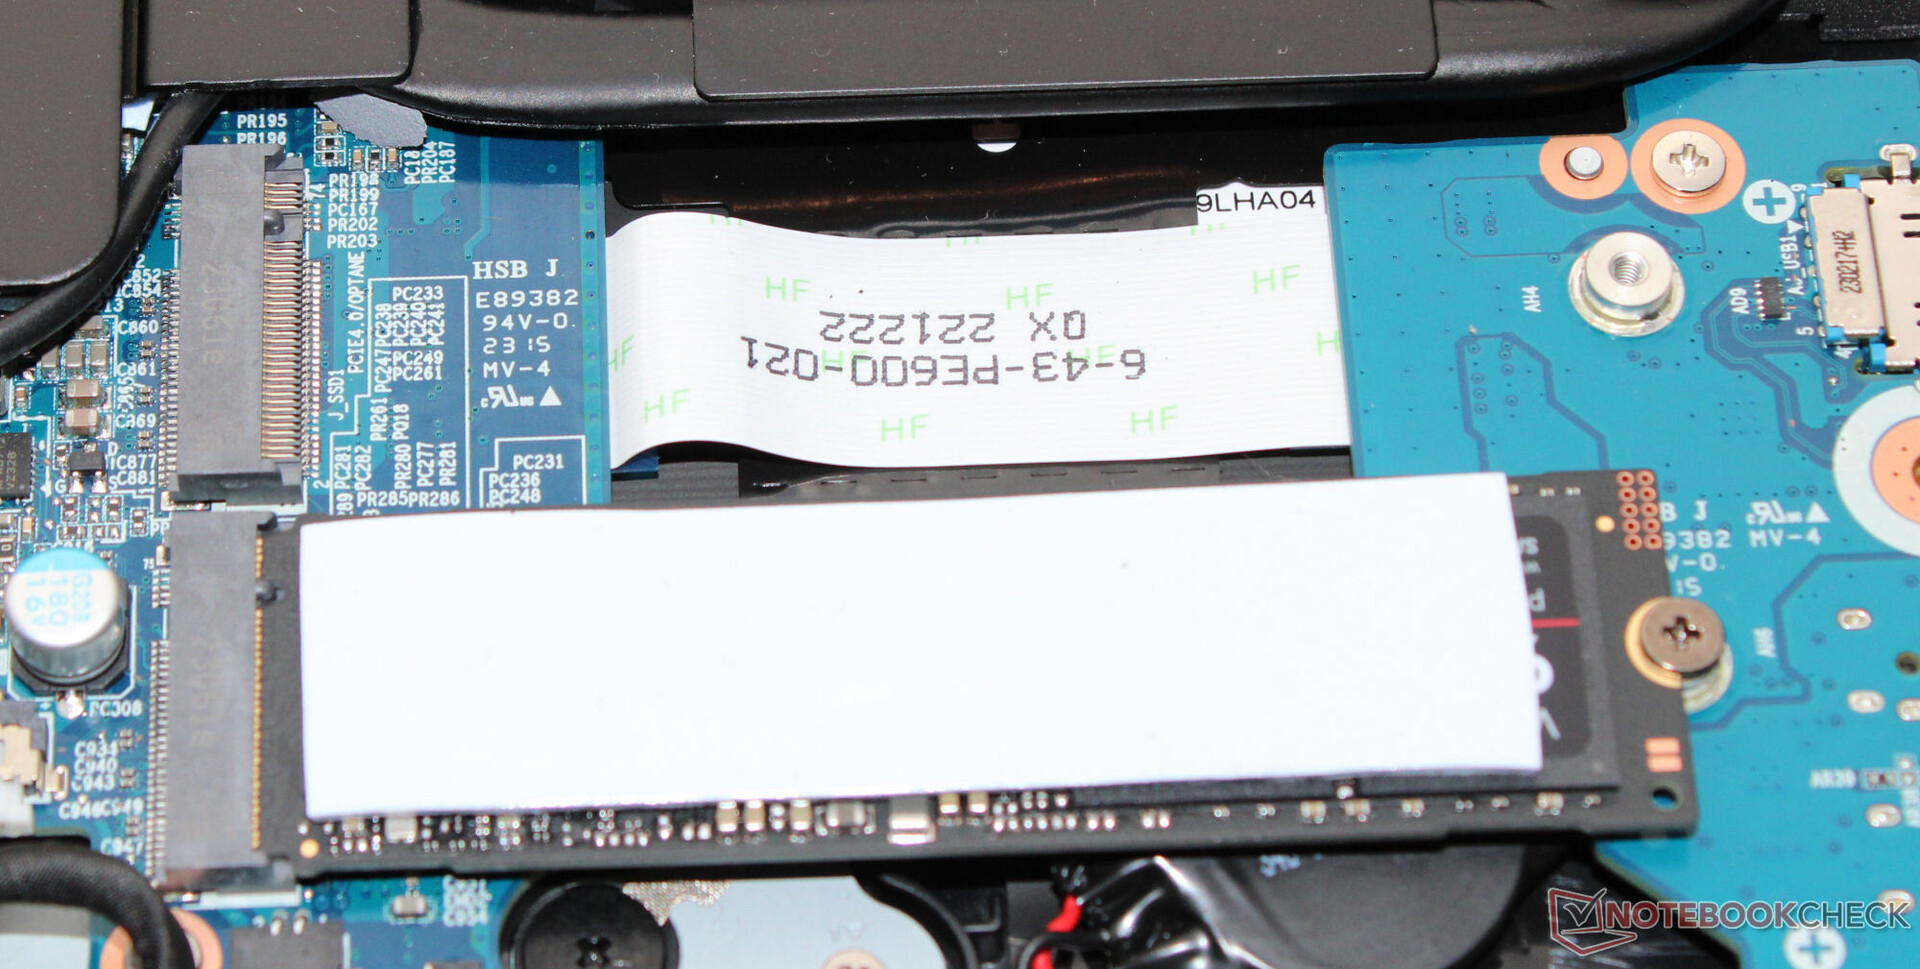
Lagringsenheter
Pro 16 har plats för totalt två PCIe 4 SSD-enheter med formatet M.2-2280. RAID-0/1 stöds. Samsung SSD (1 TB, PCIe 4, M.2-2280) i vår testenhet levererade utmärkta överföringshastigheter. Positivt: Termisk strypning inträffade inte.

* ... mindre är bättre
Reading continuous performance: DiskSpd Read Loop, Queue Depth 8
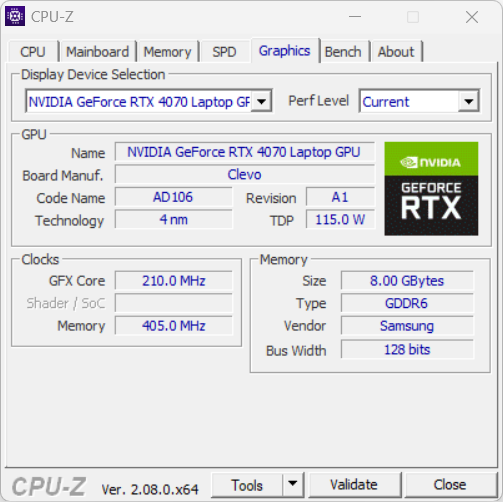
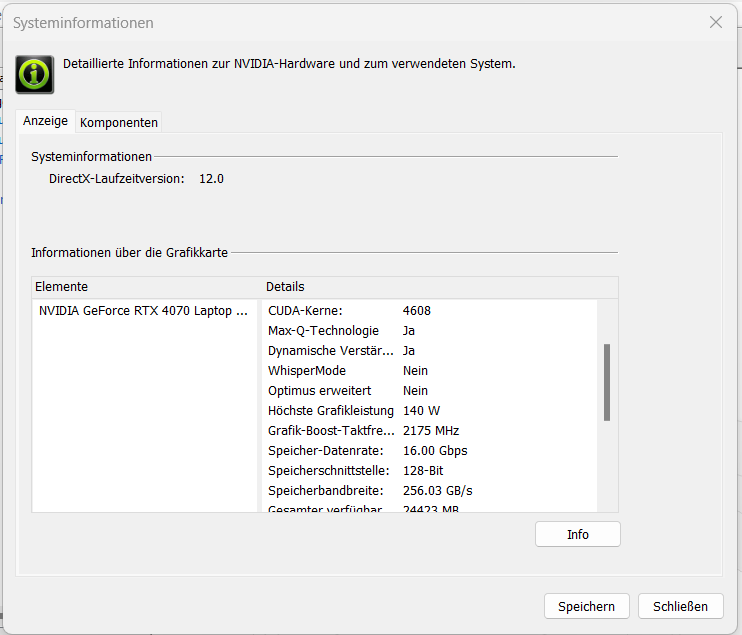
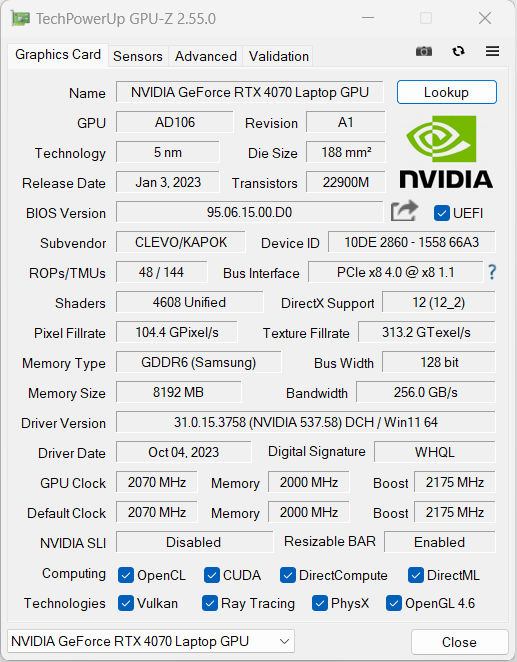
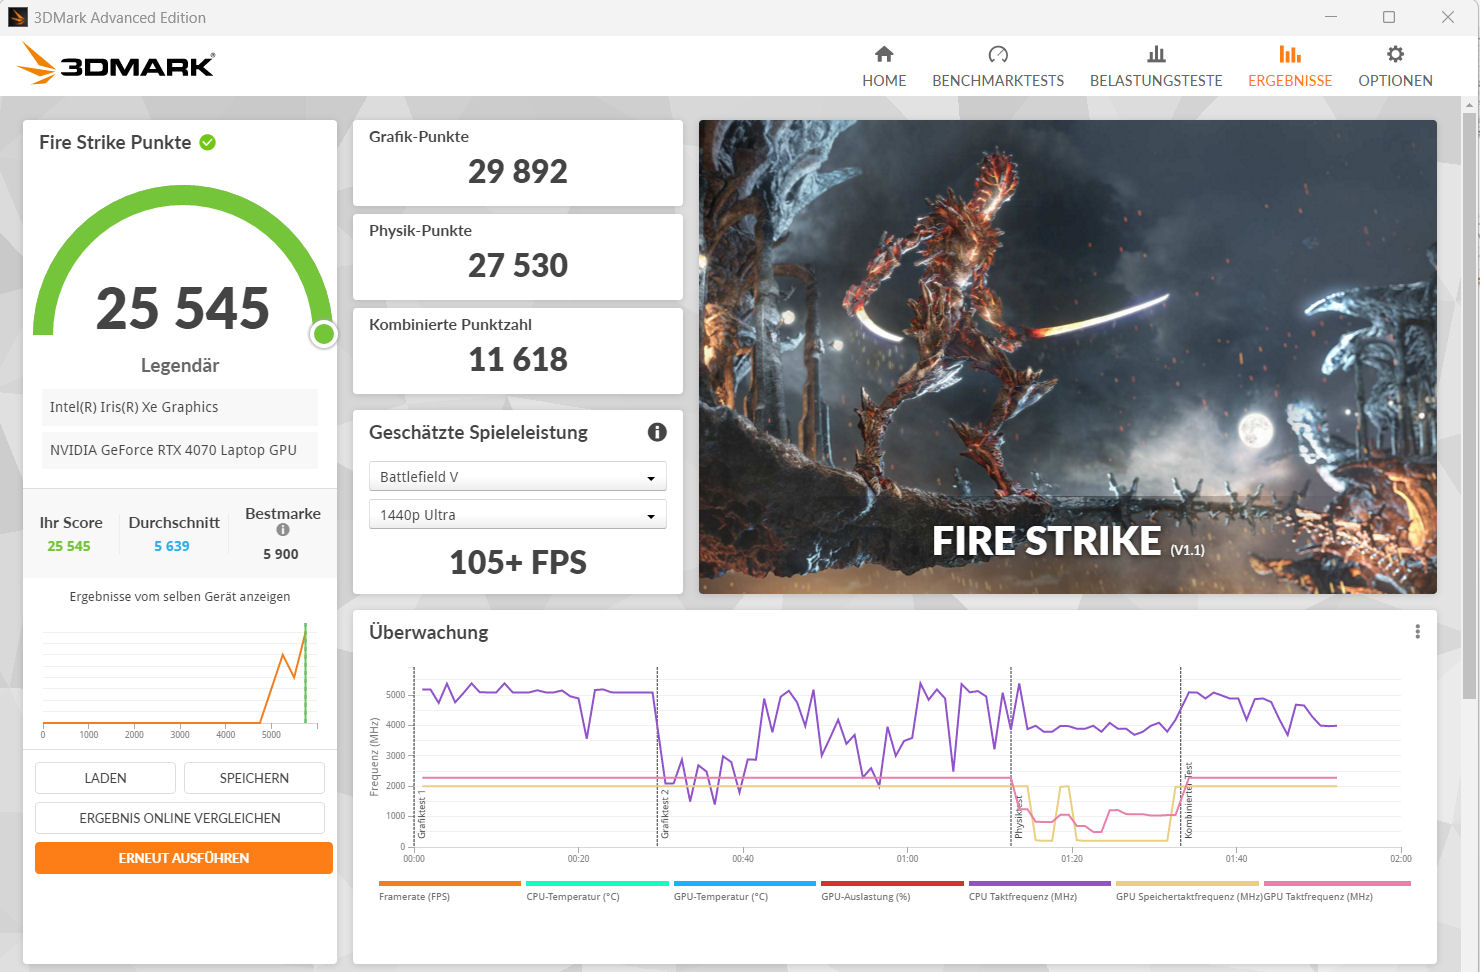
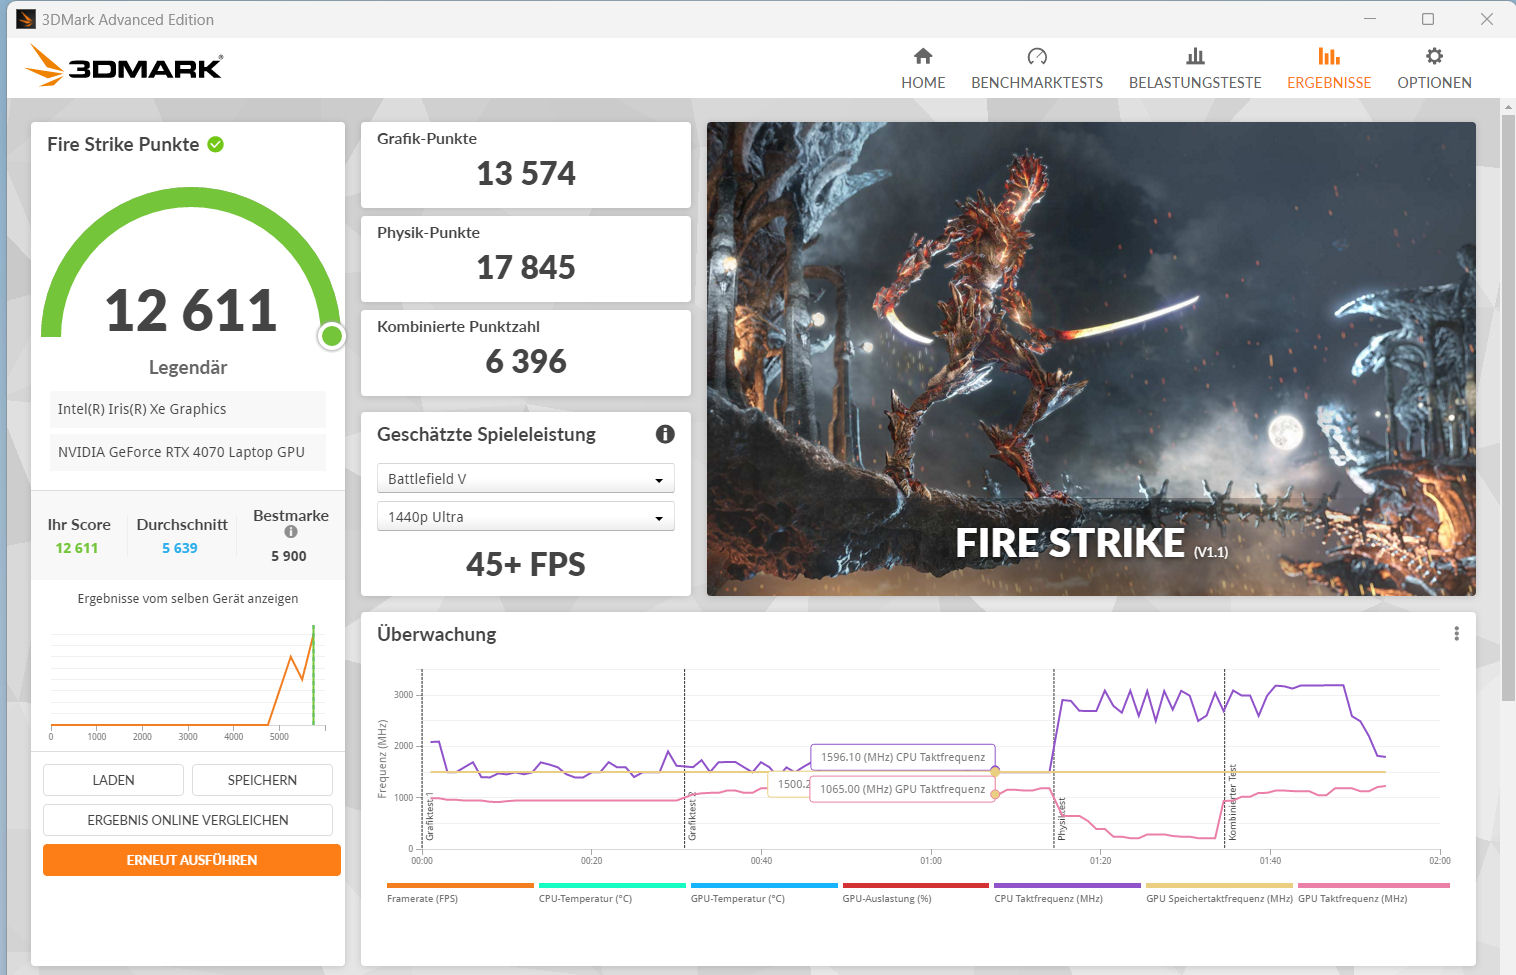
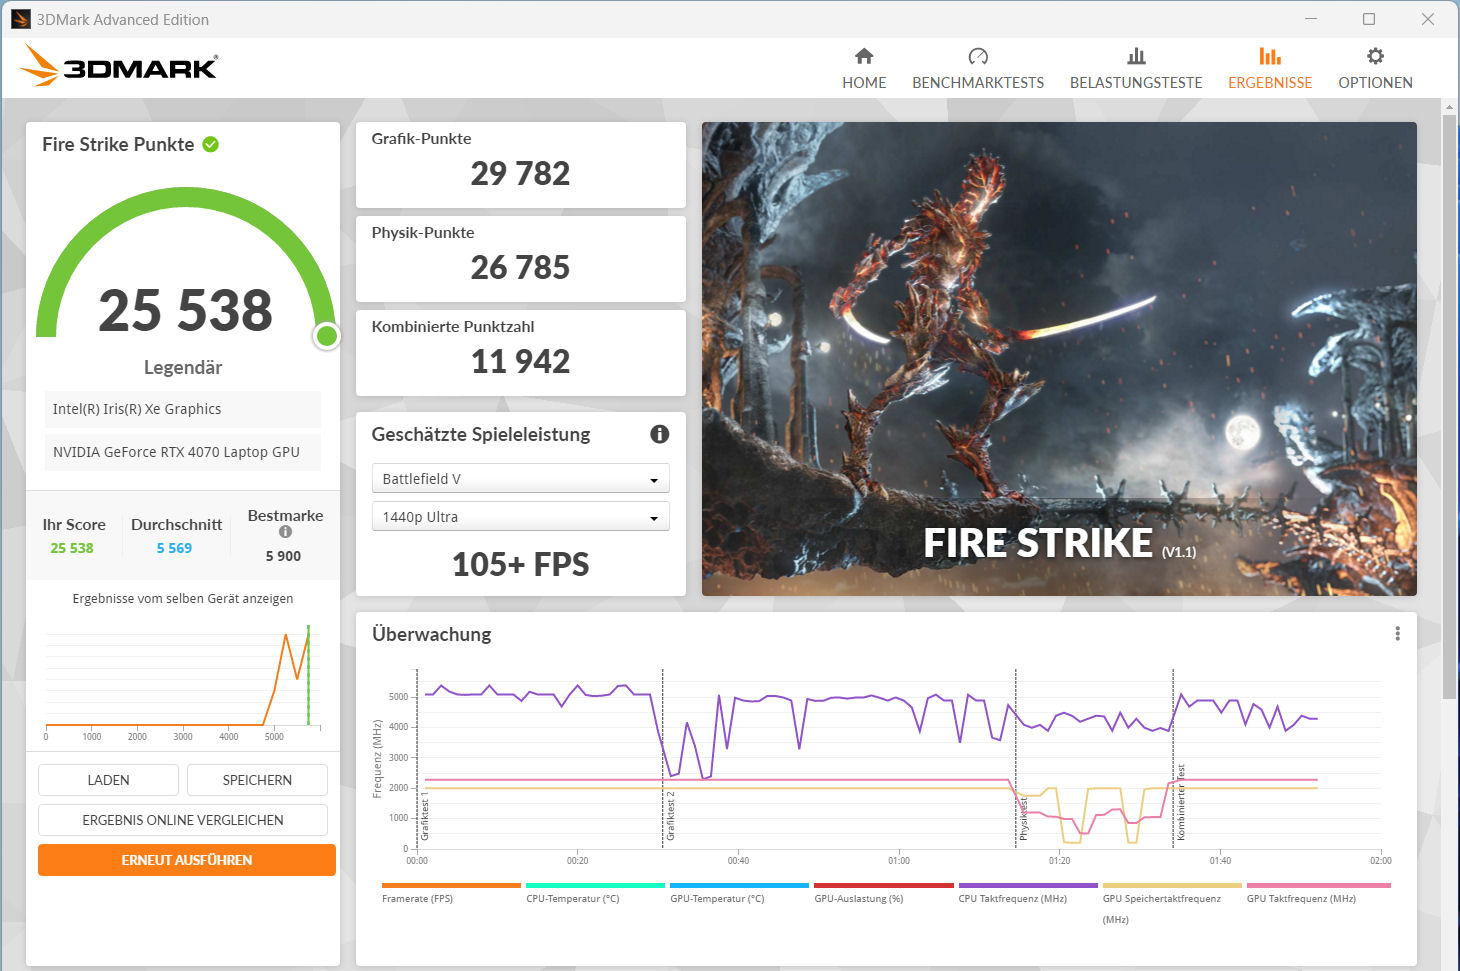
Grafikkort
RTX 4070GeForce RTX 4070 har 4 608 shaders, en 128 bit bred buss och snabb GDDR6 RAM (8 192 MB). Schenker har satt sin maximala TGP till 140 watt (115 watt + 25 watt Dynamic Boost) - mer är inte möjligt.
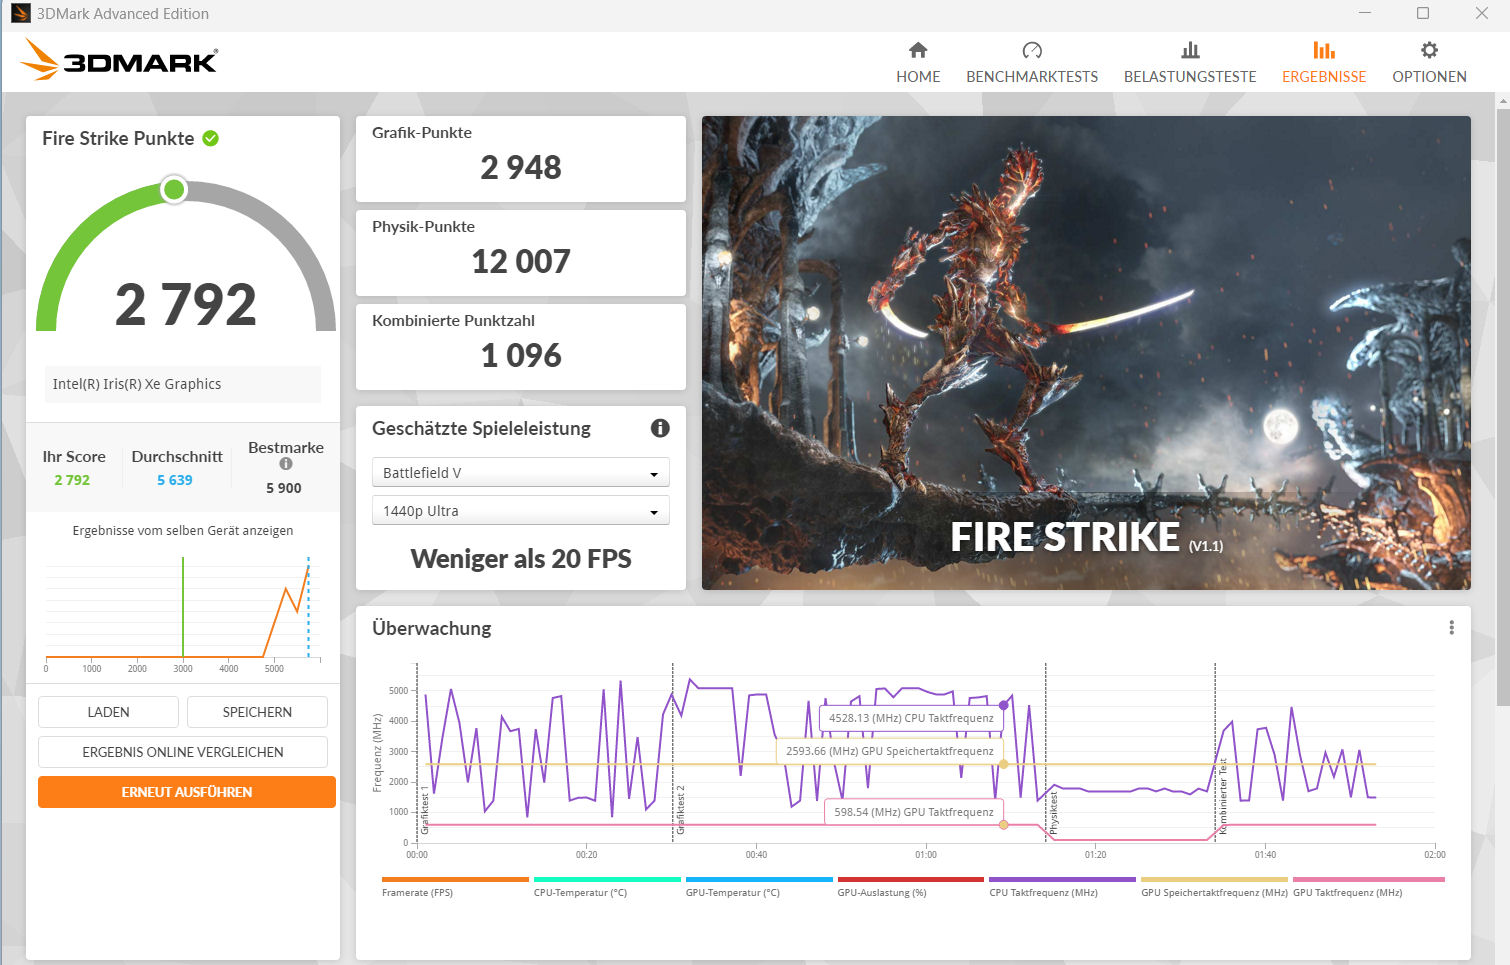
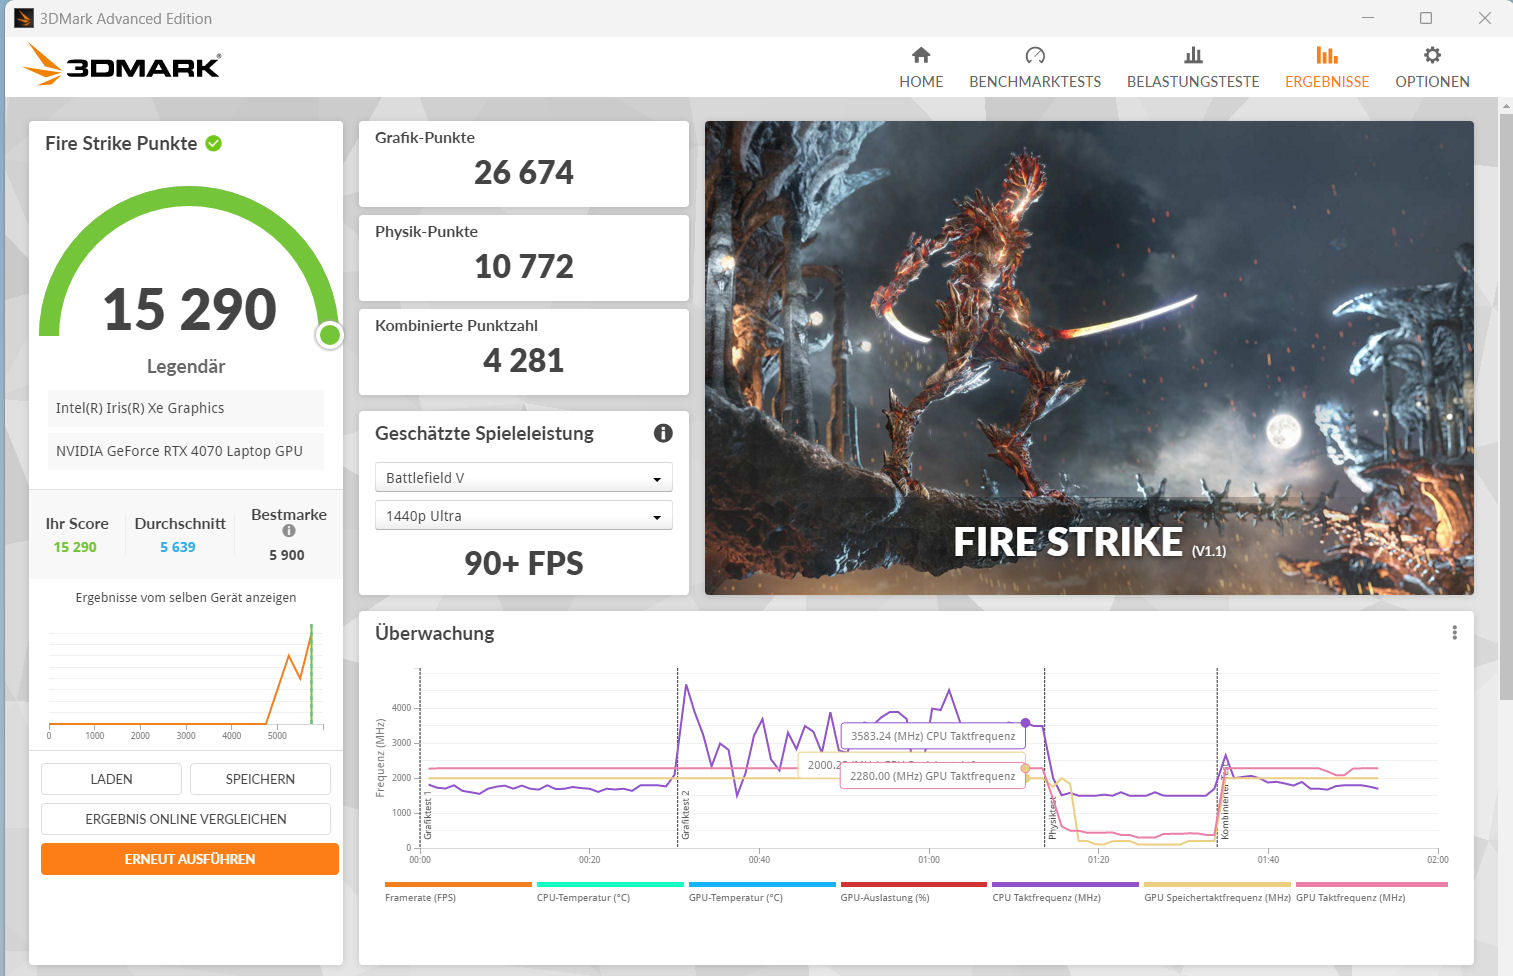
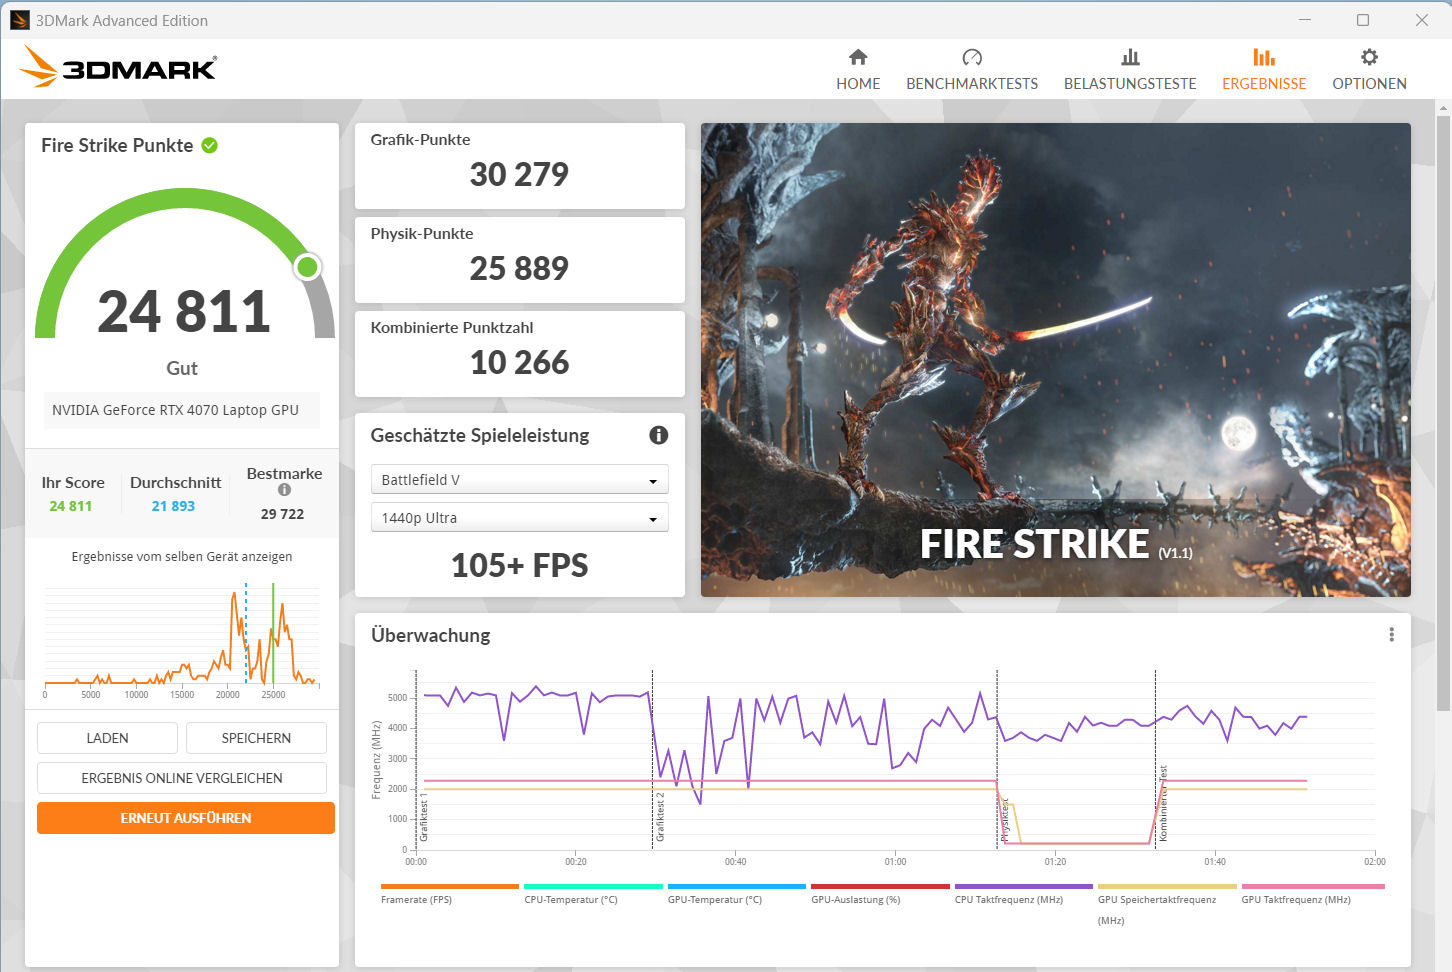
Grafikkärnan möjliggör QHD-spel med höga till maximala inställningar. På så sätt uppnår den bildfrekvenser över det tidigare fastställda RTX 4070-genomsnittet. Användning av dGPU-läge (aktiveras via BIOS) leder till en liten ökning av prestandan. Grafikkärnan och minnet kan överklockas via Control Center (Performance Mode -> klicka på de nedåtriktade pilarna). Advanced Optimus stöds inte.
| 3DMark 06 Standard Score | 54913 poäng | |
| 3DMark 11 Performance | 34302 poäng | |
| 3DMark Cloud Gate Standard Score | 62061 poäng | |
| 3DMark Fire Strike Score | 25545 poäng | |
| 3DMark Time Spy Score | 12134 poäng | |
Hjälp | ||
* ... mindre är bättre
| The Witcher 3 - 1920x1080 Ultra Graphics & Postprocessing (HBAO+) | |
| Genomsnitt av klass Gaming (95 - 240, n=8, senaste 2 åren) | |
| MSI Stealth 16 Studio A13VG | |
| Schenker XMG Pro 16 Studio (Mid 23) | |
| Lenovo Legion Slim 7i 16 Gen 8 | |
| Genomsnitt NVIDIA GeForce RTX 4070 Laptop GPU (69.8 - 133.7, n=57) | |
| HP Omen Transcend 16 | |
| Asus Vivobook Pro 16X K6604JV-MX016W | |
| Lies of P | |
| 1920x1080 Best Preset | |
| Genomsnitt NVIDIA GeForce RTX 4070 Laptop GPU (137.4 - 148.1, n=4) | |
| Schenker XMG Pro 16 Studio (Mid 23) | |
| 2560x1440 Best Preset | |
| Genomsnitt NVIDIA GeForce RTX 4070 Laptop GPU (97.2 - 98.8, n=4) | |
| Schenker XMG Pro 16 Studio (Mid 23) | |
| Assassin's Creed Mirage | |
| 1920x1080 Ultra High Preset (Adaptive Quality Off) | |
| Schenker XMG Pro 16 Studio (Mid 23) | |
| Genomsnitt NVIDIA GeForce RTX 4070 Laptop GPU (91 - 99, n=6) | |
| 2560x1440 Ultra High Preset (Adaptive Quality Off) | |
| Genomsnitt NVIDIA GeForce RTX 4070 Laptop GPU (73 - 80, n=6) | |
| Schenker XMG Pro 16 Studio (Mid 23) | |
| Lords of the Fallen | |
| 1920x1080 Ultra Preset | |
| Genomsnitt NVIDIA GeForce RTX 4070 Laptop GPU (44.3 - 67.7, n=4) | |
| Schenker XMG Pro 16 Studio (Mid 23) | |
| 2560x1440 Ultra Preset | |
| Genomsnitt NVIDIA GeForce RTX 4070 Laptop GPU (29.1 - 47.1, n=4) | |
| Schenker XMG Pro 16 Studio (Mid 23) | |
Witcher 3 FPS diagram
| låg | med. | hög | ultra | QHD | |
|---|---|---|---|---|---|
| GTA V (2015) | 186.8 | 185.9 | 181.3 | 125.4 | 93.2 |
| The Witcher 3 (2015) | 474.9 | 365.4 | 231.4 | 118.4 | 86.9 |
| Dota 2 Reborn (2015) | 210 | 187.5 | 176.5 | 162.8 | |
| Final Fantasy XV Benchmark (2018) | 219 | 159.8 | 115.5 | 84.1 | |
| X-Plane 11.11 (2018) | 166.7 | 146.4 | 119.5 | ||
| Strange Brigade (2018) | 544 | 280 | 232 | 202 | 132.8 |
| Cyberpunk 2077 1.6 (2022) | 147 | 115 | 95.3 | 86.7 | 55.4 |
| Returnal (2023) | 115 | 112 | 101 | 85 | 63 |
| F1 23 (2023) | 279 | 261 | 198.2 | 67.6 | 45.6 |
| Lies of P (2023) | 206 | 182 | 159.8 | 140.1 | 97.3 |
| Cyberpunk 2077 (2023) | 131.7 | 113.2 | 98.3 | 87.9 | 57.1 |
| Assassin's Creed Mirage (2023) | 143 | 132 | 125 | 99 | 75 |
| Total War Pharaoh (2023) | 385.9 | 239.5 | 146.2 | 113.3 | 87.2 |
| Lords of the Fallen (2023) | 96.9 | 84.1 | 63.4 | 45.9 | 29.1 |
Utsläpp och effekt - Pro 16 levererar bra körtider
Utsläpp av buller
När du spelar kan ljudnivån stiga upp till 55 dB(A) (Performance Mode). "Entertainment Mode", som vi använde, ger måttliga bulleremissioner på 48 dB(A). Det skulle kunna vara tystare: I Silent Mode kan du uppnå en ljudnivå på 42 dB(A), på bekostnad av viss spelprestanda. I viloläge och vid daglig användning (kontor, internet) är en av de två fläktarna ofta i drift och ibland är båda avstängda.
Ljudnivå
| Låg belastning |
| 26 / 29 / 34 dB(A) |
| Hög belastning |
| 43 / 48 dB(A) |
 | ||
30 dB tyst 40 dB(A) hörbar 50 dB(A) högt ljud |
||
min: | ||
| Schenker XMG Pro 16 Studio (Mid 23) i9-13900H, GeForce RTX 4070 Laptop GPU | Asus Vivobook Pro 16X K6604JV-MX016W i9-13980HX, GeForce RTX 4060 Laptop GPU | Lenovo Legion Slim 7i 16 Gen 8 i9-13900H, GeForce RTX 4070 Laptop GPU | HP Omen Transcend 16 i9-13900HX, GeForce RTX 4070 Laptop GPU | MSI Stealth 16 Studio A13VG i7-13700H, GeForce RTX 4070 Laptop GPU | |
|---|---|---|---|---|---|
| Noise | -4% | 10% | -3% | 11% | |
| av / miljö * (dB) | 25 | 25.2 -1% | 22.8 9% | 22.9 8% | 24 4% |
| Idle Minimum * (dB) | 26 | 26.6 -2% | 23.6 9% | 29.1 -12% | 24 8% |
| Idle Average * (dB) | 29 | 26.6 8% | 23.6 19% | 29.1 -0% | 24 17% |
| Idle Maximum * (dB) | 34 | 29.2 14% | 25.7 24% | 29.1 14% | 24 29% |
| Load Average * (dB) | 43 | 53.4 -24% | 27.6 36% | 45.7 -6% | 34.81 19% |
| Witcher 3 ultra * (dB) | 48 | 54.4 -13% | 54.3 -13% | 44.05 8% | |
| Load Maximum * (dB) | 48 | 56.9 -19% | 54.4 -13% | 54.3 -13% | 51.57 -7% |
* ... mindre är bättre
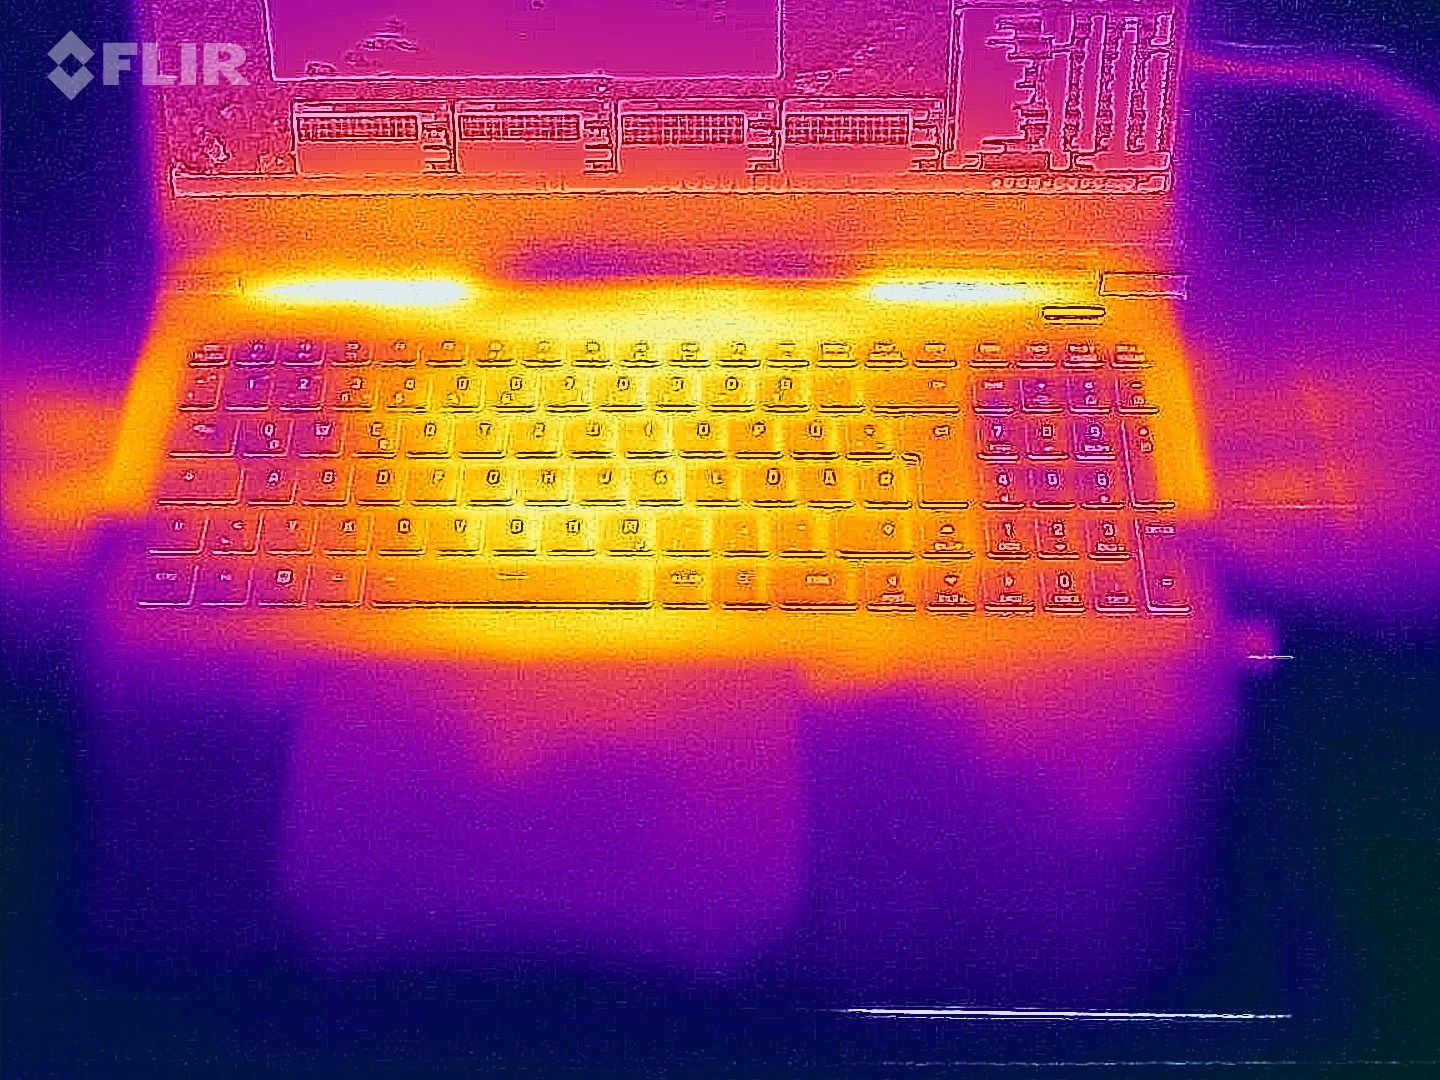
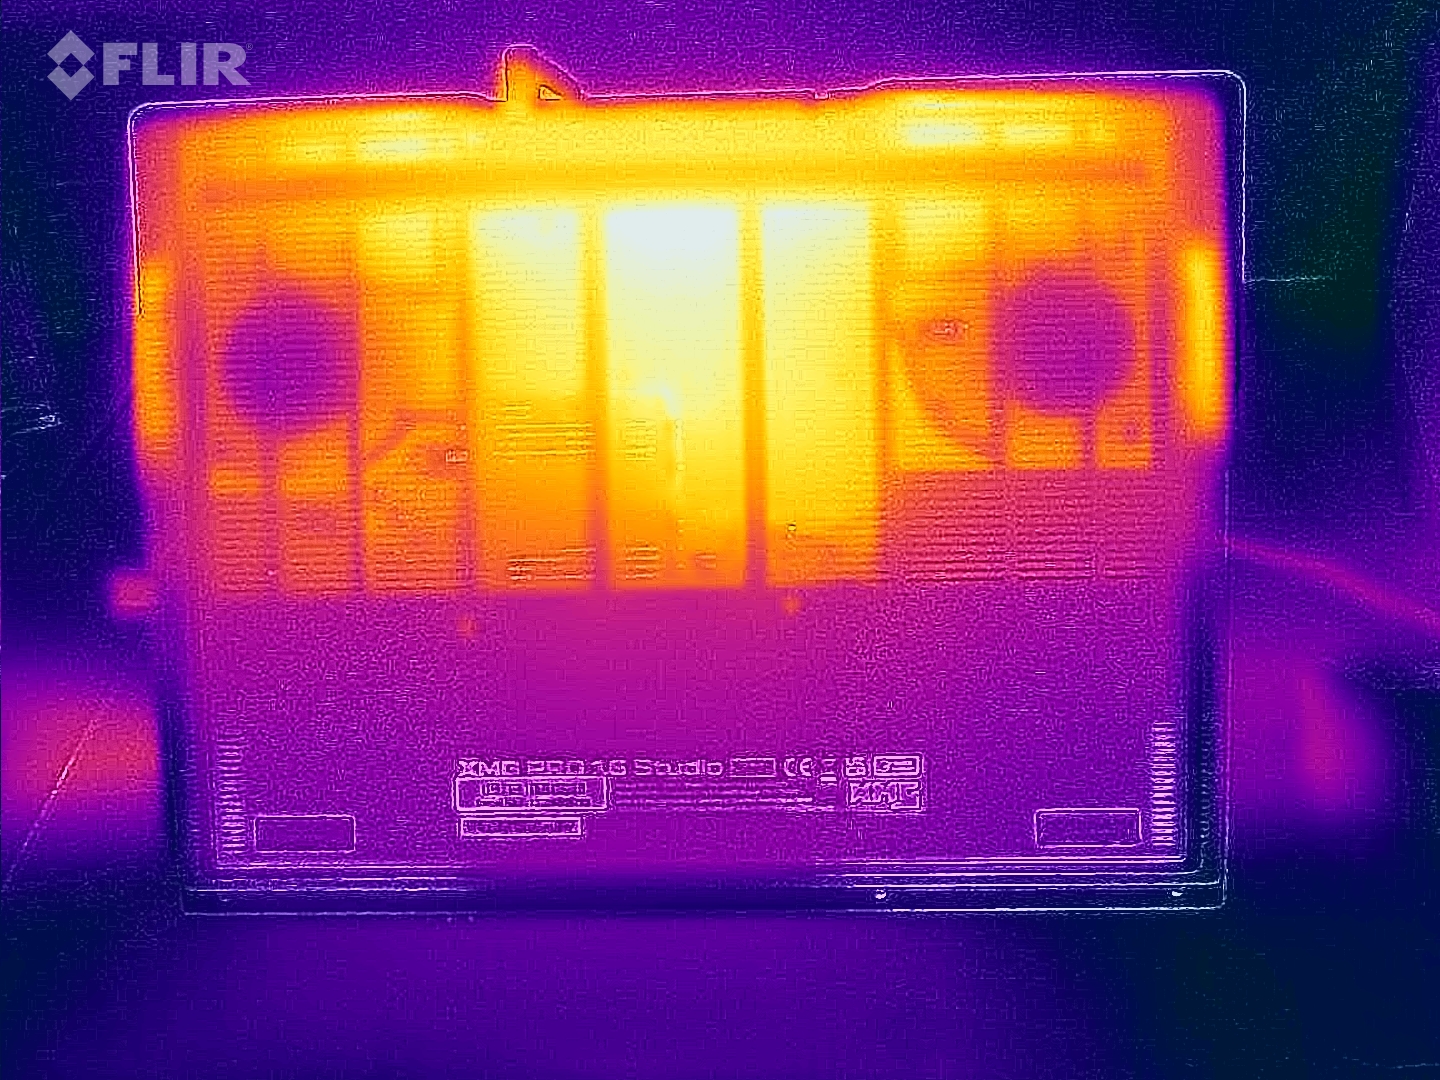
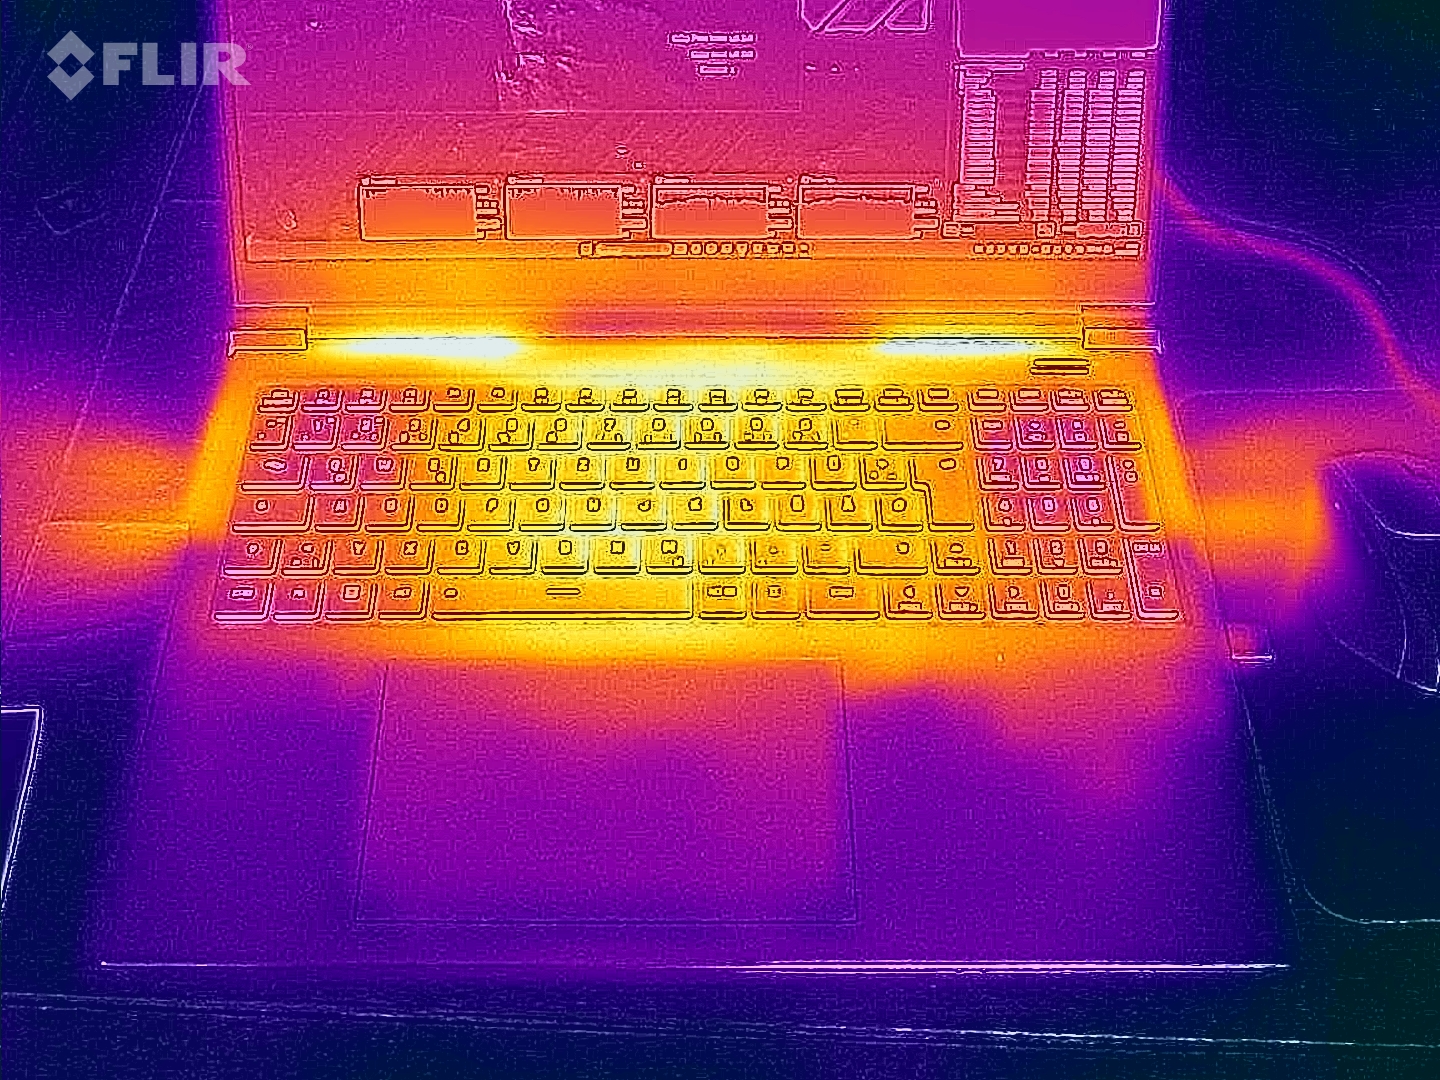
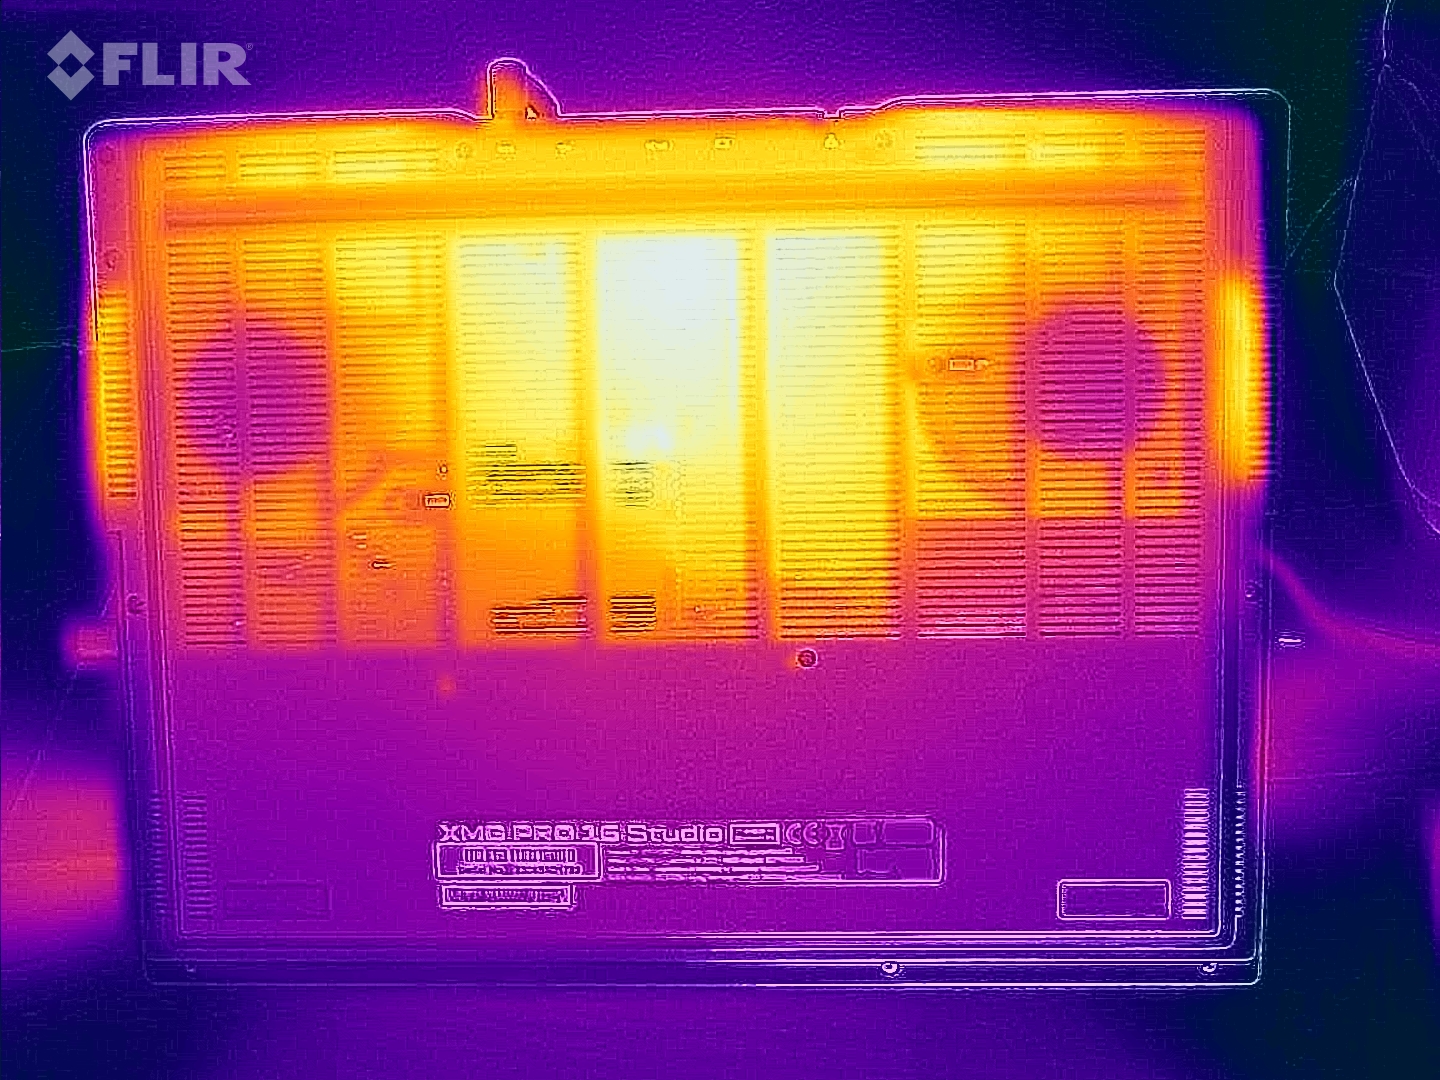
Temperatur
Stresstestet och Witcher 3 test ledde till att den bärbara datorns temperaturer steg avsevärt. I vissa områden uppmätte vi temperaturer över 60 grader Celsius. Vid daglig användning (kontor, internet) förblir dessa värden i allmänhet inom den gröna zonen - men på en högre nivå än konkurrenter somLenovo Legion Slim 7i 16 Gen 8.
(-) Den maximala temperaturen på ovansidan är 55 °C / 131 F, jämfört med genomsnittet av 40.4 °C / 105 F , allt från 21.2 till 68.8 °C för klassen Gaming.
(-) Botten värms upp till maximalt 66 °C / 151 F, jämfört med genomsnittet av 43.2 °C / 110 F
(+) Vid tomgångsbruk är medeltemperaturen för ovansidan 30.1 °C / 86 F, jämfört med enhetsgenomsnittet på 33.9 °C / ### class_avg_f### F.
(-) När du spelar The Witcher 3 är medeltemperaturen för ovansidan 43.9 °C / 111 F, jämfört med enhetsgenomsnittet på 33.9 °C / ## #class_avg_f### F.
(+) Handledsstöden och pekplattan når maximal hudtemperatur (33 °C / 91.4 F) och är därför inte varma.
(-) Medeltemperaturen för handledsstödsområdet på liknande enheter var 28.8 °C / 83.8 F (-4.2 °C / -7.6 F).
| Schenker XMG Pro 16 Studio (Mid 23) Intel Core i9-13900H, NVIDIA GeForce RTX 4070 Laptop GPU | Asus Vivobook Pro 16X K6604JV-MX016W Intel Core i9-13980HX, NVIDIA GeForce RTX 4060 Laptop GPU | Lenovo Legion Slim 7i 16 Gen 8 Intel Core i9-13900H, NVIDIA GeForce RTX 4070 Laptop GPU | HP Omen Transcend 16 Intel Core i9-13900HX, NVIDIA GeForce RTX 4070 Laptop GPU | MSI Stealth 16 Studio A13VG Intel Core i7-13700H, NVIDIA GeForce RTX 4070 Laptop GPU | |
|---|---|---|---|---|---|
| Heat | 11% | 15% | 16% | -6% | |
| Maximum Upper Side * (°C) | 55 | 39.7 28% | 49.8 9% | 47.4 14% | 60 -9% |
| Maximum Bottom * (°C) | 66 | 60 9% | 48.8 26% | 54.4 18% | 61 8% |
| Idle Upper Side * (°C) | 33 | 30.9 6% | 29.4 11% | 28.4 14% | 38.2 -16% |
| Idle Bottom * (°C) | 35 | 34.7 1% | 30 14% | 29.2 17% | 37.7 -8% |
* ... mindre är bättre
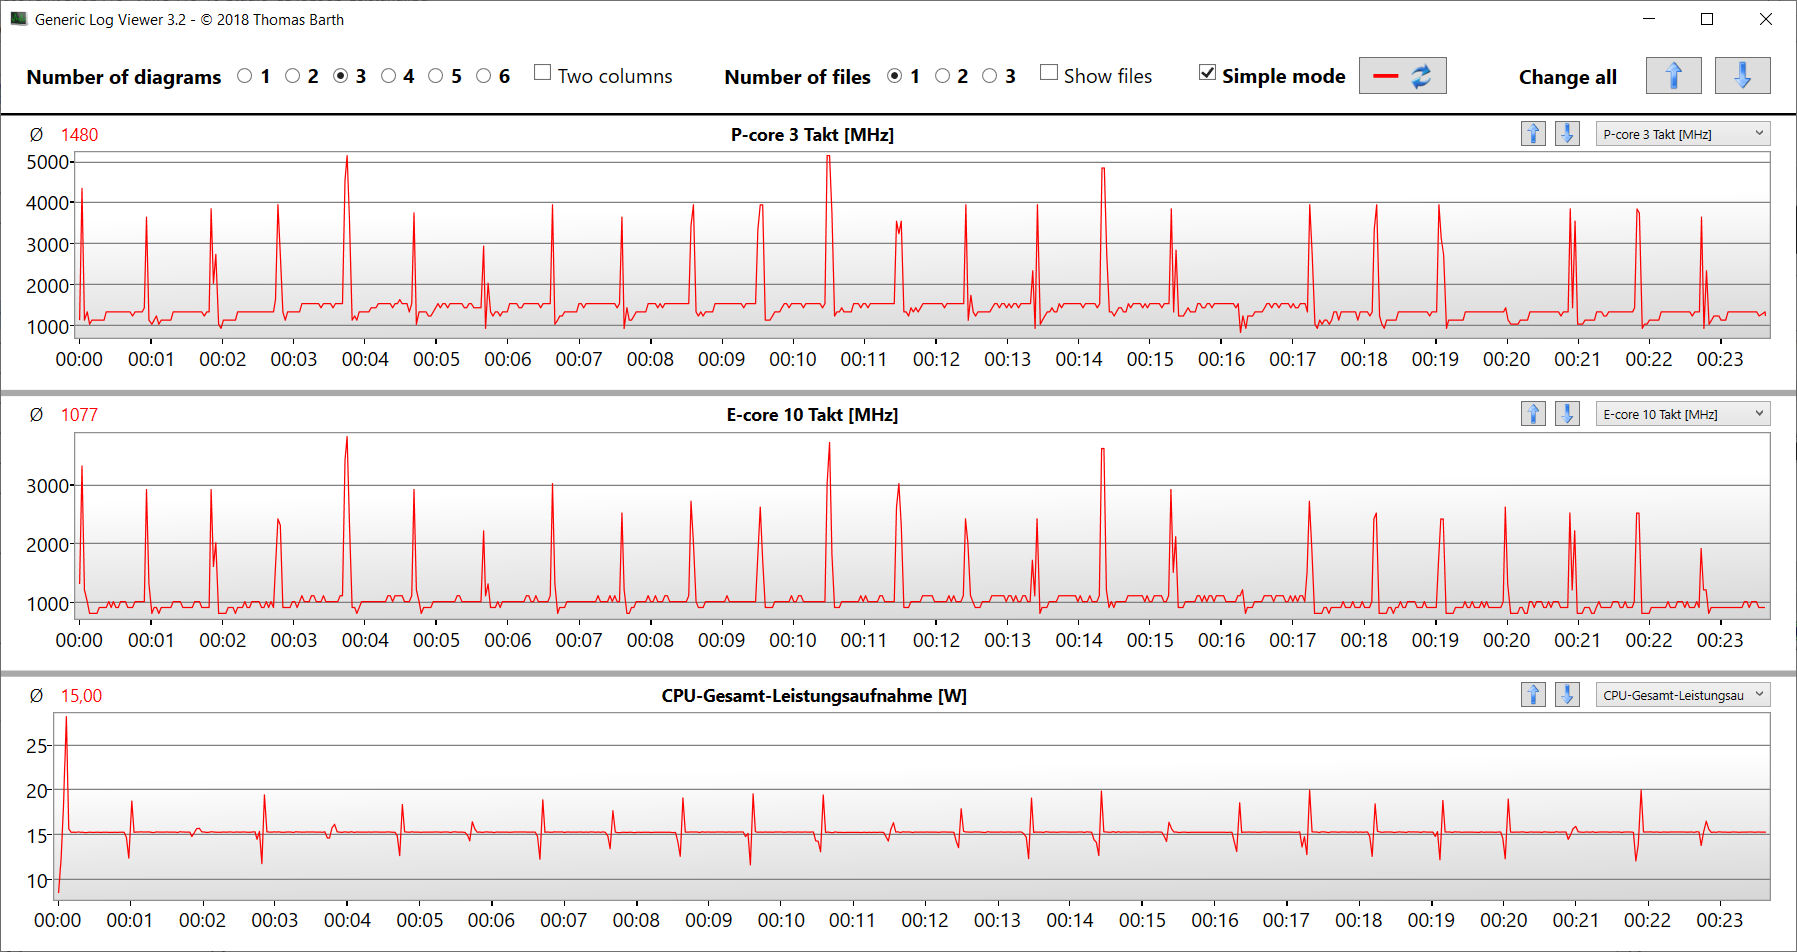
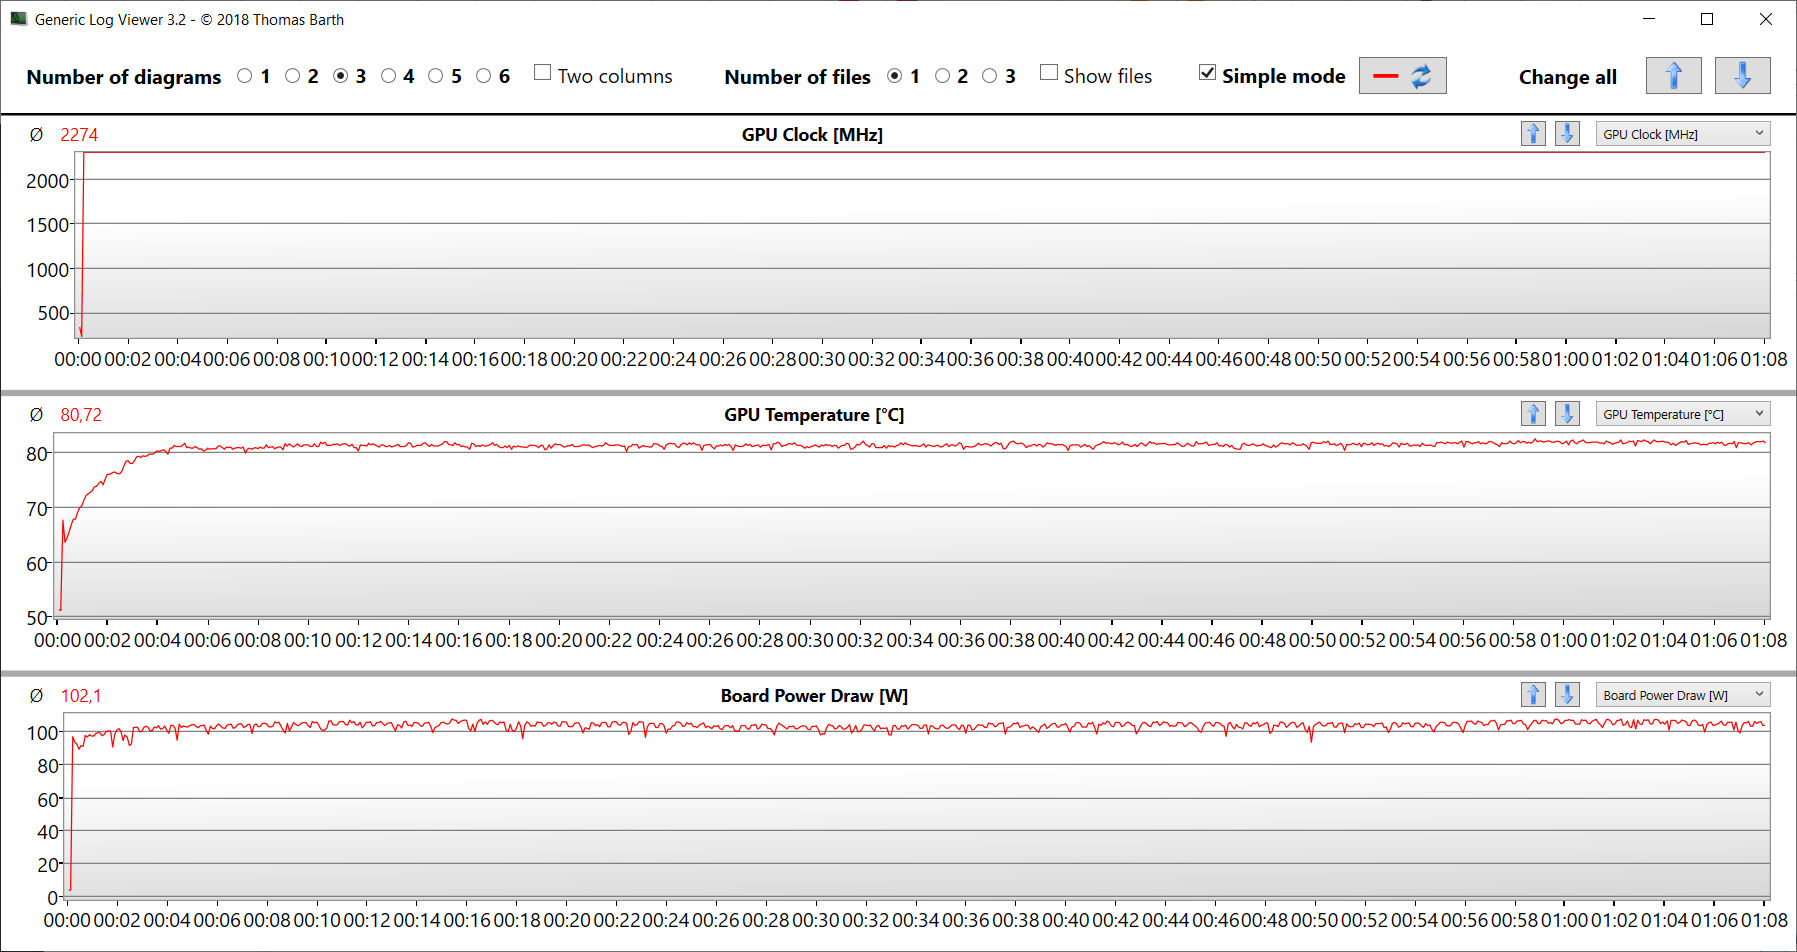
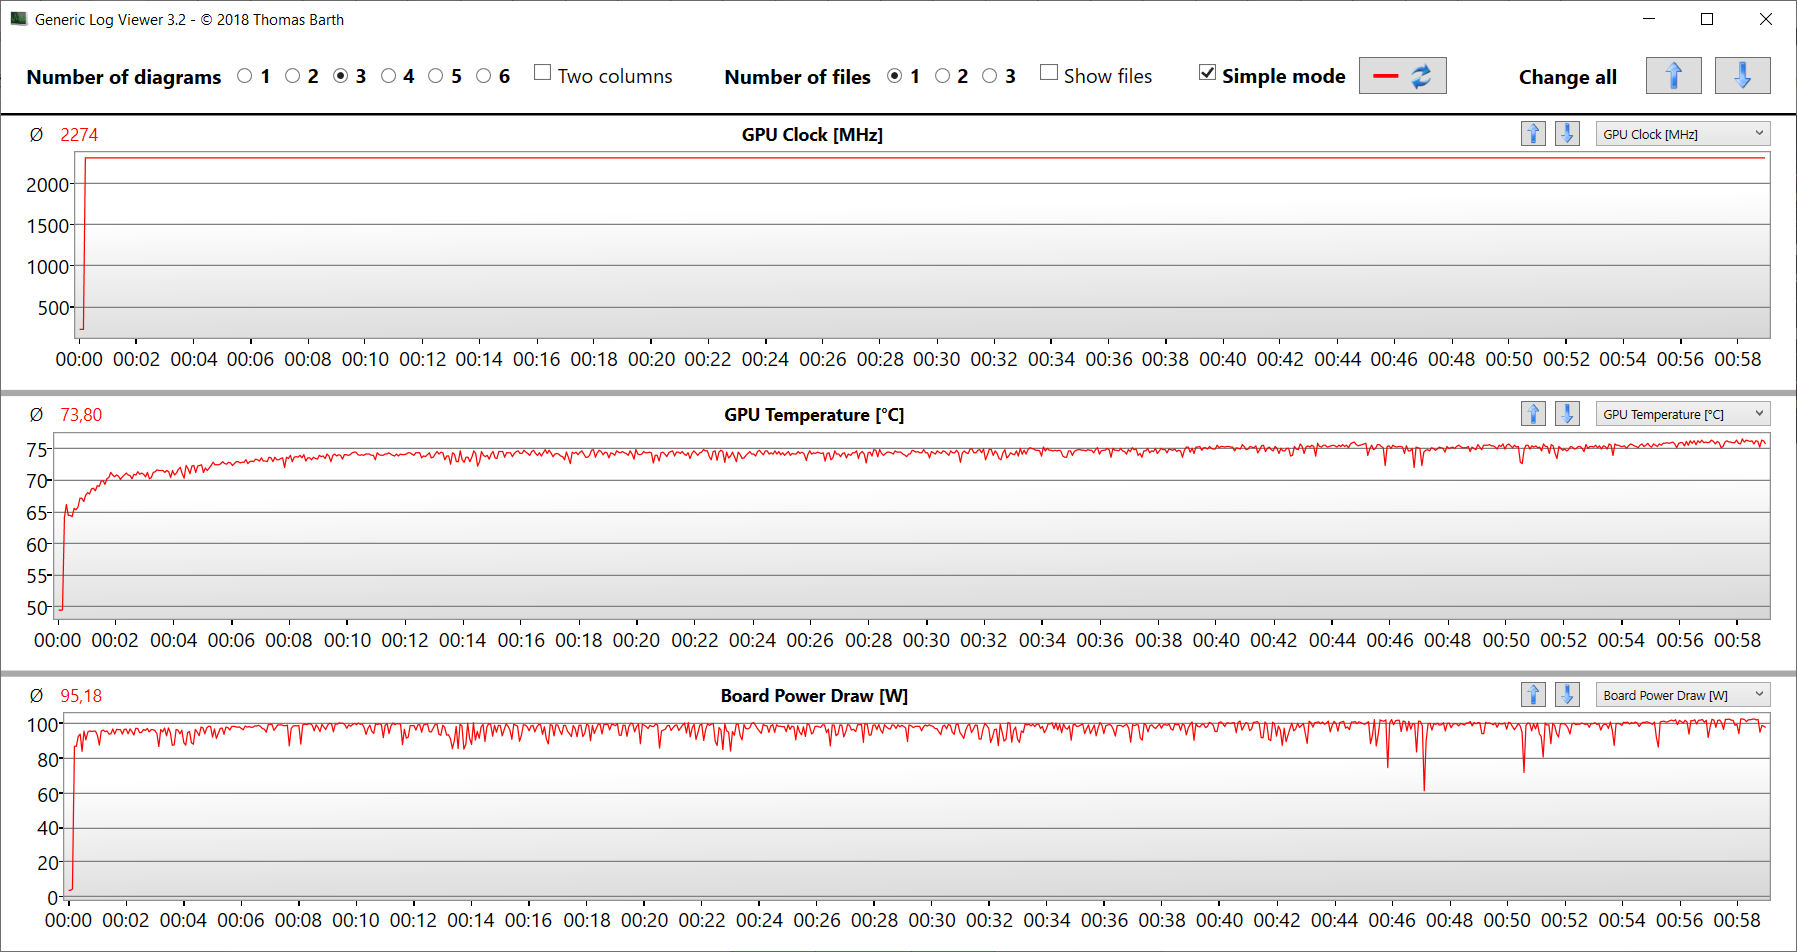
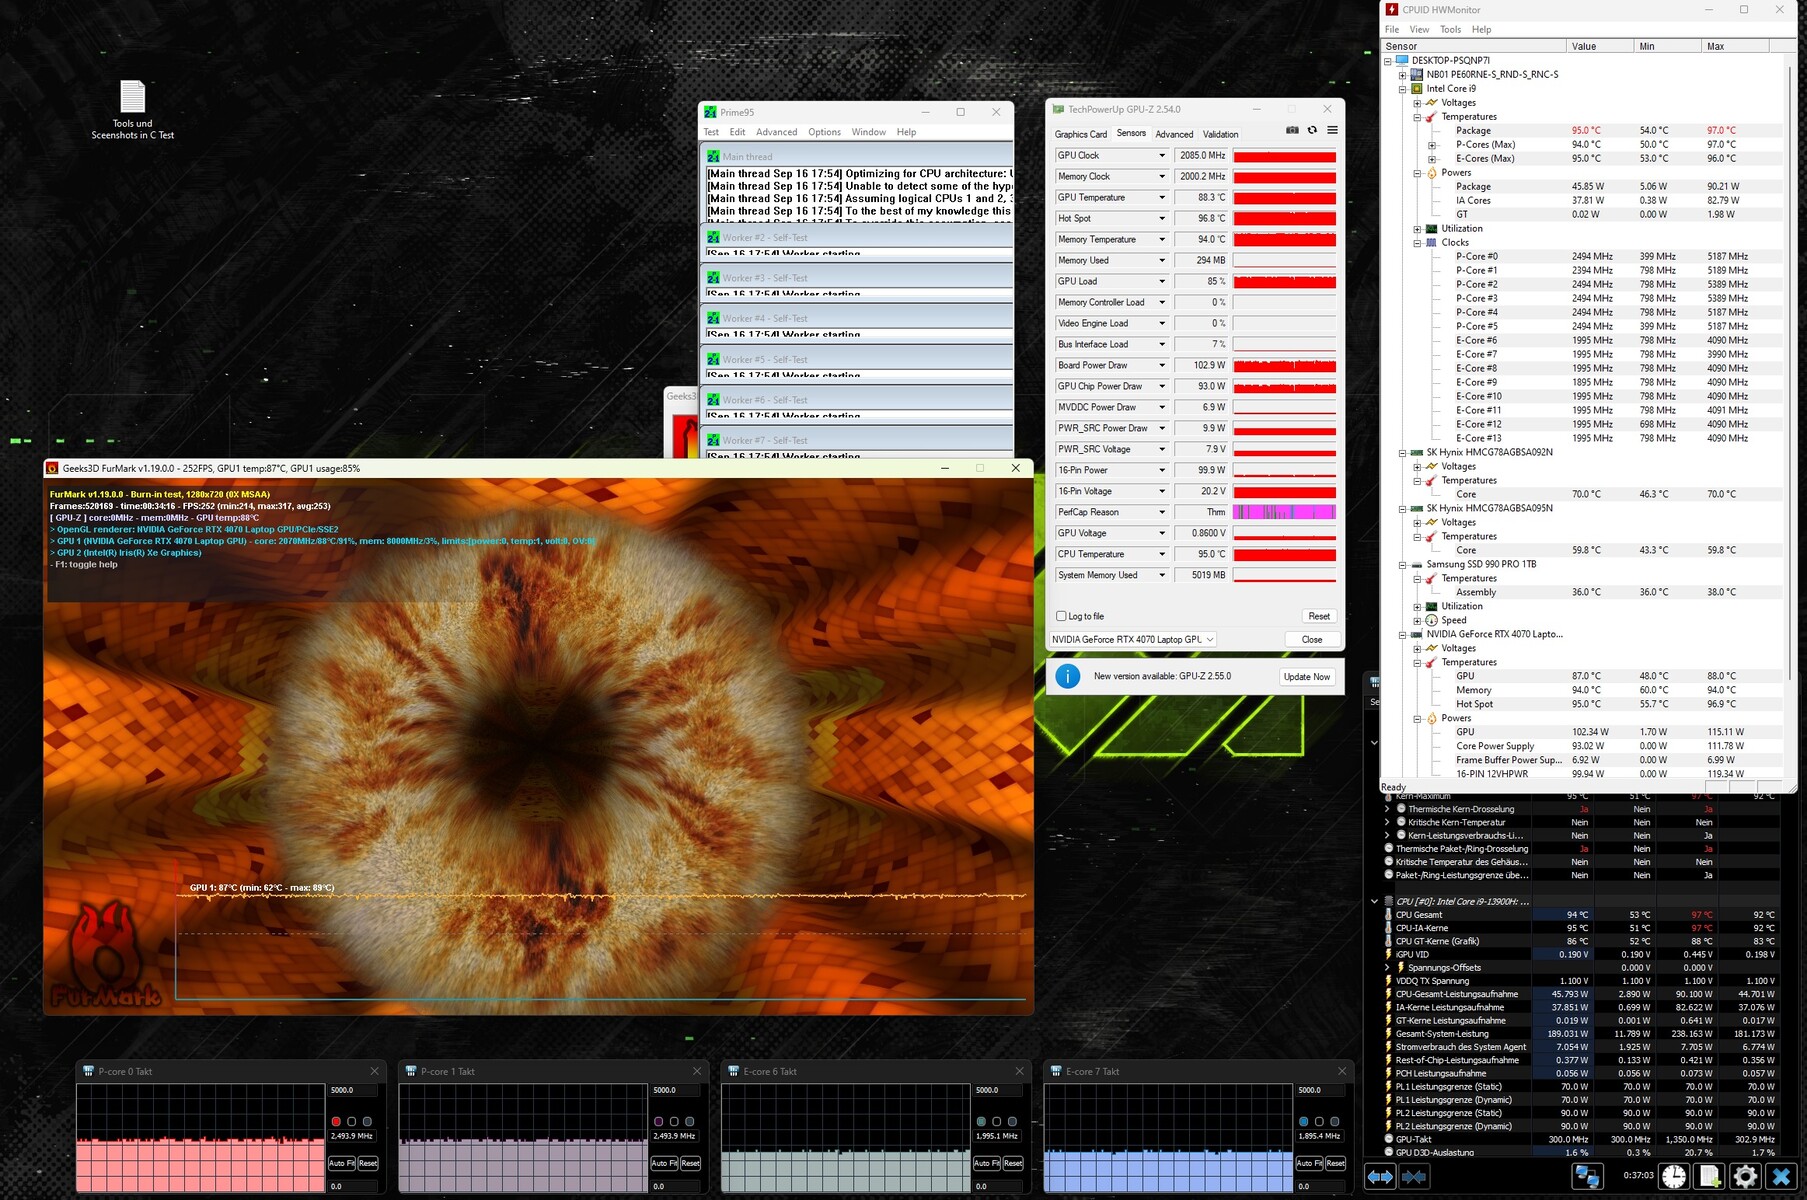
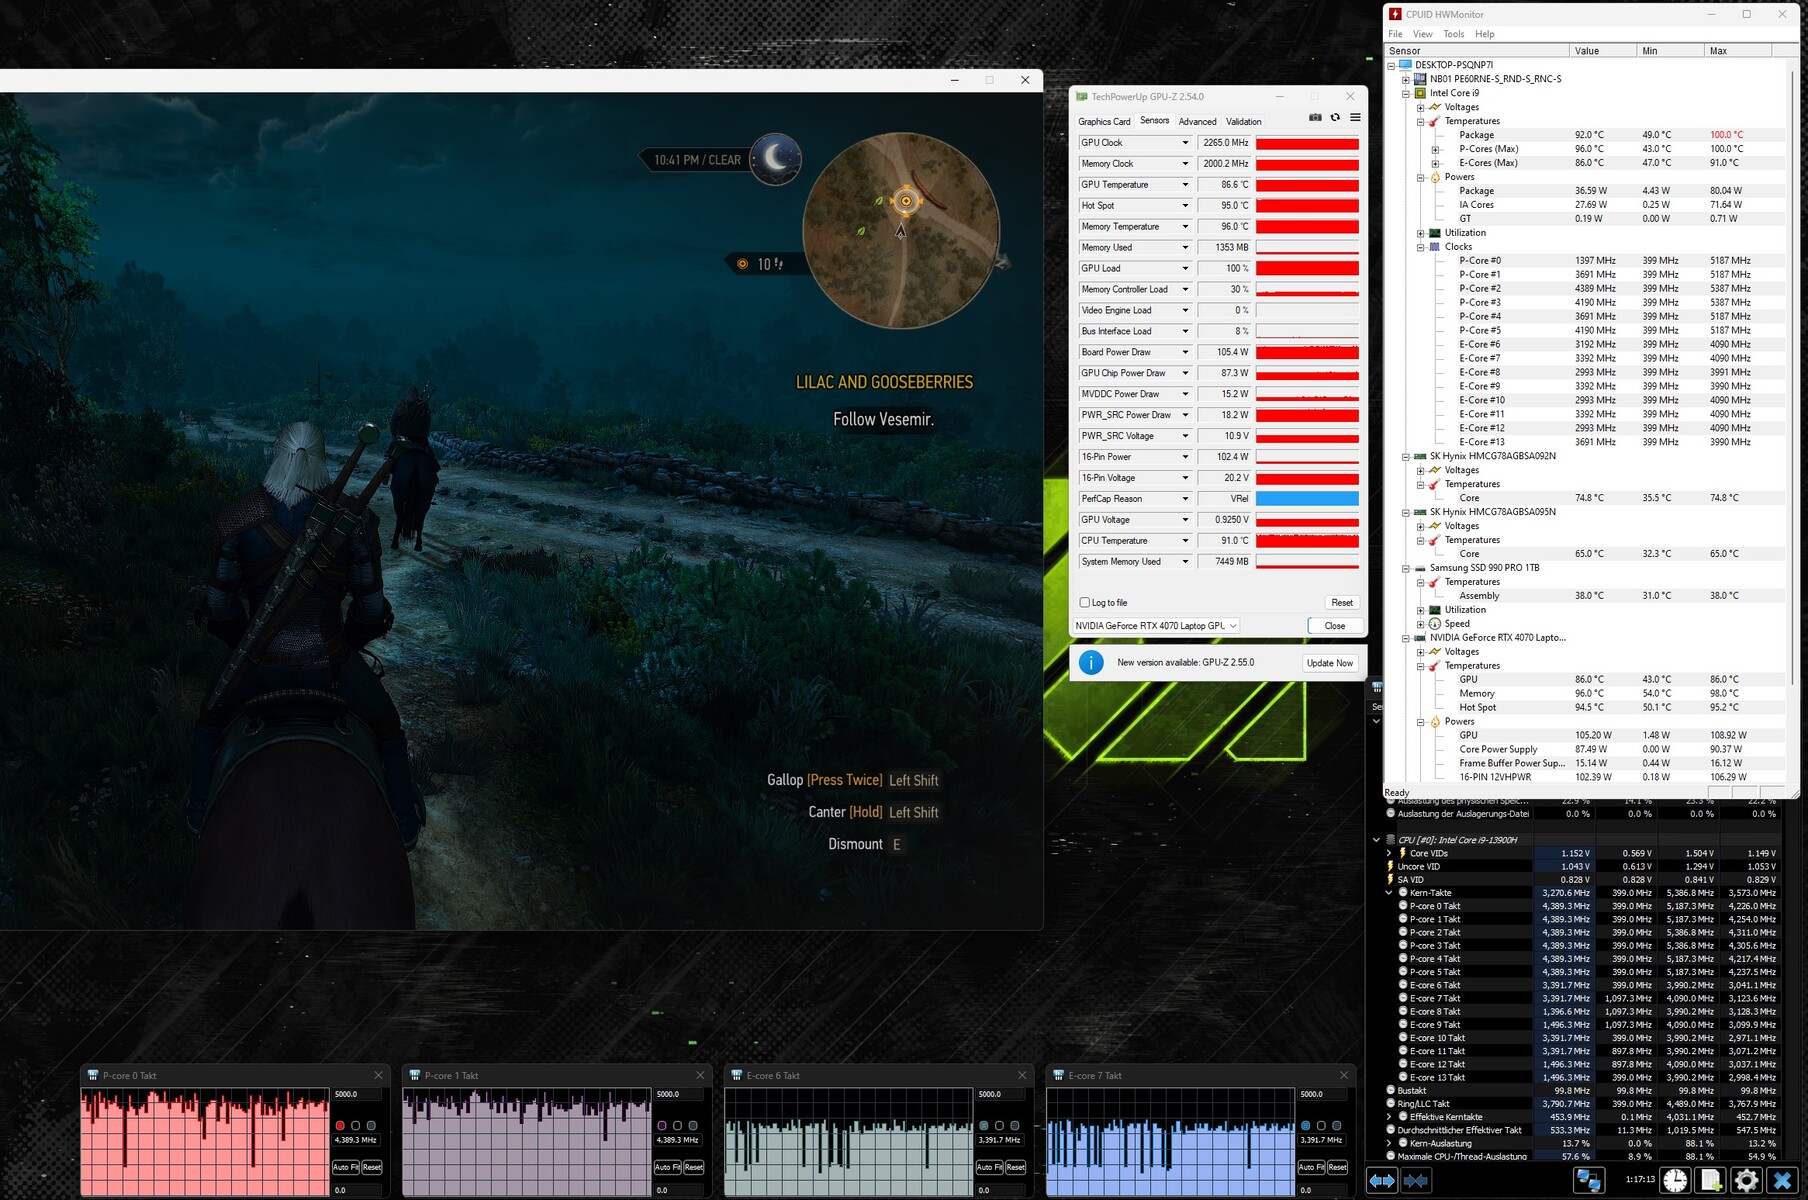
Stresstest
Stresstestet (Prime95 och Furmark i kontinuerlig användning) simulerar ett extremt scenario för att testa hur stabilt systemet förblir under full belastning. Processorn (P: 3,8 till 3,9 GHz, E: 2,7 GHz) inledde testet med höga klockfrekvenser. Under det fortsatta förloppet sjönk dessa värden ner till ungefär basklocknivån. GPU:n kördes med nästan full effekt.
Högtalare
Stereohögtalarna ger överlag ett mycket bra ljud. Basen skulle behöva vara mer kraftfull.
Schenker XMG Pro 16 Studio (Mid 23) ljudanalys
(±) | högtalarljudstyrkan är genomsnittlig men bra (80 dB)
Bas 100 - 315 Hz
(±) | reducerad bas - i genomsnitt 12.7% lägre än medianen
(+) | basen är linjär (6.1% delta till föregående frekvens)
Mellan 400 - 2000 Hz
(+) | balanserad mellan - endast 2.3% från medianen
(+) | mids är linjära (4.8% delta till föregående frekvens)
Högsta 2 - 16 kHz
(+) | balanserade toppar - endast 2.6% från medianen
(+) | toppar är linjära (6% delta till föregående frekvens)
Totalt 100 - 16 000 Hz
(+) | det totala ljudet är linjärt (10.9% skillnad mot median)
Jämfört med samma klass
» 7% av alla testade enheter i den här klassen var bättre, 3% liknande, 90% sämre
» Den bästa hade ett delta på 6%, genomsnittet var 18%, sämst var 132%
Jämfört med alla testade enheter
» 6% av alla testade enheter var bättre, 2% liknande, 92% sämre
» Den bästa hade ett delta på 4%, genomsnittet var 24%, sämst var 134%
Lenovo Legion Slim 7i 16 Gen 8 ljudanalys
(+) | högtalare kan spela relativt högt (84.8 dB)
Bas 100 - 315 Hz
(±) | reducerad bas - i genomsnitt 12.1% lägre än medianen
(±) | linjäriteten för basen är genomsnittlig (9% delta till föregående frekvens)
Mellan 400 - 2000 Hz
(+) | balanserad mellan - endast 1.4% från medianen
(+) | mids är linjära (3.3% delta till föregående frekvens)
Högsta 2 - 16 kHz
(+) | balanserade toppar - endast 4.4% från medianen
(+) | toppar är linjära (5.6% delta till föregående frekvens)
Totalt 100 - 16 000 Hz
(+) | det totala ljudet är linjärt (10.5% skillnad mot median)
Jämfört med samma klass
» 6% av alla testade enheter i den här klassen var bättre, 2% liknande, 92% sämre
» Den bästa hade ett delta på 6%, genomsnittet var 18%, sämst var 132%
Jämfört med alla testade enheter
» 5% av alla testade enheter var bättre, 1% liknande, 93% sämre
» Den bästa hade ett delta på 4%, genomsnittet var 24%, sämst var 134%
Strömförbrukning
Pro 16 uppvisade inga iögonfallande strömförbrukningsvärden. Värdena ligger på en normal nivå för den installerade hårdvaran. Testet Witcher 3 test och stresstest kördes med något minskad strömförbrukning. Strömförsörjningen (230 watt) är tillräckligt stor. Lovvärt: Inom jämförelseområdet har XMG laptop den lägsta totala energiförbrukningen.
| Av/Standby | |
| Låg belastning | |
| Hög belastning |
|
Förklaring:
min: | |
| Schenker XMG Pro 16 Studio (Mid 23) i9-13900H, GeForce RTX 4070 Laptop GPU | Asus Vivobook Pro 16X K6604JV-MX016W i9-13980HX, GeForce RTX 4060 Laptop GPU | Lenovo Legion Slim 7i 16 Gen 8 i9-13900H, GeForce RTX 4070 Laptop GPU | HP Omen Transcend 16 i9-13900HX, GeForce RTX 4070 Laptop GPU | MSI Stealth 16 Studio A13VG i7-13700H, GeForce RTX 4070 Laptop GPU | Genomsnitt av klass Gaming | |
|---|---|---|---|---|---|---|
| Power Consumption | -23% | -65% | -76% | -8% | -33% | |
| Idle Minimum * (Watt) | 8 | 13.8 -73% | 22 -175% | 19.2 -140% | 11 -38% | 13.3 ? -66% |
| Idle Average * (Watt) | 12 | 16 -33% | 29 -142% | 22.7 -89% | 18 -50% | 19 ? -58% |
| Idle Maximum * (Watt) | 23 | 19 17% | 39.5 -72% | 55.4 -141% | 19 17% | 24.5 ? -7% |
| Load Average * (Watt) | 94 | 147 -56% | 98.7 -5% | 128.4 -37% | 91 3% | 108.1 ? -15% |
| Witcher 3 ultra * (Watt) | 181.5 | 147.8 19% | 171.8 5% | 206 -13% | 130 28% | |
| Load Maximum * (Watt) | 215 | 244 -13% | 213.2 1% | 292 -36% | 228 -6% | 254 ? -18% |
* ... mindre är bättre
Power consumption Witcher 3 / stress test
Power consumption with external monitor
Körtider
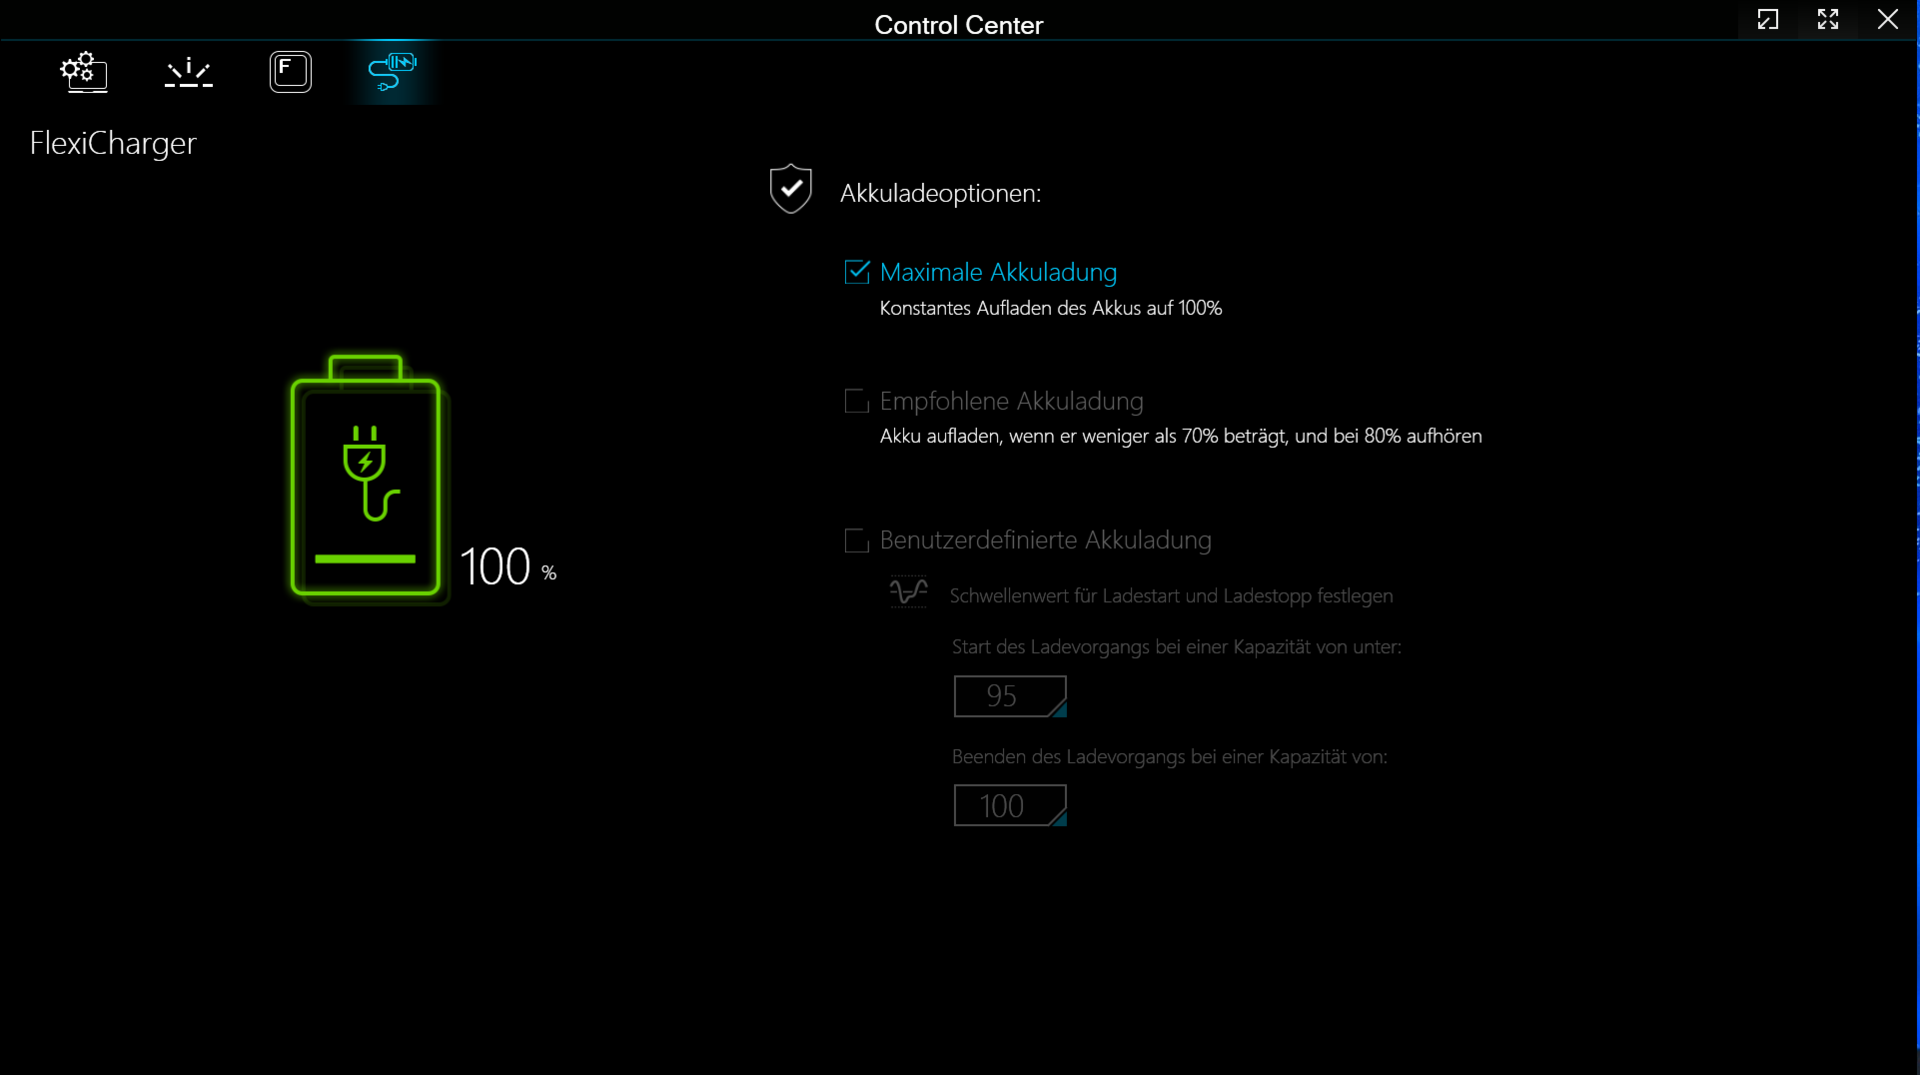
I vårt realistiska WLAN-test (som visar belastningen vid uppringning av webbplatser med ett skript) uppnådde den 16-tums bärbara datorn en drifttid på 6:45 timmar - ett generellt bra resultat. I jämförelsefältet har Pro 16 den minsta batterikapaciteten (73 Wh), men den erbjuder de bästa drifttiderna per Wh.
För
Emot
Omdöme - Ett harmoniskt kraftpaket
Video- och bildredigering, streaming, rendering och spel är alla delar av den bärbara datorns expertis. Den kraft som krävs levereras av enCore i9-13900Hoch enGeForce RTX 4070på en genomgående hög nivå. Det är möjligt att hitta en bra kompromiss mellan prestanda och ljudnivå.
Schenkers XMG Pro 16 Studio (Mid 23) visar sig vara ett kraftfullt verktyg för gamers och kreatörer.
Dess QHD+-skärm (16 tum, 2 560 x 1 600 pixlar, sRGB, IPS, 240 Hz) med ett arbetsvänligt bildförhållande på 16:10 gjorde ett gott intryck på oss. Men ändå: Skärmen på en bärbar dator för kreatörer bör kunna visa DCI P3-färgrymden. Två SSD-platser (PCIe 4) inklusive RAID-0/1-stöd säkerställer mycket lagringsutrymme och korta laddningstider.
USB-C-portarna (1x USB 3.2 Gen 2, 1x Thunderbolt 4) gör det enkelt att integrera datorn i befintliga arbetsytor och öppnar upp för ytterligare expansionsalternativ (extern GPU, dockning). TB-4-porten kan mata ut en DisplayPort-signal och har stöd för Power Delivery. Till detta kommer relativt bra körtider.
Ett alternativ skulle kunna varaLenovo Legion Slim 7i 16 Gen 8: Den har samma CPU och GPU men kan leverera något mer datorkraft. Den bärbara datorns svagheter: Högre strömförbrukning, soldered-on RAM, SSD-strypning.
Pris och tillgänglighet
XMG Pro 16 Studio kan konfigureras individuellt och beställas via Schenkers onlinebutik. Vårt testinstrument kostar ca 2 400 US-dollar.
Schenker XMG Pro 16 Studio (Mid 23)
- 10/22/2023 v7 (old)
Sascha Mölck
Genomskinlighet
Valet av enheter som ska granskas görs av vår redaktion. Testprovet gavs till författaren som ett lån av tillverkaren eller återförsäljaren för denna recension. Långivaren hade inget inflytande på denna recension och inte heller fick tillverkaren en kopia av denna recension innan publiceringen. Det fanns ingen skyldighet att publicera denna recension. Som ett oberoende medieföretag är Notebookcheck inte föremål för auktoritet från tillverkare, återförsäljare eller förlag.
This is how Notebookcheck is testingEvery year, Notebookcheck independently reviews hundreds of laptops and smartphones using standardized procedures to ensure that all results are comparable. We have continuously developed our test methods for around 20 years and set industry standards in the process. In our test labs, high-quality measuring equipment is utilized by experienced technicians and editors. These tests involve a multi-stage validation process. Our complex rating system is based on hundreds of well-founded measurements and benchmarks, which maintains objectivity.
Price comparison

