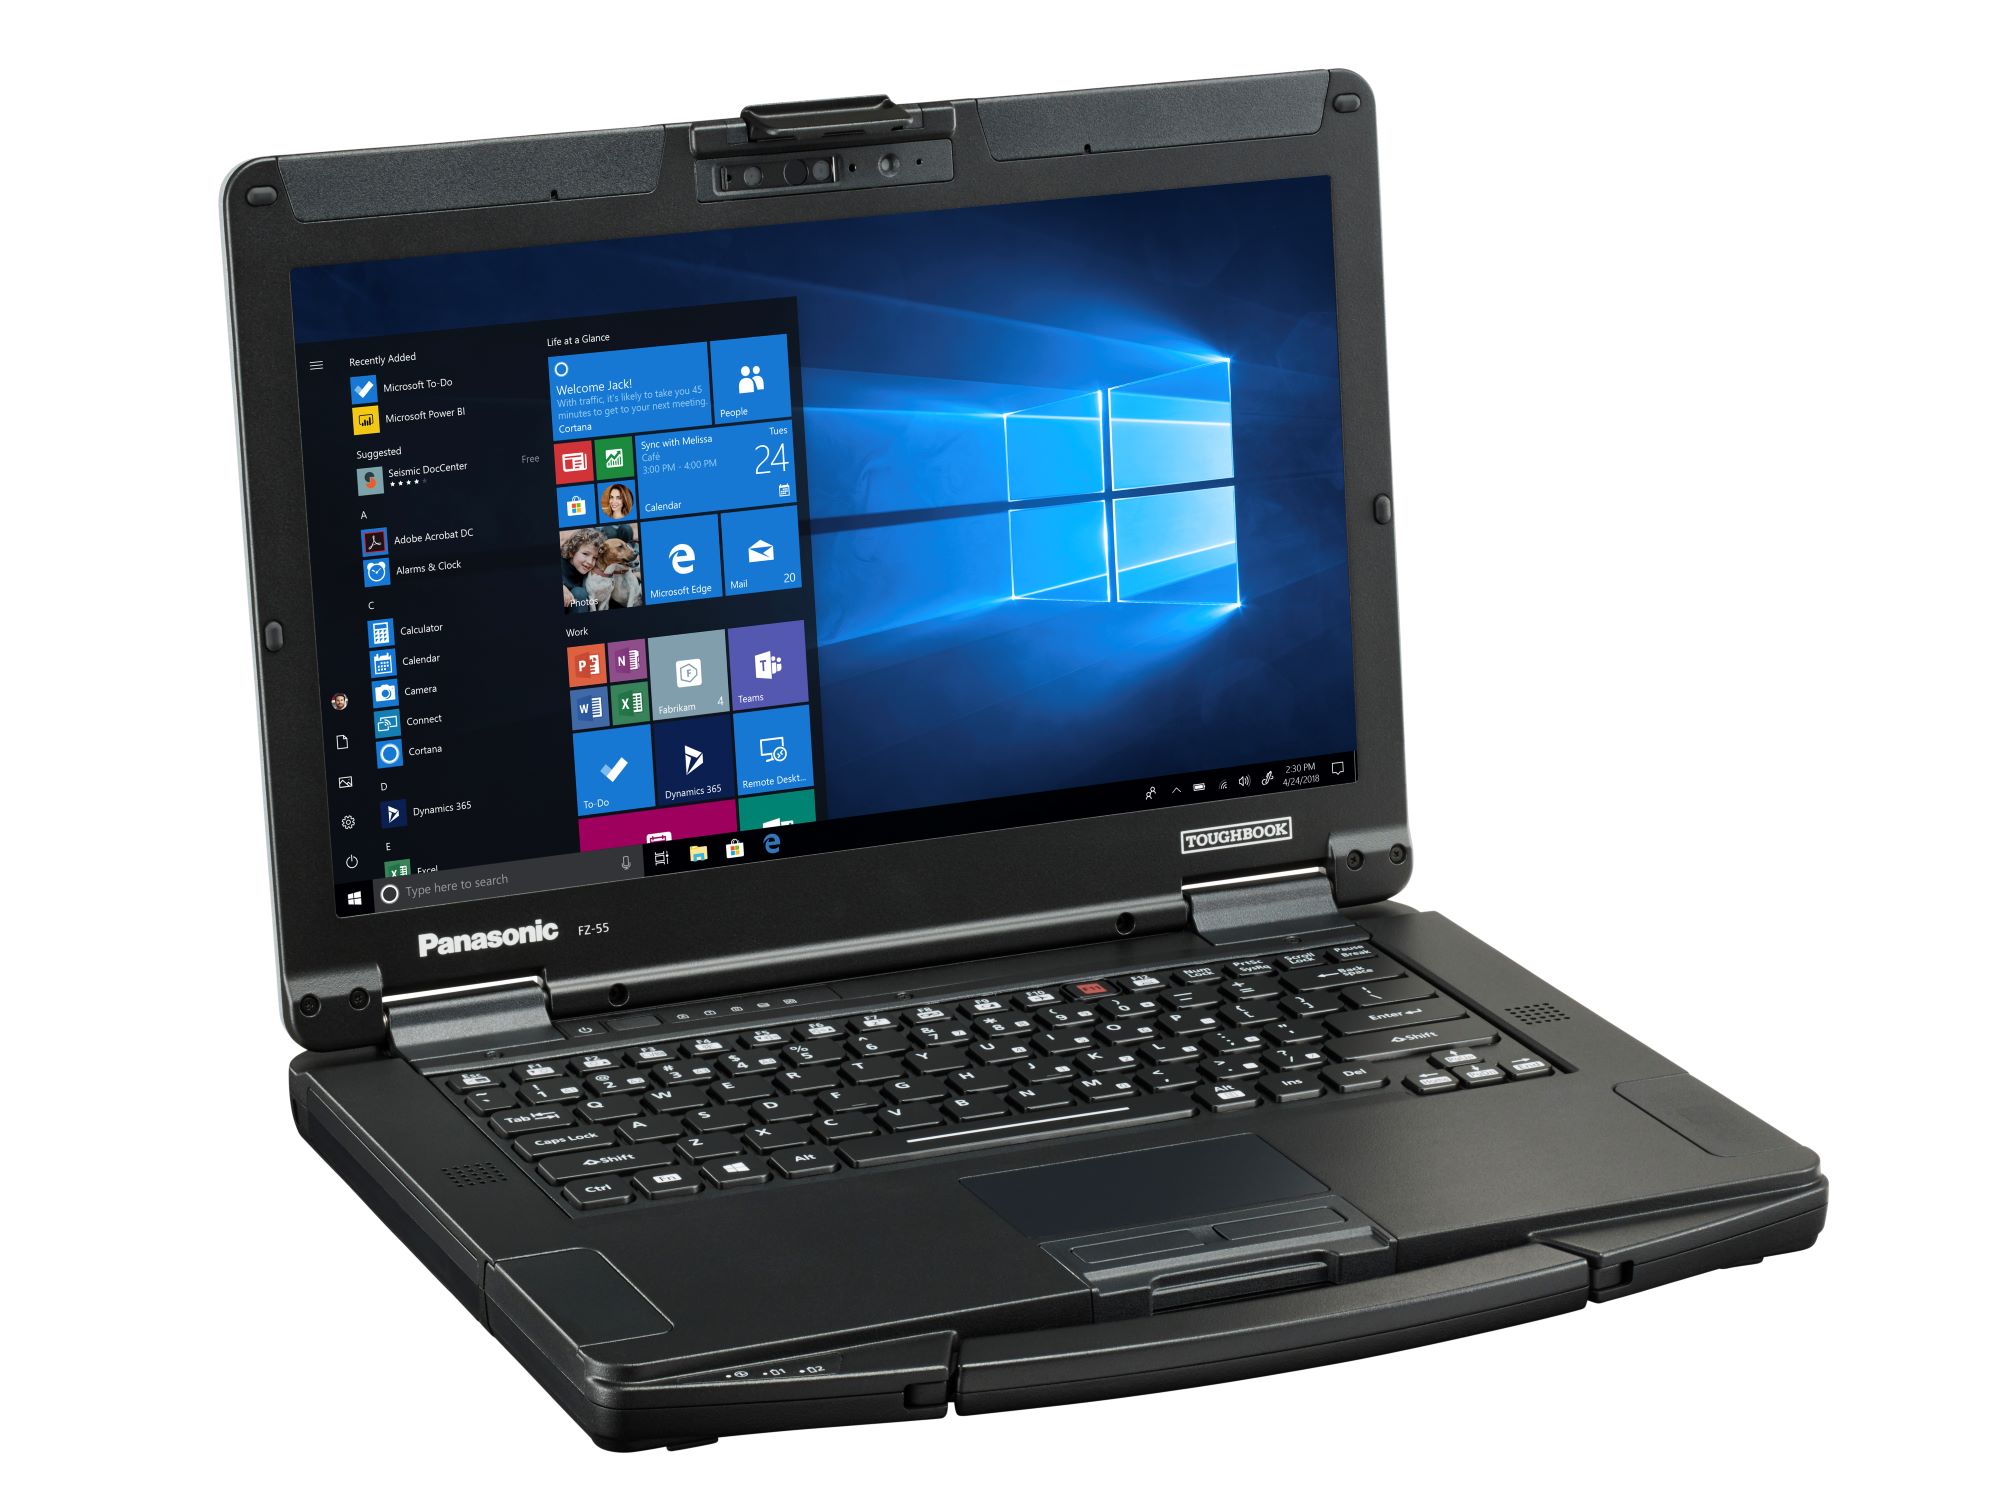
Test: Panasonic Toughbook FZ-55 MK1 (Sammanfattning)
| SD Card Reader | |
| average JPG Copy Test (av. of 3 runs) | |
| Dell Latitude 5420 Rugged-P85G (Toshiba Exceria Pro SDXC 64 GB UHS-II) | |
| Dell Latitude 7424 Rugged Extreme (Toshiba Exceria Pro SDXC 64 GB UHS-II) | |
| Panasonic Toughbook CF-54G2999VM (Toshiba Exceria Pro SDXC 64 GB UHS-II) | |
| Getac S410 (Toshiba Exceria Pro SDXC 64 GB UHS-II) | |
| Panasonic Toughbook FZ-55 (Toshiba Exceria Pro M501 64 GB UHS-II) | |
| maximum AS SSD Seq Read Test (1GB) | |
| Dell Latitude 5420 Rugged-P85G (Toshiba Exceria Pro SDXC 64 GB UHS-II) | |
| Dell Latitude 7424 Rugged Extreme (Toshiba Exceria Pro SDXC 64 GB UHS-II) | |
| Panasonic Toughbook CF-54G2999VM (Toshiba Exceria Pro SDXC 64 GB UHS-II) | |
| Getac S410 (Toshiba Exceria Pro SDXC 64 GB UHS-II) | |
| Panasonic Toughbook FZ-55 (Toshiba Exceria Pro M501 64 GB UHS-II) | |
| |||||||||||||||||||||||||
Distribution av ljusstyrkan: 76 %
Mitt på batteriet: 1037 cd/m²
Kontrast: 1728:1 (Svärta: 0.6 cd/m²)
ΔE ColorChecker Calman: 5.71 | ∀{0.5-29.43 Ø4.73}
calibrated: 4.52
ΔE Greyscale Calman: 5.5 | ∀{0.09-98 Ø4.97}
57% sRGB (Argyll 1.6.3 3D)
36.4% AdobeRGB 1998 (Argyll 1.6.3 3D)
39.38% AdobeRGB 1998 (Argyll 3D)
57% sRGB (Argyll 3D)
38.09% Display P3 (Argyll 3D)
Gamma: 2.04
CCT: 5783 K
| Panasonic Toughbook FZ-55 InfoVision M140NWF5 R3, IPS, 14", 1920x1080 | Panasonic Toughbook CF-54G2999VM B140XTN, AUO2E3C, TN LED, 14", 1366x768 | Getac S410 CMN N140BGE-E33, TN PED, 14", 1366x768 | Dell Latitude 5420 Rugged-P85G AU Optronics AUO523D, IPS, 14", 1920x1080 | Dell Latitude 7424 Rugged Extreme AU Optronics AUO523D, IPS, 14", 1920x1080 | Lenovo ThinkPad X1 Carbon 2019-20QE000VGE LP140QH2-SPD1, IPS, 14", 2560x1440 | |
|---|---|---|---|---|---|---|
| Display | -2% | 6% | 63% | 71% | 83% | |
| Display P3 Coverage (%) | 38.09 | 37.36 -2% | 40.46 6% | 62.5 64% | 65.3 71% | 72.5 90% |
| sRGB Coverage (%) | 57 | 56.1 -2% | 60.9 7% | 92.4 62% | 96.9 70% | 97.8 72% |
| AdobeRGB 1998 Coverage (%) | 39.38 | 38.62 -2% | 41.8 6% | 64.2 63% | 67.3 71% | 73.8 87% |
| Response Times | 20% | 28% | -38% | -43% | 20% | |
| Response Time Grey 50% / Grey 80% * (ms) | 42 ? | 43.2 ? -3% | 41.2 ? 2% | 68 ? -62% | 62.8 ? -50% | 33.6 ? 20% |
| Response Time Black / White * (ms) | 29.6 ? | 17.2 ? 42% | 14 ? 53% | 33.6 ? -14% | 40 ? -35% | 24 ? 19% |
| PWM Frequency (Hz) | 694 ? | 877 ? | 735 ? | 763 | ||
| Screen | -49% | -45% | 20% | 20% | 15% | |
| Brightness middle (cd/m²) | 1037 | 174.5 -83% | 265.1 -74% | 1111.7 7% | 844 -19% | 338 -67% |
| Brightness (cd/m²) | 1015 | 164 -84% | 246 -76% | 1026 1% | 793 -22% | 315 -69% |
| Brightness Distribution (%) | 76 | 71 -7% | 81 7% | 80 5% | 88 16% | 88 16% |
| Black Level * (cd/m²) | 0.6 | 0.6 -0% | 0.58 3% | 0.81 -35% | 0.54 10% | 0.43 28% |
| Contrast (:1) | 1728 | 291 -83% | 457 -74% | 1372 -21% | 1563 -10% | 786 -55% |
| Colorchecker dE 2000 * | 5.71 | 12.05 -111% | 14.24 -149% | 3.83 33% | 4.8 16% | 4 30% |
| Colorchecker dE 2000 max. * | 26.27 | 27.5 -5% | 26.66 -1% | 7.85 70% | 11.88 55% | 7.9 70% |
| Colorchecker dE 2000 calibrated * | 4.52 | 4.34 4% | 3.94 13% | 2.98 34% | 1.15 75% | 1.7 62% |
| Greyscale dE 2000 * | 5.5 | 14.8 -169% | 14.2 -158% | 5.6 -2% | 7.6 -38% | 6.2 -13% |
| Gamma | 2.04 108% | 1.4 157% | 2.03 108% | 2.306 95% | 2.334 94% | 2.13 103% |
| CCT | 5783 112% | 14529 45% | 17152 38% | 7676 85% | 6546 99% | 6787 96% |
| Color Space (Percent of AdobeRGB 1998) (%) | 36.4 | 35.7 -2% | 38.7 6% | 59 62% | 62 70% | 68.1 87% |
| Color Space (Percent of sRGB) (%) | 57 | 56.2 -1% | 61 7% | 93 63% | 97 70% | 97.8 72% |
| Totalt genomsnitt (program/inställningar) | -10% /
-32% | -4% /
-26% | 15% /
21% | 16% /
22% | 39% /
28% |
* ... mindre är bättre
Visa svarstider
| ↔ Svarstid svart till vitt | ||
|---|---|---|
| 29.6 ms ... stiga ↗ och falla ↘ kombinerat | ↗ 13.2 ms stiga | 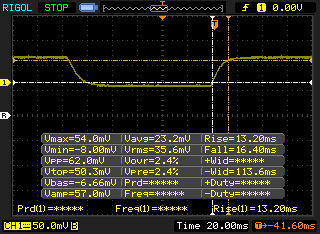 |
| ↘ 16.4 ms hösten | ||
| Skärmen visar relativt långsamma svarsfrekvenser i våra tester och kan vara för långsam för spelare. I jämförelse sträcker sig alla testade enheter från 0.1 (minst) till 240 (maximalt) ms. » 79 % av alla enheter är bättre. Detta innebär att den uppmätta svarstiden är sämre än genomsnittet av alla testade enheter (19.9 ms). | ||
| ↔ Svarstid 50 % grått till 80 % grått | ||
| 42 ms ... stiga ↗ och falla ↘ kombinerat | ↗ 20.8 ms stiga | 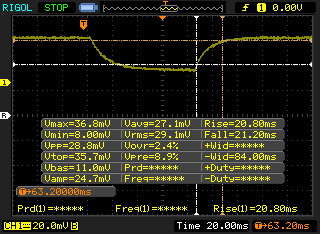 |
| ↘ 21.2 ms hösten | ||
| Skärmen visar långsamma svarsfrekvenser i våra tester och kommer att vara otillfredsställande för spelare. I jämförelse sträcker sig alla testade enheter från 0.165 (minst) till 636 (maximalt) ms. » 67 % av alla enheter är bättre. Detta innebär att den uppmätta svarstiden är sämre än genomsnittet av alla testade enheter (31.1 ms). | ||
Skärmflimmer / PWM (Puls-Width Modulation)
| Skärmflimmer / PWM upptäckt | 694 Hz | ≤ 99 % ljusstyrka inställning | 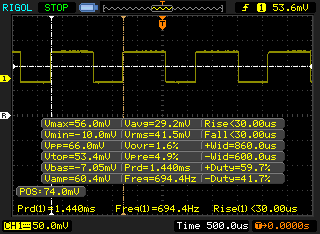 |
Displayens bakgrundsbelysning flimrar vid 694 Hz (i värsta fall, t.ex. med PWM) Flimrande upptäckt vid en ljusstyrkeinställning på 99 % och lägre. Det ska inte finnas något flimmer eller PWM över denna ljusstyrkeinställning. Frekvensen för 694 Hz är ganska hög, så de flesta användare som är känsliga för PWM bör inte märka något flimmer. Som jämförelse: 52 % av alla testade enheter använder inte PWM för att dämpa skärmen. Om PWM upptäcktes mättes ett medelvärde av 7784 (minst: 5 - maximum: 343500) Hz. | |||
| Cinebench R15 | |
| CPU Single 64Bit | |
| Dell Latitude 5500 | |
| Lenovo ThinkPad X1 Yoga 2019-20QGS00A00 | |
| Asus VivoBook S15 S530UN-BQ097T | |
| Lenovo Legion Y540-17IRH | |
| Panasonic Toughbook FZ-55 | |
| Genomsnitt Intel Core i5-8365U (163 - 171, n=4) | |
| Lenovo ThinkPad L490 20Q6S08600 | |
| Dell Latitude 14 5495 | |
| Lenovo ThinkPad 13 20J1005TPB | |
| Dell Latitude 13 3390 | |
| HP ProBook 445 G6 | |
| Panasonic Toughbook CF-54G2999VM | |
| CPU Multi 64Bit | |
| Lenovo Legion Y540-17IRH | |
| Asus VivoBook S15 S530UN-BQ097T | |
| Lenovo ThinkPad X1 Yoga 2019-20QGS00A00 | |
| Dell Latitude 5500 | |
| Dell Latitude 14 5495 | |
| HP ProBook 445 G6 | |
| Genomsnitt Intel Core i5-8365U (558 - 620, n=4) | |
| Panasonic Toughbook FZ-55 | |
| Dell Latitude 13 3390 | |
| Lenovo ThinkPad L490 20Q6S08600 | |
| Panasonic Toughbook CF-54G2999VM | |
| Lenovo ThinkPad 13 20J1005TPB | |
| Cinebench R11.5 | |
| CPU Single 64Bit | |
| Genomsnitt Intel Core i5-8365U (n=1) | |
| Lenovo ThinkPad L490 20Q6S08600 | |
| Dell Latitude 13 3390 | |
| CPU Multi 64Bit | |
| Genomsnitt Intel Core i5-8365U (n=1) | |
| Lenovo ThinkPad L490 20Q6S08600 | |
| Dell Latitude 13 3390 | |
| Cinebench R10 | |
| Rendering Multiple CPUs 32Bit | |
| Lenovo Legion Y540-17IRH | |
| Genomsnitt Intel Core i5-8365U (n=1) | |
| HP ProBook 445 G6 | |
| Rendering Single 32Bit | |
| Genomsnitt Intel Core i5-8365U (n=1) | |
| Lenovo Legion Y540-17IRH | |
| HP ProBook 445 G6 | |
| wPrime 2.10 - 1024m | |
| Lenovo ThinkPad 13 20J1005TPB | |
| Genomsnitt Intel Core i5-8365U (n=1) | |
* ... mindre är bättre
| PCMark 8 | |
| Home Score Accelerated v2 | |
| Getac S410 | |
| Dell Latitude 7424 Rugged Extreme | |
| Dell Latitude 5420 Rugged-P85G | |
| Panasonic Toughbook CF-54G2999VM | |
| Lenovo ThinkPad X1 Carbon 2019-20QE000VGE | |
| Genomsnitt Intel Core i5-8365U, Intel UHD Graphics 620 (3146 - 3546, n=4) | |
| Panasonic Toughbook FZ-55 | |
| Work Score Accelerated v2 | |
| Dell Latitude 7424 Rugged Extreme | |
| Dell Latitude 5420 Rugged-P85G | |
| Genomsnitt Intel Core i5-8365U, Intel UHD Graphics 620 (4381 - 4911, n=3) | |
| Lenovo ThinkPad X1 Carbon 2019-20QE000VGE | |
| Panasonic Toughbook FZ-55 | |
| PCMark 8 Home Score Accelerated v2 | 3146 poäng | |
| PCMark 8 Work Score Accelerated v2 | 4381 poäng | |
| PCMark 10 Score | 3751 poäng | |
Hjälp | ||
| Panasonic Toughbook FZ-55 Samsung SSD PM871b MZNLN256HAJQ | Getac S410 CUKUSA 1 TB SATA SSD Q0526A | Dell Latitude 5420 Rugged-P85G SK hynix PC401 NVMe 500 GB | Dell Latitude 7424 Rugged Extreme SK Hynix PC401 512GB M.2 (HFS512GD9TNG) | Lenovo ThinkPad X1 Carbon 2019-20QE000VGE WDC PC SN720 SDAQNTW-512G | |
|---|---|---|---|---|---|
| AS SSD | 52% | 122% | 107% | 268% | |
| Seq Read (MB/s) | 437.7 | 484.2 11% | 2054 369% | 2096 379% | 2978 580% |
| Seq Write (MB/s) | 387.3 | 396.1 2% | 653 69% | 1016 162% | 2287 490% |
| 4K Read (MB/s) | 26.18 | 34.9 33% | 39.34 50% | 39.91 52% | 47.39 81% |
| 4K Write (MB/s) | 60.3 | 74.1 23% | 96.4 60% | 97.9 62% | 175.6 191% |
| 4K-64 Read (MB/s) | 369.8 | 382.3 3% | 677 83% | 636 72% | 1209 227% |
| 4K-64 Write (MB/s) | 313.7 | 329 5% | 982 213% | 604 93% | 1148 266% |
| Access Time Read * (ms) | 0.089 | 0.058 35% | 0.044 51% | 0.044 51% | |
| Access Time Write * (ms) | 0.058 | 0.045 22% | 0.051 12% | 0.051 12% | 0.023 60% |
| Score Read (Points) | 440 | 466 6% | 921 109% | 886 101% | 1554 253% |
| Score Write (Points) | 413 | 443 7% | 1143 177% | 804 95% | 1553 276% |
| Score Total (Points) | 1083 | 1154 7% | 2475 129% | 2099 94% | 3874 258% |
| Copy ISO MB/s (MB/s) | 553 | 2151 289% | 1622 193% | ||
| Copy Program MB/s (MB/s) | 204.7 | 422.8 107% | 378.1 85% | ||
| Copy Game MB/s (MB/s) | 385.9 | 1045 171% | 793 105% |
* ... mindre är bättre

| 3DMark 11 | |
| 1280x720 Performance GPU | |
| Asus FX550IU-WSFX | |
| Razer Blade Stealth i7-8565U | |
| HP ProBook 445 G6 | |
| Intel NUC8i7BE | |
| Lenovo ThinkPad X1 Yoga 2019-20QGS00A00 | |
| Genomsnitt Intel UHD Graphics 620 (1144 - 3432, n=244) | |
| Panasonic Toughbook FZ-55 | |
| Dell Latitude 13 3390 | |
| Lenovo ThinkPad 13 20J1005TPB | |
| Chuwi LapBook Plus | |
| 1280x720 Performance Combined | |
| Razer Blade Stealth i7-8565U | |
| Asus FX550IU-WSFX | |
| Intel NUC8i7BE | |
| HP ProBook 445 G6 | |
| Lenovo ThinkPad X1 Yoga 2019-20QGS00A00 | |
| Genomsnitt Intel UHD Graphics 620 (927 - 2505, n=244) | |
| Dell Latitude 13 3390 | |
| Panasonic Toughbook FZ-55 | |
| Lenovo ThinkPad 13 20J1005TPB | |
| Chuwi LapBook Plus | |
| 3DMark | |
| 1280x720 Cloud Gate Standard Graphics | |
| Asus FX550IU-WSFX | |
| Razer Blade Stealth i7-8565U | |
| Intel NUC8i7BE | |
| HP ProBook 445 G6 | |
| Lenovo ThinkPad X1 Yoga 2019-20QGS00A00 | |
| Lenovo ThinkPad X1 Yoga 2019-20QGS00A00 | |
| Genomsnitt Intel UHD Graphics 620 (6205 - 16400, n=225) | |
| Dell Latitude 13 3390 | |
| Panasonic Toughbook FZ-55 | |
| Lenovo ThinkPad 13 20J1005TPB | |
| Chuwi LapBook Plus | |
| 1920x1080 Fire Strike Graphics | |
| Asus FX550IU-WSFX | |
| Razer Blade Stealth i7-8565U | |
| Intel NUC8i7BE | |
| HP ProBook 445 G6 | |
| Lenovo ThinkPad X1 Yoga 2019-20QGS00A00 | |
| Genomsnitt Intel UHD Graphics 620 (557 - 2608, n=213) | |
| Dell Latitude 13 3390 | |
| Panasonic Toughbook FZ-55 | |
| Lenovo ThinkPad 13 20J1005TPB | |
| 1920x1080 Ice Storm Extreme Graphics | |
| Asus FX550IU-WSFX | |
| HP ProBook 445 G6 | |
| Dell Latitude 13 3390 | |
| Genomsnitt Intel UHD Graphics 620 (26409 - 59483, n=71) | |
| Panasonic Toughbook FZ-55 | |
| Lenovo ThinkPad 13 20J1005TPB | |
| Chuwi LapBook Plus | |
| 3DMark 11 Performance | 1875 poäng | |
| 3DMark Ice Storm Standard Score | 57207 poäng | |
| 3DMark Cloud Gate Standard Score | 7800 poäng | |
| 3DMark Fire Strike Score | 967 poäng | |
| 3DMark Time Spy Score | 407 poäng | |
Hjälp | ||
| The Witcher 3 | |
| 1024x768 The Witcher 3 low | |
| Genomsnitt av klass Office (32.2 - 103.7, n=4, senaste 2 åren) | |
| Genomsnitt Intel UHD Graphics 620 (8.8 - 50.9, n=64) | |
| 1366x768 The Witcher 3 medium | |
| Genomsnitt av klass Office (44.7 - 63.9, n=4, senaste 2 åren) | |
| Genomsnitt Intel UHD Graphics 620 (8 - 27.9, n=29) | |
| 1920x1080 The Witcher 3 high | |
| Genomsnitt av klass Office (23.7 - 39.9, n=4, senaste 2 åren) | |
| Genomsnitt Intel UHD Graphics 620 (4.2 - 13.5, n=17) | |
| 1920x1080 The Witcher 3 ultra | |
| Genomsnitt av klass Office (14.8 - 18.1, n=4, senaste 2 åren) | |
| Genomsnitt Intel UHD Graphics 620 (2.97 - 5.2, n=7) | |
| Panasonic Toughbook FZ-55 UHD Graphics 620, i5-8365U, Samsung SSD PM871b MZNLN256HAJQ | Panasonic Toughbook CF-54G2999VM HD Graphics 620, i5-7300U, Seagate BarraCuda Compute 1TB ST1000LM048 | Getac S410 UHD Graphics 620, i5-8550U, CUKUSA 1 TB SATA SSD Q0526A | Dell Latitude 5420 Rugged-P85G Radeon RX 540, i7-8650U, SK hynix PC401 NVMe 500 GB | Dell Latitude 7424 Rugged Extreme Radeon RX 540, i7-8650U, SK Hynix PC401 512GB M.2 (HFS512GD9TNG) | Lenovo ThinkPad X1 Carbon 2019-20QE000VGE UHD Graphics 620, i7-8665U, WDC PC SN720 SDAQNTW-512G | |
|---|---|---|---|---|---|---|
| Noise | 1% | 5% | 3% | 0% | 4% | |
| av / miljö * (dB) | 29 | 28.3 2% | 28.4 2% | 28.3 2% | 28.6 1% | 28.4 2% |
| Idle Minimum * (dB) | 29 | 28.8 1% | 28.4 2% | 28.3 2% | 28.6 1% | 28.4 2% |
| Idle Average * (dB) | 29.6 | 28.8 3% | 28.4 4% | 28.3 4% | 28.6 3% | 28.4 4% |
| Idle Maximum * (dB) | 30.5 | 29.1 5% | 28.4 7% | 28.3 7% | 28.6 6% | 28.6 6% |
| Load Average * (dB) | 30.3 | 31.3 -3% | 30.3 -0% | 29.9 1% | 32.9 -9% | 31.5 -4% |
| Load Maximum * (dB) | 39 | 40 -3% | 33.3 15% | 38 3% | 39 -0% | 33.1 15% |
* ... mindre är bättre
Ljudnivå
| Låg belastning |
| 29 / 29.6 / 30.5 dB(A) |
| Hög belastning |
| 30.3 / 39 dB(A) |
 | ||
30 dB tyst 40 dB(A) hörbar 50 dB(A) högt ljud |
||
min: | ||
(+) Den maximala temperaturen på ovansidan är 36 °C / 97 F, jämfört med genomsnittet av 34.3 °C / 94 F , allt från 21.2 till 62.5 °C för klassen Office.
(+) Botten värms upp till maximalt 37.8 °C / 100 F, jämfört med genomsnittet av 36.8 °C / 98 F
(+) Vid tomgångsbruk är medeltemperaturen för ovansidan 22.7 °C / 73 F, jämfört med enhetsgenomsnittet på 29.5 °C / ### class_avg_f### F.
(+) Handledsstöden och pekplattan är kallare än hudtemperaturen med maximalt 28.6 °C / 83.5 F och är därför svala att ta på.
(±) Medeltemperaturen för handledsstödsområdet på liknande enheter var 27.5 °C / 81.5 F (-1.1 °C / -2 F).
Panasonic Toughbook FZ-55 ljudanalys
(+) | högtalare kan spela relativt högt (84.3 dB)
Bas 100 - 315 Hz
(-) | nästan ingen bas - i genomsnitt 30% lägre än medianen
(+) | basen är linjär (6.2% delta till föregående frekvens)
Mellan 400 - 2000 Hz
(±) | högre mellan - i genomsnitt 6.9% högre än median
(±) | linjäriteten för mids är genomsnittlig (9.7% delta till föregående frekvens)
Högsta 2 - 16 kHz
(+) | balanserade toppar - endast 0.9% från medianen
(+) | toppar är linjära (3.8% delta till föregående frekvens)
Totalt 100 - 16 000 Hz
(±) | linjäriteten för det totala ljudet är genomsnittlig (28% skillnad mot median)
Jämfört med samma klass
» 87% av alla testade enheter i den här klassen var bättre, 3% liknande, 9% sämre
» Den bästa hade ett delta på 7%, genomsnittet var 21%, sämst var 53%
Jämfört med alla testade enheter
» 85% av alla testade enheter var bättre, 3% liknande, 12% sämre
» Den bästa hade ett delta på 4%, genomsnittet var 24%, sämst var 134%
Apple MacBook 12 (Early 2016) 1.1 GHz ljudanalys
(+) | högtalare kan spela relativt högt (83.6 dB)
Bas 100 - 315 Hz
(±) | reducerad bas - i genomsnitt 11.3% lägre än medianen
(±) | linjäriteten för basen är genomsnittlig (14.2% delta till föregående frekvens)
Mellan 400 - 2000 Hz
(+) | balanserad mellan - endast 2.4% från medianen
(+) | mids är linjära (5.5% delta till föregående frekvens)
Högsta 2 - 16 kHz
(+) | balanserade toppar - endast 2% från medianen
(+) | toppar är linjära (4.5% delta till föregående frekvens)
Totalt 100 - 16 000 Hz
(+) | det totala ljudet är linjärt (10.2% skillnad mot median)
Jämfört med samma klass
» 7% av alla testade enheter i den här klassen var bättre, 2% liknande, 91% sämre
» Den bästa hade ett delta på 5%, genomsnittet var 18%, sämst var 53%
Jämfört med alla testade enheter
» 5% av alla testade enheter var bättre, 1% liknande, 94% sämre
» Den bästa hade ett delta på 4%, genomsnittet var 24%, sämst var 134%
| Av/Standby | |
| Låg belastning | |
| Hög belastning |
|
Förklaring:
min: | |
| Panasonic Toughbook FZ-55 i5-8365U, UHD Graphics 620, Samsung SSD PM871b MZNLN256HAJQ, IPS, 1920x1080, 14" | Panasonic Toughbook CF-54G2999VM i5-7300U, HD Graphics 620, Seagate BarraCuda Compute 1TB ST1000LM048, TN LED, 1366x768, 14" | Getac S410 i5-8550U, UHD Graphics 620, CUKUSA 1 TB SATA SSD Q0526A, TN PED, 1366x768, 14" | Dell Latitude 5420 Rugged-P85G i7-8650U, Radeon RX 540, SK hynix PC401 NVMe 500 GB, IPS, 1920x1080, 14" | Dell Latitude 7424 Rugged Extreme i7-8650U, Radeon RX 540, SK Hynix PC401 512GB M.2 (HFS512GD9TNG), IPS, 1920x1080, 14" | Lenovo ThinkPad X1 Carbon 2019-20QE000VGE i7-8665U, UHD Graphics 620, WDC PC SN720 SDAQNTW-512G, IPS, 2560x1440, 14" | |
|---|---|---|---|---|---|---|
| Power Consumption | 22% | 11% | -41% | -59% | 14% | |
| Idle Minimum * (Watt) | 3.7 | 4.4 -19% | 5.6 -51% | 4.8 -30% | 6.5 -76% | 3 19% |
| Idle Average * (Watt) | 9.6 | 6.3 34% | 7.9 18% | 13.6 -42% | 15.1 -57% | 6.3 34% |
| Idle Maximum * (Watt) | 10.4 | 6.5 37% | 8.4 19% | 13.8 -33% | 16.1 -55% | 8.9 14% |
| Load Average * (Watt) | 40 | 36.3 9% | 32.8 18% | 67.8 -69% | 70.5 -76% | 40.8 -2% |
| Load Maximum * (Watt) | 71.9 | 38.3 47% | 34.3 52% | 93.5 -30% | 95.2 -32% | 67.5 6% |
| Witcher 3 ultra * (Watt) | 69.1 | 68.1 |
* ... mindre är bättre
| Panasonic Toughbook FZ-55 i5-8365U, UHD Graphics 620, 71 Wh | Panasonic Toughbook CF-54G2999VM i5-7300U, HD Graphics 620, 33 Wh | Getac S410 i5-8550U, UHD Graphics 620, 46.6 Wh | Dell Latitude 5420 Rugged-P85G i7-8650U, Radeon RX 540, 102 Wh | Dell Latitude 7424 Rugged Extreme i7-8650U, Radeon RX 540, 102 Wh | Lenovo ThinkPad X1 Carbon 2019-20QE000VGE i7-8665U, UHD Graphics 620, 51 Wh | |
|---|---|---|---|---|---|---|
| Batteridrifttid | -68% | -72% | -12% | -36% | -55% | |
| WiFi v1.3 (h) | 18.4 | 5.9 -68% | 5.2 -72% | 16.2 -12% | 11.7 -36% | 8.2 -55% |
| Reader / Idle (h) | 31.4 | |||||
| Load (h) | 3.2 | 2.7 | 1.4 |
För
Emot
Läs den fullständiga versionen av den här recensionen på engelska här.
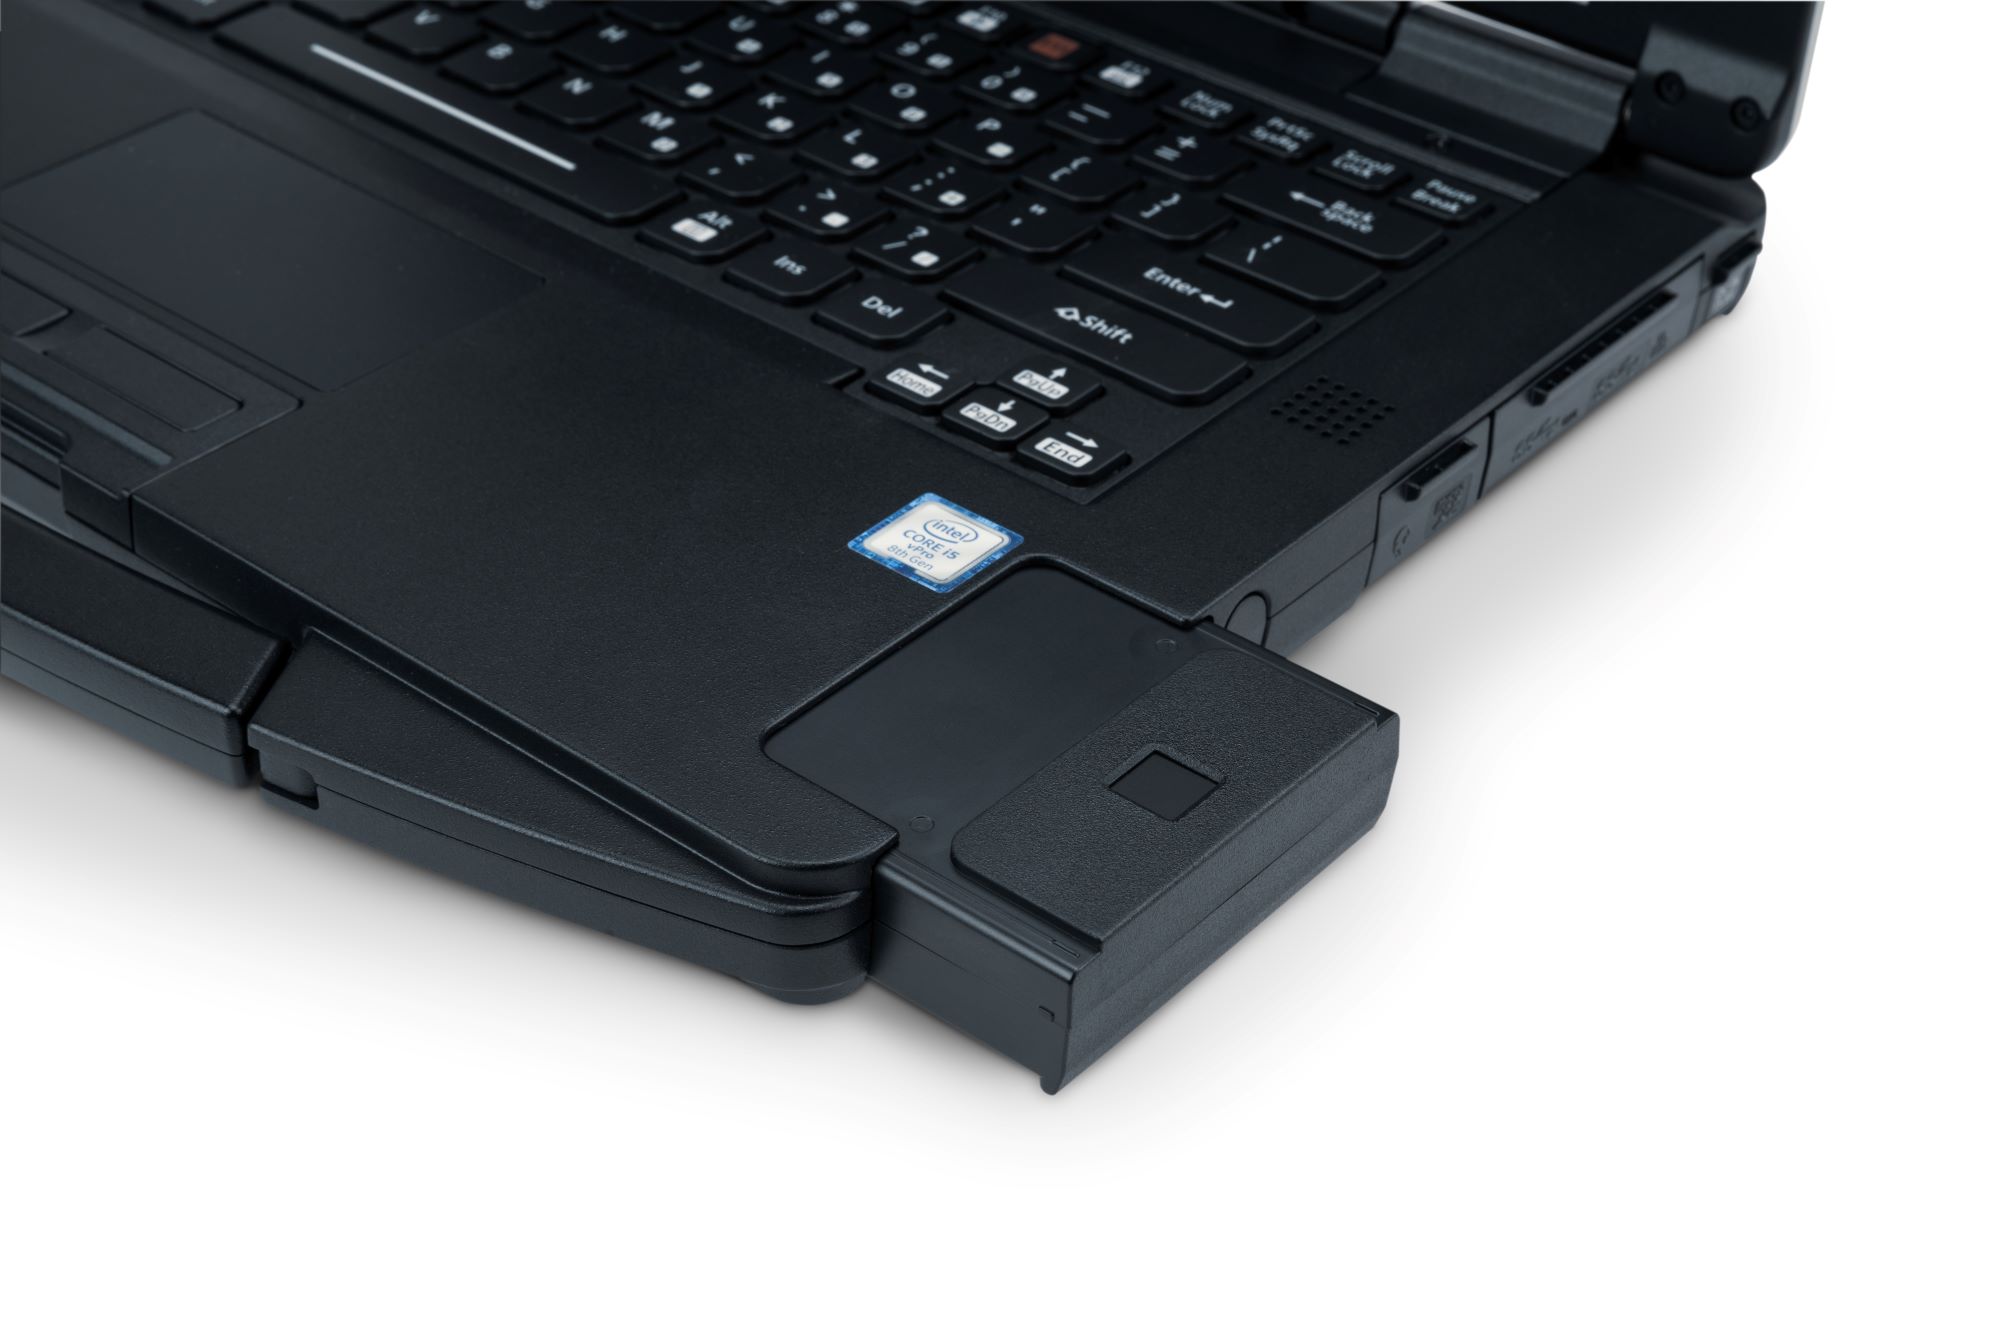
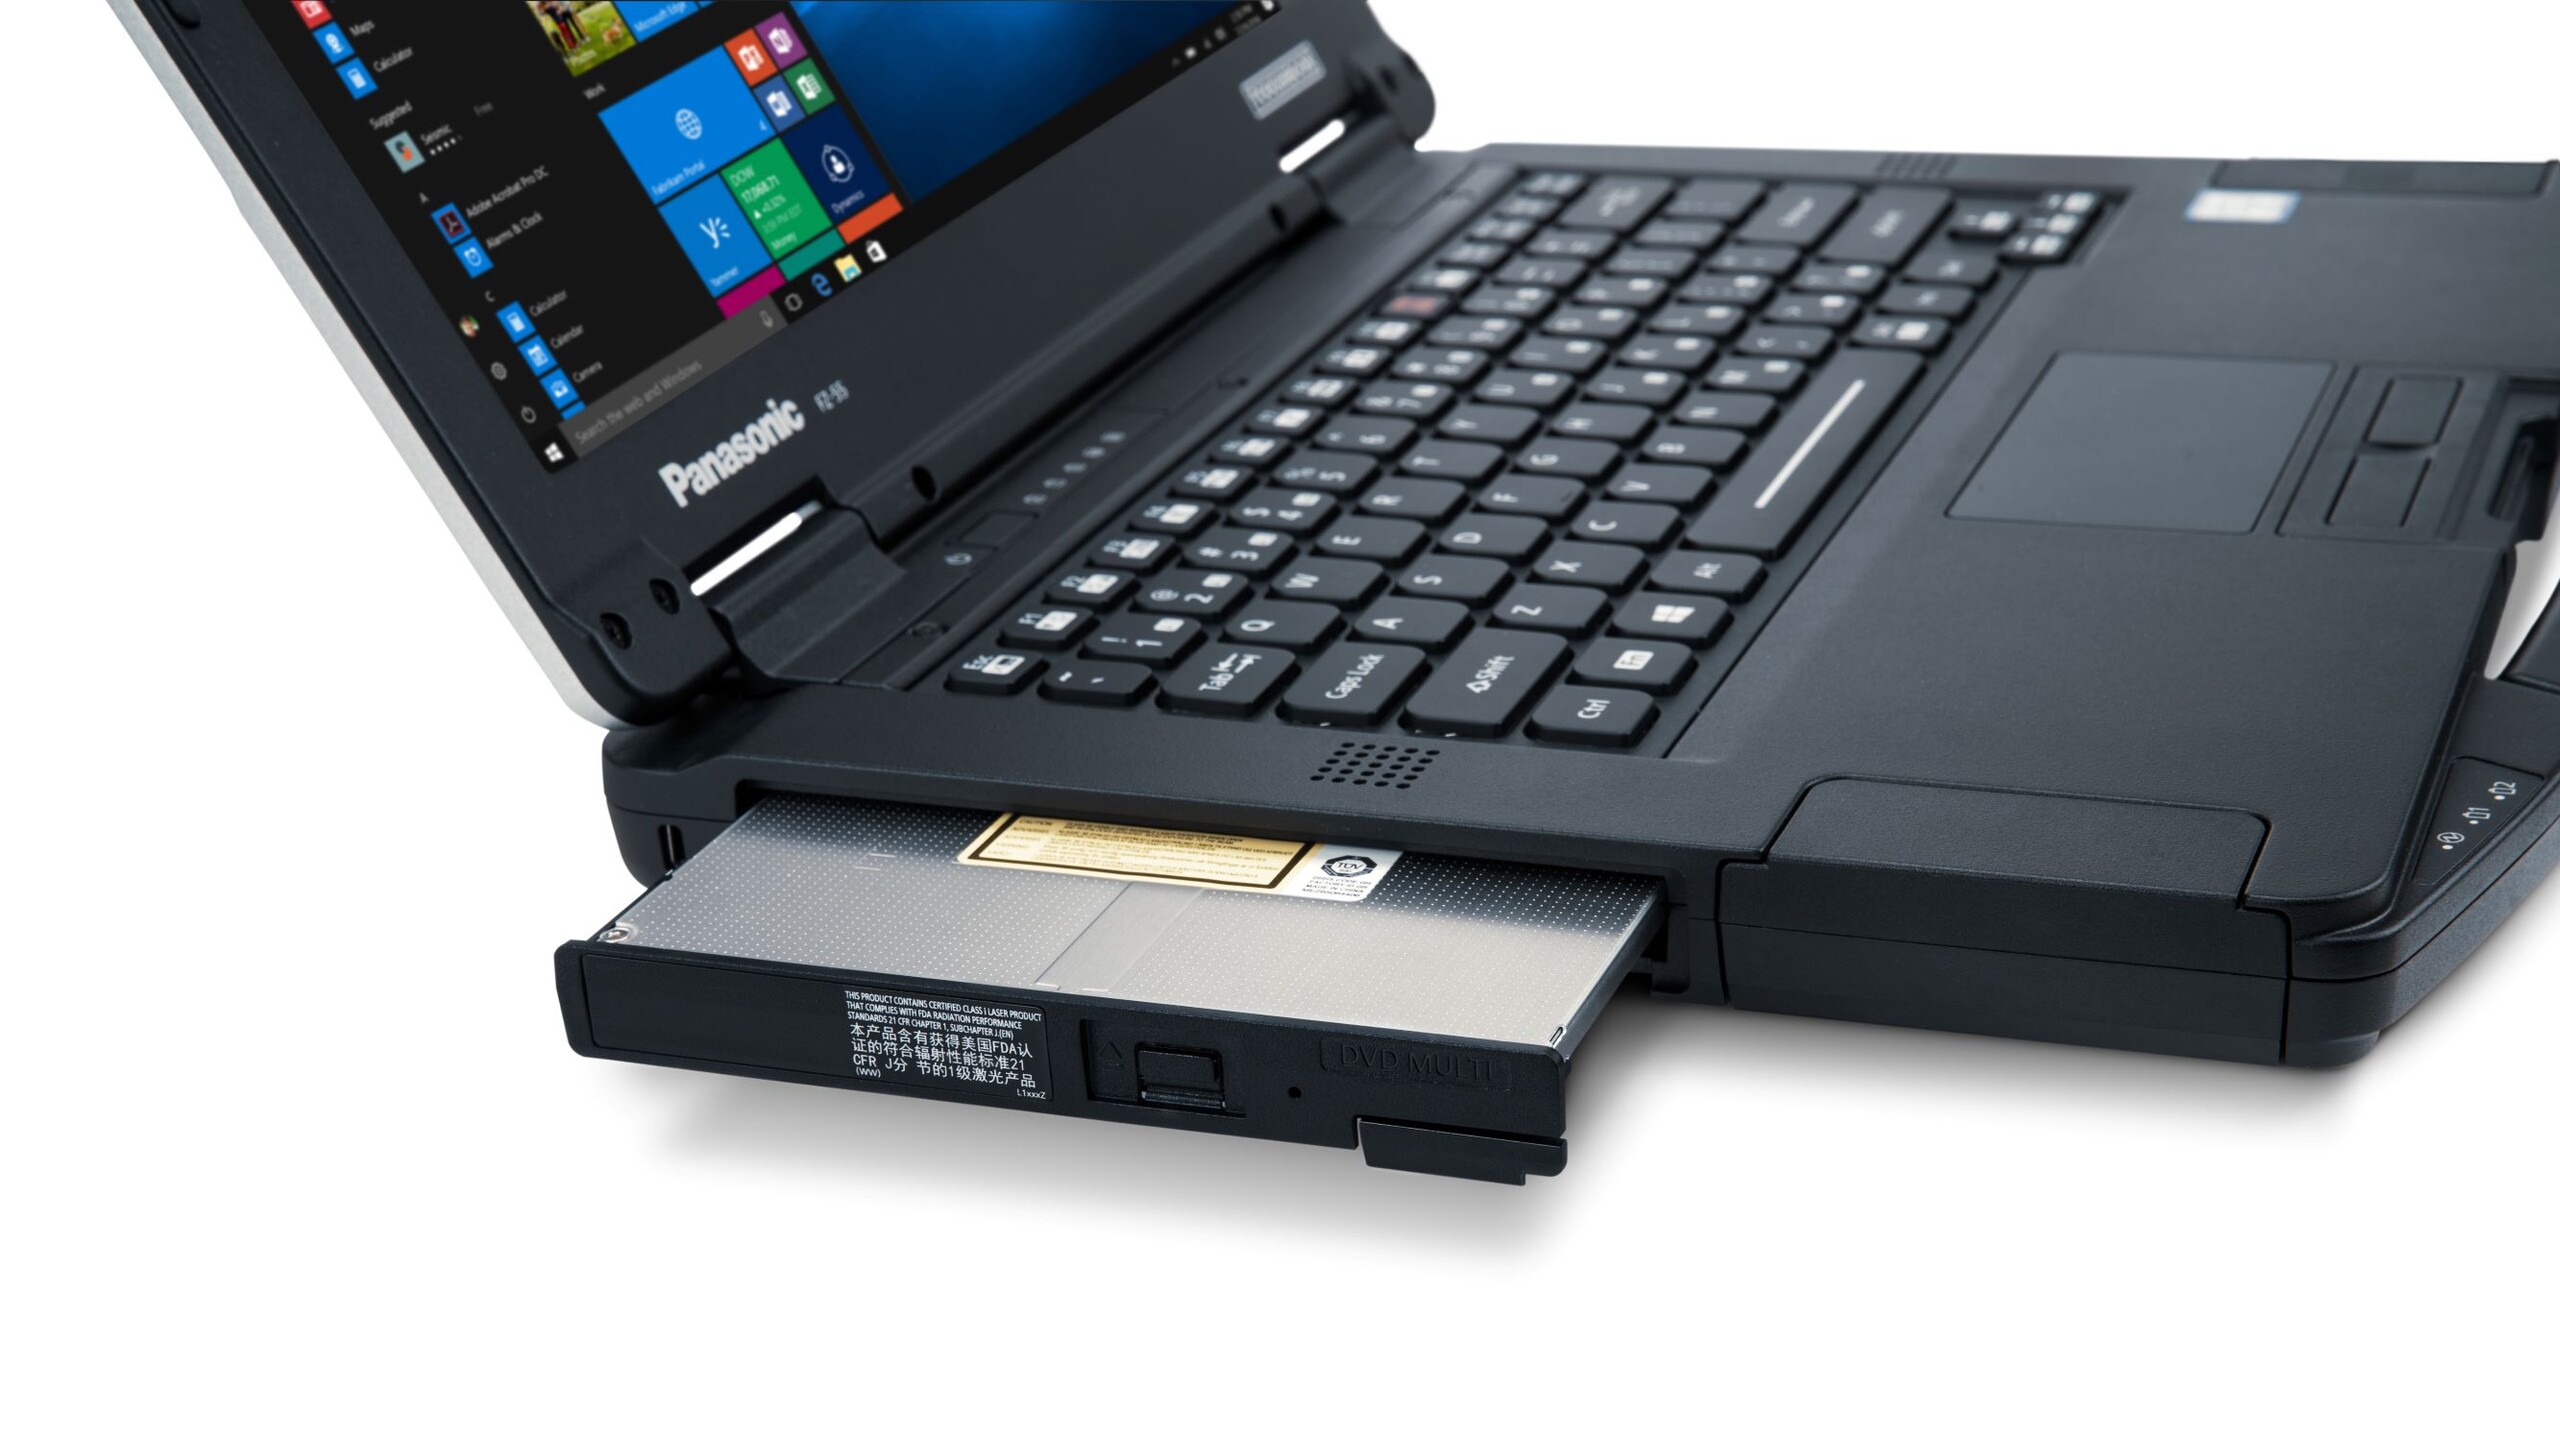
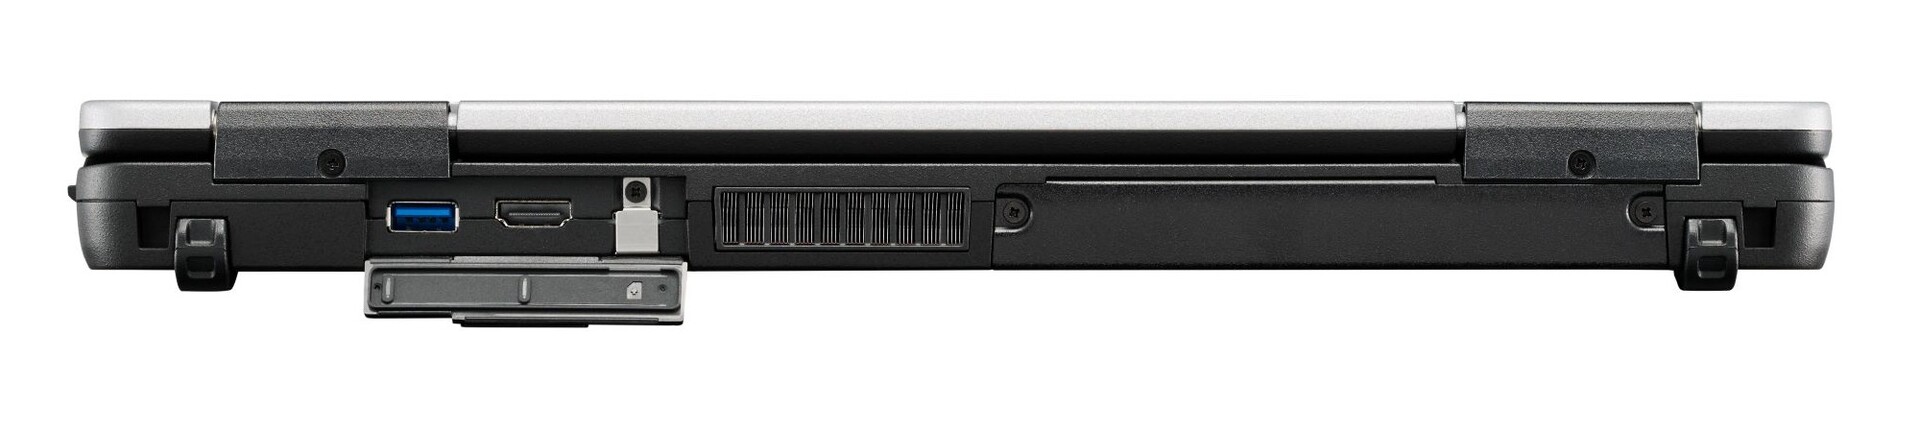
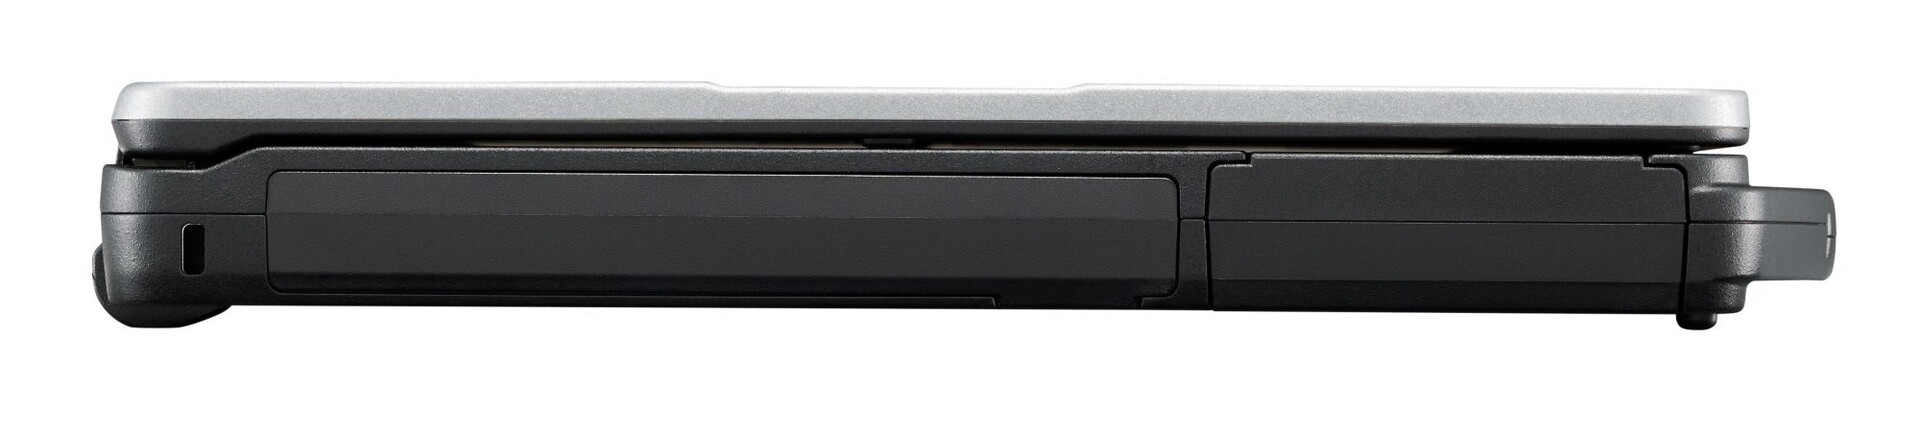
Toughbook 55 har 70 procent högre CPU-prestanda än Toughbook 54 samtidigt som den är bakåtkompatibel med alla sina tillbehör. Batteritiden är dessutom extraordinärt lång och ger 18 timmar konstant WLAN-användning. Möjligheten att byta ut batterier, M.2-enheter, WAN och SATA-expansion gör detta till en mångsidig maskin för den som är ute i fält.
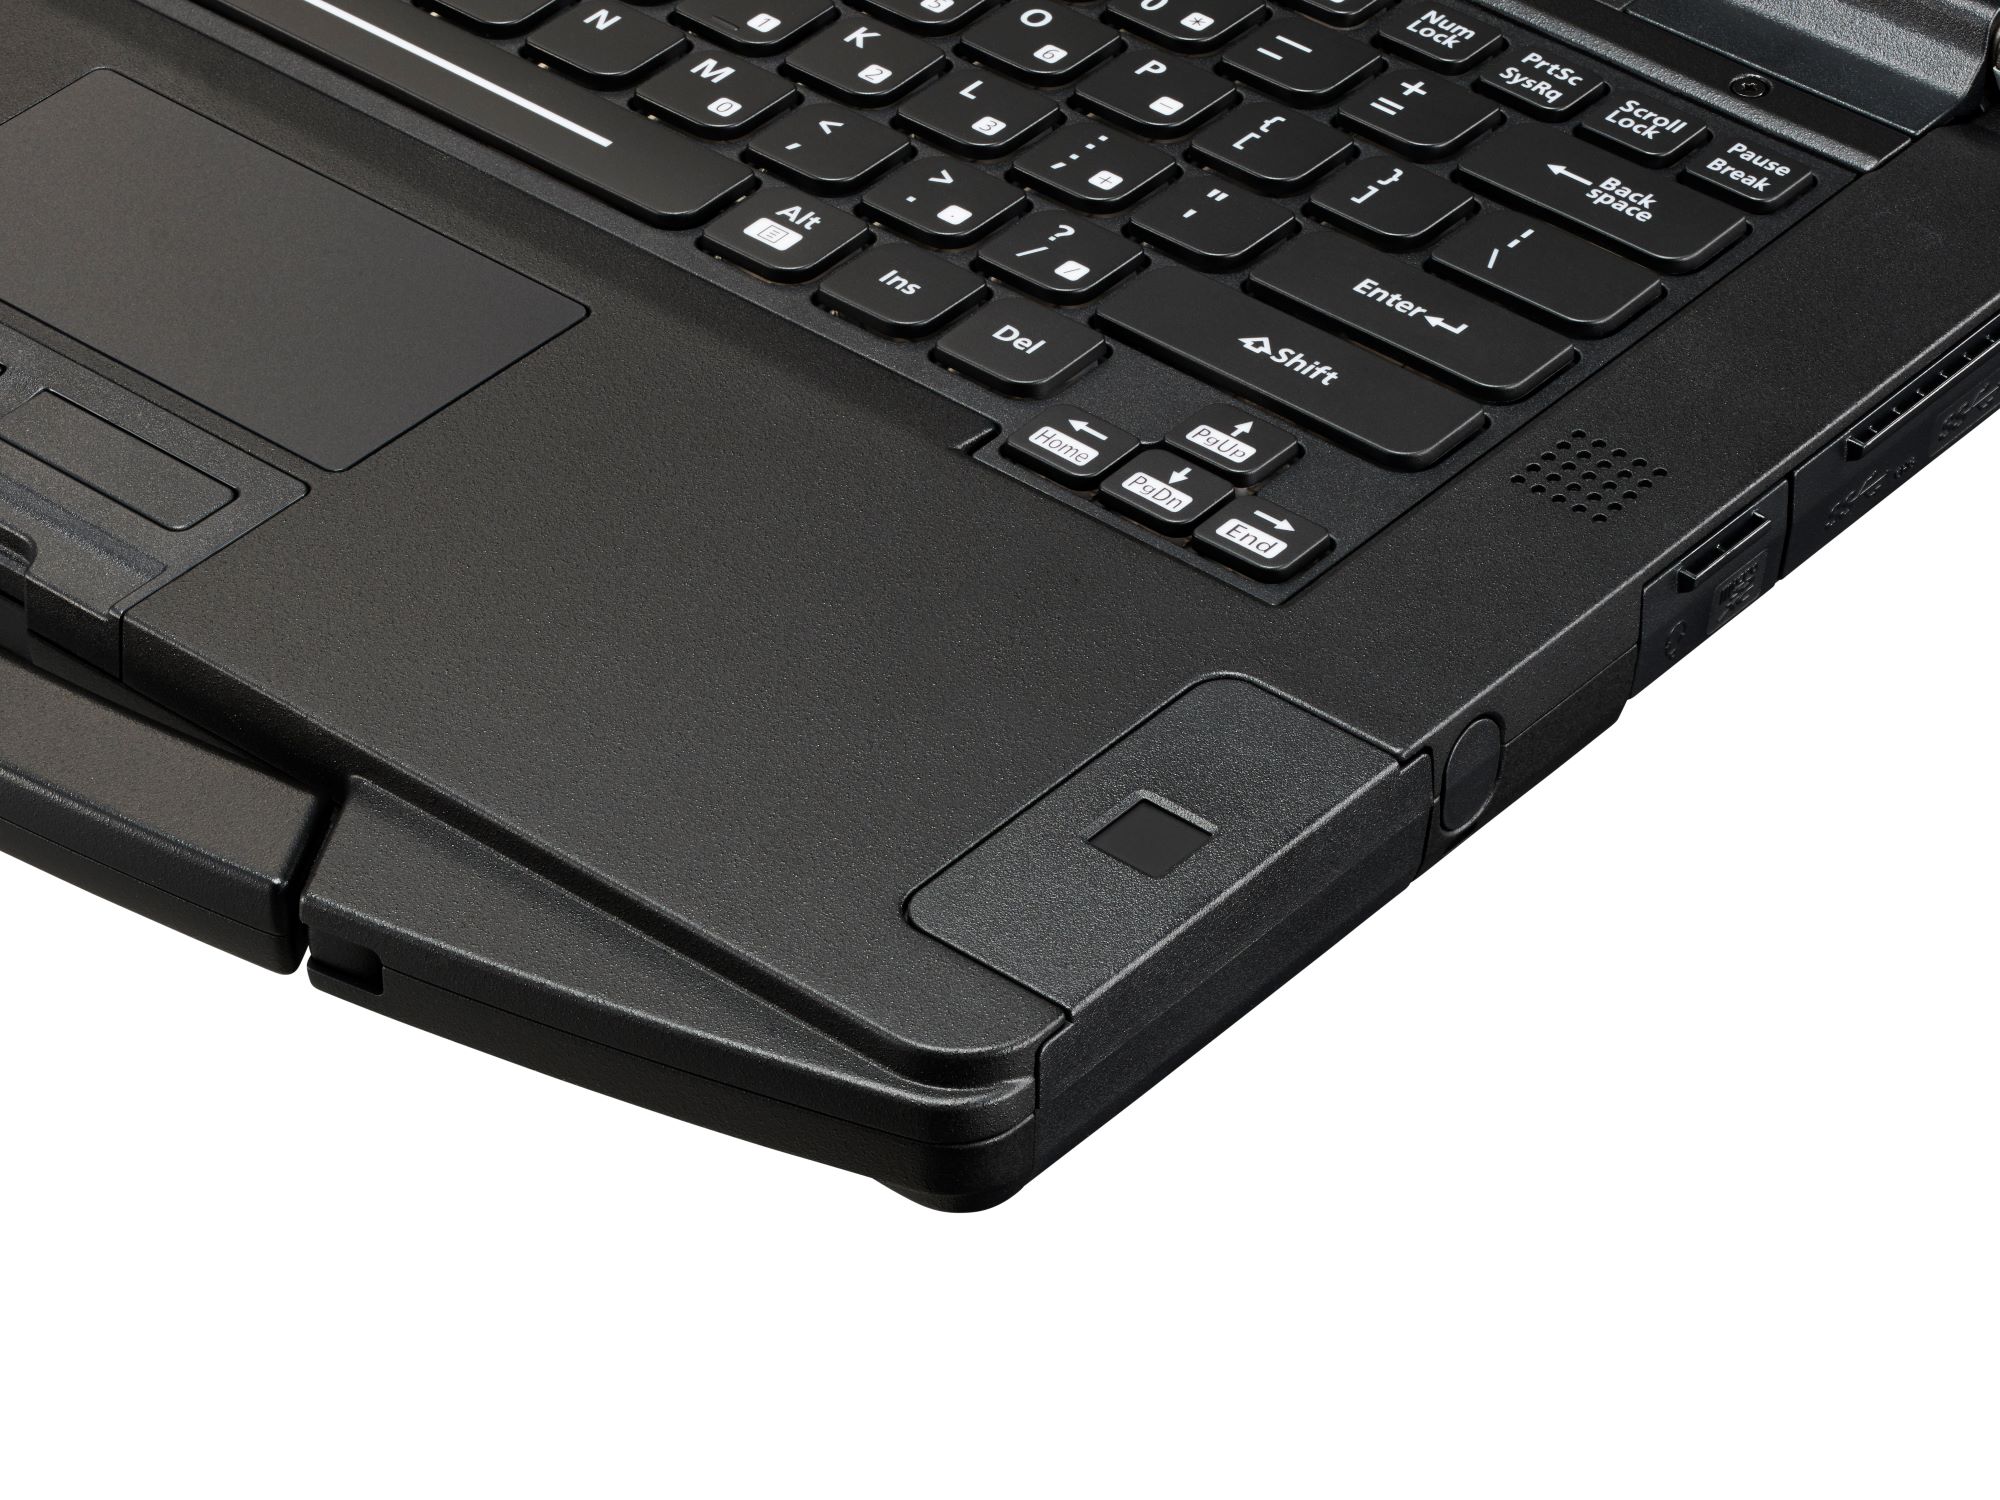
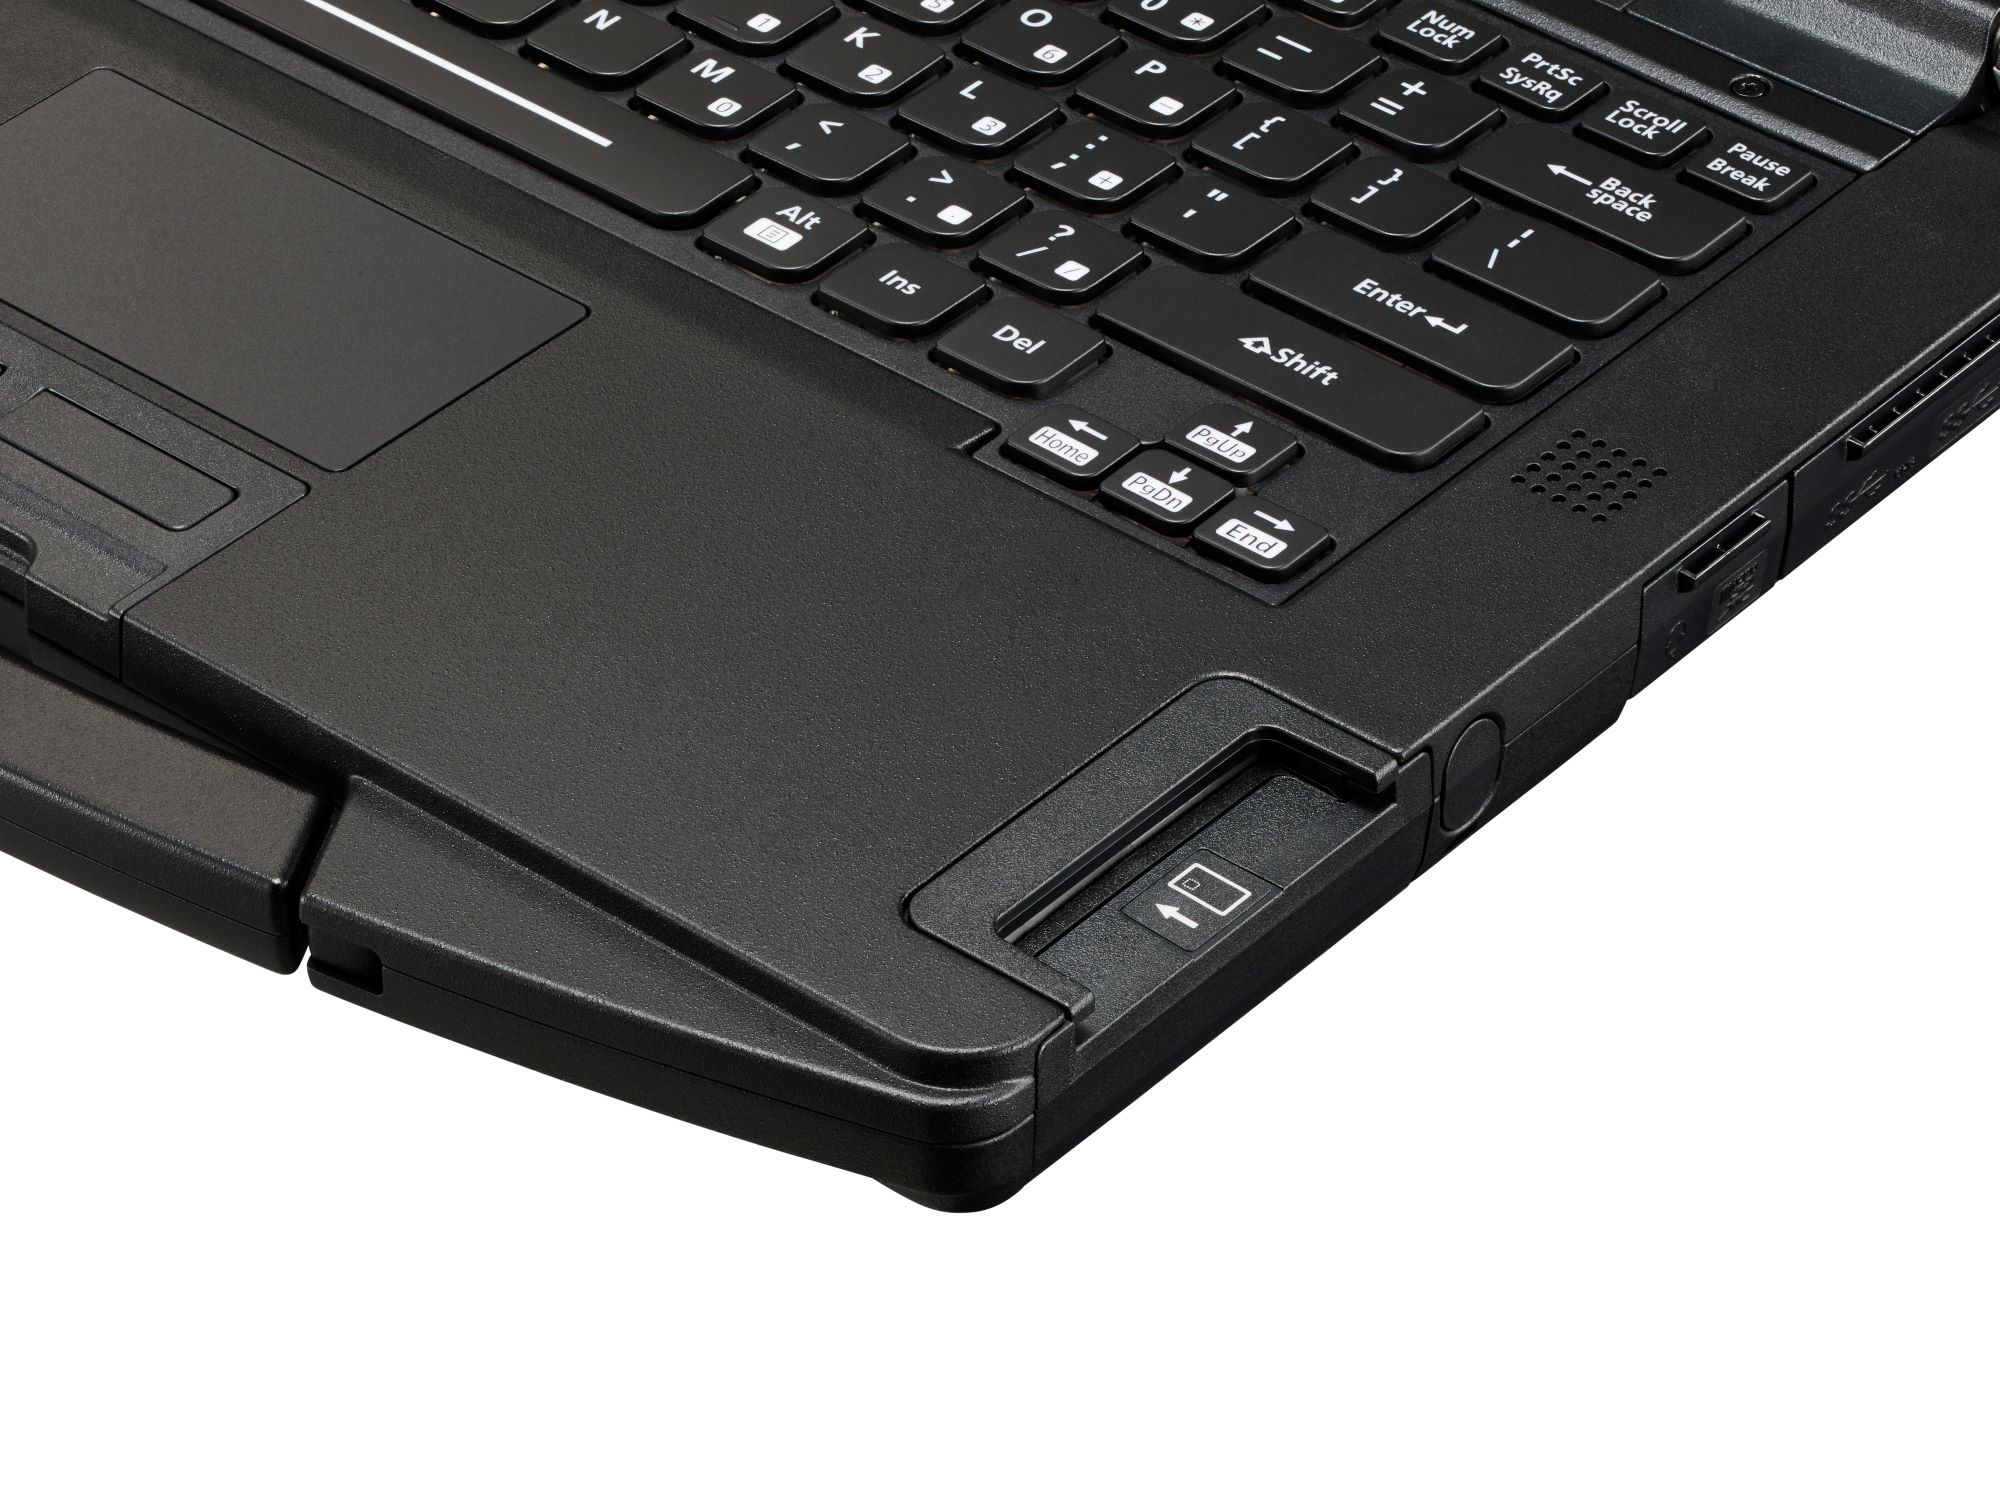
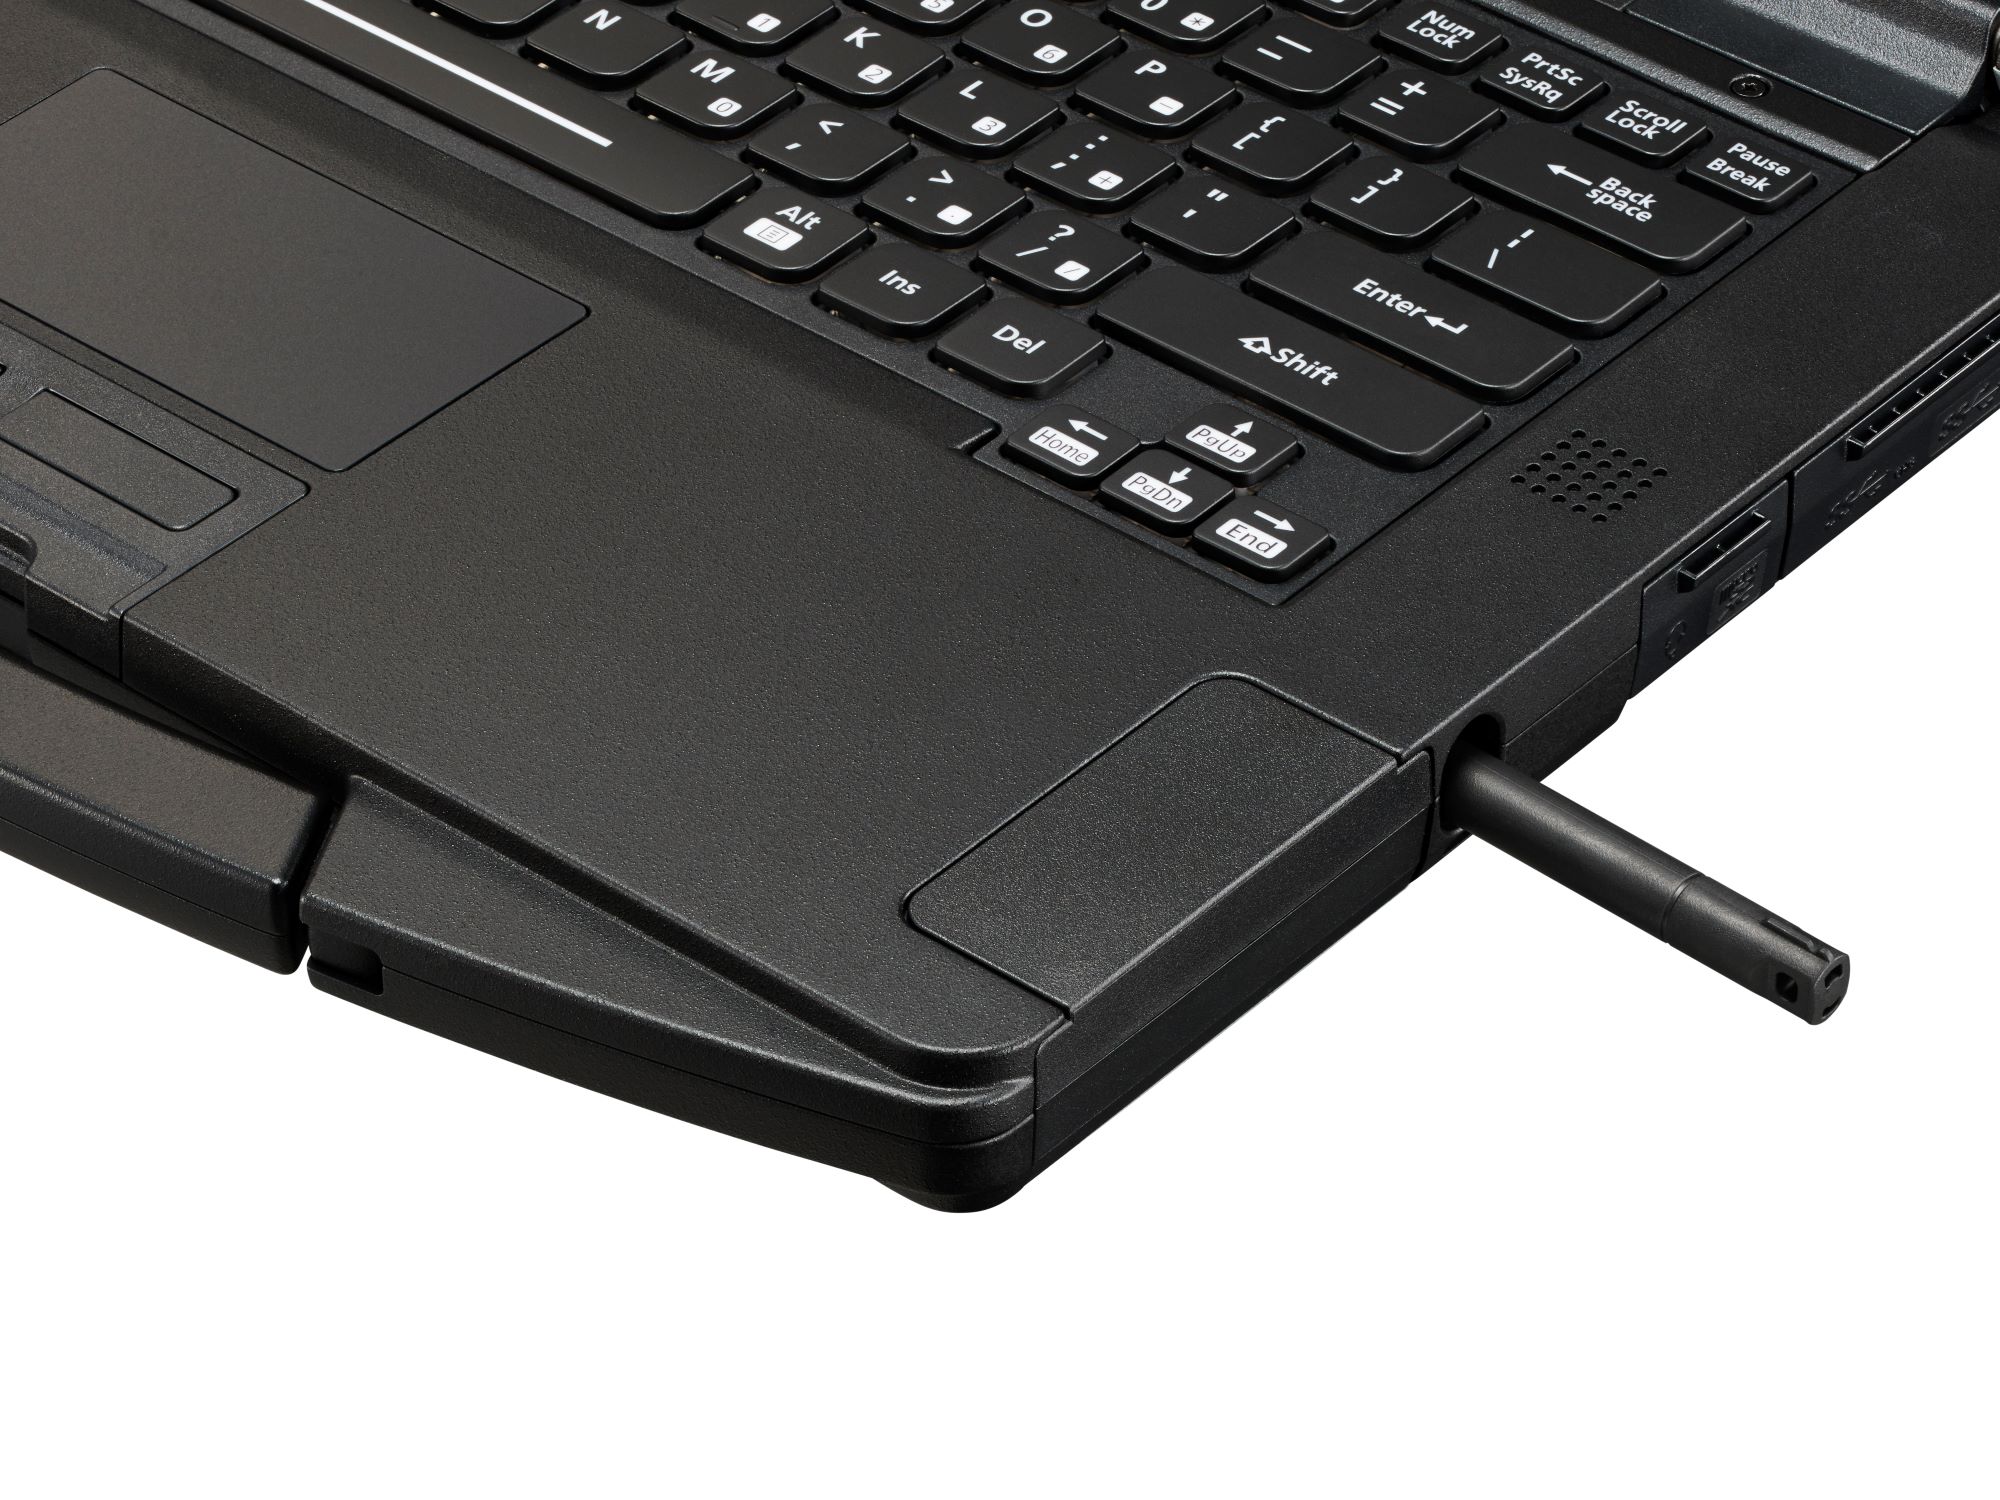
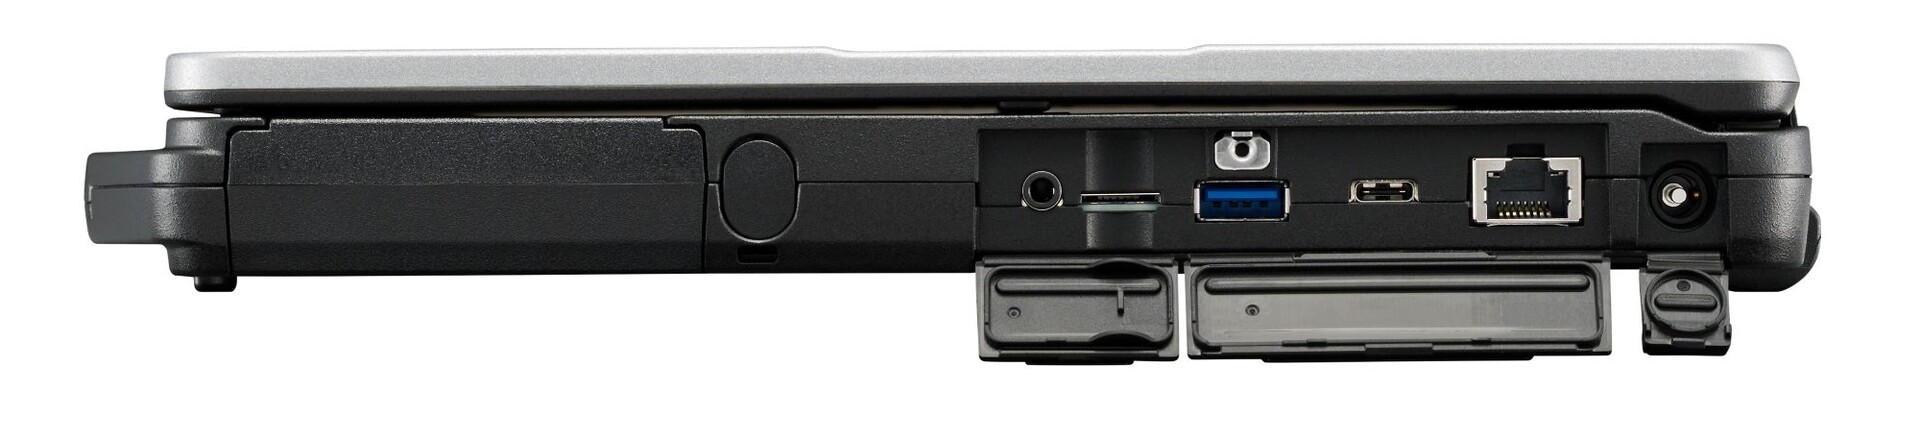
Det finns aspekter vi anser kunde varit bättre. En långsammare MicroSD-kortläsare är en nedgradering jämfört med förra generationens modell och de små piltangenterna känns för trånga. En del funktioner som vanligtvis är standard på de flesta Ultrabook-modeller har Toughbook endast som tillval, vilket inkluderar USB Typ C PD och fingeravtrycksläsare. Andra funktioner saknas helt och hållet såsom Thunderbolt 3, 4K UHD och NFC. Vidare kunde den ljusstarka skärmen varit en aning mindre grynig och haft djupare färger. För en bättre visuell upplevelse hade det också varit bra om den inte använde PWM och om bakgrundsbelysningen inte led av ojämn bleeding.
Du skaffar Toughbook 55 för rejäl uthållighet, en ljusstark skärm, ett stort utbud av tillbehör och lättutförd service. Men förvänta dig inte optimal färgåtergivning eller optimal prestanda då den är begränsad till en processor från Intels U-klass med en tre år gammal Radeon GPU som tillval.
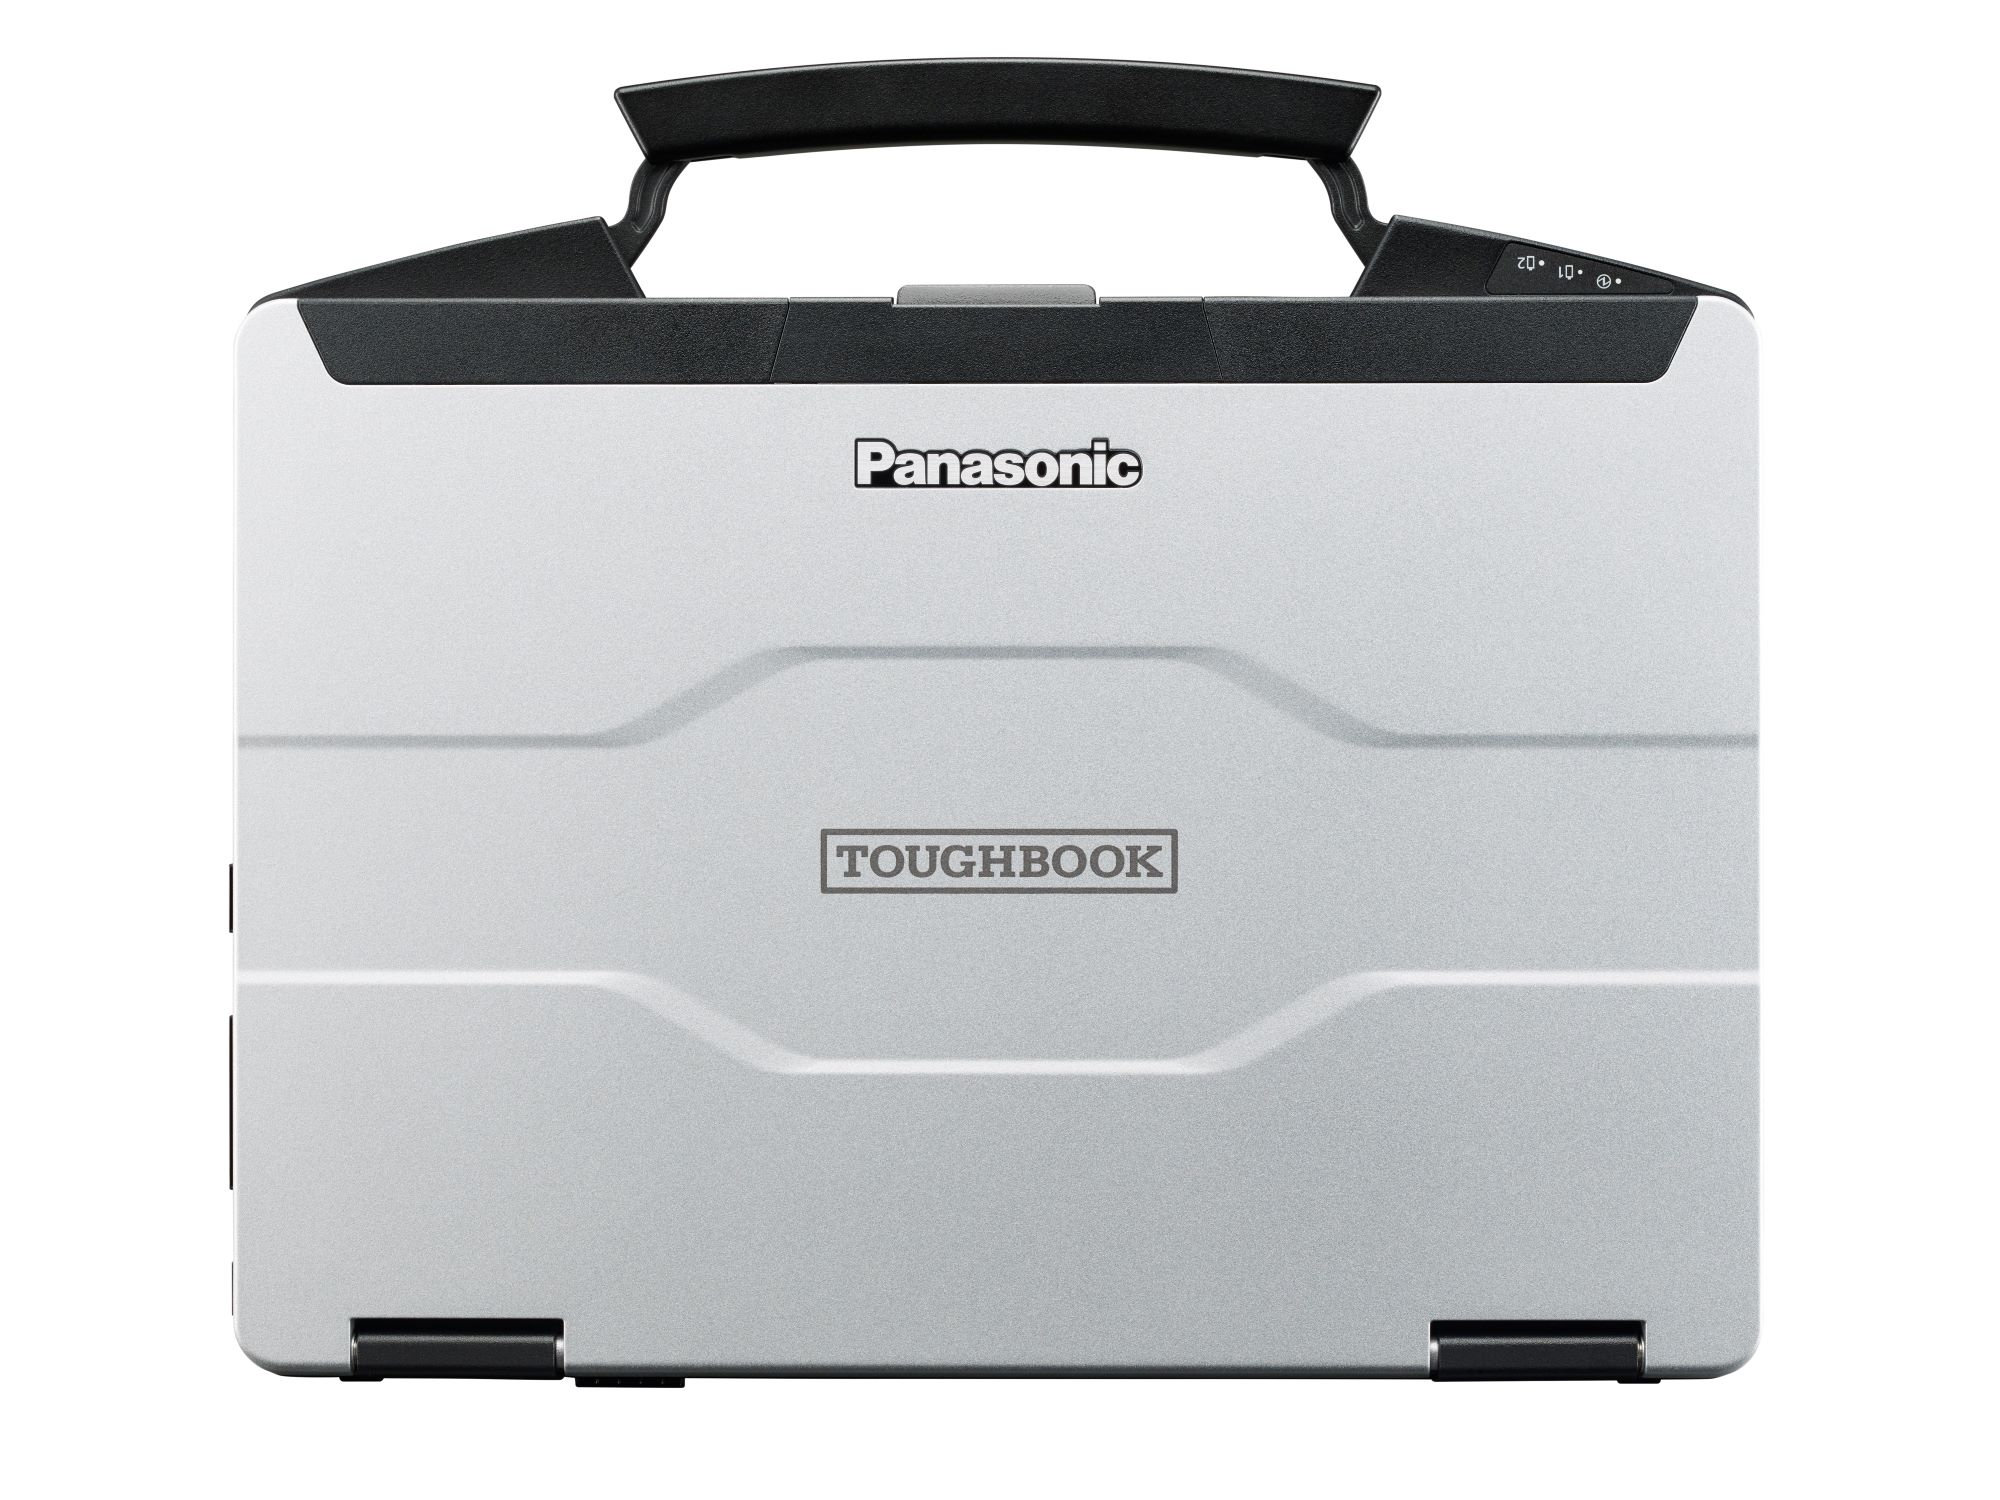
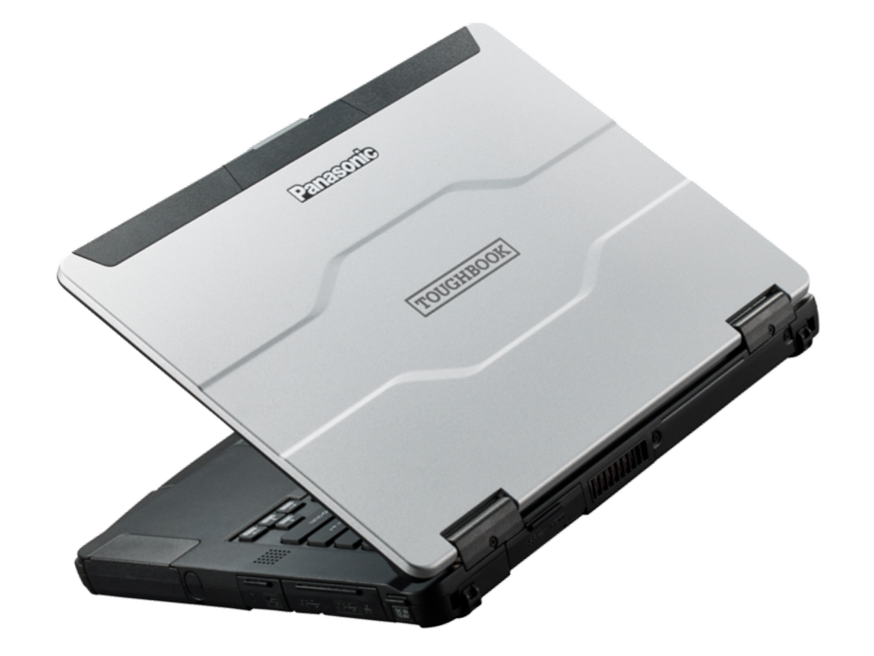
Panasonic Toughbook FZ-55
- 05/14/2020 v7 (old)
Allen Ngo
Price comparison
