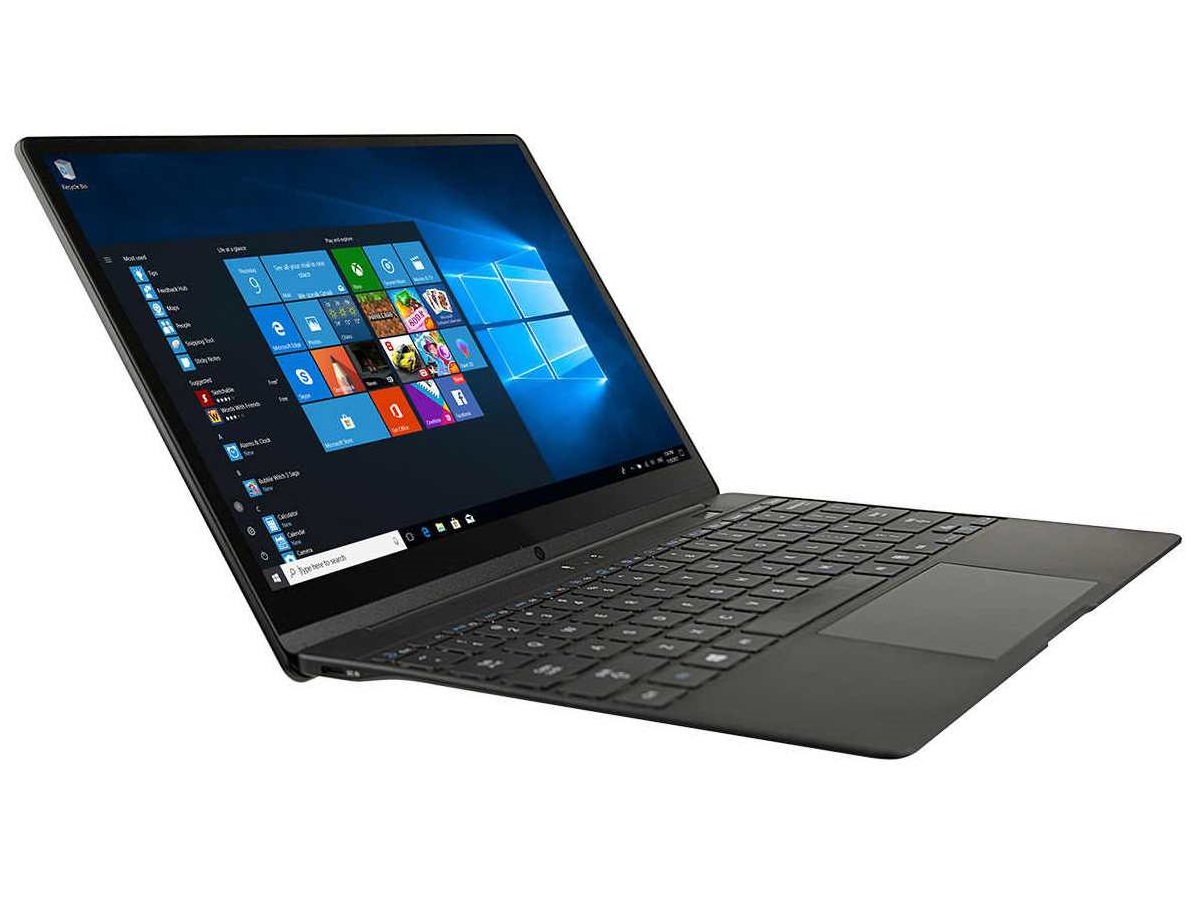
Test: NuVision Encite Book 12 Plus (N3350, QHD) Laptop (Sammanfattning)
| Networking | |
| iperf3 transmit AX12 | |
| Dell Latitude 5290 | |
| Lenovo ThinkPad A275 | |
| Microsoft Surface Go MHN-00003 | |
| Apple MacBook Air 2018 | |
| NuVision Encite Book 12 Plus | |
| Chuwi LapBook SE | |
| iperf3 receive AX12 | |
| Dell Latitude 5290 | |
| Microsoft Surface Go MHN-00003 | |
| Apple MacBook Air 2018 | |
| Lenovo ThinkPad A275 | |
| NuVision Encite Book 12 Plus | |
| Chuwi LapBook SE | |
| |||||||||||||||||||||||||
Distribution av ljusstyrkan: 80 %
Mitt på batteriet: 431.5 cd/m²
Kontrast: 1003:1 (Svärta: 0.43 cd/m²)
ΔE ColorChecker Calman: 3.56 | ∀{0.5-29.43 Ø4.71}
calibrated: 3.34
ΔE Greyscale Calman: 2.9 | ∀{0.09-98 Ø4.96}
98.9% sRGB (Argyll 1.6.3 3D)
66.7% AdobeRGB 1998 (Argyll 1.6.3 3D)
75.6% AdobeRGB 1998 (Argyll 3D)
98.9% sRGB (Argyll 3D)
74.8% Display P3 (Argyll 3D)
Gamma: 2.2
CCT: 6572 K
| NuVision Encite Book 12 Plus Sharp SHP142C, IPS, 12.5", 2560x1440 | Microsoft Surface Go MHN-00003 Sharp SHP14A6, IPS, 10", 1800x1200 | Dell Latitude 5290 AUO B125XW01-V0, TN LED, 12.5", 1366x768 | Lenovo ThinkPad A275 Len40E0, TN, 12.5", 1366x768 | Chuwi LapBook SE 13.3", 1920x1080 | Apple MacBook Air 2018 APPA039, IPS, 13.3", 2560x1600 | |
|---|---|---|---|---|---|---|
| Display | -8% | -45% | -41% | -10% | -7% | |
| Display P3 Coverage (%) | 74.8 | 66.5 -11% | 39.22 -48% | 42.05 -44% | 65 -13% | 67.8 -9% |
| sRGB Coverage (%) | 98.9 | 97.5 -1% | 59 -40% | 62.8 -37% | 94.8 -4% | 96.1 -3% |
| AdobeRGB 1998 Coverage (%) | 75.6 | 67.5 -11% | 40.56 -46% | 43.48 -42% | 66.5 -12% | 69.8 -8% |
| Response Times | 1% | 18% | 9% | 4% | 3% | |
| Response Time Grey 50% / Grey 80% * (ms) | 37.6 ? | 44 ? -17% | 46.8 ? -24% | 41 ? -9% | 39.2 ? -4% | 39.6 ? -5% |
| Response Time Black / White * (ms) | 31.6 ? | 25.6 ? 19% | 12.8 ? 59% | 23 ? 27% | 27.7 ? 12% | 28 ? 11% |
| PWM Frequency (Hz) | 198.4 ? | 1020 ? | 800 ? | 200 ? | 113600 ? | |
| Screen | 30% | -101% | -79% | -47% | 26% | |
| Brightness middle (cd/m²) | 431.5 | 456 6% | 232 -46% | 255 -41% | 227 -47% | 320 -26% |
| Brightness (cd/m²) | 406 | 426 5% | 218 -46% | 244 -40% | 210 -48% | 315 -22% |
| Brightness Distribution (%) | 80 | 88 10% | 86 8% | 87 9% | 89 11% | 95 19% |
| Black Level * (cd/m²) | 0.43 | 0.31 28% | 0.54 -26% | 0.52 -21% | 0.44 -2% | 0.29 33% |
| Contrast (:1) | 1003 | 1471 47% | 430 -57% | 490 -51% | 516 -49% | 1103 10% |
| Colorchecker dE 2000 * | 3.56 | 1.3 63% | 11.8 -231% | 9.76 -174% | 6.6 -85% | 1.2 66% |
| Colorchecker dE 2000 max. * | 7 | 3 57% | 23.2 -231% | 14.53 -108% | 12.2 -74% | 3.2 54% |
| Colorchecker dE 2000 calibrated * | 3.34 | 1.1 67% | 3.9 -17% | 1.9 43% | 0.5 85% | |
| Greyscale dE 2000 * | 2.9 | 1.4 52% | 13.9 -379% | 11.13 -284% | 7.9 -172% | 0.8 72% |
| Gamma | 2.2 100% | 2.24 98% | 2.13 103% | 2.38 92% | 2.16 102% | 2.2 100% |
| CCT | 6572 99% | 6687 97% | 16629 39% | 12214 53% | 8879 73% | 6548 99% |
| Color Space (Percent of AdobeRGB 1998) (%) | 66.7 | 62.3 -7% | 37.6 -44% | 40 -40% | 62.1 -7% | |
| Color Space (Percent of sRGB) (%) | 98.9 | 96.8 -2% | 59.2 -40% | 63 -36% | 96 -3% | |
| Totalt genomsnitt (program/inställningar) | 8% /
19% | -43% /
-76% | -37% /
-59% | -18% /
-32% | 7% /
17% |
* ... mindre är bättre
Visa svarstider
| ↔ Svarstid svart till vitt | ||
|---|---|---|
| 31.6 ms ... stiga ↗ och falla ↘ kombinerat | ↗ 16.8 ms stiga | 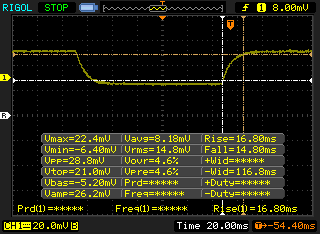 |
| ↘ 14.8 ms hösten | ||
| Skärmen visar långsamma svarsfrekvenser i våra tester och kommer att vara otillfredsställande för spelare. I jämförelse sträcker sig alla testade enheter från 0.1 (minst) till 240 (maximalt) ms. » 85 % av alla enheter är bättre. Detta innebär att den uppmätta svarstiden är sämre än genomsnittet av alla testade enheter (19.8 ms). | ||
| ↔ Svarstid 50 % grått till 80 % grått | ||
| 37.6 ms ... stiga ↗ och falla ↘ kombinerat | ↗ 20.4 ms stiga | 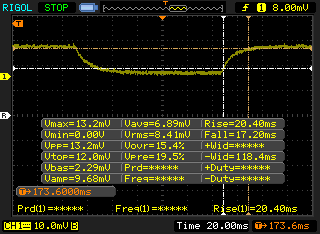 |
| ↘ 17.2 ms hösten | ||
| Skärmen visar långsamma svarsfrekvenser i våra tester och kommer att vara otillfredsställande för spelare. I jämförelse sträcker sig alla testade enheter från 0.165 (minst) till 636 (maximalt) ms. » 55 % av alla enheter är bättre. Detta innebär att den uppmätta svarstiden är sämre än genomsnittet av alla testade enheter (30.9 ms). | ||
Skärmflimmer / PWM (Puls-Width Modulation)
| Skärmflimmer / PWM upptäckt | 198.4 Hz | ≤ 25 % ljusstyrka inställning | 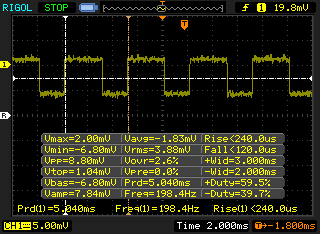 |
Displayens bakgrundsbelysning flimrar vid 198.4 Hz (i värsta fall, t.ex. med PWM) Flimrande upptäckt vid en ljusstyrkeinställning på 25 % och lägre. Det ska inte finnas något flimmer eller PWM över denna ljusstyrkeinställning. Frekvensen för 198.4 Hz är relativt låg, så känsliga användare kommer sannolikt att märka flimmer och uppleva ansträngda ögon vid den angivna ljusstyrkeinställningen och nedan. Som jämförelse: 52 % av alla testade enheter använder inte PWM för att dämpa skärmen. Om PWM upptäcktes mättes ett medelvärde av 7741 (minst: 5 - maximum: 343500) Hz. | |||
| Cinebench R15 | |
| CPU Single 64Bit | |
| Dell Latitude 5290 | |
| Apple MacBook Air 2018 | |
| Intel NUC7CJYH | |
| Lenovo ThinkPad A275 | |
| Chuwi LapBook SE | |
| Microsoft Surface Go MHN-00003 | |
| NuVision Encite Book 12 Plus | |
| Genomsnitt Intel Celeron N3350 (43 - 48, n=9) | |
| Chuwi Hi12 | |
| HP x2 210 G2 | |
| CPU Multi 64Bit | |
| Dell Latitude 5290 | |
| Apple MacBook Air 2018 | |
| Lenovo ThinkPad A275 | |
| Microsoft Surface Go MHN-00003 | |
| Chuwi LapBook SE | |
| Intel NUC7CJYH | |
| Chuwi Hi12 | |
| HP x2 210 G2 | |
| Genomsnitt Intel Celeron N3350 (81 - 92, n=9) | |
| NuVision Encite Book 12 Plus | |
| PCMark 8 | |
| Home Score Accelerated v2 | |
| Lenovo ThinkPad A275 | |
| Intel NUC7CJYH | |
| Genomsnitt Intel Celeron N3350, Intel HD Graphics 500 (1462 - 1816, n=8) | |
| NuVision Encite Book 12 Plus | |
| Chuwi Hi12 | |
| Microsoft Surface Go MHN-00003 | |
| Work Score Accelerated v2 | |
| Lenovo ThinkPad A275 | |
| Intel NUC7CJYH | |
| Genomsnitt Intel Celeron N3350, Intel HD Graphics 500 (2148 - 2703, n=6) | |
| NuVision Encite Book 12 Plus | |
| Chuwi Hi12 | |
| Creative Score Accelerated v2 | |
| Intel NUC7CJYH | |
| Genomsnitt Intel Celeron N3350, Intel HD Graphics 500 (1814 - 1935, n=3) | |
| PCMark 8 Home Score Accelerated v2 | 1462 poäng | |
| PCMark 8 Work Score Accelerated v2 | 2148 poäng | |
| PCMark 10 Score | 1102 poäng | |
Hjälp | ||
| NuVision Encite Book 12 Plus SanDisk DF4064 | Microsoft Surface Go MHN-00003 64 GB eMMC Flash | Lenovo ThinkPad A275 Samsung PM961 MZVLW256HEHP | Chuwi LapBook SE SanDisk DF4032 | Chuwi GBox CWI560 SanDisk DA4064 | |
|---|---|---|---|---|---|
| AS SSD | 105% | 619% | 19% | ||
| Seq Read (MB/s) | 154 | 289.8 88% | 1289 737% | 264.1 71% | |
| Seq Write (MB/s) | 102.4 | 126.7 24% | 350 242% | 131.8 29% | |
| 4K Read (MB/s) | 5.07 | 18.29 261% | 21.53 325% | 6.3 24% | |
| 4K Write (MB/s) | 8.42 | 35.07 317% | 1.24 -85% | 13.6 62% | |
| 4K-64 Read (MB/s) | 27.74 | 40.27 45% | 556 1904% | 25.65 -8% | |
| 4K-64 Write (MB/s) | 12.15 | 44.48 266% | 117 863% | 9.11 -25% | |
| Access Time Read * (ms) | 0.747 | 0.151 80% | 0.094 87% | 0.671 10% | |
| Access Time Write * (ms) | 1.136 | 0.233 79% | 1.929 -70% | 1.233 -9% | |
| Score Read (Points) | 48 | 88 83% | 707 1373% | 58 21% | |
| Score Write (Points) | 31 | 92 197% | 153 394% | 36 16% | |
| Score Total (Points) | 103 | 225 118% | 1177 1043% | 120 17% | |
| Copy ISO MB/s (MB/s) | 119.7 | 99.1 -17% | |||
| Copy Program MB/s (MB/s) | 72.8 | 44.34 -39% | |||
| Copy Game MB/s (MB/s) | 116.5 | 76.5 -34% | |||
| CrystalDiskMark 5.2 / 6 | 124% | 804% | 8% | 142% | |
| Write 4K (MB/s) | 7.837 | 26.91 243% | 76.4 875% | 11.17 43% | 38 385% |
| Read 4K (MB/s) | 7.689 | 19.72 156% | 36.38 373% | 7.2 -6% | 23.84 210% |
| Write Seq (MB/s) | 104.9 | 126.2 20% | 1208 1052% | 87.7 -16% | 226.7 116% |
| Read Seq (MB/s) | 167.8 | 268 60% | 1191 610% | 247 47% | 271.8 62% |
| Write 4K Q32T1 (MB/s) | 13.64 | 62.9 361% | 101 640% | 12.29 -10% | 44.74 228% |
| Read 4K Q32T1 (MB/s) | 32.95 | 39.82 21% | 133.9 306% | 32.46 -1% | 53.2 61% |
| Write Seq Q32T1 (MB/s) | 99.5 | 131.3 32% | 1381 1288% | 92 -8% | 129.4 30% |
| Read Seq Q32T1 (MB/s) | 128.8 | 259.3 101% | 1785 1286% | 150.1 17% | 189.4 47% |
| Write 4K Q8T8 (MB/s) | 12.36 | ||||
| Read 4K Q8T8 (MB/s) | 31.66 | ||||
| Totalt genomsnitt (program/inställningar) | 115% /
112% | 712% /
697% | 14% /
14% | 142% /
142% |
* ... mindre är bättre

| 3DMark 11 | |
| 1280x720 Performance GPU | |
| Dell Latitude 5290 | |
| Apple MacBook Air 2018 | |
| Microsoft Surface Go MHN-00003 | |
| Intel NUC7CJYH | |
| Chuwi GBox CWI560 | |
| Chuwi LapBook SE | |
| Genomsnitt Intel HD Graphics 500 (368 - 584, n=11) | |
| NuVision Encite Book 12 Plus | |
| HP x2 210 G2 | |
| Chuwi Hi12 | |
| 1280x720 Performance Combined | |
| Apple MacBook Air 2018 | |
| Dell Latitude 5290 | |
| Microsoft Surface Go MHN-00003 | |
| Intel NUC7CJYH | |
| Genomsnitt Intel HD Graphics 500 (343 - 588, n=11) | |
| Chuwi LapBook SE | |
| Chuwi GBox CWI560 | |
| NuVision Encite Book 12 Plus | |
| HP x2 210 G2 | |
| Chuwi Hi12 | |
| 3DMark | |
| 1280x720 Cloud Gate Standard Graphics | |
| Dell Latitude 5290 | |
| Apple MacBook Air 2018 | |
| Microsoft Surface Go MHN-00003 | |
| Lenovo ThinkPad A275 | |
| Intel NUC7CJYH | |
| Genomsnitt Intel HD Graphics 500 (2578 - 3693, n=8) | |
| Chuwi LapBook SE | |
| NuVision Encite Book 12 Plus | |
| HP x2 210 G2 | |
| Chuwi Hi12 | |
| 1920x1080 Fire Strike Graphics | |
| Dell Latitude 5290 | |
| Apple MacBook Air 2018 | |
| Microsoft Surface Go MHN-00003 | |
| Intel NUC7CJYH | |
| Genomsnitt Intel HD Graphics 500 (293 - 444, n=8) | |
| HP x2 210 G2 | |
| Chuwi Hi12 | |
| 1920x1080 Ice Storm Extreme Graphics | |
| Microsoft Surface Go MHN-00003 | |
| Intel NUC7CJYH | |
| Genomsnitt Intel HD Graphics 500 (12299 - 18200, n=3) | |
| 2560x1440 Time Spy Graphics | |
| Apple MacBook Air 2018 | |
| Chuwi LapBook SE | |
| 3DMark 11 Performance | 461 poäng | |
| 3DMark Cloud Gate Standard Score | 1932 poäng | |
Hjälp | ||
(±) Den maximala temperaturen på ovansidan är 41 °C / 106 F, jämfört med genomsnittet av 35.9 °C / 97 F , allt från 21.4 till 59 °C för klassen Subnotebook.
(+) Botten värms upp till maximalt 36.4 °C / 98 F, jämfört med genomsnittet av 39.2 °C / 103 F
(+) Vid tomgångsbruk är medeltemperaturen för ovansidan 23.2 °C / 74 F, jämfört med enhetsgenomsnittet på 30.8 °C / ### class_avg_f### F.
(+) Handledsstöden och pekplattan är kallare än hudtemperaturen med maximalt 27 °C / 80.6 F och är därför svala att ta på.
(±) Medeltemperaturen för handledsstödsområdet på liknande enheter var 28.2 °C / 82.8 F (+1.2 °C / 2.2 F).
NuVision Encite Book 12 Plus ljudanalys
(-) | inte särskilt höga högtalare (61.1 dB)
Bas 100 - 315 Hz
(-) | nästan ingen bas - i genomsnitt 19.5% lägre än medianen
(+) | basen är linjär (5.6% delta till föregående frekvens)
Mellan 400 - 2000 Hz
(±) | högre mellan - i genomsnitt 7.8% högre än median
(-) | mids är inte linjära (17.4% delta till föregående frekvens)
Högsta 2 - 16 kHz
(±) | högre toppar - i genomsnitt 7.8% högre än medianen
(±) | linjäriteten för toppar är genomsnittlig (8.2% delta till föregående frekvens)
Totalt 100 - 16 000 Hz
(-) | det totala ljudet är inte linjärt (47.8% skillnad mot median)
Jämfört med samma klass
» 99% av alla testade enheter i den här klassen var bättre, 0% liknande, 0% sämre
» Den bästa hade ett delta på 5%, genomsnittet var 18%, sämst var 53%
Jämfört med alla testade enheter
» 96% av alla testade enheter var bättre, 0% liknande, 4% sämre
» Den bästa hade ett delta på 4%, genomsnittet var 23%, sämst var 134%
Apple MacBook 12 (Early 2016) 1.1 GHz ljudanalys
(+) | högtalare kan spela relativt högt (83.6 dB)
Bas 100 - 315 Hz
(±) | reducerad bas - i genomsnitt 11.3% lägre än medianen
(±) | linjäriteten för basen är genomsnittlig (14.2% delta till föregående frekvens)
Mellan 400 - 2000 Hz
(+) | balanserad mellan - endast 2.4% från medianen
(+) | mids är linjära (5.5% delta till föregående frekvens)
Högsta 2 - 16 kHz
(+) | balanserade toppar - endast 2% från medianen
(+) | toppar är linjära (4.5% delta till föregående frekvens)
Totalt 100 - 16 000 Hz
(+) | det totala ljudet är linjärt (10.2% skillnad mot median)
Jämfört med samma klass
» 7% av alla testade enheter i den här klassen var bättre, 2% liknande, 90% sämre
» Den bästa hade ett delta på 5%, genomsnittet var 18%, sämst var 53%
Jämfört med alla testade enheter
» 5% av alla testade enheter var bättre, 1% liknande, 94% sämre
» Den bästa hade ett delta på 4%, genomsnittet var 23%, sämst var 134%
| Av/Standby | |
| Låg belastning | |
| Hög belastning |
|
Förklaring:
min: | |
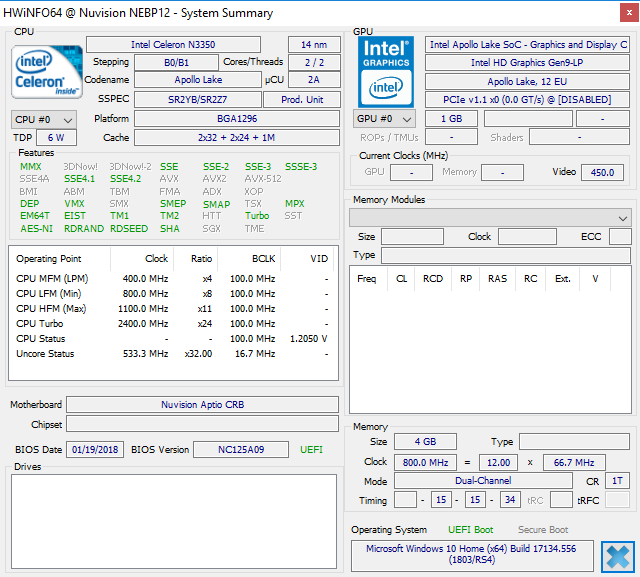
| NuVision Encite Book 12 Plus Celeron N3350, HD Graphics 500, SanDisk DF4064, IPS, 2560x1440, 12.5" | Microsoft Surface Go MHN-00003 Pentium 4415Y, UHD Graphics 615, 64 GB eMMC Flash, IPS, 1800x1200, 10" | Dell Latitude 5290 i5-8250U, UHD Graphics 620, Micron 1100 MTFDDAV256TBN, TN LED, 1366x768, 12.5" | Lenovo ThinkPad A275 PRO A12-9800B, Radeon R7 (Bristol Ridge), Samsung PM961 MZVLW256HEHP, TN, 1366x768, 12.5" | Chuwi LapBook SE Celeron N4100, UHD Graphics 600, SanDisk DF4032, , 1920x1080, 13.3" | Apple MacBook Air 2018 i5-8210Y, UHD Graphics 617, Apple SSD AP0256, IPS, 2560x1600, 13.3" | Apple MacBook 12 (Early 2016) 1.1 GHz 6Y30, HD Graphics 515, Apple SSD AP0256, IPS, 2304x1440, 12" | |
|---|---|---|---|---|---|---|---|
| Power Consumption | 14% | -44% | -43% | 16% | -10% | 16% | |
| Idle Minimum * (Watt) | 4.7 | 2.88 39% | 2.68 43% | 4.2 11% | 2.7 43% | 2.2 53% | 2.7 43% |
| Idle Average * (Watt) | 7 | 4.8 31% | 4.3 39% | 8.2 -17% | 6.3 10% | 5.7 19% | 2.7 61% |
| Idle Maximum * (Watt) | 8 | 7.5 6% | 5.2 35% | 10 -25% | 7.6 5% | 10.3 -29% | 7.2 10% |
| Load Average * (Watt) | 14.1 | 16.9 -20% | 40.3 -186% | 34.5 -145% | 12.6 11% | 25.6 -82% | 22 -56% |
| Load Maximum * (Watt) | 27.1 | 23.8 12% | 68 -151% | 37 -37% | 24.6 9% | 30.6 -13% | 20.5 24% |
* ... mindre är bättre
| NuVision Encite Book 12 Plus Celeron N3350, HD Graphics 500, 31.9 Wh | Microsoft Surface Go MHN-00003 Pentium 4415Y, UHD Graphics 615, 28 Wh | Dell Latitude 5290 i5-8250U, UHD Graphics 620, 51 Wh | Lenovo ThinkPad A275 PRO A12-9800B, Radeon R7 (Bristol Ridge), 71 Wh | Chuwi LapBook SE Celeron N4100, UHD Graphics 600, 37 Wh | Apple MacBook Air 2018 i5-8210Y, UHD Graphics 617, 50.3 Wh | Apple MacBook 12 (Early 2016) 1.1 GHz 6Y30, HD Graphics 515, 41.4 Wh | |
|---|---|---|---|---|---|---|---|
| Batteridrifttid | 2% | 49% | 29% | 35% | 12% | 16% | |
| Reader / Idle (h) | 11.3 | 12.9 14% | 16 42% | ||||
| WiFi v1.3 (h) | 6.8 | 7.5 10% | 10.1 49% | 9 32% | 7.4 9% | 11.1 63% | 8.4 24% |
| Load (h) | 3.6 | 3 -17% | 4.1 14% | 5.8 61% | 2.2 -39% | 3.9 8% |
För
Emot
Läs den fullständiga versionen av den här recensionen på engelska här.
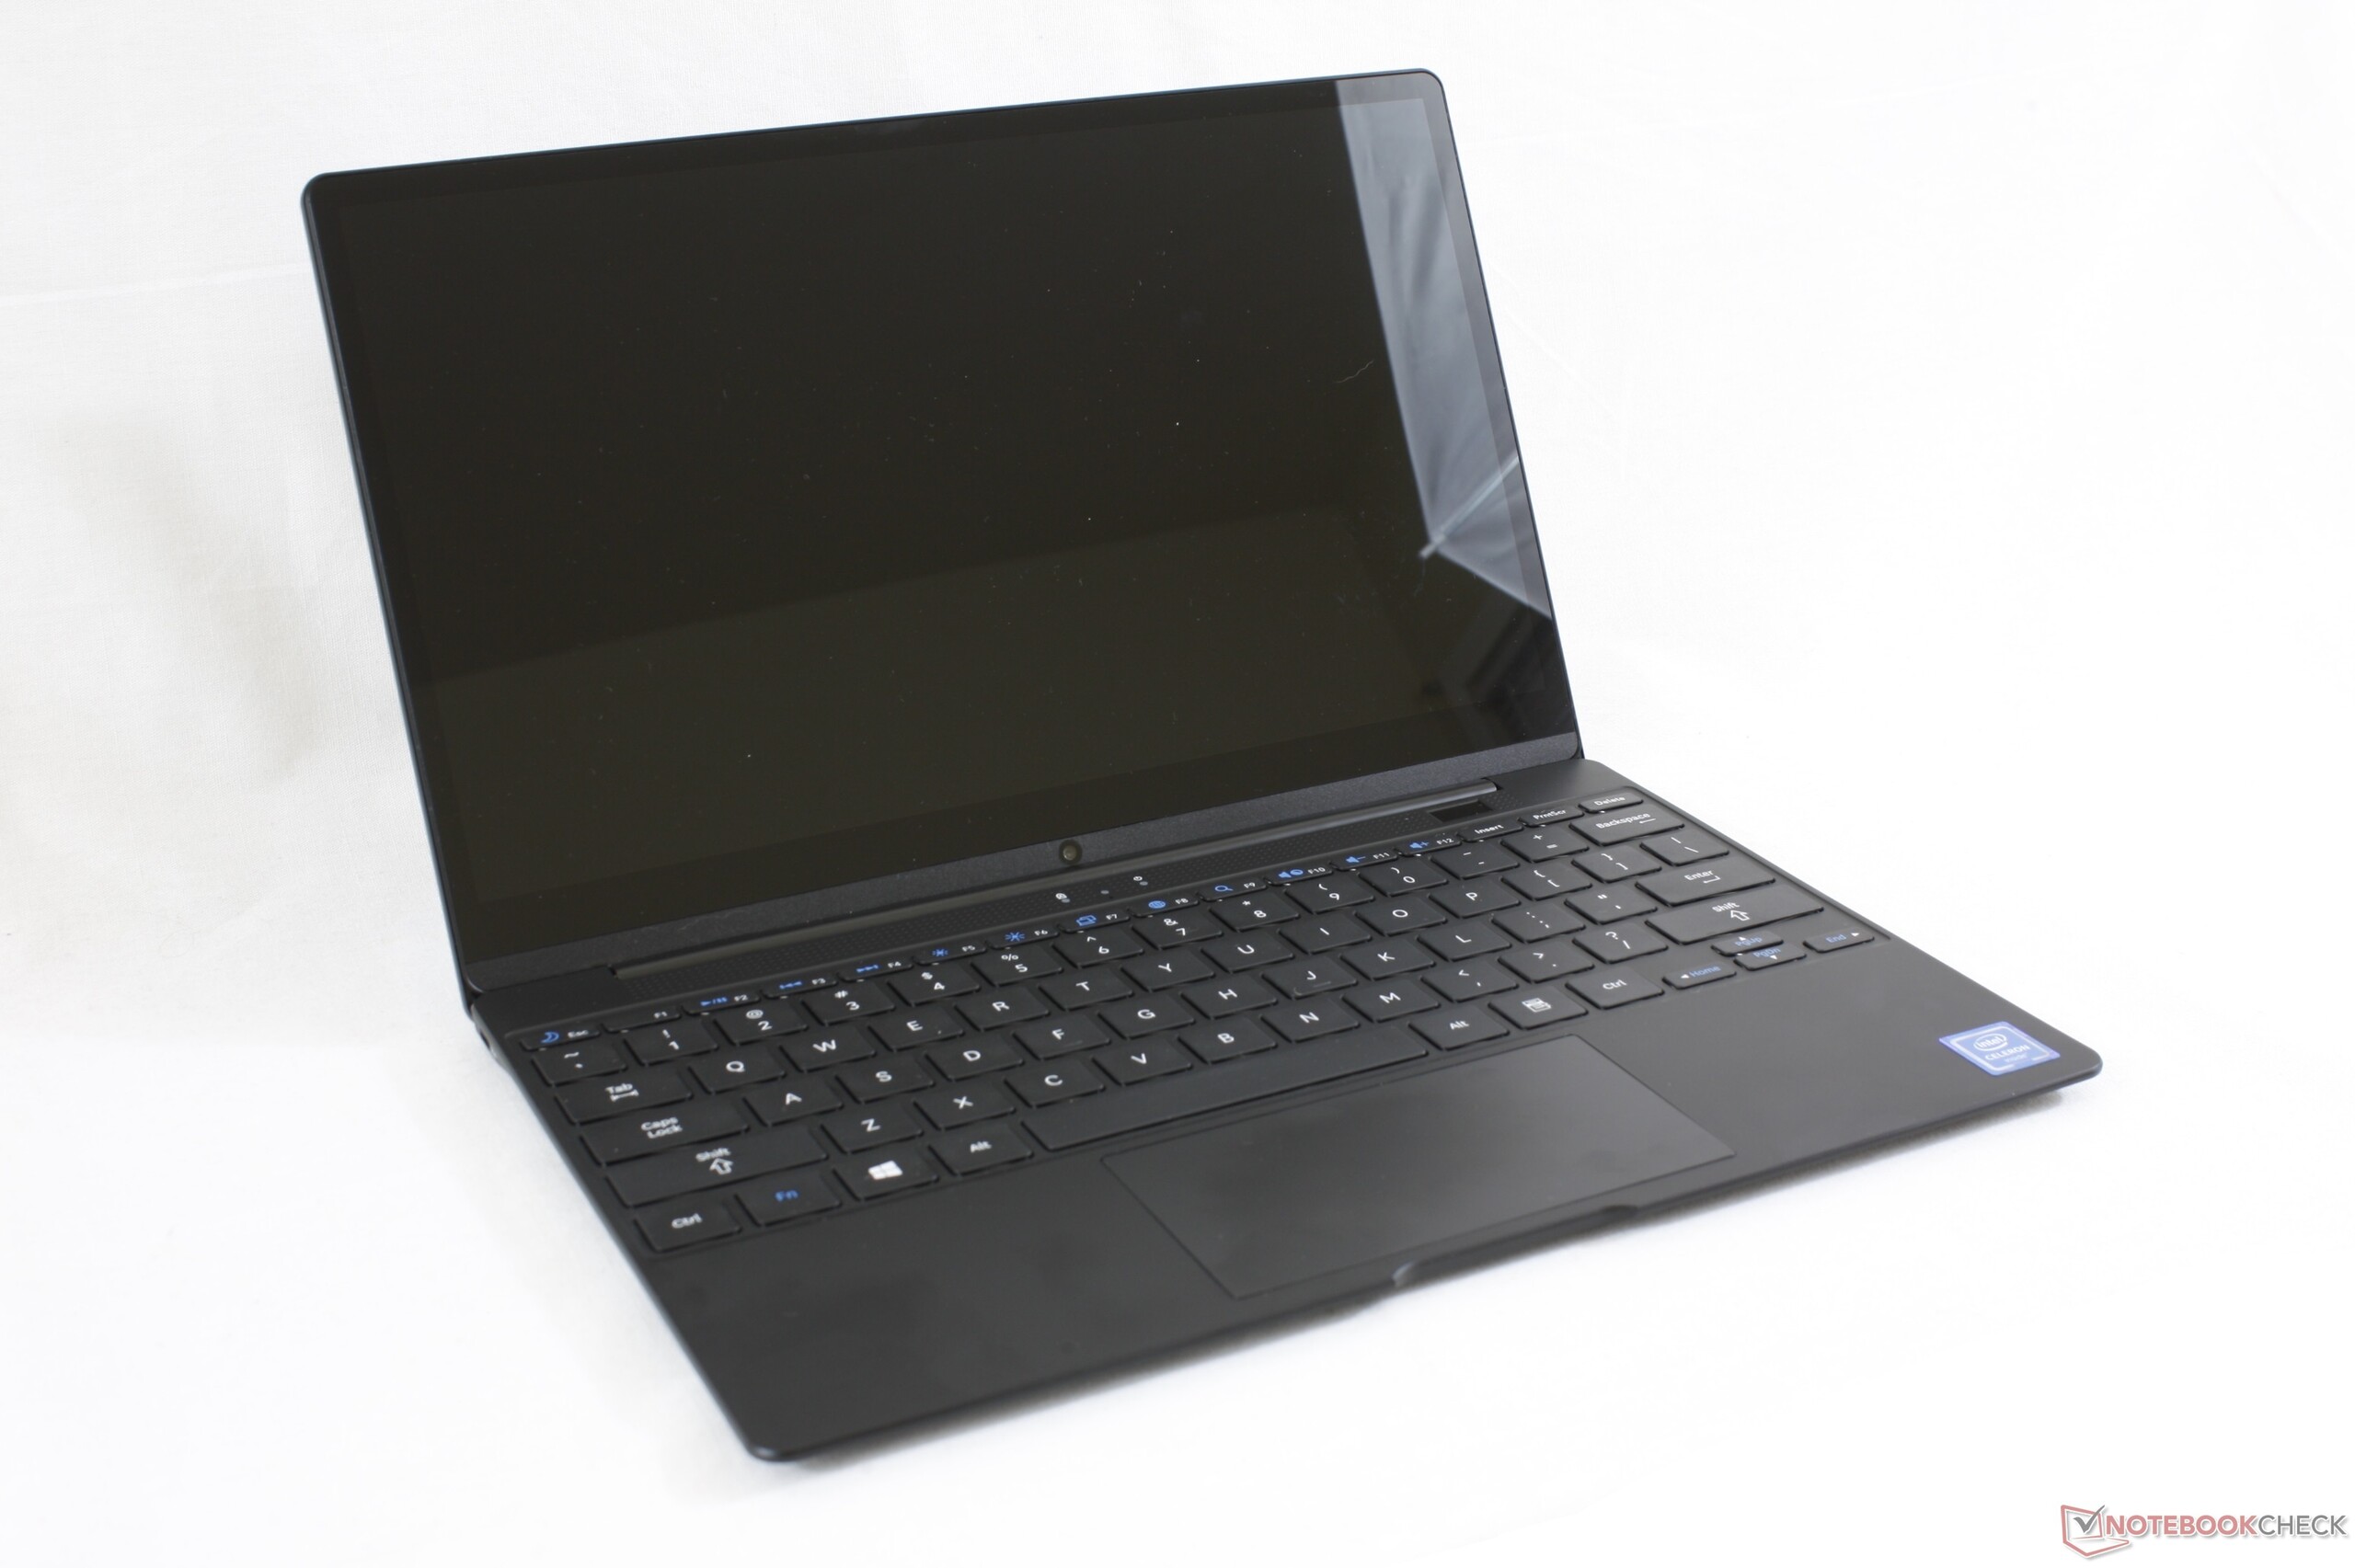
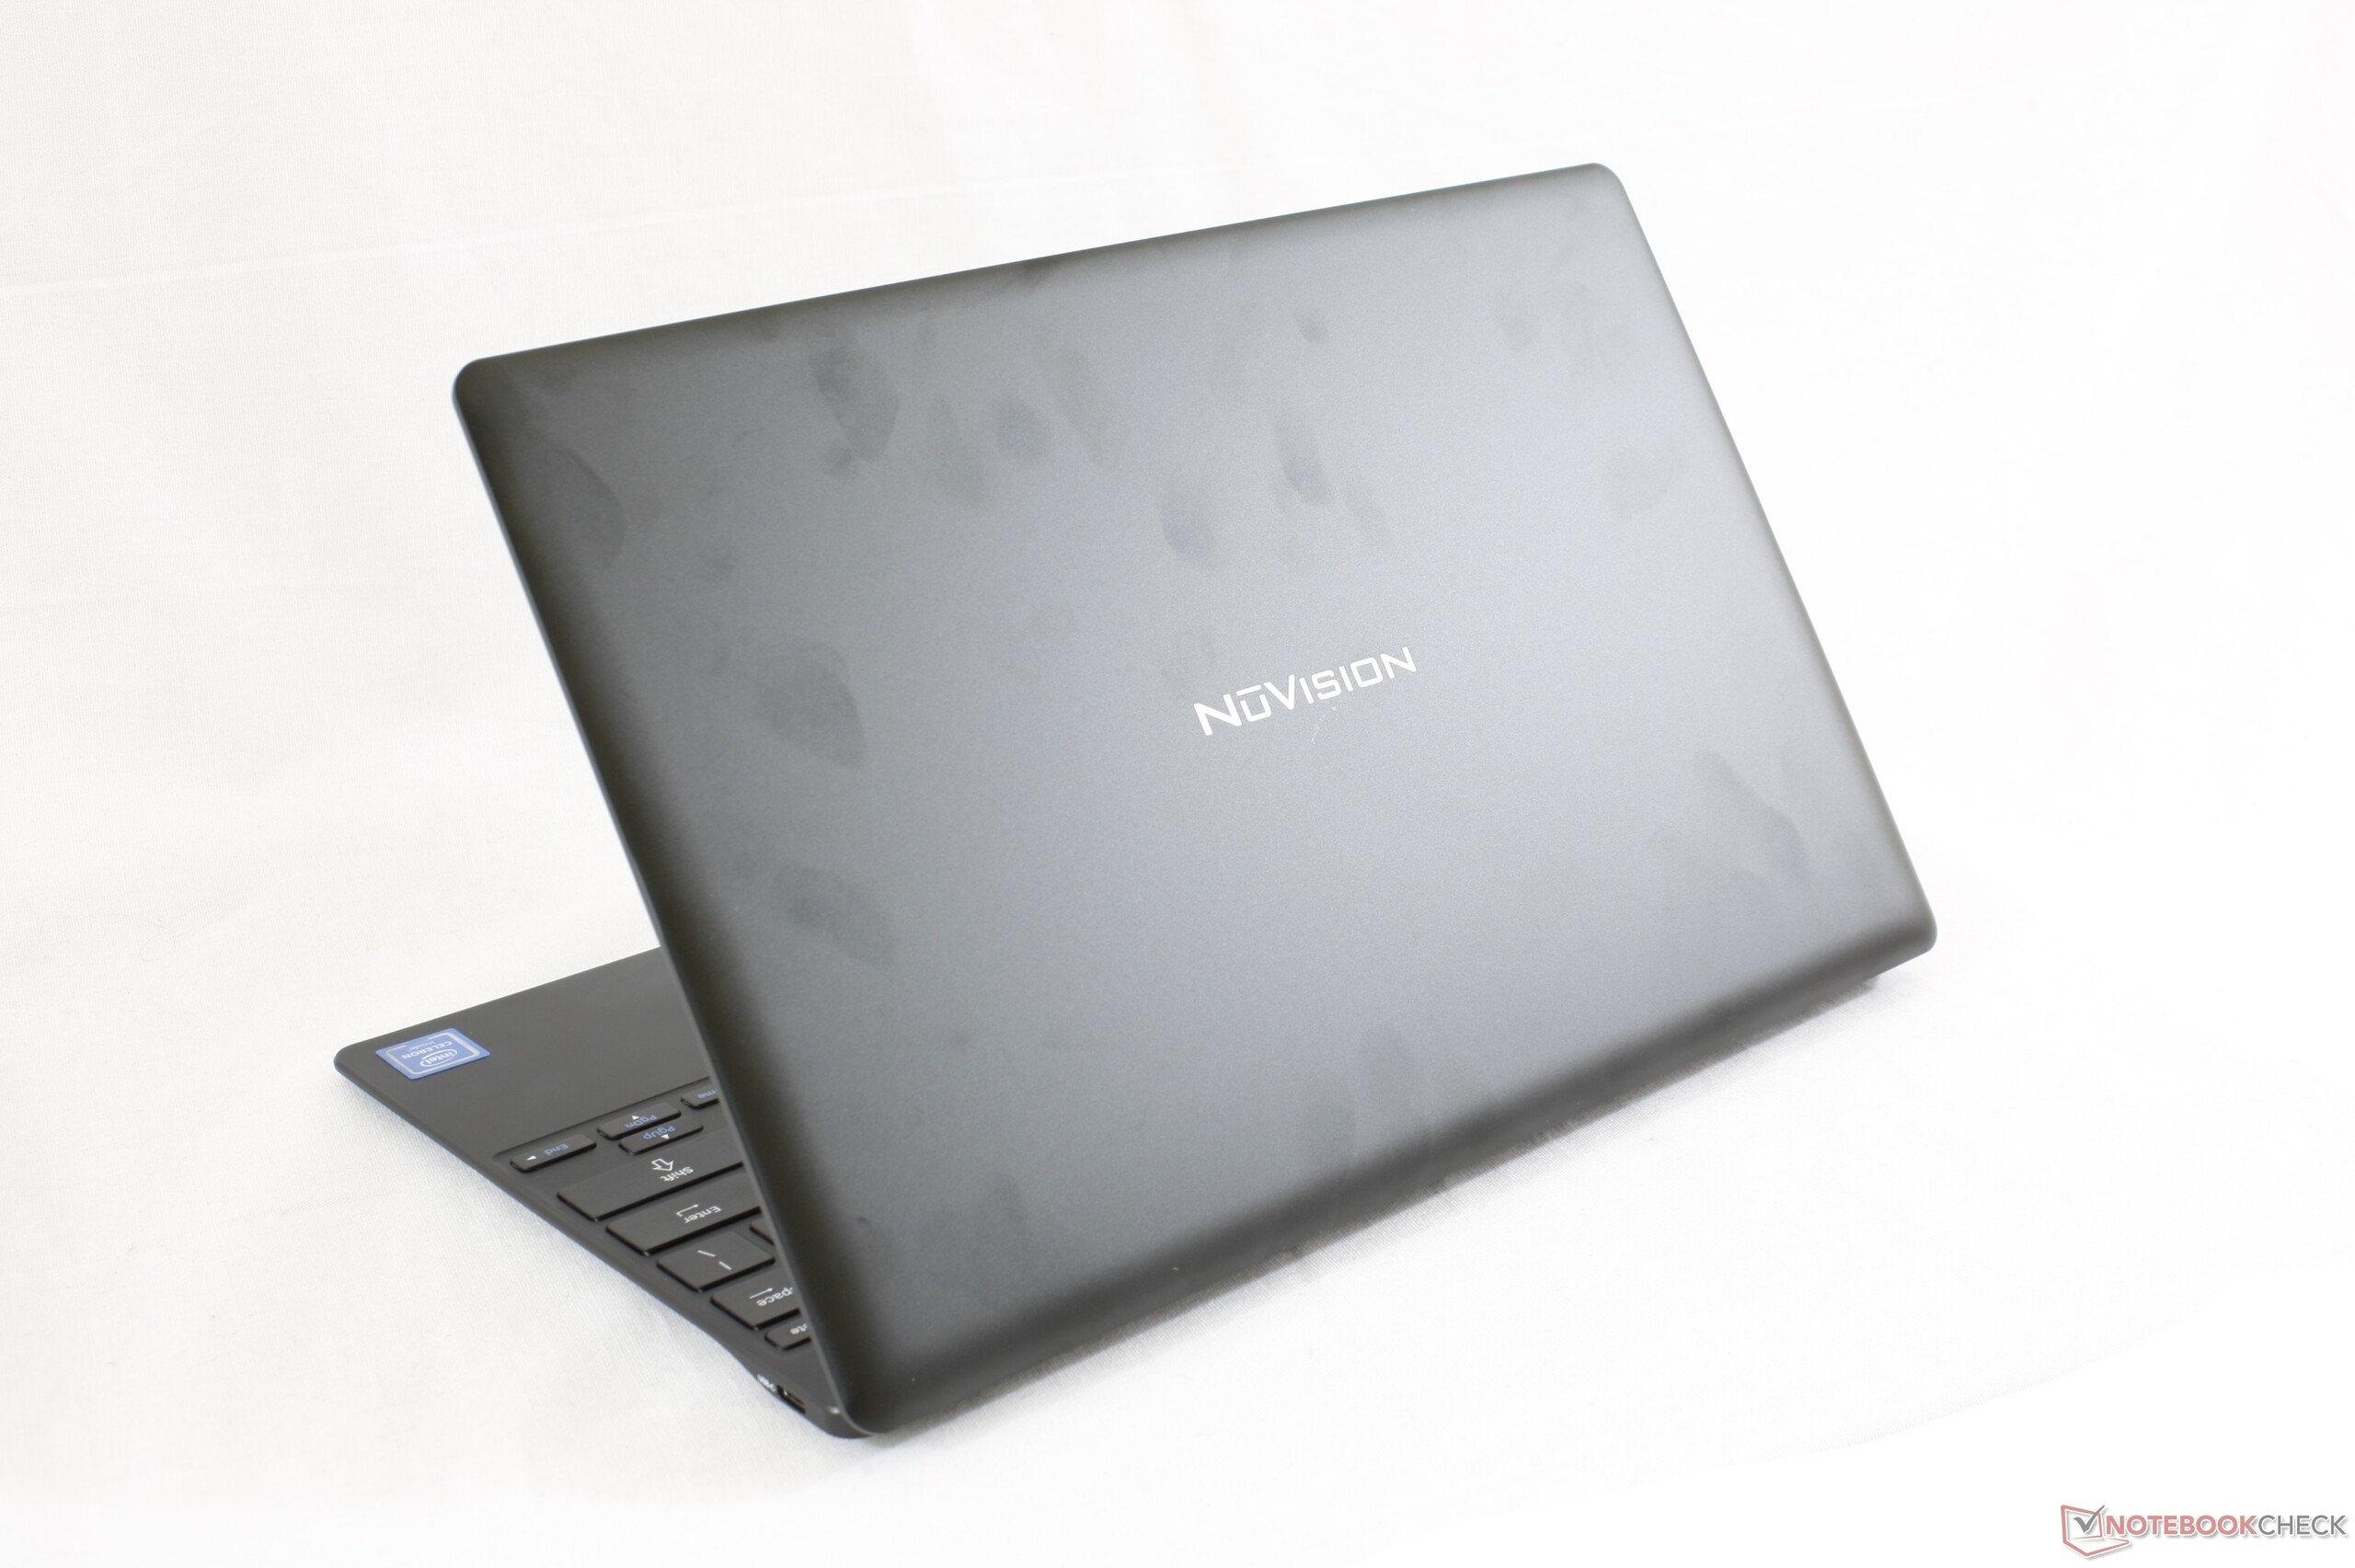
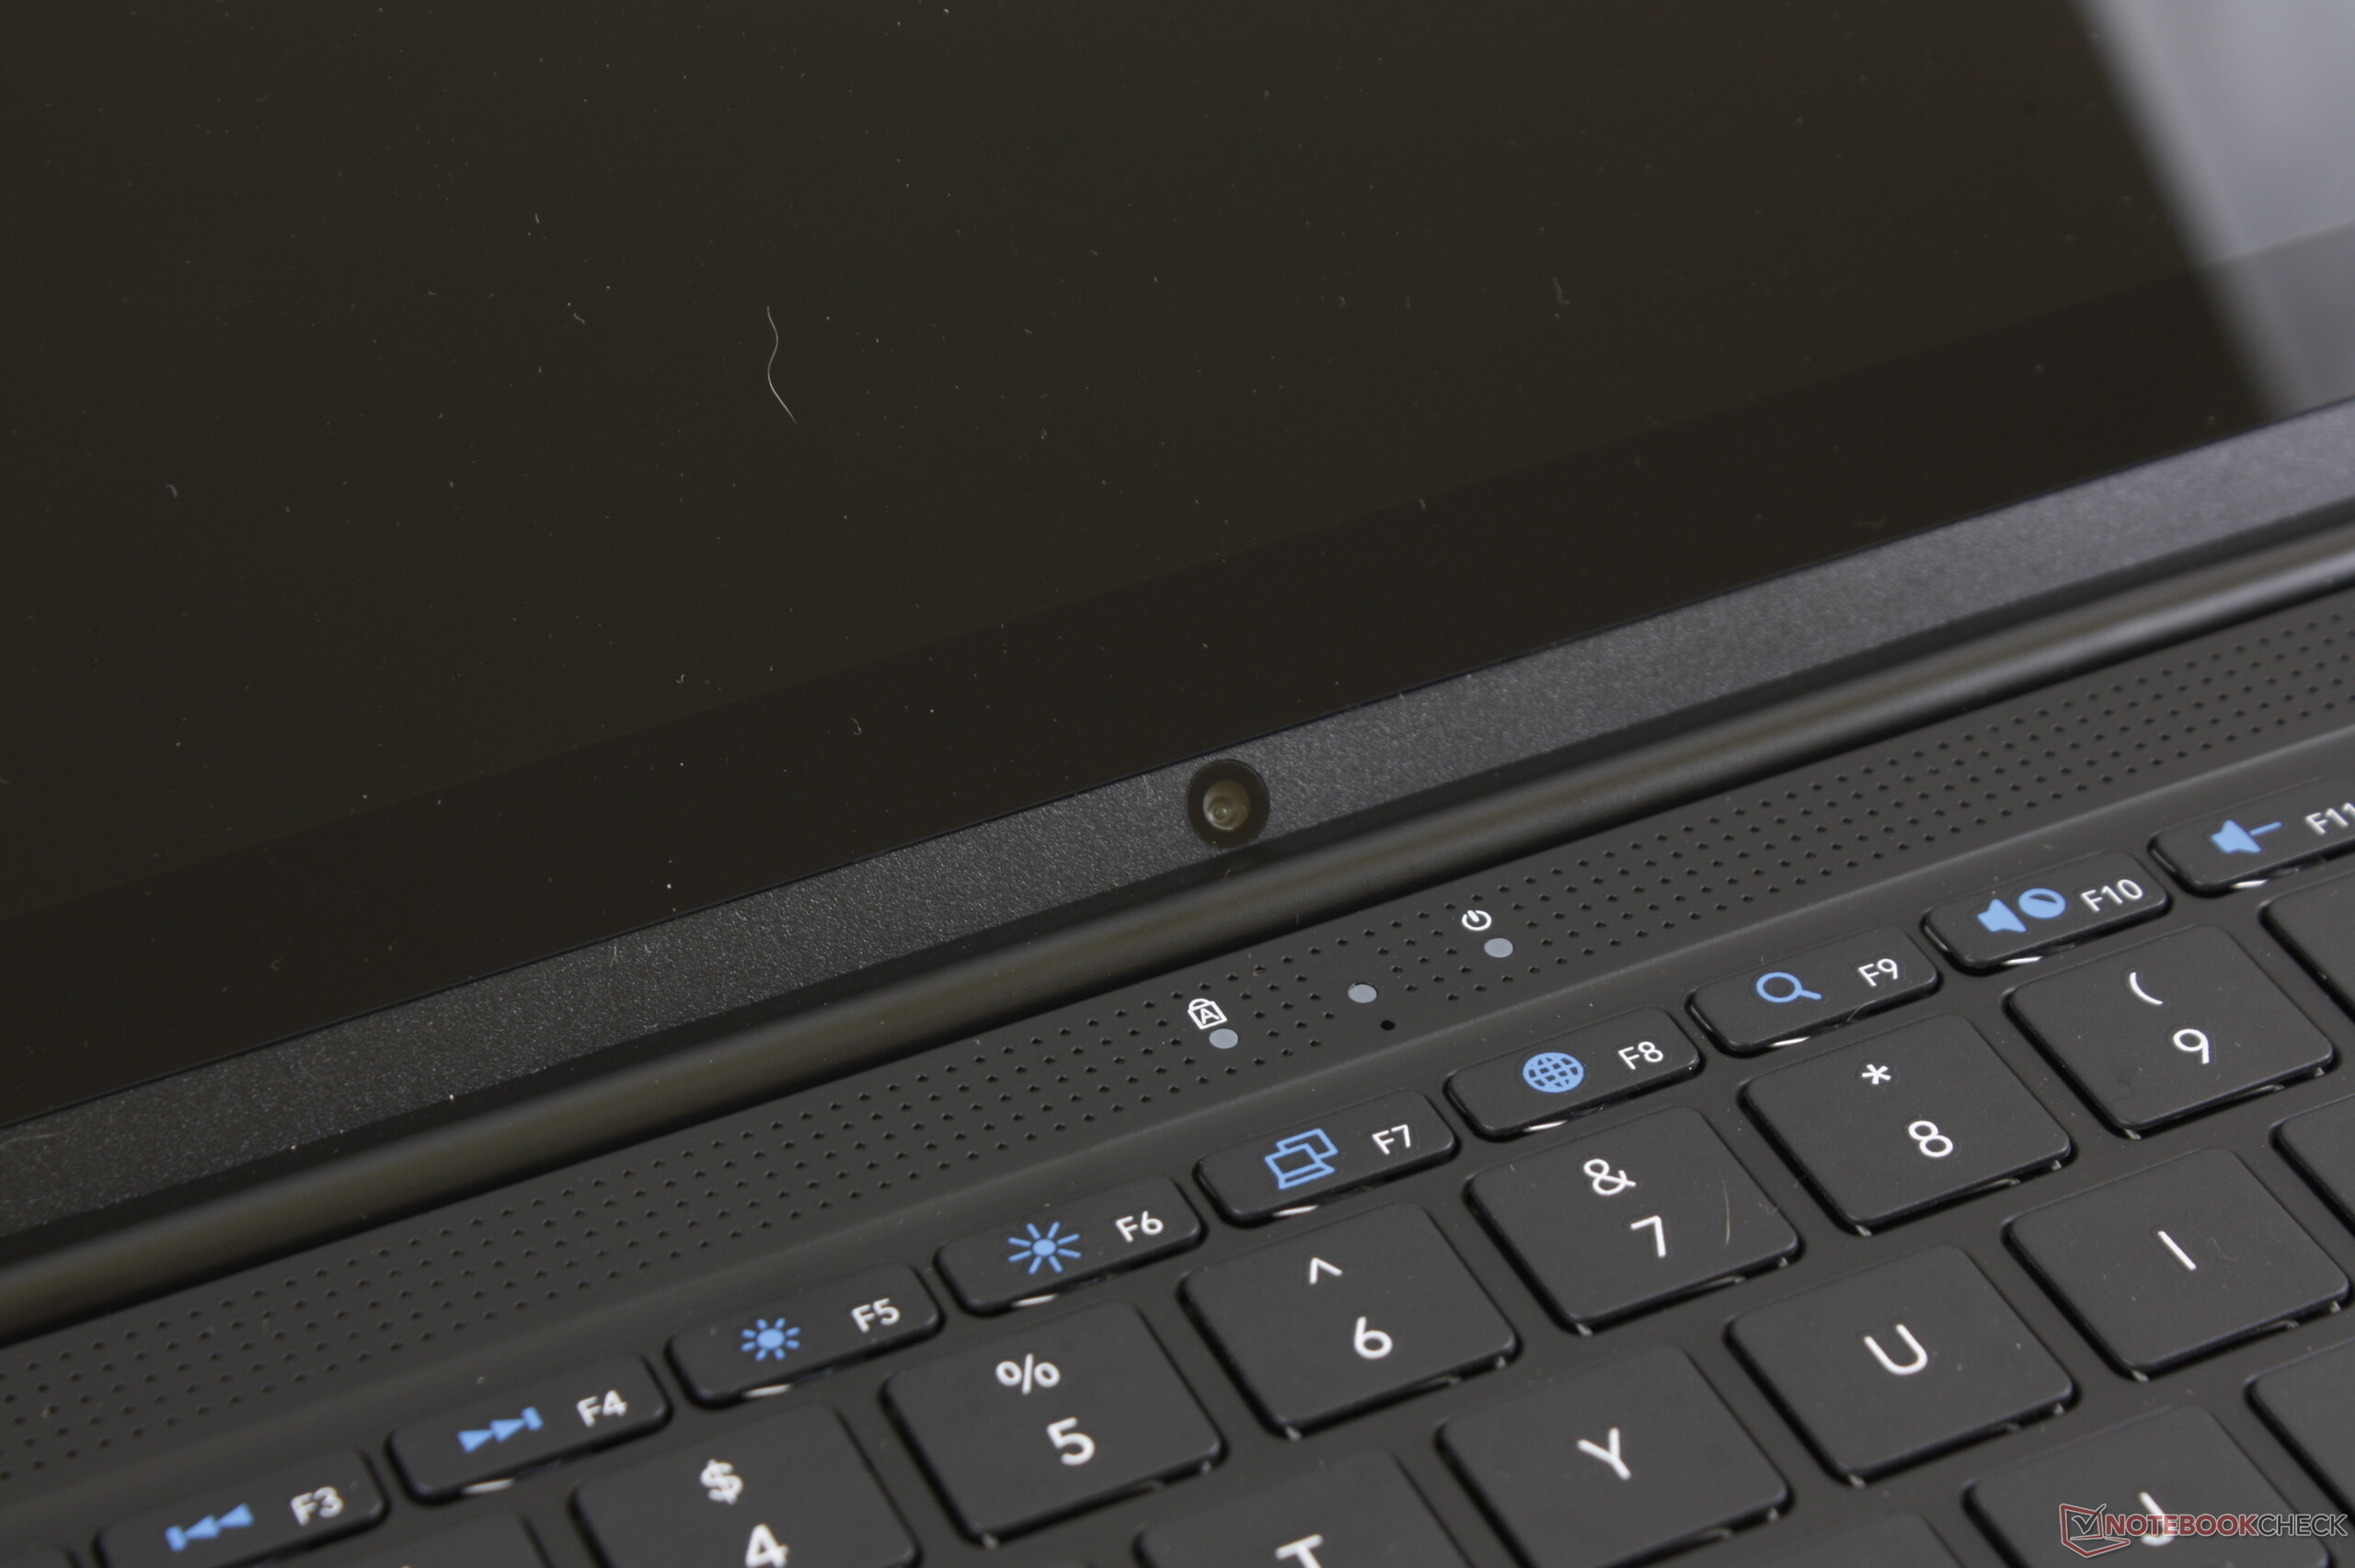
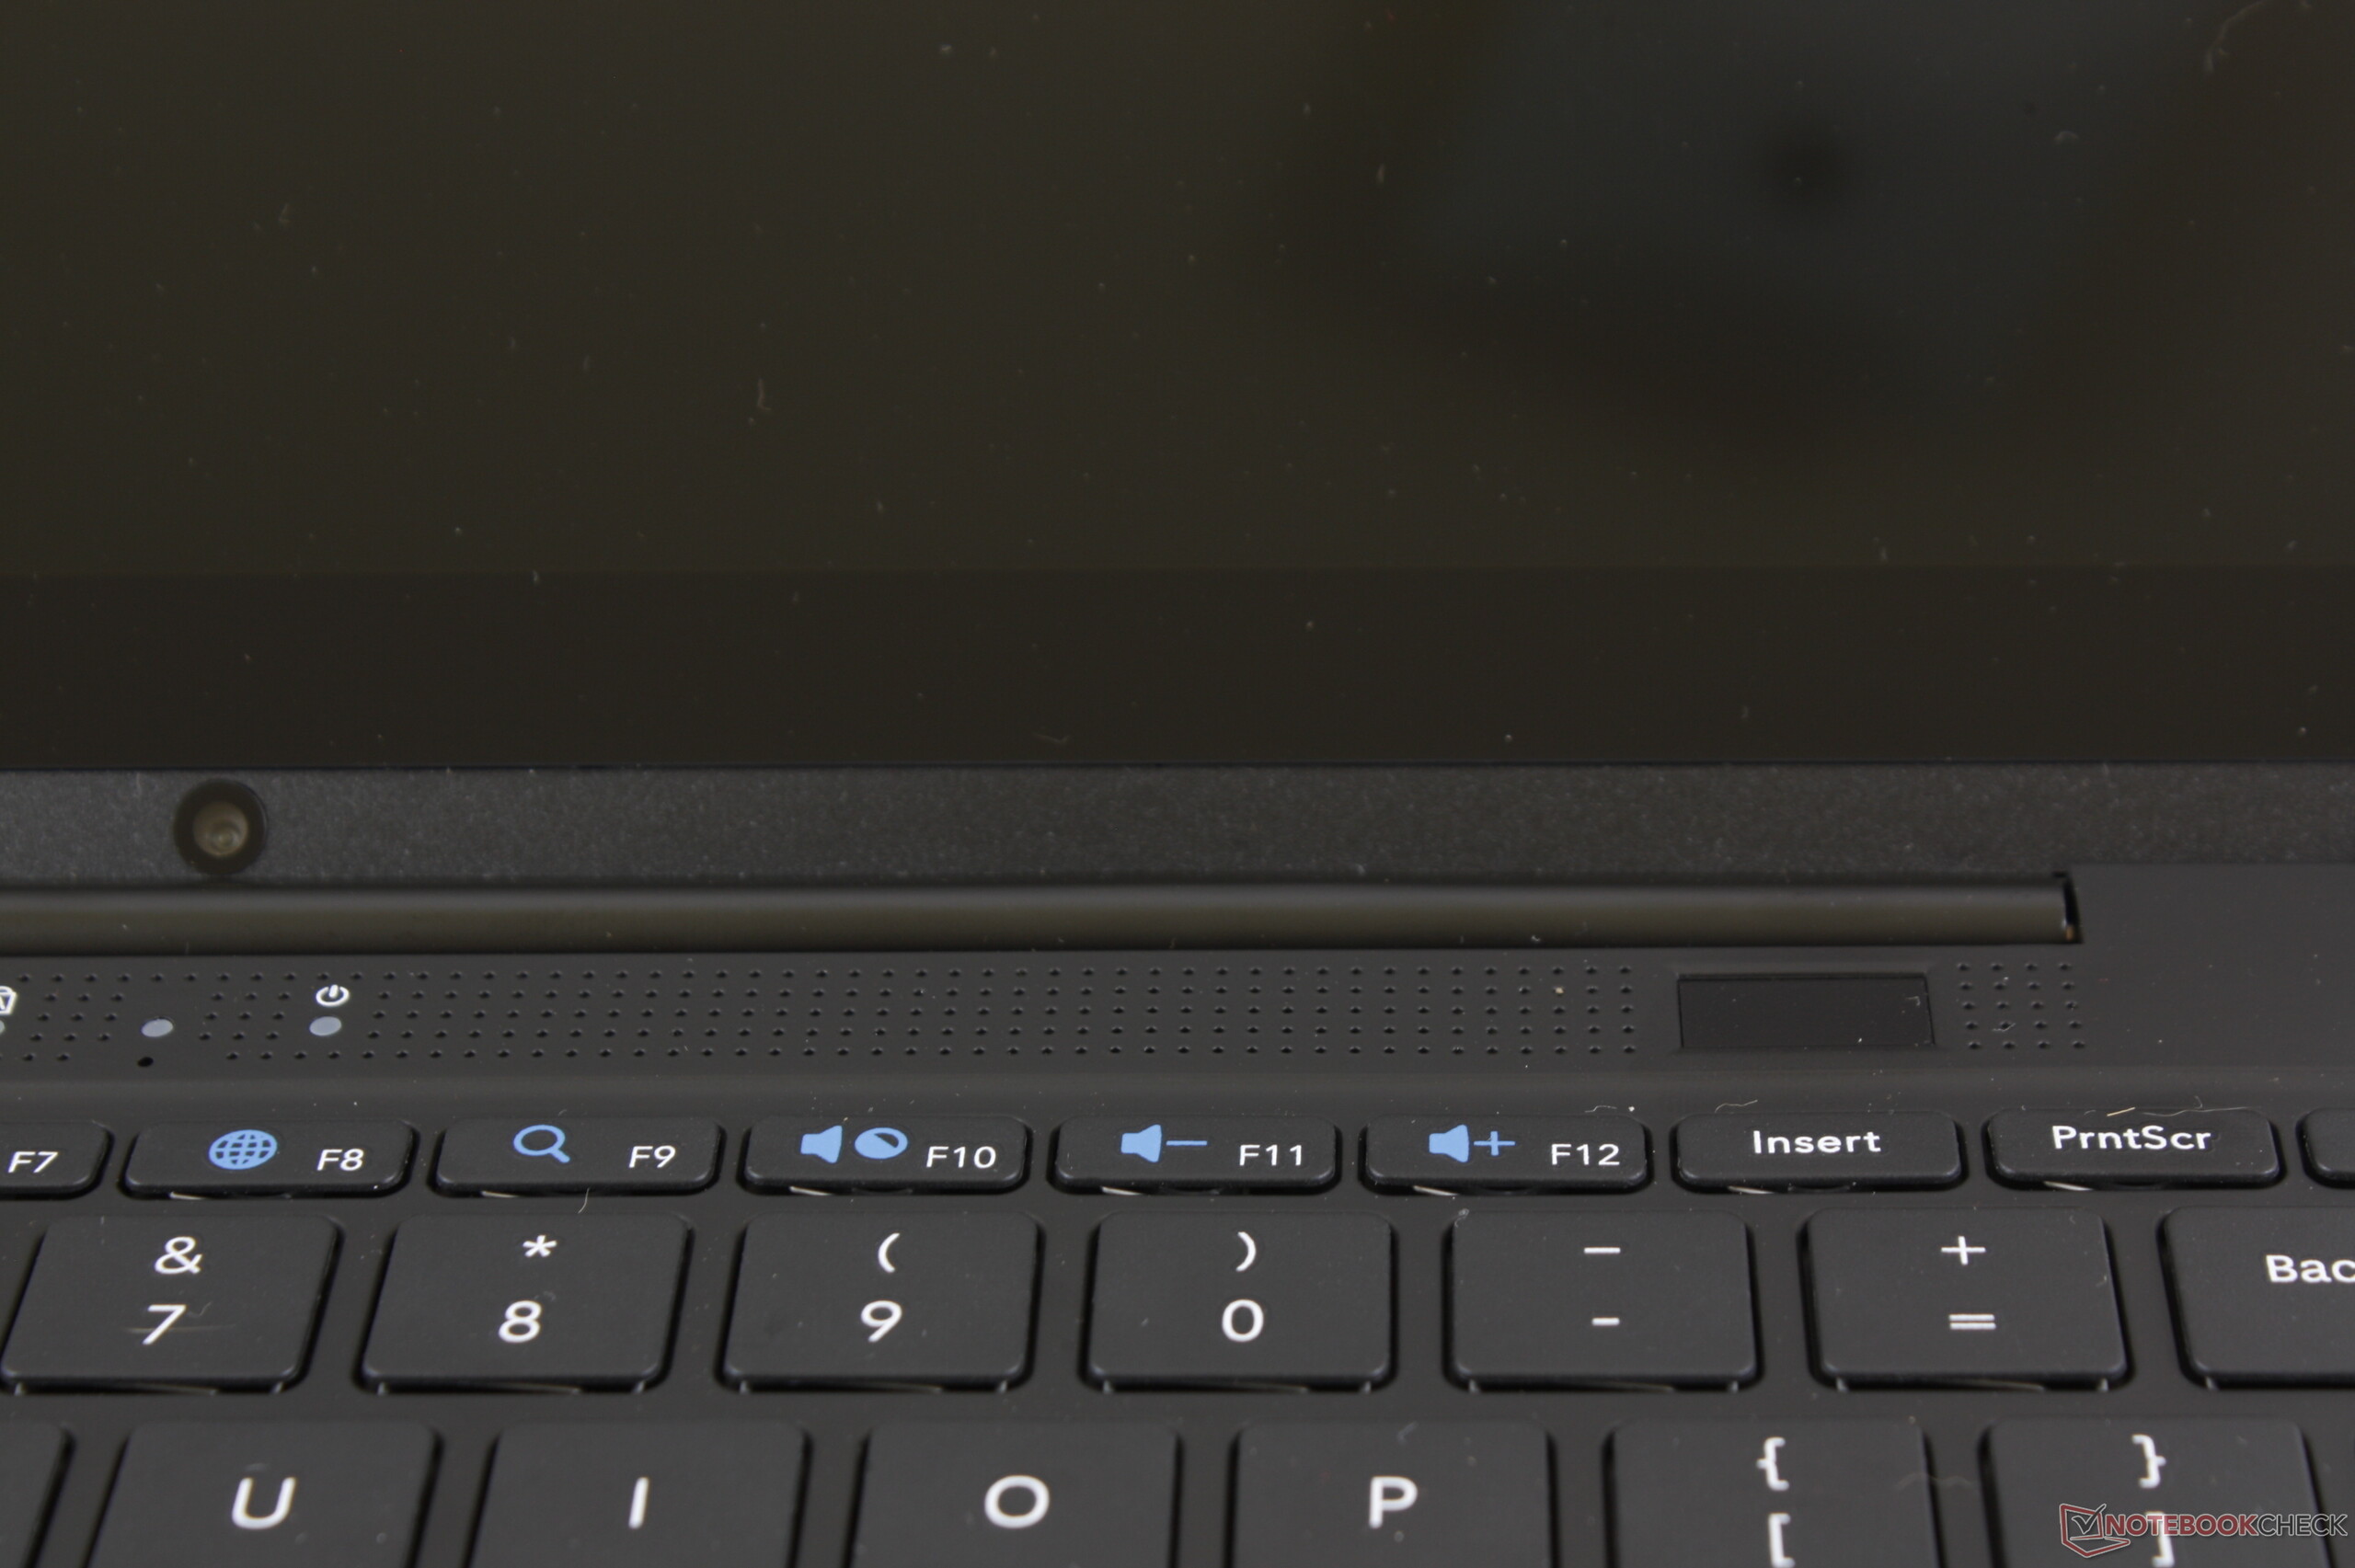
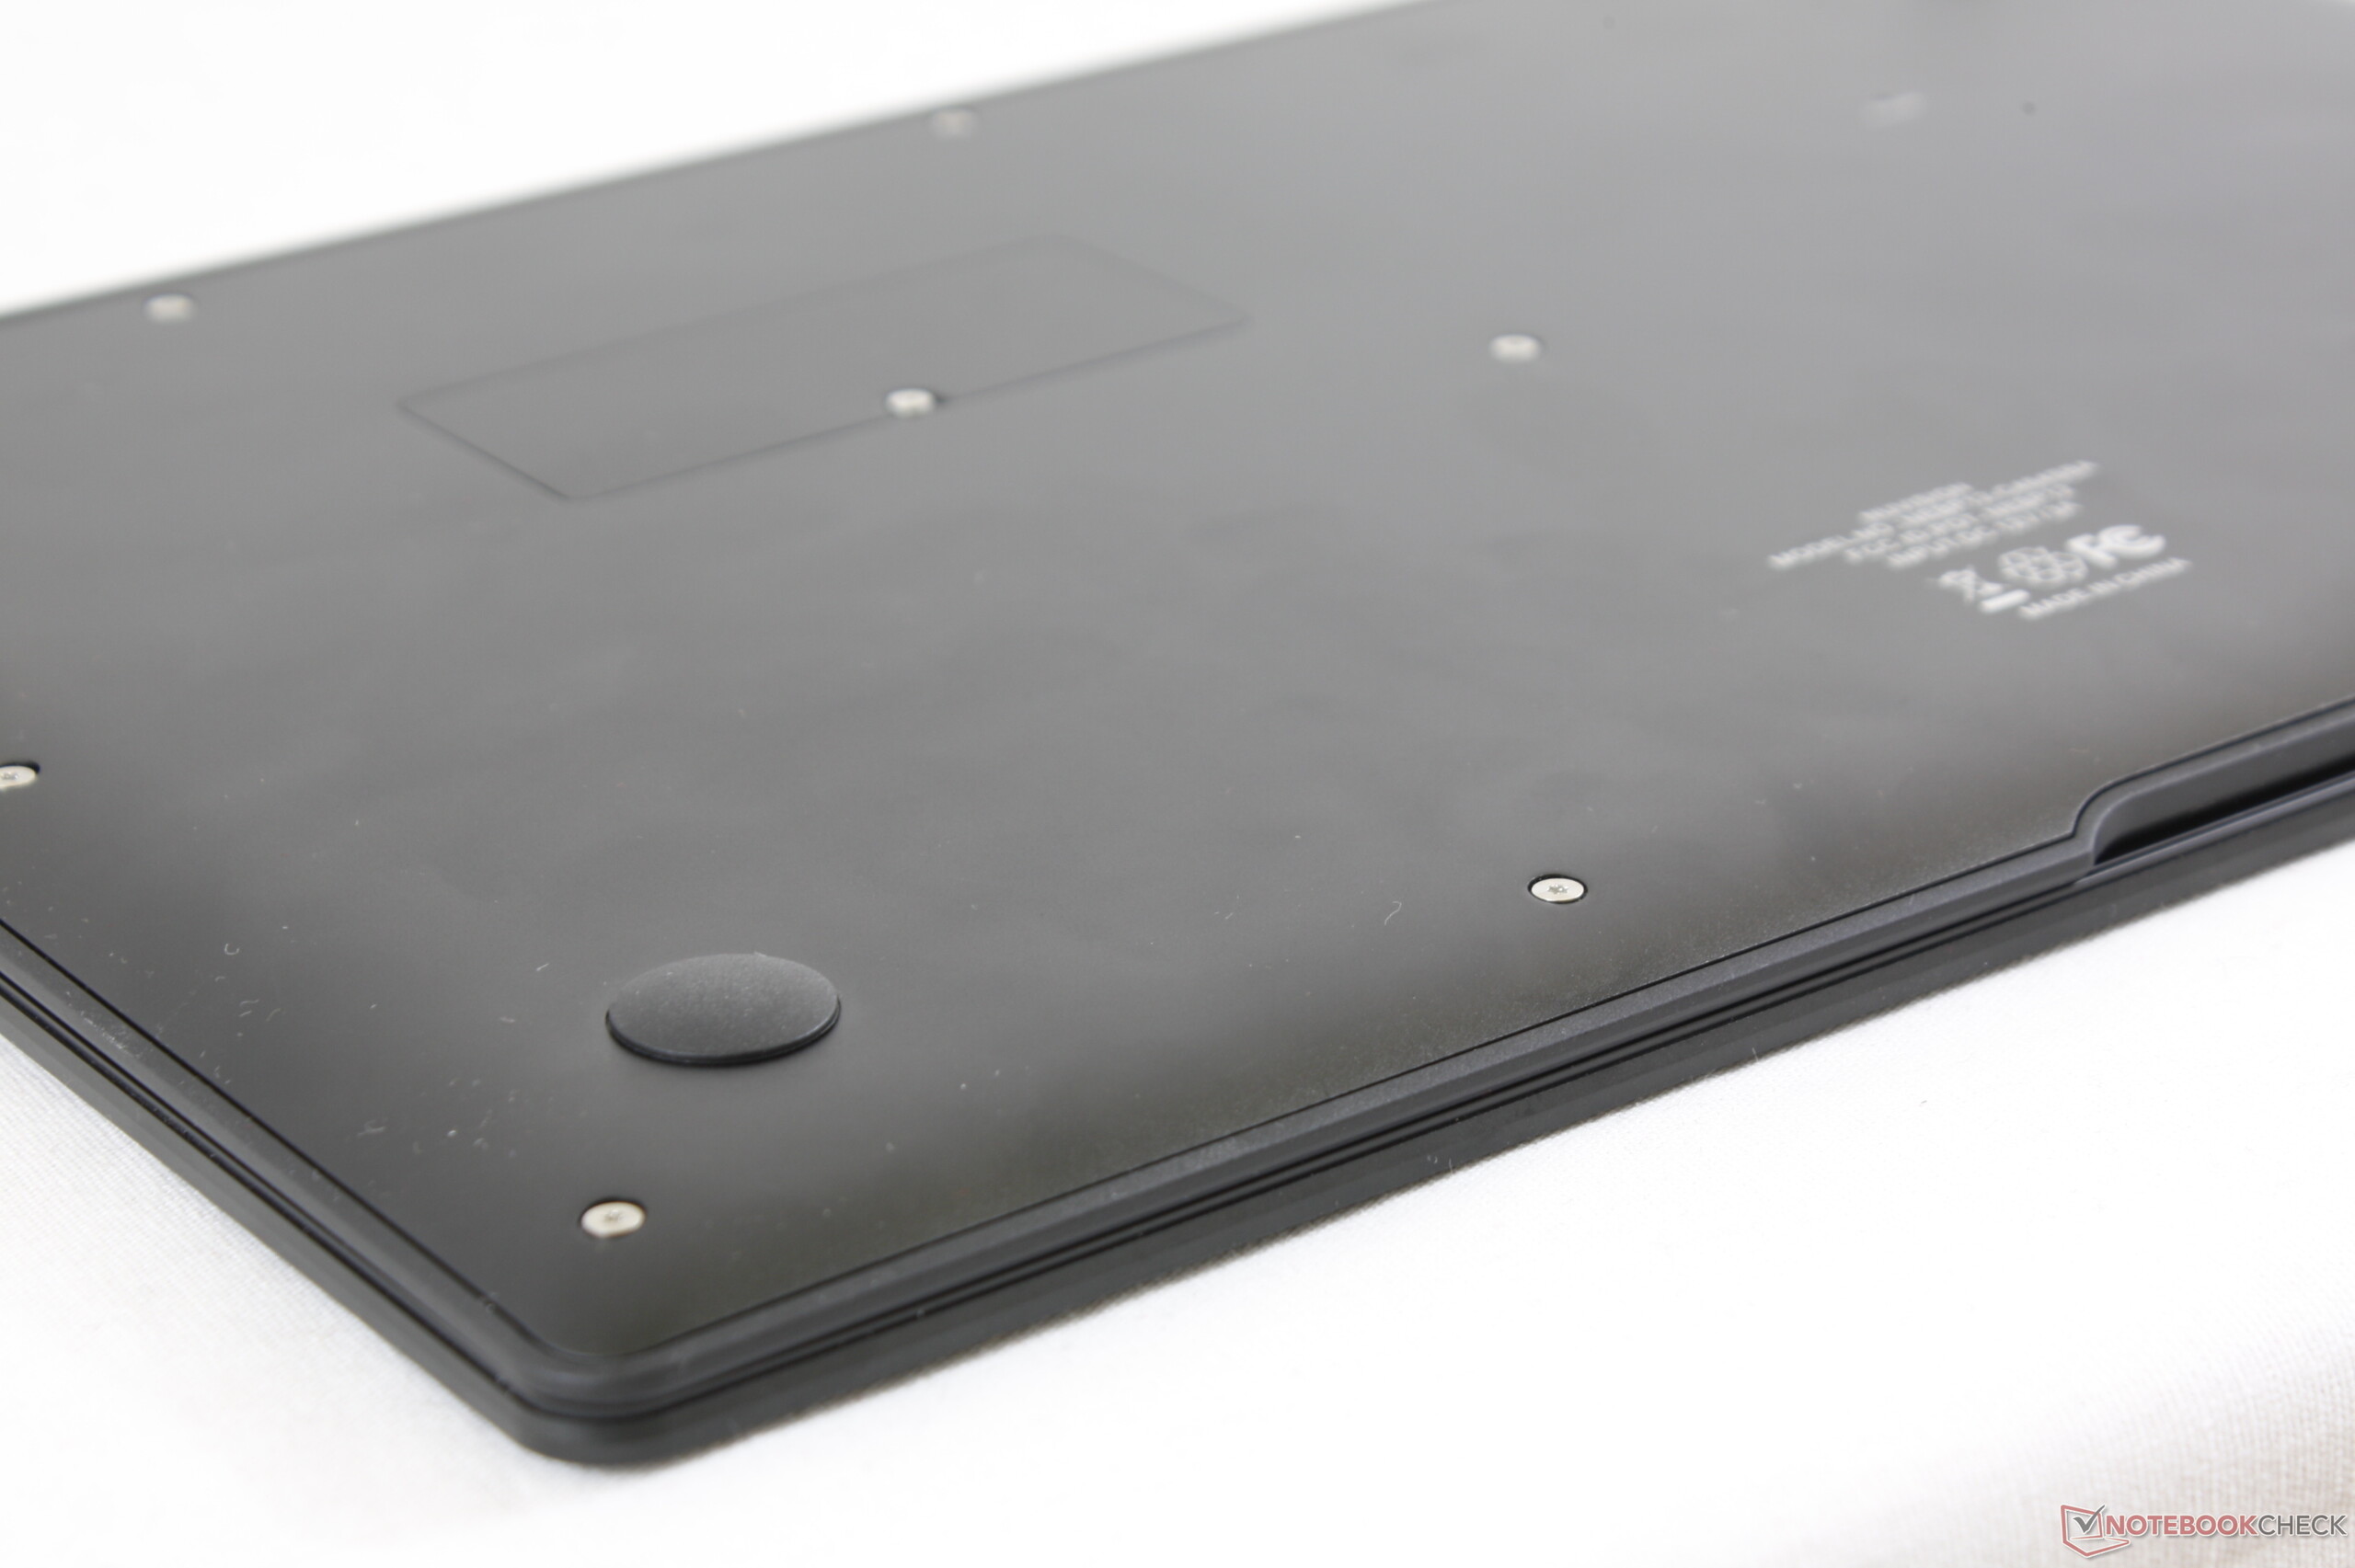
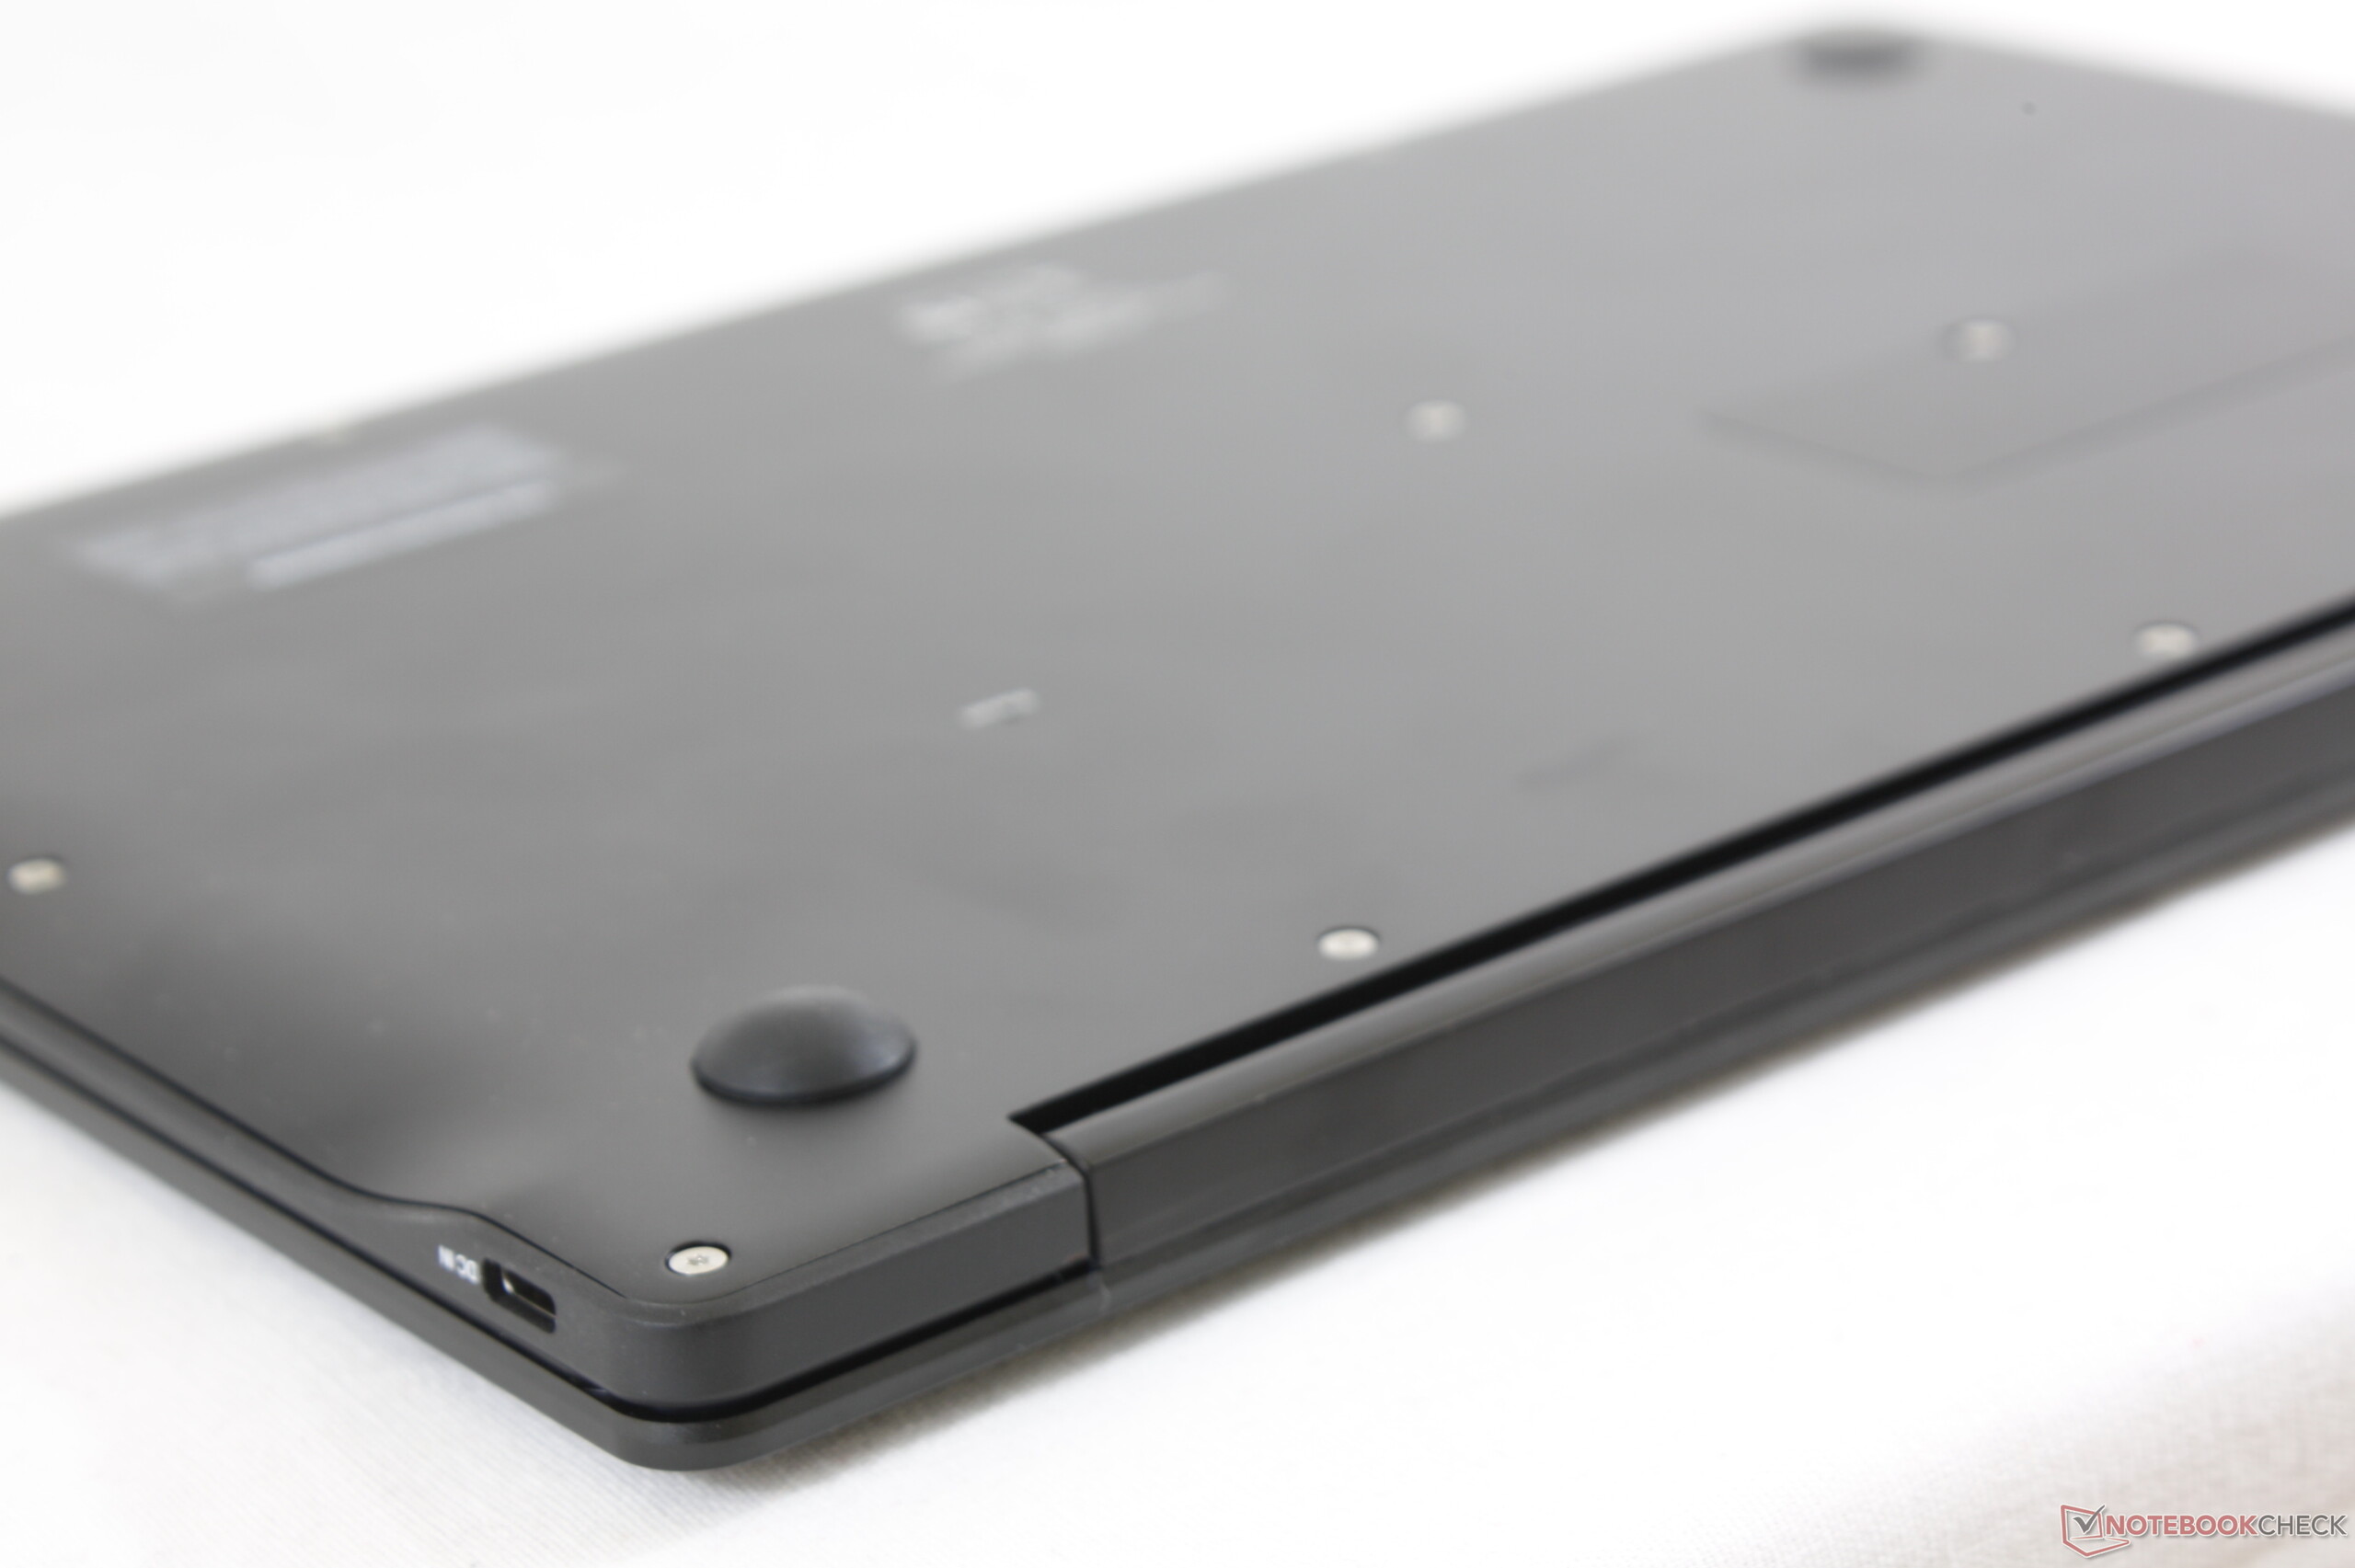
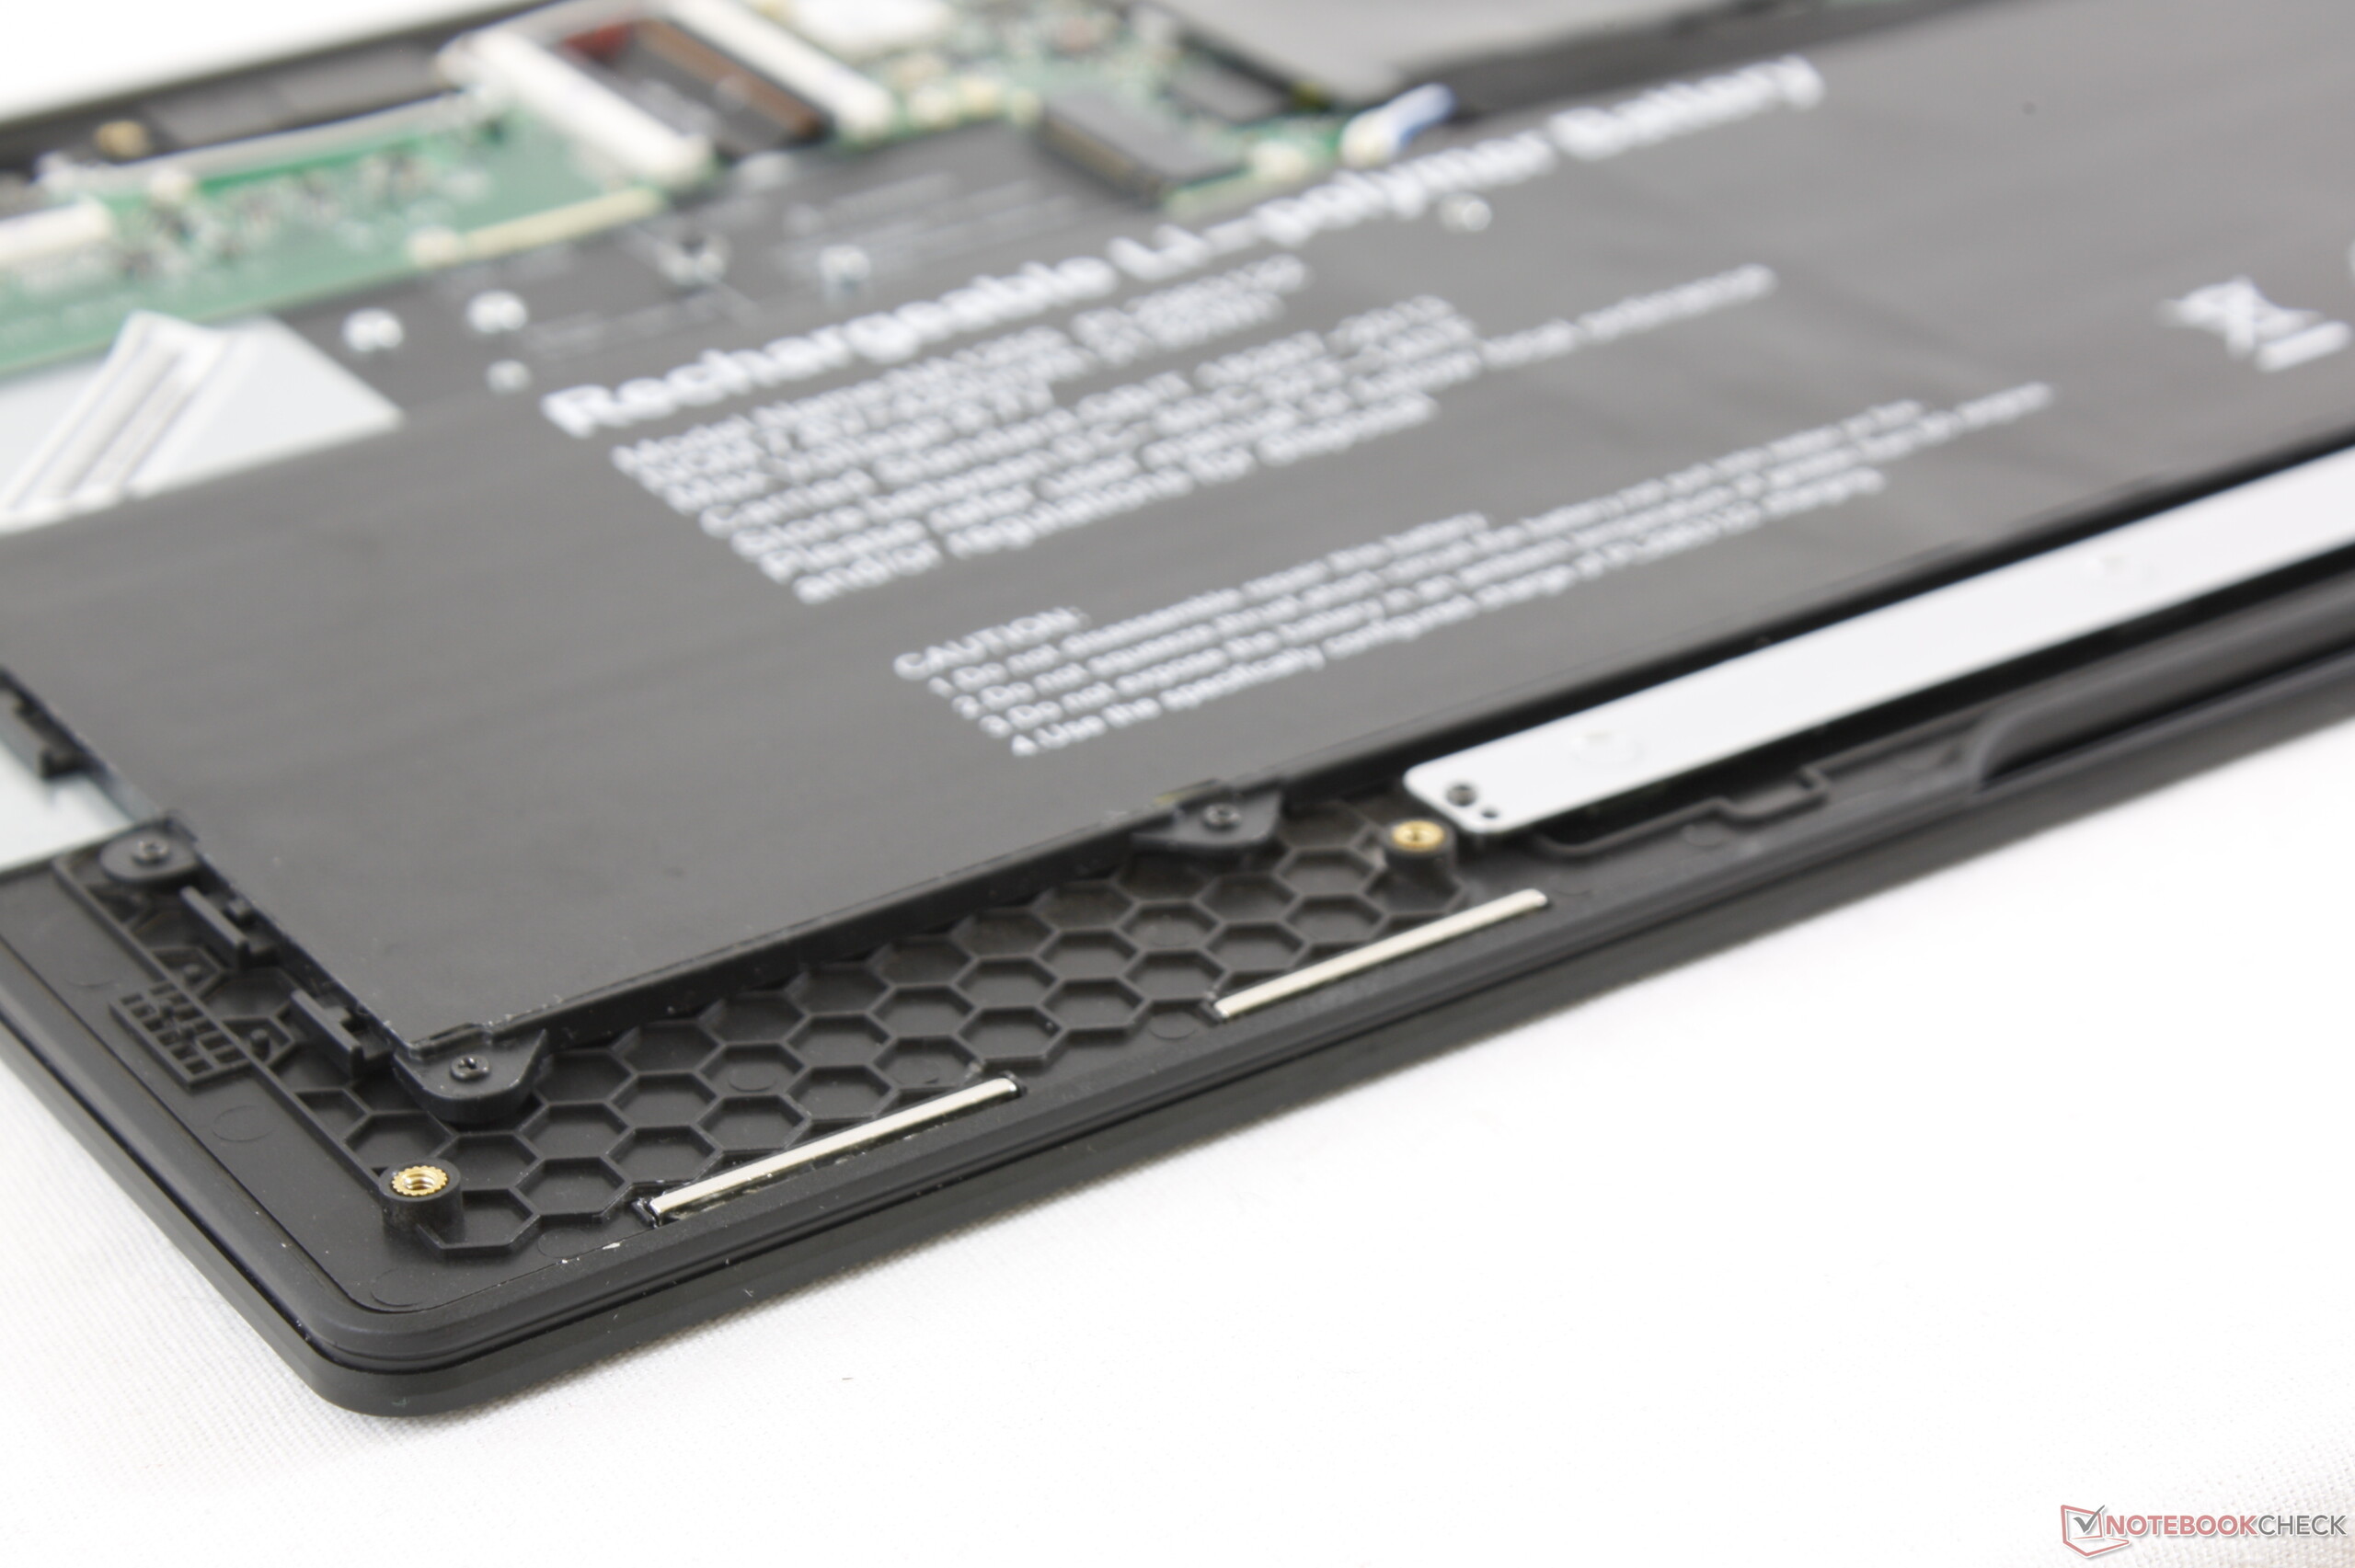
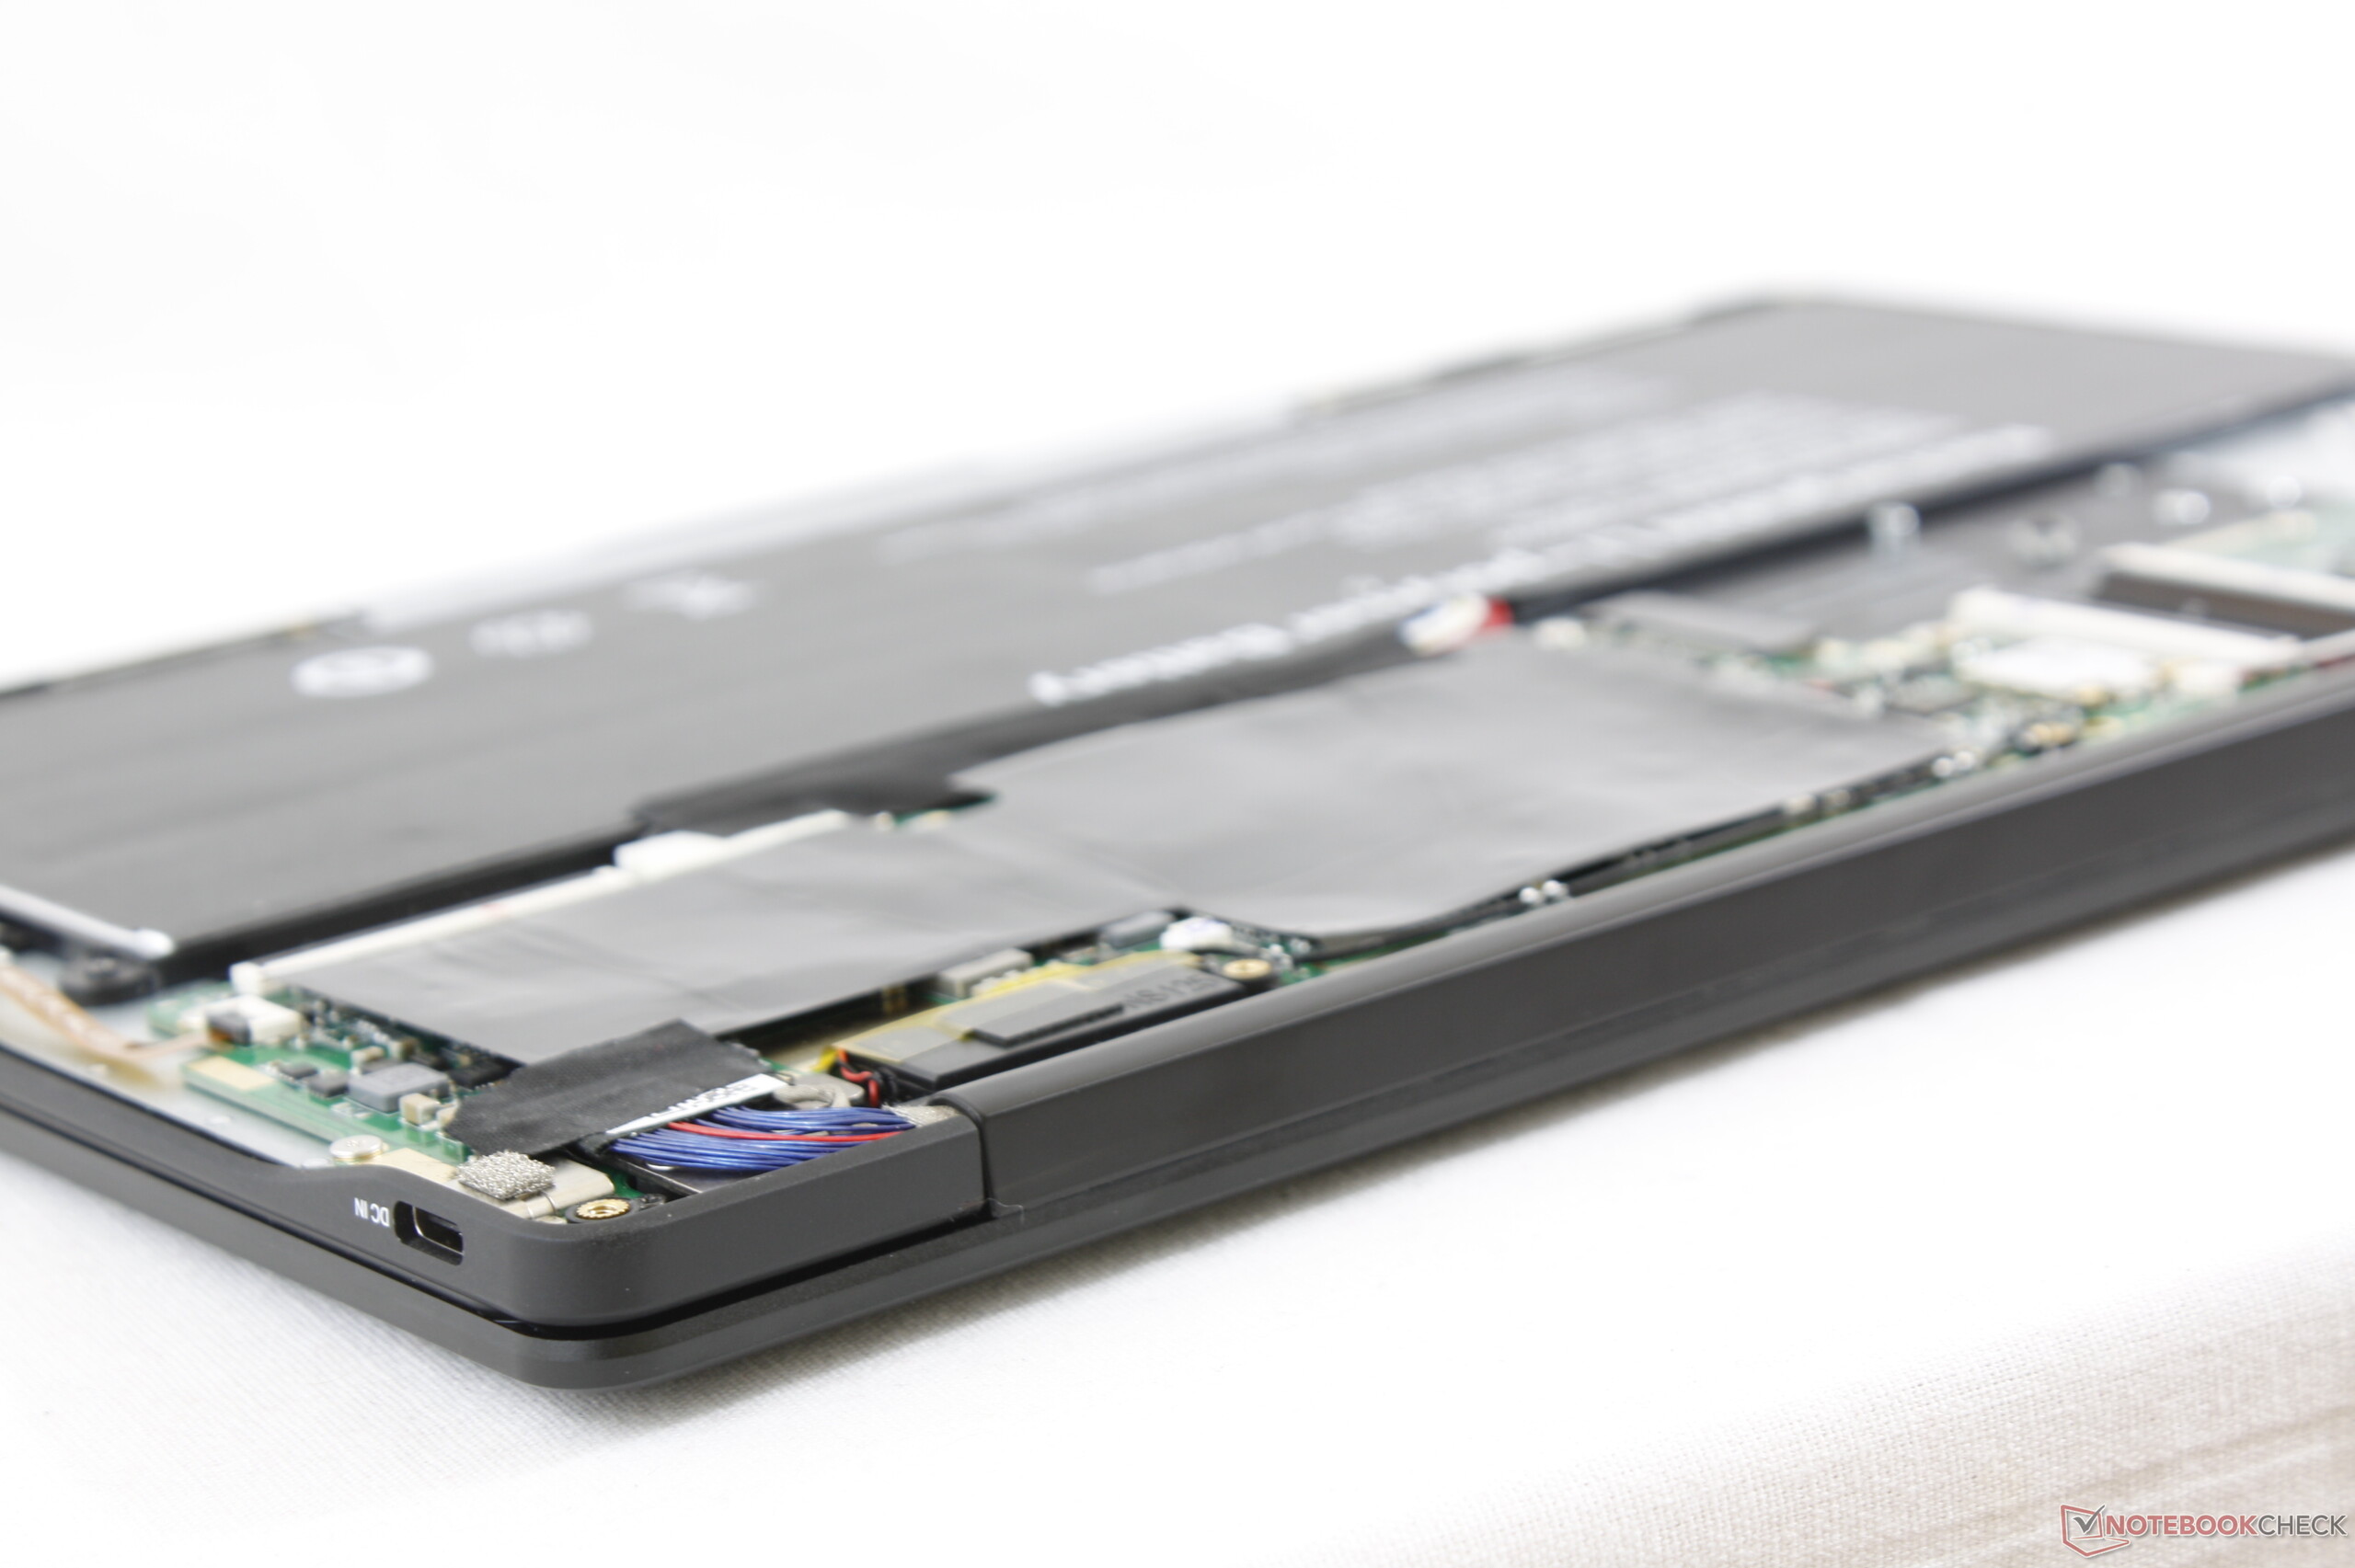
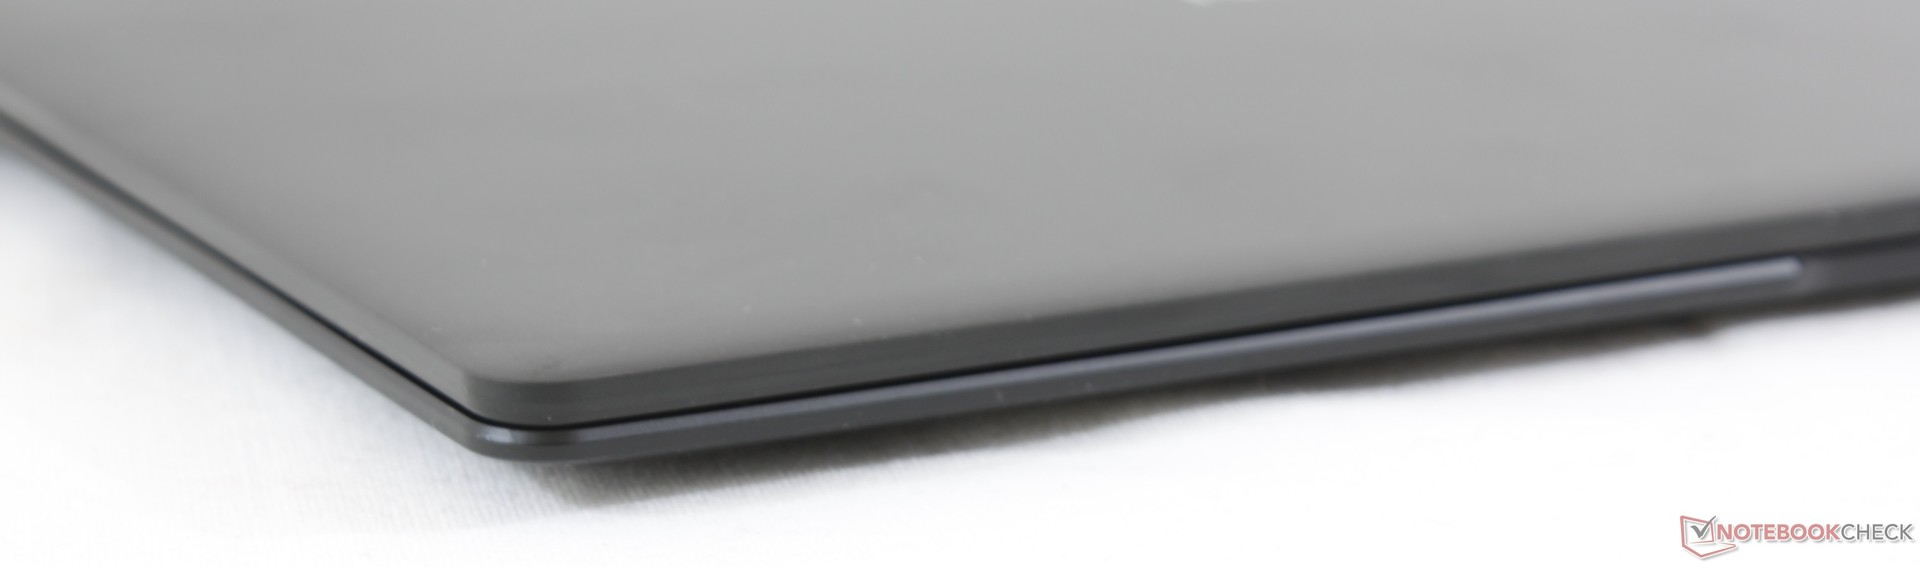
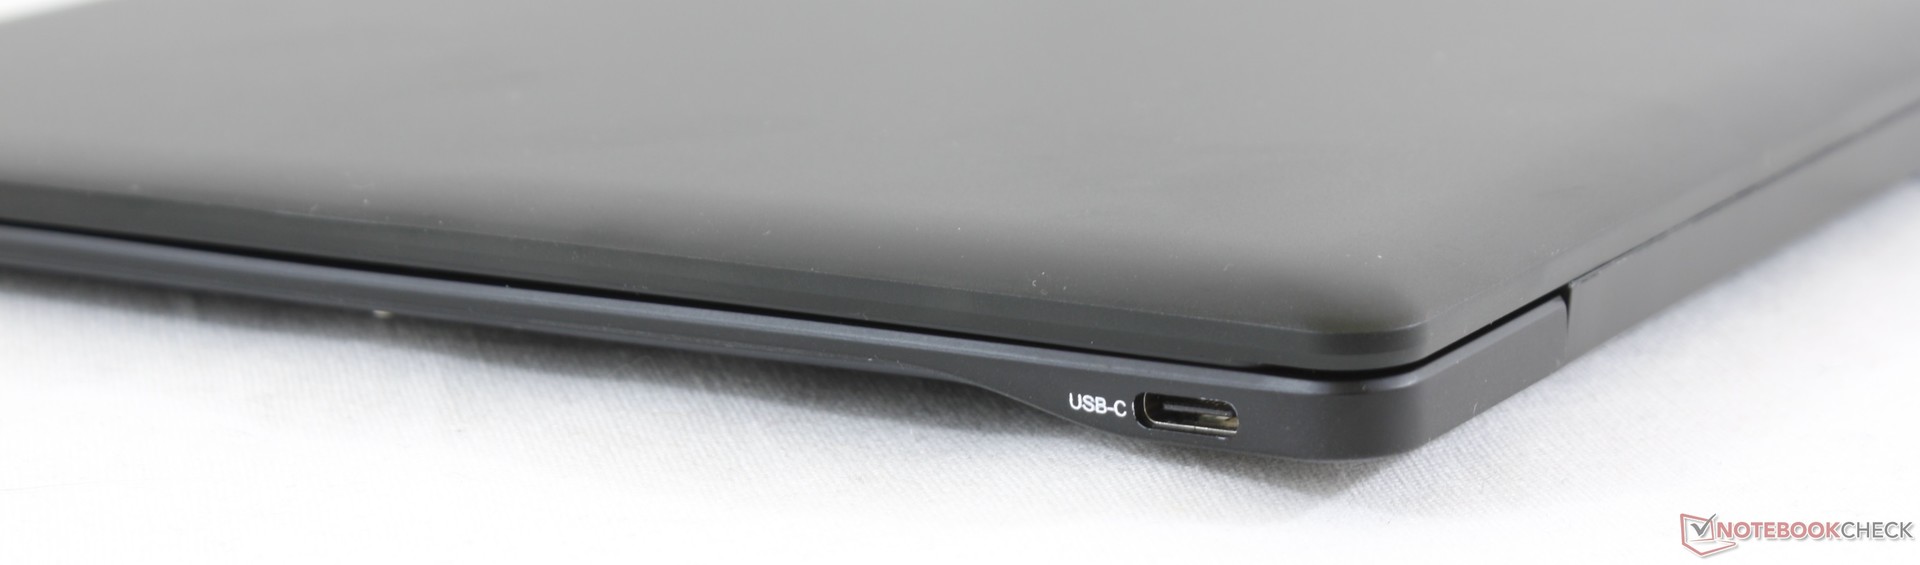
NuVision Encite Book 12 Plus är en obalanserad maskin. Vi får ge den beröm för sitt fokus på en ljusstark och högupplöst skärm samt ett tunt aluminiumhölje för under 4.000 kronor, men det kommer på bekostnad av nästan allt annat. Portutbudet är kraftigt begränsat, webbkamerans placering är suboptimal, tangentbordets och styrplattans knappar är svampiga, basen och gångjärnen kunde varit fastare, den laddar riktigt långsamt och SSD-enheten presterar inte särskilt mycket bättre än en vanlig mekanisk enhet. Den skarpa skärmen och de djupa färgerna är inte tillräckligt för att kompensera för resten av datorn.
Den som tilltalas av den lilla formfaktorn och priset bör istället investera i en Core i3-ultrabook från förra generationen. Äldre modeller av Dell XPS, HP Spectre eller Envy, Lenovo Ideapad 720s eller till och med Chuwi LapBook kan erbjuda mycket mer än NuVision på i princip alla sätt.
En utmärkt skärm begränsas av svampiga knappar och superlångsam systemprestanda. NuVision fick göra många märkbara nedskärningar för att kunna erbjuda en QHD-skärm till ett så lågt pris.
NuVision Encite Book 12 Plus
- 01/21/2019 v6 (old)
Allen Ngo
Price comparison
