Test: HP Envy 13-ad006ng (i7-7500U, MX150) Laptop (Sammanfattning)
| SD Card Reader | |
| average JPG Copy Test (av. of 3 runs) | |
| Dell XPS 13 i7-8550U | |
| HP Envy 13-ad006ng (Toshiba Exceria Pro SDXC 64 GB UHS-II) | |
| Lenovo IdeaPad 710S Plus-13IKB | |
| maximum AS SSD Seq Read Test (1GB) | |
| Dell XPS 13 i7-8550U | |
| Lenovo IdeaPad 710S Plus-13IKB | |
| HP Envy 13-ad006ng (Toshiba Exceria Pro SDXC 64 GB UHS-II) | |
| Networking | |
| iperf3 transmit AX12 | |
| HP Envy 13-ad006ng | |
| Lenovo IdeaPad 710S Plus-13IKB | |
| Dell XPS 13 i7-8550U | |
| iperf3 receive AX12 | |
| Dell XPS 13 i7-8550U | |
| Lenovo IdeaPad 710S Plus-13IKB | |
| HP Envy 13-ad006ng | |
| |||||||||||||||||||||||||
Distribution av ljusstyrkan: 83 %
Mitt på batteriet: 281 cd/m²
Kontrast: 1222:1 (Svärta: 0.23 cd/m²)
ΔE ColorChecker Calman: 4.83 | ∀{0.5-29.43 Ø4.73}
ΔE Greyscale Calman: 6.63 | ∀{0.09-98 Ø4.97}
86% sRGB (Argyll 1.6.3 3D)
56% AdobeRGB 1998 (Argyll 1.6.3 3D)
63.1% AdobeRGB 1998 (Argyll 3D)
86.3% sRGB (Argyll 3D)
66.8% Display P3 (Argyll 3D)
Gamma: 1.85
CCT: 6794 K
| HP Envy 13-ad006ng BOE070E, , 1920x1080, 13.3" | HP Envy 13-ad065nr LG Philips LGD0576, , 1920x1080, 13.3" | Dell XPS 13 9360 FHD i5 Sharp SHP1449 LQ133M1, , 1920x1080, 13.3" | Lenovo IdeaPad 710S Plus-13IKB LG Philips LP133WF4-SPB1 (LGD04EF), , 1920x1080, 13.3" | Asus Zenbook UX310UA-FC347T iGP AU Optronics AUO272D, , 1920x1080, 13.3" | Xiaomi Mi Notebook Air 13.3 2016 Samsung LTN133HL09-M01, , 1920x1080, 13.3" | |
|---|---|---|---|---|---|---|
| Display | -3% | -21% | -3% | -8% | 6% | |
| Display P3 Coverage (%) | 66.8 | 65.5 -2% | 48.94 -27% | 65.3 -2% | 64.2 -4% | 66 -1% |
| sRGB Coverage (%) | 86.3 | 83.8 -3% | 73.3 -15% | 82.9 -4% | 65.3 -24% | 95.5 11% |
| AdobeRGB 1998 Coverage (%) | 63.1 | 61.3 -3% | 50.5 -20% | 60.6 -4% | 65.3 3% | 67.8 7% |
| Response Times | 36% | 14% | 8% | 24% | 7% | |
| Response Time Grey 50% / Grey 80% * (ms) | 48 ? | 28 ? 42% | 32.8 ? 32% | 45 ? 6% | 40 ? 17% | 49 ? -2% |
| Response Time Black / White * (ms) | 32 ? | 22.4 ? 30% | 33.2 ? -4% | 29 ? 9% | 22 ? 31% | 27 ? 16% |
| PWM Frequency (Hz) | 1000 ? | 10200 ? | 200 ? | 50 ? | ||
| Screen | -4% | 4% | 4% | 6% | 18% | |
| Brightness middle (cd/m²) | 281 | 290 3% | 351.2 25% | 343 22% | 358 27% | 347 23% |
| Brightness (cd/m²) | 264 | 270 2% | 325 23% | 306 16% | 347 31% | 334 27% |
| Brightness Distribution (%) | 83 | 78 -6% | 89 7% | 81 -2% | 87 5% | 80 -4% |
| Black Level * (cd/m²) | 0.23 | 0.32 -39% | 0.195 15% | 0.3 -30% | 0.26 -13% | 0.27 -17% |
| Contrast (:1) | 1222 | 906 -26% | 1801 47% | 1143 -6% | 1377 13% | 1285 5% |
| Colorchecker dE 2000 * | 4.83 | 4.8 1% | 7.4 -53% | 4.73 2% | 5.22 -8% | 3.29 32% |
| Colorchecker dE 2000 max. * | 8.89 | 11.2 -26% | 9.08 -2% | 9.05 -2% | 9.19 -3% | 4.69 47% |
| Greyscale dE 2000 * | 6.63 | 2.8 58% | 6.71 -1% | 3.29 50% | 6.69 -1% | 3.62 45% |
| Gamma | 1.85 119% | 2.19 100% | 2.74 80% | 2.36 93% | 2.35 94% | 2.23 99% |
| CCT | 6794 96% | 6382 102% | 7222 90% | 6437 101% | 6745 96% | 7307 89% |
| Color Space (Percent of AdobeRGB 1998) (%) | 56 | 54.9 -2% | 50.48 -10% | 54 -4% | 59 5% | 62 11% |
| Color Space (Percent of sRGB) (%) | 86 | 83.5 -3% | 73.31 -15% | 83 -3% | 91 6% | 95 10% |
| Totalt genomsnitt (program/inställningar) | 10% /
2% | -1% /
0% | 3% /
3% | 7% /
6% | 10% /
14% |
* ... mindre är bättre
Visa svarstider
| ↔ Svarstid svart till vitt | ||
|---|---|---|
| 32 ms ... stiga ↗ och falla ↘ kombinerat | ↗ 17 ms stiga | 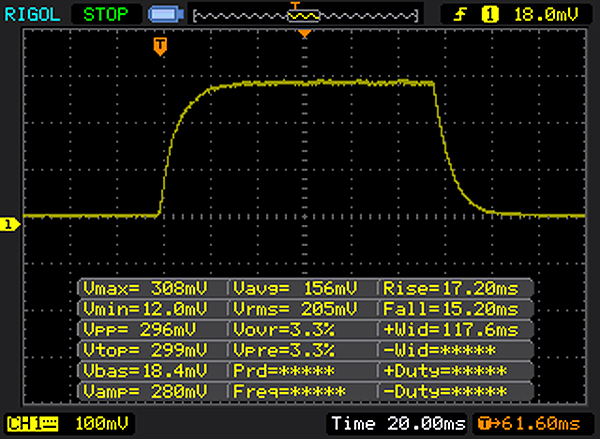 |
| ↘ 15 ms hösten | ||
| Skärmen visar långsamma svarsfrekvenser i våra tester och kommer att vara otillfredsställande för spelare. I jämförelse sträcker sig alla testade enheter från 0.1 (minst) till 240 (maximalt) ms. » 86 % av alla enheter är bättre. Detta innebär att den uppmätta svarstiden är sämre än genomsnittet av alla testade enheter (19.9 ms). | ||
| ↔ Svarstid 50 % grått till 80 % grått | ||
| 48 ms ... stiga ↗ och falla ↘ kombinerat | ↗ 23 ms stiga | 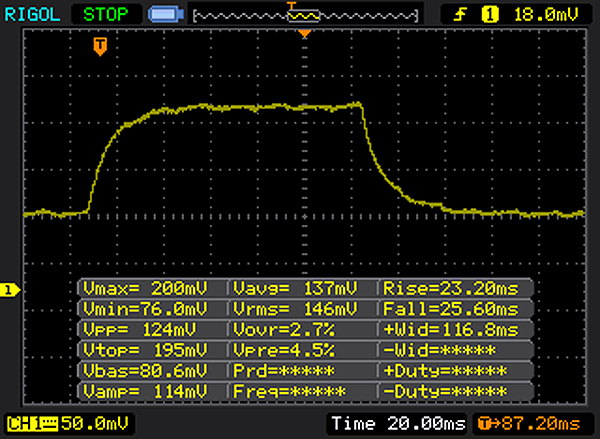 |
| ↘ 25 ms hösten | ||
| Skärmen visar långsamma svarsfrekvenser i våra tester och kommer att vara otillfredsställande för spelare. I jämförelse sträcker sig alla testade enheter från 0.165 (minst) till 636 (maximalt) ms. » 82 % av alla enheter är bättre. Detta innebär att den uppmätta svarstiden är sämre än genomsnittet av alla testade enheter (31.1 ms). | ||
Skärmflimmer / PWM (Puls-Width Modulation)
| Skärmflimmer / PWM upptäckt | 1000 Hz | ≤ 90 % ljusstyrka inställning | 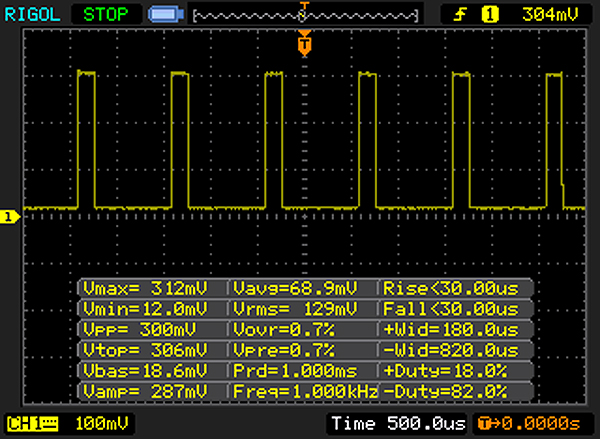 |
Displayens bakgrundsbelysning flimrar vid 1000 Hz (i värsta fall, t.ex. med PWM) Flimrande upptäckt vid en ljusstyrkeinställning på 90 % och lägre. Det ska inte finnas något flimmer eller PWM över denna ljusstyrkeinställning. Frekvensen för 1000 Hz är ganska hög, så de flesta användare som är känsliga för PWM bör inte märka något flimmer. Som jämförelse: 52 % av alla testade enheter använder inte PWM för att dämpa skärmen. Om PWM upptäcktes mättes ett medelvärde av 7798 (minst: 5 - maximum: 343500) Hz. | |||
| Cinebench R15 | |
| CPU Single 64Bit | |
| Dell XPS 13 i7-8550U | |
| Asus Zenbook UX310UA-FC347T iGP | |
| HP Envy 13-ad006ng | |
| HP Envy 13-ad065nr | |
| Xiaomi Mi Notebook Air 13.3 2016 | |
| Lenovo IdeaPad 710S Plus-13IKB | |
| CPU Multi 64Bit | |
| Dell XPS 13 i7-8550U | |
| HP Envy 13-ad006ng | |
| Asus Zenbook UX310UA-FC347T iGP | |
| HP Envy 13-ad065nr | |
| Xiaomi Mi Notebook Air 13.3 2016 | |
| Lenovo IdeaPad 710S Plus-13IKB | |
| PCMark 8 | |
| Home Score Accelerated v2 | |
| Asus Zenbook UX310UA-FC347T iGP | |
| HP Envy 13-ad006ng | |
| HP Envy 13-ad065nr | |
| Dell XPS 13 i7-8550U | |
| Lenovo IdeaPad 710S Plus-13IKB | |
| Xiaomi Mi Notebook Air 13.3 2016 | |
| Work Score Accelerated v2 | |
| Asus Zenbook UX310UA-FC347T iGP | |
| HP Envy 13-ad006ng | |
| HP Envy 13-ad065nr | |
| Dell XPS 13 i7-8550U | |
| Xiaomi Mi Notebook Air 13.3 2016 | |
| Lenovo IdeaPad 710S Plus-13IKB | |
| PCMark 10 - Score | |
| HP Envy 13-ad006ng | |
| HP Envy 13-ad065nr | |
| PCMark 8 Home Score Accelerated v2 | 3773 poäng | |
| PCMark 8 Work Score Accelerated v2 | 4900 poäng | |
| PCMark 10 Score | 3282 poäng | |
Hjälp | ||
| HP Envy 13-ad006ng Toshiba NVMe THNSN5256GPUK | Lenovo IdeaPad 710S Plus-13IKB Samsung PM961 NVMe MZVLW512HMJP | Xiaomi Mi Notebook Air 13.3 2016 Samsung PM951 NVMe MZVLV256 | Asus Zenbook UX310UA-FC347T iGP Micron SSD 1100 (MTFDDAV256TBN) | HP Envy 13-ad065nr SanDisk X400 SD8SN8U-128G-1006 | Dell XPS 13 i7-8550U Toshiba XG5 KXG50ZNV256G | |
|---|---|---|---|---|---|---|
| CrystalDiskMark 3.0 | 193% | 40% | 14% | |||
| Read Seq (MB/s) | 1019 | 1577 55% | 1209 19% | 489.4 -52% | ||
| Write Seq (MB/s) | 195.4 | 1472 653% | 314 61% | 431.6 121% | ||
| Read 512 (MB/s) | 735 | 1165 59% | 356.7 -51% | |||
| Write 512 (MB/s) | 172.3 | 1244 622% | 389.1 126% | |||
| Read 4k (MB/s) | 34.5 | 54.8 59% | 43.4 26% | 26.68 -23% | ||
| Write 4k (MB/s) | 109.4 | 121.5 11% | 153.4 40% | 88.7 -19% | ||
| Read 4k QD32 (MB/s) | 494.6 | 407.5 -18% | 487.6 -1% | 246.3 -50% | ||
| Write 4k QD32 (MB/s) | 161.3 | 321.4 99% | 312.2 94% | 251.5 56% | ||
| CrystalDiskMark 5.2 / 6 | -26% | 12% | ||||
| Write 4K (MB/s) | 155.7 | 57.5 -63% | 121.5 -22% | |||
| Read 4K (MB/s) | 26.5 | 29.34 11% | 24.92 -6% | |||
| Write Seq (MB/s) | 312.3 | 342.5 10% | 345 10% | |||
| Read Seq (MB/s) | 928 | 503 -46% | 1313 41% | |||
| Write 4K Q32T1 (MB/s) | 208.7 | 160.3 -23% | 346.1 66% | |||
| Read 4K Q32T1 (MB/s) | 478.8 | 285.7 -40% | 389.4 -19% | |||
| Write Seq Q32T1 (MB/s) | 305.1 | 330.8 8% | 334.7 10% | |||
| Read Seq Q32T1 (MB/s) | 1601 | 552 -66% | 1840 15% | |||
| Totalt genomsnitt (program/inställningar) | 193% /
193% | 40% /
40% | 14% /
14% | -26% /
-26% | 12% /
12% |

| 3DMark 11 - 1280x720 Performance GPU | |
| HP Envy 13-ad006ng | |
| Lenovo IdeaPad 710S Plus-13IKB | |
| Xiaomi Mi Notebook Air 13.3 2016 | |
| Dell XPS 13 i7-8550U | |
| Asus Zenbook UX310UA-FC347T iGP | |
| HP Envy 13-ad065nr | |
| 3DMark | |
| 1280x720 Cloud Gate Standard Graphics | |
| HP Envy 13-ad006ng | |
| Lenovo IdeaPad 710S Plus-13IKB | |
| Xiaomi Mi Notebook Air 13.3 2016 | |
| Dell XPS 13 i7-8550U | |
| Asus Zenbook UX310UA-FC347T iGP | |
| HP Envy 13-ad065nr | |
| 1920x1080 Fire Strike Graphics | |
| HP Envy 13-ad006ng | |
| Xiaomi Mi Notebook Air 13.3 2016 | |
| Lenovo IdeaPad 710S Plus-13IKB | |
| Dell XPS 13 i7-8550U | |
| Asus Zenbook UX310UA-FC347T iGP | |
| HP Envy 13-ad065nr | |
| 3DMark 11 Performance | 3588 poäng | |
| 3DMark Cloud Gate Standard Score | 9800 poäng | |
| 3DMark Fire Strike Score | 2528 poäng | |
Hjälp | ||
| The Witcher 3 - 1366x768 Medium Graphics & Postprocessing | |
| Dell XPS 15 2017 9560 (7300HQ, Full-HD) | |
| HP Envy 13-ad006ng | |
| Lenovo IdeaPad 710S Plus-13IKB | |
| Asus Zenbook UX310UA-FC347T iGP | |
| BioShock Infinite - 1366x768 High Preset | |
| HP Envy 13-ad006ng | |
| Xiaomi Mi Notebook Air 13.3 2016 | |
| Dell XPS 13 i7-8550U | |
| Asus Zenbook UX310UA-FC347T iGP | |
| HP Envy 13-ad065nr | |
| låg | med. | hög | ultra | |
|---|---|---|---|---|
| BioShock Infinite (2013) | 173.9 | 94 | 79 | 29.72 |
| Company of Heroes 2 (2013) | 46.46 | 38.73 | 27.87 | 9.9 |
| The Witcher 3 (2015) | 45.13 | 27.64 | 14.47 | 9 |
| Rise of the Tomb Raider (2016) | 60 | 34.06 | 17 |
Ljudnivå
| Låg belastning |
| 30.5 / 30.5 / 30.5 dB(A) |
| Hög belastning |
| 37.3 / 34.2 dB(A) |
 | ||
30 dB tyst 40 dB(A) hörbar 50 dB(A) högt ljud |
||
min: | ||
(±) Den maximala temperaturen på ovansidan är 41.6 °C / 107 F, jämfört med genomsnittet av 35.9 °C / 97 F , allt från 21.4 till 59 °C för klassen Subnotebook.
(+) Botten värms upp till maximalt 33.4 °C / 92 F, jämfört med genomsnittet av 39.2 °C / 103 F
(+) Vid tomgångsbruk är medeltemperaturen för ovansidan 22.4 °C / 72 F, jämfört med enhetsgenomsnittet på 30.8 °C / ### class_avg_f### F.
(±) När du spelar The Witcher 3 är medeltemperaturen för ovansidan 35 °C / 95 F, jämfört med enhetsgenomsnittet på 30.8 °C / ## #class_avg_f### F.
(+) Handledsstöden och pekplattan är kallare än hudtemperaturen med maximalt 30.6 °C / 87.1 F och är därför svala att ta på.
(-) Medeltemperaturen för handledsstödsområdet på liknande enheter var 28.2 °C / 82.8 F (-2.4 °C / -4.3 F).
HP Envy 13-ad006ng ljudanalys
(-) | inte särskilt höga högtalare (70.1 dB)
Bas 100 - 315 Hz
(-) | nästan ingen bas - i genomsnitt 27.6% lägre än medianen
(±) | linjäriteten för basen är genomsnittlig (9.8% delta till föregående frekvens)
Mellan 400 - 2000 Hz
(+) | balanserad mellan - endast 2.2% från medianen
(+) | mids är linjära (6.1% delta till föregående frekvens)
Högsta 2 - 16 kHz
(+) | balanserade toppar - endast 2% från medianen
(+) | toppar är linjära (3.7% delta till föregående frekvens)
Totalt 100 - 16 000 Hz
(±) | linjäriteten för det totala ljudet är genomsnittlig (20.2% skillnad mot median)
Jämfört med samma klass
» 64% av alla testade enheter i den här klassen var bättre, 9% liknande, 27% sämre
» Den bästa hade ett delta på 5%, genomsnittet var 18%, sämst var 53%
Jämfört med alla testade enheter
» 52% av alla testade enheter var bättre, 8% liknande, 39% sämre
» Den bästa hade ett delta på 4%, genomsnittet var 24%, sämst var 134%
Dell XPS 13 i7-8550U ljudanalys
(-) | inte särskilt höga högtalare (66.8 dB)
Bas 100 - 315 Hz
(+) | bra bas - bara 4.5% från medianen
(±) | linjäriteten för basen är genomsnittlig (8.2% delta till föregående frekvens)
Mellan 400 - 2000 Hz
(±) | högre mellan - i genomsnitt 5% högre än median
(+) | mids är linjära (5.8% delta till föregående frekvens)
Högsta 2 - 16 kHz
(+) | balanserade toppar - endast 3% från medianen
(±) | linjäriteten för toppar är genomsnittlig (14.5% delta till föregående frekvens)
Totalt 100 - 16 000 Hz
(±) | linjäriteten för det totala ljudet är genomsnittlig (17.2% skillnad mot median)
Jämfört med samma klass
» 44% av alla testade enheter i den här klassen var bättre, 9% liknande, 47% sämre
» Den bästa hade ett delta på 5%, genomsnittet var 18%, sämst var 53%
Jämfört med alla testade enheter
» 32% av alla testade enheter var bättre, 8% liknande, 60% sämre
» Den bästa hade ett delta på 4%, genomsnittet var 24%, sämst var 134%
| Av/Standby | |
| Låg belastning | |
| Hög belastning |
|
Förklaring:
min: | |
| HP Envy 13-ad006ng i7-7500U, GeForce MX150, Toshiba NVMe THNSN5256GPUK, IPS LED, 1920x1080, 13.3" | HP Envy 13-ad065nr i5-7200U, HD Graphics 620, SanDisk X400 SD8SN8U-128G-1006, IPS, 1920x1080, 13.3" | Lenovo IdeaPad 710S Plus-13IKB i7-7500U, GeForce 940MX, Samsung PM961 NVMe MZVLW512HMJP, IPS, 1920x1080, 13.3" | Asus Zenbook UX310UA-FC347T iGP i7-7500U, HD Graphics 620, Micron SSD 1100 (MTFDDAV256TBN), IPS, LED, 1920x1080, 13.3" | Dell XPS 13 i7-8550U i5-8550U, UHD Graphics 620, Toshiba XG5 KXG50ZNV256G, IGZO IPS, 3200x1800, 13.3" | Xiaomi Mi Notebook Air 13.3 2016 6200U, GeForce 940MX, Samsung PM951 NVMe MZVLV256, IPS, 1920x1080, 13.3" | |
|---|---|---|---|---|---|---|
| Power Consumption | 17% | -10% | 2% | 0% | -10% | |
| Idle Minimum * (Watt) | 2.8 | 2.8 -0% | 3.6 -29% | 3.5 -25% | 4.1 -46% | 4 -43% |
| Idle Average * (Watt) | 5.8 | 5.8 -0% | 7.4 -28% | 6.6 -14% | 5.8 -0% | 6.6 -14% |
| Idle Maximum * (Watt) | 7.7 | 6.4 17% | 8.7 -13% | 7.5 3% | 6 22% | 7.4 4% |
| Load Average * (Watt) | 48 | 31.3 35% | 43 10% | 34.7 28% | 42.5 11% | 41.7 13% |
| Witcher 3 ultra * (Watt) | 35 | |||||
| Load Maximum * (Watt) | 48 | 31.7 34% | 42 12% | 39.6 17% | 41.4 14% | 52.4 -9% |
* ... mindre är bättre
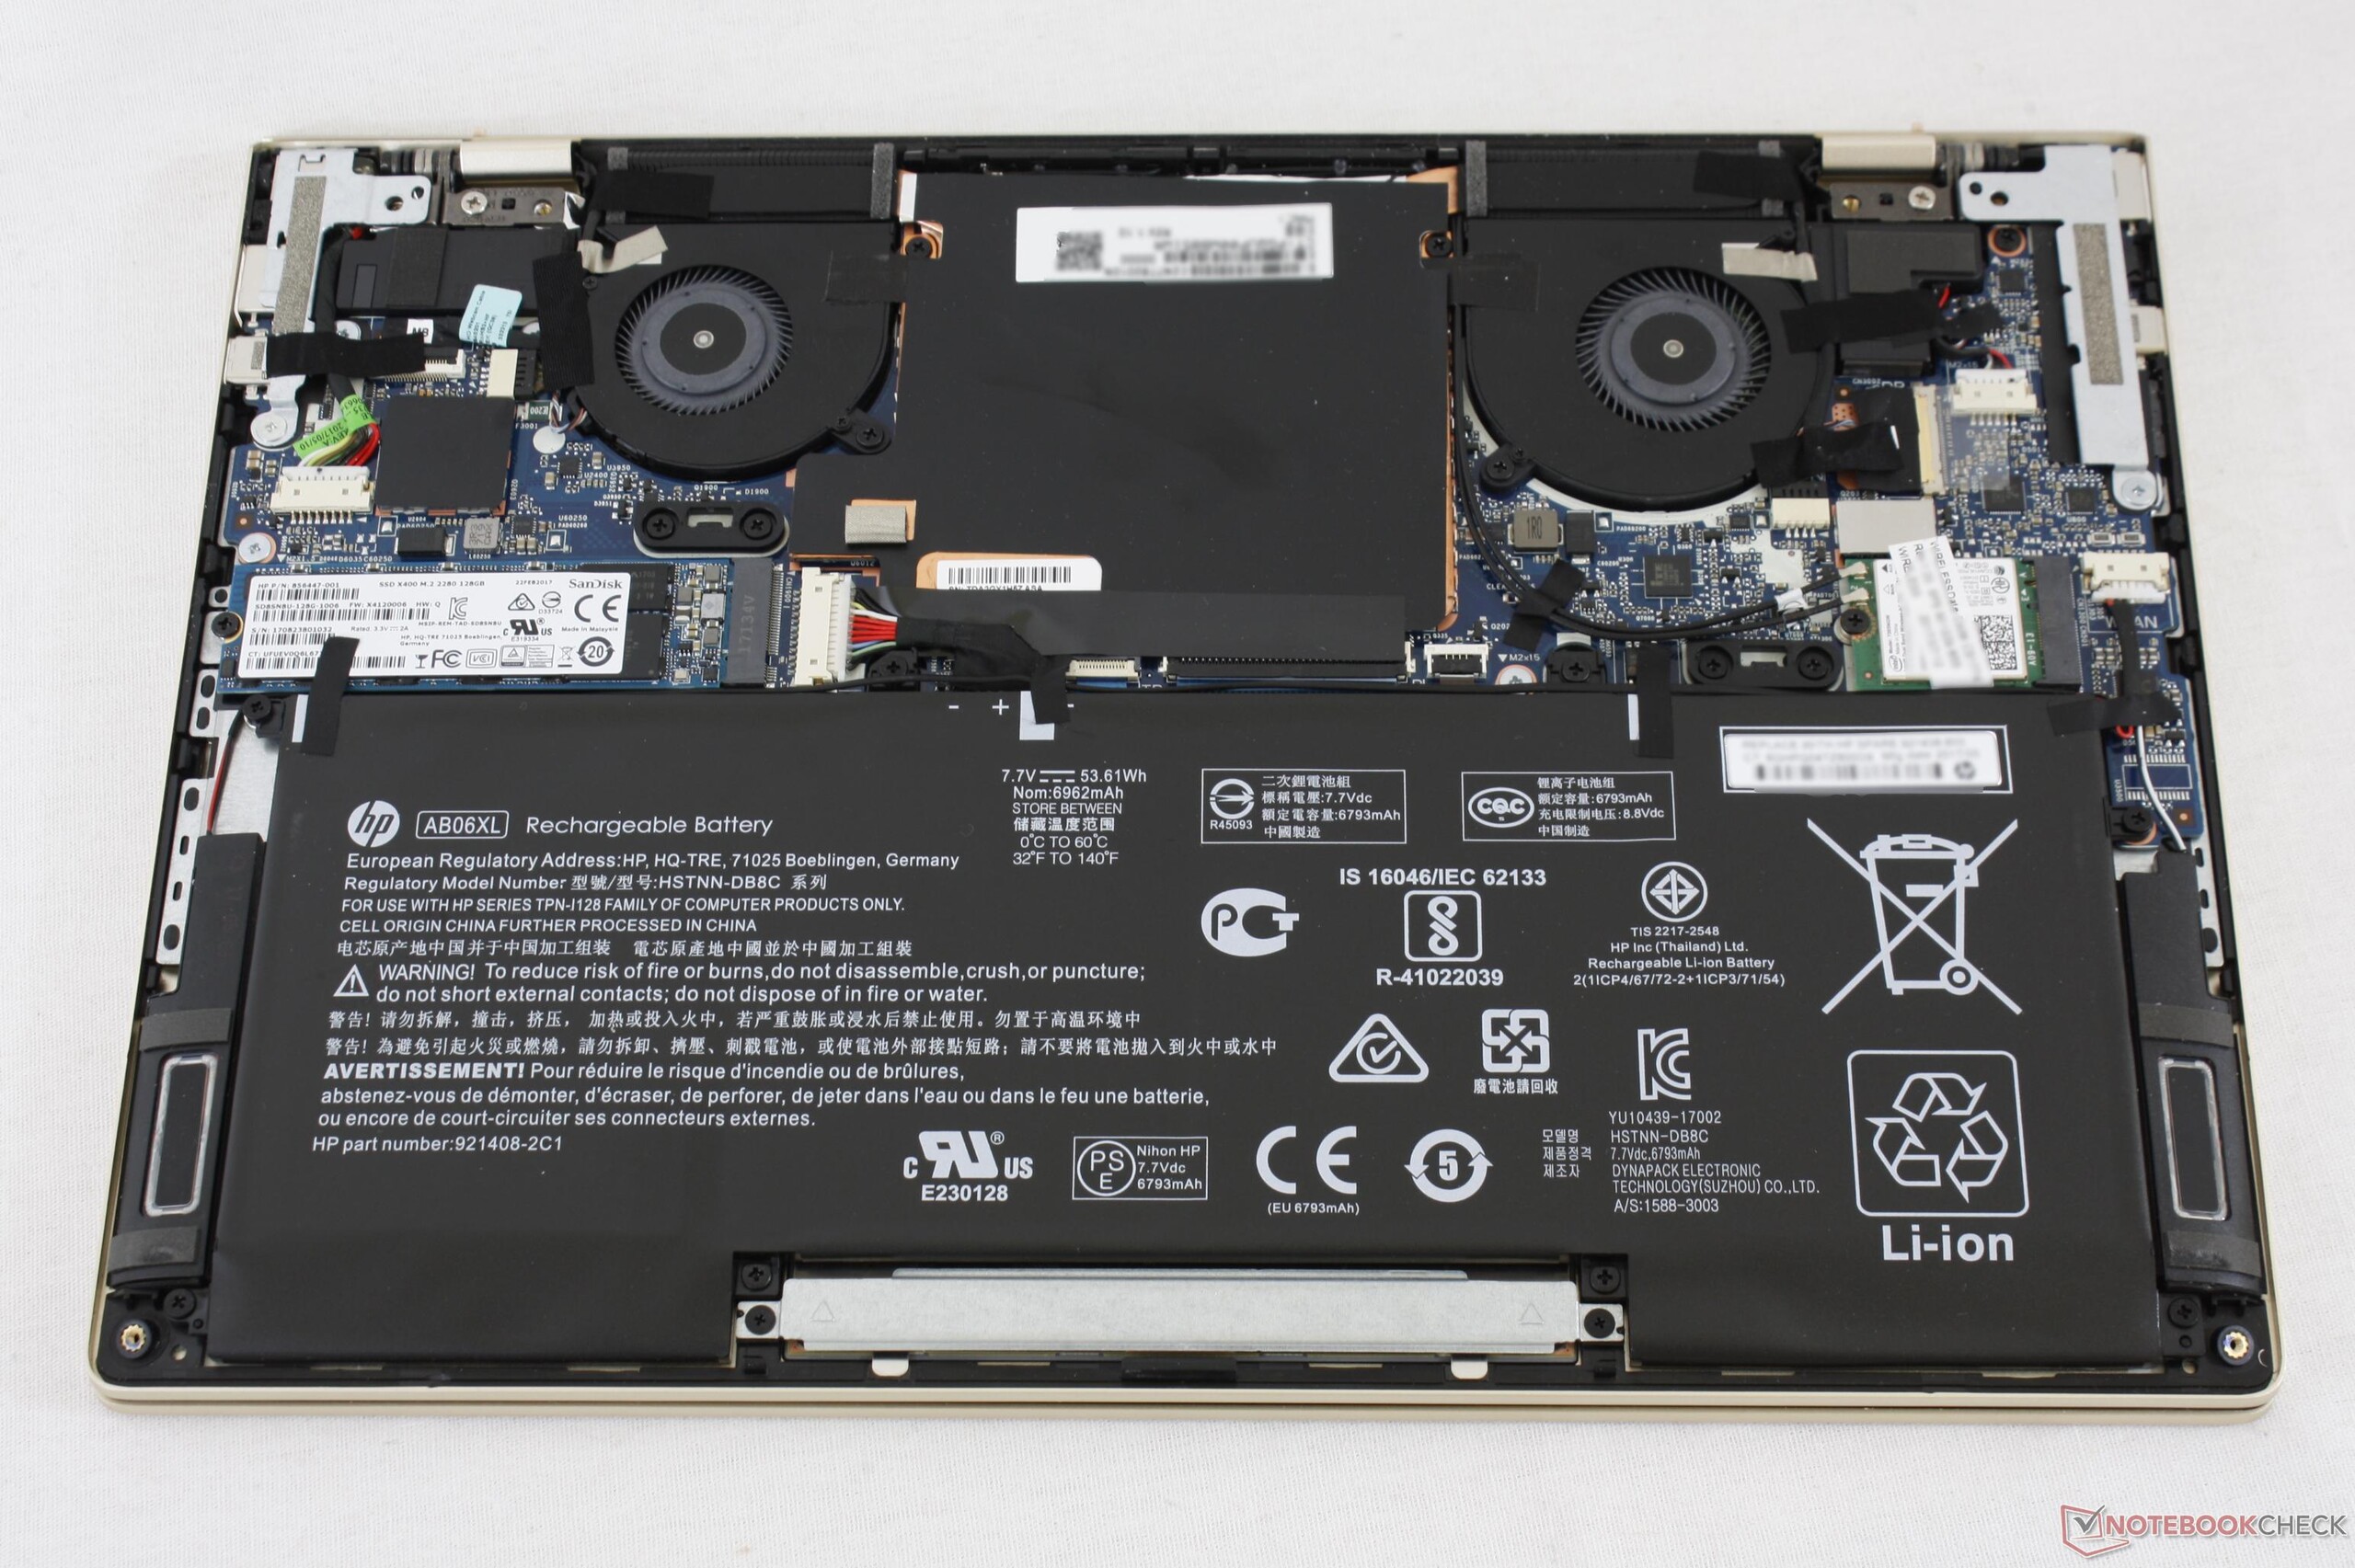
| HP Envy 13-ad006ng i7-7500U, GeForce MX150, 51 Wh | HP Envy 13-ad065nr i5-7200U, HD Graphics 620, 53.6 Wh | Lenovo IdeaPad 710S Plus-13IKB i7-7500U, GeForce 940MX, 46 Wh | Asus Zenbook UX310UA-FC347T iGP i7-7500U, HD Graphics 620, 48 Wh | Dell XPS 13 i7-8550U i5-8550U, UHD Graphics 620, 60 Wh | Xiaomi Mi Notebook Air 13.3 2016 6200U, GeForce 940MX, 40 Wh | |
|---|---|---|---|---|---|---|
| Batteridrifttid | 21% | -36% | -1% | 17% | -22% | |
| Reader / Idle (h) | 20 | 24.8 24% | 7.8 -61% | 16.1 -19% | 18.5 -7% | 12 -40% |
| H.264 (h) | 7.9 | 6.9 -13% | 7.1 -10% | |||
| WiFi v1.3 (h) | 7.1 | 9.5 34% | 5.6 -21% | 9.6 35% | 9.8 38% | 6.5 -8% |
| Load (h) | 2 | 2.1 5% | 1.5 -25% | 1.9 -5% | 2.4 20% | 1.4 -30% |
För
Emot

HP:s Envy 13 är en attraktiv 13.3-tums mittenskikts-Ultrabook designad för att tävla med Dell XPS 13 - även med dess pris. Men är det gäller detta högt satta mål så misslyckas Envy.
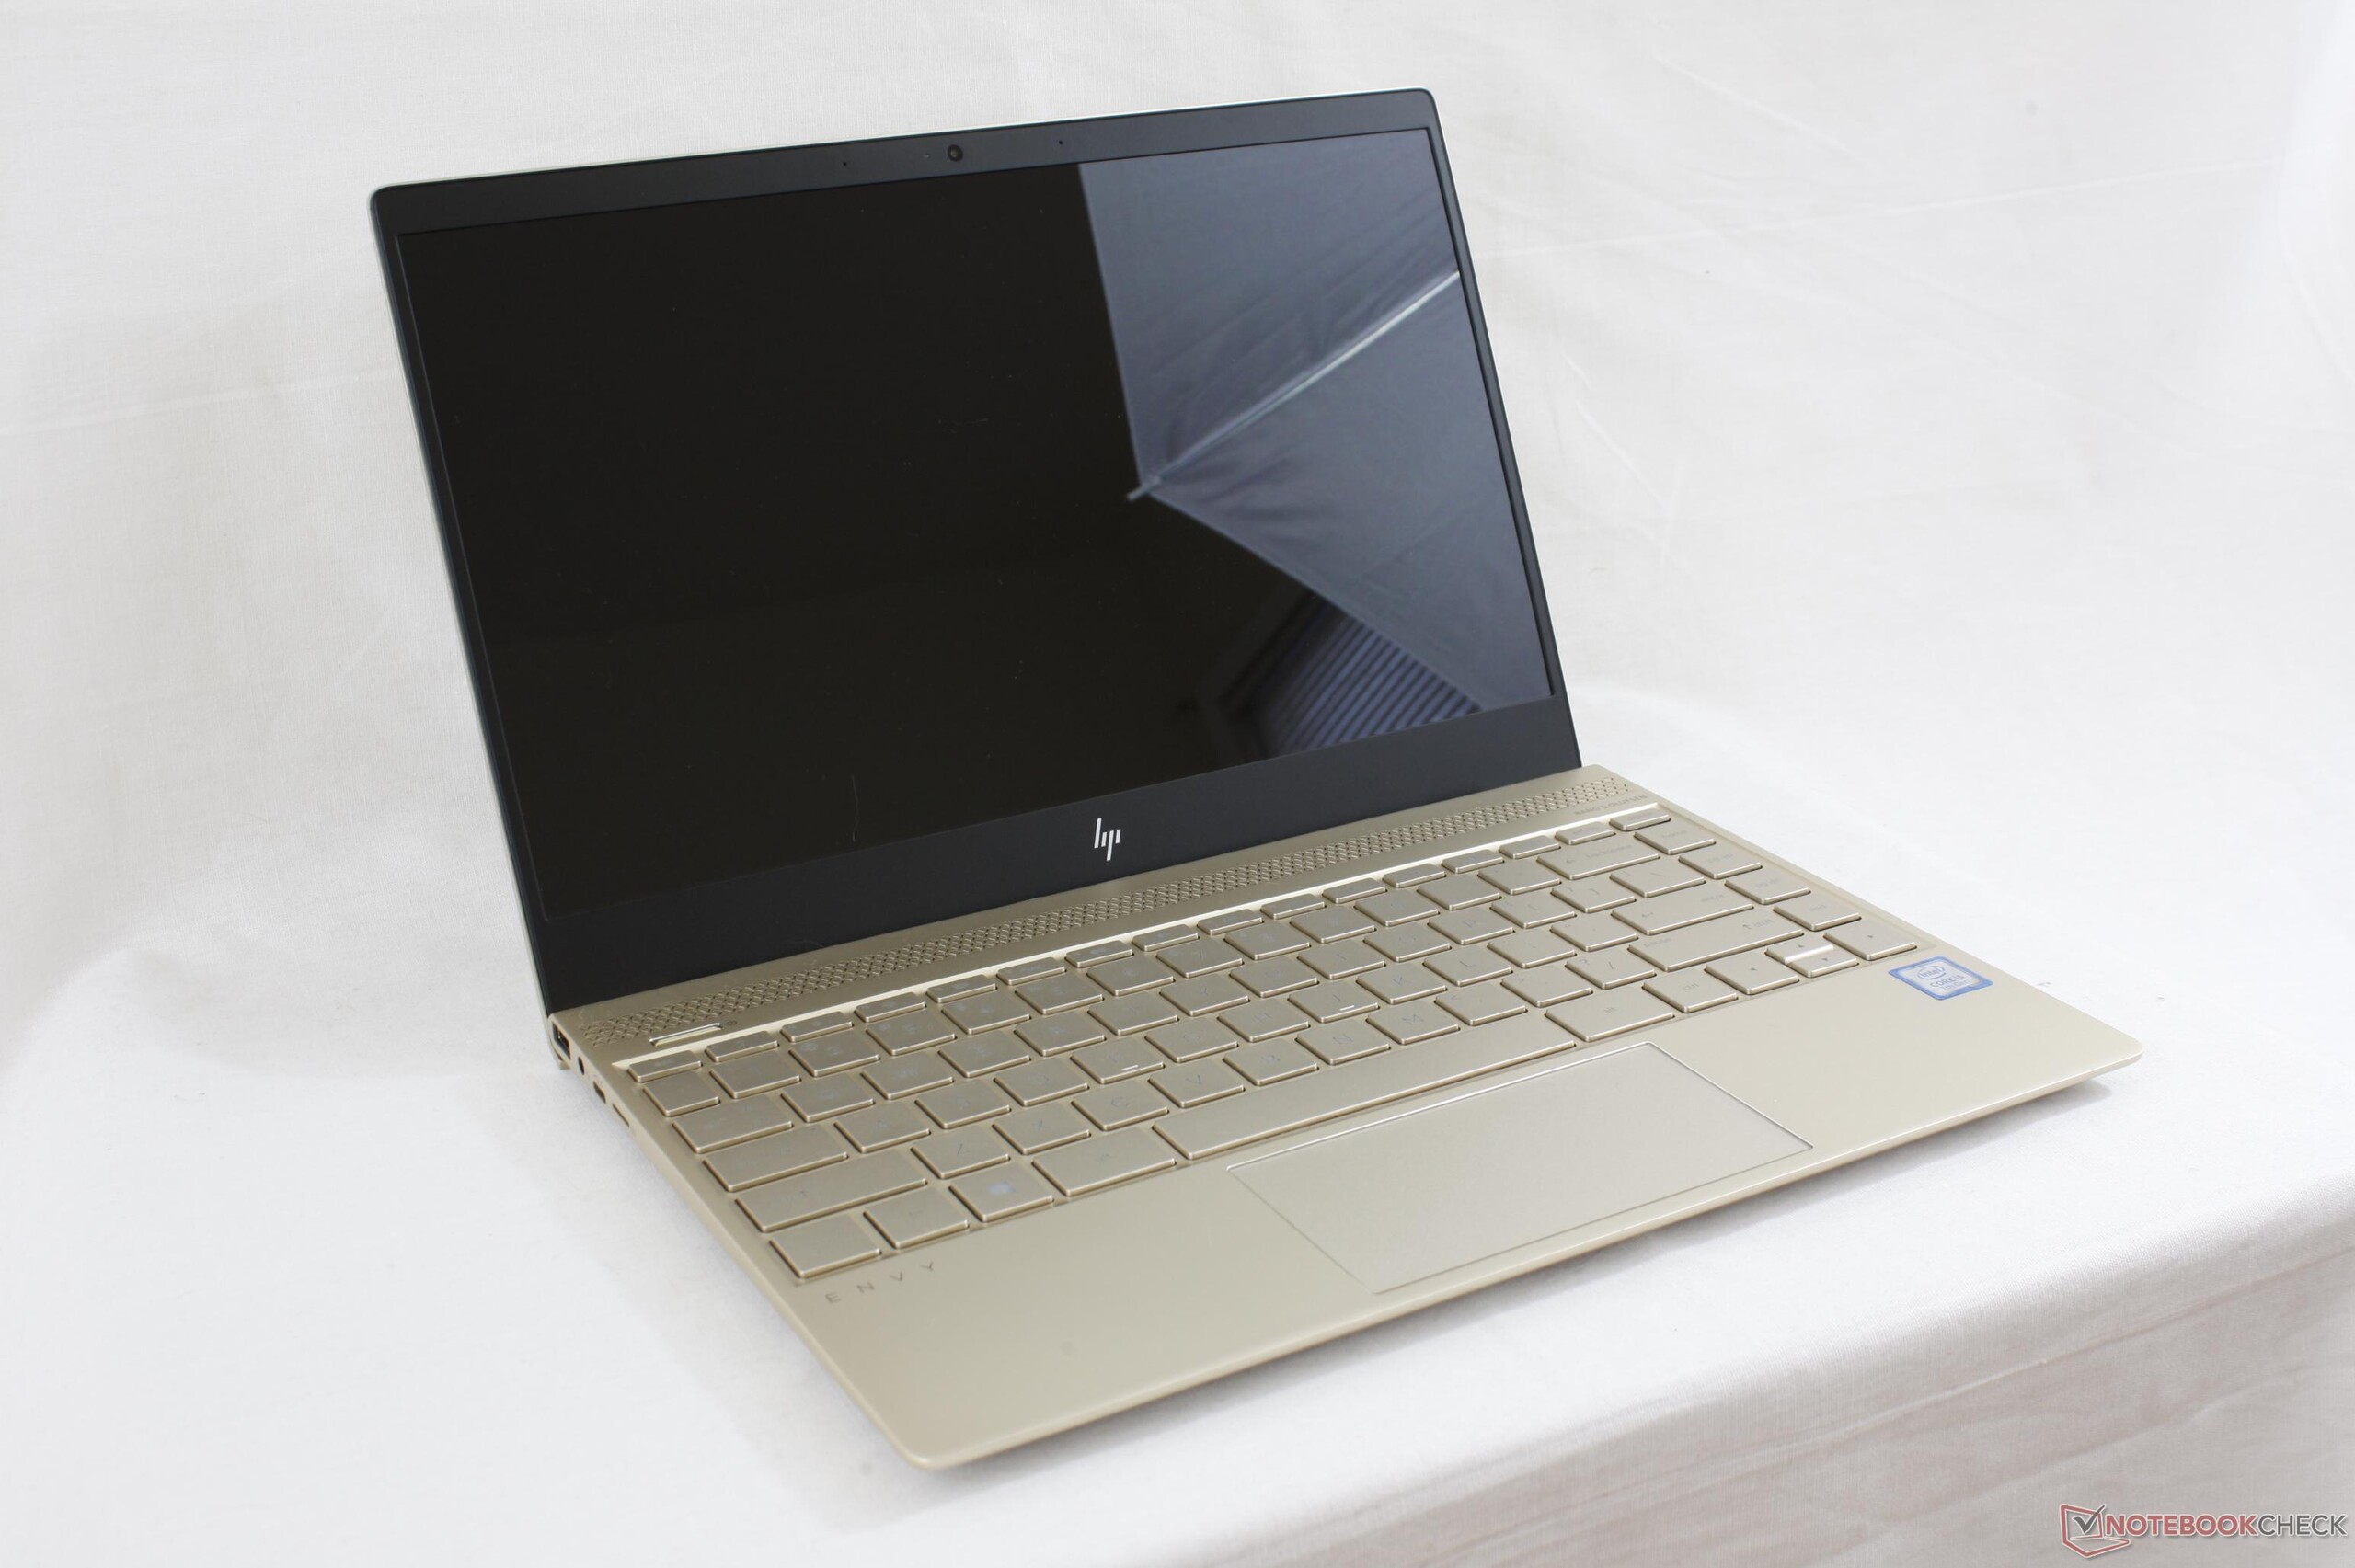
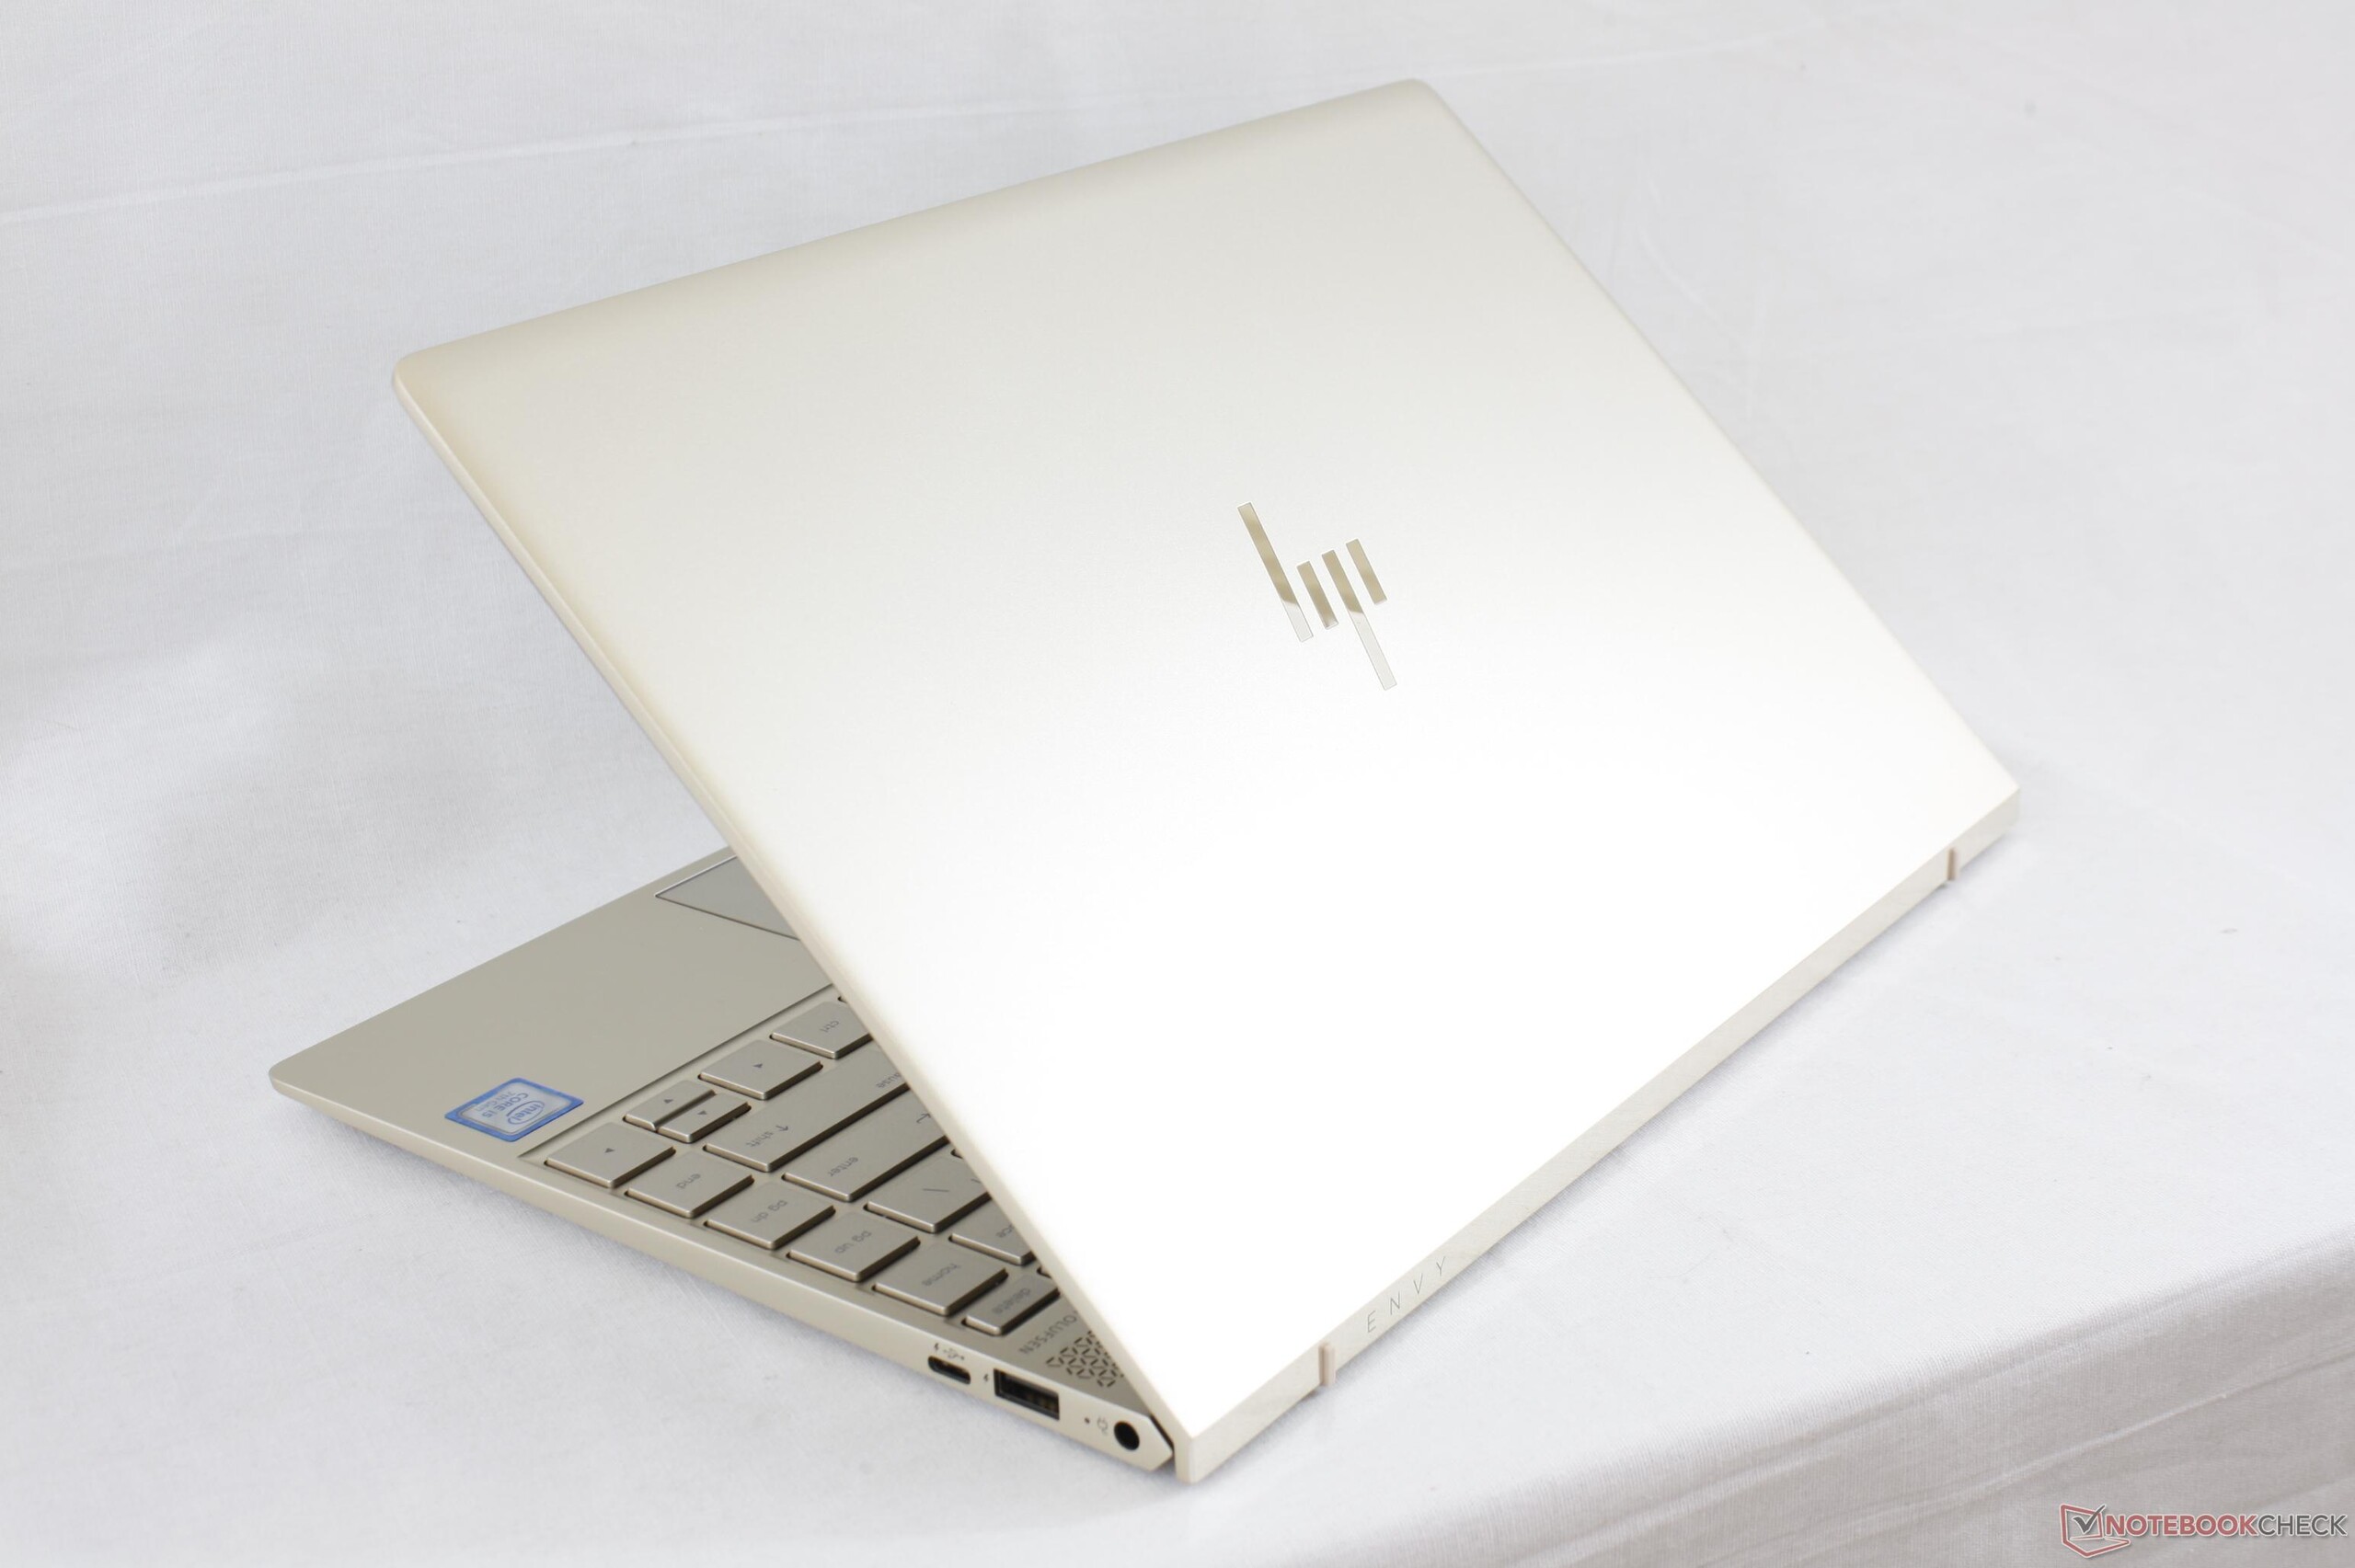
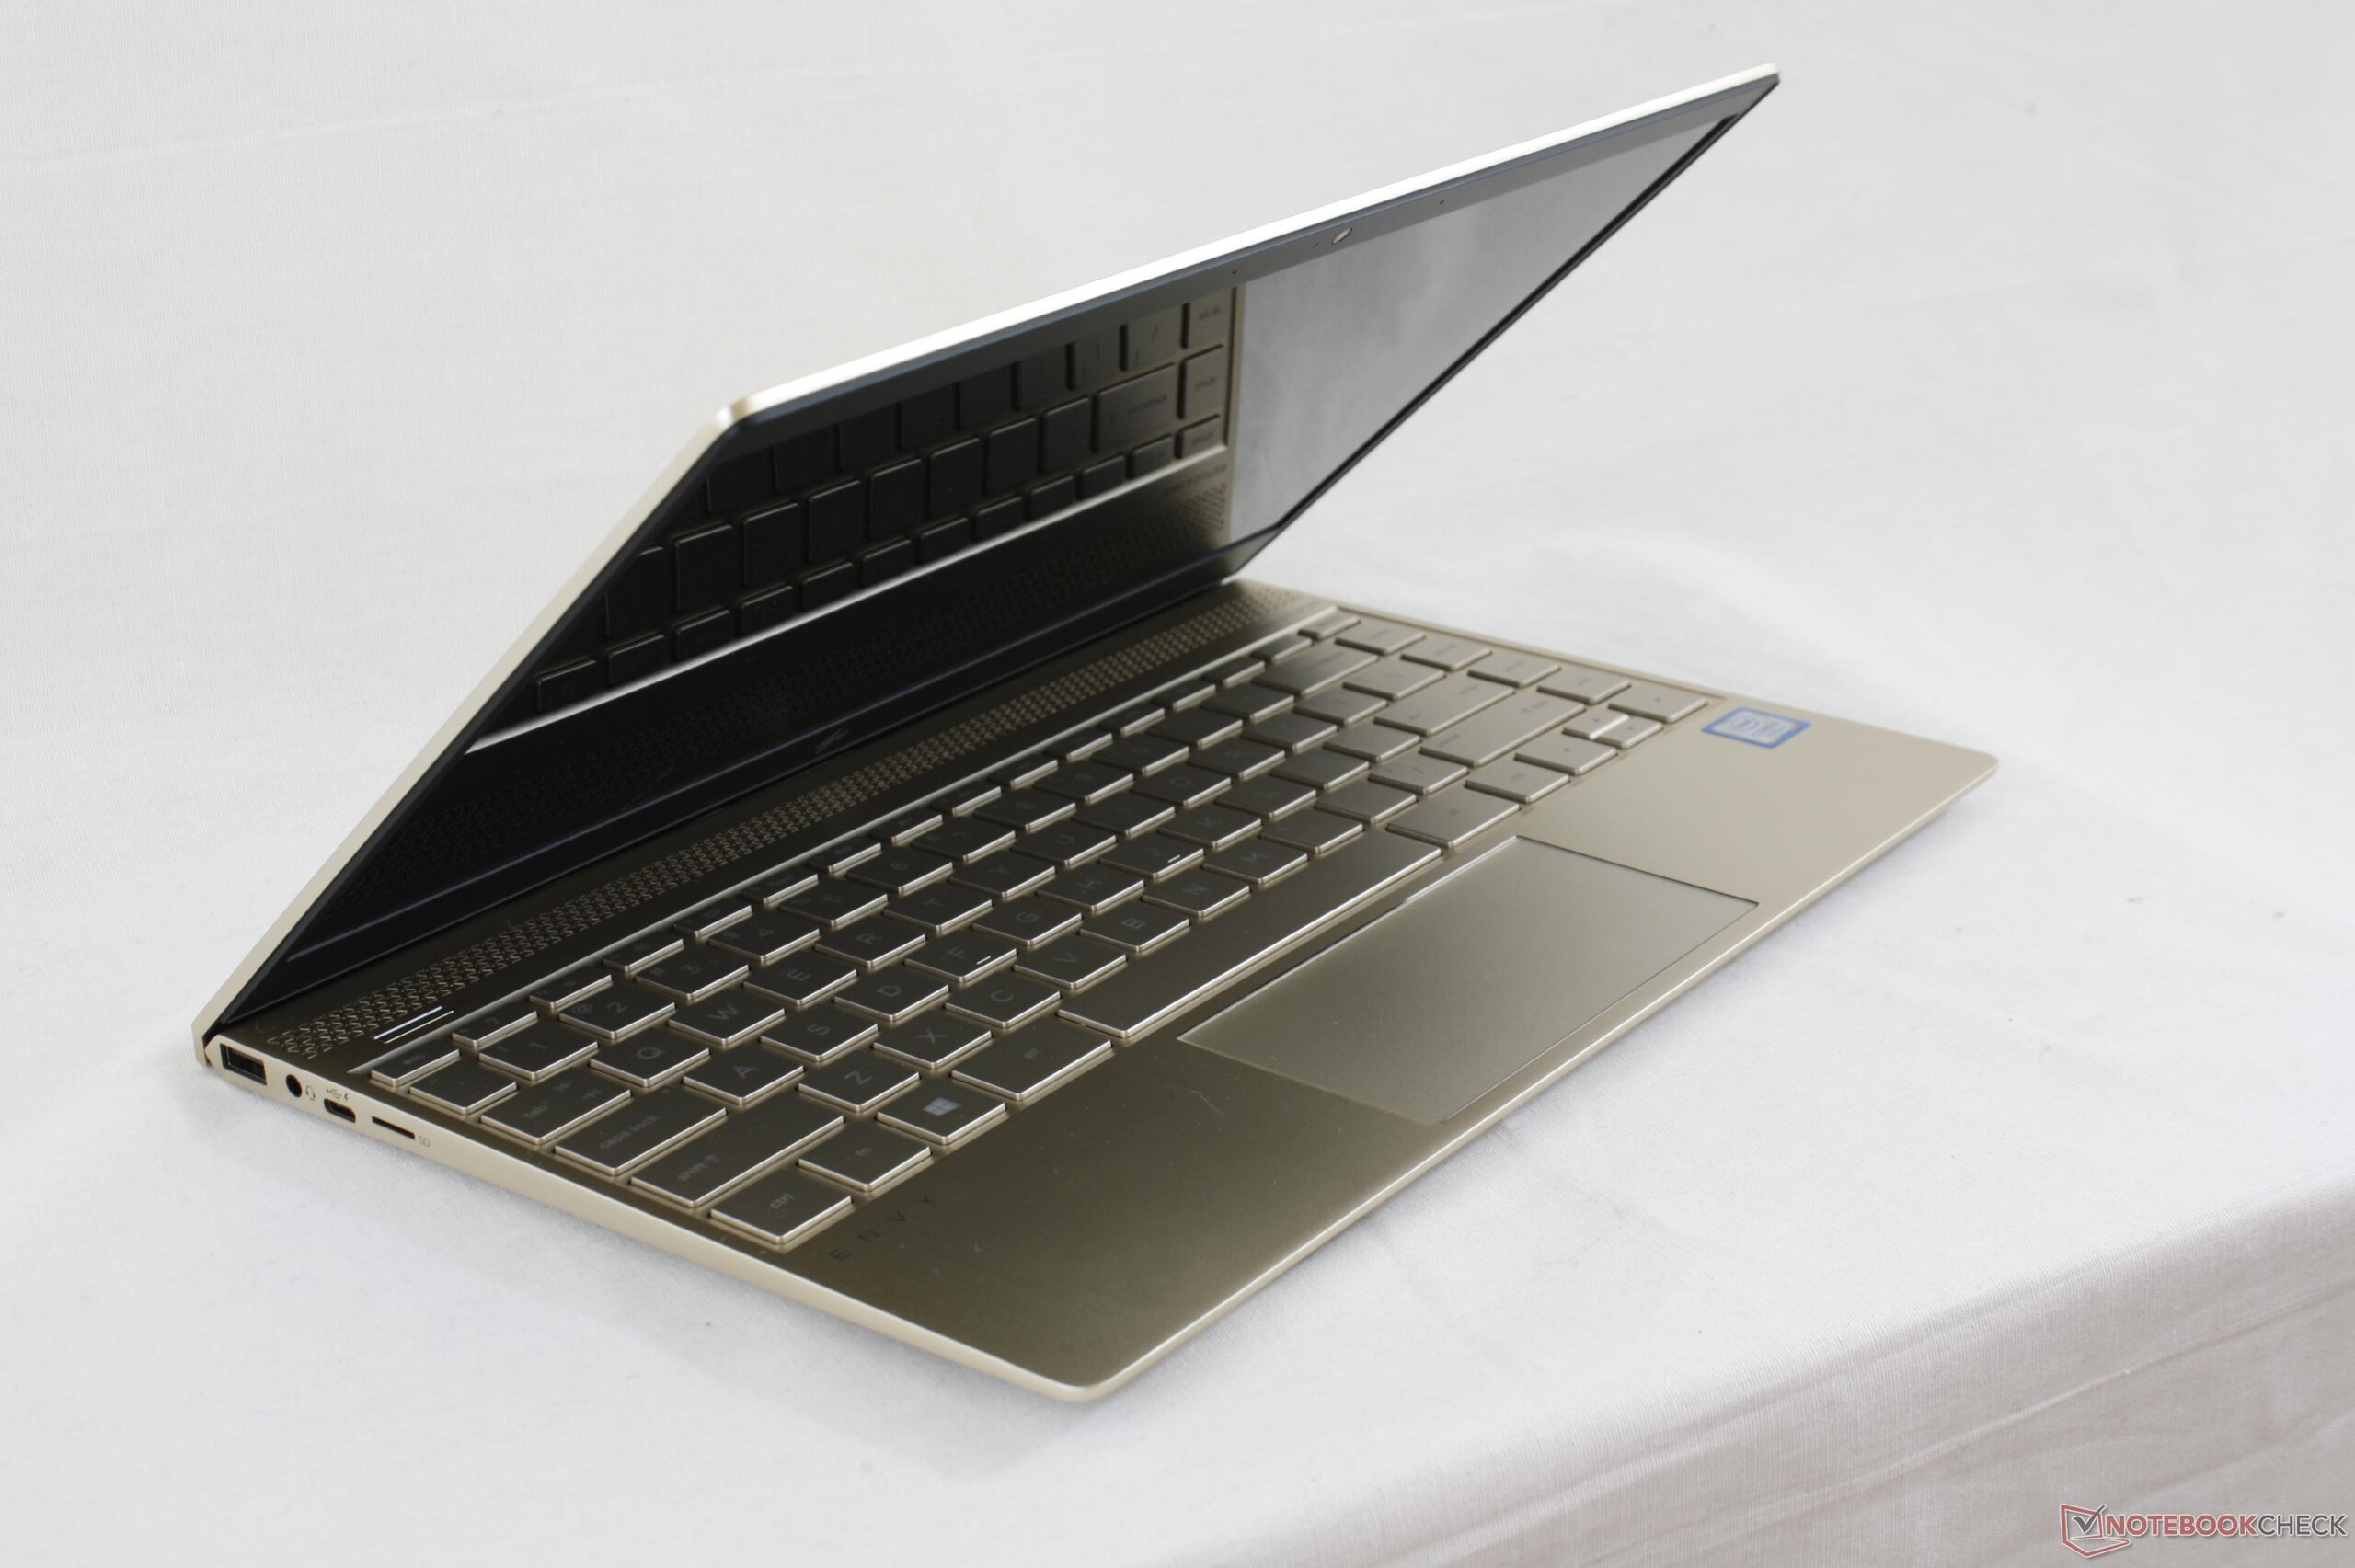
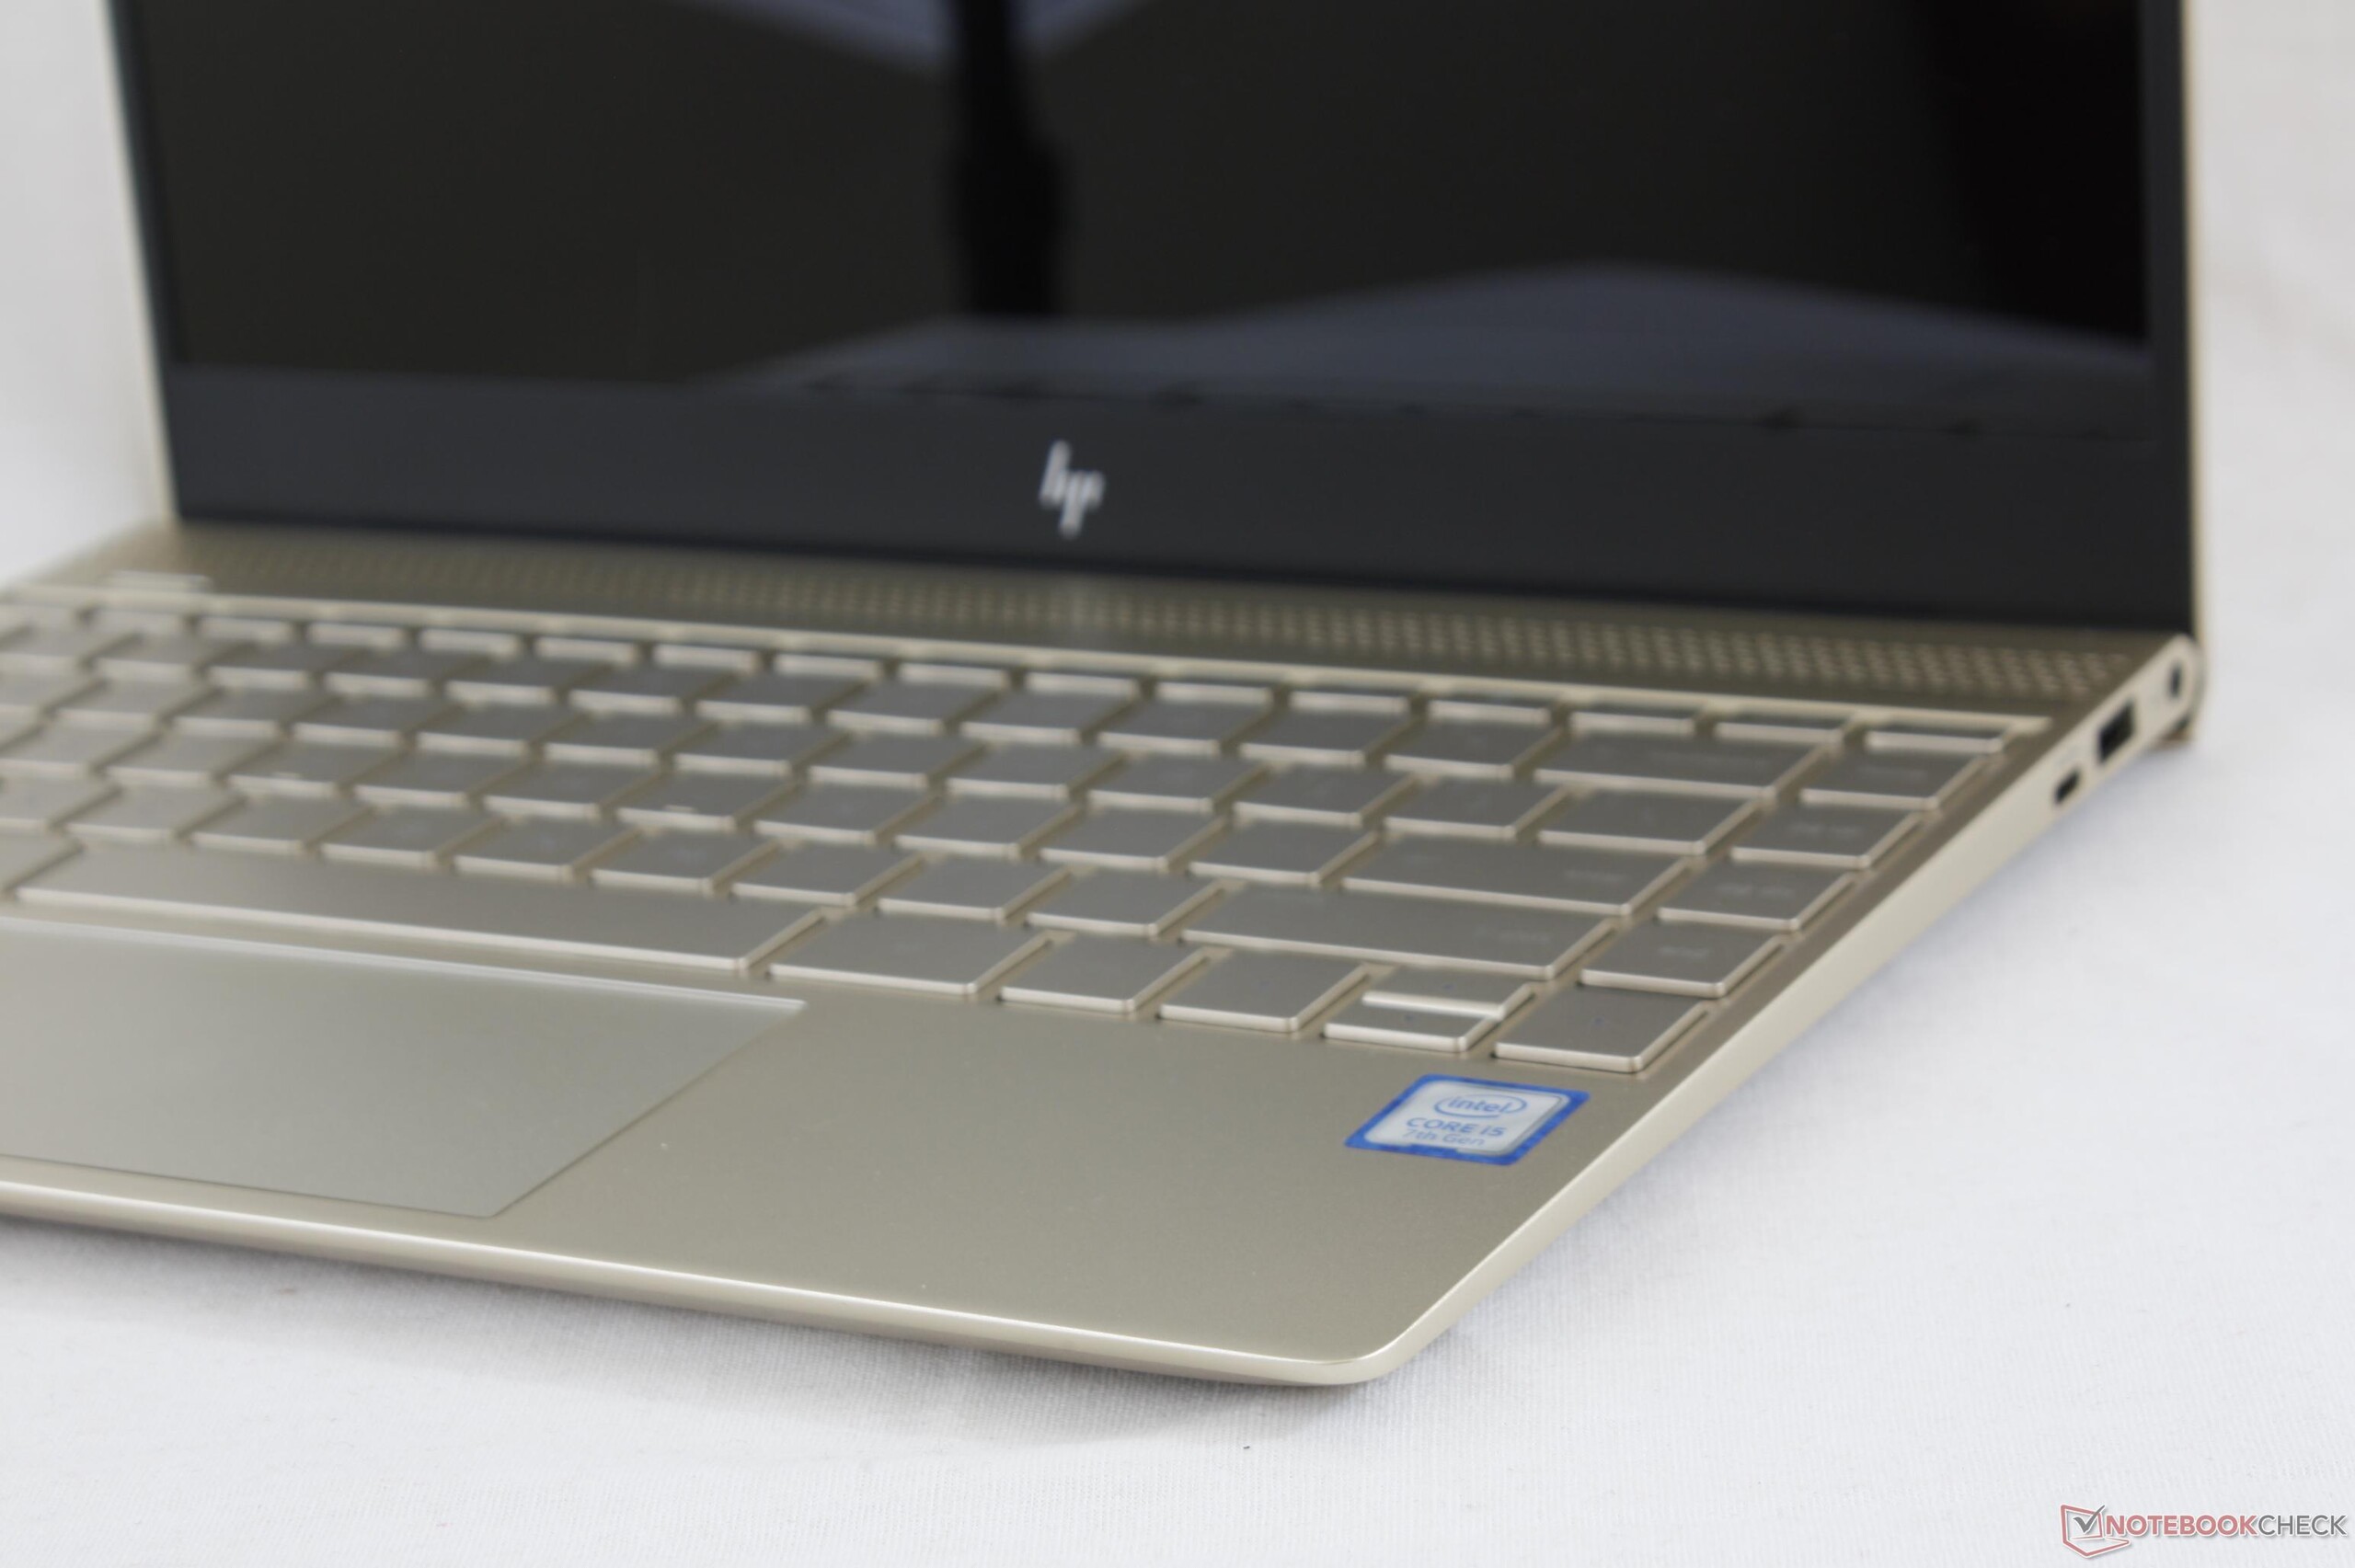
Det finns en sak XPS 13 inte erbjuder: en dedikerad GPU. Det är en klar fördel för HP, eftersom MX150 kommer vara en avgörande faktor för många köpare. Envy gör många saker väldigt bra: byggkvaliteten är utmärkt och chassit är - tack vare sin tunna infattning - väldigt kompakt och tilltalande. Kylsystemet är också väldigt kapabelt och allt är bra när det kommer till ljudnivåer och temperaturer. Skärmen har sin beskärda del av svagheter, men subjektivt, den ser väldigt bra ut, är väldigt skarp och erbjuder bra kontrast.
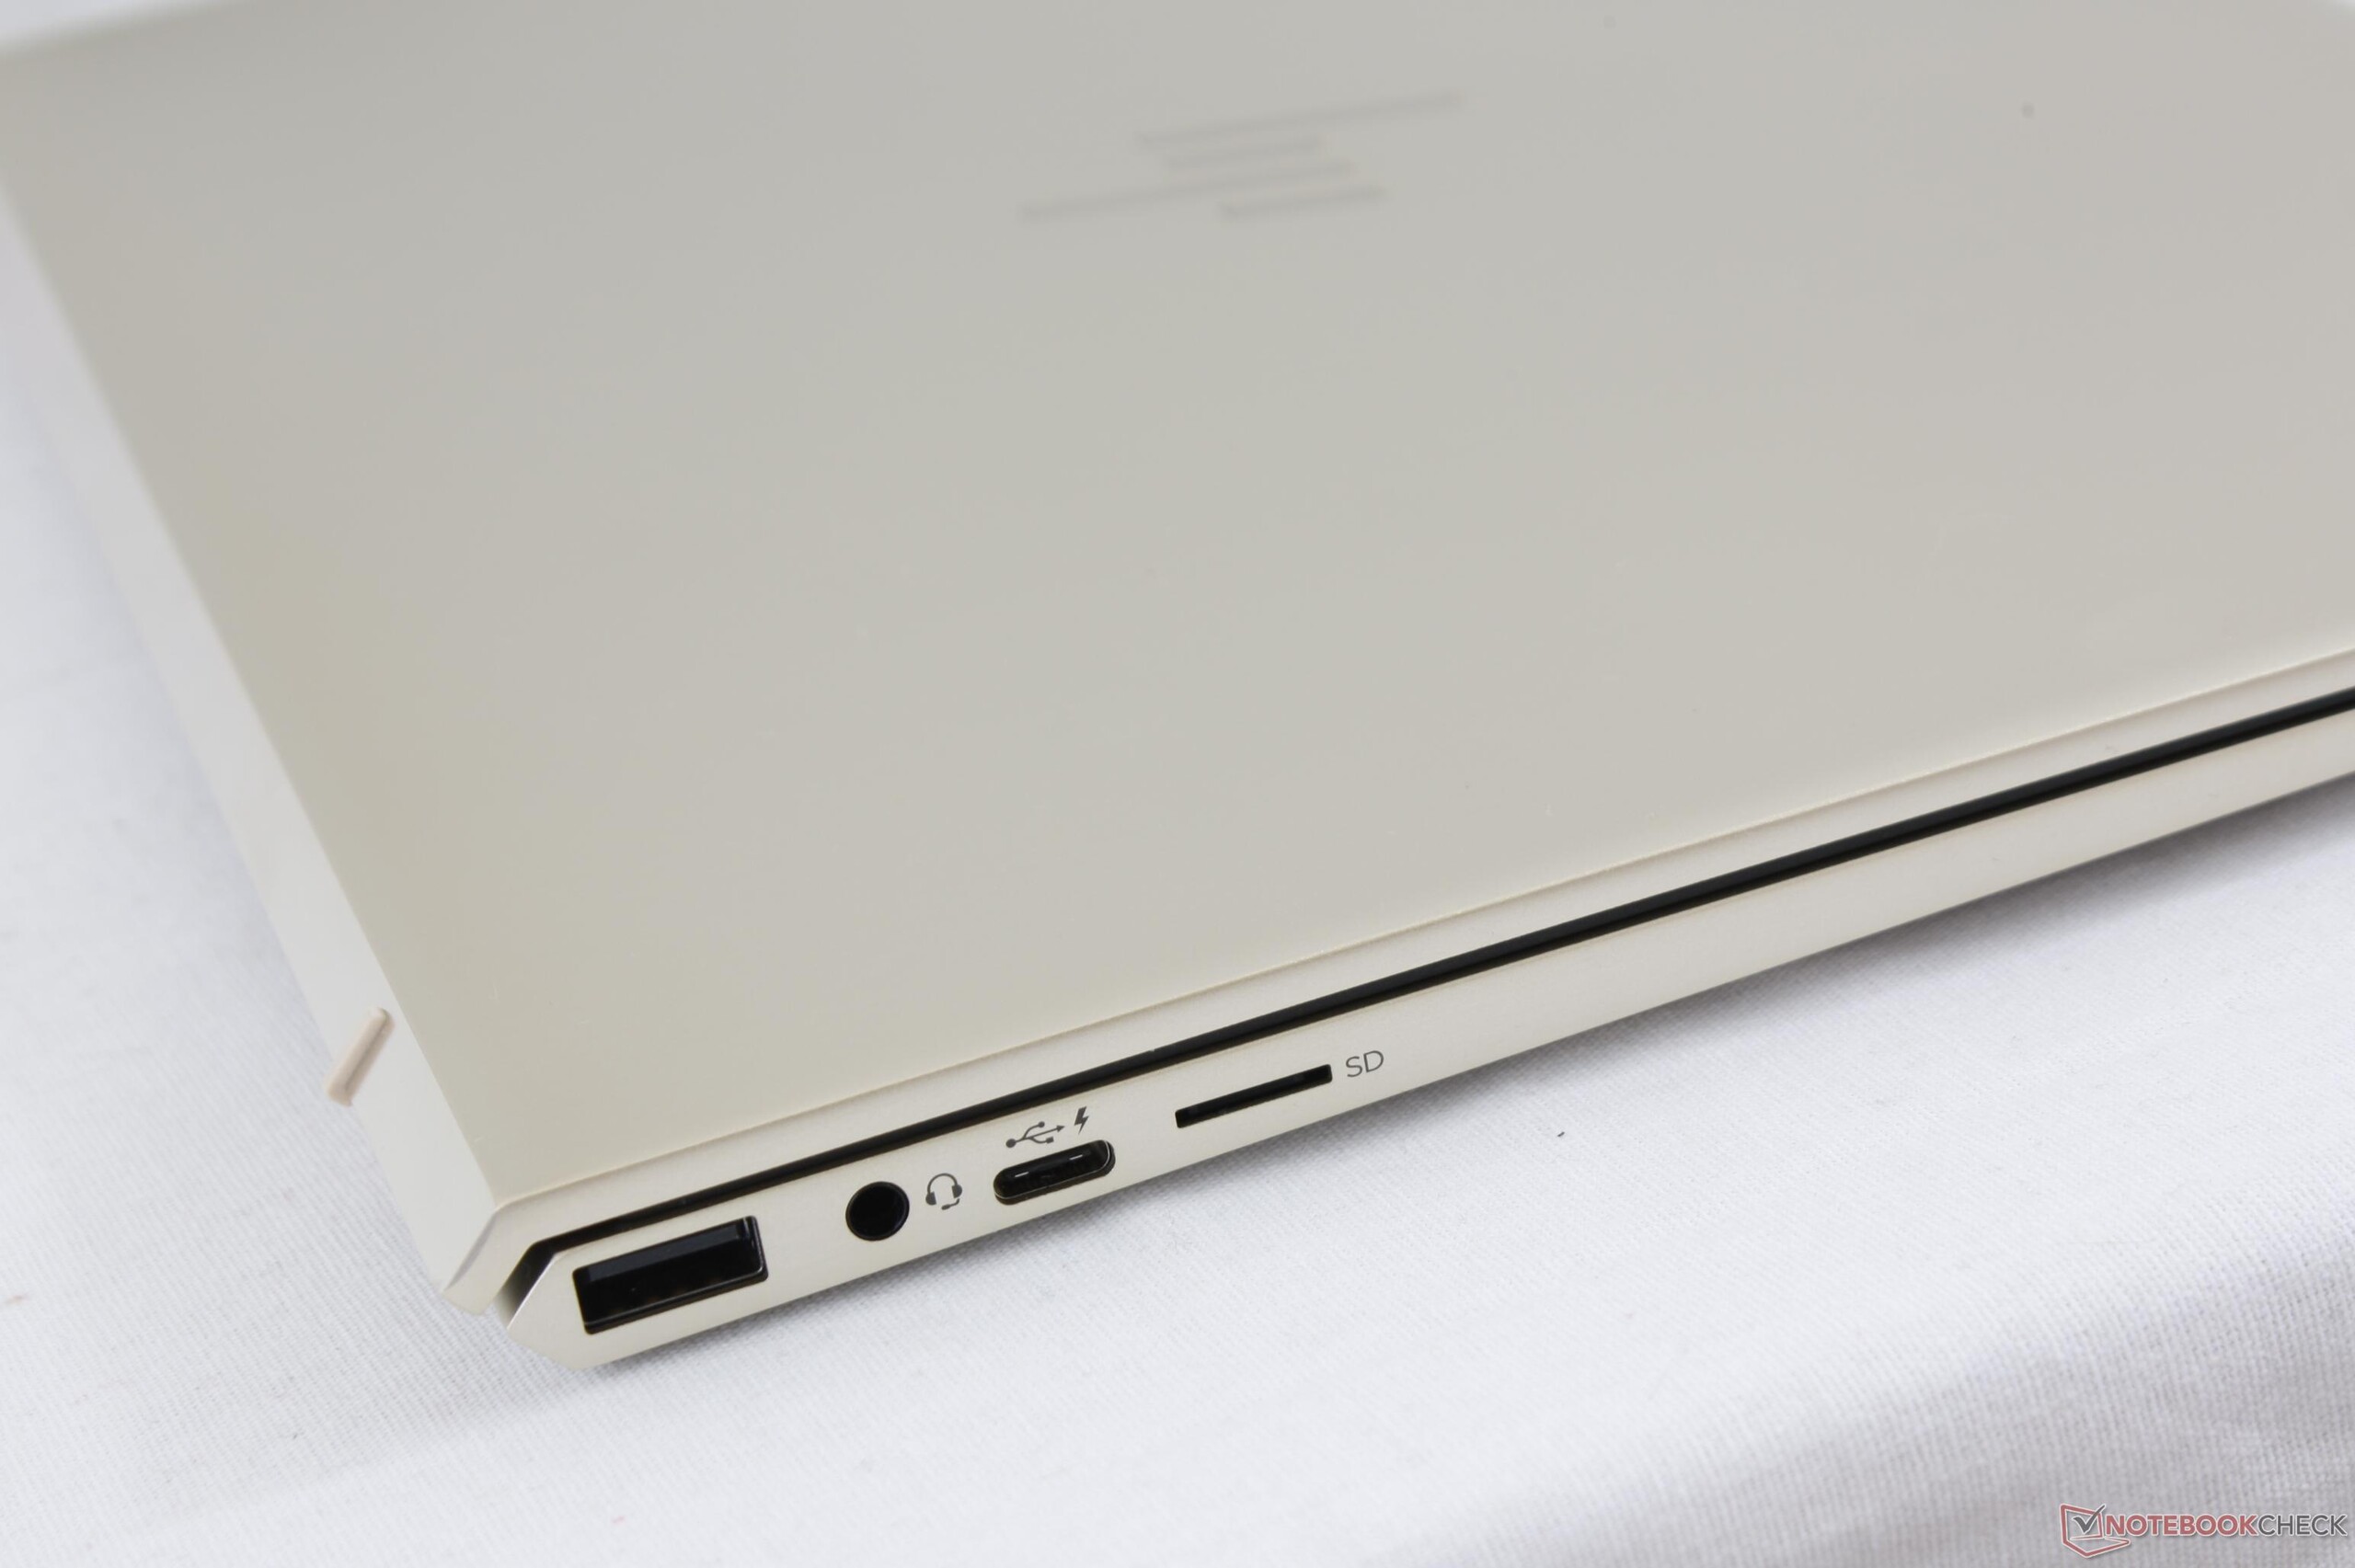
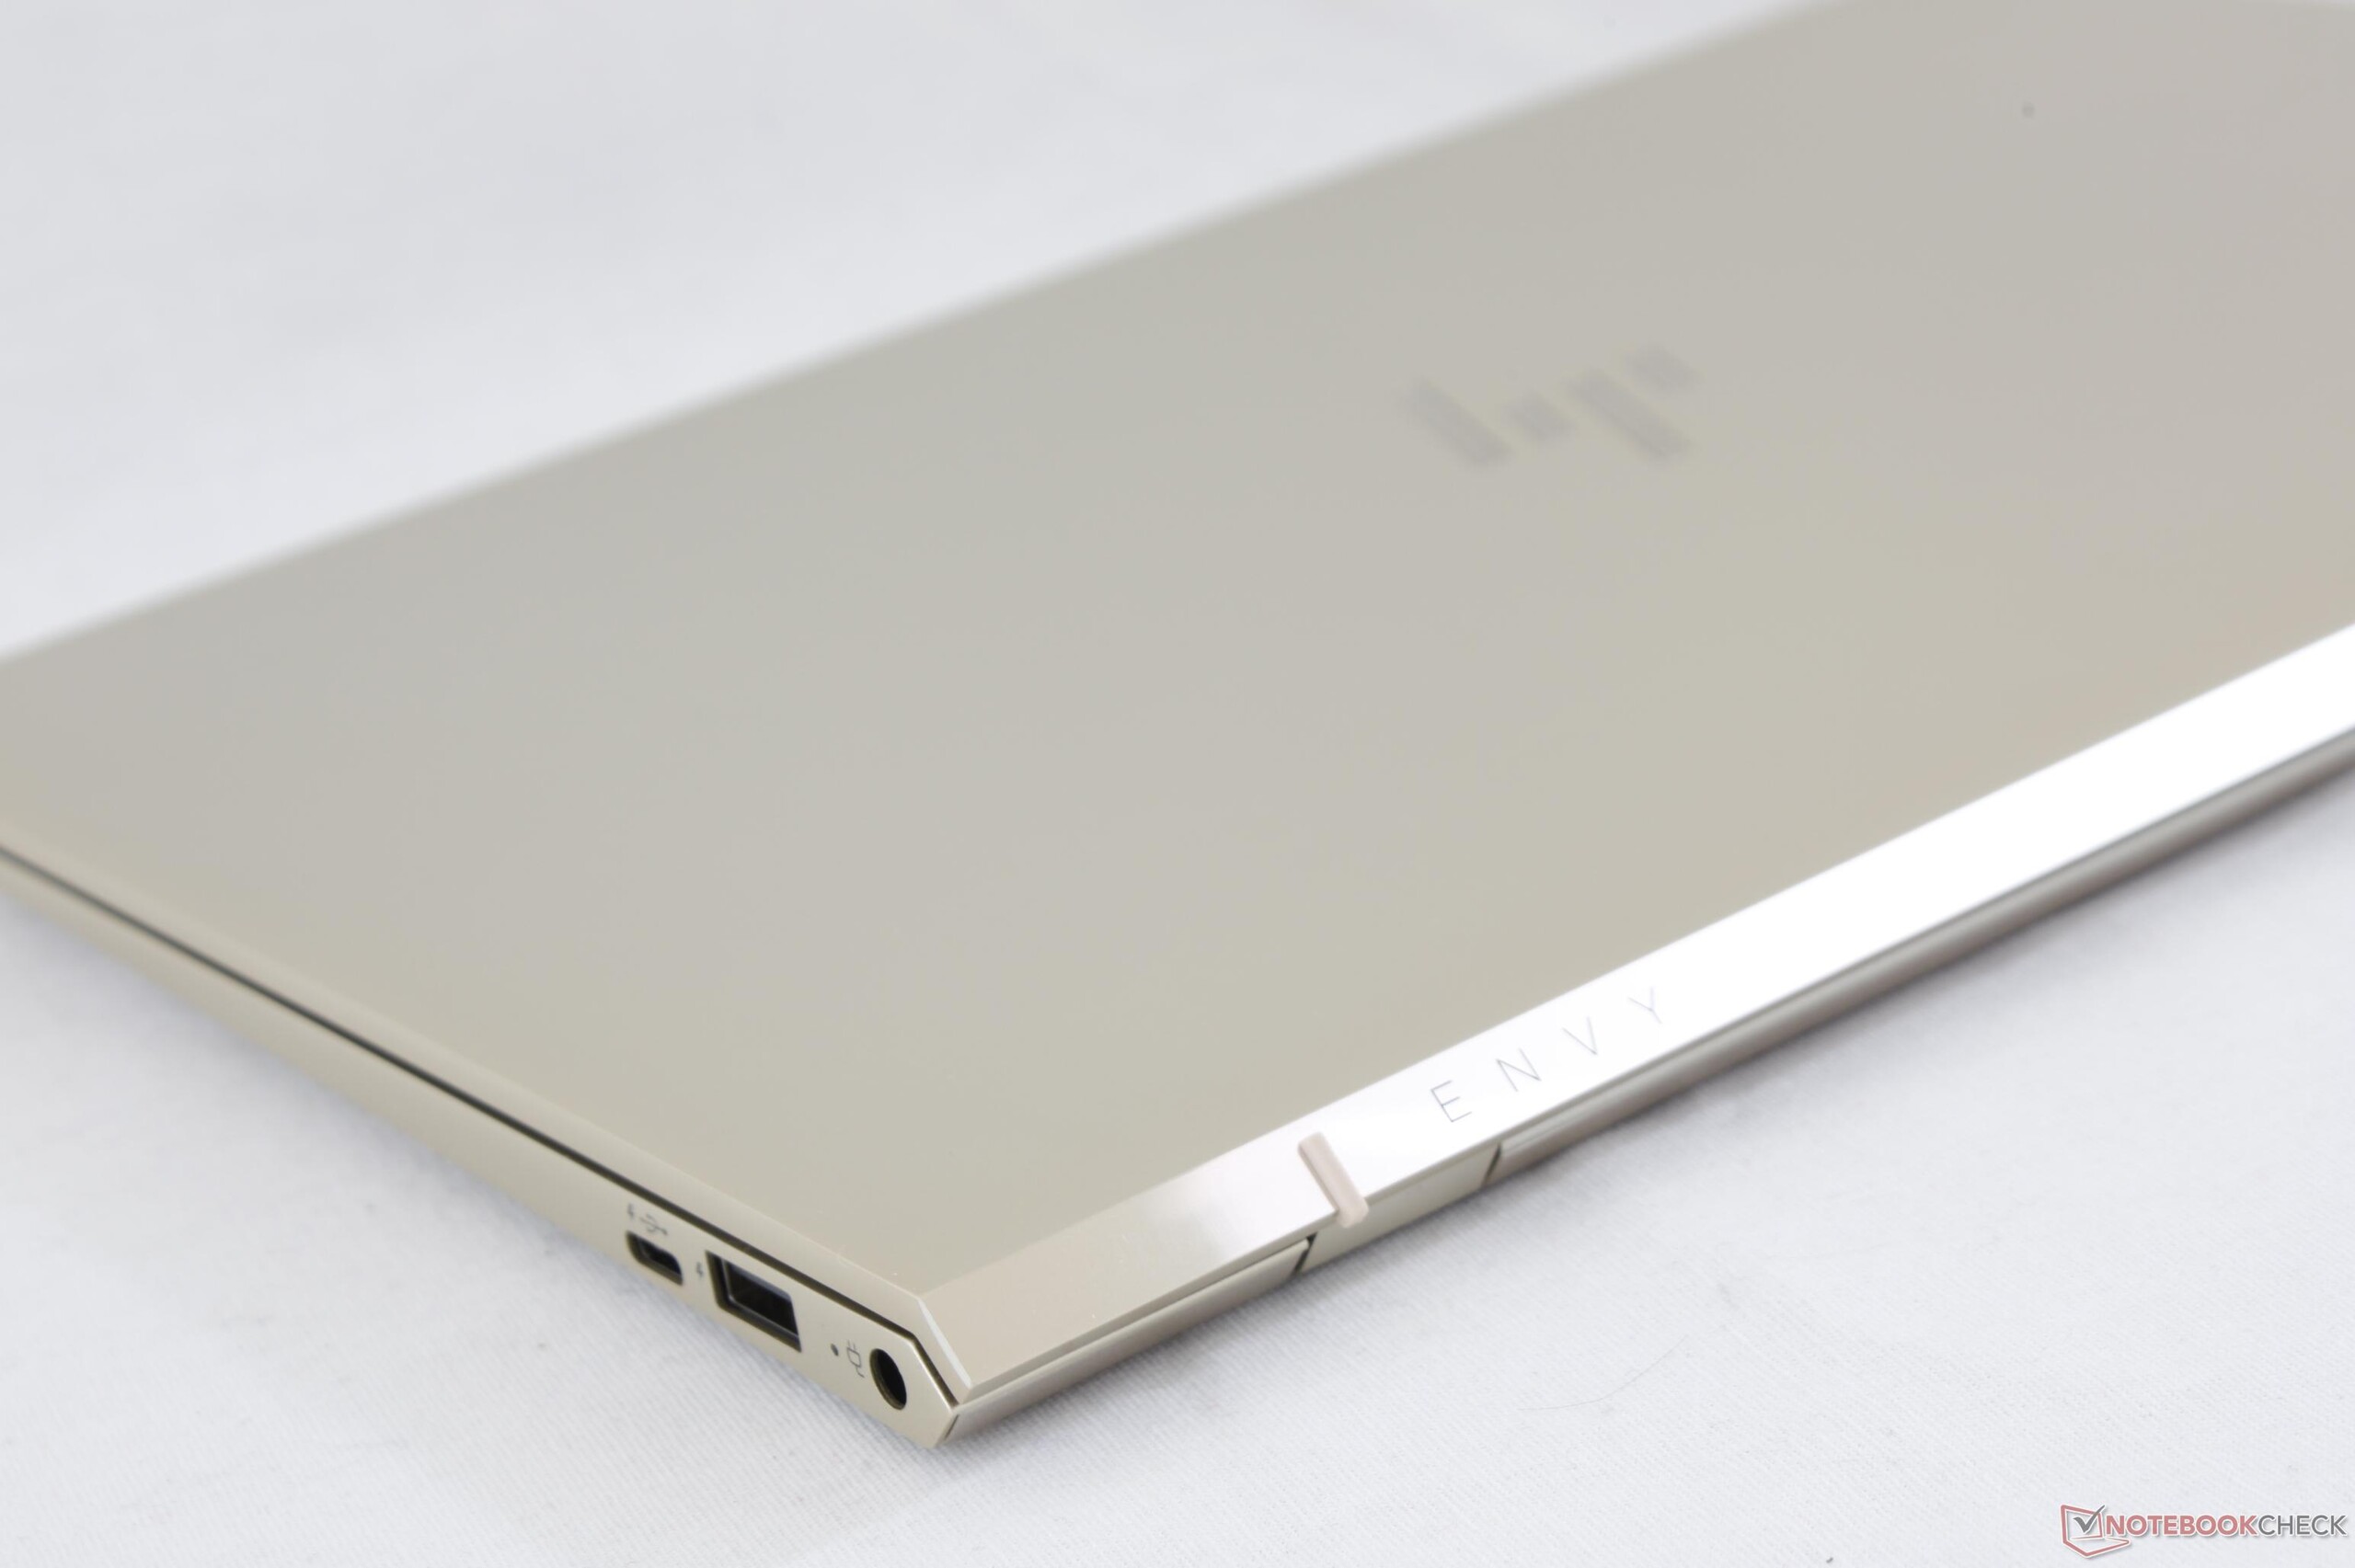
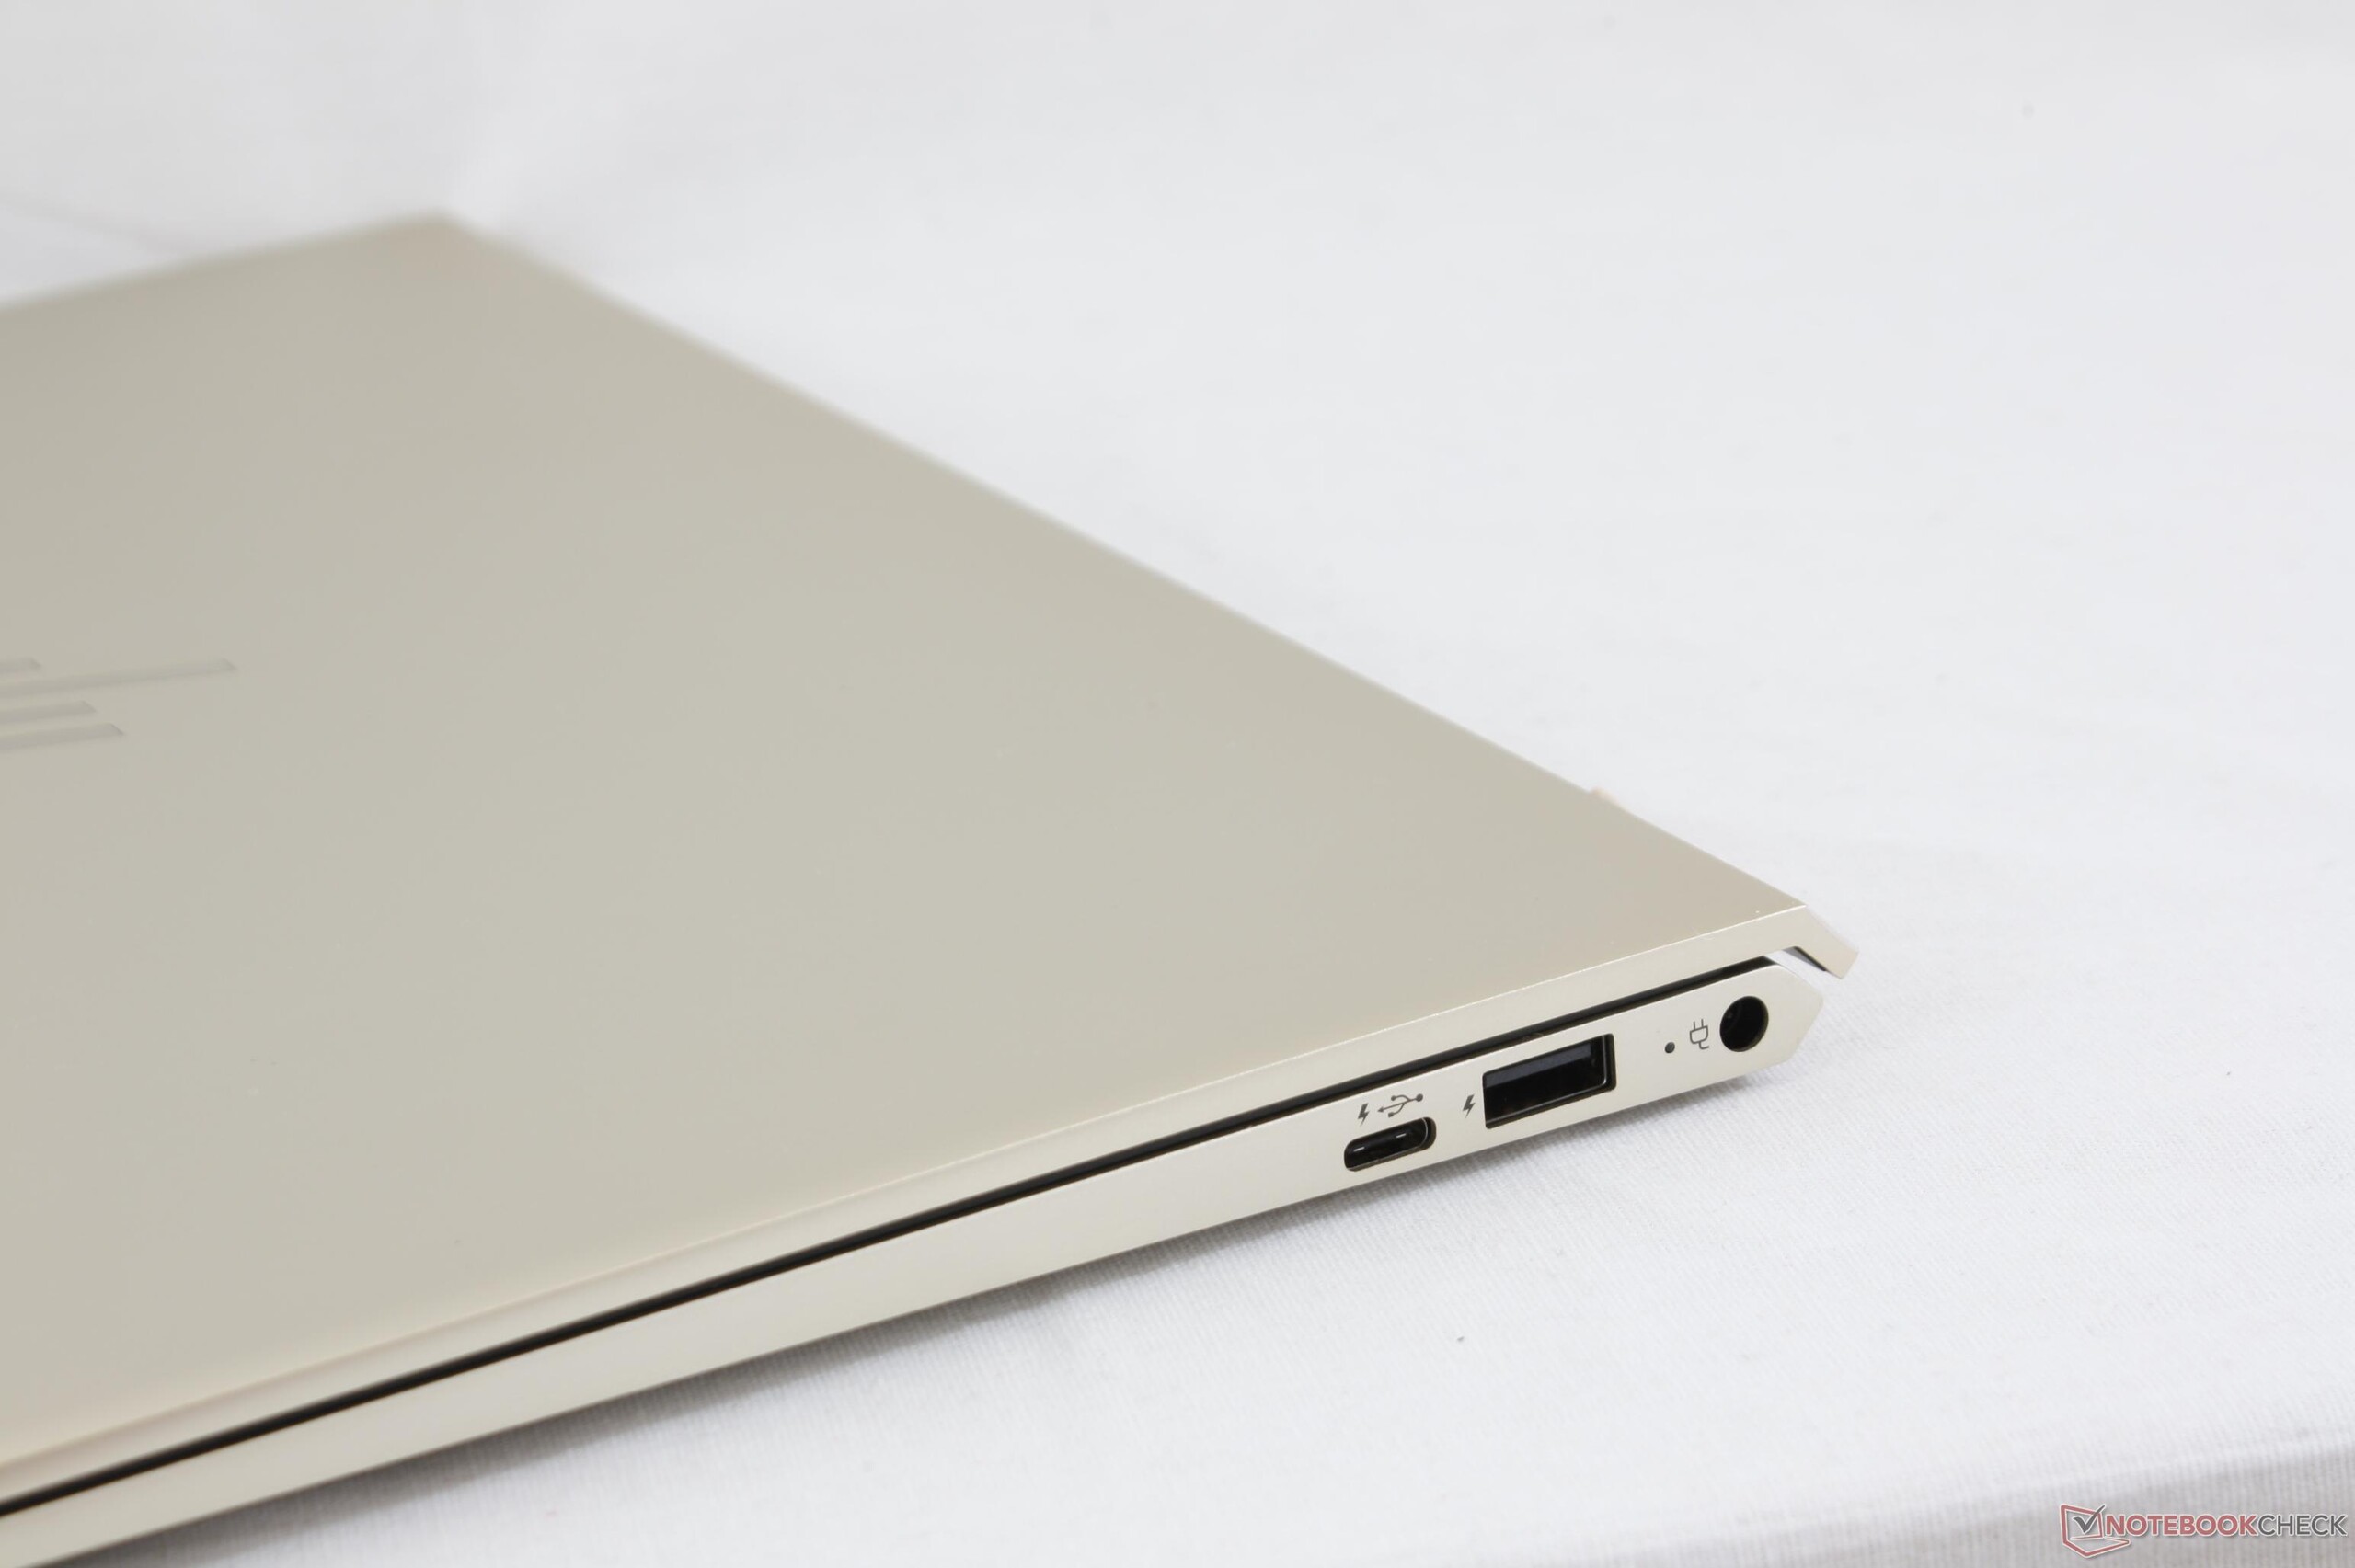
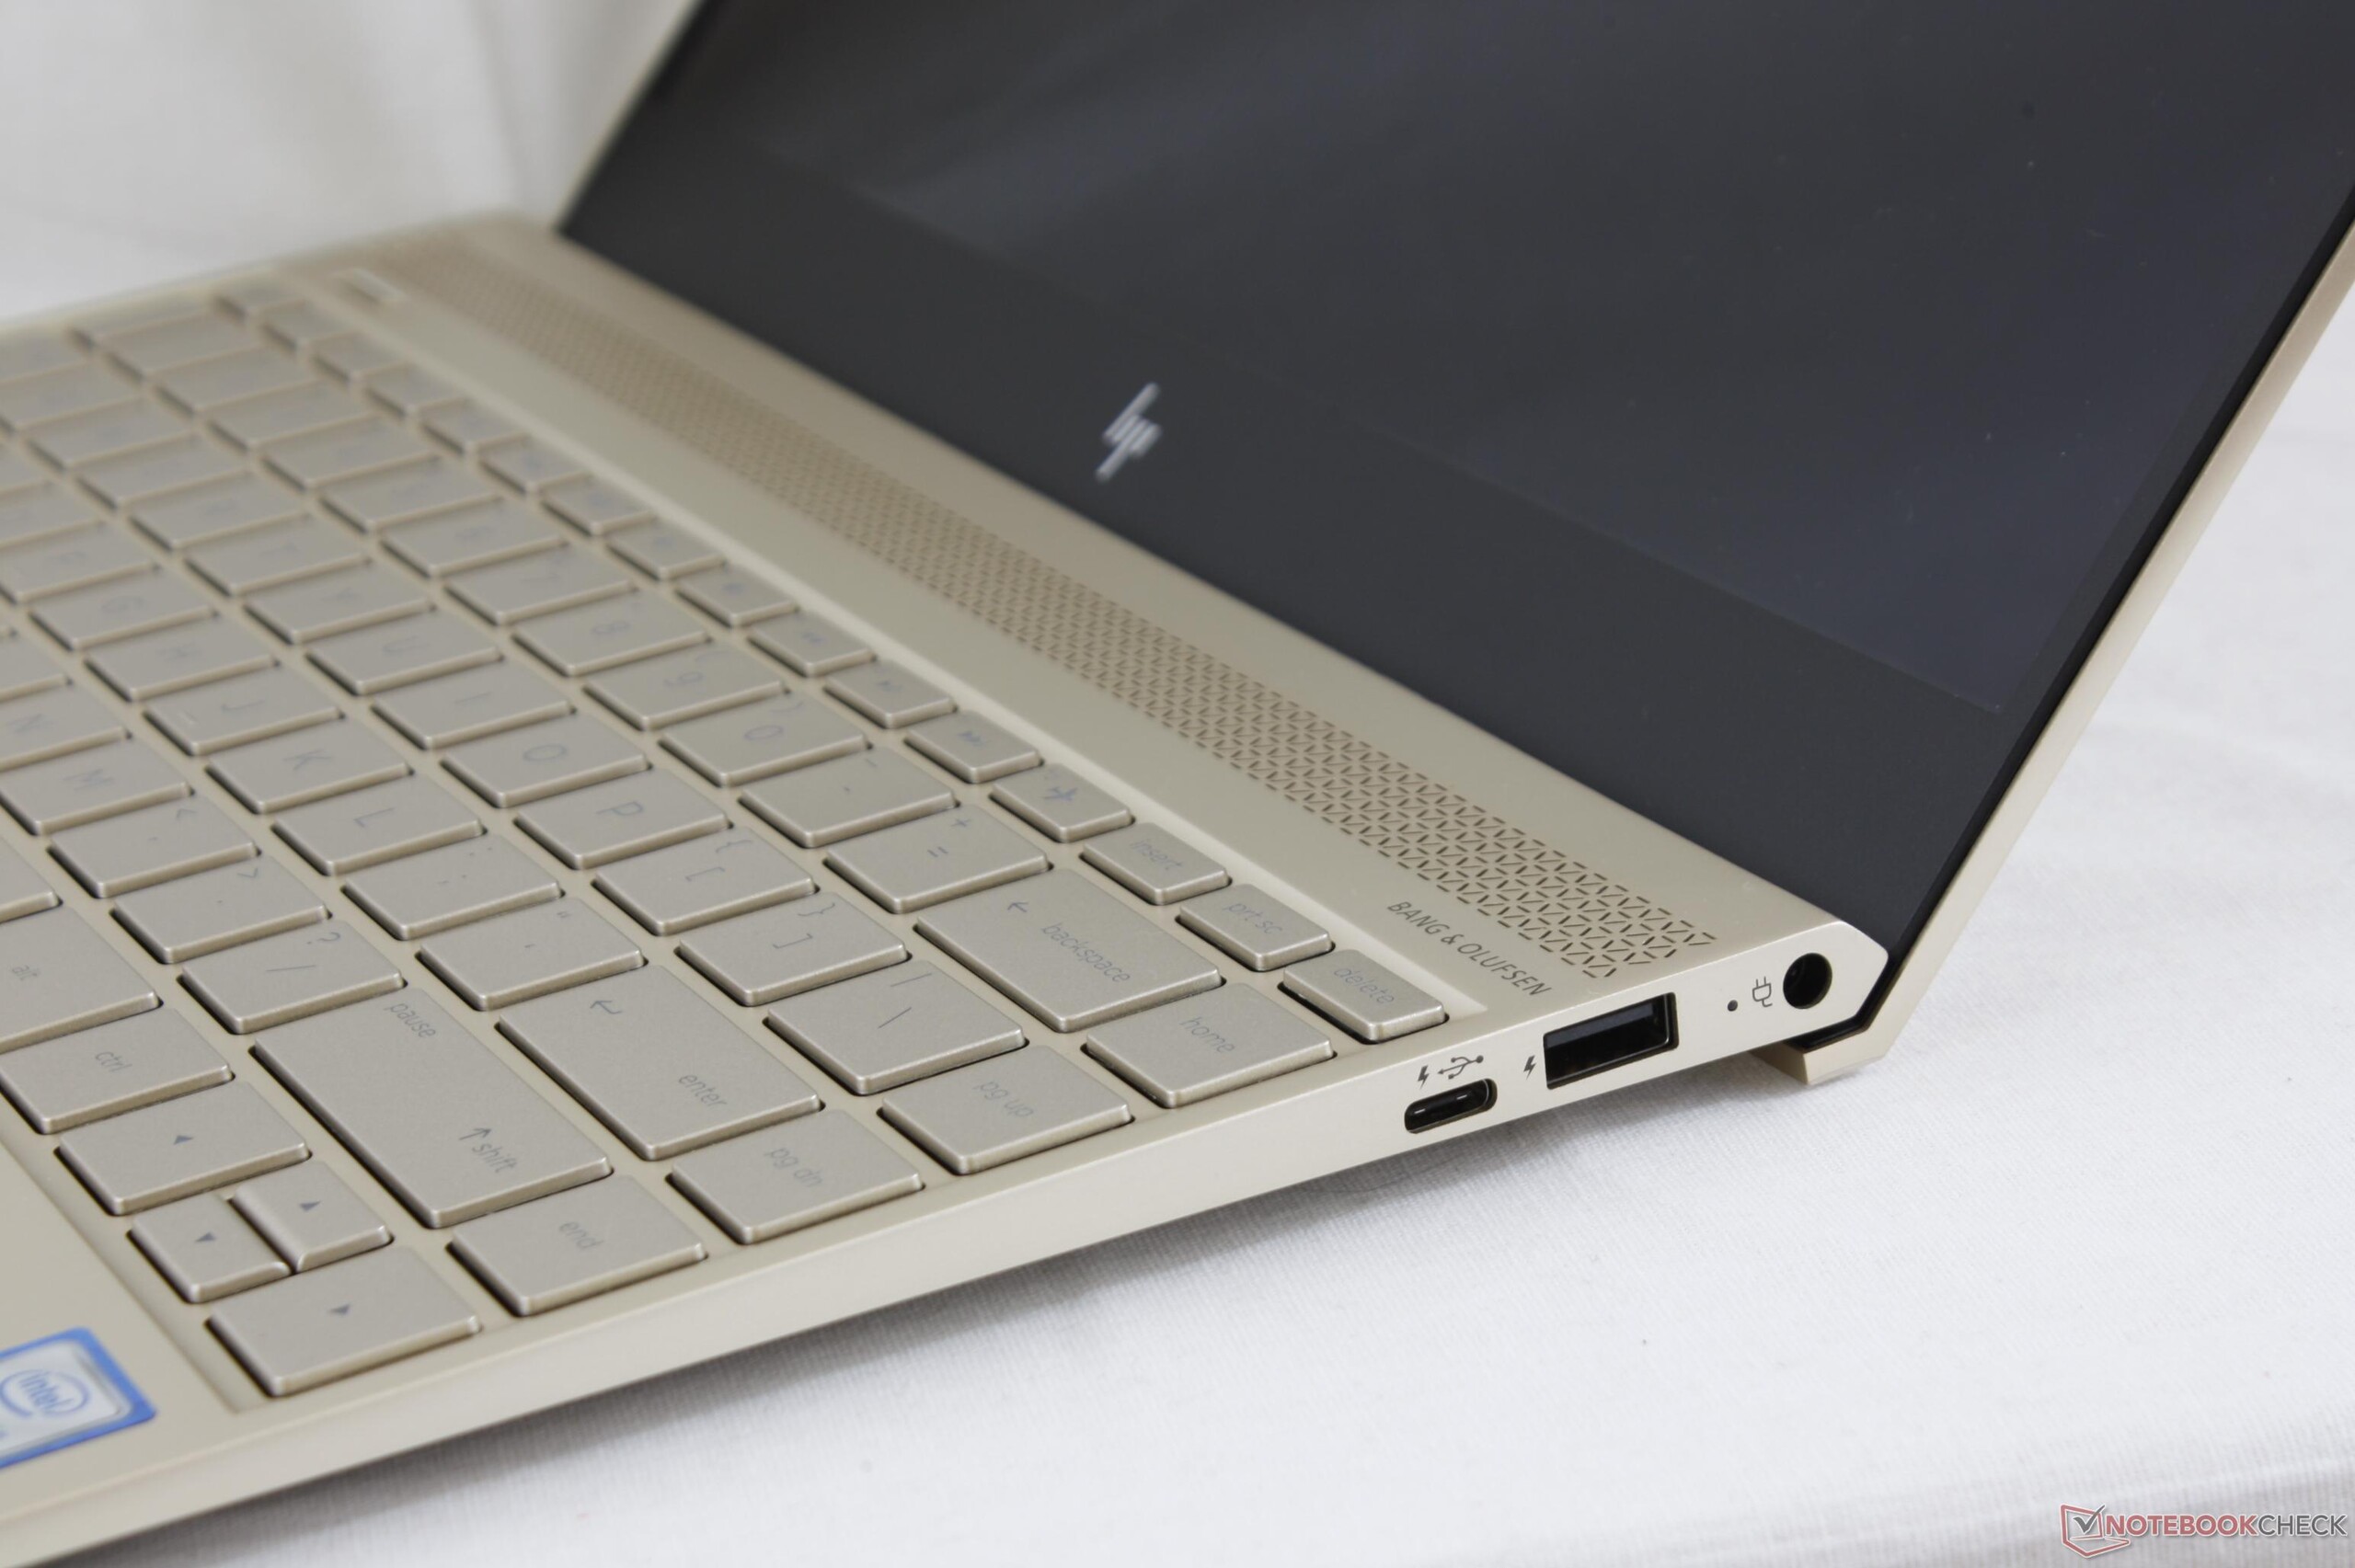
Skärmens ljusstyrka står sig dock inte bra mot konkurrensen. Det faktum att det inte finns något alternativ för en matt skärm gör det hela värre och begränsar lämpligheten för utomhusanvändning en del - ett riktigt problem med tanke på att detta är en subnotebook. Utbudet av portar är också undermåligt: vi hade uppskattat om HDMI, en full-storleks SD-kortläsare och Thunderbolt 3 var inkluderade. Vi var inte särskilt nöjda med styrplattan på Envy 13-ad065nr och vår missnöje fortsätter då glas-pekplattan skramlar tydligt. En annan potentiell nackdel för detta högprestanda-system är det faktum att värmestrypning skedde under stresstestet. Denna strypning kan potentiellt ske även under vanlig användning.
Ibland är originalet helt enkelt bättre: vi kan inte komma på tillräckligt med anledningar att rekommendera HP Envy 13 framför Dell XPS 13.
Trots dessa brister är Envy 13 inte på något sätt en dålig laptop. Bortsett från det aningen lägre priset och en dedikerad GPU hittar vi bara inte några argument för Envy. Dell XPS är exklusivare och bättre när det kommer till fysiska portar, skärmljusstyrka och batteritid. Vår konfiguration är dessutom redan utdaterad - en efterföljare med Core i7-8550U är redan tillgänglig. Av den anledningen kan vi inte rekommendera denna specifika version. Användare som är intresserade av Envy 13 borde leta efter en modell med de senaste hårdvarukomponenterna.
HP Envy 13-ad006ng
- 10/17/2017 v6 (old)
Benjamin Herzig
Price comparison
