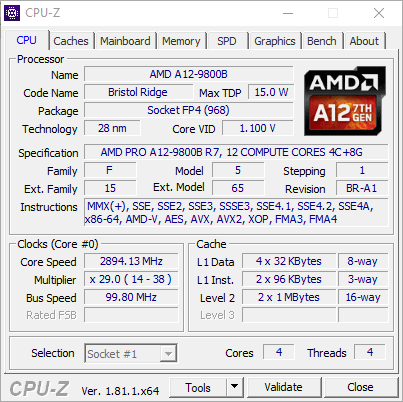
Test: Lenovo ThinkPad A275 (A12-9800B, 256GB) Laptop (Sammanfattning)
| SD Card Reader | |
| average JPG Copy Test (av. of 3 runs) | |
| HP EliteBook 820 G3 (Toshiba Exceria Pro SDXC 64 GB UHS-II) | |
| Lenovo ThinkPad X260-20F6007RGE (Toshiba Exceria Pro SDXC 64 GB UHS-II) | |
| Lenovo ThinkPad X270-20HMS00T00 (Toshiba Exceria Pro SDXC 64 GB UHS-II) | |
| Lenovo ThinkPad A275 (Toshiba Exceria Pro SDXC 64 GB UHS-II) | |
| HP EliteBook 725 G4 (Toshiba Exceria Pro SDXC 64 GB UHS-II) | |
| Lenovo Thinkpad 13-20J1001BUS (Toshiba Exceria Pro SDXC 64 GB UHS-II) | |
| maximum AS SSD Seq Read Test (1GB) | |
| Lenovo ThinkPad X270-20HMS00T00 (Toshiba Exceria Pro SDXC 64 GB UHS-II) | |
| HP EliteBook 820 G3 (Toshiba Exceria Pro SDXC 64 GB UHS-II) | |
| Lenovo ThinkPad X260-20F6007RGE (Toshiba Exceria Pro SDXC 64 GB UHS-II) | |
| Lenovo ThinkPad A275 (Toshiba Exceria Pro SDXC 64 GB UHS-II) | |
| HP EliteBook 725 G4 (Toshiba Exceria Pro SDXC 64 GB UHS-II) | |
| Lenovo Thinkpad 13-20J1001BUS (Toshiba Exceria Pro SDXC 64 GB UHS-II) | |
| Networking | |
| iperf3 transmit AX12 | |
| HP EliteBook 725 G4 | |
| Lenovo ThinkPad A275 | |
| Lenovo Thinkpad 13-20J1001BUS | |
| Lenovo ThinkPad X270-20HMS00T00 | |
| HP Envy x360 15m-bq121dx | |
| Lenovo IdeaPad 320S-13IKB | |
| iperf3 receive AX12 | |
| Lenovo ThinkPad X270-20HMS00T00 | |
| Lenovo Thinkpad 13-20J1001BUS | |
| HP EliteBook 725 G4 | |
| Lenovo ThinkPad A275 | |
| HP Envy x360 15m-bq121dx | |
| Lenovo IdeaPad 320S-13IKB | |
| |||||||||||||||||||||||||
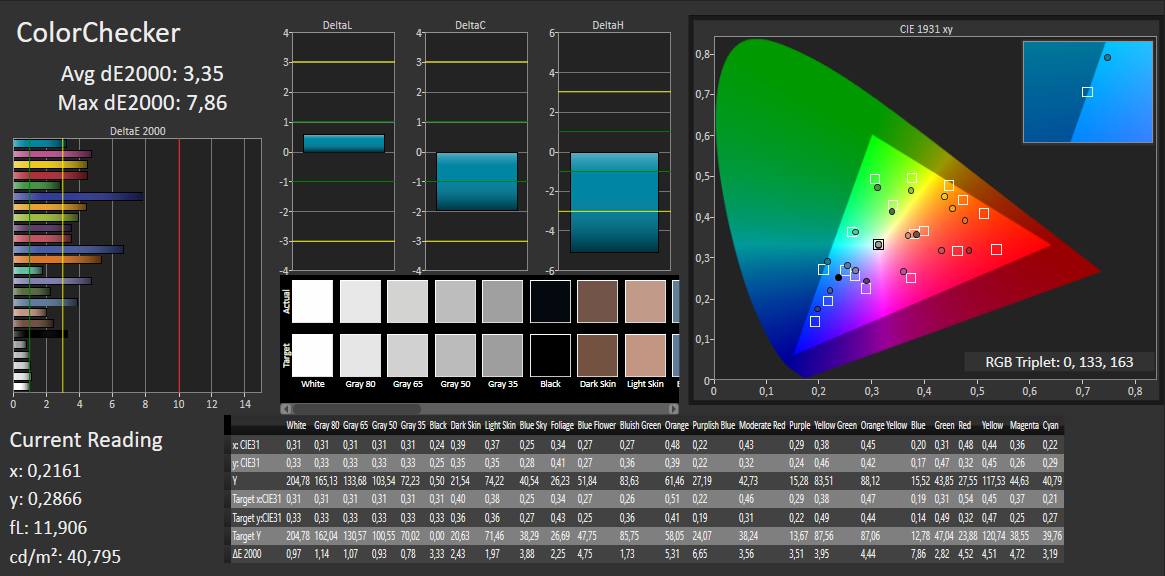
Distribution av ljusstyrkan: 87 %
Mitt på batteriet: 130 cd/m²
Kontrast: 490:1 (Svärta: 0.52 cd/m²)
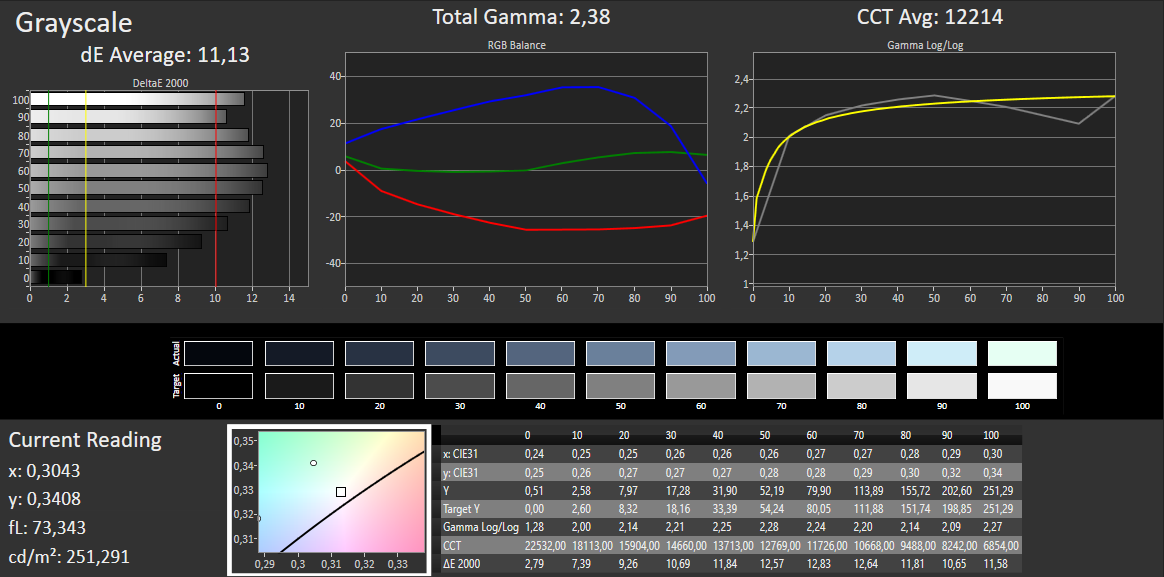
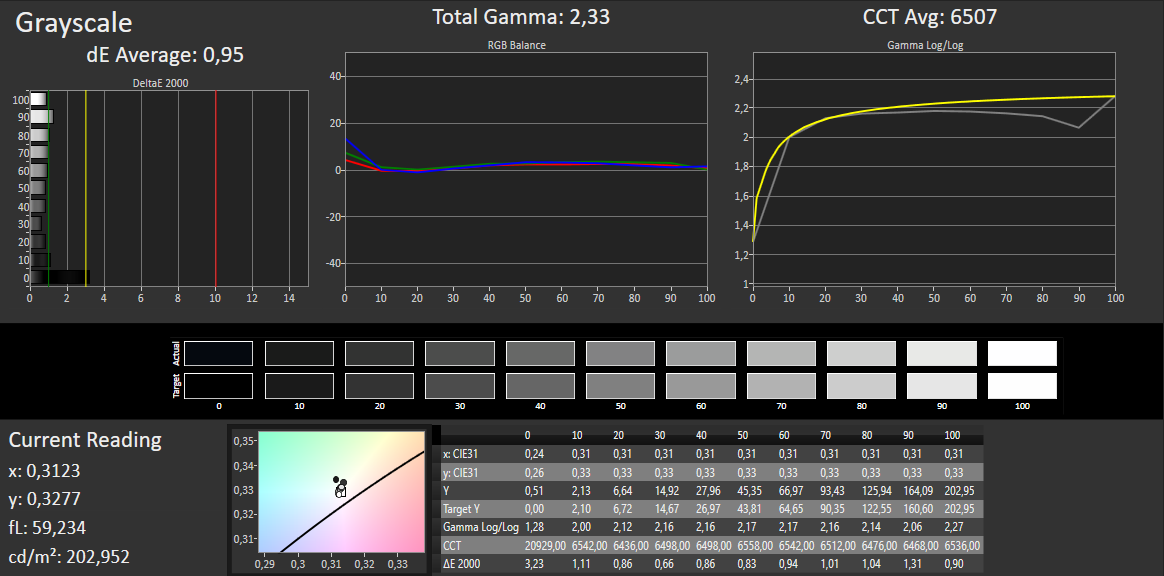
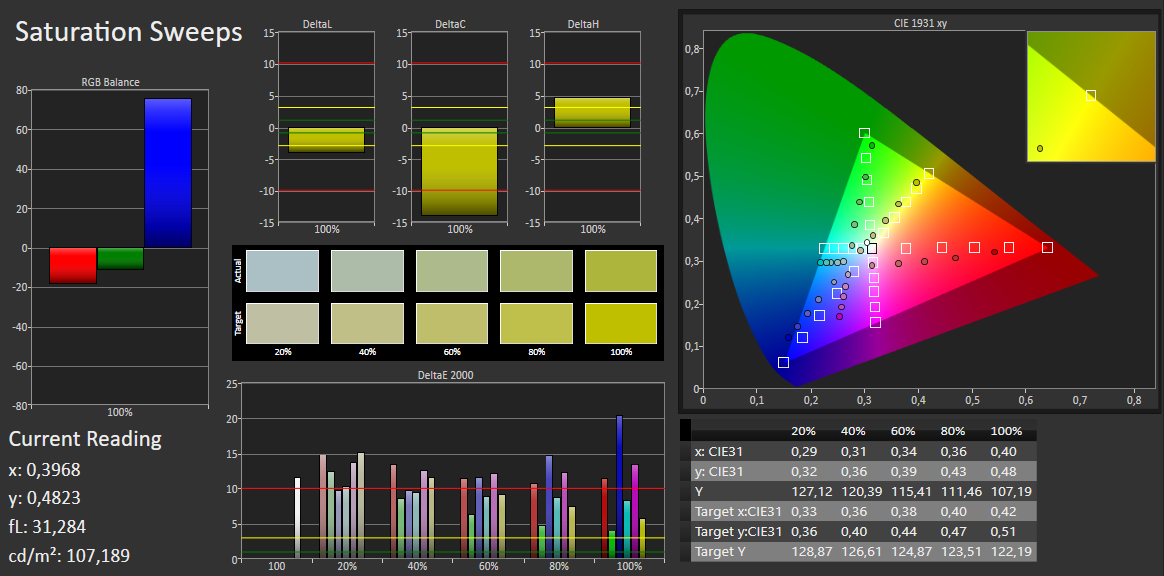
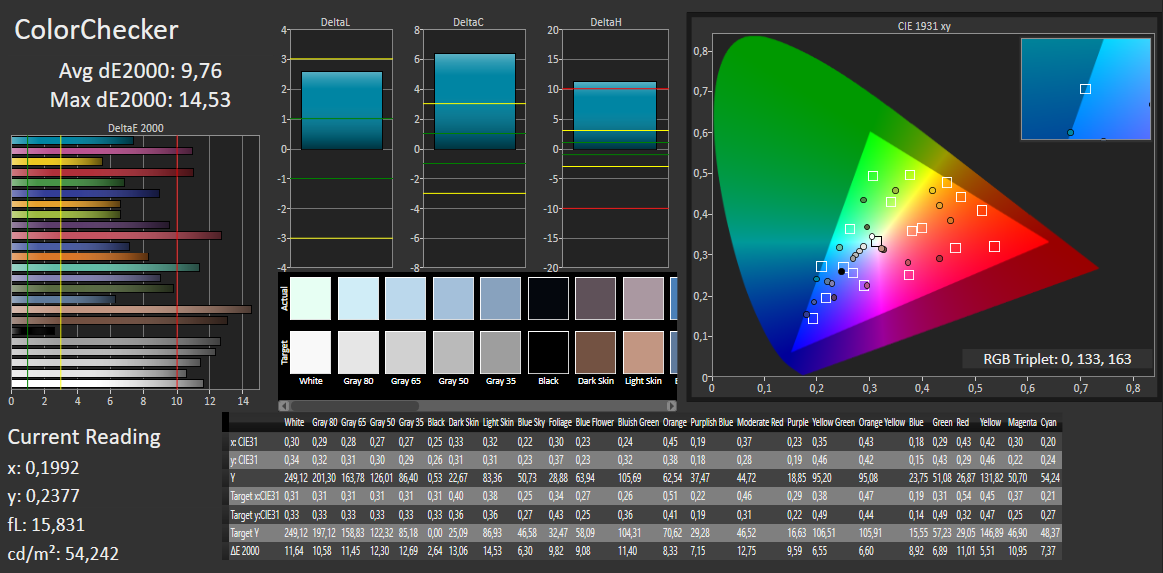
ΔE ColorChecker Calman: 9.76 | ∀{0.5-29.43 Ø4.72}
ΔE Greyscale Calman: 11.13 | ∀{0.09-98 Ø4.97}
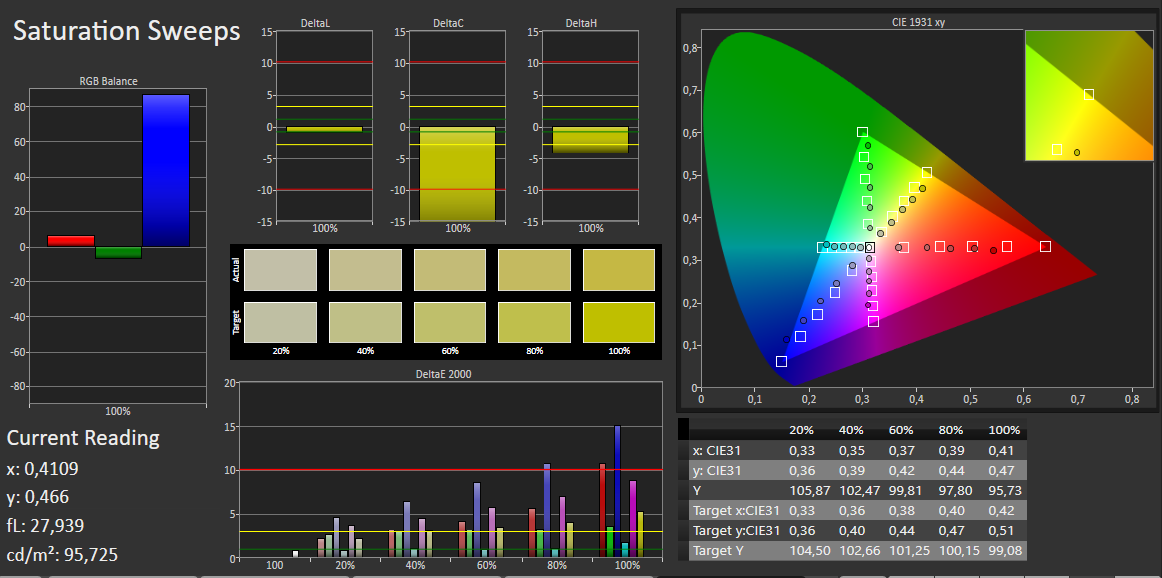
63% sRGB (Argyll 1.6.3 3D)
40% AdobeRGB 1998 (Argyll 1.6.3 3D)
43.48% AdobeRGB 1998 (Argyll 3D)
62.8% sRGB (Argyll 3D)
42.05% Display P3 (Argyll 3D)
Gamma: 2.38
CCT: 12214 K
| Lenovo ThinkPad A275 Len40E0, , 1366x768, 12.5" | HP EliteBook 820 G3 LG Philips LGD0498, , 1366x768, 12.5" | Lenovo ThinkPad X260-20F6007RGE Lenovo N125HCE-GN1, , 1920x1080, 12.5" | Lenovo Thinkpad 13-20J1001BUS Lenovo LEN4094, , 1920x1080, 13.3" | HP EliteBook 725 G4 AU Optronics, , 1920x1080, 12.5" | Lenovo ThinkPad X270-20HMS00T00 Innolux N125HCE-GN1, , 1920x1080, 12.5" | |
|---|---|---|---|---|---|---|
| Display | -7% | 6% | -4% | 16% | 6% | |
| Display P3 Coverage (%) | 42.05 | 38.9 -7% | 44.71 6% | 40.57 -4% | 49.16 17% | 44.6 6% 44.6 6% |
| sRGB Coverage (%) | 62.8 | 58.5 -7% | 66.1 5% | 60.7 -3% | 72.3 15% | 65.9 5% 65.9 5% |
| AdobeRGB 1998 Coverage (%) | 43.48 | 40.2 -8% | 46.23 6% | 41.92 -4% | 50.8 17% | 46.11 6% 46.11 6% |
| Response Times | -34% | 1% | -15% | -10% | -16% | |
| Response Time Grey 50% / Grey 80% * (ms) | 41 ? | 58 ? -41% | 32.8 ? 20% | 32.8 ? 20% | 47 ? -15% | 40.8 ? -0% |
| Response Time Black / White * (ms) | 23 ? | 29.2 ? -27% | 27.2 ? -18% | 34.4 ? -50% | 24 ? -4% | 30.4 ? -32% |
| PWM Frequency (Hz) | 800 ? | 26040 ? | ||||
| Screen | -4% | 32% | 18% | 61% | 30% | |
| Brightness middle (cd/m²) | 255 | 244 -4% | 337 32% | 266.4 4% | 329 29% | 283 11% |
| Brightness (cd/m²) | 244 | 240 -2% | 322 32% | 250 2% | 310 27% | 281 15% |
| Brightness Distribution (%) | 87 | 84 -3% | 91 5% | 88 1% | 88 1% | 94 8% |
| Black Level * (cd/m²) | 0.52 | 0.6 -15% | 0.32 38% | 0.31 40% | 0.19 63% | 0.25 52% |
| Contrast (:1) | 490 | 407 -17% | 1053 115% | 859 75% | 1732 253% | 1132 131% |
| Colorchecker dE 2000 * | 9.76 | 9 8% | 5.71 41% | 5.3 46% | 2.69 72% | 6.1 37% |
| Colorchecker dE 2000 max. * | 14.53 | 15.73 -8% | 15.39 -6% | 21 -45% | 4.47 69% | 15.4 -6% |
| Greyscale dE 2000 * | 11.13 | 9.48 15% | 5.15 54% | 3.3 70% | 4.23 62% | 6 46% |
| Gamma | 2.38 92% | 2.44 90% | 2.38 92% | 2.36 93% | 2.21 100% | 2.05 107% |
| CCT | 12214 53% | 11116 58% | 6881 94% | 6843 95% | 6011 108% | 6832 95% |
| Color Space (Percent of AdobeRGB 1998) (%) | 40 | 37.18 -7% | 42.38 6% | 38 -5% | 46 15% | 42.26 6% |
| Color Space (Percent of sRGB) (%) | 63 | 58.63 -7% | 65.62 4% | 60 -5% | 72 14% | 65.43 4% |
| Totalt genomsnitt (program/inställningar) | -15% /
-9% | 13% /
23% | -0% /
9% | 22% /
42% | 7% /
17% |
* ... mindre är bättre
Visa svarstider
| ↔ Svarstid svart till vitt | ||
|---|---|---|
| 23 ms ... stiga ↗ och falla ↘ kombinerat | ↗ 19 ms stiga | 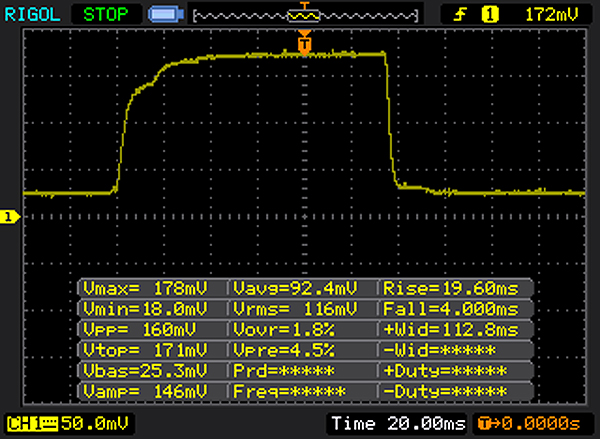 |
| ↘ 4 ms hösten | ||
| Skärmen visar bra svarsfrekvens i våra tester, men kan vara för långsam för konkurrenskraftiga spelare. I jämförelse sträcker sig alla testade enheter från 0.1 (minst) till 240 (maximalt) ms. » 52 % av alla enheter är bättre. Detta innebär att den uppmätta svarstiden är sämre än genomsnittet av alla testade enheter (19.8 ms). | ||
| ↔ Svarstid 50 % grått till 80 % grått | ||
| 41 ms ... stiga ↗ och falla ↘ kombinerat | ↗ 22 ms stiga | 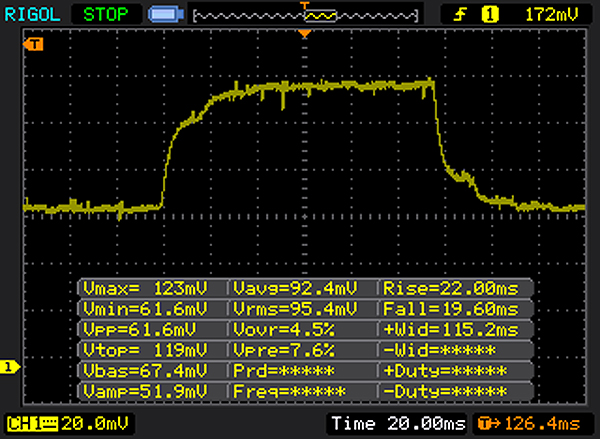 |
| ↘ 19 ms hösten | ||
| Skärmen visar långsamma svarsfrekvenser i våra tester och kommer att vara otillfredsställande för spelare. I jämförelse sträcker sig alla testade enheter från 0.165 (minst) till 636 (maximalt) ms. » 65 % av alla enheter är bättre. Detta innebär att den uppmätta svarstiden är sämre än genomsnittet av alla testade enheter (31 ms). | ||
Skärmflimmer / PWM (Puls-Width Modulation)
| Skärmflimmer / PWM upptäckt | 800 Hz | ≤ 30 % ljusstyrka inställning | 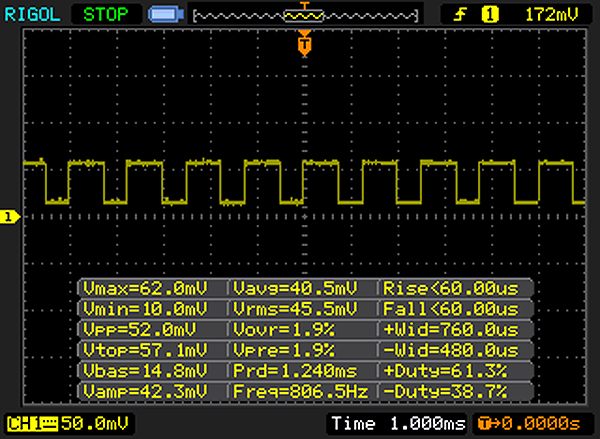 |
Displayens bakgrundsbelysning flimrar vid 800 Hz (i värsta fall, t.ex. med PWM) Flimrande upptäckt vid en ljusstyrkeinställning på 30 % och lägre. Det ska inte finnas något flimmer eller PWM över denna ljusstyrkeinställning. Frekvensen för 800 Hz är ganska hög, så de flesta användare som är känsliga för PWM bör inte märka något flimmer. Som jämförelse: 52 % av alla testade enheter använder inte PWM för att dämpa skärmen. Om PWM upptäcktes mättes ett medelvärde av 7772 (minst: 5 - maximum: 343500) Hz. | |||
| Cinebench R15 | |
| CPU Single 64Bit | |
| HP Envy x360 15m-bq121dx | |
| Lenovo ThinkPad X270-20HMS00T00 | |
| Lenovo ThinkPad X260-20F6007RGE | |
| HP EliteBook 820 G3 | |
| Lenovo Thinkpad 13-20J1001BUS | |
| HP EliteBook 725 G4 | |
| Lenovo ThinkPad A275 | |
| CPU Multi 64Bit | |
| HP Envy x360 15m-bq121dx | |
| Lenovo ThinkPad X270-20HMS00T00 | |
| Lenovo ThinkPad X260-20F6007RGE | |
| HP EliteBook 820 G3 | |
| Lenovo Thinkpad 13-20J1001BUS | |
| HP EliteBook 725 G4 | |
| Lenovo ThinkPad A275 | |
| PCMark 8 | |
| Home Score Accelerated v2 | |
| Lenovo ThinkPad X270-20HMS00T00 | |
| HP EliteBook 820 G3 | |
| HP Envy x360 15m-bq121dx | |
| Lenovo ThinkPad X260-20F6007RGE | |
| Lenovo Thinkpad 13-20J1001BUS | |
| Lenovo ThinkPad A275 | |
| HP EliteBook 725 G4 | |
| Work Score Accelerated v2 | |
| Lenovo ThinkPad X270-20HMS00T00 | |
| HP EliteBook 820 G3 | |
| Lenovo ThinkPad X260-20F6007RGE | |
| Lenovo ThinkPad A275 | |
| Lenovo Thinkpad 13-20J1001BUS | |
| HP EliteBook 725 G4 | |
| PCMark 8 Home Score Accelerated v2 | 2925 poäng | |
| PCMark 8 Work Score Accelerated v2 | 4156 poäng | |
| PCMark 10 Score | 2312 poäng | |
Hjälp | ||
| Lenovo ThinkPad A275 Samsung PM961 MZVLW256HEHP | HP EliteBook 820 G3 Samsung SM951 MZVPV256HDGL m.2 PCI-e | Lenovo ThinkPad X260-20F6007RGE Liteonit LCH-512V2S | Lenovo Thinkpad 13-20J1001BUS | HP EliteBook 725 G4 Samsung PM961 MZVLW256HEHP | |
|---|---|---|---|---|---|
| CrystalDiskMark 3.0 | 106% | 18% | -7% | 12% | |
| Read Seq (MB/s) | 1196 | 1255 5% | 499.6 -58% | 447.3 -63% | 1963 64% |
| Write Seq (MB/s) | 1133 | 1240 9% | 403 -64% | 331.3 -71% | 1409 24% |
| Read 512 (MB/s) | 943 | 1131 20% | 322.9 -66% | 315.7 -67% | 949 1% |
| Write 512 (MB/s) | 870 | 811 -7% | 372.4 -57% | 247.2 -72% | 890 2% |
| Read 4k (MB/s) | 33.82 | 51 51% | 27.22 -20% | 34.46 2% | 29.75 -12% |
| Write 4k (MB/s) | 46.63 | 134.1 188% | 83.6 79% | 76.1 63% | 47.35 2% |
| Read 4k QD32 (MB/s) | 131.5 | 549 317% | 316.5 141% | 235.3 79% | 139.7 6% |
| Write 4k QD32 (MB/s) | 94.9 | 343.9 262% | 273.1 188% | 162.2 71% | 100.2 6% |

| 3DMark - 1280x720 Cloud Gate Standard Graphics | |
| HP Envy x360 15m-bq121dx | |
| Lenovo IdeaPad 320S-13IKB | |
| Lenovo ThinkPad X260-20F6007RGE | |
| HP EliteBook 820 G3 | |
| Lenovo Thinkpad 13-20J1001BUS | |
| Lenovo ThinkPad A275 | |
| HP EliteBook 725 G4 | |
| 3DMark Cloud Gate Standard Score | 3942 poäng | |
Hjälp | ||
| BioShock Infinite - 1280x720 Very Low Preset | |
| HP Envy x360 15m-bq121dx | |
| Lenovo ThinkPad A275 | |
| Rise of the Tomb Raider - 1024x768 Lowest Preset | |
| HP Envy x360 15m-bq121dx | |
| Lenovo IdeaPad 320S-13IKB | |
| Lenovo ThinkPad A275 | |
| Battlefield 4 - 1024x768 Low Preset | |
| Lenovo ThinkPad A275 | |
| låg | med. | hög | ultra | |
|---|---|---|---|---|
| BioShock Infinite (2013) | 45.4 | 26.9 | 23 | |
| Battlefield 4 (2013) | 29 | 20.1 | 12.6 | |
| Rise of the Tomb Raider (2016) | 21.6 | 13.2 | 7 |
Ljudnivå
| Låg belastning |
| 30.15 / 30.4 / 32.4 dB(A) |
| Hög belastning |
| 32.4 / 32.4 dB(A) |
 | ||
30 dB tyst 40 dB(A) hörbar 50 dB(A) högt ljud |
||
min: | ||
(+) Den maximala temperaturen på ovansidan är 38.7 °C / 102 F, jämfört med genomsnittet av 35.9 °C / 97 F , allt från 21.4 till 59 °C för klassen Subnotebook.
(-) Botten värms upp till maximalt 47 °C / 117 F, jämfört med genomsnittet av 39.2 °C / 103 F
(+) Vid tomgångsbruk är medeltemperaturen för ovansidan 26.5 °C / 80 F, jämfört med enhetsgenomsnittet på 30.8 °C / ### class_avg_f### F.
(+) Handledsstöden och pekplattan är kallare än hudtemperaturen med maximalt 29.3 °C / 84.7 F och är därför svala att ta på.
(±) Medeltemperaturen för handledsstödsområdet på liknande enheter var 28.2 °C / 82.8 F (-1.1 °C / -1.9 F).
Lenovo ThinkPad A275 ljudanalys
(-) | inte särskilt höga högtalare (63.7 dB)
Bas 100 - 315 Hz
(-) | nästan ingen bas - i genomsnitt 20% lägre än medianen
(±) | linjäriteten för basen är genomsnittlig (13.8% delta till föregående frekvens)
Mellan 400 - 2000 Hz
(+) | balanserad mellan - endast 4% från medianen
(±) | linjäriteten för mids är genomsnittlig (13% delta till föregående frekvens)
Högsta 2 - 16 kHz
(+) | balanserade toppar - endast 2.5% från medianen
(±) | linjäriteten för toppar är genomsnittlig (9.7% delta till föregående frekvens)
Totalt 100 - 16 000 Hz
(±) | linjäriteten för det totala ljudet är genomsnittlig (22.8% skillnad mot median)
Jämfört med samma klass
» 78% av alla testade enheter i den här klassen var bättre, 4% liknande, 18% sämre
» Den bästa hade ett delta på 5%, genomsnittet var 18%, sämst var 53%
Jämfört med alla testade enheter
» 67% av alla testade enheter var bättre, 6% liknande, 27% sämre
» Den bästa hade ett delta på 4%, genomsnittet var 24%, sämst var 134%
HP EliteBook 820 G3 ljudanalys
(±) | högtalarljudstyrkan är genomsnittlig men bra (76.5 dB)
Bas 100 - 315 Hz
(-) | nästan ingen bas - i genomsnitt 20.2% lägre än medianen
(±) | linjäriteten för basen är genomsnittlig (14.7% delta till föregående frekvens)
Mellan 400 - 2000 Hz
(+) | balanserad mellan - endast 2% från medianen
(+) | mids är linjära (5% delta till föregående frekvens)
Högsta 2 - 16 kHz
(±) | högre toppar - i genomsnitt 6.7% högre än medianen
(+) | toppar är linjära (6.9% delta till föregående frekvens)
Totalt 100 - 16 000 Hz
(±) | linjäriteten för det totala ljudet är genomsnittlig (22.1% skillnad mot median)
Jämfört med samma klass
» 75% av alla testade enheter i den här klassen var bättre, 6% liknande, 19% sämre
» Den bästa hade ett delta på 5%, genomsnittet var 18%, sämst var 53%
Jämfört med alla testade enheter
» 64% av alla testade enheter var bättre, 6% liknande, 30% sämre
» Den bästa hade ett delta på 4%, genomsnittet var 24%, sämst var 134%
Lenovo Thinkpad 13-20J1001BUS ljudanalys
(±) | högtalarljudstyrkan är genomsnittlig men bra (75.1 dB)
Bas 100 - 315 Hz
(-) | nästan ingen bas - i genomsnitt 16.8% lägre än medianen
(±) | linjäriteten för basen är genomsnittlig (14.7% delta till föregående frekvens)
Mellan 400 - 2000 Hz
(+) | balanserad mellan - endast 2.1% från medianen
(+) | mids är linjära (6.3% delta till föregående frekvens)
Högsta 2 - 16 kHz
(+) | balanserade toppar - endast 2.5% från medianen
(±) | linjäriteten för toppar är genomsnittlig (8.4% delta till föregående frekvens)
Totalt 100 - 16 000 Hz
(±) | linjäriteten för det totala ljudet är genomsnittlig (18.4% skillnad mot median)
Jämfört med samma klass
» 33% av alla testade enheter i den här klassen var bättre, 7% liknande, 60% sämre
» Den bästa hade ett delta på 7%, genomsnittet var 21%, sämst var 53%
Jämfört med alla testade enheter
» 41% av alla testade enheter var bättre, 8% liknande, 52% sämre
» Den bästa hade ett delta på 4%, genomsnittet var 24%, sämst var 134%
| Av/Standby | |
| Låg belastning | |
| Hög belastning |
|
Förklaring:
min: | |
| Lenovo ThinkPad A275 PRO A12-9800B, Radeon R7 (Bristol Ridge), Samsung PM961 MZVLW256HEHP, TN, 1366x768, 12.5" | HP EliteBook 820 G3 6300U, HD Graphics 520, Samsung SM951 MZVPV256HDGL m.2 PCI-e, TN LED, 1366x768, 12.5" | Lenovo ThinkPad X260-20F6007RGE 6500U, HD Graphics 520, Liteonit LCH-512V2S, IPS, 1920x1080, 12.5" | Lenovo Thinkpad 13-20J1001BUS i3-7100U, HD Graphics 620, , IPS, 1920x1080, 13.3" | HP EliteBook 725 G4 PRO A12-9800B, Radeon R7 (Bristol Ridge), Samsung PM961 MZVLW256HEHP, IPS, 1920x1080, 12.5" | |
|---|---|---|---|---|---|
| Power Consumption | 21% | 17% | 28% | 12% | |
| Idle Minimum * (Watt) | 4.2 | 3.5 17% | 3.5 17% | 3.5 17% | 4.5 -7% |
| Idle Average * (Watt) | 8.2 | 5.4 34% | 5.5 33% | 5.7 30% | 6.3 23% |
| Idle Maximum * (Watt) | 10 | 6.2 38% | 6.7 33% | 6.2 38% | 8.3 17% |
| Load Average * (Watt) | 34.5 | 27.3 21% | 28.9 16% | 24.1 30% | 27.6 20% |
| Load Maximum * (Watt) | 37 | 39.5 -7% | 42.1 -14% | 28.5 23% | 34.5 7% |
* ... mindre är bättre
| Lenovo ThinkPad A275 PRO A12-9800B, Radeon R7 (Bristol Ridge), 71 Wh | HP EliteBook 820 G3 6300U, HD Graphics 520, 44 Wh | Lenovo ThinkPad X260-20F6007RGE 6500U, HD Graphics 520, 46 Wh | Lenovo Thinkpad 13-20J1001BUS i3-7100U, HD Graphics 620, 42 Wh | HP EliteBook 725 G4 PRO A12-9800B, Radeon R7 (Bristol Ridge), 49 Wh | |
|---|---|---|---|---|---|
| Batteridrifttid | -29% | -24% | -14% | -35% | |
| Reader / Idle (h) | 16 | 13.8 -14% | 15.9 -1% | 16.5 3% | 11.7 -27% |
| WiFi v1.3 (h) | 9 | 6.2 -31% | 8.4 -7% | 9.7 8% | 6.3 -30% |
| Load (h) | 4.1 | 2.4 -41% | 1.5 -63% | 1.9 -54% | 2.1 -49% |
| H.264 (h) | 8.3 | 7.8 | 5.7 |
För
Emot
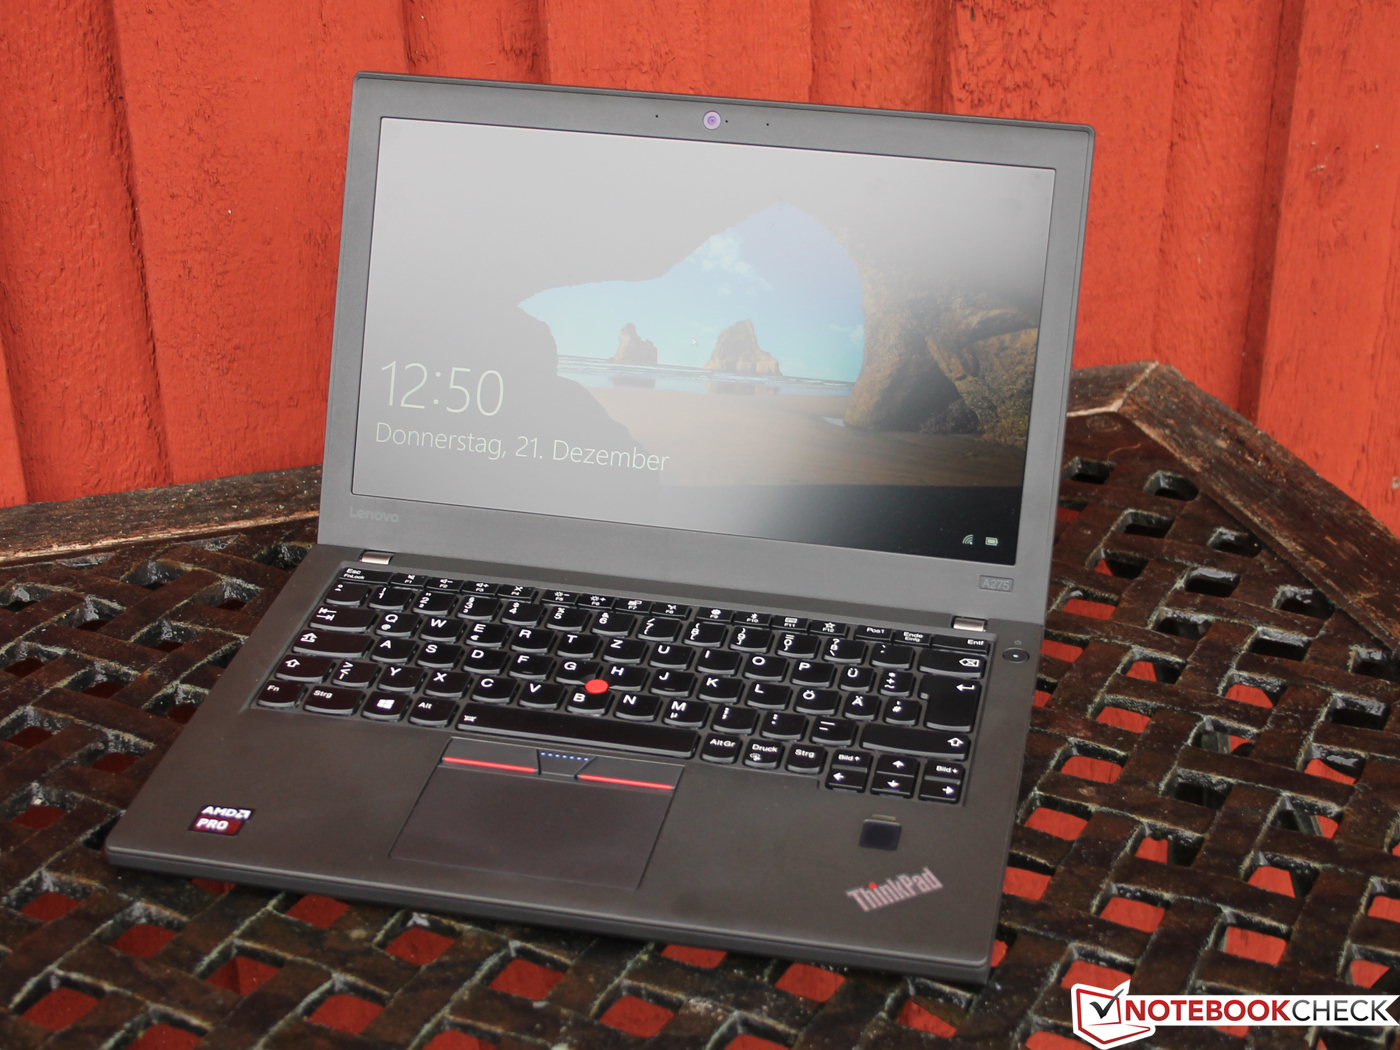
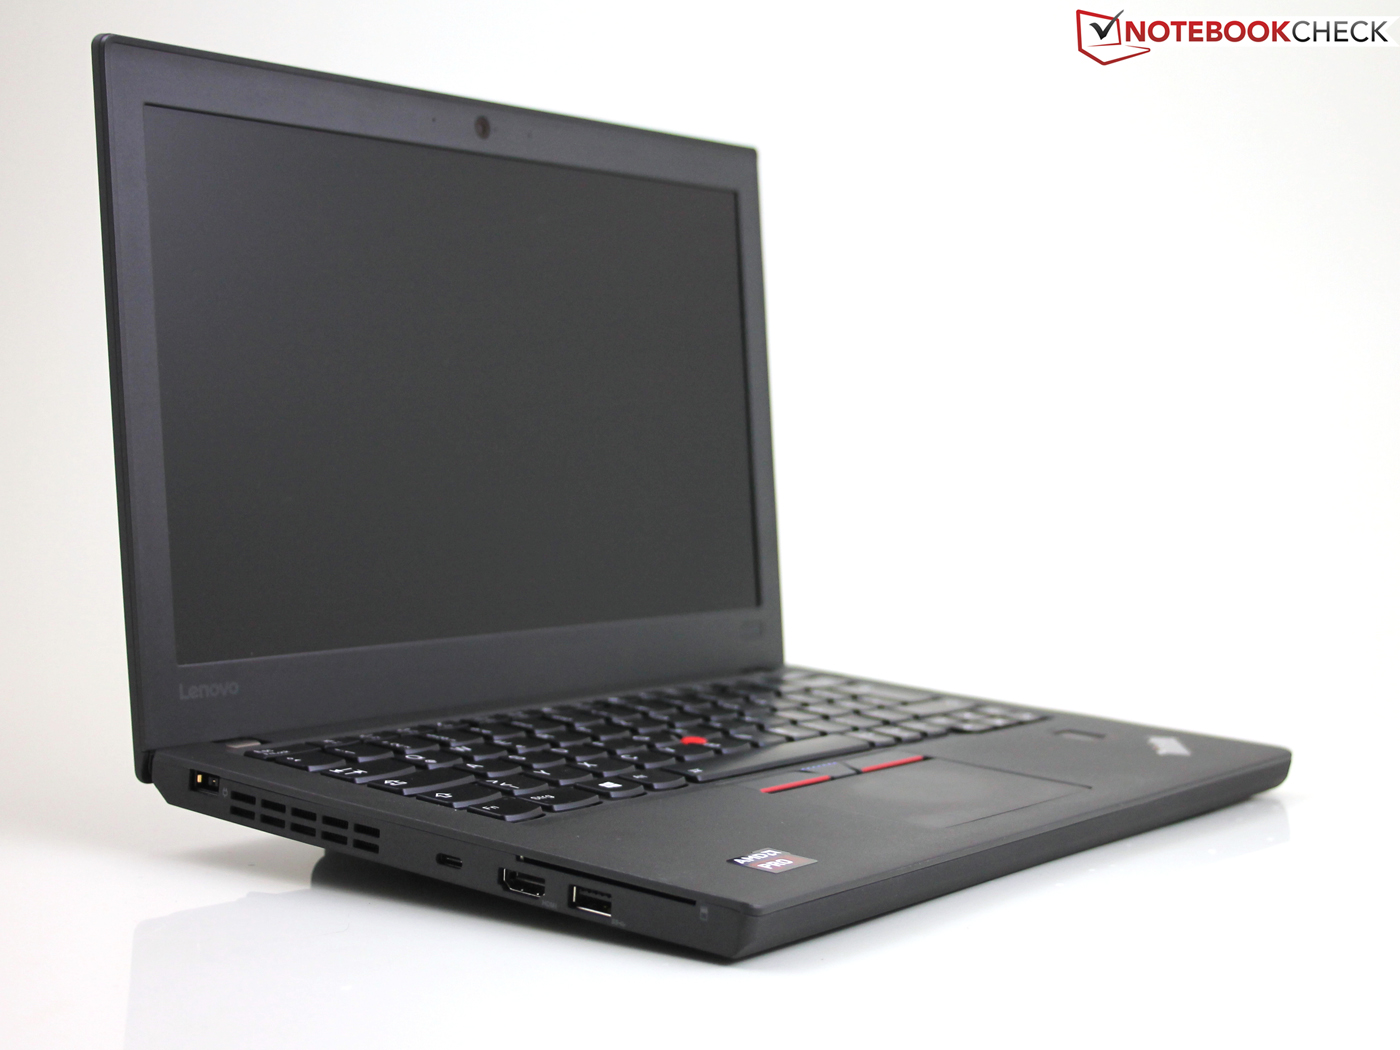
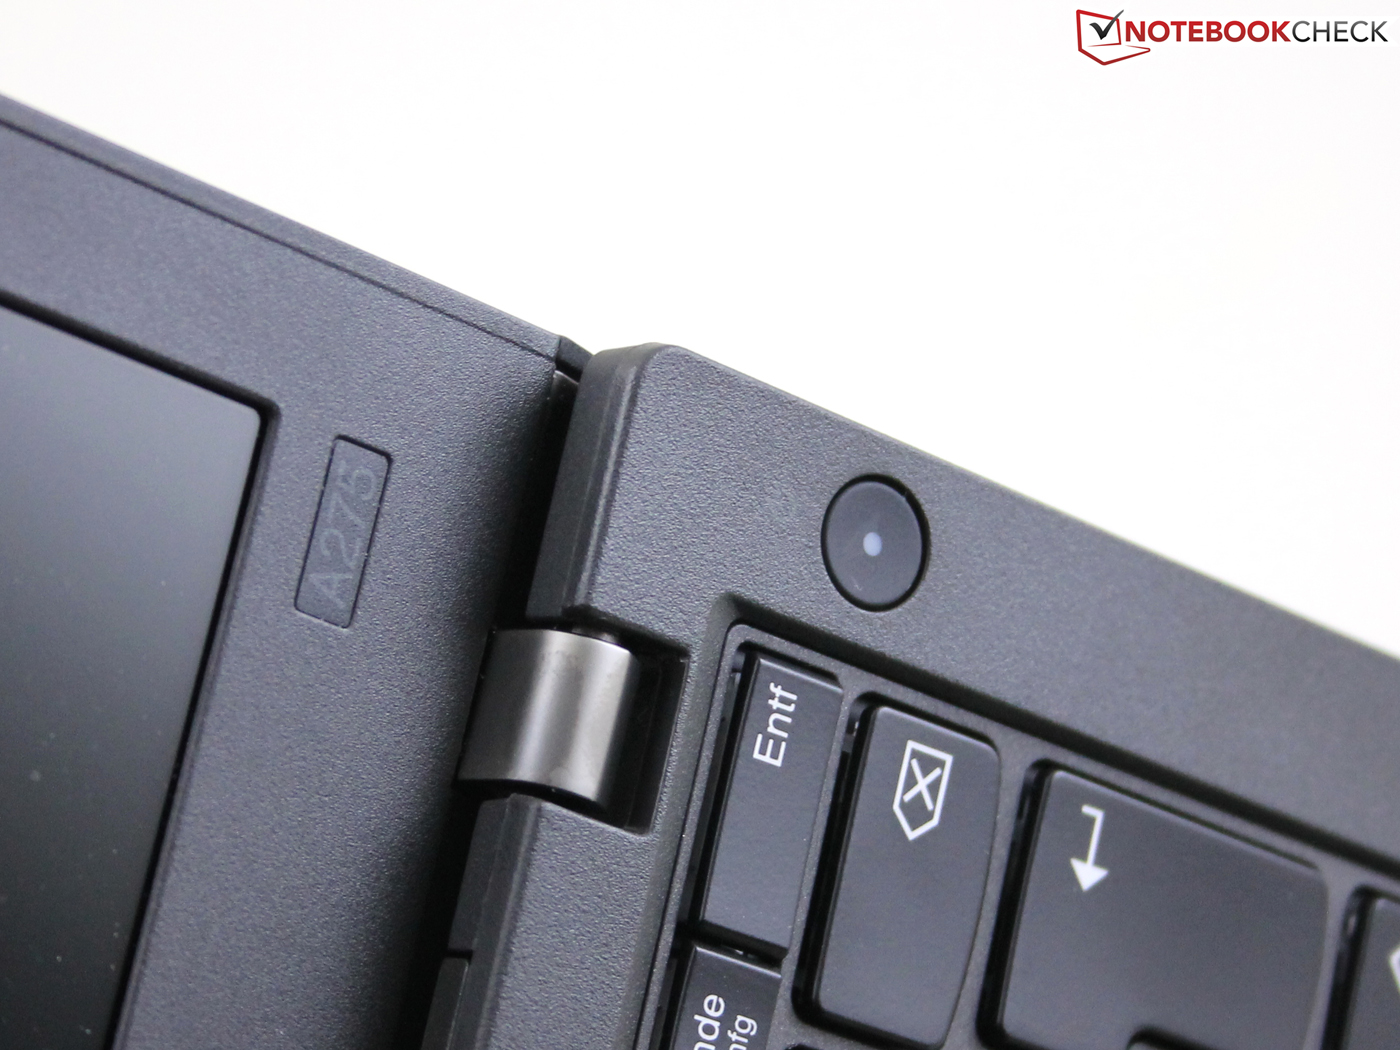
A275 är verkligen ingen efterföljare till ThinkPad Edge-serien. Även om dess kvalitetsnivå till viss del påminner om den nedlagda lågskikts-serien Edge och vi var väldigt besvikna på basens brist på rigiditet så är dom andra kvaliteterna hos A275 i nivå med andra subnotebooks från mittenskiktet såsom ThinkPad 13 eller X260.
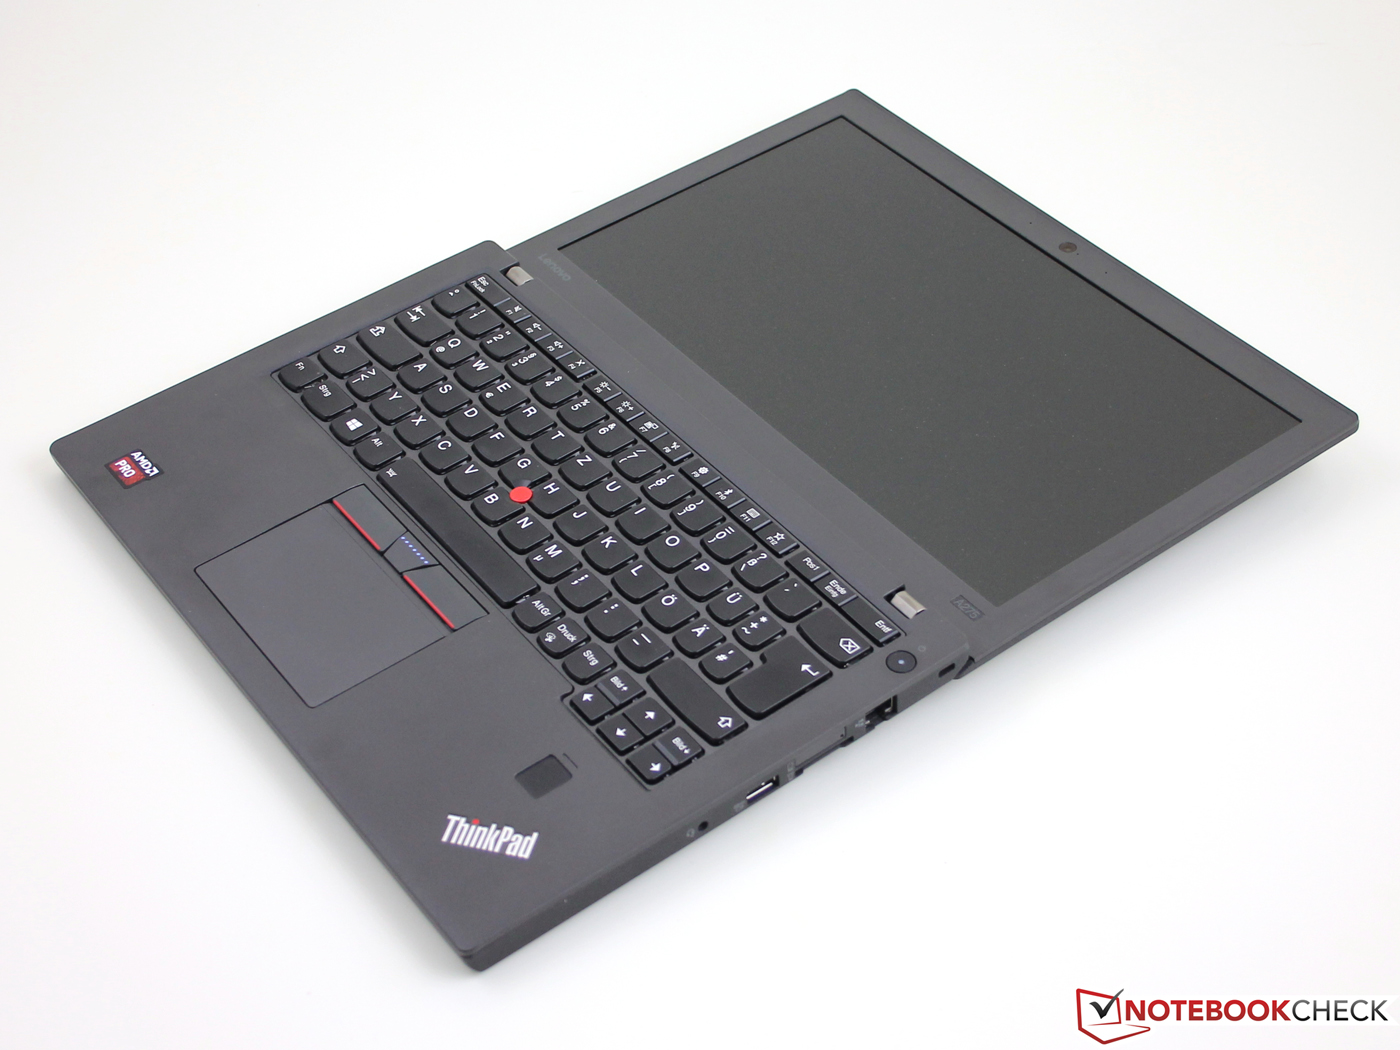
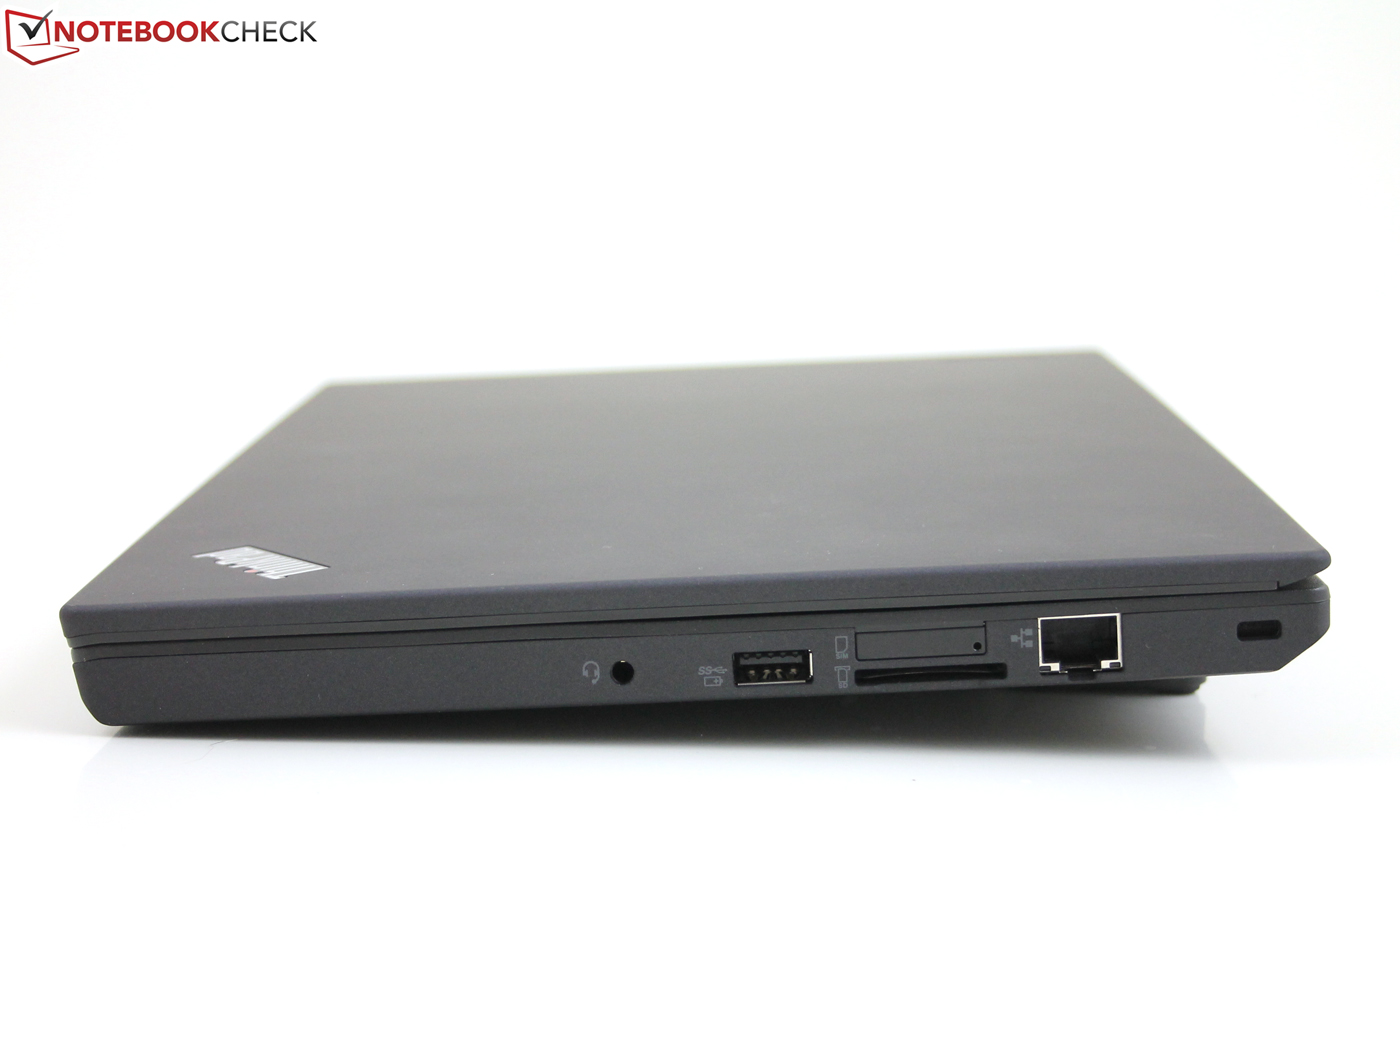
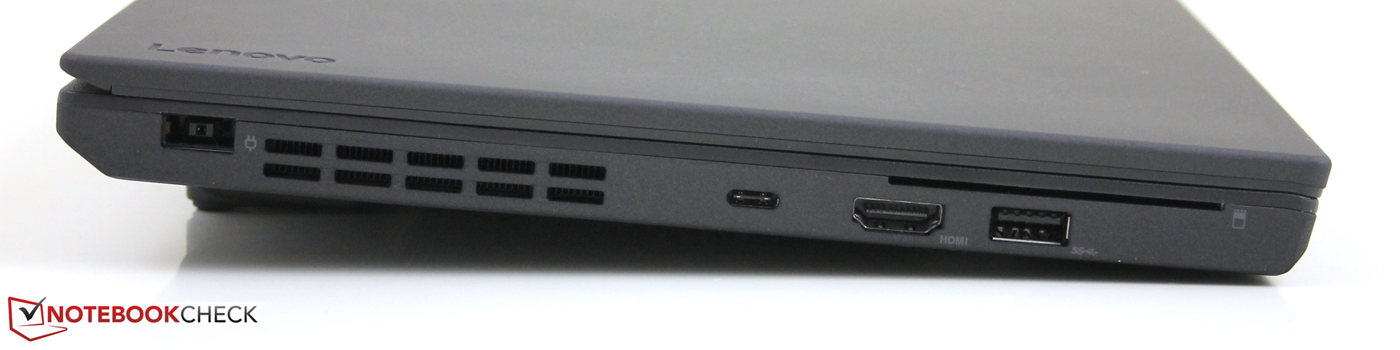
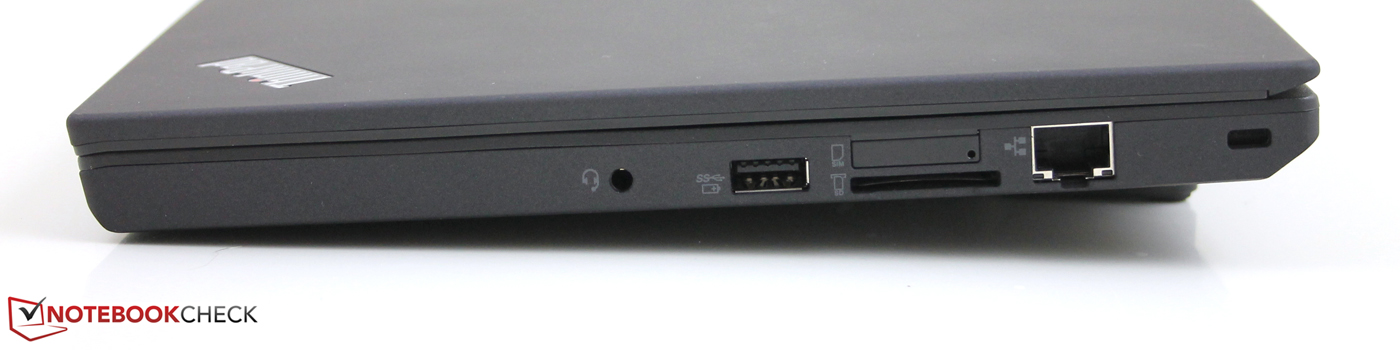
Det som imponerade på oss mest var dom högkvalitativa inmatningsenheterna som till 95% liknar dom hos ThinkPad 13 i fråga om återkoppling och upplägg. Portutbudet är också utmärkt, med Ethernet, 3st USB 3.0 Gen. 1 och DisplayPort pass-through stöd för USB Typ-C porten. Säkerhetsfunktionerna inkluderar en snabb och pålitlig fingeravtrycksläsare, en smartcard-läsare och ett TPM 2.0-chip.
Den största nackdelen var i särklass den TN-panelsbaserade HD-skärmen. Vi uppmanar kraftigt köpare att välja FHD-panelen istället – den passar ändamålet mycket bättre än HD-panelen.
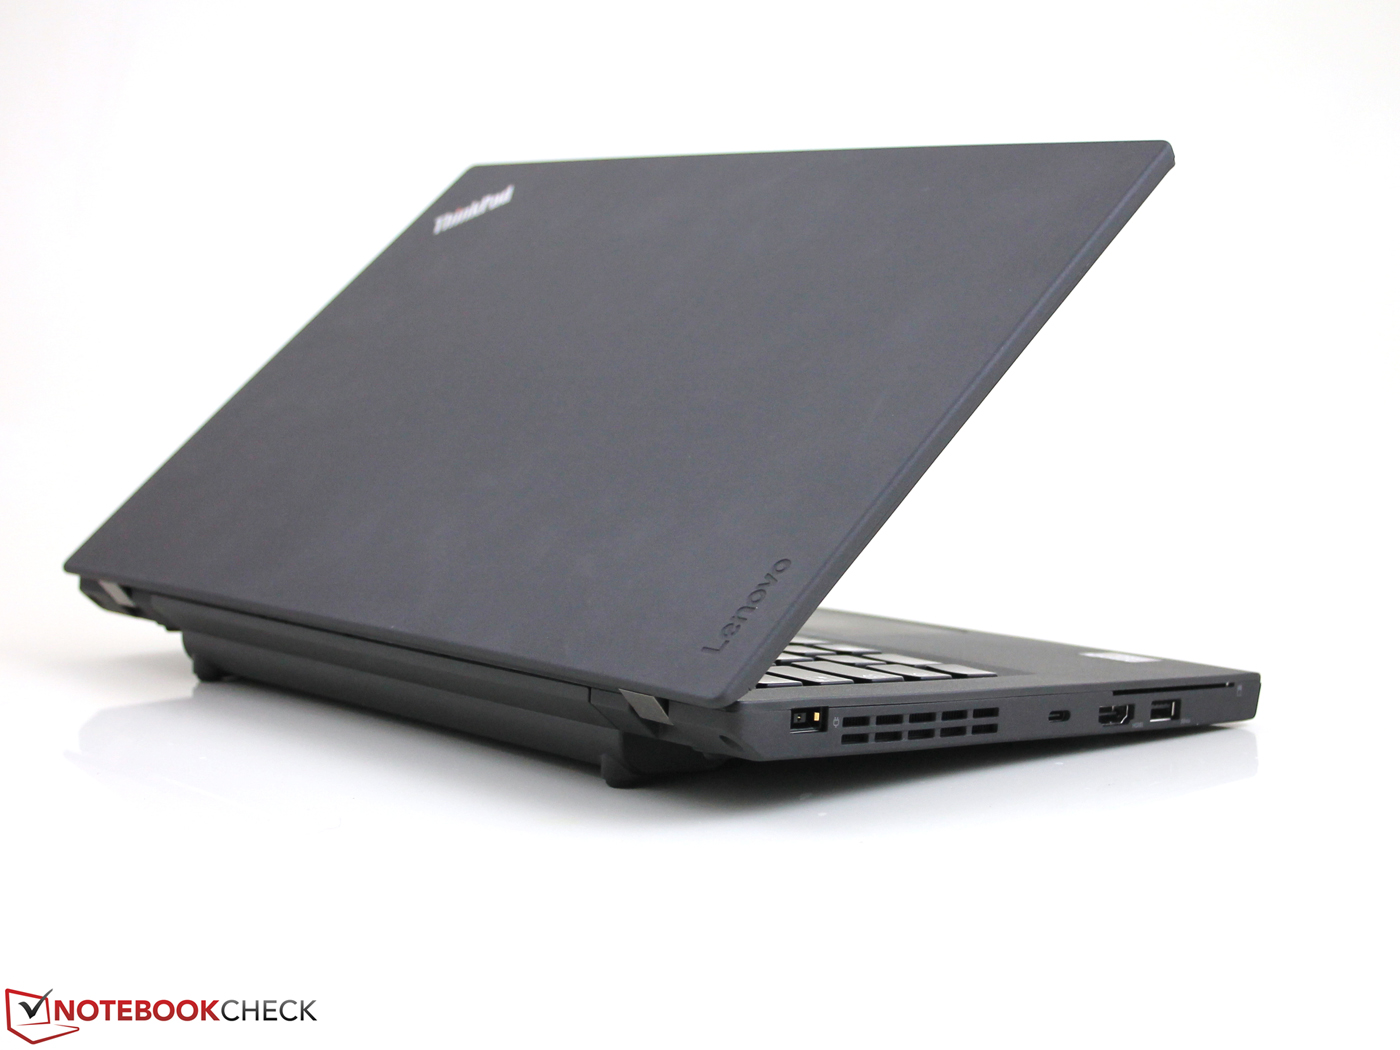
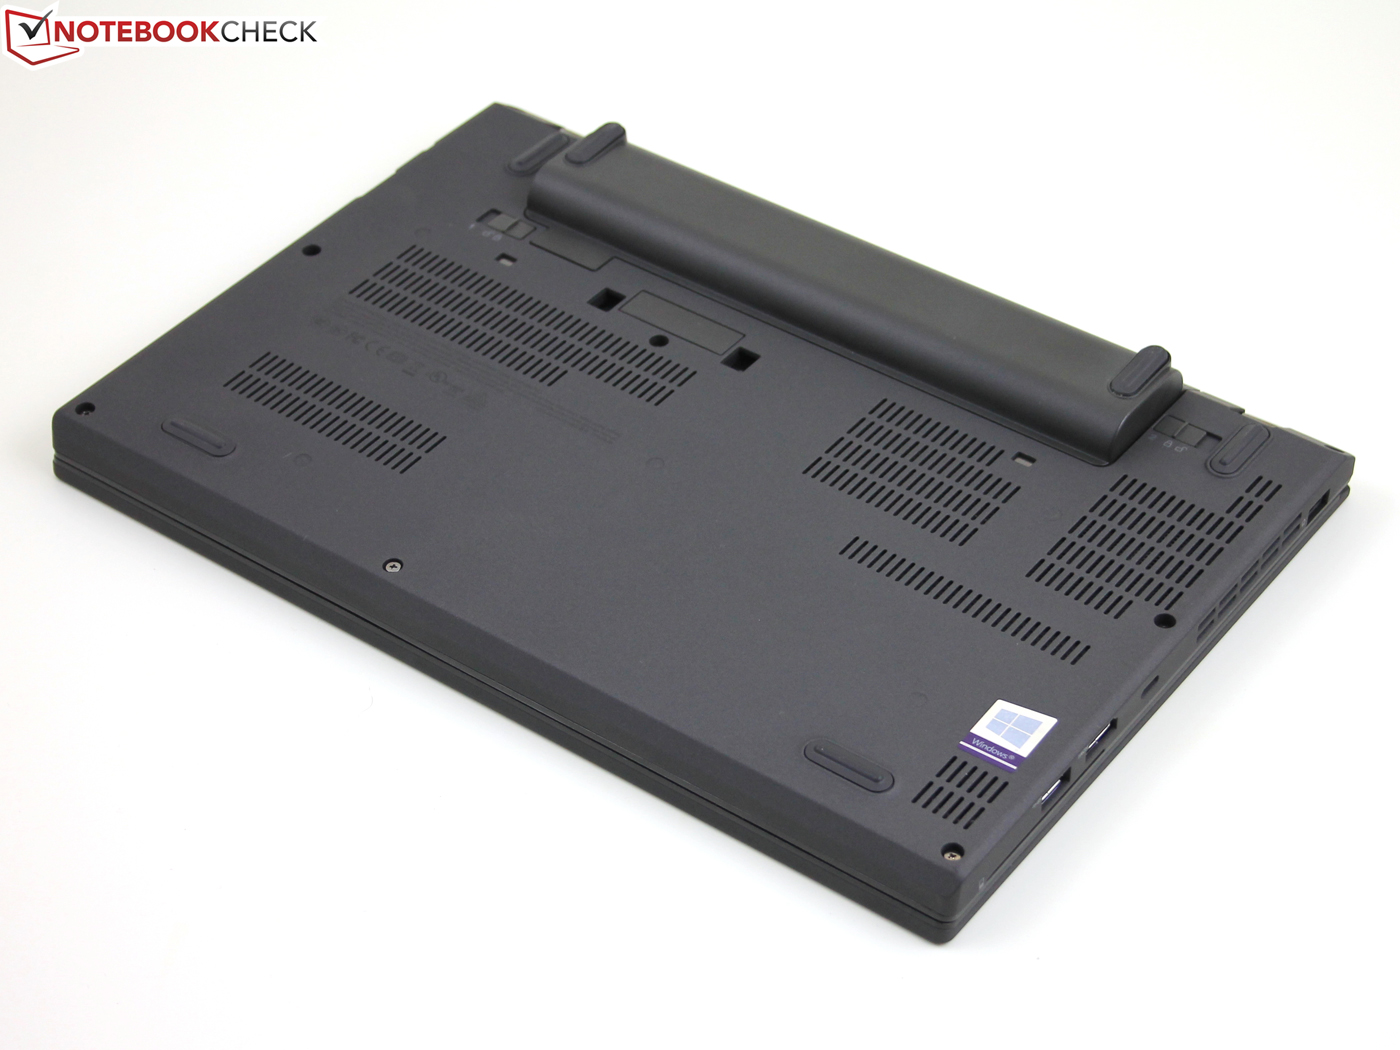
Med underhållsmöjligheterna är det lite blandat. Även om det externa batteriet kan bytas under körning tack vare det primära inbyggda icke-utbytbara batteriet på 23 Wh så saknar A275 en dedikerat underhålls-lucka. Hela den övre delen av höljet behöver tas bort för att komma åt dess SSD (M.2), fläkten eller den enda RAM-platsen.
Allt övervägt så är A275 definitivt en duglig arbetshäst med onekbara kvaliteter såsom 9 timmars batteritid i vårt WiFi-test, utmärkta inmatningsenheter, dess överflöd av portar och dess säkerhetsfunktioner. Men för över 8 100 SEK ($1,000) så tycker vi den är en aning dyr med tanke på dess långsamma och vid det här laget utdaterade AMD Bristol Ridge SoC.
HP EliteBook 820 G3 utrustad med snabbare i5-6200U Skylake-processorer går redan att hitta för under 8 100 SEK ($1,000), och det gäller även ThinkPad 13 G2 utrustad med i5-7200U.
Vi har stora problem med att hitta en övertygande anledning att köpa denna specifika laptop utöver det faktum att HP:s Bristol Ridge-baserade EliteBook 725 G4 kostar ungefär lika mycket. Men vi anser att även den har ett för högt pris. Ett pris på under 8 100 SEK ($1,000) hade varit rimligare för att kompensera för den tydligt långsammare prestandan.
Lenovo ThinkPad A275
- 12/21/2017 v6 (old)
Sebastian Jentsch
Price comparison
