Test: HP Pavilion 14 - En tjusig allt-i-allo med en ljusstark skärm (Sammanfattning)
Gradering | Datum | Modell | Vikt | Höjd | Storlek | Upplösning | Pris |
|---|---|---|---|---|---|---|---|
| 77.8 % v7 (old) | 01/2020 | HP Pavilion 14-ce3040ng i7-1065G7, GeForce MX250 | 1.6 kg | 18 mm | 14.00" | 1920x1080 | |
| 84.9 % v6 (old) | 07/2019 | Lenovo IdeaPad S540-14IWL i5-8265U, GeForce MX250 | 1.4 kg | 15.9 mm | 14.00" | 1920x1080 | |
| 84.2 % v7 (old) | Acer Aspire 5 A515-52G-723L i7-8565U, GeForce MX250 | 1.8 kg | 17.95 mm | 15.60" | 1920x1080 | ||
| 82.6 % v6 (old) | 07/2019 | Asus VivoBook S15 S532F i7-8565U, GeForce MX250 | 1.8 kg | 18 mm | 15.60" | 1920x1080 |
| SD Card Reader | |
| average JPG Copy Test (av. of 3 runs) | |
| Genomsnitt av klass Multimedia (23 - 531, n=43, senaste 2 åren) | |
| Lenovo IdeaPad S540-14IWL (Toshiba Exceria Pro SDXC 64 GB UHS-II) | |
| Acer Aspire 5 A515-52G-723L (Toshiba Exceria Pro SDXC 64 GB UHS-II) | |
| Asus VivoBook S15 S532F (Toshiba Exceria Pro UHS-II) | |
| HP Pavilion 14-ce3040ng (Toshiba Exceria Pro SDXC 64 GB UHS-II) | |
| maximum AS SSD Seq Read Test (1GB) | |
| Genomsnitt av klass Multimedia (27.9 - 1455, n=42, senaste 2 åren) | |
| Lenovo IdeaPad S540-14IWL (Toshiba Exceria Pro SDXC 64 GB UHS-II) | |
| Acer Aspire 5 A515-52G-723L (Toshiba Exceria Pro SDXC 64 GB UHS-II) | |
| Asus VivoBook S15 S532F (Toshiba Exceria Pro UHS-II) | |
| HP Pavilion 14-ce3040ng (Toshiba Exceria Pro SDXC 64 GB UHS-II) | |
| |||||||||||||||||||||||||
Distribution av ljusstyrkan: 91 %
Mitt på batteriet: 395 cd/m²
Kontrast: 1519:1 (Svärta: 0.26 cd/m²)
ΔE ColorChecker Calman: 5.92 | ∀{0.5-29.43 Ø4.73}
calibrated: 0.91
ΔE Greyscale Calman: 6.69 | ∀{0.09-98 Ø4.97}
98% sRGB (Argyll 1.6.3 3D)
63% AdobeRGB 1998 (Argyll 1.6.3 3D)
68.2% AdobeRGB 1998 (Argyll 3D)
98.4% sRGB (Argyll 3D)
66.5% Display P3 (Argyll 3D)
Gamma: 2.78
CCT: 7596 K
| HP Pavilion 14-ce3040ng AUO543D, IPS, 1920x1080, 14" | Lenovo IdeaPad S540-14IWL NV140FHM-N48, IPS, 1920x1080, 14" | Acer Aspire 5 A515-52G-723L BOE NV156FHM-N48, IPS, 1920x1080, 15.6" | Asus VivoBook S15 S532F LG Philips LP156WFC-SPD1, IPS, 1920x1080, 15.6" | |
|---|---|---|---|---|
| Display | -40% | -40% | -44% | |
| Display P3 Coverage (%) | 66.5 | 40.1 -40% | 40.02 -40% | 37.12 -44% |
| sRGB Coverage (%) | 98.4 | 59.2 -40% | 58.5 -41% | 55.9 -43% |
| AdobeRGB 1998 Coverage (%) | 68.2 | 41.43 -39% | 41.34 -39% | 38.35 -44% |
| Response Times | 14% | 8% | 39% | |
| Response Time Grey 50% / Grey 80% * (ms) | 60.8 ? | 39.6 ? 35% | 45 ? 26% | 24.8 ? 59% |
| Response Time Black / White * (ms) | 29.6 ? | 32 ? -8% | 33 ? -11% | 24 ? 19% |
| PWM Frequency (Hz) | 352.1 ? | 250 ? | ||
| Screen | -55% | -50% | -69% | |
| Brightness middle (cd/m²) | 395 | 316 -20% | 278 -30% | 262.3 -34% |
| Brightness (cd/m²) | 375 | 301 -20% | 271 -28% | 250 -33% |
| Brightness Distribution (%) | 91 | 88 -3% | 89 -2% | 89 -2% |
| Black Level * (cd/m²) | 0.26 | 0.28 -8% | 0.26 -0% | 0.43 -65% |
| Contrast (:1) | 1519 | 1129 -26% | 1069 -30% | 610 -60% |
| Colorchecker dE 2000 * | 5.92 | 5.3 10% | 4.73 20% | 5.81 2% |
| Colorchecker dE 2000 max. * | 9.79 | 18.5 -89% | 8.38 14% | 14.7 -50% |
| Colorchecker dE 2000 calibrated * | 0.91 | 4.8 -427% | 5.17 -468% | 5.36 -489% |
| Greyscale dE 2000 * | 6.69 | 2.4 64% | 2.59 61% | 2.8 58% |
| Gamma | 2.78 79% | 2.05 107% | 2.38 92% | 2.15 102% |
| CCT | 7596 86% | 6644 98% | 6160 106% | 7016 93% |
| Color Space (Percent of AdobeRGB 1998) (%) | 63 | 37.6 -40% | 36 -43% | 35.2 -44% |
| Color Space (Percent of sRGB) (%) | 98 | 58.3 -41% | 58 -41% | 55.6 -43% |
| Totalt genomsnitt (program/inställningar) | -27% /
-43% | -27% /
-41% | -25% /
-51% |
* ... mindre är bättre
Visa svarstider
| ↔ Svarstid svart till vitt | ||
|---|---|---|
| 29.6 ms ... stiga ↗ och falla ↘ kombinerat | ↗ 13.2 ms stiga | 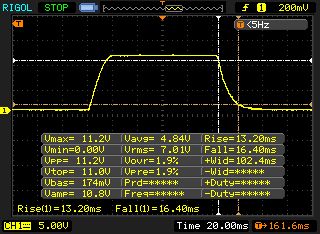 |
| ↘ 16.4 ms hösten | ||
| Skärmen visar relativt långsamma svarsfrekvenser i våra tester och kan vara för långsam för spelare. I jämförelse sträcker sig alla testade enheter från 0.1 (minst) till 240 (maximalt) ms. » 79 % av alla enheter är bättre. Detta innebär att den uppmätta svarstiden är sämre än genomsnittet av alla testade enheter (19.9 ms). | ||
| ↔ Svarstid 50 % grått till 80 % grått | ||
| 60.8 ms ... stiga ↗ och falla ↘ kombinerat | ↗ 29.2 ms stiga | 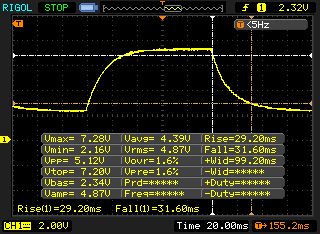 |
| ↘ 31.6 ms hösten | ||
| Skärmen visar långsamma svarsfrekvenser i våra tester och kommer att vara otillfredsställande för spelare. I jämförelse sträcker sig alla testade enheter från 0.165 (minst) till 636 (maximalt) ms. » 96 % av alla enheter är bättre. Detta innebär att den uppmätta svarstiden är sämre än genomsnittet av alla testade enheter (31.1 ms). | ||
Skärmflimmer / PWM (Puls-Width Modulation)
| Skärmflimmer / PWM upptäcktes inte | 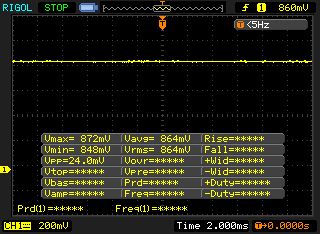 | ||
Som jämförelse: 52 % av alla testade enheter använder inte PWM för att dämpa skärmen. Om PWM upptäcktes mättes ett medelvärde av 7798 (minst: 5 - maximum: 343500) Hz. | |||
| Cinebench R15 | |
| CPU Single 64Bit | |
| Genomsnitt av klass Multimedia (184.8 - 326, n=66, senaste 2 åren) | |
| HP Pavilion 14-ce3040ng | |
| Asus VivoBook S15 S532F | |
| Acer Aspire 5 A515-52G-723L | |
| Lenovo IdeaPad S540-14IWL | |
| CPU Multi 64Bit | |
| Genomsnitt av klass Multimedia (856 - 5224, n=68, senaste 2 åren) | |
| HP Pavilion 14-ce3040ng | |
| Asus VivoBook S15 S532F | |
| Lenovo IdeaPad S540-14IWL | |
| Acer Aspire 5 A515-52G-723L | |
| Cinebench R20 | |
| CPU (Single Core) | |
| Genomsnitt av klass Multimedia (425 - 853, n=64, senaste 2 åren) | |
| HP Pavilion 14-ce3040ng | |
| Lenovo IdeaPad S540-14IWL | |
| Acer Aspire 5 A515-52G-723L | |
| CPU (Multi Core) | |
| Genomsnitt av klass Multimedia (1887 - 12912, n=64, senaste 2 åren) | |
| HP Pavilion 14-ce3040ng | |
| Lenovo IdeaPad S540-14IWL | |
| Acer Aspire 5 A515-52G-723L | |
| PCMark 10 - Score | |
| Genomsnitt av klass Multimedia (4325 - 10386, n=58, senaste 2 åren) | |
| HP Pavilion 14-ce3040ng | |
| Acer Aspire 5 A515-52G-723L | |
| Lenovo IdeaPad S540-14IWL | |
| Asus VivoBook S15 S532F | |
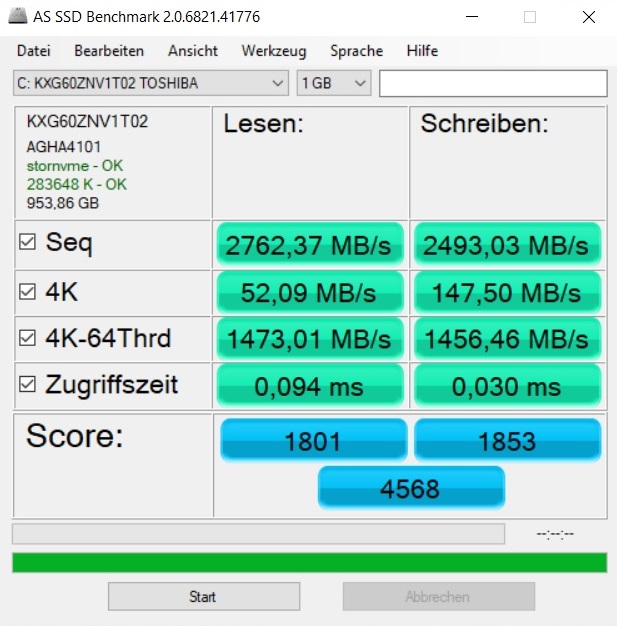
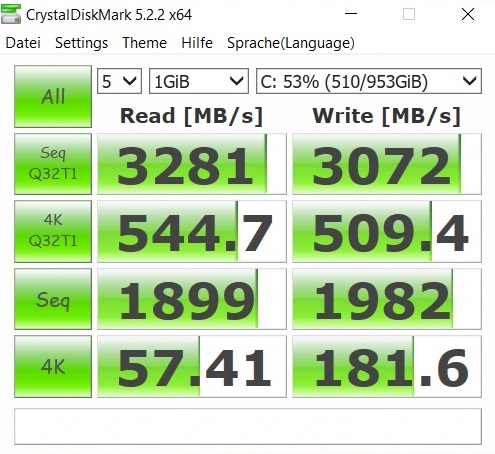
| HP Pavilion 14-ce3040ng Toshiba XG6 KXG60ZNV1T02 | Lenovo IdeaPad S540-14IWL Samsung SSD PM981 MZVLB512HAJQ | Acer Aspire 5 A515-52G-723L WDC PC SN520 SDAPNUW-512G | Asus VivoBook S15 S532F WDC PC SN520 SDAPNUW-256G | |
|---|---|---|---|---|
| CrystalDiskMark 5.2 / 6 | -22% | -39% | -36% | |
| Write 4K (MB/s) | 181.6 | 157.6 -13% | 130.1 -28% | 149.9 -17% |
| Read 4K (MB/s) | 57.4 | 46.39 -19% | 27.64 -52% | 46.13 -20% |
| Write Seq (MB/s) | 1982 | 1214 -39% | 1438 -27% | 970 -51% |
| Read Seq (MB/s) | 1899 | 1295 -32% | 1319 -31% | 1085 -43% |
| Write 4K Q32T1 (MB/s) | 509 | 370.7 -27% | 323.3 -36% | 460.8 -9% |
| Read 4K Q32T1 (MB/s) | 545 | 461.1 -15% | 359.9 -34% | 410.3 -25% |
| Write Seq Q32T1 (MB/s) | 3072 | 1888 -39% | 1454 -53% | 662 -78% |
| Read Seq Q32T1 (MB/s) | 3281 | 3540 8% | 1740 -47% | 1728 -47% |

| 3DMark 11 Performance | 4850 poäng | |
| 3DMark Time Spy Score | 1223 poäng | |
Hjälp | ||
| 3DMark | |
| 1920x1080 Fire Strike Graphics | |
| Genomsnitt av klass Multimedia (2328 - 48907, n=66, senaste 2 åren) | |
| Lenovo IdeaPad S540-14IWL | |
| Asus VivoBook S15 S532F | |
| Acer Aspire 5 A515-52G-723L | |
| HP Pavilion 14-ce3040ng | |
| 2560x1440 Time Spy Graphics | |
| Genomsnitt av klass Multimedia (696 - 19403, n=67, senaste 2 åren) | |
| Asus VivoBook S15 S532F | |
| HP Pavilion 14-ce3040ng | |
| Acer Aspire 5 A515-52G-723L | |
| 3DMark 11 - 1280x720 Performance GPU | |
| Genomsnitt av klass Multimedia (3765 - 60002, n=62, senaste 2 åren) | |
| Lenovo IdeaPad S540-14IWL | |
| Asus VivoBook S15 S532F | |
| Acer Aspire 5 A515-52G-723L | |
| HP Pavilion 14-ce3040ng | |
| The Witcher 3 | |
| 1366x768 Medium Graphics & Postprocessing | |
| Genomsnitt av klass Multimedia (41 - 93, n=4, senaste 2 åren) | |
| Acer Aspire 5 A515-52G-723L | |
| Asus VivoBook S15 S532F | |
| Lenovo IdeaPad S540-14IWL | |
| HP Pavilion 14-ce3040ng | |
| 1920x1080 High Graphics & Postprocessing (Nvidia HairWorks Off) | |
| Genomsnitt av klass Multimedia (22 - 224, n=13, senaste 2 åren) | |
| Acer Aspire 5 A515-52G-723L | |
| Lenovo IdeaPad S540-14IWL | |
| Asus VivoBook S15 S532F | |
| HP Pavilion 14-ce3040ng | |
| låg | med. | hög | ultra | |
|---|---|---|---|---|
| The Witcher 3 (2015) | 56.4 | 33.5 | 18.8 | 10.9 |
| Resident Evil 7 (2017) | 118 | 53.9 | 32.1 | 27 |
| Prey (2017) | 108 | 46.2 | 36.4 | 30.1 |
| Middle-earth: Shadow of War (2017) | 64 | 27 | 19 | 15 |
| ELEX (2017) | 53.9 | 25.4 | 20.6 | 15.6 |
| Star Wars Battlefront 2 (2017) | 79.1 | 25.4 | 21.8 | 18.7 |
| Kingdom Come: Deliverance (2018) | 50.7 | 21.9 | 18.7 | 12.7 |
| The Crew 2 (2018) | 43.9 | 20.2 | 19.5 | 16.5 |
| Control (2019) | 41 | 14 | 10.1 | |
| Borderlands 3 (2019) | 52.9 | 20.7 | 13.4 | 10.2 |
| FIFA 20 (2019) | 120 | 82.4 | 76.8 | 62.5 |
| Ghost Recon Breakpoint (2019) | 36 | 19 | 17 | 12 |
| GRID 2019 (2019) | 65.2 | 25.2 | 20.3 | 11.8 |
| Call of Duty Modern Warfare 2019 (2019) | 41.7 | 23.3 | 19.4 | 15.9 |
| Need for Speed Heat (2019) | 41.1 | 20.2 | 18.4 | 15.3 |
| Star Wars Jedi Fallen Order (2019) | 29.4 | 22.5 | 18.1 | |
| Red Dead Redemption 2 (2019) | 20.9 | 15.2 | 9.8 | 6.2 |
Ljudnivå
| Låg belastning |
| 31 / 36 / 41 dB(A) |
| Hög belastning |
| 49 / 49 dB(A) |
 | ||
30 dB tyst 40 dB(A) hörbar 50 dB(A) högt ljud |
||
min: | ||
| HP Pavilion 14-ce3040ng i7-1065G7, GeForce MX250 | Lenovo IdeaPad S540-14IWL i5-8265U, GeForce MX250 | Acer Aspire 5 A515-52G-723L i7-8565U, GeForce MX250 | Asus VivoBook S15 S532F i7-8565U, GeForce MX250 | Genomsnitt av klass Multimedia | |
|---|---|---|---|---|---|
| Noise | 20% | 13% | 16% | 23% | |
| av / miljö * (dB) | 30 | 29.3 2% | 29.9 -0% | 28 7% | 24.2 ? 19% |
| Idle Minimum * (dB) | 31 | 29.3 5% | 29.9 4% | 28 10% | 24.4 ? 21% |
| Idle Average * (dB) | 36 | 29.3 19% | 29.9 17% | 28 22% | 24.8 ? 31% |
| Idle Maximum * (dB) | 41 | 29.3 29% | 29.9 27% | 30 27% | 26.5 ? 35% |
| Load Average * (dB) | 49 | 34.4 30% | 41.7 15% | 41.4 16% | 37.6 ? 23% |
| Witcher 3 ultra * (dB) | 47 | 34.4 27% | 41.5 12% | ||
| Load Maximum * (dB) | 49 | 34.9 29% | 41.7 15% | 41.5 15% | 45.9 ? 6% |
* ... mindre är bättre
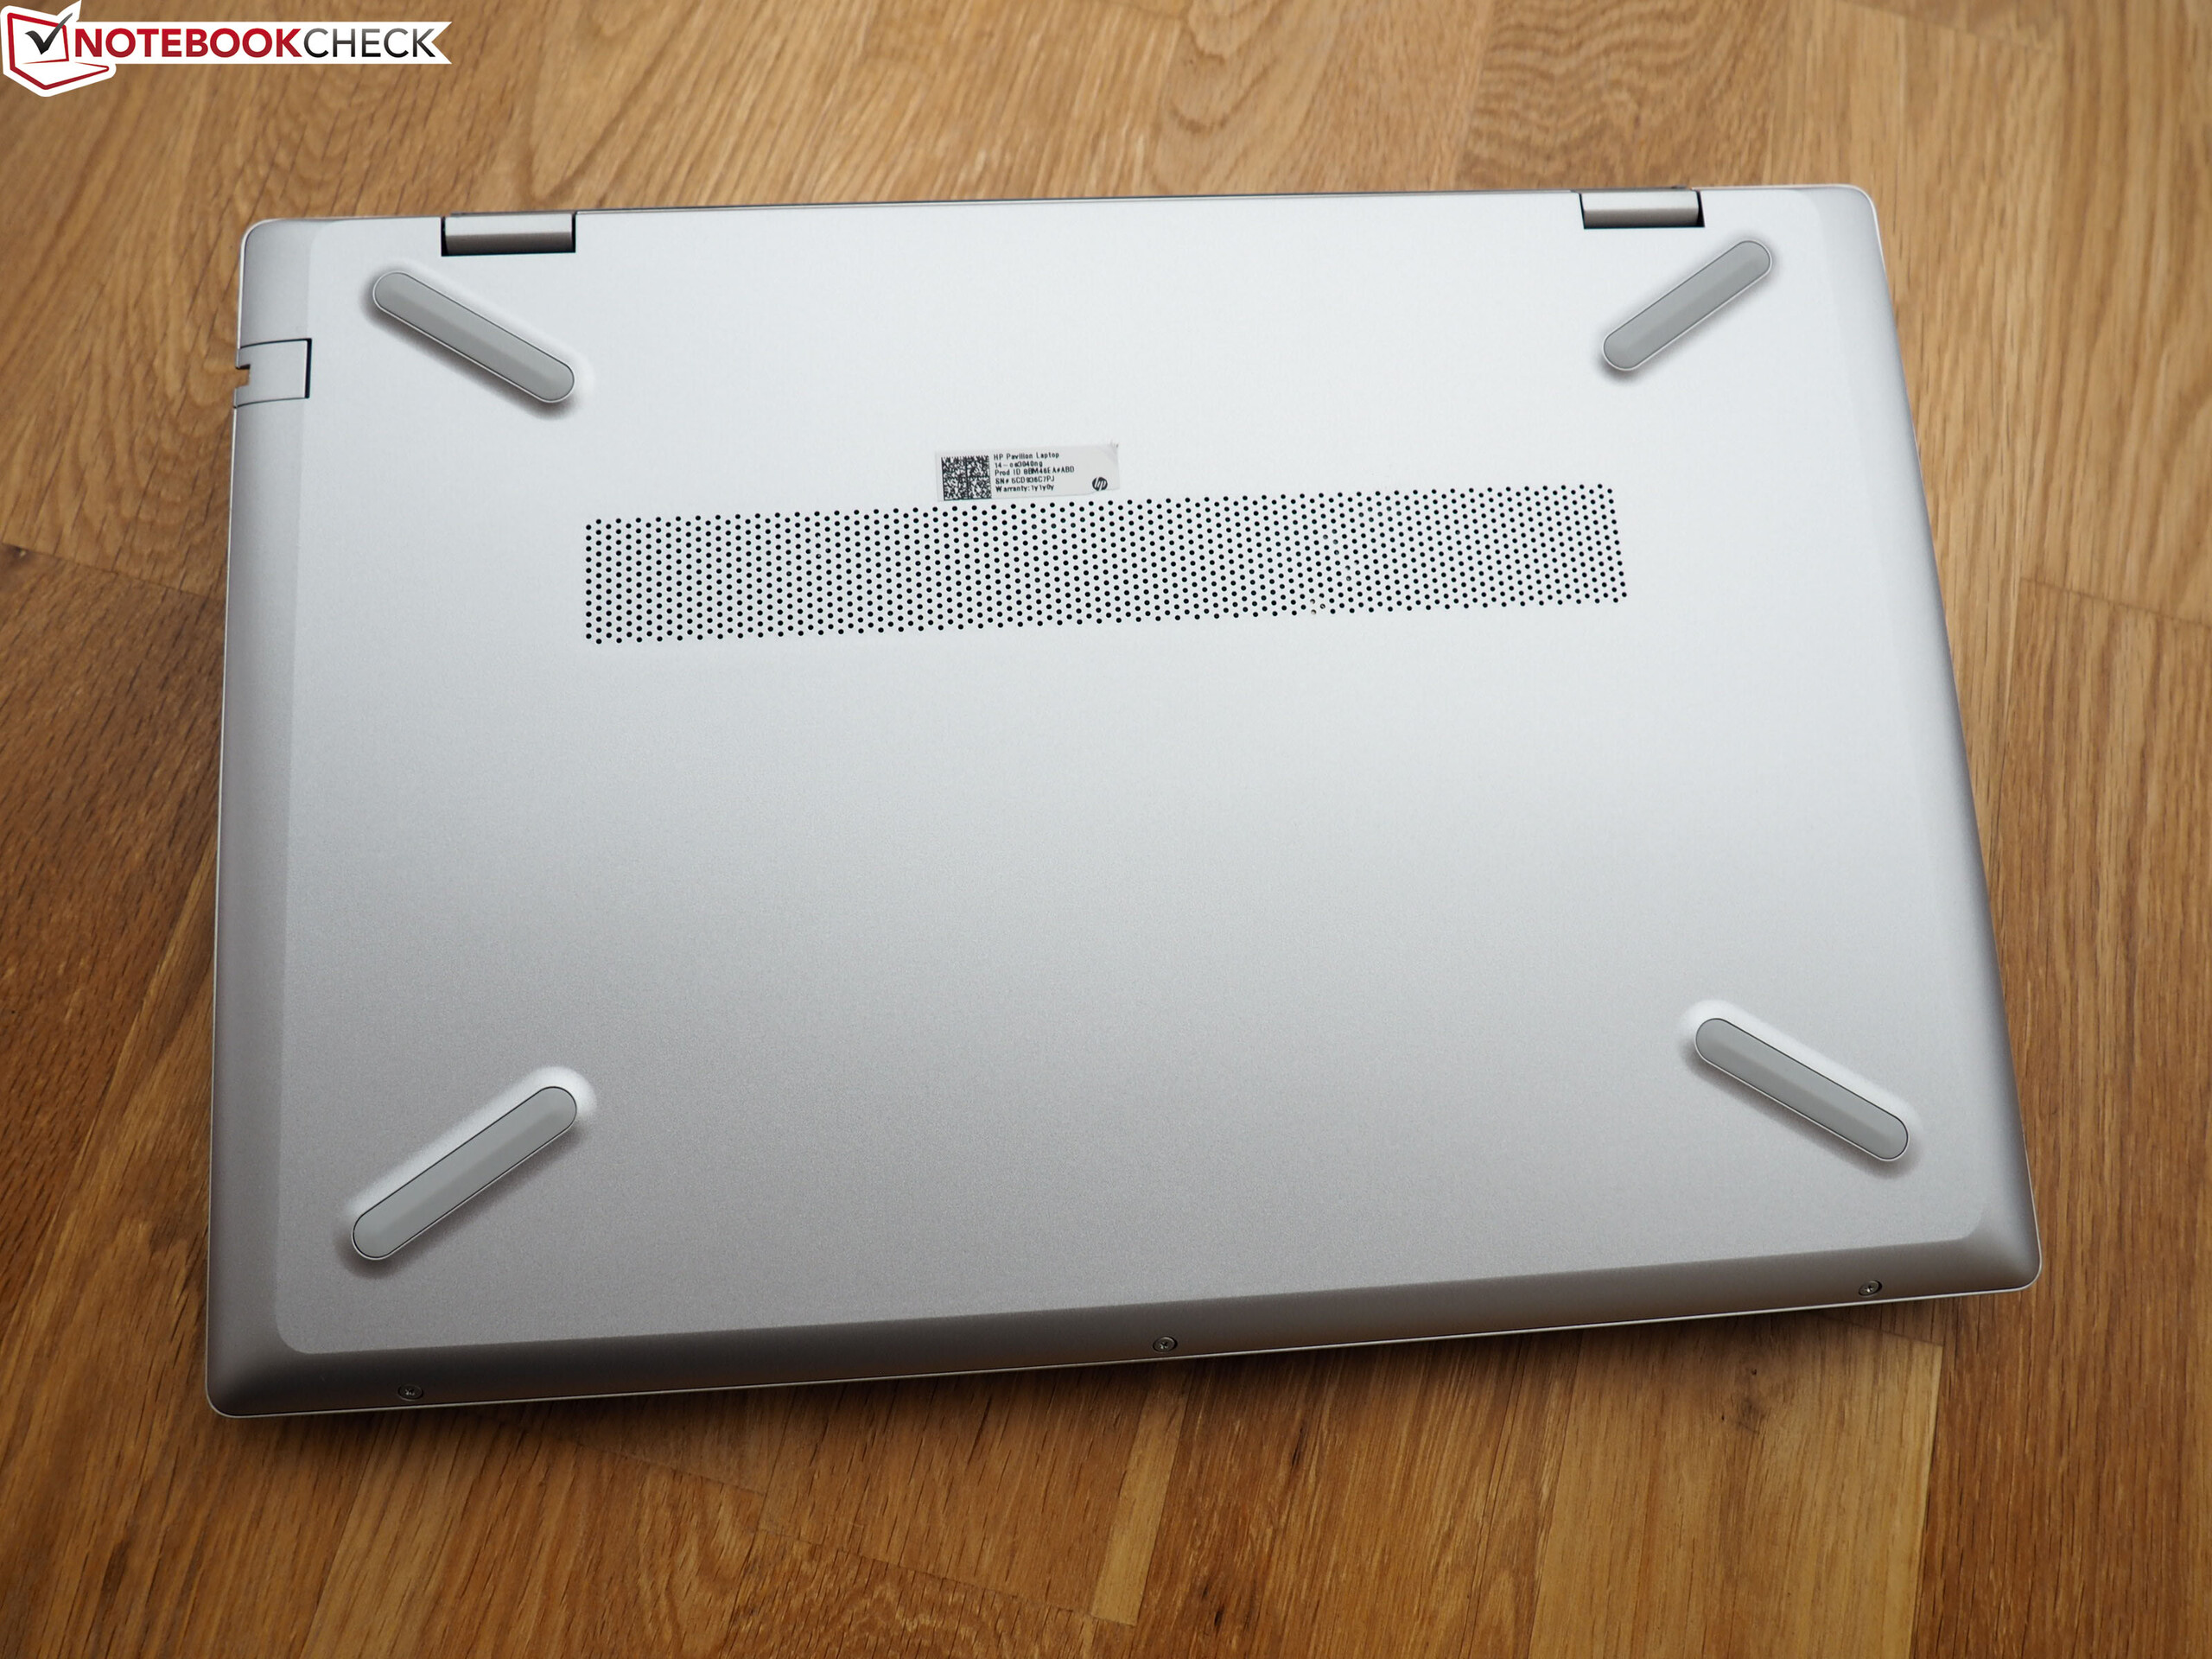
(-) Den maximala temperaturen på ovansidan är 47 °C / 117 F, jämfört med genomsnittet av 36.8 °C / 98 F , allt från 21 till 71 °C för klassen Multimedia.
(-) Botten värms upp till maximalt 47 °C / 117 F, jämfört med genomsnittet av 39.1 °C / 102 F
(+) Vid tomgångsbruk är medeltemperaturen för ovansidan 24 °C / 75 F, jämfört med enhetsgenomsnittet på 31.3 °C / ### class_avg_f### F.
(-) När du spelar The Witcher 3 är medeltemperaturen för ovansidan 38.6 °C / 101 F, jämfört med enhetsgenomsnittet på 31.3 °C / ## #class_avg_f### F.
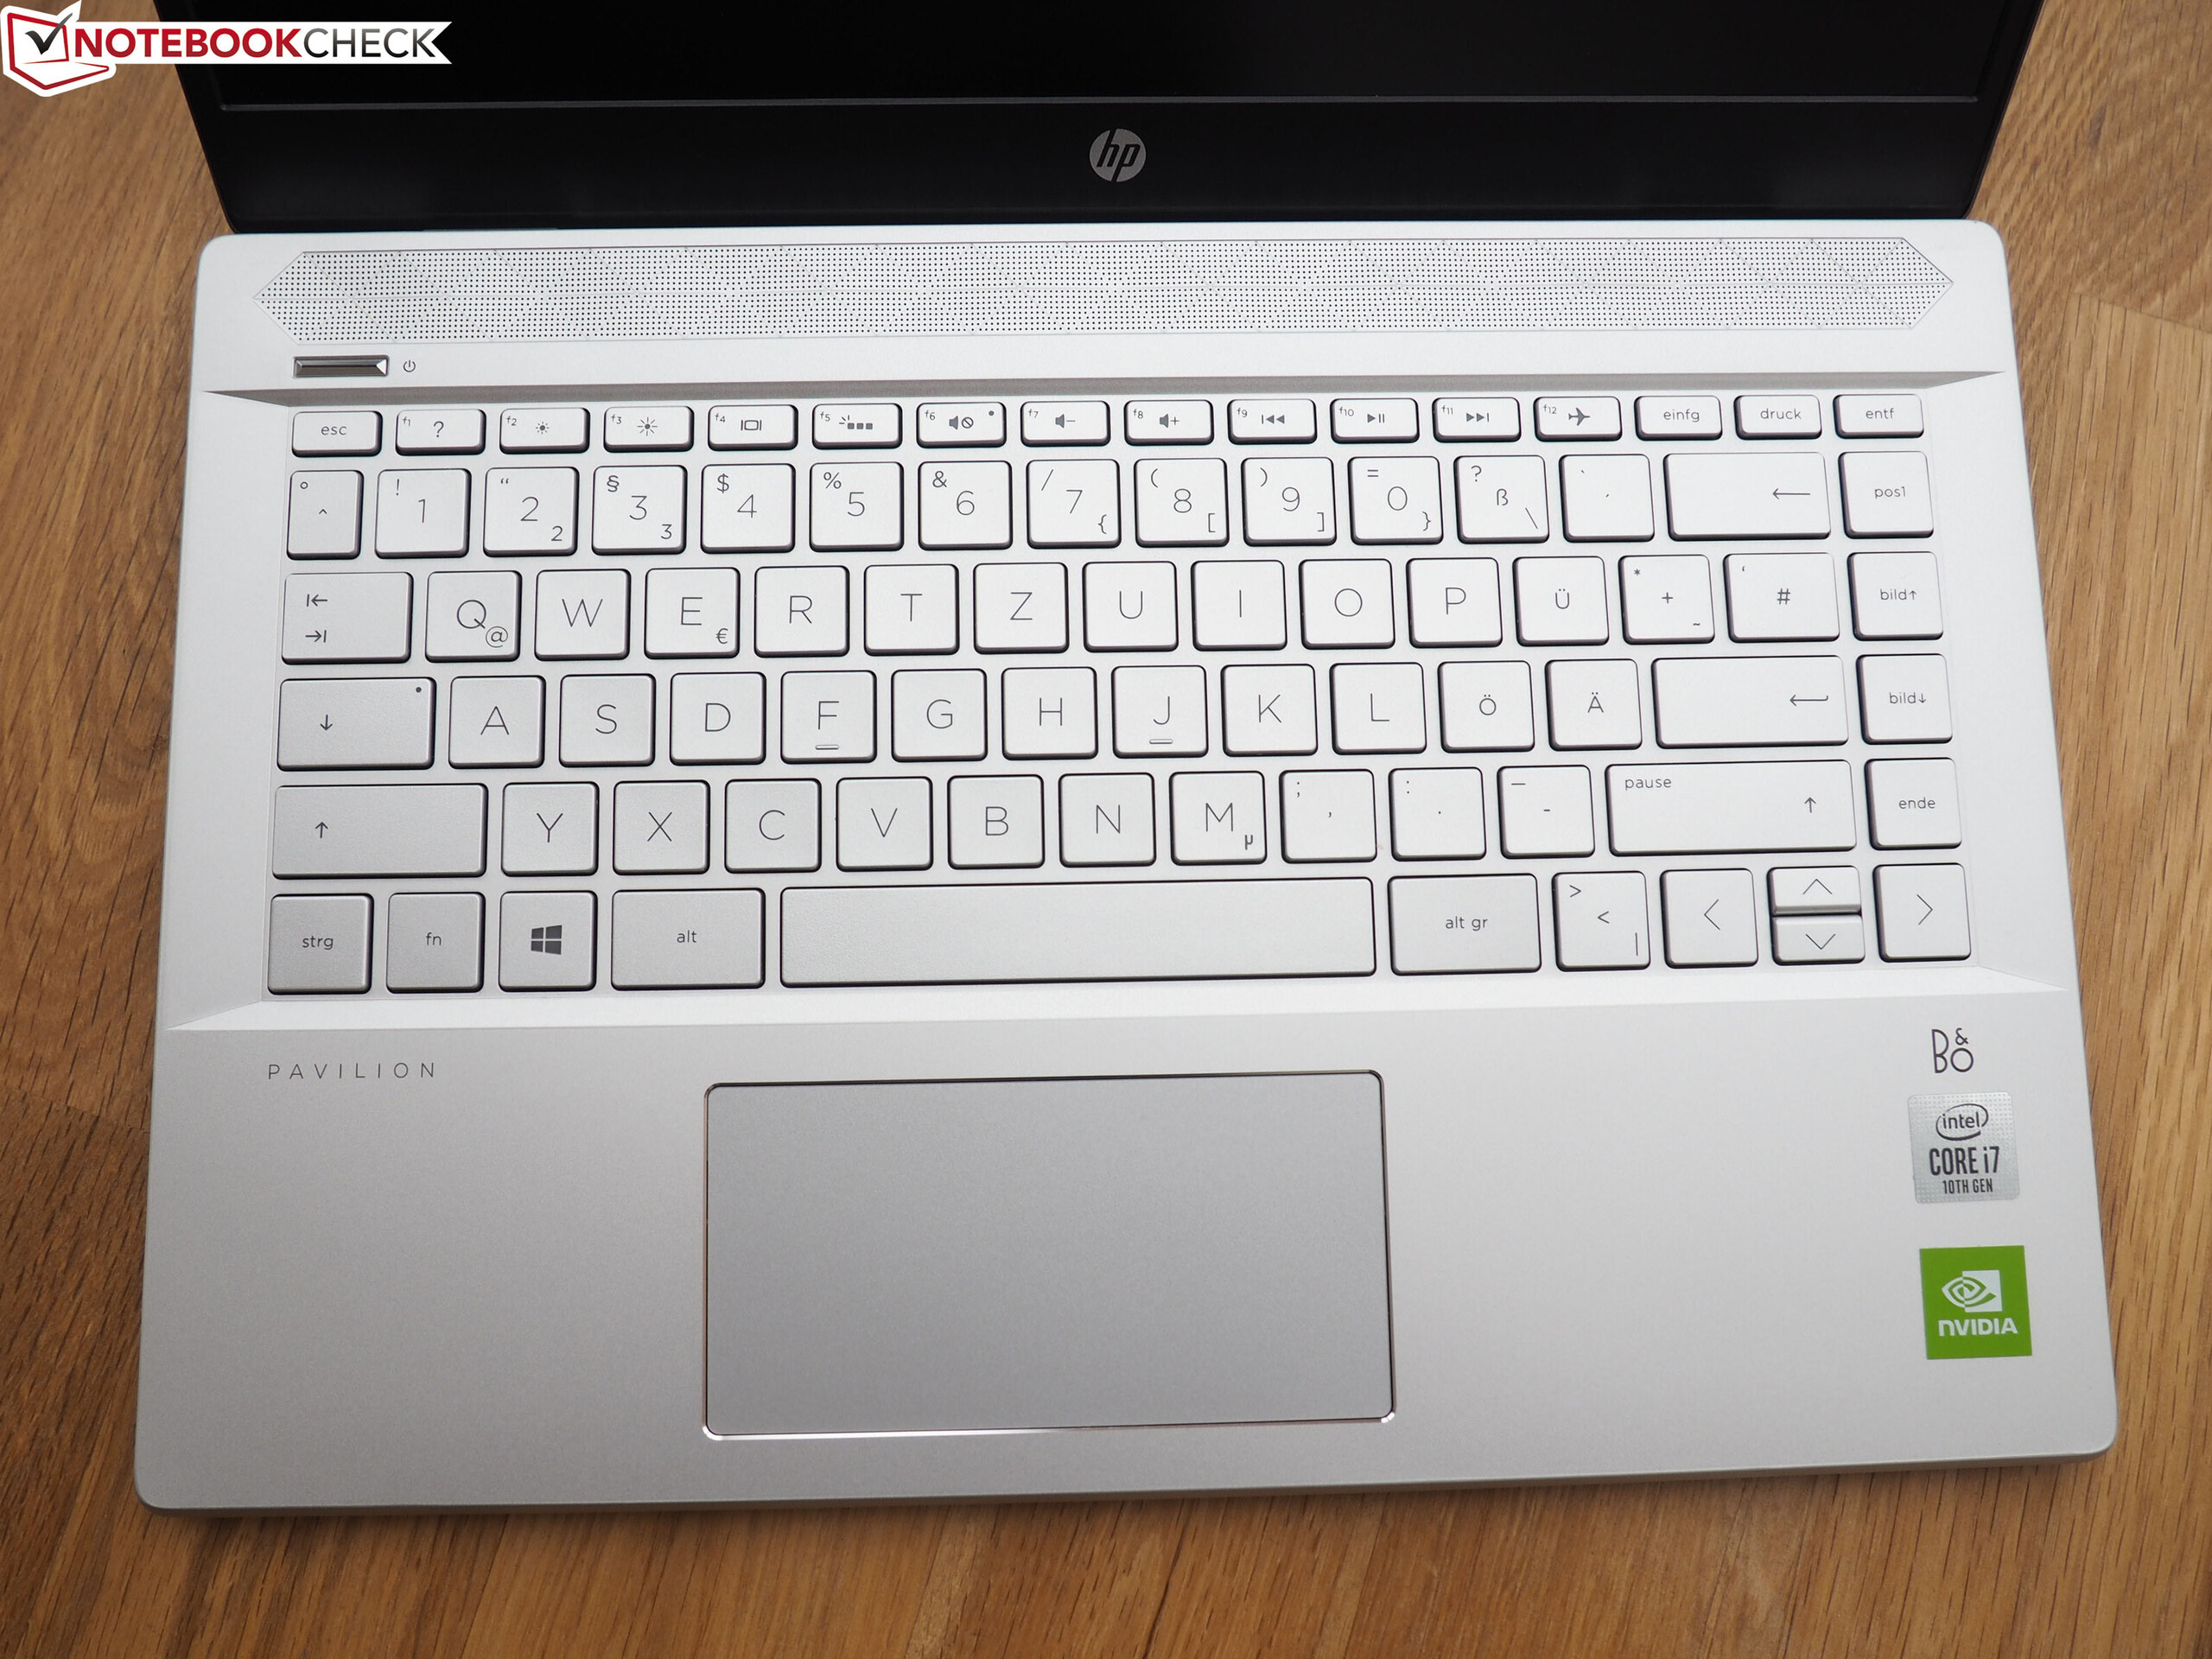
(+) Handledsstöden och pekplattan når maximal hudtemperatur (32 °C / 89.6 F) och är därför inte varma.
(-) Medeltemperaturen för handledsstödsområdet på liknande enheter var 28.7 °C / 83.7 F (-3.3 °C / -5.9 F).
| HP Pavilion 14-ce3040ng i7-1065G7, GeForce MX250 | Lenovo IdeaPad S540-14IWL i5-8265U, GeForce MX250 | Acer Aspire 5 A515-52G-723L i7-8565U, GeForce MX250 | Asus VivoBook S15 S532F i7-8565U, GeForce MX250 | Genomsnitt av klass Multimedia | |
|---|---|---|---|---|---|
| Heat | 5% | -15% | -6% | 1% | |
| Maximum Upper Side * (°C) | 47 | 41.8 11% | 53.7 -14% | 45.4 3% | 41.5 ? 12% |
| Maximum Bottom * (°C) | 47 | 43.3 8% | 56 -19% | 40.8 13% | 44.1 ? 6% |
| Idle Upper Side * (°C) | 25 | 25.1 -0% | 28.4 -14% | 29.6 -18% | 27.1 ? -8% |
| Idle Bottom * (°C) | 26 | 25.4 2% | 28.9 -11% | 31.2 -20% | 28 ? -8% |
* ... mindre är bättre
HP Pavilion 14-ce3040ng ljudanalys
(+) | högtalare kan spela relativt högt (85 dB)
Bas 100 - 315 Hz
(-) | nästan ingen bas - i genomsnitt 25.8% lägre än medianen
(±) | linjäriteten för basen är genomsnittlig (10.3% delta till föregående frekvens)
Mellan 400 - 2000 Hz
(+) | balanserad mellan - endast 2.9% från medianen
(+) | mids är linjära (6.8% delta till föregående frekvens)
Högsta 2 - 16 kHz
(+) | balanserade toppar - endast 3.9% från medianen
(+) | toppar är linjära (4.9% delta till föregående frekvens)
Totalt 100 - 16 000 Hz
(±) | linjäriteten för det totala ljudet är genomsnittlig (18.6% skillnad mot median)
Jämfört med samma klass
» 57% av alla testade enheter i den här klassen var bättre, 8% liknande, 35% sämre
» Den bästa hade ett delta på 5%, genomsnittet var 17%, sämst var 45%
Jämfört med alla testade enheter
» 42% av alla testade enheter var bättre, 8% liknande, 50% sämre
» Den bästa hade ett delta på 4%, genomsnittet var 24%, sämst var 134%
Lenovo IdeaPad S540-14IWL ljudanalys
(-) | inte särskilt höga högtalare (70.5 dB)
Bas 100 - 315 Hz
(±) | reducerad bas - i genomsnitt 10.7% lägre än medianen
(±) | linjäriteten för basen är genomsnittlig (12.7% delta till föregående frekvens)
Mellan 400 - 2000 Hz
(±) | högre mellan - i genomsnitt 5% högre än median
(±) | linjäriteten för mids är genomsnittlig (8.3% delta till föregående frekvens)
Högsta 2 - 16 kHz
(±) | reducerade toppar - i genomsnitt 5.5% lägre än medianen
(±) | linjäriteten för toppar är genomsnittlig (9.4% delta till föregående frekvens)
Totalt 100 - 16 000 Hz
(±) | linjäriteten för det totala ljudet är genomsnittlig (23% skillnad mot median)
Jämfört med samma klass
» 81% av alla testade enheter i den här klassen var bättre, 5% liknande, 14% sämre
» Den bästa hade ett delta på 5%, genomsnittet var 17%, sämst var 45%
Jämfört med alla testade enheter
» 69% av alla testade enheter var bättre, 5% liknande, 26% sämre
» Den bästa hade ett delta på 4%, genomsnittet var 24%, sämst var 134%
| Av/Standby | |
| Låg belastning | |
| Hög belastning |
|
Förklaring:
min: | |
| HP Pavilion 14-ce3040ng i7-1065G7, GeForce MX250 | Lenovo IdeaPad S540-14IWL i5-8265U, GeForce MX250 | Acer Aspire 5 A515-52G-723L i7-8565U, GeForce MX250 | Asus VivoBook S15 S532F i7-8565U, GeForce MX250 | Genomsnitt av klass Multimedia | |
|---|---|---|---|---|---|
| Power Consumption | 12% | 1% | -25% | -38% | |
| Idle Minimum * (Watt) | 4 | 2.74 31% | 4.4 -10% | 6 -50% | 5.71 ? -43% |
| Idle Average * (Watt) | 7 | 5.64 19% | 6.9 1% | 10.3 -47% | 10.1 ? -44% |
| Idle Maximum * (Watt) | 10 | 8.4 16% | 9.9 1% | 10.5 -5% | 12.4 ? -24% |
| Load Average * (Watt) | 62 | 61.3 1% | 55 11% | 69.1 -11% | 65 ? -5% |
| Witcher 3 ultra * (Watt) | 58 | 49.2 15% | 57.8 -0% | ||
| Load Maximum * (Watt) | 64 | 69.4 -8% | 63.4 1% | 88 -38% | 112.2 ? -75% |
* ... mindre är bättre
| HP Pavilion 14-ce3040ng i7-1065G7, GeForce MX250, 41 Wh | Lenovo IdeaPad S540-14IWL i5-8265U, GeForce MX250, 48 Wh | Acer Aspire 5 A515-52G-723L i7-8565U, GeForce MX250, 48 Wh | Asus VivoBook S15 S532F i7-8565U, GeForce MX250, 42 Wh | Genomsnitt av klass Multimedia | |
|---|---|---|---|---|---|
| Batteridrifttid | 49% | 30% | -2% | 85% | |
| Reader / Idle (h) | 11.6 | 21.4 84% | 12.9 11% | 10.9 -6% | 25.2 ? 117% |
| WiFi v1.3 (h) | 6.1 | 8.4 38% | 6.9 13% | 5.1 -16% | 12 ? 97% |
| Load (h) | 1.2 | 1.5 25% | 2 67% | 1.4 17% | 1.675 ? 40% |
| H.264 (h) | 8.3 | 6.5 | 16.4 ? |
För
Emot
Läs den fullständiga versionen av den här recensionen på engelska här.
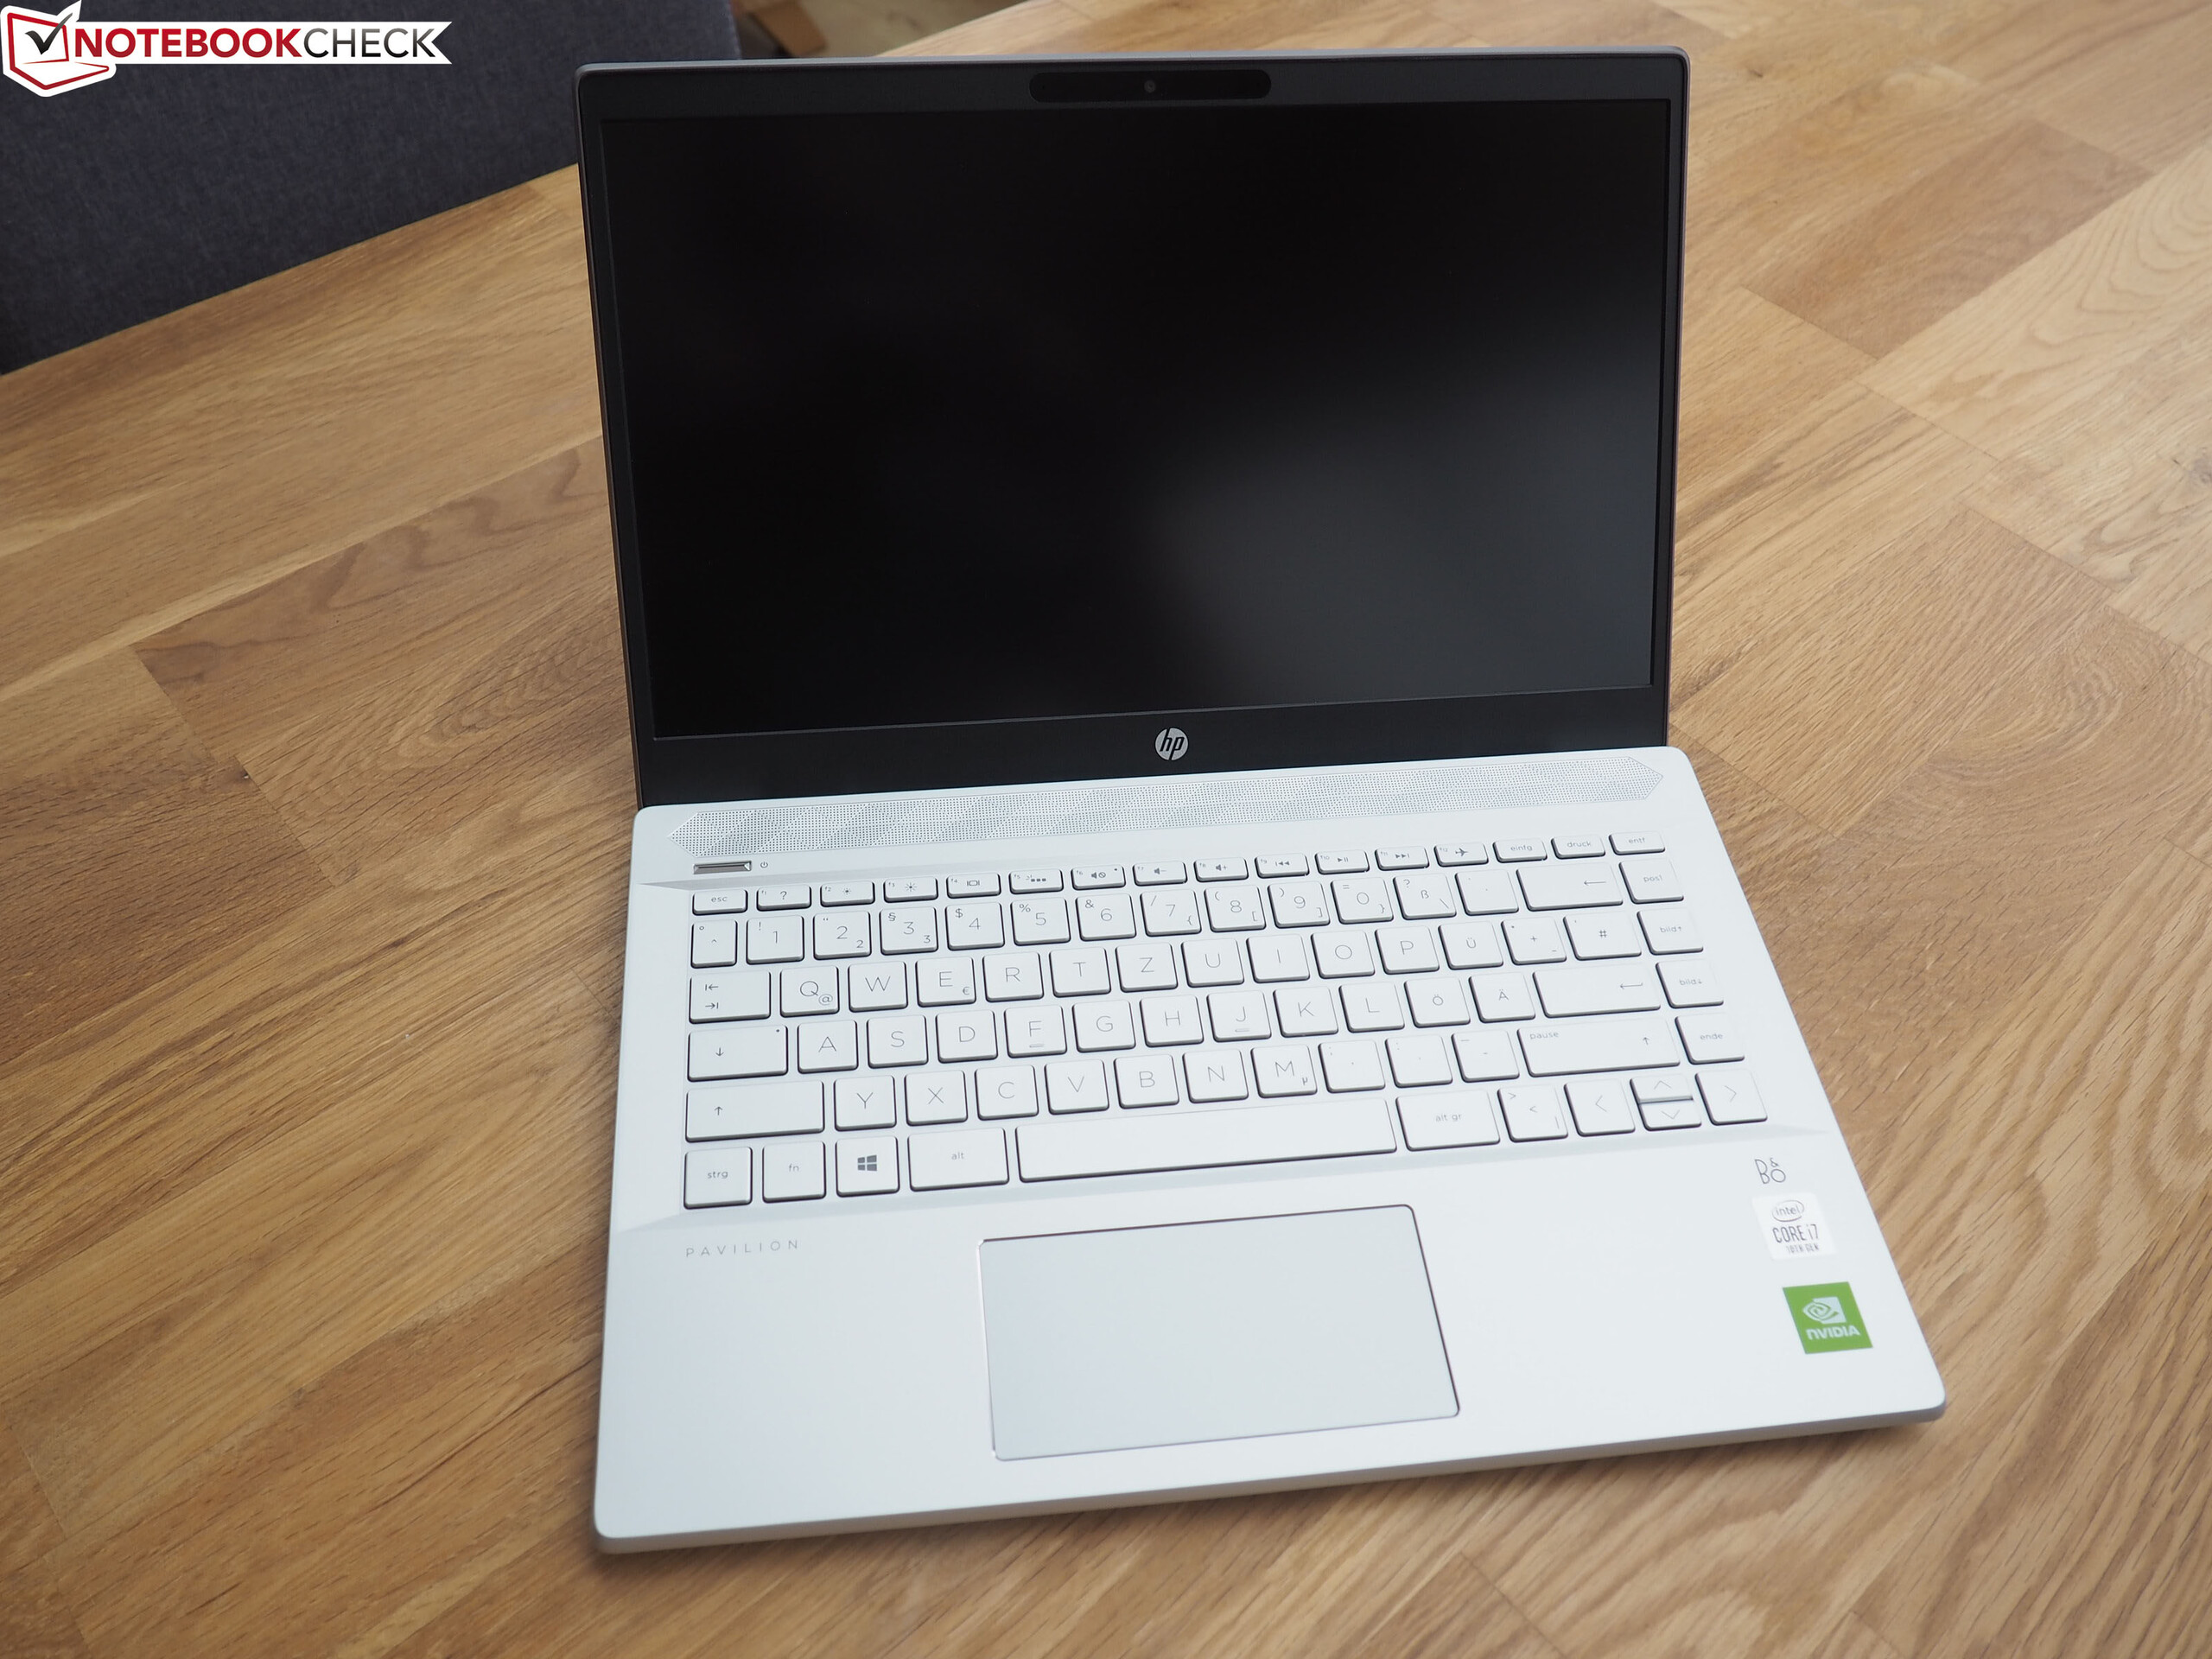
Vid en snabb titt lämnar Pavilion 14-ce3040ng ett ganska bra intryck.
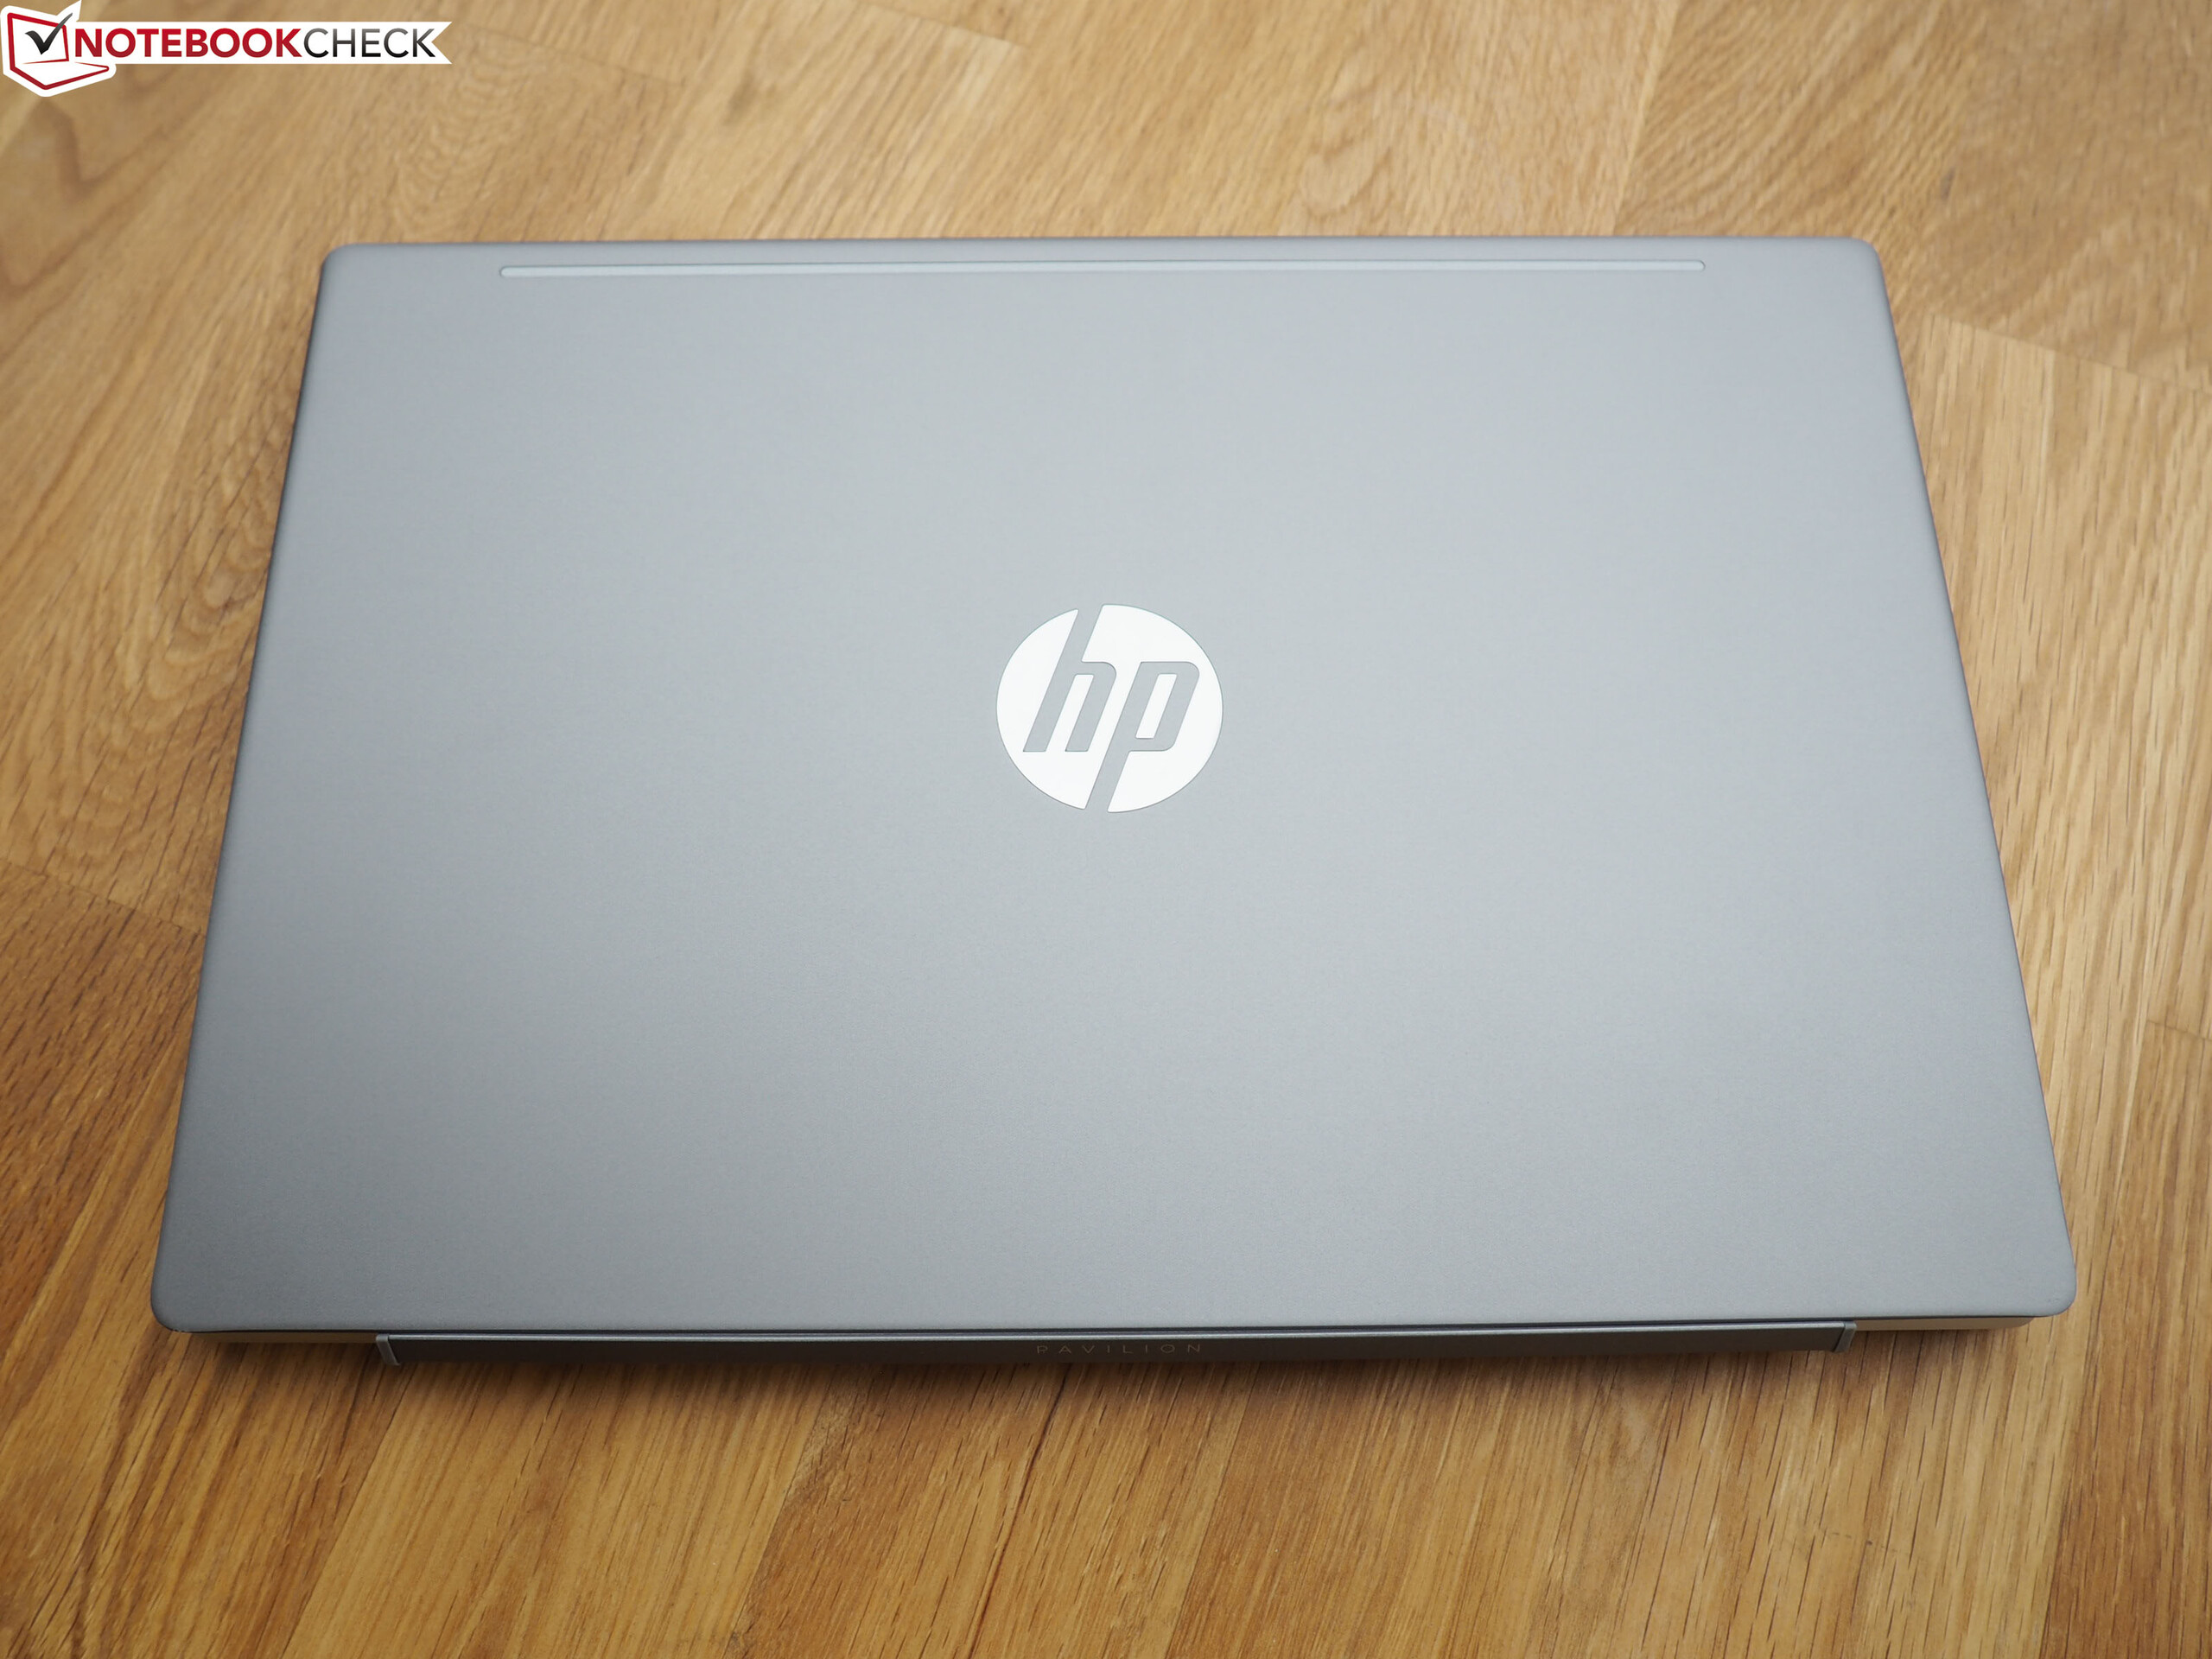
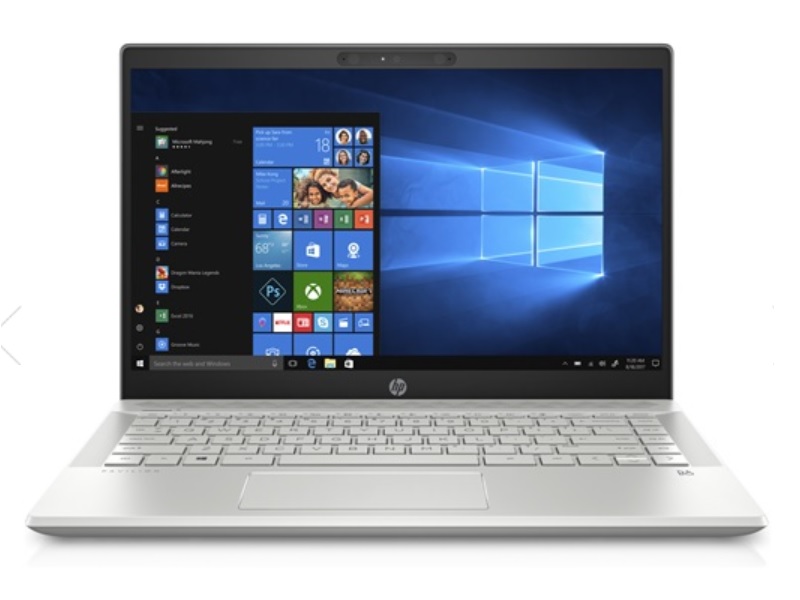
Den tjusiga designen, som till viss del består av aluminium, imponerade på oss med låg vikt och kompakta dimensioner. Detta gör enheten särskilt bra för den som reser ofta.
En ljusstark och kontrastrik skärm är ytterligare ett säljargument och får denna 14-tummare att stå ut från sina konkurrenter. Men å andra sidan är inmatningsenheterna, anslutningsmöjligheterna och batteritiden bara bra nog för en mittenplacering.
HP har dock gjort ett avgörande misstag med fläktkurvan. Fläkten uppnår 40 dB(A) redan vid tomgång och nästan 50 dB(A) vid belastning. Som det är nu rekommenderar vi att du letar någon annanstans om du lätt blir irriterad av högljudda fläktar.
HP Pavilion 14-ce3040ng
- 05/14/2020 v7 (old)
Florian Glaser
Price comparison