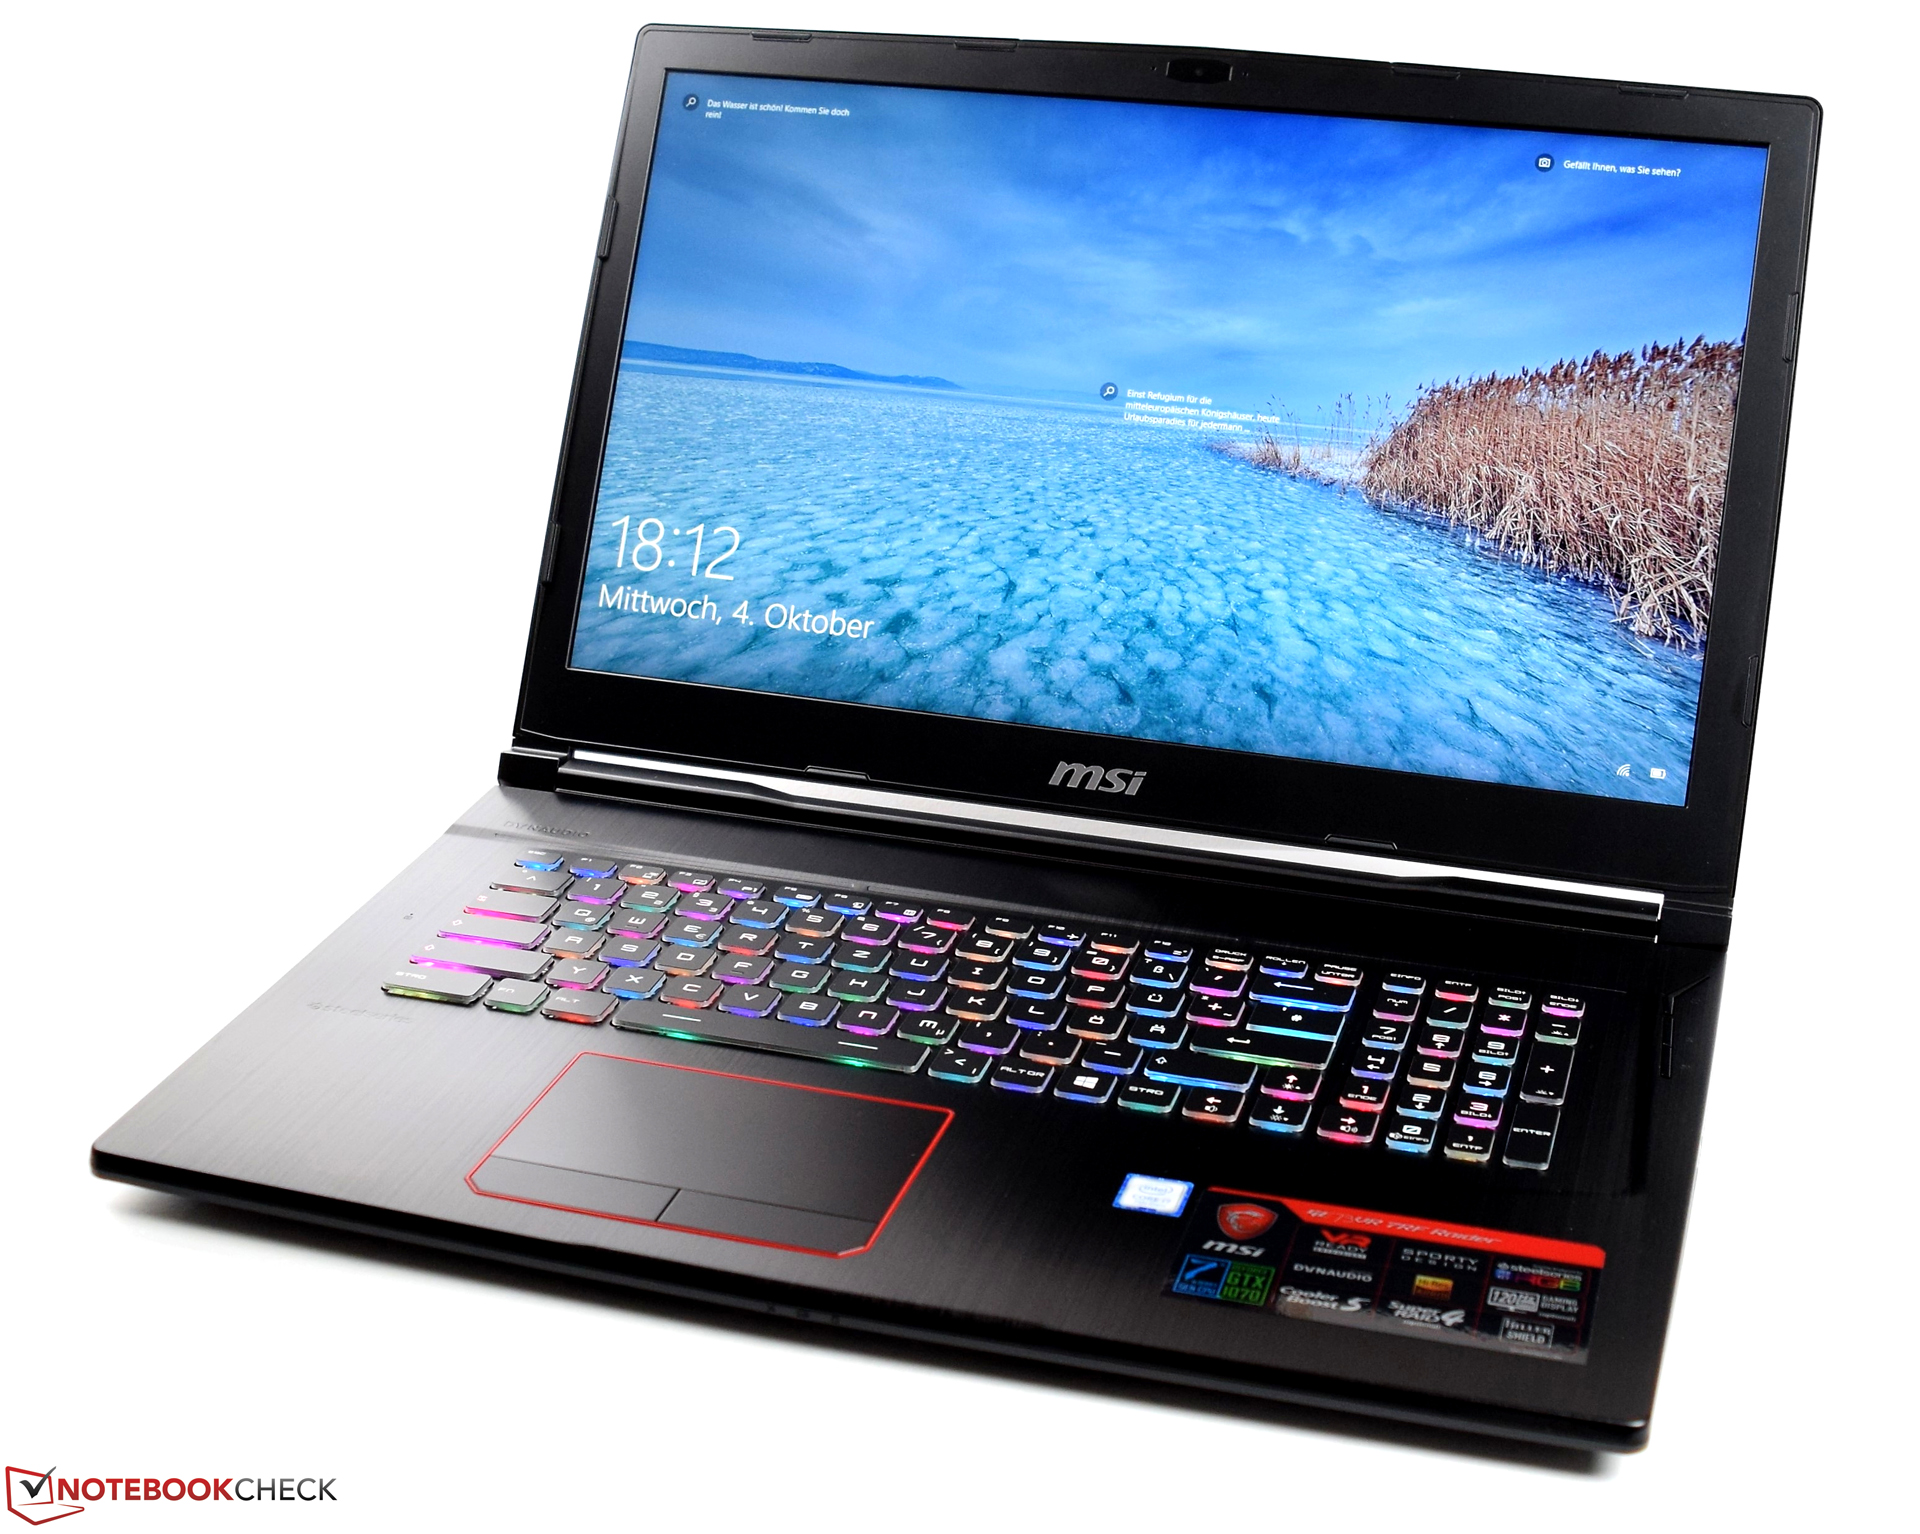
Test: MSI GE73VR 7RF Raider (i7-7700HQ, GTX 1070, Full HD) Laptop (Sammanfattning)
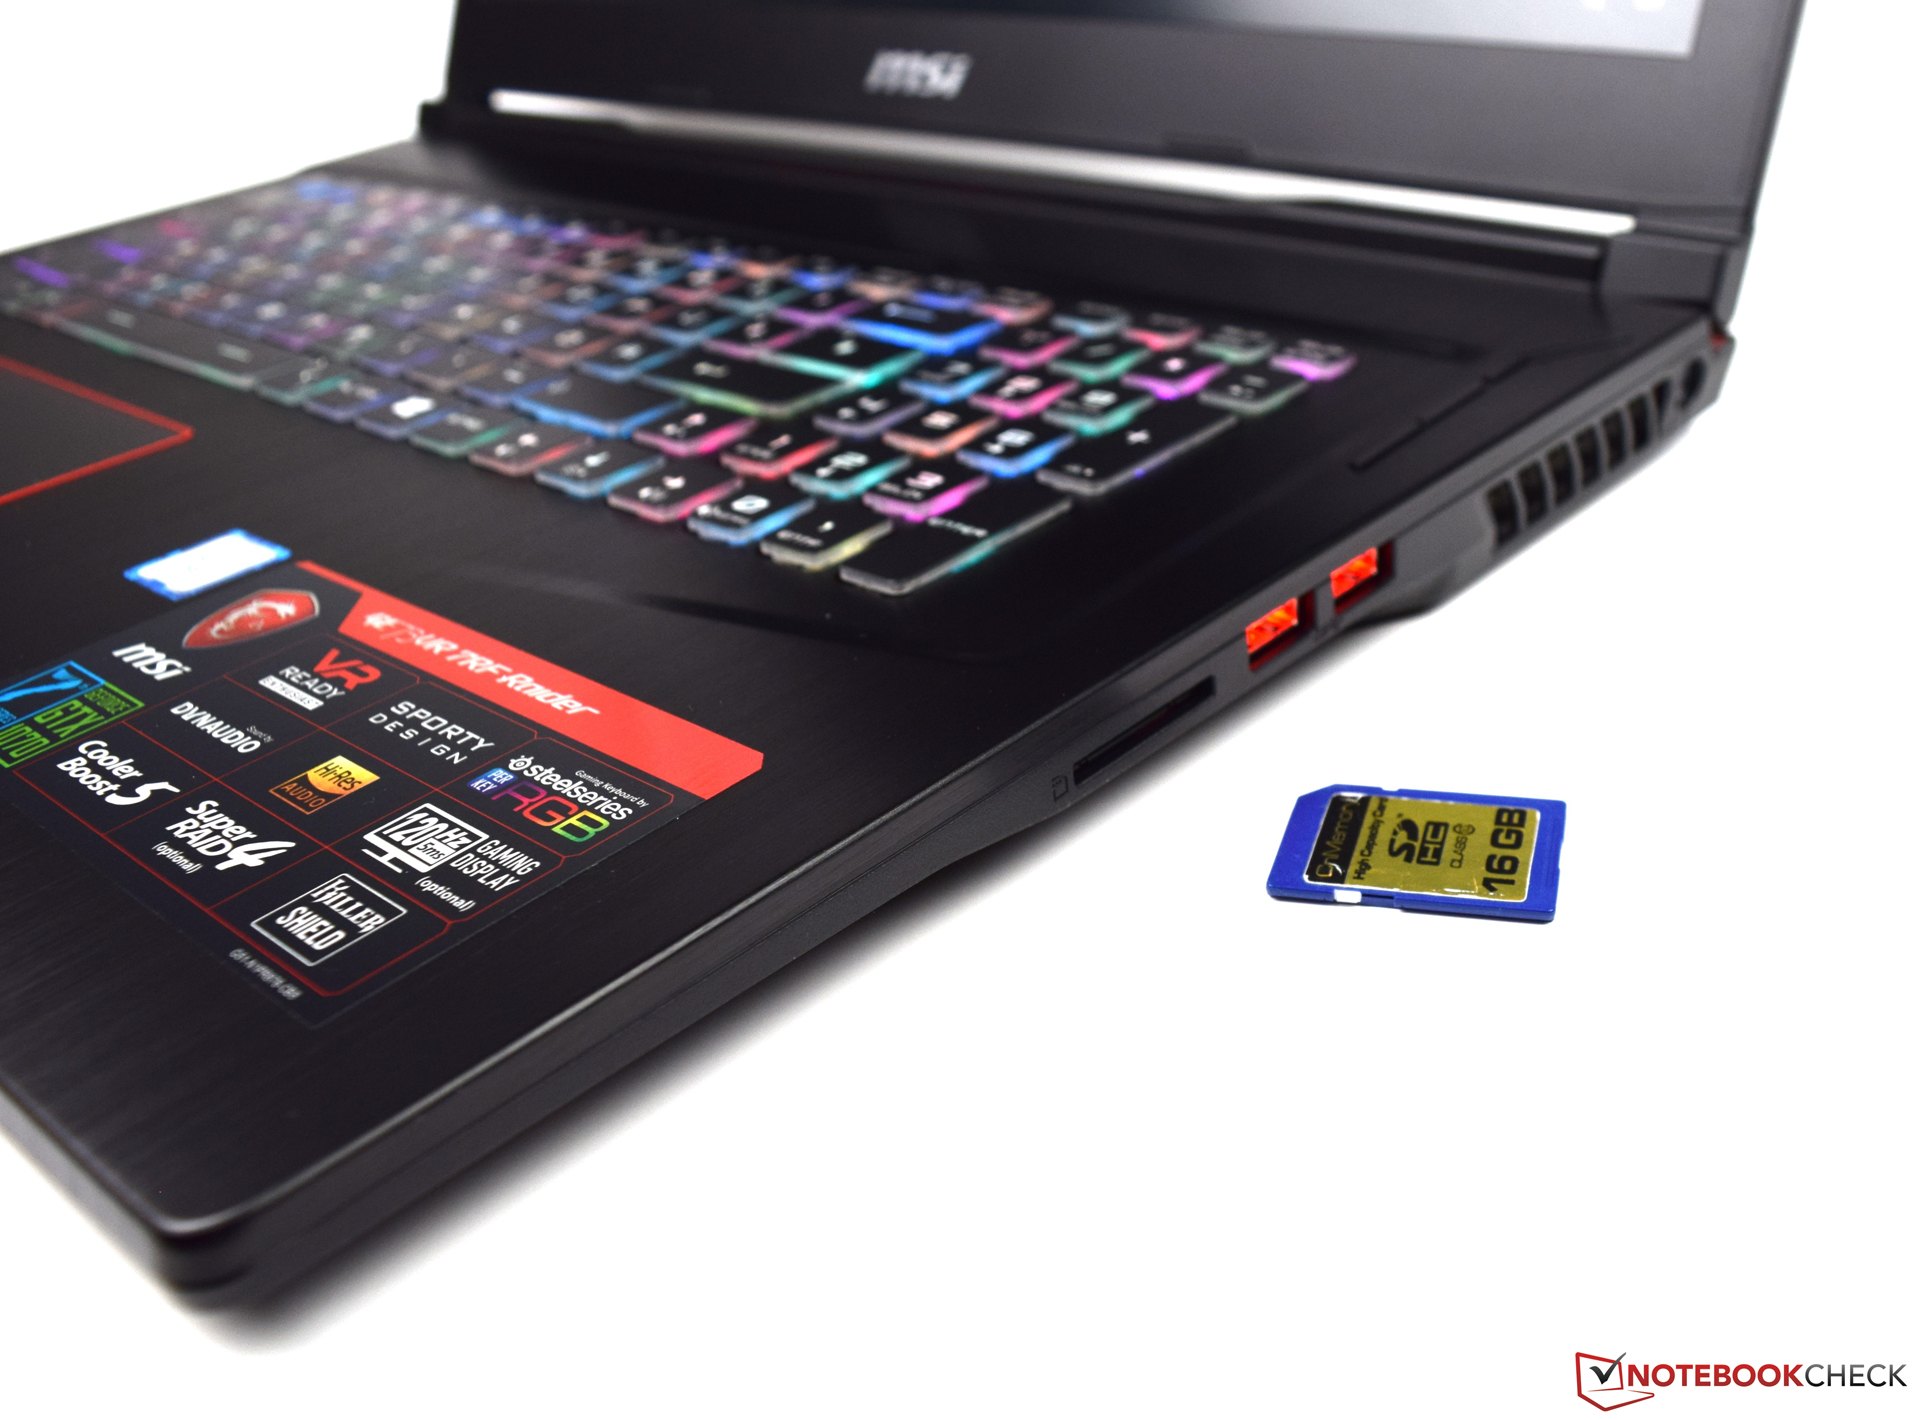
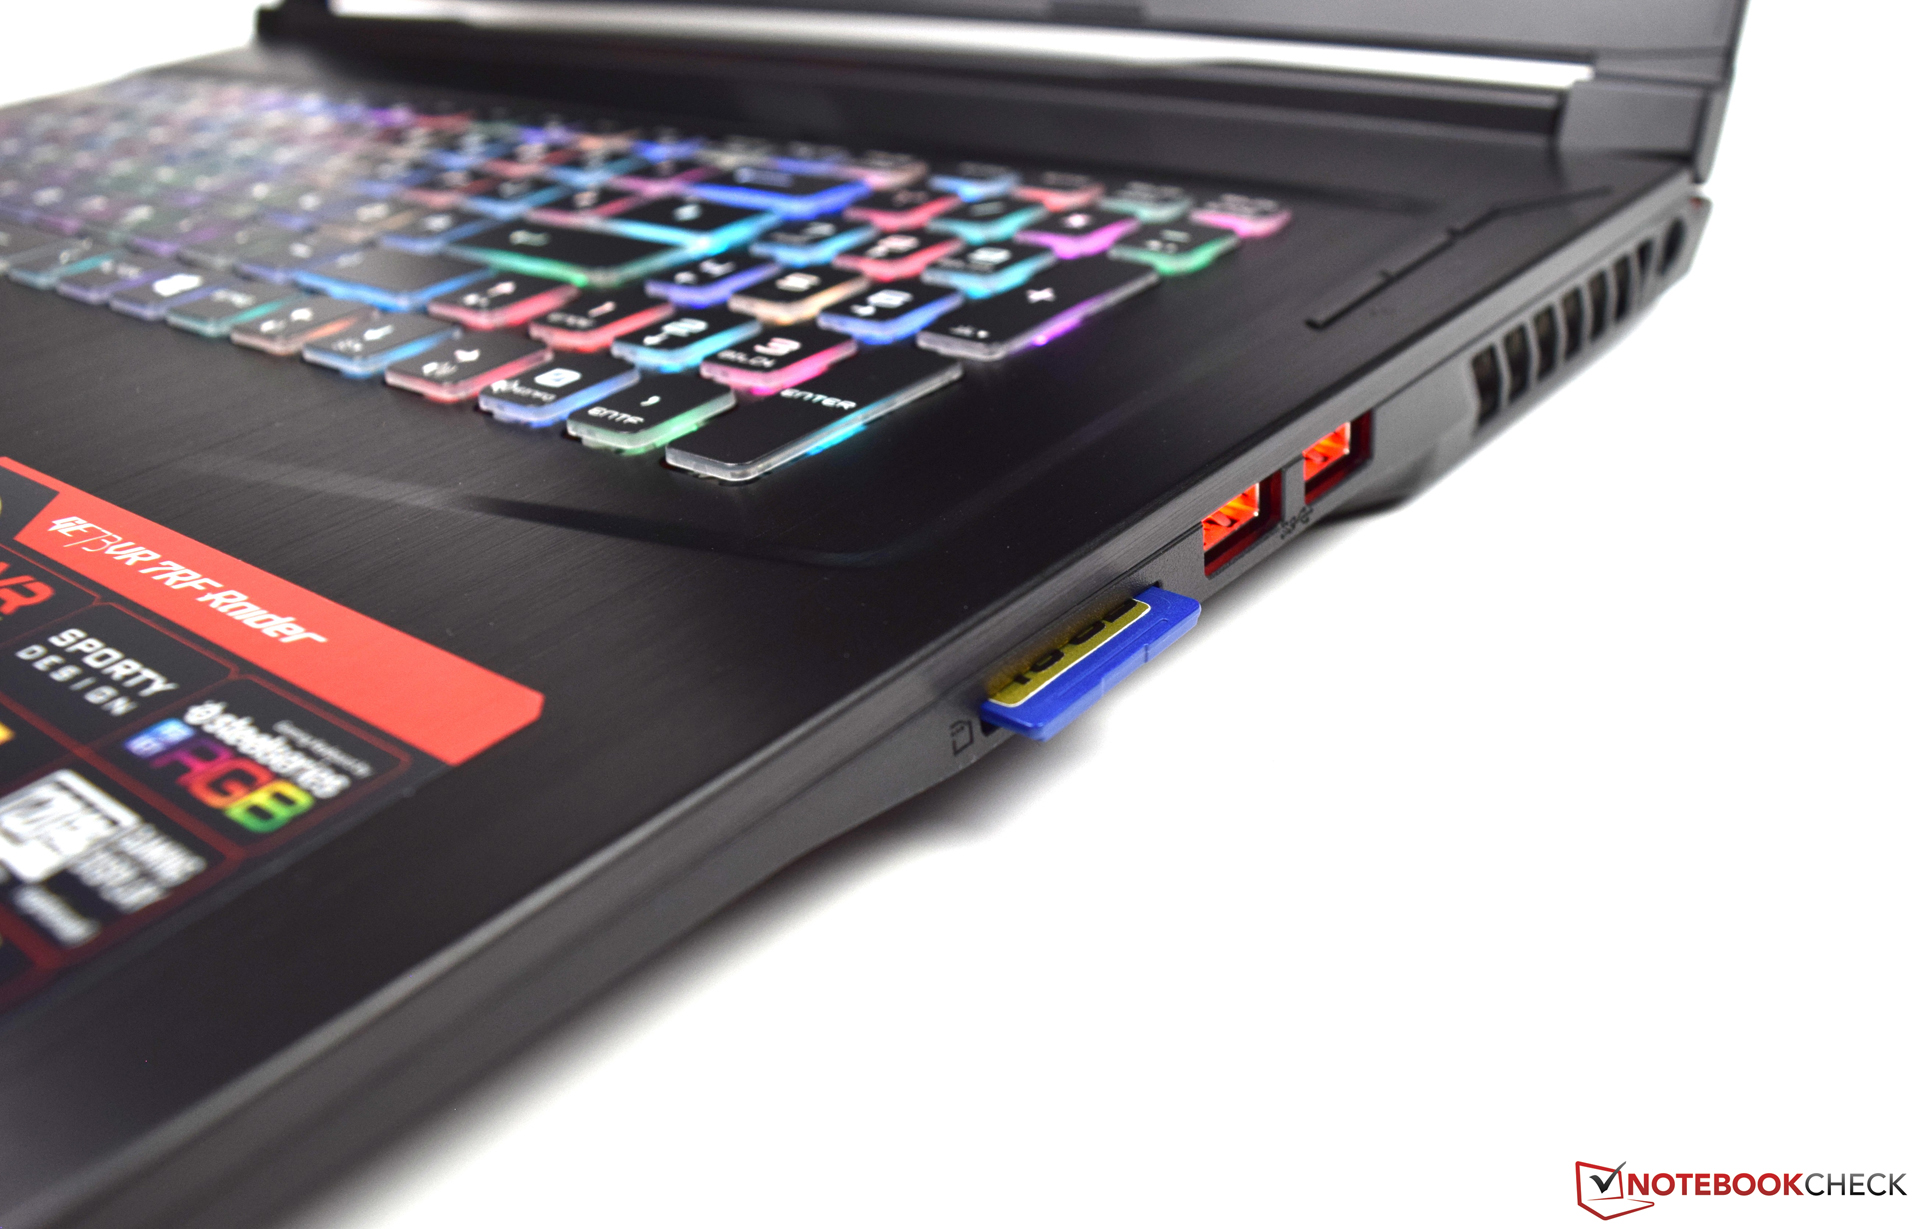
| SD Card Reader | |
| average JPG Copy Test (av. of 3 runs) | |
| MSI GE73VR 7RF Raider (Toshiba Exceria Pro SDXC 64 GB UHS-II) | |
| MSI GT72VR 7RE-433 (Toshiba Exceria Pro SDXC 64 GB UHS-II) | |
| Acer Predator 17 G9-793-70PJ (Toshiba Exceria Pro SDXC 64 GB UHS-II) | |
| Gigabyte P57X v7 (Toshiba Exceria Pro SDXC 64 GB UHS-II) | |
| Asus G752VS-BA338T (Toshiba Exceria Pro SDXC 64 GB UHS-II) | |
| HP Omen 17-an014ng (Toshiba Exceria Pro SDXC 64 GB UHS-II) | |
| maximum AS SSD Seq Read Test (1GB) | |
| MSI GT72VR 7RE-433 (Toshiba Exceria Pro SDXC 64 GB UHS-II) | |
| MSI GE73VR 7RF Raider (Toshiba Exceria Pro SDXC 64 GB UHS-II) | |
| Gigabyte P57X v7 (Toshiba Exceria Pro SDXC 64 GB UHS-II) | |
| Acer Predator 17 G9-793-70PJ (Toshiba Exceria Pro SDXC 64 GB UHS-II) | |
| Asus G752VS-BA338T (Toshiba Exceria Pro SDXC 64 GB UHS-II) | |
| HP Omen 17-an014ng (Toshiba Exceria Pro SDXC 64 GB UHS-II) | |
| |||||||||||||||||||||||||
Distribution av ljusstyrkan: 90 %
Mitt på batteriet: 296 cd/m²
Kontrast: 1410:1 (Svärta: 0.21 cd/m²)
ΔE ColorChecker Calman: 3.09 | ∀{0.5-29.43 Ø4.71}
ΔE Greyscale Calman: 3.06 | ∀{0.09-98 Ø4.96}
100% sRGB (Argyll 1.6.3 3D)
75% AdobeRGB 1998 (Argyll 1.6.3 3D)
84.8% AdobeRGB 1998 (Argyll 3D)
99.9% sRGB (Argyll 3D)
90.5% Display P3 (Argyll 3D)
Gamma: 2.19
CCT: 7315 K
| MSI GE73VR 7RF Raider Chi Mei N173HHE-G32 (CMN1747), 1920x1080, 17.3" | HP Omen 17-an014ng AUO149D, 1920x1080, 17.3" | Asus G752VS-BA338T AU Optronics B173HAN01.1 (AUO119D), 1920x1080, 17.3" | Gigabyte P57X v7 SHP145E, 3840x2160, 17.3" | Acer Predator 17 G9-793-70PJ AU Optronics B173ZAN01.0 (AUO109B), 3840x2160, 17.3" | MSI GT72VR 7RE-433 Chi Mei N173HHE-G32 (CMN1747), 1920x1080, 17.3" | |
|---|---|---|---|---|---|---|
| Display | -19% | -23% | 5% | 4% | -21% | |
| Display P3 Coverage (%) | 90.5 | 64.6 -29% | 61.6 -32% | 87.8 -3% | 86.4 -5% | 68.3 -25% |
| sRGB Coverage (%) | 99.9 | 92.9 -7% | 90.3 -10% | 100 0% | 99.9 0% | 86.7 -13% |
| AdobeRGB 1998 Coverage (%) | 84.8 | 66.1 -22% | 62.8 -26% | 98.9 17% | 99.1 17% | 63.4 -25% |
| Response Times | -92% | -60% | -171% | -83% | 24% | |
| Response Time Grey 50% / Grey 80% * (ms) | 28.8 ? | 45.2 ? -57% | 36 ? -25% | 55.6 ? -93% | 50 ? -74% | 29 ? -1% |
| Response Time Black / White * (ms) | 13.4 ? | 30.4 ? -127% | 26 ? -94% | 46.8 ? -249% | 25.6 ? -91% | 7 ? 48% |
| PWM Frequency (Hz) | 26000 ? | 1000 ? | ||||
| Screen | -13% | -41% | -20% | -10% | -64% | |
| Brightness middle (cd/m²) | 296 | 314 6% | 307 4% | 441.3 49% | 343 16% | 299 1% |
| Brightness (cd/m²) | 279 | 309 11% | 300 8% | 408 46% | 328 18% | 277 -1% |
| Brightness Distribution (%) | 90 | 88 -2% | 88 -2% | 86 -4% | 84 -7% | 87 -3% |
| Black Level * (cd/m²) | 0.21 | 0.34 -62% | 0.32 -52% | 0.44 -110% | 0.29 -38% | 0.27 -29% |
| Contrast (:1) | 1410 | 924 -34% | 959 -32% | 1003 -29% | 1183 -16% | 1107 -21% |
| Colorchecker dE 2000 * | 3.09 | 3.19 -3% | 5.53 -79% | 5.1 -65% | 4.01 -30% | 9.65 -212% |
| Colorchecker dE 2000 max. * | 5.97 | 6.1 -2% | 11.54 -93% | 9.8 -64% | 6.03 -1% | 15.43 -158% |
| Greyscale dE 2000 * | 3.06 | 3.49 -14% | 7 -129% | 4.3 -41% | 4.7 -54% | 9.68 -216% |
| Gamma | 2.19 100% | 2.34 94% | 2.48 89% | 2.08 106% | 2.4 92% | 1.89 116% |
| CCT | 7315 89% | 7261 90% | 8103 80% | 7345 88% | 6451 101% | 11652 56% |
| Color Space (Percent of AdobeRGB 1998) (%) | 75 | 60 -20% | 58 -23% | 87 16% | 88 17% | 75 0% |
| Color Space (Percent of sRGB) (%) | 100 | 93 -7% | 90 -10% | 100 0% | 100 0% | 100 0% |
| Totalt genomsnitt (program/inställningar) | -41% /
-25% | -41% /
-40% | -62% /
-35% | -30% /
-17% | -20% /
-44% |
* ... mindre är bättre
Visa svarstider
| ↔ Svarstid svart till vitt | ||
|---|---|---|
| 13.4 ms ... stiga ↗ och falla ↘ kombinerat | ↗ 11.4 ms stiga | 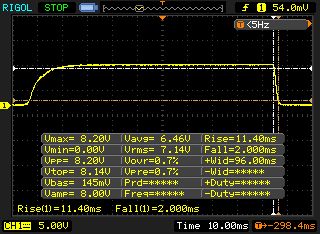 |
| ↘ 2 ms hösten | ||
| Skärmen visar bra svarsfrekvens i våra tester, men kan vara för långsam för konkurrenskraftiga spelare. I jämförelse sträcker sig alla testade enheter från 0.1 (minst) till 240 (maximalt) ms. » 34 % av alla enheter är bättre. Det betyder att den uppmätta svarstiden är bättre än genomsnittet av alla testade enheter (19.8 ms). | ||
| ↔ Svarstid 50 % grått till 80 % grått | ||
| 28.8 ms ... stiga ↗ och falla ↘ kombinerat | ↗ 16.8 ms stiga | 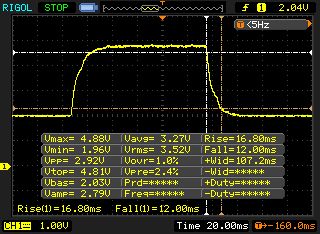 |
| ↘ 12 ms hösten | ||
| Skärmen visar relativt långsamma svarsfrekvenser i våra tester och kan vara för långsam för spelare. I jämförelse sträcker sig alla testade enheter från 0.165 (minst) till 636 (maximalt) ms. » 39 % av alla enheter är bättre. Det betyder att den uppmätta svarstiden liknar genomsnittet av alla testade enheter (31 ms). | ||
Skärmflimmer / PWM (Puls-Width Modulation)
| Skärmflimmer / PWM upptäckt | 26000 Hz | ≤ 15 % ljusstyrka inställning | 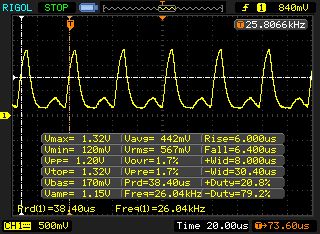 |
Displayens bakgrundsbelysning flimrar vid 26000 Hz (i värsta fall, t.ex. med PWM) Flimrande upptäckt vid en ljusstyrkeinställning på 15 % och lägre. Det ska inte finnas något flimmer eller PWM över denna ljusstyrkeinställning. Frekvensen för 26000 Hz är ganska hög, så de flesta användare som är känsliga för PWM bör inte märka något flimmer. Som jämförelse: 52 % av alla testade enheter använder inte PWM för att dämpa skärmen. Om PWM upptäcktes mättes ett medelvärde av 7757 (minst: 5 - maximum: 343500) Hz. | |||
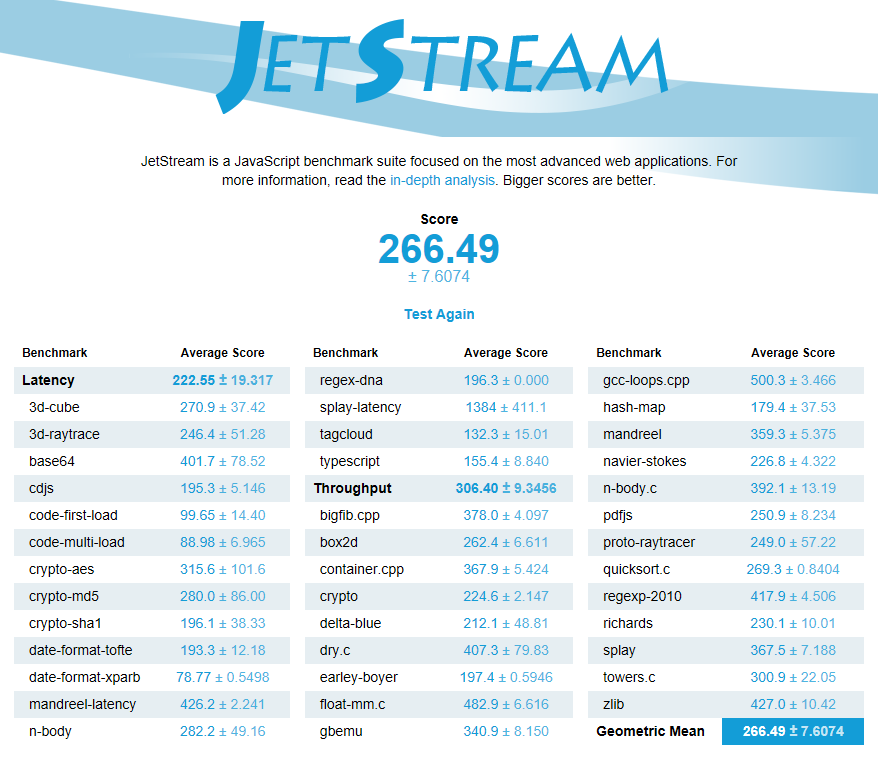
| JetStream 1.1 - 1.1 Total | |
| Asus G752VS-BA338T | |
| MSI GE73VR 7RF Raider | |
| MSI GT72VR 7RE-433 | |
| HP Omen 17-an014ng | |
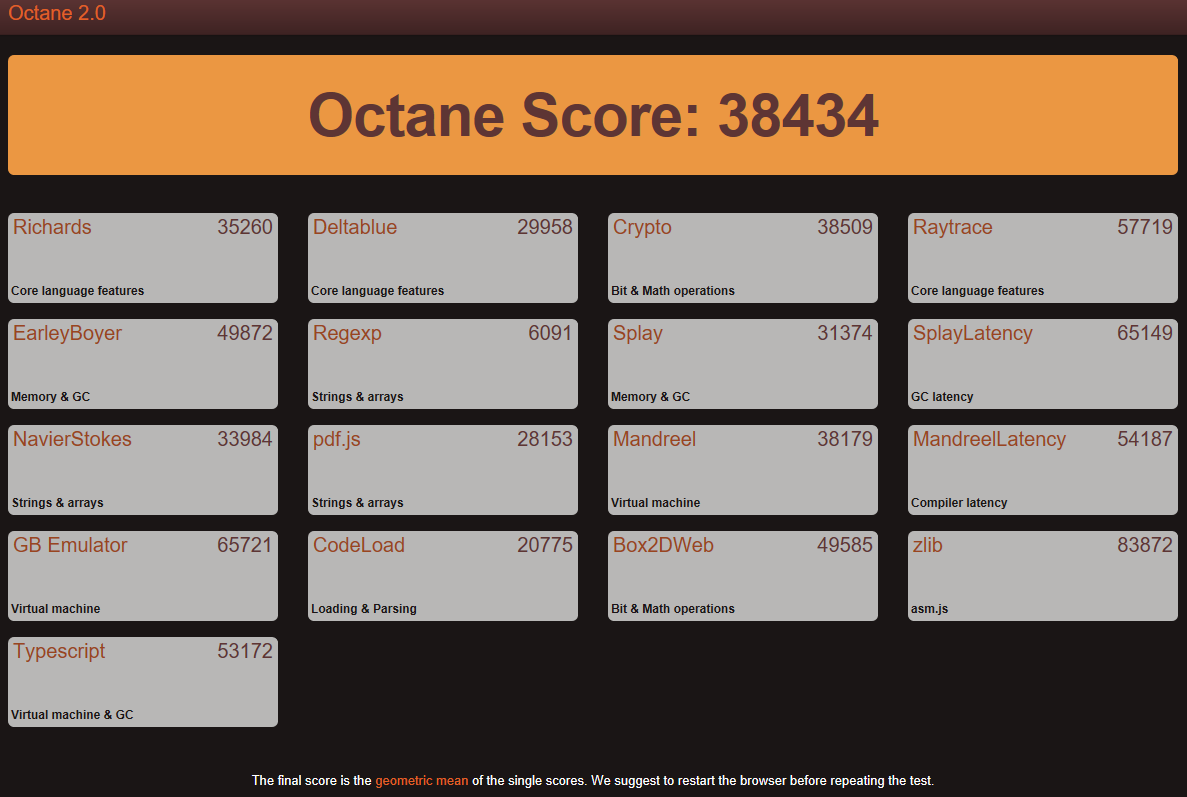
| Octane V2 - Total Score | |
| MSI GT72VR 7RE-433 | |
| MSI GE73VR 7RF Raider | |
| Asus G752VS-BA338T | |
| HP Omen 17-an014ng | |
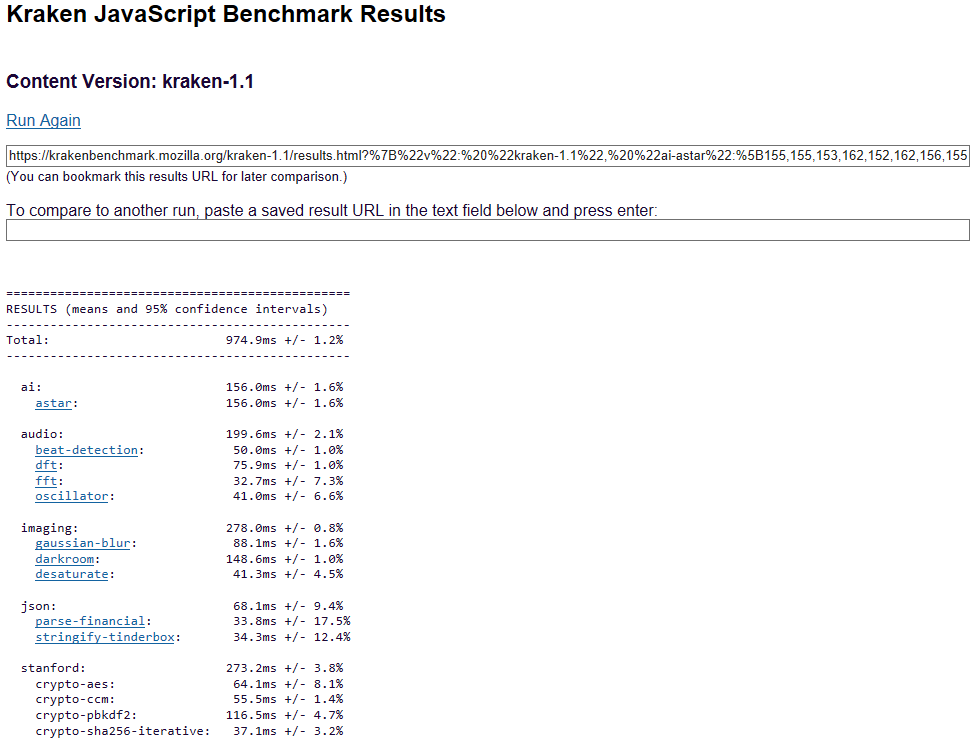
| Mozilla Kraken 1.1 - Total | |
| HP Omen 17-an014ng | |
| MSI GT72VR 7RE-433 | |
| MSI GE73VR 7RF Raider | |
| Asus G752VS-BA338T | |
* ... mindre är bättre
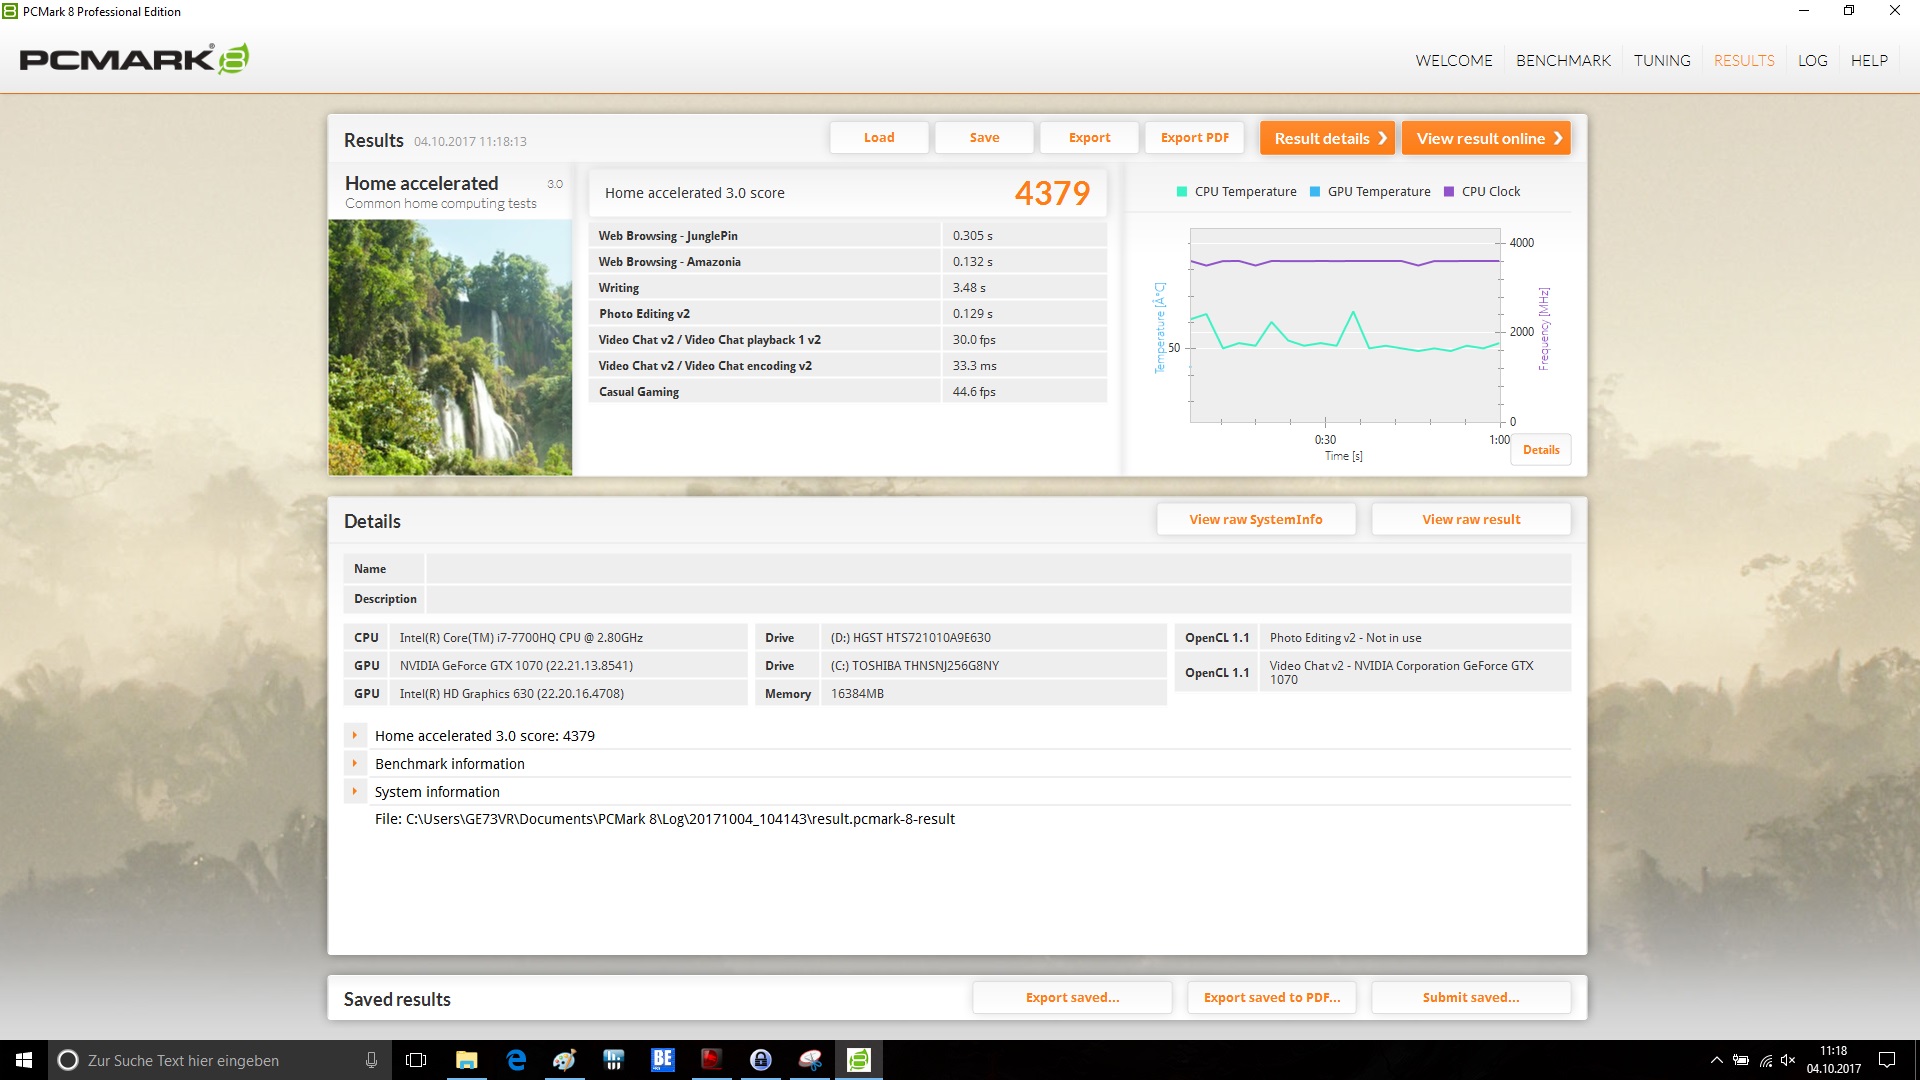
| PCMark 8 | |
| Home Score Accelerated v2 | |
| Asus G752VS-BA338T | |
| MSI GT72VR 7RE-433 | |
| HP Omen 17-an014ng | |
| Acer Predator 17 G9-793-70PJ | |
| MSI GE73VR 7RF Raider | |
| Gigabyte P57X v7 | |
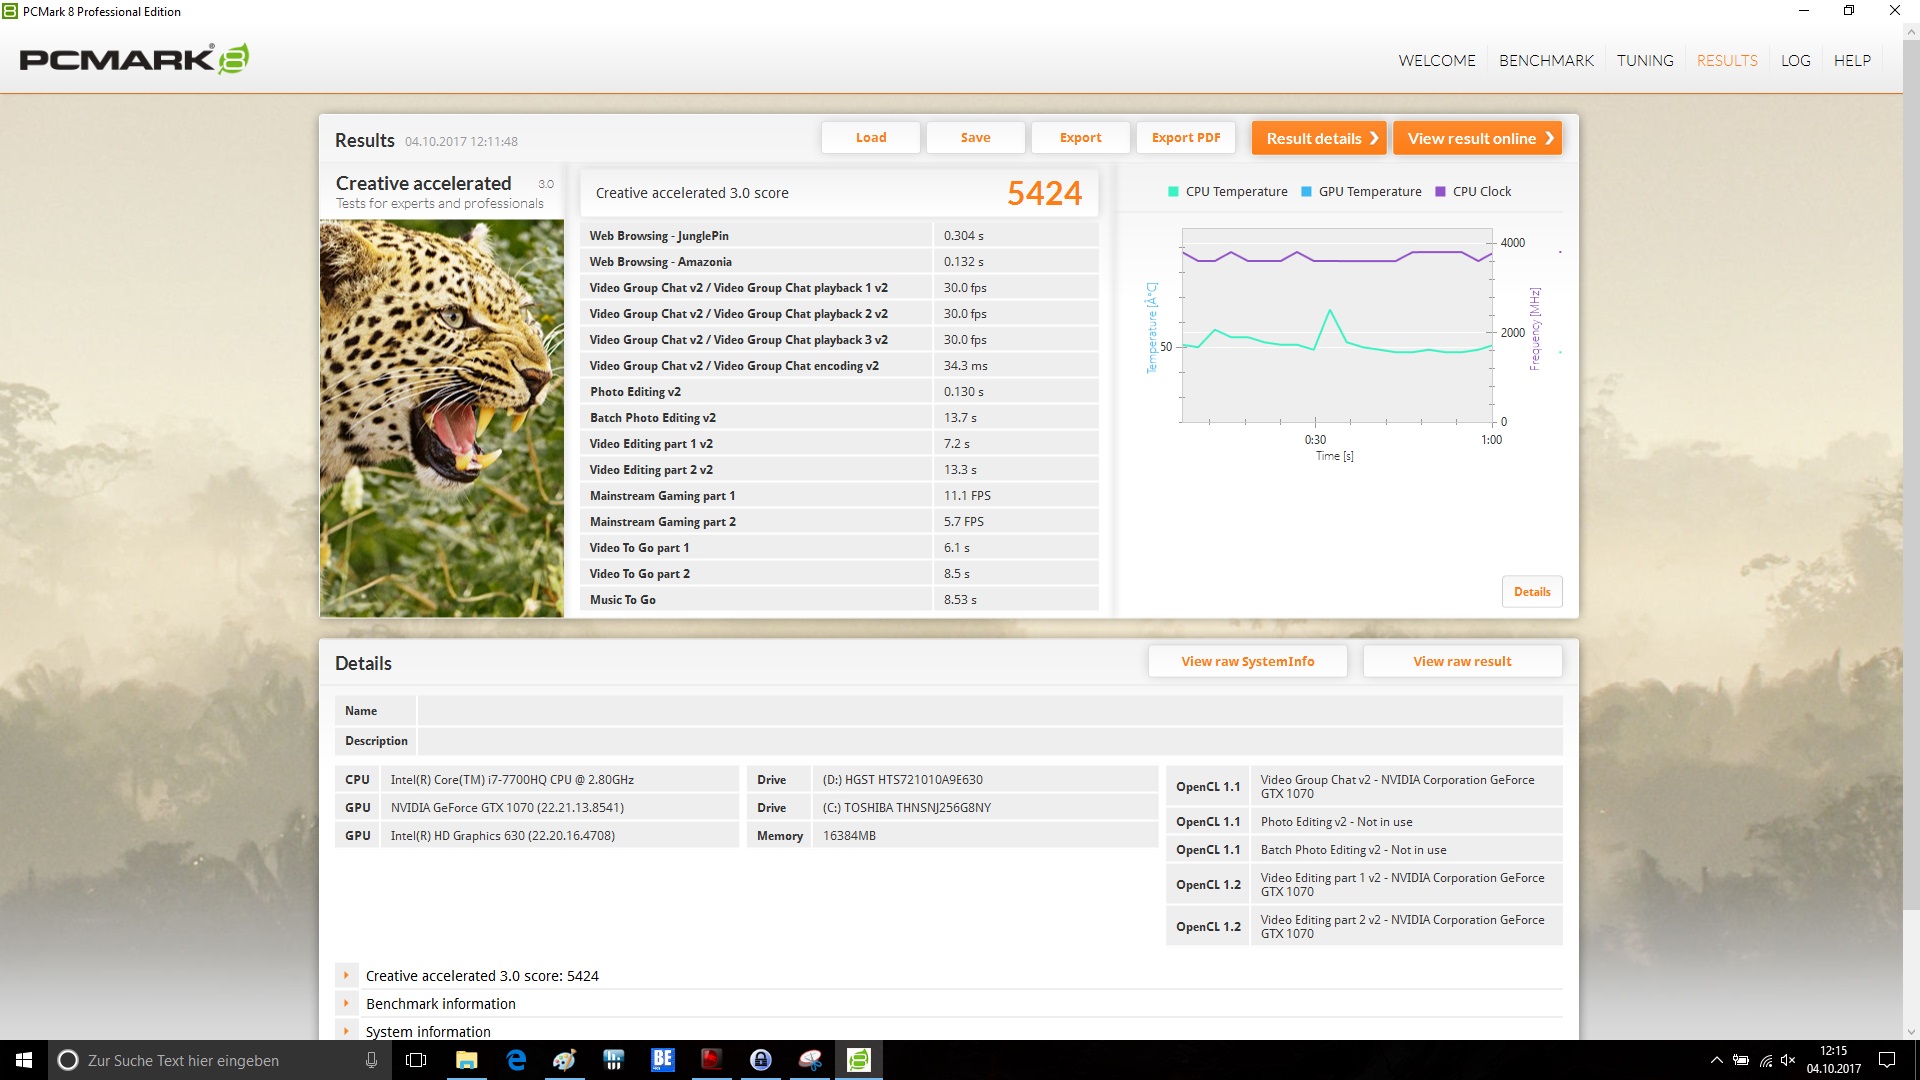
| Creative Score Accelerated v2 | |
| Asus G752VS-BA338T | |
| MSI GT72VR 7RE-433 | |
| MSI GE73VR 7RF Raider | |
| Gigabyte P57X v7 | |
| Work Score Accelerated v2 | |
| Asus G752VS-BA338T | |
| MSI GT72VR 7RE-433 | |
| HP Omen 17-an014ng | |
| MSI GE73VR 7RF Raider | |
| Acer Predator 17 G9-793-70PJ | |
| Gigabyte P57X v7 | |
| PCMark 10 - Score | |
| HP Omen 17-an014ng | |
| MSI GE73VR 7RF Raider | |
| PCMark 8 Home Score Accelerated v2 | 4379 poäng | |
| PCMark 8 Creative Score Accelerated v2 | 5424 poäng | |
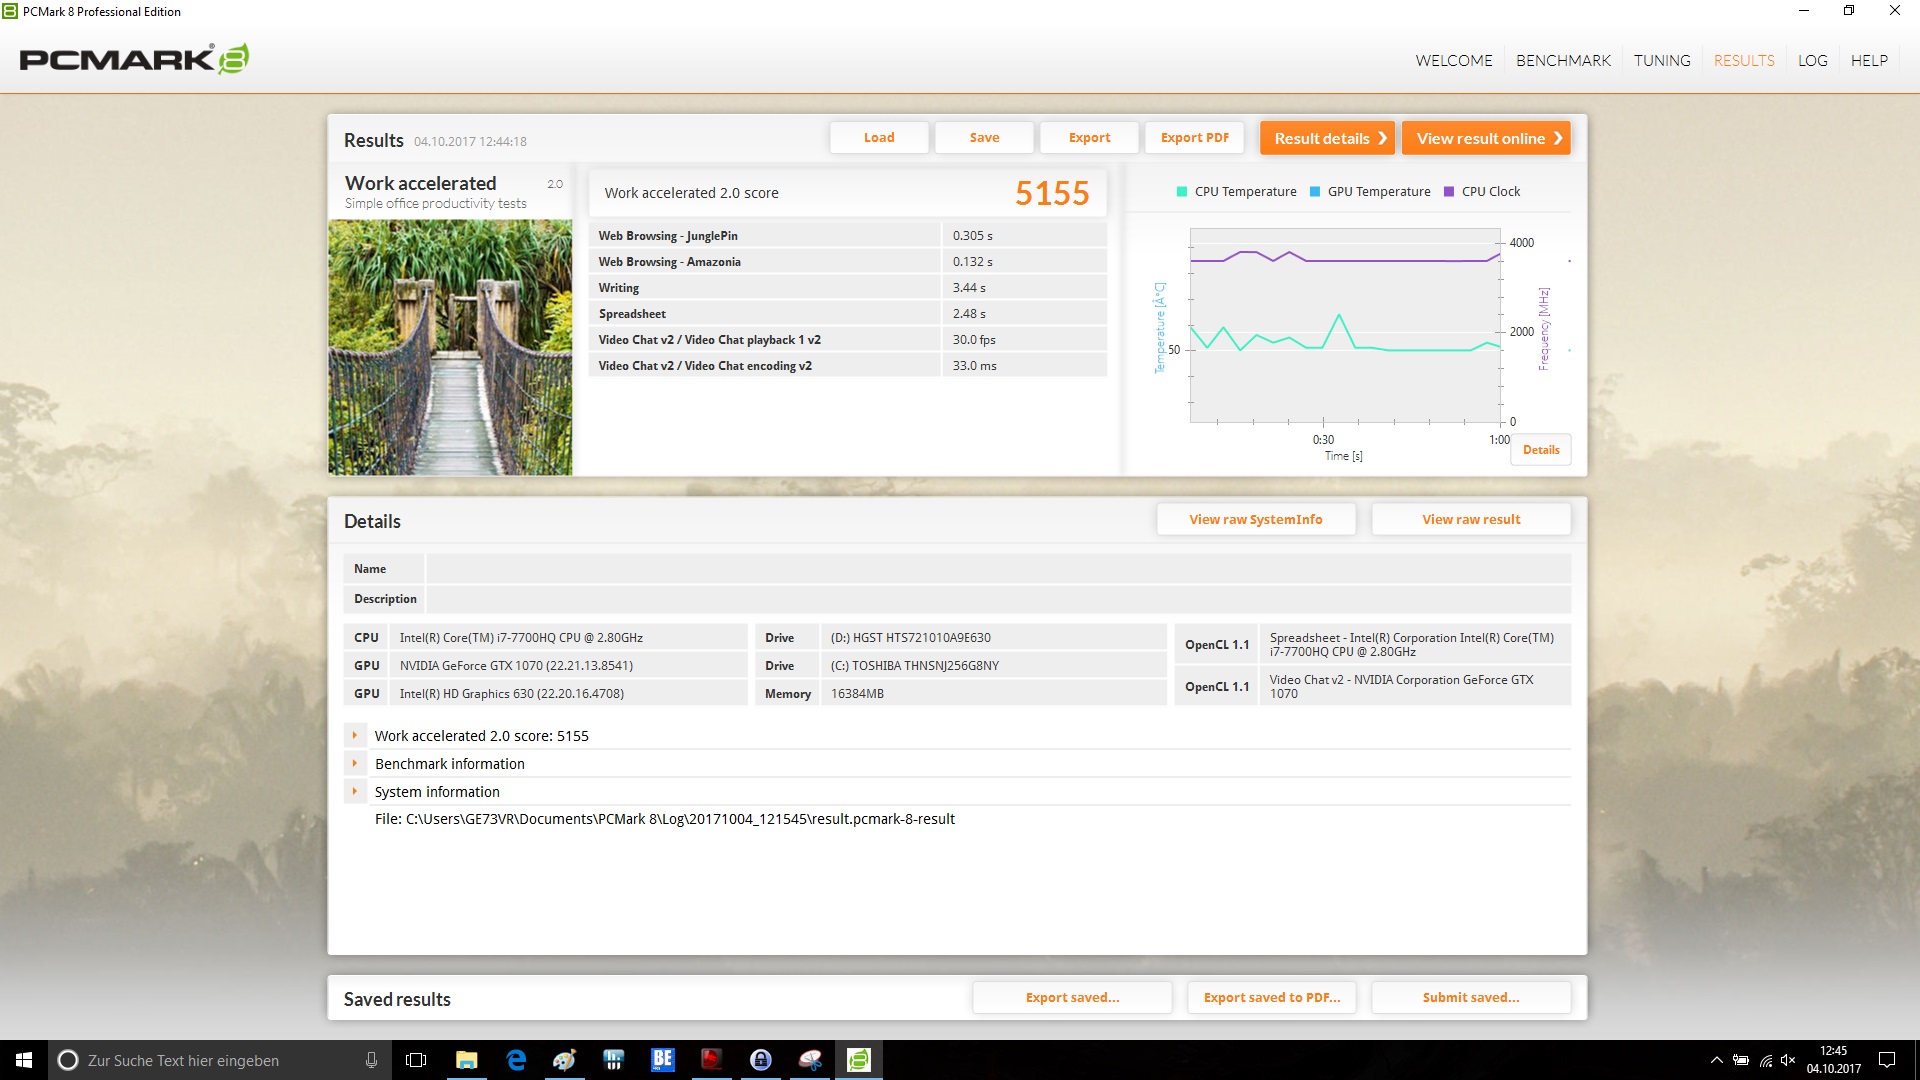
| PCMark 8 Work Score Accelerated v2 | 5155 poäng | |
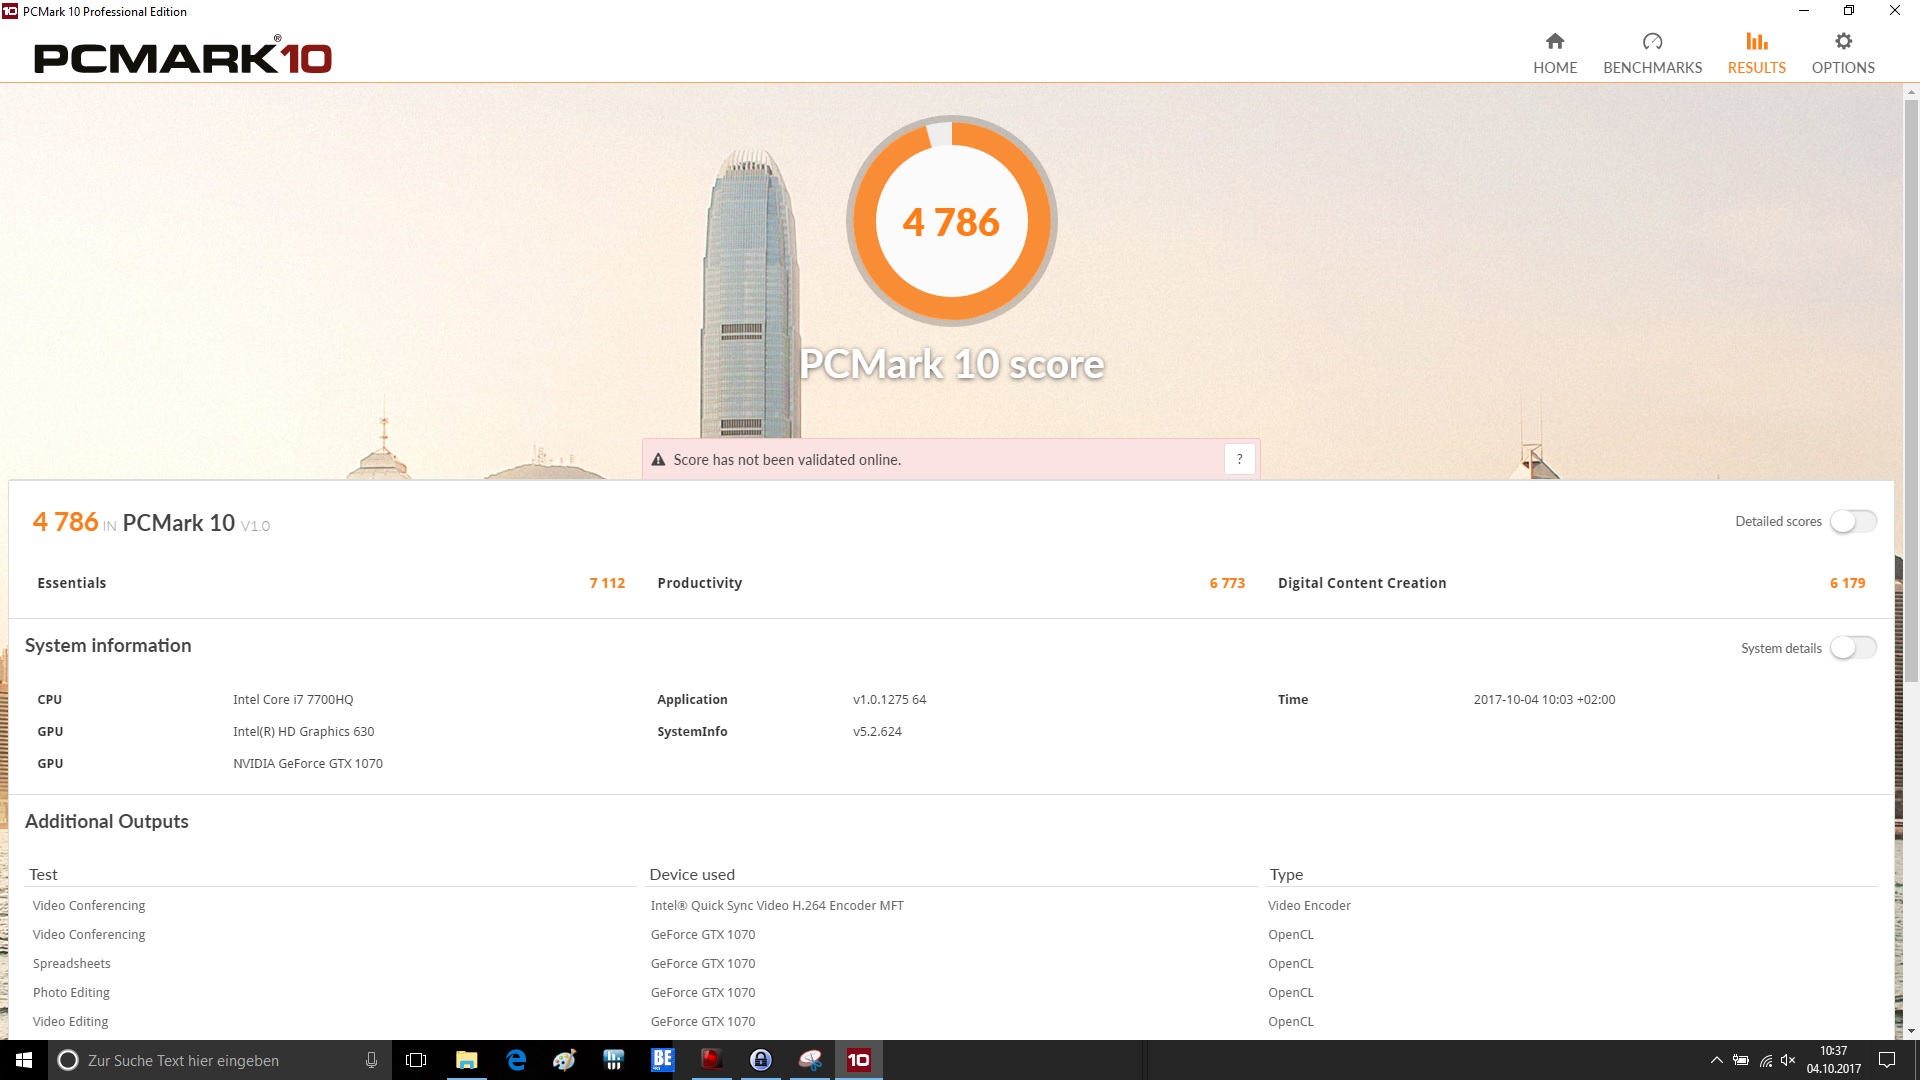
| PCMark 10 Score | 4786 poäng | |
Hjälp | ||
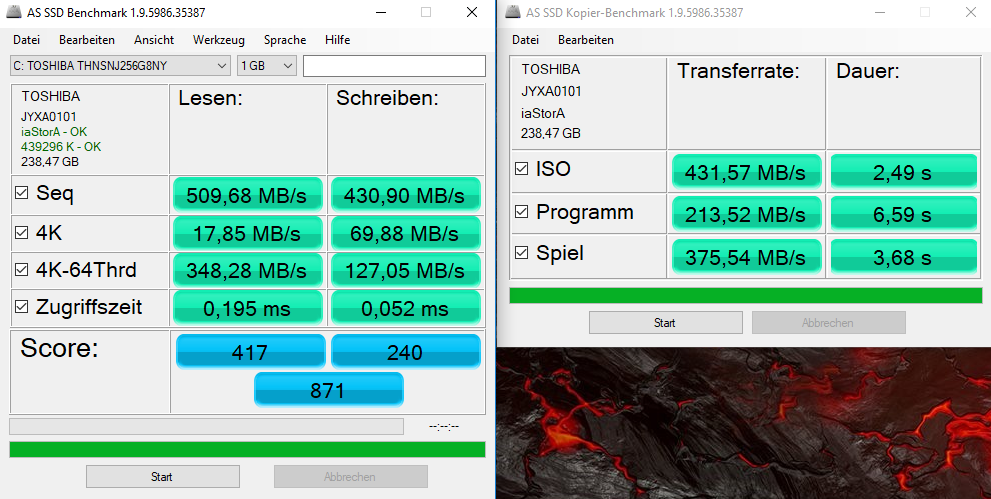
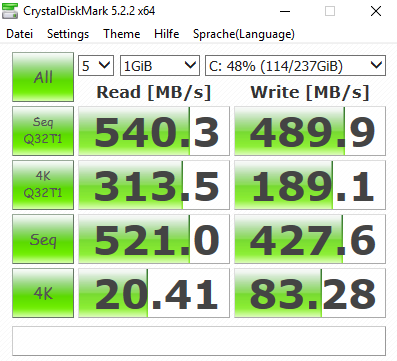
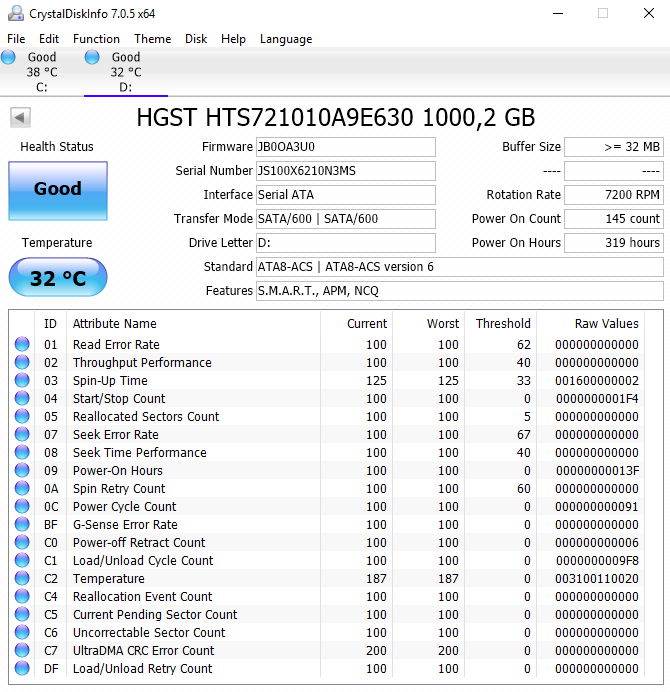
| MSI GE73VR 7RF Raider Toshiba HG6 THNSNJ256G8NY | HP Omen 17-an014ng Samsung PM961 MZVLW256HEHP | Asus G752VS-BA338T Samsung SM961 MZVKW512HMJP m.2 PCI-e | Gigabyte P57X v7 Transcend MTS800 256GB M.2 (TS256GMTS800) | Acer Predator 17 G9-793-70PJ Toshiba NVMe THNSN5512GPU7 | MSI GT72VR 7RE-433 Kingston RBU-SNS8152S3256GG5 | |
|---|---|---|---|---|---|---|
| AS SSD | -344% | 257% | 2% | 171% | 44% | |
| Seq Read (MB/s) | 510 | 2374 365% | 2824 454% | 491.9 -4% | 2237 339% | 509 0% |
| Seq Write (MB/s) | 430.9 | 365.5 -15% | 1554 261% | 260.9 -39% | 1230 185% | 282.1 -35% |
| 4K Read (MB/s) | 17.85 | 47.62 167% | 49.71 178% | 23.65 32% | 37.51 110% | 40.04 124% |
| 4K Write (MB/s) | 69.9 | 1.26 -98% | 138.9 99% | 72 3% | 120.8 73% | 95.8 37% |
| 4K-64 Read (MB/s) | 348.3 | 1129 224% | 744 114% | 241.4 -31% | 851 144% | 394.5 13% |
| 4K-64 Write (MB/s) | 127.1 | 122.9 -3% | 1185 832% | 151.4 19% | 646 408% | 281.4 121% |
| Access Time Read * (ms) | 0.195 | 0.058 70% | 0.058 70% | 0.11 44% | 0.052 73% | 0.077 61% |
| Access Time Write * (ms) | 0.052 | 1.85 -3458% | 0.027 48% | 0.055 -6% | 0.033 37% | 0.035 33% |
* ... mindre är bättre

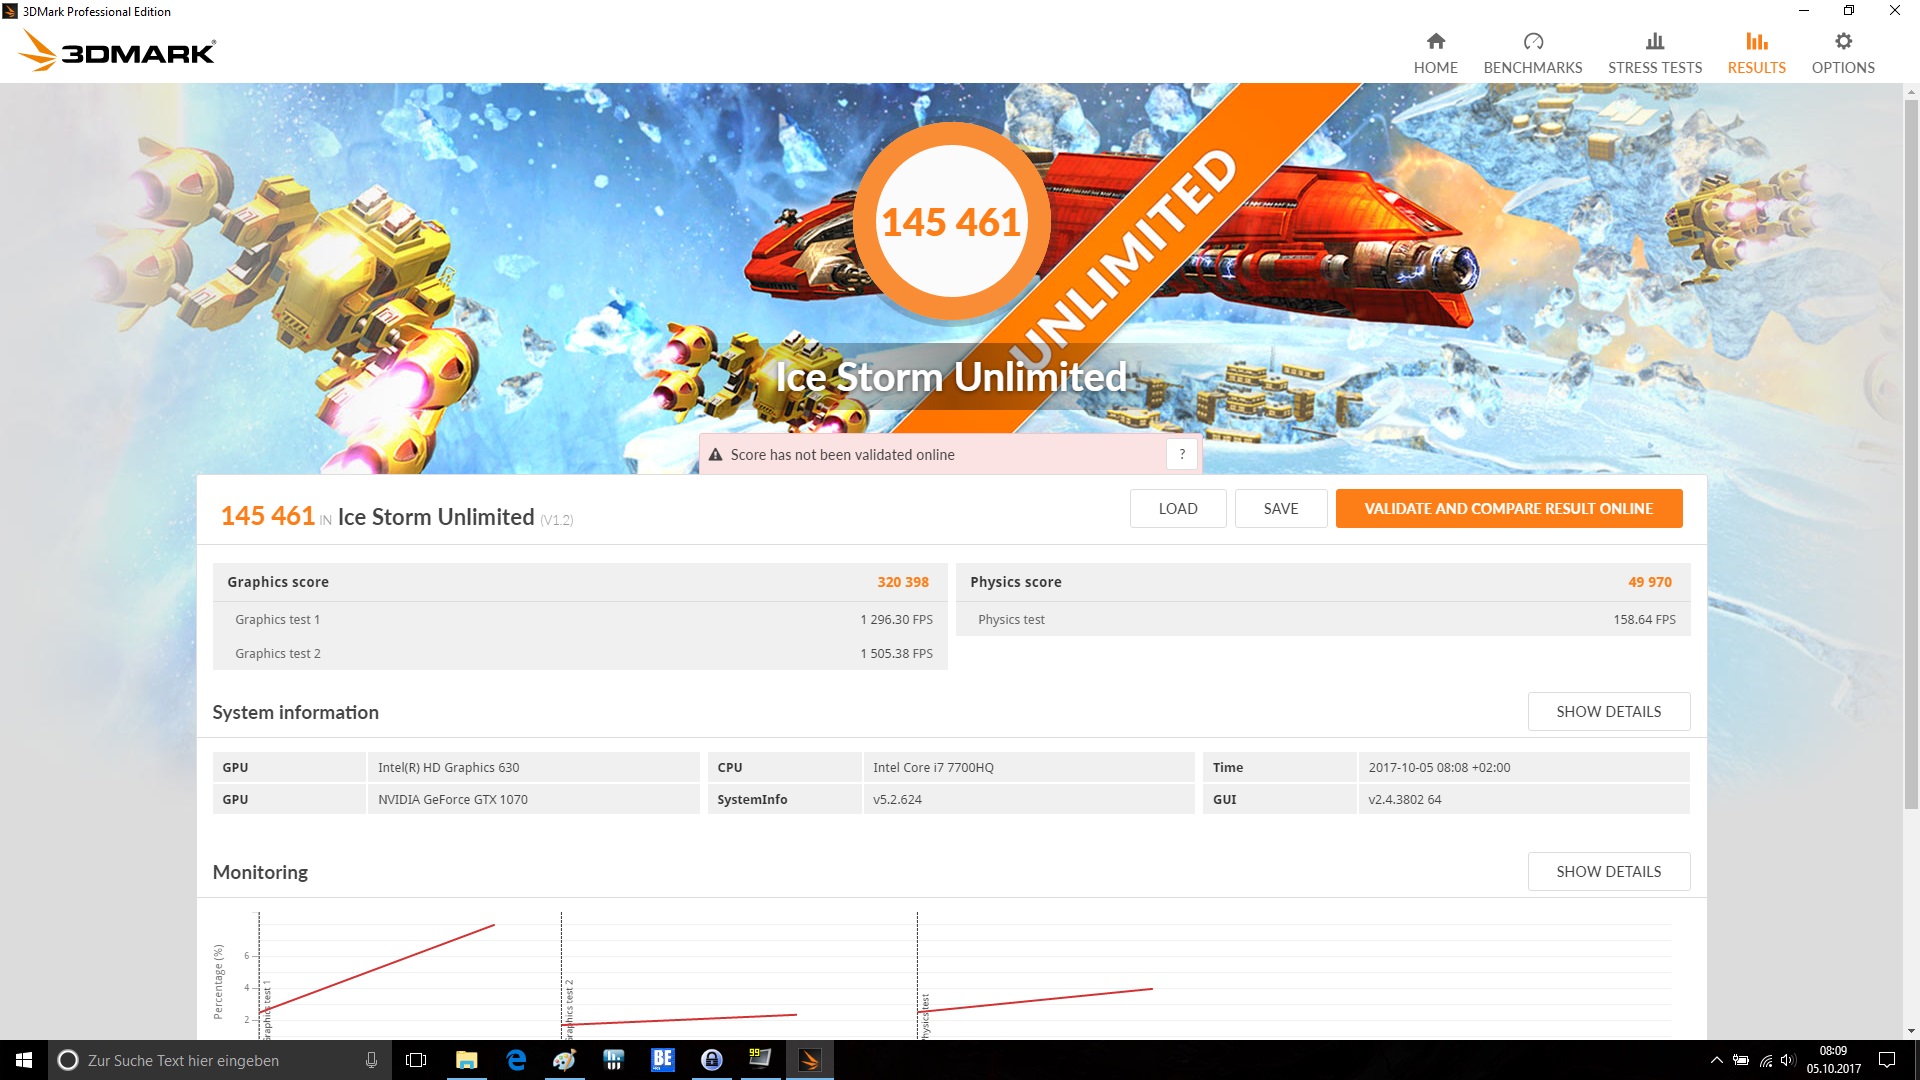
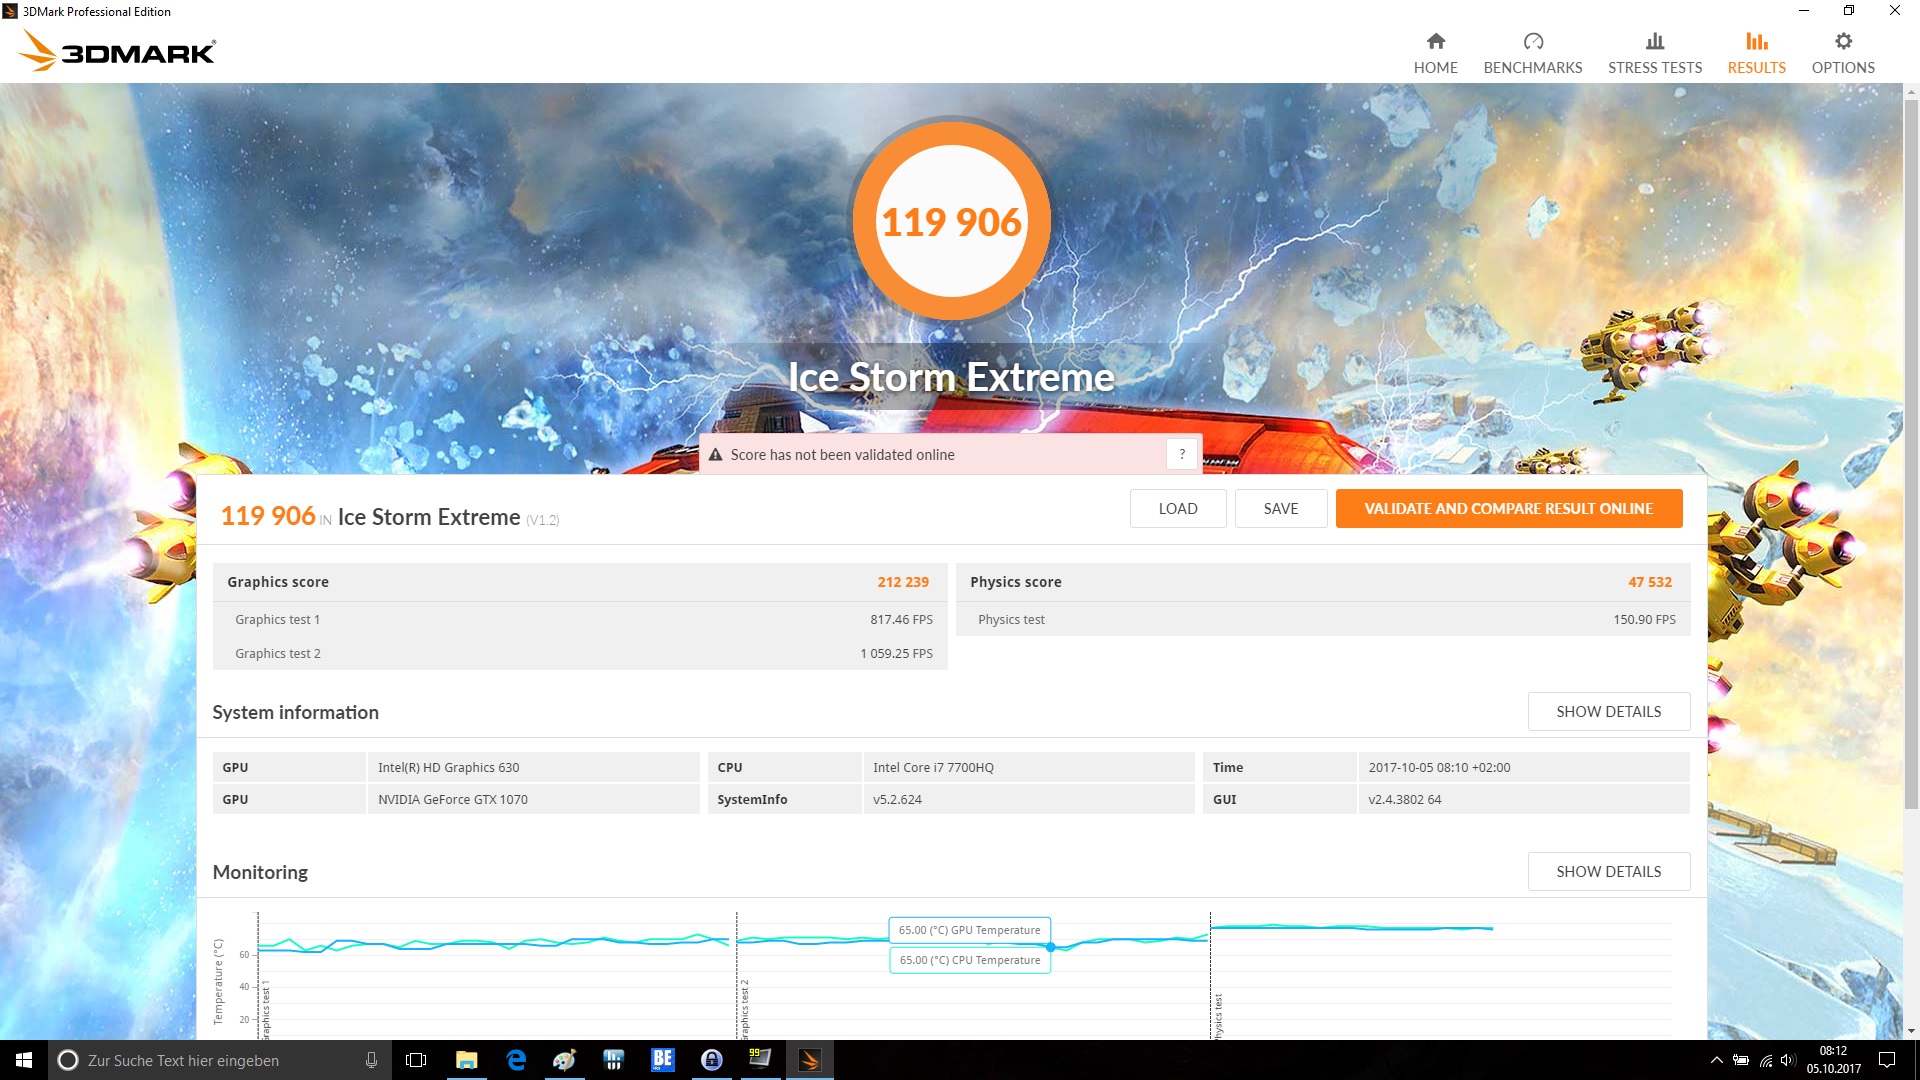
| 3DMark | |
| 1920x1080 Fire Strike Graphics | |
| Asus G752VS-BA338T | |
| MSI GE73VR 7RF Raider | |
| MSI GT72VR 7RE-433 | |
| HP Omen 17-an014ng | |
| Gigabyte P57X v7 | |
| Acer Predator 17 G9-793-70PJ | |
| Fire Strike Extreme Graphics | |
| Asus G752VS-BA338T | |
| MSI GE73VR 7RF Raider | |
| Gigabyte P57X v7 | |
| MSI GT72VR 7RE-433 | |
| 3DMark 11 - 1280x720 Performance GPU | |
| Asus G752VS-BA338T | |
| MSI GE73VR 7RF Raider | |
| Gigabyte P57X v7 | |
| MSI GT72VR 7RE-433 | |
| Acer Predator 17 G9-793-70PJ | |
| HP Omen 17-an014ng | |
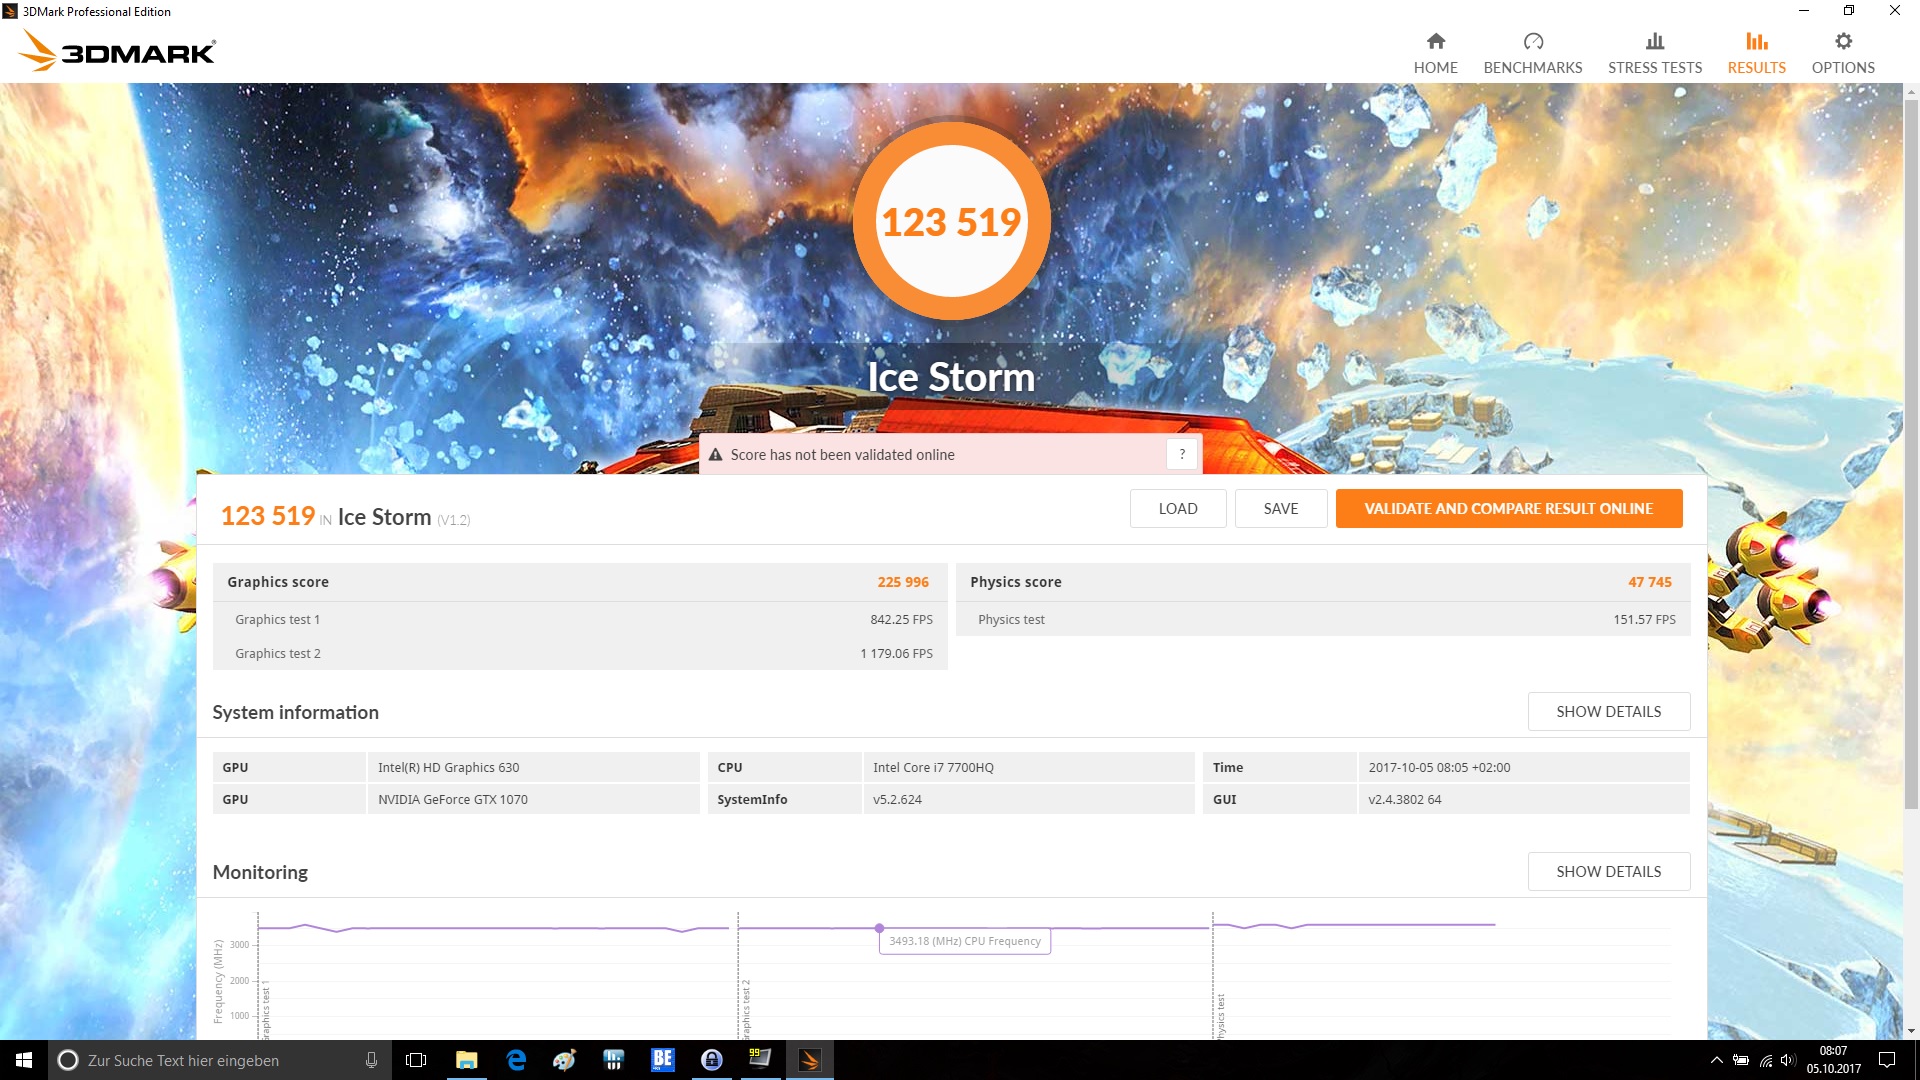
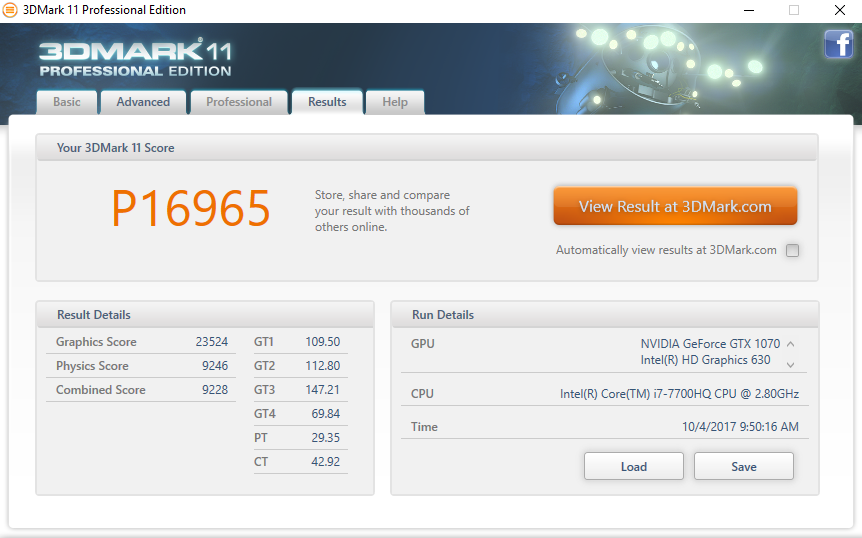
| 3DMark 11 Performance | 16965 poäng | |
| 3DMark Ice Storm Standard Score | 123519 poäng | |
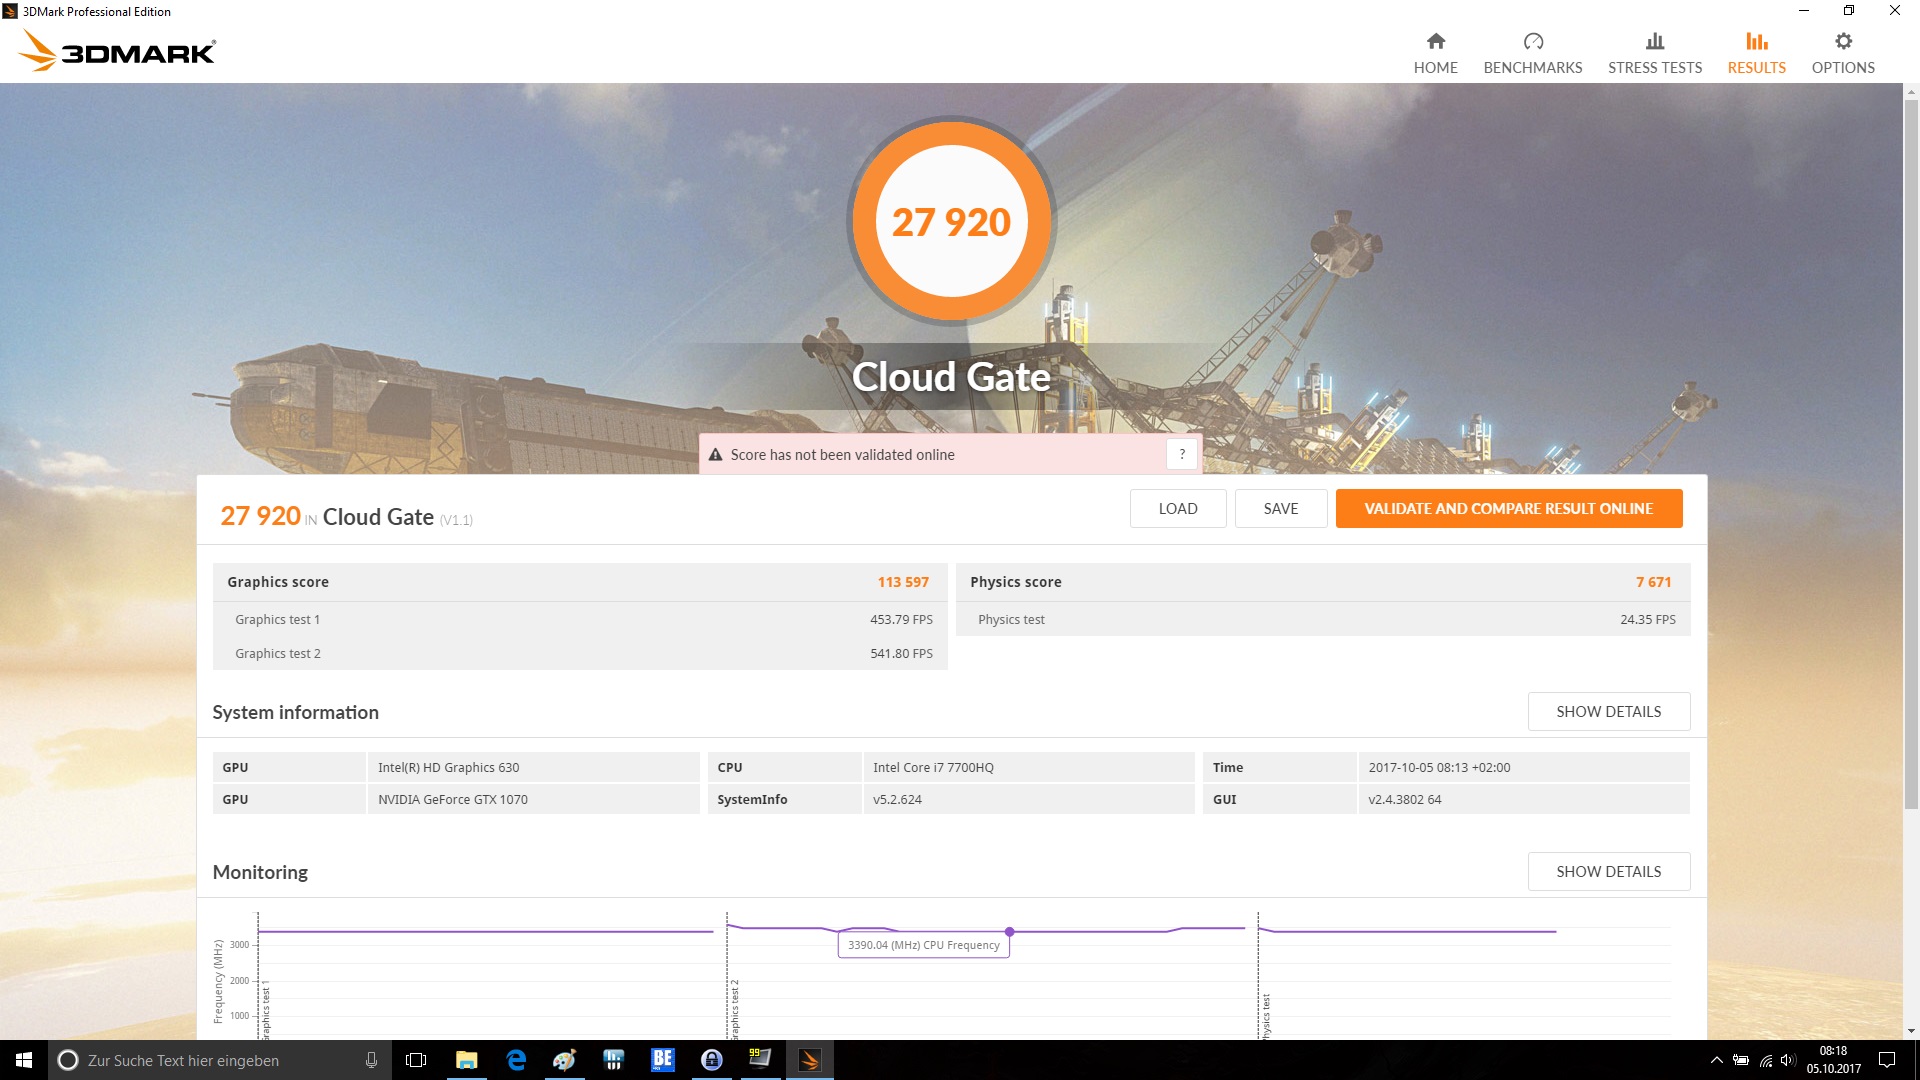
| 3DMark Cloud Gate Standard Score | 27920 poäng | |
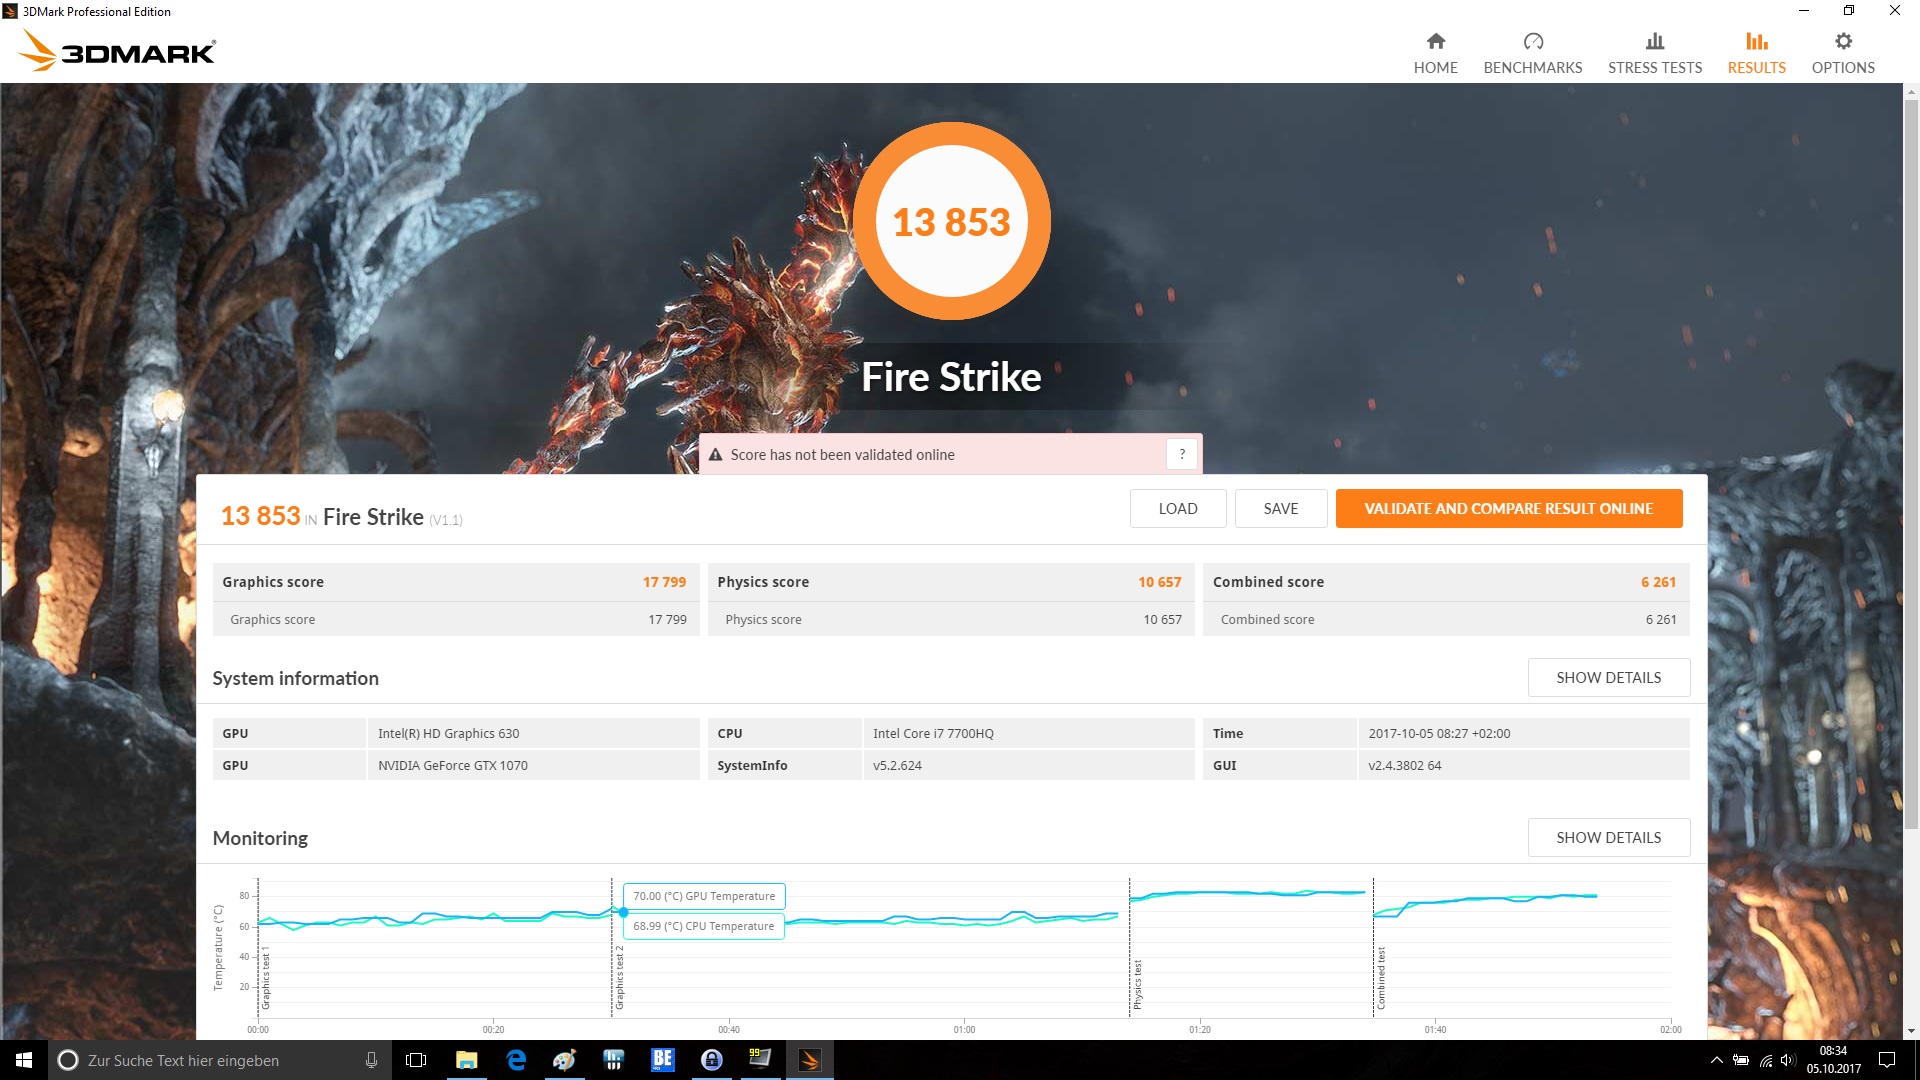
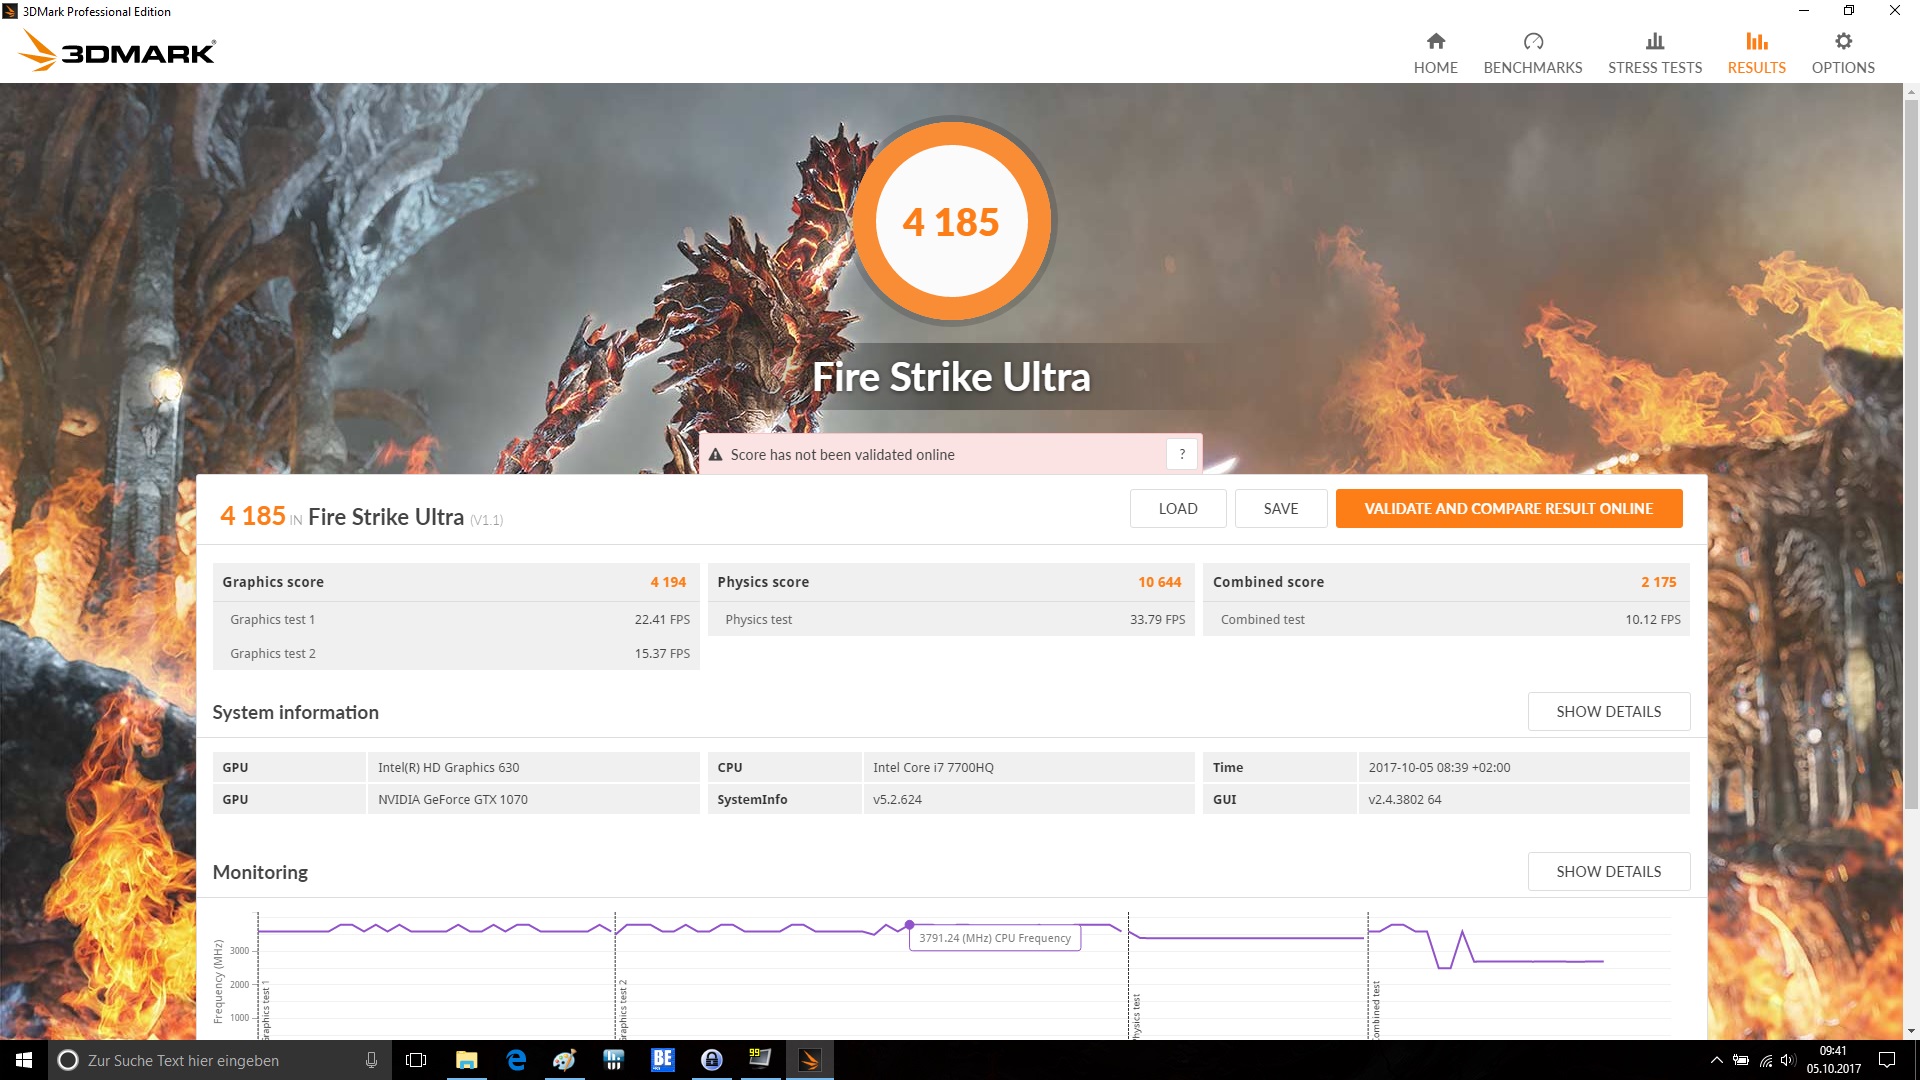
| 3DMark Fire Strike Score | 13853 poäng | |
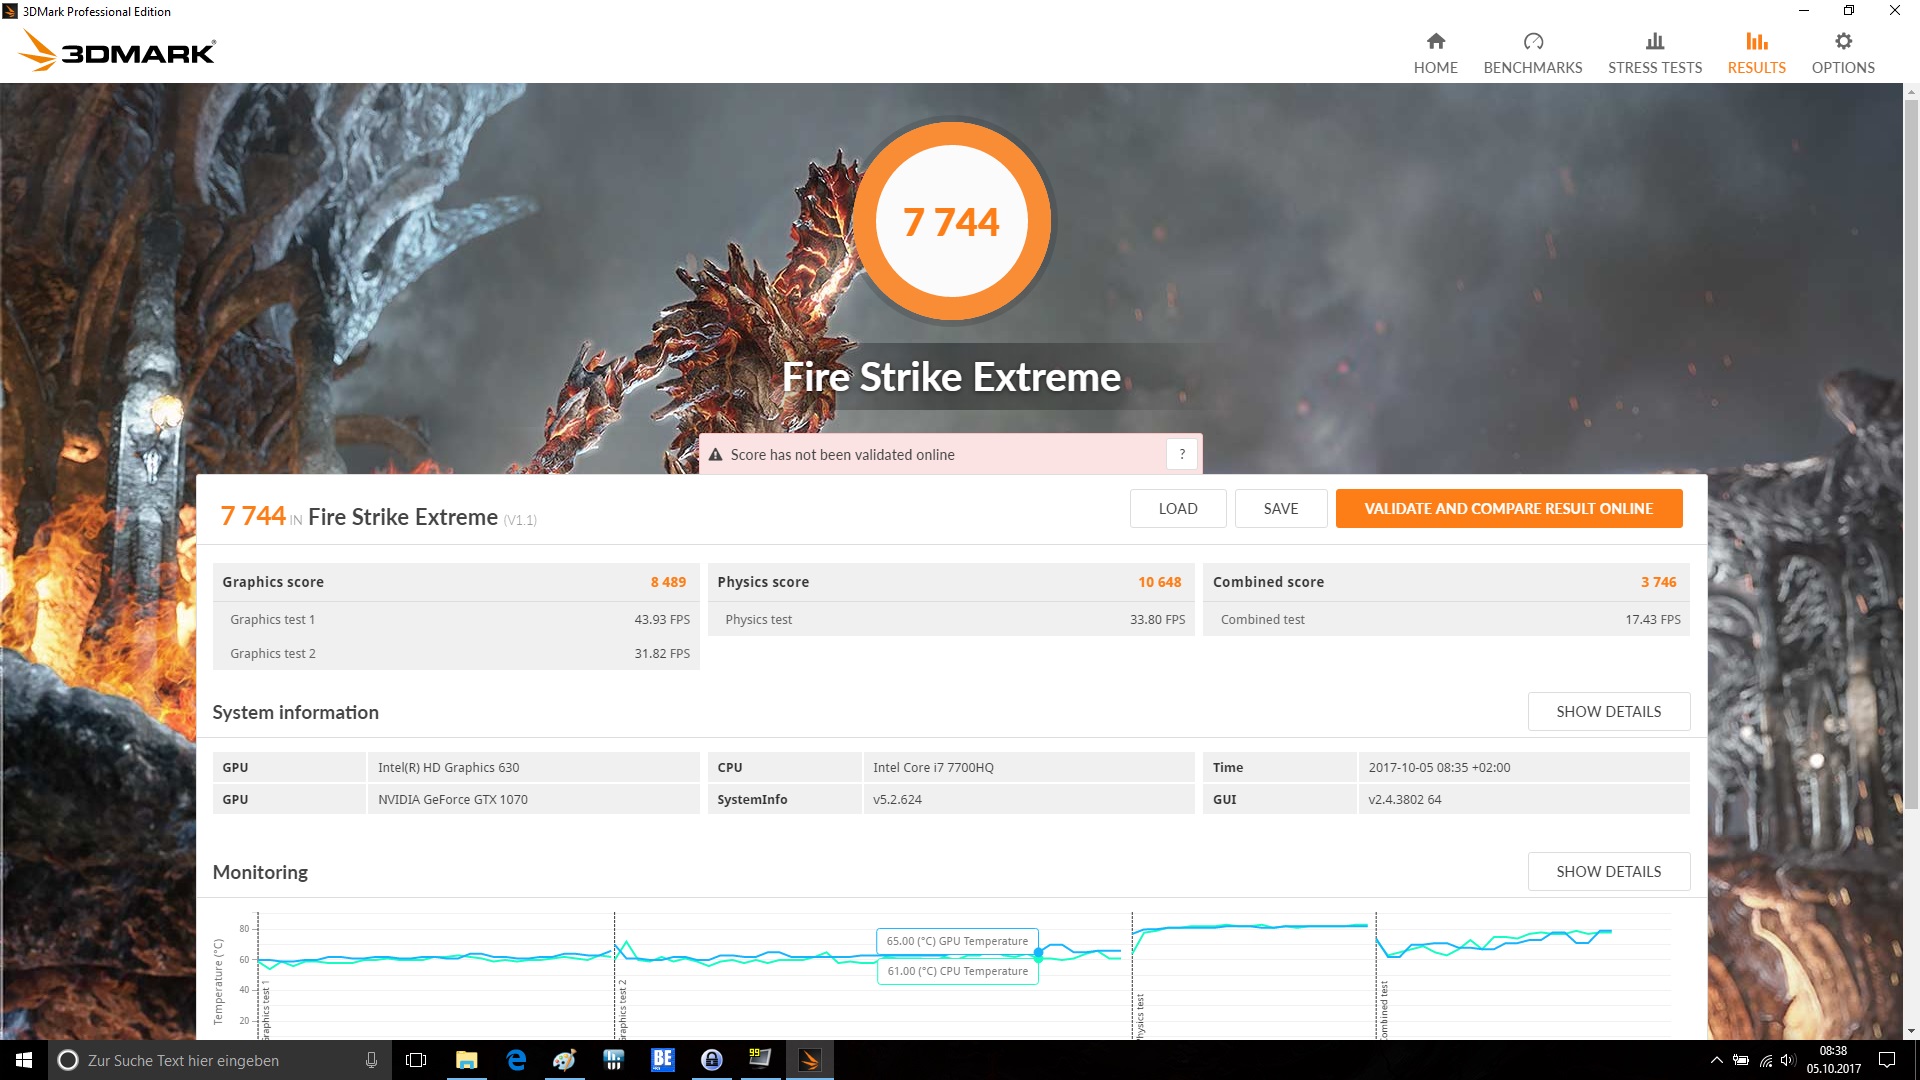
| 3DMark Fire Strike Extreme Score | 7744 poäng | |
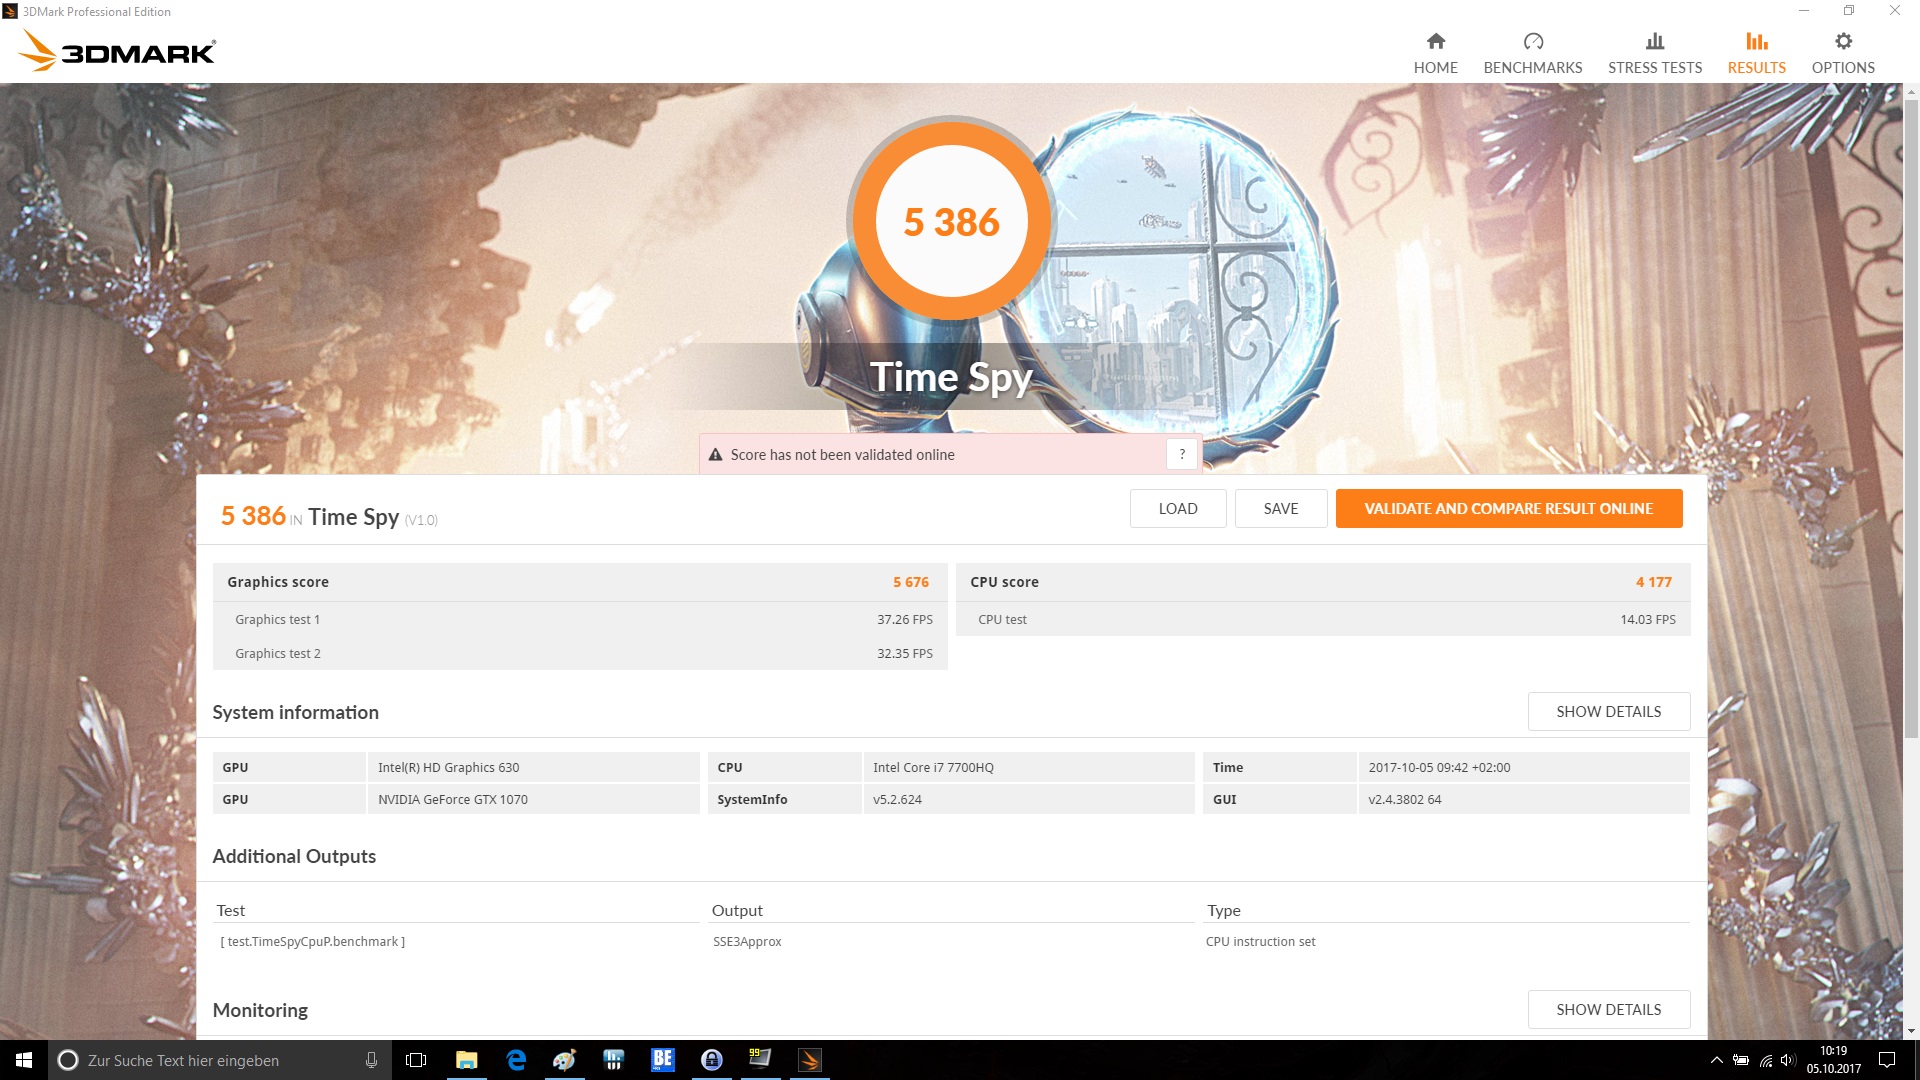
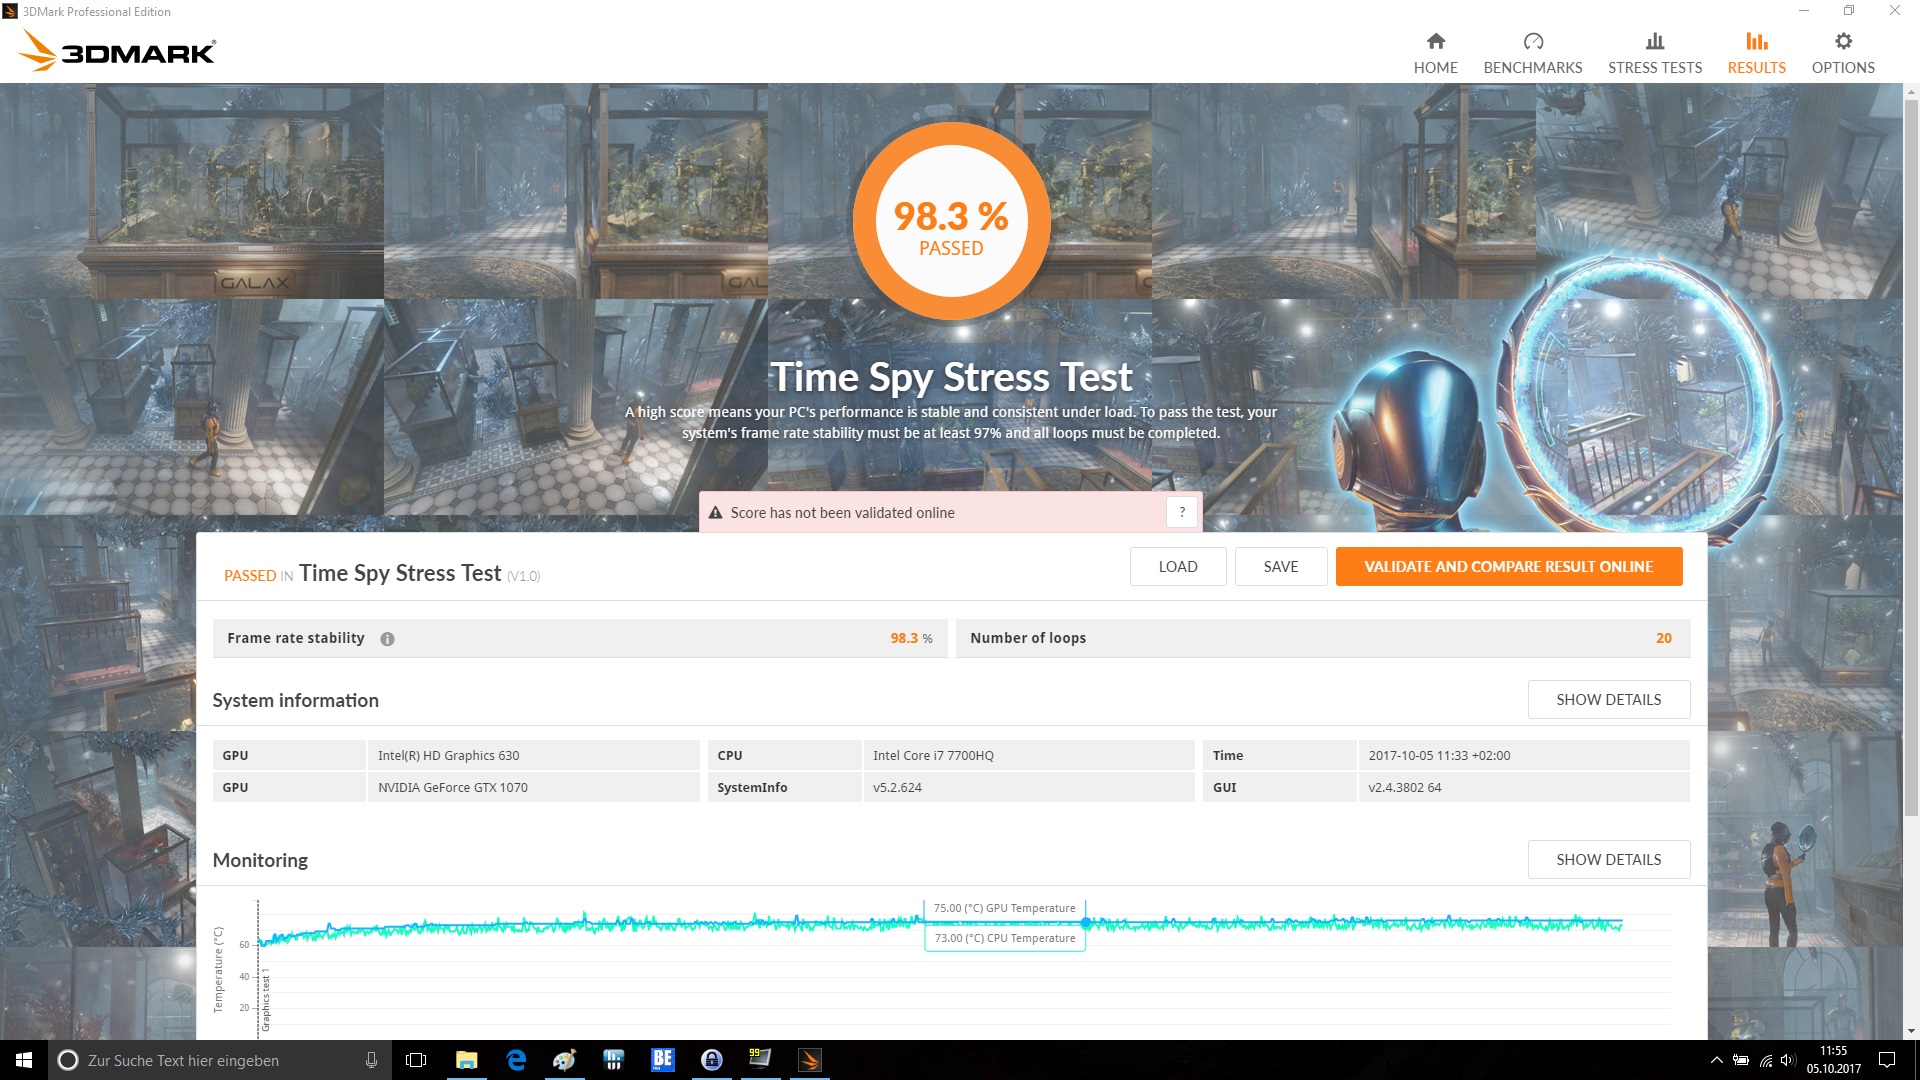
| 3DMark Time Spy Score | 5386 poäng | |
Hjälp | ||
| The Witcher 3 - 1920x1080 Ultra Graphics & Postprocessing (HBAO+) | |
| Asus G752VS-BA338T | |
| Acer Predator 17 G9-793-70PJ | |
| MSI GE73VR 7RF Raider | |
| HP Omen 17-an014ng | |
| BioShock Infinite - 1920x1080 Ultra Preset, DX11 (DDOF) | |
| Asus G752VS-BA338T | |
| MSI GE73VR 7RF Raider | |
| MSI GT72VR 7RE-433 | |
| Gigabyte P57X v7 | |
| Rise of the Tomb Raider - 1920x1080 Very High Preset AA:FX AF:16x | |
| Asus G752VS-BA338T | |
| MSI GE73VR 7RF Raider | |
| HP Omen 17-an014ng | |
| Battlefield 1 - 1920x1080 Ultra Preset AA:T | |
| MSI GE73VR 7RF Raider | |
| MSI GT72VR 7RE-433 | |
| Battlefield 4 - 1920x1080 Ultra Preset AA:4x MS | |
| MSI GE73VR 7RF Raider | |
| MSI GT72VR 7RE-433 | |
| Deus Ex Mankind Divided - 1920x1080 Ultra Preset AA:2xMS AF:8x | |
| MSI GE73VR 7RF Raider | |
| MSI GT72VR 7RE-433 | |
| låg | med. | hög | ultra | 4K | |
|---|---|---|---|---|---|
| BioShock Infinite (2013) | 267.3 | 233.7 | 217.3 | 135 | |
| Battlefield 4 (2013) | 199.9 | 199.9 | 199.5 | 154.2 | 72.6 |
| The Witcher 3 (2015) | 231.9 | 175.7 | 107.8 | 58.6 | 39.9 |
| Rise of the Tomb Raider (2016) | 218.5 | 176.2 | 111.4 | 91.4 | 38.1 |
| Deus Ex Mankind Divided (2016) | 139.8 | 129.7 | 84.5 | 45.9 | 28.5 |
| Battlefield 1 (2016) | 179.2 | 161.8 | 133.4 | 123.2 | 51.8 |
Ljudnivå
| Låg belastning |
| 33 / 34 / 39 dB(A) |
| Hårddisk |
| 34 dB(A) |
| Hög belastning |
| 47 / 54 dB(A) |
 | ||
30 dB tyst 40 dB(A) hörbar 50 dB(A) högt ljud |
||
min: | ||
| MSI GE73VR 7RF Raider GeForce GTX 1070 Mobile, i7-7700HQ | HP Omen 17-an014ng GeForce GTX 1070 Mobile, i7-7700HQ | Asus G752VS-BA338T GeForce GTX 1070 Mobile, i7-7700HQ | Gigabyte P57X v7 GeForce GTX 1070 Mobile, i7-7700HQ | Acer Predator 17 G9-793-70PJ GeForce GTX 1070 Mobile, i7-7700HQ | MSI GT72VR 7RE-433 GeForce GTX 1070 Mobile, i7-7700HQ | |
|---|---|---|---|---|---|---|
| Noise | 1% | 8% | 7% | 4% | 6% | |
| av / miljö * (dB) | 30 | 30 -0% | 30 -0% | 29 3% | 31 -3% | 31 -3% |
| Idle Minimum * (dB) | 33 | 30 9% | 30 9% | 30.4 8% | 32 3% | 34 -3% |
| Idle Average * (dB) | 34 | 37 -9% | 32 6% | 32.1 6% | 35 -3% | 35 -3% |
| Idle Maximum * (dB) | 39 | 39 -0% | 36 8% | 32.1 18% | 38 3% | 37 5% |
| Load Average * (dB) | 47 | 44 6% | 43 9% | 45.6 3% | 42 11% | 37 21% |
| Witcher 3 ultra * (dB) | 49 | 47 4% | 43 12% | 44 10% | ||
| Load Maximum * (dB) | 54 | 55 -2% | 49 9% | 51.5 5% | 50 7% | 44 19% |
* ... mindre är bättre
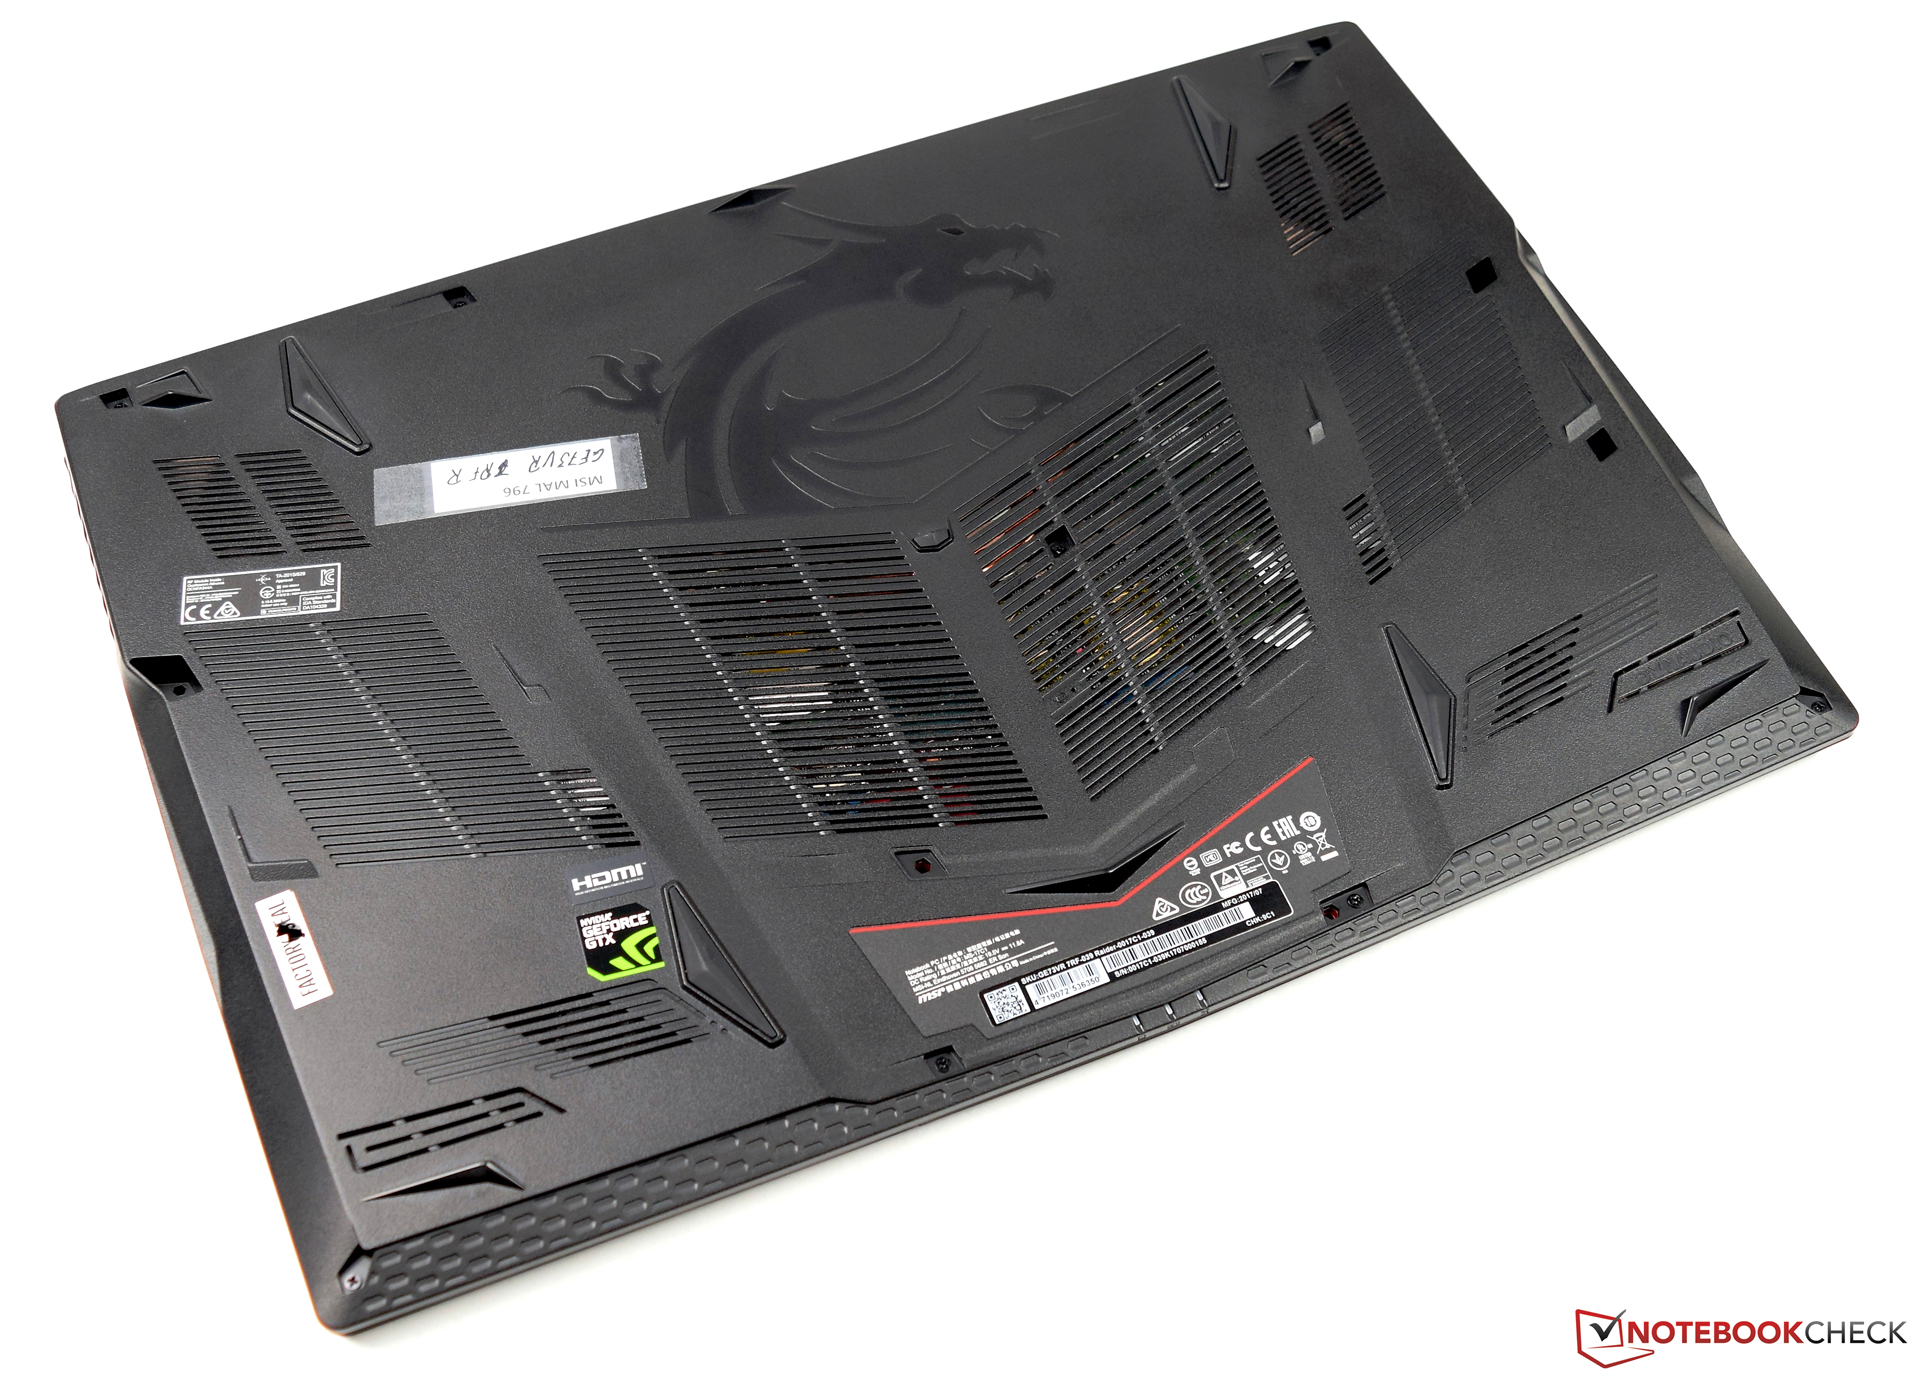
(-) Den maximala temperaturen på ovansidan är 48 °C / 118 F, jämfört med genomsnittet av 40.4 °C / 105 F , allt från 21.2 till 68.8 °C för klassen Gaming.
(-) Botten värms upp till maximalt 49 °C / 120 F, jämfört med genomsnittet av 43.2 °C / 110 F
(+) Vid tomgångsbruk är medeltemperaturen för ovansidan 24.3 °C / 76 F, jämfört med enhetsgenomsnittet på 33.9 °C / ### class_avg_f### F.
(±) När du spelar The Witcher 3 är medeltemperaturen för ovansidan 37.9 °C / 100 F, jämfört med enhetsgenomsnittet på 33.9 °C / ## #class_avg_f### F.
(+) Handledsstöden och pekplattan är kallare än hudtemperaturen med maximalt 31 °C / 87.8 F och är därför svala att ta på.
(-) Medeltemperaturen för handledsstödsområdet på liknande enheter var 28.8 °C / 83.8 F (-2.2 °C / -4 F).
| MSI GE73VR 7RF Raider i7-7700HQ, GeForce GTX 1070 Mobile | HP Omen 17-an014ng i7-7700HQ, GeForce GTX 1070 Mobile | Asus G752VS-BA338T i7-7700HQ, GeForce GTX 1070 Mobile | Gigabyte P57X v7 i7-7700HQ, GeForce GTX 1070 Mobile | Acer Predator 17 G9-793-70PJ i7-7700HQ, GeForce GTX 1070 Mobile | MSI GT72VR 7RE-433 i7-7700HQ, GeForce GTX 1070 Mobile | |
|---|---|---|---|---|---|---|
| Heat | -23% | 4% | -13% | 5% | 2% | |
| Maximum Upper Side * (°C) | 48 | 48 -0% | 41 15% | 51.2 -7% | 39.1 19% | 41.5 14% |
| Maximum Bottom * (°C) | 49 | 54 -10% | 39.3 20% | 56.8 -16% | 42.1 14% | 50.6 -3% |
| Idle Upper Side * (°C) | 25 | 35 -40% | 28.8 -15% | 29.2 -17% | 27.9 -12% | 26.4 -6% |
| Idle Bottom * (°C) | 26 | 37 -42% | 27.3 -5% | 29.2 -12% | 26.1 -0% | 25.4 2% |
* ... mindre är bättre
MSI GE73VR 7RF Raider ljudanalys
(+) | högtalare kan spela relativt högt (93 dB)
Bas 100 - 315 Hz
(-) | nästan ingen bas - i genomsnitt 18.5% lägre än medianen
(+) | basen är linjär (6.3% delta till föregående frekvens)
Mellan 400 - 2000 Hz
(±) | reducerade mids - i genomsnitt 5.4% lägre än median
(+) | mids är linjära (5.5% delta till föregående frekvens)
Högsta 2 - 16 kHz
(+) | balanserade toppar - endast 2.5% från medianen
(+) | toppar är linjära (3.1% delta till föregående frekvens)
Totalt 100 - 16 000 Hz
(+) | det totala ljudet är linjärt (14.3% skillnad mot median)
Jämfört med samma klass
» 26% av alla testade enheter i den här klassen var bättre, 7% liknande, 67% sämre
» Den bästa hade ett delta på 6%, genomsnittet var 18%, sämst var 132%
Jämfört med alla testade enheter
» 18% av alla testade enheter var bättre, 4% liknande, 78% sämre
» Den bästa hade ett delta på 4%, genomsnittet var 23%, sämst var 134%
Asus G752VS-BA338T ljudanalys
(±) | högtalarljudstyrkan är genomsnittlig men bra (80 dB)
Bas 100 - 315 Hz
(±) | reducerad bas - i genomsnitt 9.4% lägre än medianen
(±) | linjäriteten för basen är genomsnittlig (11.1% delta till föregående frekvens)
Mellan 400 - 2000 Hz
(+) | balanserad mellan - endast 4.2% från medianen
(+) | mids är linjära (6% delta till föregående frekvens)
Högsta 2 - 16 kHz
(±) | reducerade toppar - i genomsnitt 7.7% lägre än medianen
(±) | linjäriteten för toppar är genomsnittlig (10% delta till föregående frekvens)
Totalt 100 - 16 000 Hz
(±) | linjäriteten för det totala ljudet är genomsnittlig (21.2% skillnad mot median)
Jämfört med samma klass
» 76% av alla testade enheter i den här klassen var bättre, 4% liknande, 19% sämre
» Den bästa hade ett delta på 6%, genomsnittet var 18%, sämst var 132%
Jämfört med alla testade enheter
» 59% av alla testade enheter var bättre, 7% liknande, 34% sämre
» Den bästa hade ett delta på 4%, genomsnittet var 23%, sämst var 134%
| Av/Standby | |
| Låg belastning | |
| Hög belastning |
|
Förklaring:
min: | |
| MSI GE73VR 7RF Raider i7-7700HQ, GeForce GTX 1070 Mobile | HP Omen 17-an014ng i7-7700HQ, GeForce GTX 1070 Mobile | Asus G752VS-BA338T i7-7700HQ, GeForce GTX 1070 Mobile | Gigabyte P57X v7 i7-7700HQ, GeForce GTX 1070 Mobile | Acer Predator 17 G9-793-70PJ i7-7700HQ, GeForce GTX 1070 Mobile | MSI GT72VR 7RE-433 i7-7700HQ, GeForce GTX 1070 Mobile | |
|---|---|---|---|---|---|---|
| Power Consumption | -31% | -25% | -34% | -43% | -28% | |
| Idle Minimum * (Watt) | 10 | 22 -120% | 21 -110% | 15.7 -57% | 23 -130% | 20 -100% |
| Idle Average * (Watt) | 18 | 28 -56% | 27 -50% | 23.4 -30% | 33 -83% | 27 -50% |
| Idle Maximum * (Watt) | 26 | 35 -35% | 32 -23% | 23.5 10% | 40 -54% | 31 -19% |
| Load Average * (Watt) | 97 | 93 4% | 86 11% | 184.6 -90% | 94 3% | 86 11% |
| Witcher 3 ultra * (Watt) | 183 | 157 14% | 165 10% | 177 3% | ||
| Load Maximum * (Watt) | 230 | 208 10% | 206 10% | 233.1 -1% | 228 1% | 184 20% |
* ... mindre är bättre

| MSI GE73VR 7RF Raider i7-7700HQ, GeForce GTX 1070 Mobile, 51 Wh | HP Omen 17-an014ng i7-7700HQ, GeForce GTX 1070 Mobile, 86 Wh | Asus G752VS-BA338T i7-7700HQ, GeForce GTX 1070 Mobile, 90 Wh | Gigabyte P57X v7 i7-7700HQ, GeForce GTX 1070 Mobile, 75.81 Wh | Acer Predator 17 G9-793-70PJ i7-7700HQ, GeForce GTX 1070 Mobile, 88 Wh | MSI GT72VR 7RE-433 i7-7700HQ, GeForce GTX 1070 Mobile, 83 Wh | |
|---|---|---|---|---|---|---|
| Batteridrifttid | 43% | 62% | 31% | 42% | 35% | |
| Reader / Idle (h) | 4.4 | 5.8 32% | 7.4 68% | 4.3 -2% | 5.4 23% | 5.3 20% |
| H.264 (h) | 3.4 | 4.3 26% | 4.3 26% | 3.8 12% | ||
| WiFi v1.3 (h) | 4 | 4.5 13% | 4.9 23% | 2.6 -35% | 3.6 -10% | 3.8 -5% |
| Load (h) | 0.7 | 1.4 100% | 1.6 129% | 1.6 129% | 1.5 114% | 1.5 114% |
För
Emot

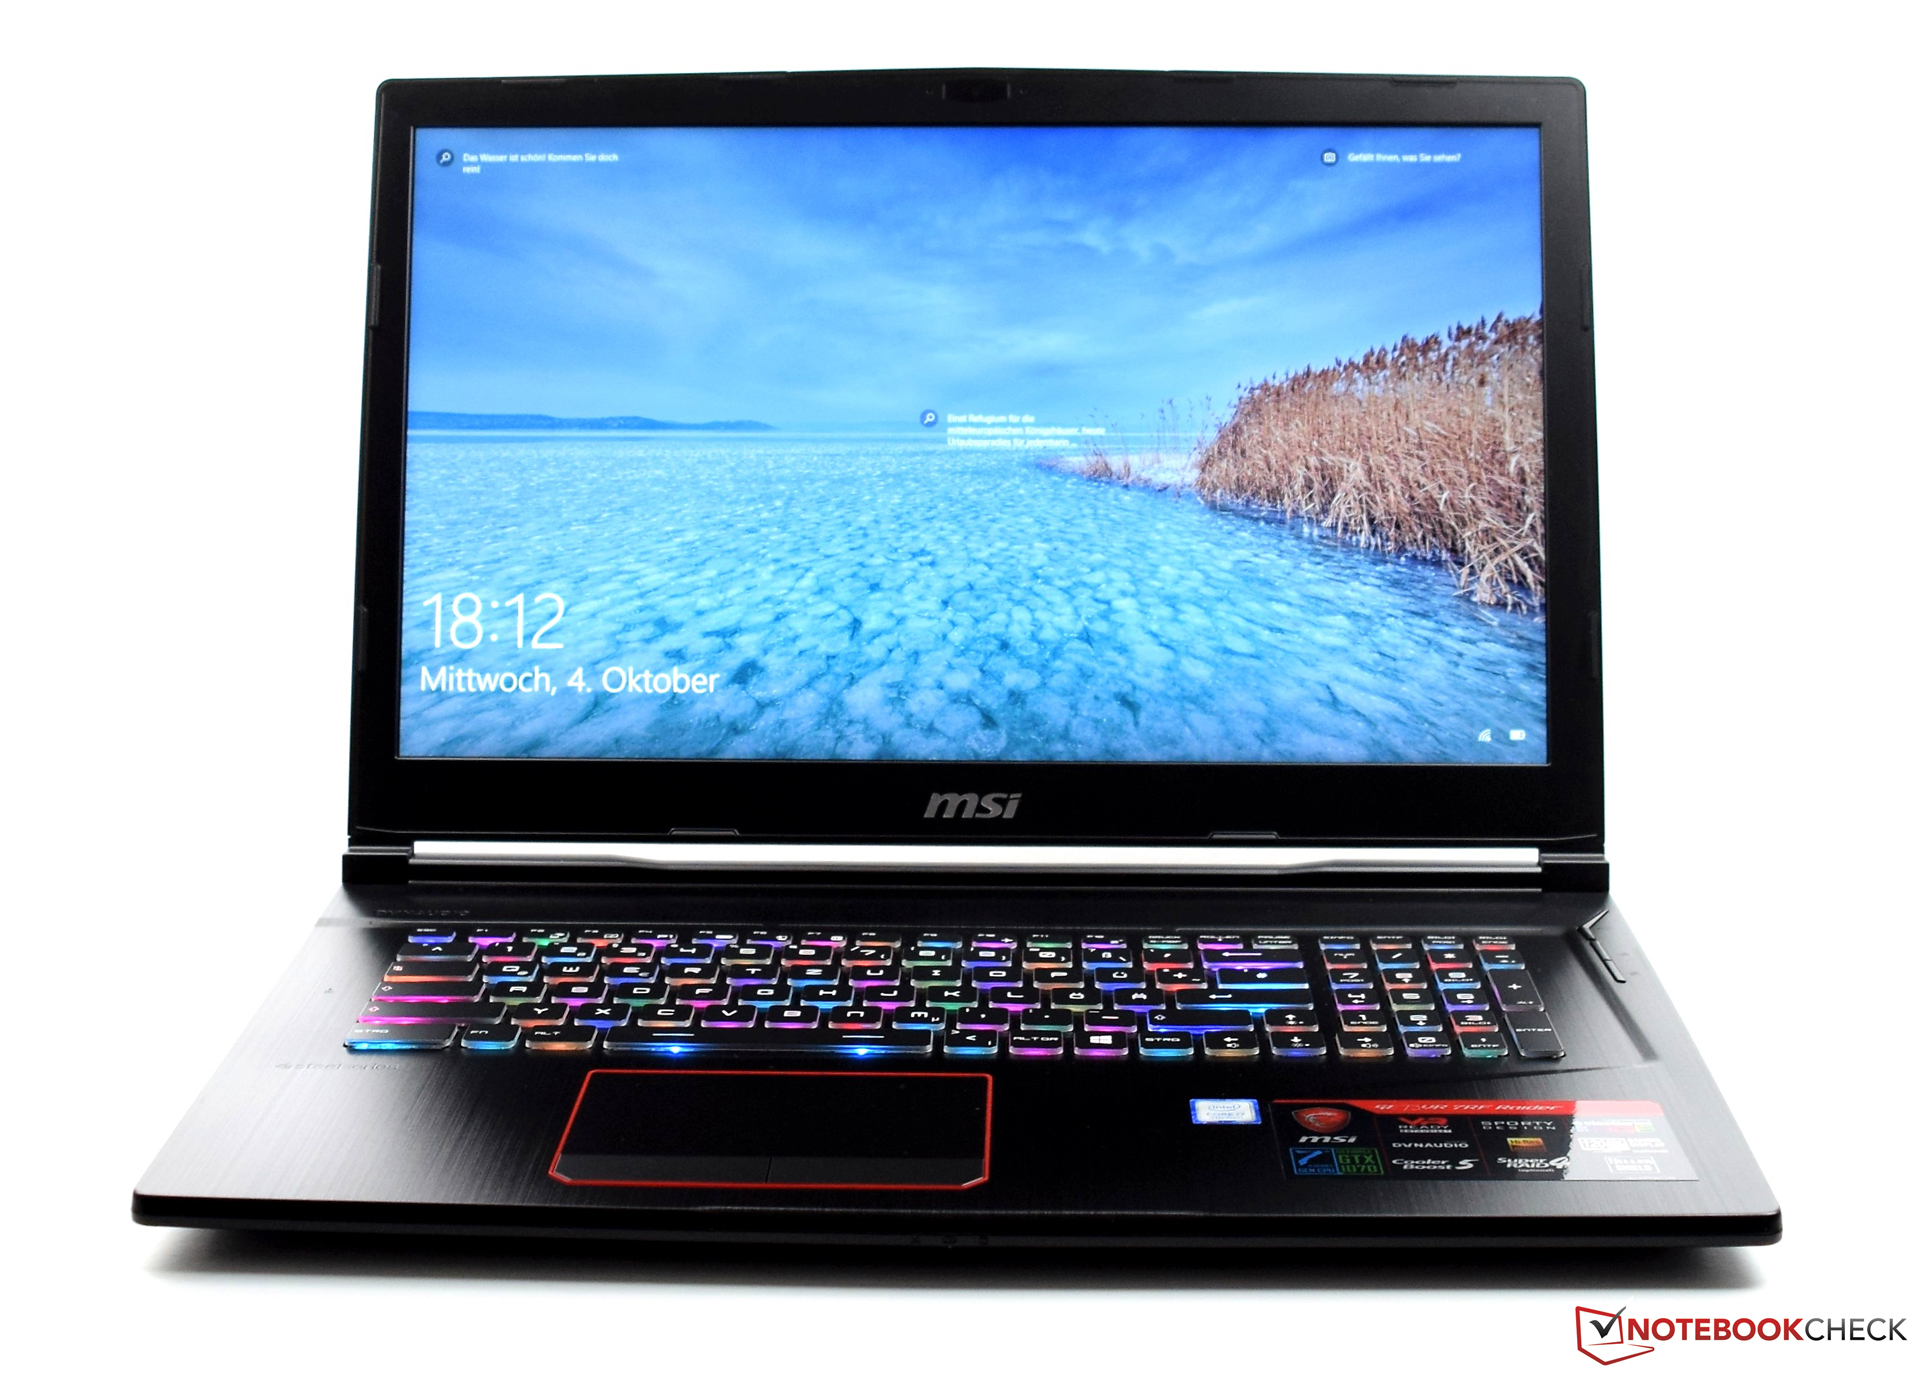
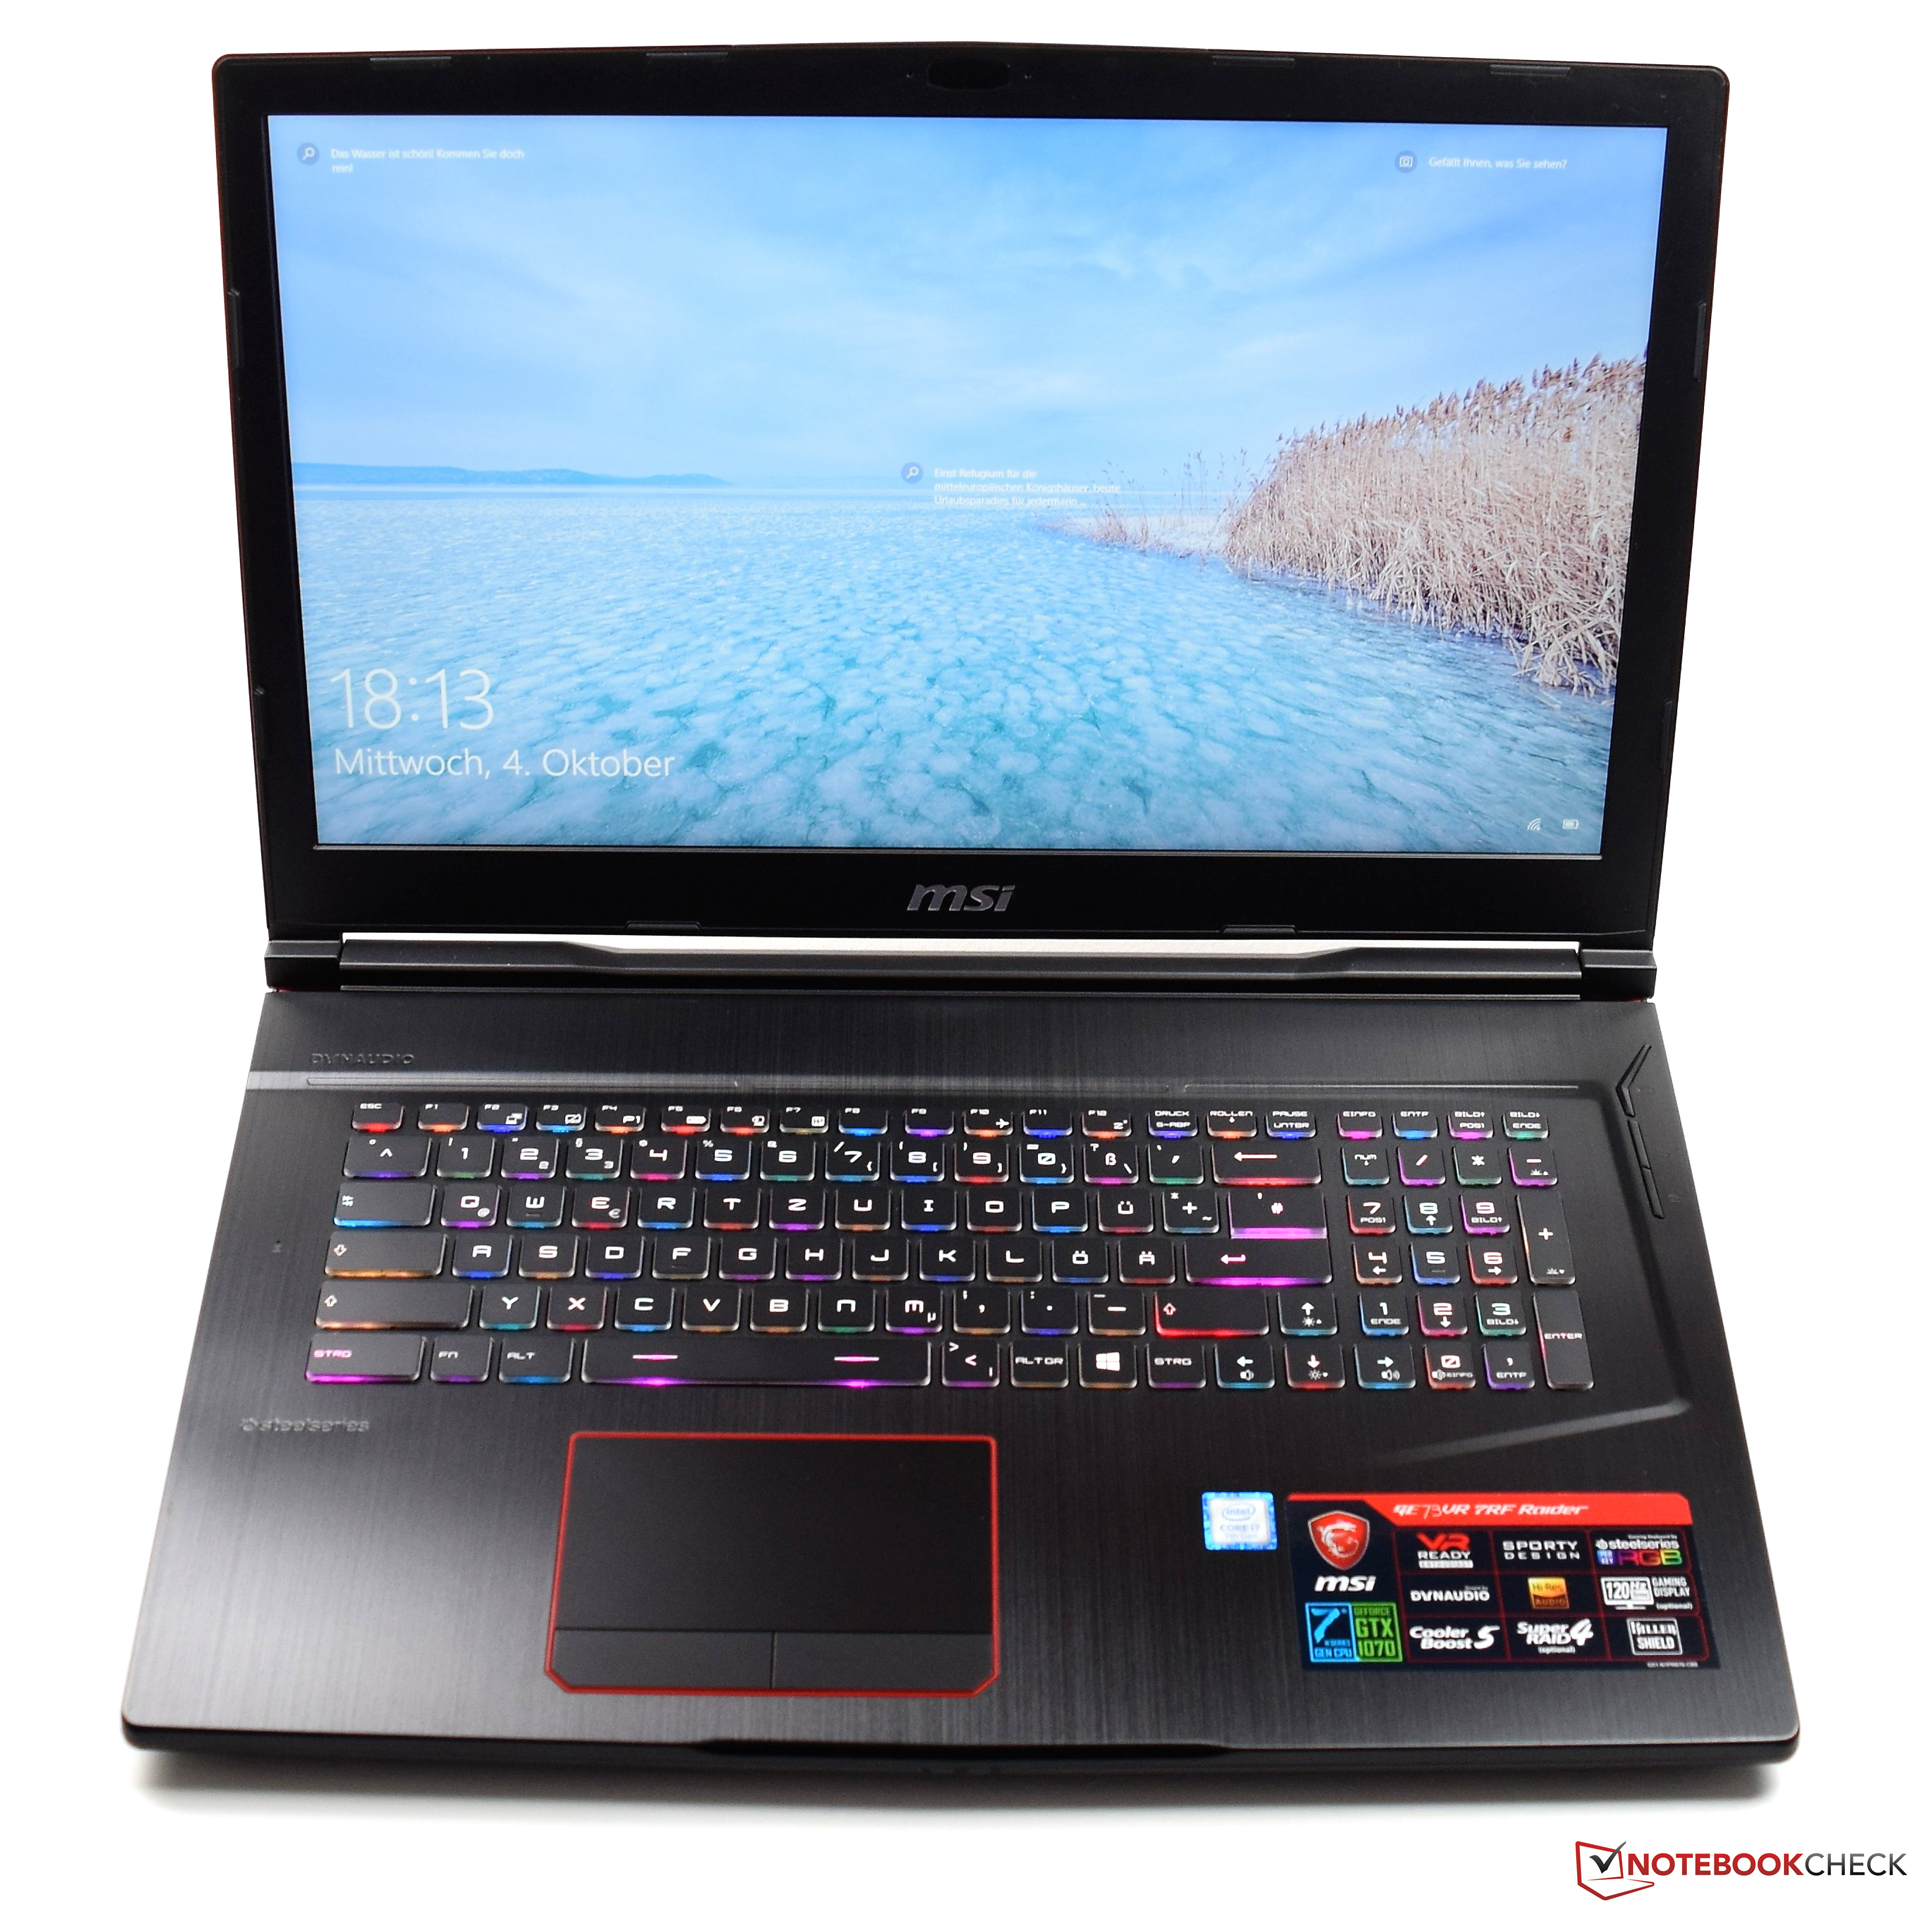
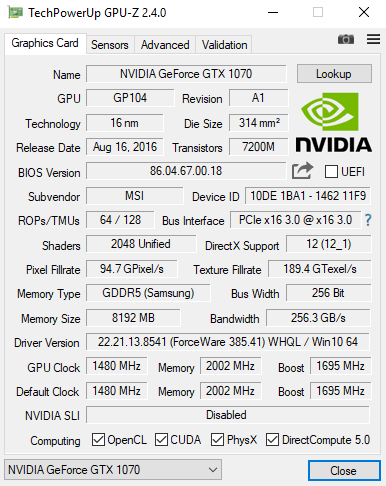
MSI GE73VR 7RF Raider är utan tvekan en spellaptop. Tillsammans så erbjuder en snabb Intel Core i7-7700HQ och ett Nvidia GeForce GTX 1070 en bra bas för spel. Vi gillade också skärmen, som får hjärtat hos varje gamer att slå snabbare med hög färgrymd och 120 Hz. För en enhet utrustad som i vårt test vill tillverkaren ha ~19 400 (1999 Euro), vilket är ungefär samma som för andra jämförbara modeller på 17-tum.
MSI GE73VR 7RF Raider erbjuder en bra bas för att möta dom höga krav som gamers ställler, även i ett längre perspektiv. Det högkvalitativa tangentbordet gör ett bra jobb och står verkligen ut med sitt färggranna ljus.
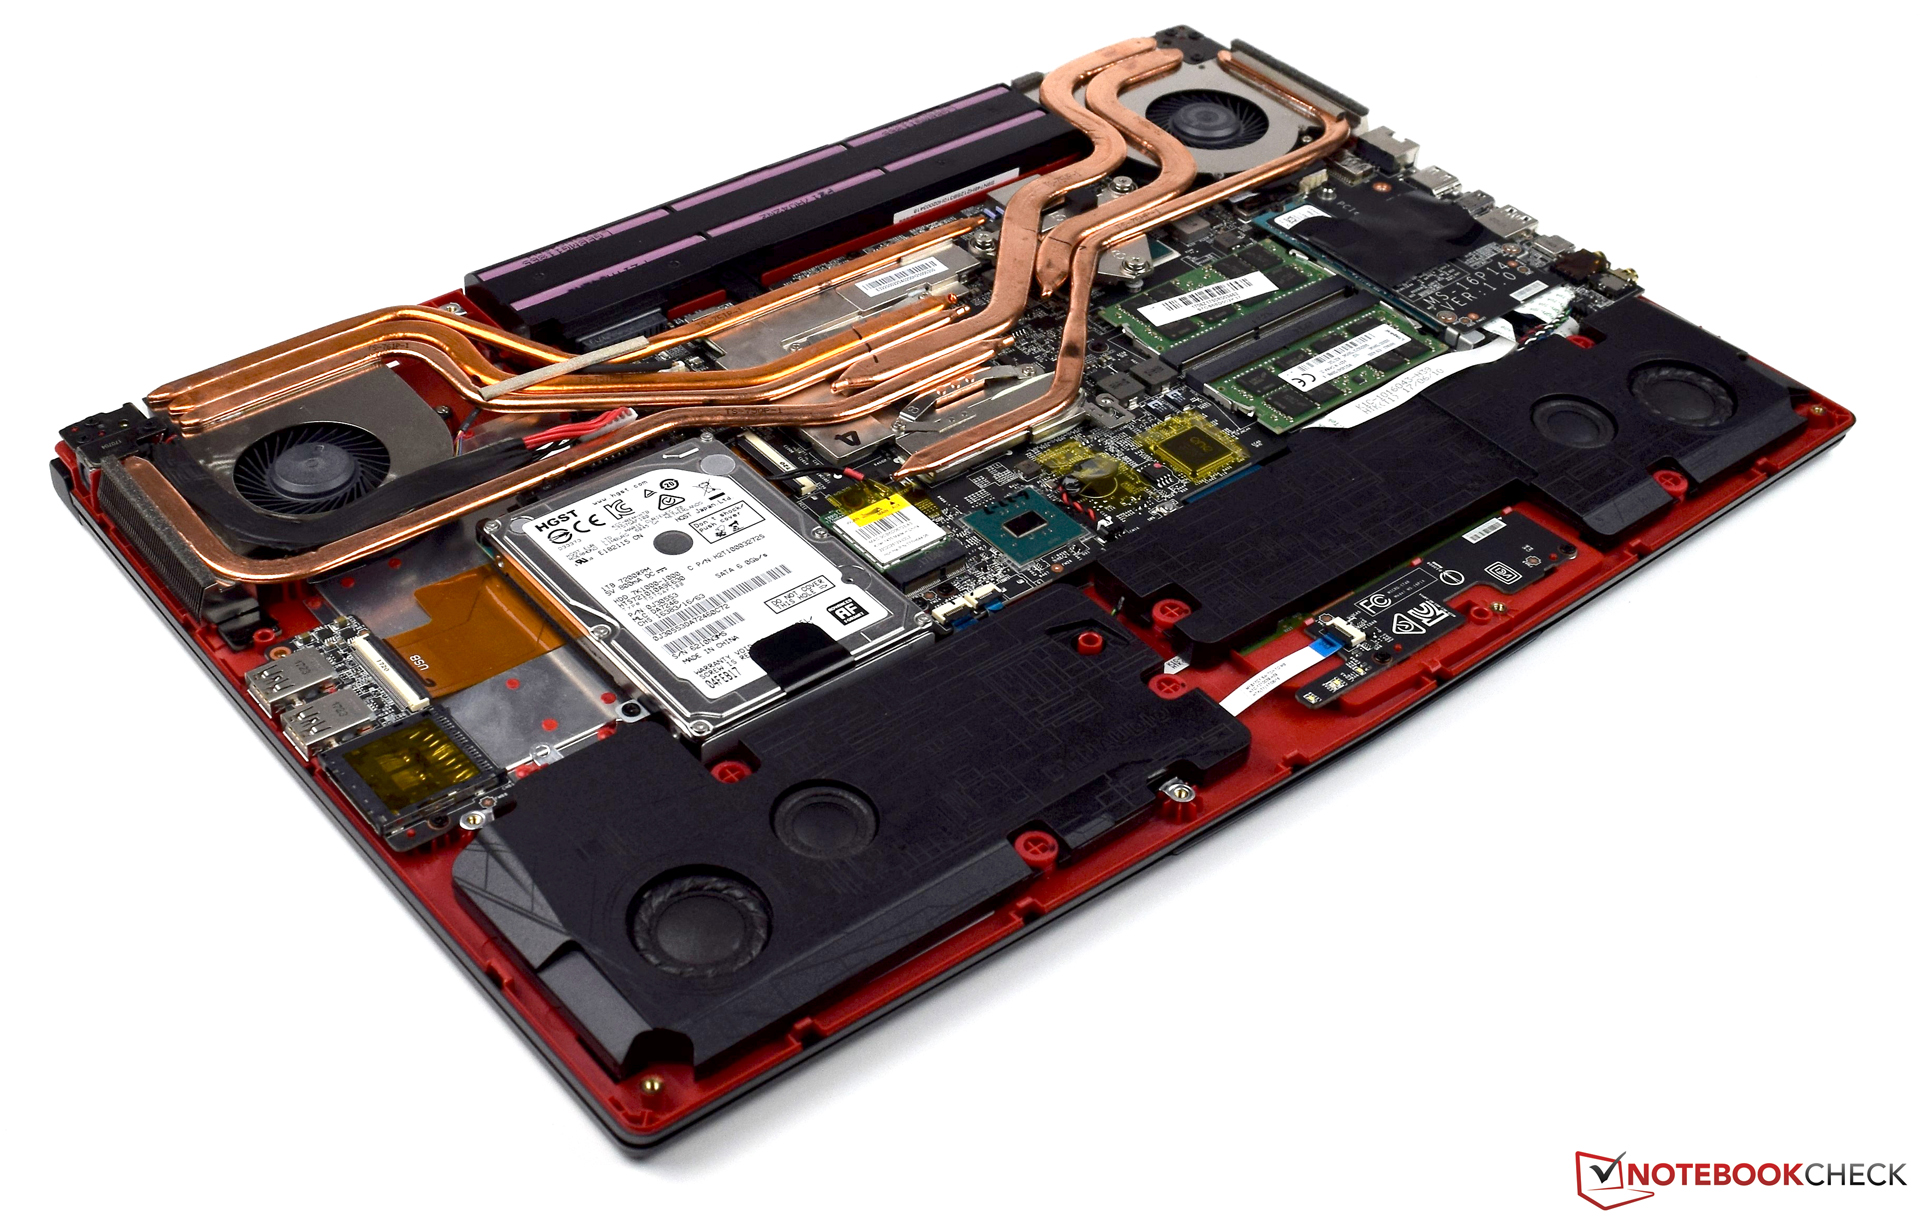
Förutom dom positiva egenskaperna, som inkluderar låg energiförbrukning, så finns det även punkter där MSI GE73VR 7RF Raider förtjänar en viss kritik. I fråga om lagring så hade vi föredragit en SSD som använder den betydligt snabbare PCIe-anslutningen för att fullt uttnyttja prestandan hos M.2-adaptern. Batteritiden lämnar oss också med blandade känslor då den inte kunde övertyga i jämförelserna. Men eftersom detta är en ren speldator så borde det inte vara en särskilt viktig faktor att väga in vid ett köp. Tillslut, generellt kan vi säga att med GE73VR 7RF Raider har MSI en väldigt bra spellaptop i ett hett segment av marknaden.
MSI GE73VR 7RF Raider
- 10/12/2017 v6 (old)
Sebastian Bade