Test: Gigabyte P57X v7 (sammanfattning)

| SD Card Reader | |
| average JPG Copy Test (av. of 3 runs) | |
| MSI GT73VR 7RF-296 | |
| Gigabyte P57X v7 | |
| Acer Predator 17 G9-793-77LG | |
| Gigabyte P57X v6 | |
| maximum AS SSD Seq Read Test (1GB) | |
| MSI GT73VR 7RF-296 | |
| Gigabyte P57X v7 | |
| Gigabyte P57X v6 | |
| Acer Predator 17 G9-793-77LG | |
| Networking | |
| iperf Server (receive) TCP 1 m 512KB | |
| Gigabyte P57X v6 | |
| Gigabyte P57X v7 | |
| iperf Client (transmit) TCP 1 m 512KB | |
| Gigabyte P57X v7 | |
| Gigabyte P57X v6 | |
| |||||||||||||||||||||||||
Distribution av ljusstyrkan: 86 %
Mitt på batteriet: 441.3 cd/m²
Kontrast: 1003:1 (Svärta: 0.44 cd/m²)
ΔE ColorChecker Calman: 5.1 | ∀{0.5-29.43 Ø4.71}
ΔE Greyscale Calman: 4.3 | ∀{0.09-98 Ø4.96}
100% sRGB (Argyll 1.6.3 3D)
87% AdobeRGB 1998 (Argyll 1.6.3 3D)
98.9% AdobeRGB 1998 (Argyll 3D)
100% sRGB (Argyll 3D)
87.8% Display P3 (Argyll 3D)
Gamma: 2.08
CCT: 7345 K
| Gigabyte P57X v7 SHP145E, IPS, 17.3", 3840x2160 | Gigabyte P57X v6 LGD0469, IPS, 17.3", 1920x1080 | Acer Predator 17 G9-793-77LG AU Optronics B173ZAN01.0 (AUO109B), IPS, 17.3", 3840x2160 | MSI GT73VR 7RF-296 N173HHE-G32 (CMN1747), TN LED, 17.3", 1920x1080 | EVGA SC17 GTX 1070 Sharp LQ173D1JW31, IPS, 17.3", 3840x2160 | |
|---|---|---|---|---|---|
| Display | -23% | 0% | -4% | -0% | |
| Display P3 Coverage (%) | 87.8 | 68 -23% | 86.9 -1% | 90.6 3% | 87.3 -1% |
| sRGB Coverage (%) | 100 | 87.5 -12% | 100 0% | 99.9 0% | 100 0% |
| AdobeRGB 1998 Coverage (%) | 98.9 | 64 -35% | 99.4 1% | 84.7 -14% | 98.8 0% |
| Response Times | 43% | 41% | 69% | 22% | |
| Response Time Grey 50% / Grey 80% * (ms) | 55.6 ? | 33.6 ? 40% | 37 ? 33% | 26 ? 53% | 45.6 ? 18% |
| Response Time Black / White * (ms) | 46.8 ? | 25.6 ? 45% | 24 ? 49% | 7 ? 85% | 35.2 ? 25% |
| PWM Frequency (Hz) | 1000 ? | 1042 ? | |||
| Screen | -11% | 9% | -30% | 2% | |
| Brightness middle (cd/m²) | 441.3 | 329.2 -25% | 336 -24% | 307 -30% | 399.1 -10% |
| Brightness (cd/m²) | 408 | 321 -21% | 320 -22% | 284 -30% | 360 -12% |
| Brightness Distribution (%) | 86 | 93 8% | 88 2% | 85 -1% | 81 -6% |
| Black Level * (cd/m²) | 0.44 | 0.267 39% | 0.25 43% | 0.25 43% | 0.4 9% |
| Contrast (:1) | 1003 | 1233 23% | 1344 34% | 1228 22% | 998 0% |
| Colorchecker dE 2000 * | 5.1 | 5.93 -16% | 3.61 29% | 9.65 -89% | 4.78 6% |
| Colorchecker dE 2000 max. * | 9.8 | 11.07 -13% | 6.02 39% | 16.36 -67% | 7.65 22% |
| Greyscale dE 2000 * | 4.3 | 6.72 -56% | 4.78 -11% | 10.07 -134% | 3.8 12% |
| Gamma | 2.08 106% | 2.12 104% | 2.32 95% | 2.12 104% | 2.03 108% |
| CCT | 7345 88% | 7611 85% | 6185 105% | 12145 54% | 7288 89% |
| Color Space (Percent of AdobeRGB 1998) (%) | 87 | 57 -34% | 88 1% | 75 -14% | 86.9 0% |
| Color Space (Percent of sRGB) (%) | 100 | 87 -13% | 100 0% | 100 0% | 100 0% |
| Totalt genomsnitt (program/inställningar) | 3% /
-6% | 17% /
12% | 12% /
-12% | 8% /
4% |
* ... mindre är bättre
Visa svarstider
| ↔ Svarstid svart till vitt | ||
|---|---|---|
| 46.8 ms ... stiga ↗ och falla ↘ kombinerat | ↗ 10.4 ms stiga | 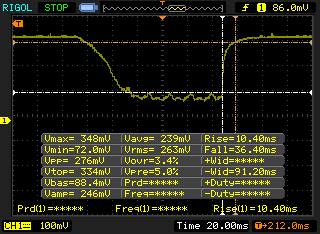 |
| ↘ 36.4 ms hösten | ||
| Skärmen visar långsamma svarsfrekvenser i våra tester och kommer att vara otillfredsställande för spelare. I jämförelse sträcker sig alla testade enheter från 0.1 (minst) till 240 (maximalt) ms. » 99 % av alla enheter är bättre. Detta innebär att den uppmätta svarstiden är sämre än genomsnittet av alla testade enheter (19.8 ms). | ||
| ↔ Svarstid 50 % grått till 80 % grått | ||
| 55.6 ms ... stiga ↗ och falla ↘ kombinerat | ↗ 18.4 ms stiga | 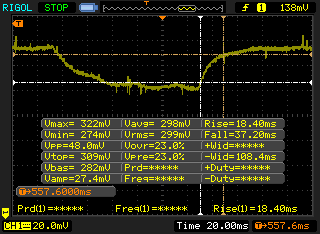 |
| ↘ 37.2 ms hösten | ||
| Skärmen visar långsamma svarsfrekvenser i våra tester och kommer att vara otillfredsställande för spelare. I jämförelse sträcker sig alla testade enheter från 0.165 (minst) till 636 (maximalt) ms. » 92 % av alla enheter är bättre. Detta innebär att den uppmätta svarstiden är sämre än genomsnittet av alla testade enheter (31 ms). | ||
Skärmflimmer / PWM (Puls-Width Modulation)
| Skärmflimmer / PWM upptäckt | 1000 Hz | ≤ 29 % ljusstyrka inställning | 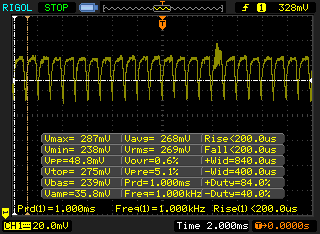 |
Displayens bakgrundsbelysning flimrar vid 1000 Hz (i värsta fall, t.ex. med PWM) Flimrande upptäckt vid en ljusstyrkeinställning på 29 % och lägre. Det ska inte finnas något flimmer eller PWM över denna ljusstyrkeinställning. Frekvensen för 1000 Hz är ganska hög, så de flesta användare som är känsliga för PWM bör inte märka något flimmer. Som jämförelse: 52 % av alla testade enheter använder inte PWM för att dämpa skärmen. Om PWM upptäcktes mättes ett medelvärde av 7754 (minst: 5 - maximum: 343500) Hz. | |||
| Cinebench R11.5 | |
| CPU Single 64Bit | |
| MSI GT73VR 7RF-296 | |
| Gigabyte P57X v7 | |
| EVGA SC17 GTX 1070 | |
| Gigabyte P57X v6 | |
| CPU Multi 64Bit | |
| MSI GT73VR 7RF-296 | |
| Gigabyte P57X v7 | |
| EVGA SC17 GTX 1070 | |
| Gigabyte P57X v6 | |
| wPrime 2.10 - 1024m | |
| Gigabyte P57X v6 | |
| Gigabyte P57X v7 | |
| EVGA SC17 GTX 1070 | |
* ... mindre är bättre
| PCMark 8 | |
| Home Score Accelerated v2 | |
| EVGA SC17 GTX 1070 | |
| Gigabyte P57X v6 | |
| Acer Predator 17 G9-793-77LG | |
| Gigabyte P57X v7 | |
| Work Score Accelerated v2 | |
| Gigabyte P57X v6 | |
| EVGA SC17 GTX 1070 | |
| Gigabyte P57X v7 | |
| Creative Score Accelerated v2 | |
| EVGA SC17 GTX 1070 | |
| Gigabyte P57X v6 | |
| Gigabyte P57X v7 | |
| Acer Predator 17 G9-793-77LG | |
| PCMark 8 Home Score Accelerated v2 | 3569 poäng | |
| PCMark 8 Creative Score Accelerated v2 | 5161 poäng | |
| PCMark 8 Work Score Accelerated v2 | 4218 poäng | |
Hjälp | ||
| Gigabyte P57X v7 Transcend MTS800 256GB M.2 (TS256GMTS800) | Gigabyte P57X v6 Transcend MTS800 256GB M.2 (TS256GMTS800) | MSI GT73VR 7RF-296 2x Samsung SM951 MZVPV256HDGL (RAID 0) | EVGA SC17 GTX 1070 Samsung SM951 MZVPV256 m.2 | |
|---|---|---|---|---|
| CrystalDiskMark 3.0 | -2% | 352% | 174% | |
| Read Seq (MB/s) | 517 | 481.7 -7% | 3219 523% | 1658 221% |
| Write Seq (MB/s) | 305.7 | 315.4 3% | 2572 741% | 1249 309% |
| Read 512 (MB/s) | 315 | 303.1 -4% | 1776 464% | 1044 231% |
| Write 512 (MB/s) | 306.1 | 314.4 3% | 2445 699% | 1254 310% |
| Read 4k (MB/s) | 26.04 | 25.93 0% | 51.1 96% | 51.6 98% |
| Write 4k (MB/s) | 82.3 | 84.6 3% | 141.3 72% | 145.2 76% |
| Read 4k QD32 (MB/s) | 281.3 | 273.9 -3% | 658 134% | 601 114% |
| Write 4k QD32 (MB/s) | 296 | 274.9 -7% | 554 87% | 386.8 31% |

| 3DMark 11 | |
| 1280x720 Performance GPU | |
| MSI GT73VR 7RF-296 | |
| Gigabyte P57X v6 | |
| Gigabyte P57X v7 | |
| EVGA SC17 GTX 1070 | |
| Acer Predator 17 G9-793-77LG | |
| 1280x720 Performance Combined | |
| MSI GT73VR 7RF-296 | |
| EVGA SC17 GTX 1070 | |
| Gigabyte P57X v7 | |
| Gigabyte P57X v6 | |
| Acer Predator 17 G9-793-77LG | |
| 3DMark | |
| 1280x720 Cloud Gate Standard Graphics | |
| MSI GT73VR 7RF-296 | |
| EVGA SC17 GTX 1070 | |
| Acer Predator 17 G9-793-77LG | |
| Gigabyte P57X v6 | |
| Gigabyte P57X v7 | |
| 1920x1080 Fire Strike Graphics | |
| MSI GT73VR 7RF-296 | |
| Gigabyte P57X v7 | |
| EVGA SC17 GTX 1070 | |
| Acer Predator 17 G9-793-77LG | |
| Fire Strike Extreme Graphics | |
| Gigabyte P57X v6 | |
| Gigabyte P57X v7 | |
| EVGA SC17 GTX 1070 | |
| 3840x2160 Fire Strike Ultra Graphics | |
| Gigabyte P57X v7 | |
| EVGA SC17 GTX 1070 | |
| 1920x1080 Ice Storm Extreme Graphics | |
| EVGA SC17 GTX 1070 | |
| Gigabyte P57X v6 | |
| Gigabyte P57X v7 | |
| 3DMark 06 Standard Score | 28053 poäng | |
| 3DMark 11 Performance | 16753 poäng | |
| 3DMark Cloud Gate Standard Score | 24337 poäng | |
| 3DMark Fire Strike Score | 13444 poäng | |
| 3DMark Fire Strike Extreme Score | 7498 poäng | |
Hjälp | ||
| Batman: Arkham Knight - 3840x2160 High / On (Interactive Smoke & Paper Debris Off) AA:SM AF:8x (sortera efter värde) | |
| Gigabyte P57X v7 | |
| EVGA SC17 GTX 1070 | |
| Mafia 2 - 1920x1080 high AA:0x AF:16x (sortera efter värde) | |
| Gigabyte P57X v7 | |
| Rise of the Tomb Raider - 3840x2160 High Preset AA:FX AF:4x (sortera efter värde) | |
| Gigabyte P57X v7 | |
| Acer Predator 17 G9-793-77LG | |
| EVGA SC17 GTX 1070 | |
| Sleeping Dogs - 1920x1080 Extreme Preset AA:Extreme (sortera efter värde) | |
| Gigabyte P57X v7 | |
| Fallout 4 - 3840x2160 High Preset AA:T AF:16x (sortera efter värde) | |
| Gigabyte P57X v7 | |
| EVGA SC17 GTX 1070 | |
| BioShock Infinite - 1920x1080 Ultra Preset, DX11 (DDOF) (sortera efter värde) | |
| Gigabyte P57X v7 | |
| Gigabyte P57X v6 | |
| EVGA SC17 GTX 1070 | |
| låg | med. | hög | ultra | 4K | |
|---|---|---|---|---|---|
| Mafia 2 (2010) | 156.3 | ||||
| Sleeping Dogs (2012) | 116.3 | ||||
| BioShock Infinite (2013) | 130 | ||||
| Batman: Arkham Knight (2015) | 47 | ||||
| Fallout 4 (2015) | 42 | ||||
| Rise of the Tomb Raider (2016) | 43 |
Ljudnivå
| Låg belastning |
| 30.4 / 32.1 / 32.1 dB(A) |
| Hög belastning |
| 45.6 / 51.5 dB(A) |
 | ||
30 dB tyst 40 dB(A) hörbar 50 dB(A) högt ljud |
||
min: | ||
| Gigabyte P57X v7 GeForce GTX 1070 Mobile, i7-7700HQ, Transcend MTS800 256GB M.2 (TS256GMTS800) | Gigabyte P57X v6 GeForce GTX 1070 Mobile, 6700HQ, Transcend MTS800 256GB M.2 (TS256GMTS800) | Acer Predator 17 G9-793-77LG GeForce GTX 1070 Mobile, 6700HQ, Toshiba NVMe THNSN5256GPU7 | MSI GT73VR 7RF-296 GeForce GTX 1080 Mobile, i7-7820HK, 2x Samsung SM951 MZVPV256HDGL (RAID 0) | EVGA SC17 GTX 1070 GeForce GTX 1070 Mobile, 6820HK, Samsung SM951 MZVPV256 m.2 | |
|---|---|---|---|---|---|
| Noise | -4% | -7% | -6% | -4% | |
| av / miljö * (dB) | 29 | 29.7 -2% | 31 -7% | 30 -3% | 29.2 -1% |
| Idle Minimum * (dB) | 30.4 | 33.2 -9% | 33 -9% | 34 -12% | 33.9 -12% |
| Idle Average * (dB) | 32.1 | 33.2 -3% | 34 -6% | 35 -9% | 33.9 -6% |
| Idle Maximum * (dB) | 32.1 | 33.2 -3% | 40 -25% | 37 -15% | 33.9 -6% |
| Load Average * (dB) | 45.6 | 47.5 -4% | 44 4% | 39 14% | 43.8 4% |
| Load Maximum * (dB) | 51.5 | 52.5 -2% | 50 3% | 56 -9% | 53.4 -4% |
* ... mindre är bättre
(-) Den maximala temperaturen på ovansidan är 51.2 °C / 124 F, jämfört med genomsnittet av 40.4 °C / 105 F , allt från 21.2 till 68.8 °C för klassen Gaming.
(-) Botten värms upp till maximalt 56.8 °C / 134 F, jämfört med genomsnittet av 43.2 °C / 110 F
(+) Vid tomgångsbruk är medeltemperaturen för ovansidan 24.7 °C / 76 F, jämfört med enhetsgenomsnittet på 33.9 °C / ### class_avg_f### F.
(+) Handledsstöden och pekplattan är kallare än hudtemperaturen med maximalt 23.6 °C / 74.5 F och är därför svala att ta på.
(+) Medeltemperaturen för handledsstödsområdet på liknande enheter var 28.8 °C / 83.8 F (+5.2 °C / 9.3 F).
Gigabyte P57X v7 ljudanalys
(-) | inte särskilt höga högtalare (70.5 dB)
Bas 100 - 315 Hz
(±) | reducerad bas - i genomsnitt 13.5% lägre än medianen
(±) | linjäriteten för basen är genomsnittlig (9.2% delta till föregående frekvens)
Mellan 400 - 2000 Hz
(+) | balanserad mellan - endast 4.1% från medianen
(±) | linjäriteten för mids är genomsnittlig (8.8% delta till föregående frekvens)
Högsta 2 - 16 kHz
(±) | högre toppar - i genomsnitt 7% högre än medianen
(±) | linjäriteten för toppar är genomsnittlig (11.2% delta till föregående frekvens)
Totalt 100 - 16 000 Hz
(-) | det totala ljudet är inte linjärt (30.3% skillnad mot median)
Jämfört med samma klass
» 96% av alla testade enheter i den här klassen var bättre, 2% liknande, 3% sämre
» Den bästa hade ett delta på 6%, genomsnittet var 18%, sämst var 132%
Jämfört med alla testade enheter
» 89% av alla testade enheter var bättre, 3% liknande, 9% sämre
» Den bästa hade ett delta på 4%, genomsnittet var 23%, sämst var 134%
Acer Predator 17 G9-793-77LG ljudanalys
(+) | högtalare kan spela relativt högt (83 dB)
Bas 100 - 315 Hz
(±) | reducerad bas - i genomsnitt 7.8% lägre än medianen
(±) | linjäriteten för basen är genomsnittlig (8.2% delta till föregående frekvens)
Mellan 400 - 2000 Hz
(+) | balanserad mellan - endast 4% från medianen
(+) | mids är linjära (4.6% delta till föregående frekvens)
Högsta 2 - 16 kHz
(+) | balanserade toppar - endast 3.7% från medianen
(±) | linjäriteten för toppar är genomsnittlig (7.1% delta till föregående frekvens)
Totalt 100 - 16 000 Hz
(+) | det totala ljudet är linjärt (12% skillnad mot median)
Jämfört med samma klass
» 12% av alla testade enheter i den här klassen var bättre, 4% liknande, 84% sämre
» Den bästa hade ett delta på 6%, genomsnittet var 18%, sämst var 132%
Jämfört med alla testade enheter
» 9% av alla testade enheter var bättre, 2% liknande, 88% sämre
» Den bästa hade ett delta på 4%, genomsnittet var 23%, sämst var 134%
| Av/Standby | |
| Låg belastning | |
| Hög belastning |
|
Förklaring:
min: | |
| Gigabyte P57X v7 i7-7700HQ, GeForce GTX 1070 Mobile, Transcend MTS800 256GB M.2 (TS256GMTS800), IPS, 3840x2160, 17.3" | Gigabyte P57X v6 6700HQ, GeForce GTX 1070 Mobile, Transcend MTS800 256GB M.2 (TS256GMTS800), IPS, 1920x1080, 17.3" | Acer Predator 17 G9-793-77LG 6700HQ, GeForce GTX 1070 Mobile, Toshiba NVMe THNSN5256GPU7, IPS, 3840x2160, 17.3" | MSI GT73VR 7RF-296 i7-7820HK, GeForce GTX 1080 Mobile, 2x Samsung SM951 MZVPV256HDGL (RAID 0), TN LED, 1920x1080, 17.3" | EVGA SC17 GTX 1070 6820HK, GeForce GTX 1070 Mobile, Samsung SM951 MZVPV256 m.2, IPS, 3840x2160, 17.3" | |
|---|---|---|---|---|---|
| Power Consumption | -2% | -31% | -38% | -32% | |
| Idle Minimum * (Watt) | 15.7 | 18.4 -17% | 25 -59% | 29 -85% | 27.3 -74% |
| Idle Average * (Watt) | 23.4 | 22.8 3% | 35 -50% | 35 -50% | 34.9 -49% |
| Idle Maximum * (Watt) | 23.5 | 24 -2% | 46 -96% | 40 -70% | 37.6 -60% |
| Load Average * (Watt) | 184.6 | 175.5 5% | 103 44% | 94 49% | 164.4 11% |
| Load Maximum * (Watt) | 233.1 | 229.5 2% | 223 4% | 315 -35% | 202.5 13% |
* ... mindre är bättre
| Gigabyte P57X v7 i7-7700HQ, GeForce GTX 1070 Mobile, 75.81 Wh | Gigabyte P57X v6 6700HQ, GeForce GTX 1070 Mobile, 75.81 Wh | Acer Predator 17 G9-793-77LG 6700HQ, GeForce GTX 1070 Mobile, 88 Wh | MSI GT73VR 7RF-296 i7-7820HK, GeForce GTX 1080 Mobile, 75.2 Wh | EVGA SC17 GTX 1070 6820HK, GeForce GTX 1070 Mobile, 74.48 Wh | |
|---|---|---|---|---|---|
| Batteridrifttid | 33% | 9% | 4% | -16% | |
| Reader / Idle (h) | 4.3 | 7 63% | 4.6 7% | 4 -7% | |
| WiFi v1.3 (h) | 2.6 | 3.4 31% | 3.3 27% | 2.7 4% | 2.7 4% |
| Load (h) | 1.6 | 1.7 6% | 1.5 -6% | 0.9 -44% |
För
Emot
Läs det längre originaltestet på engelska här.
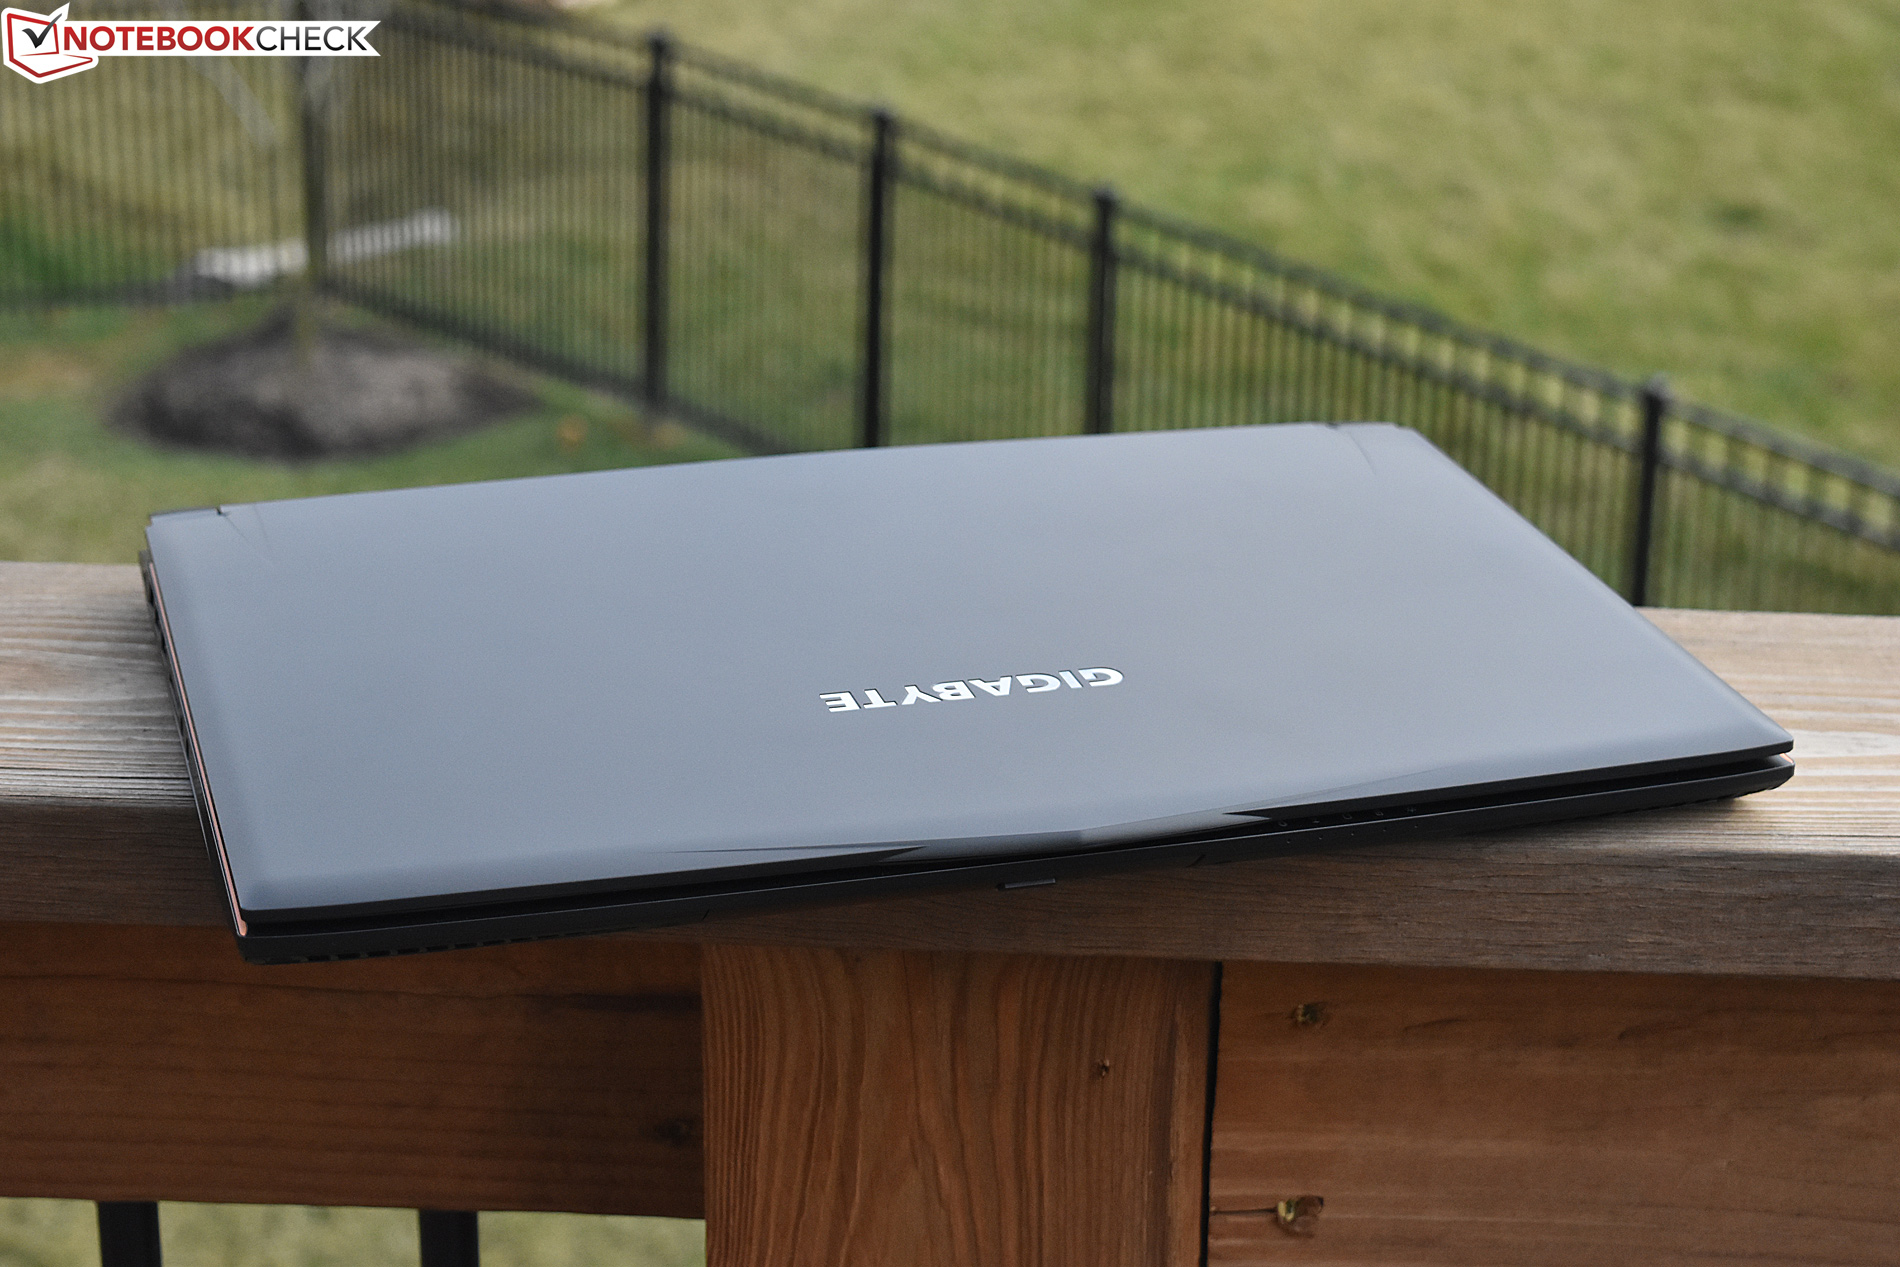
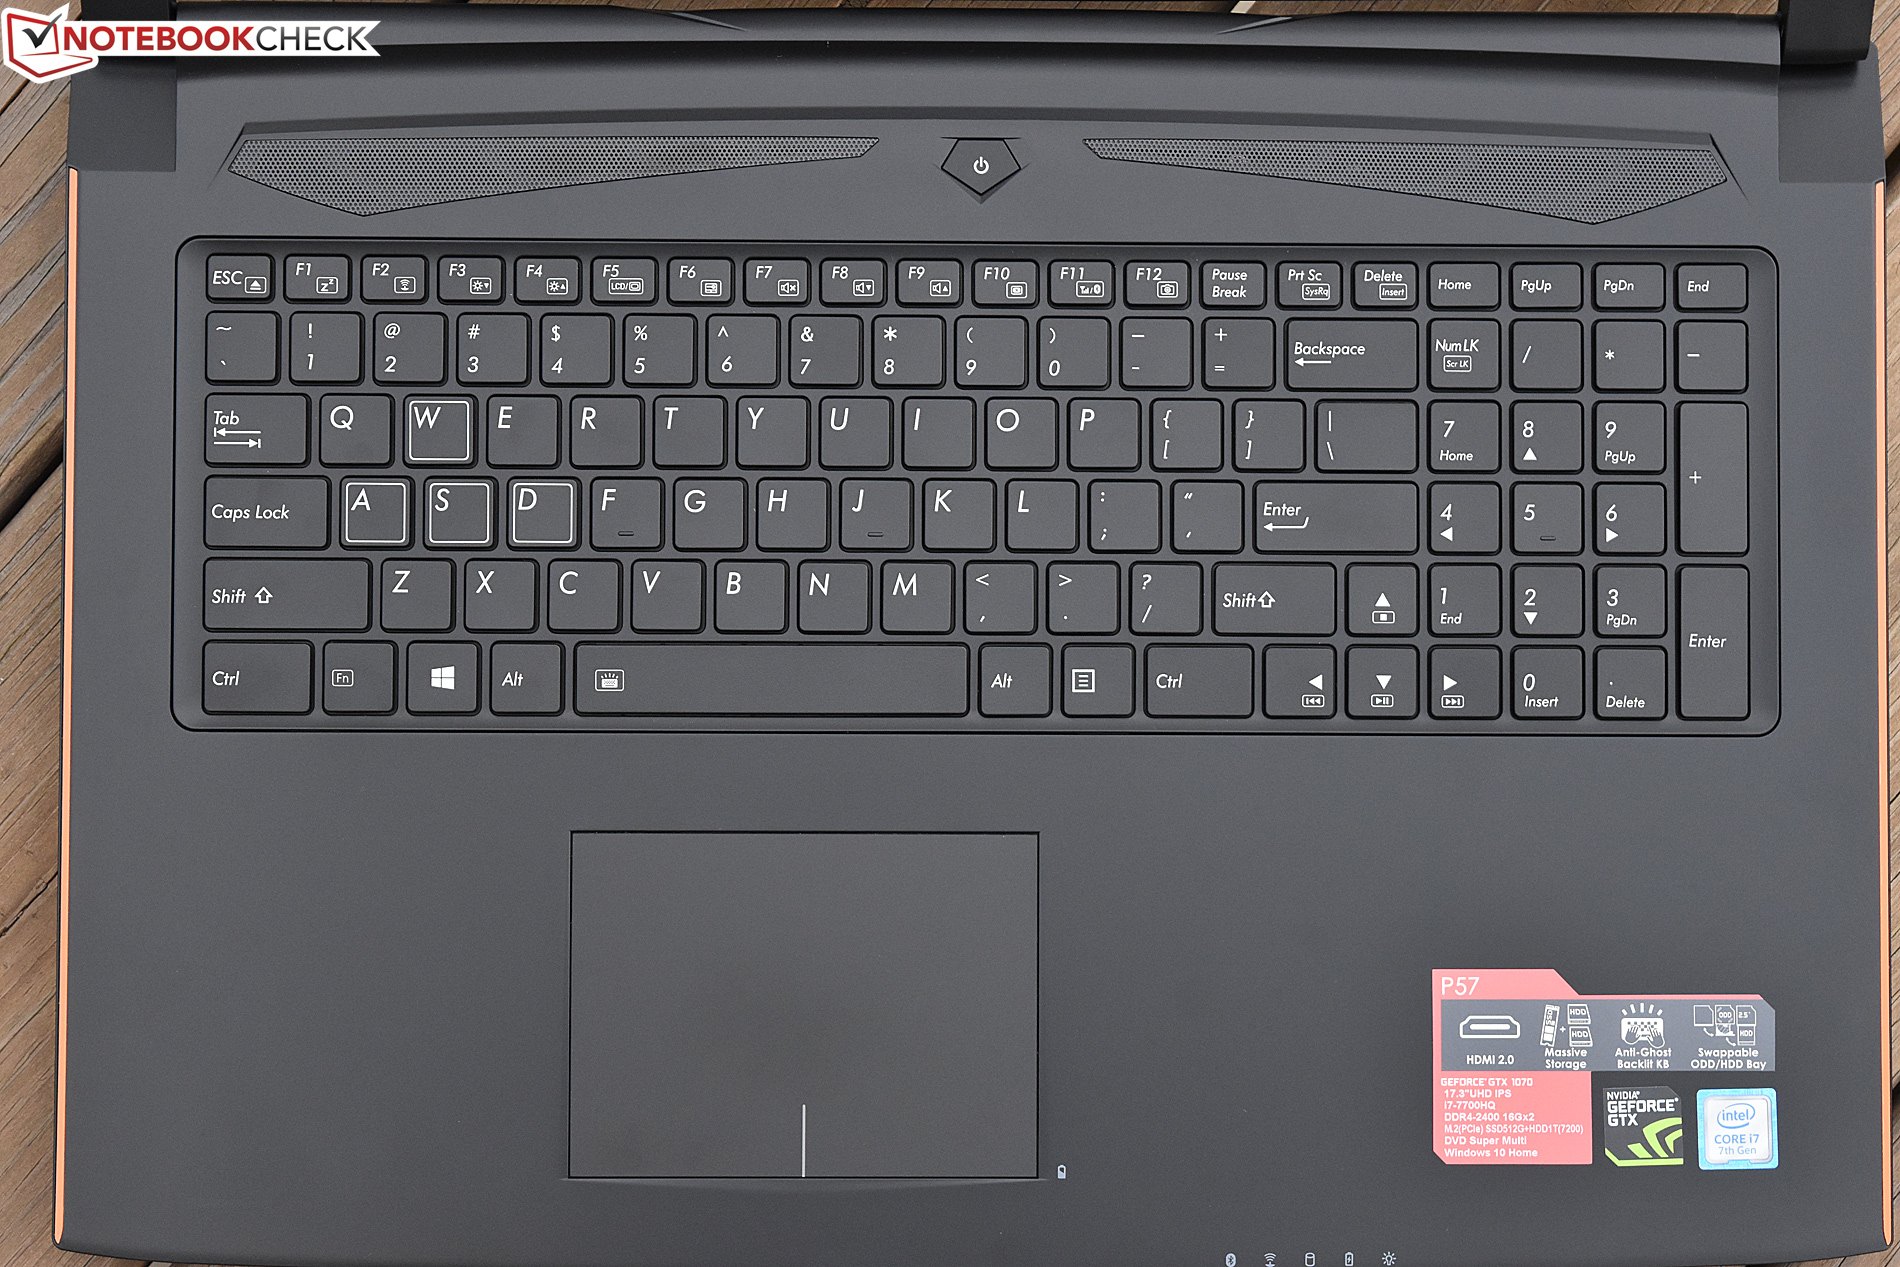
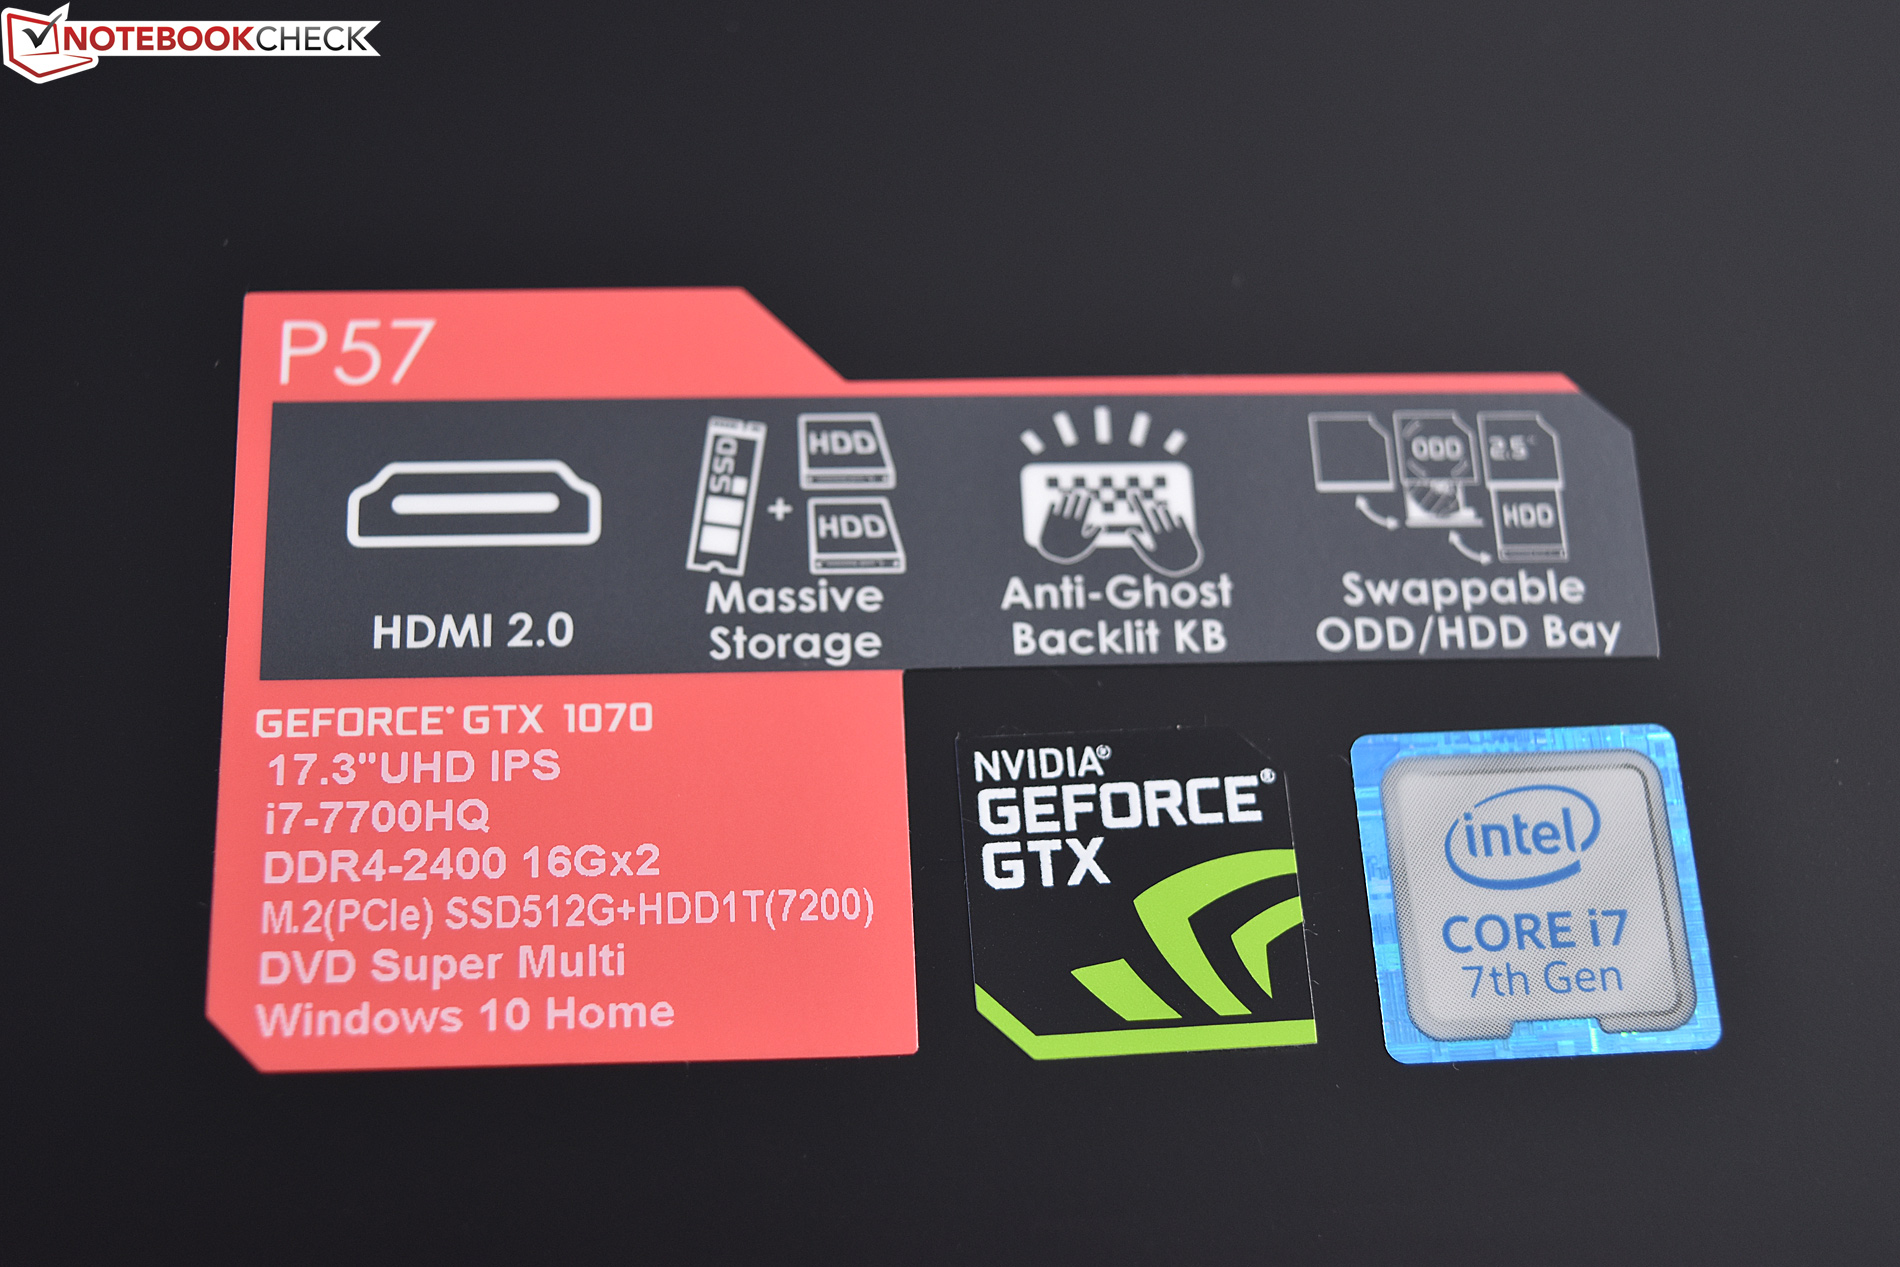
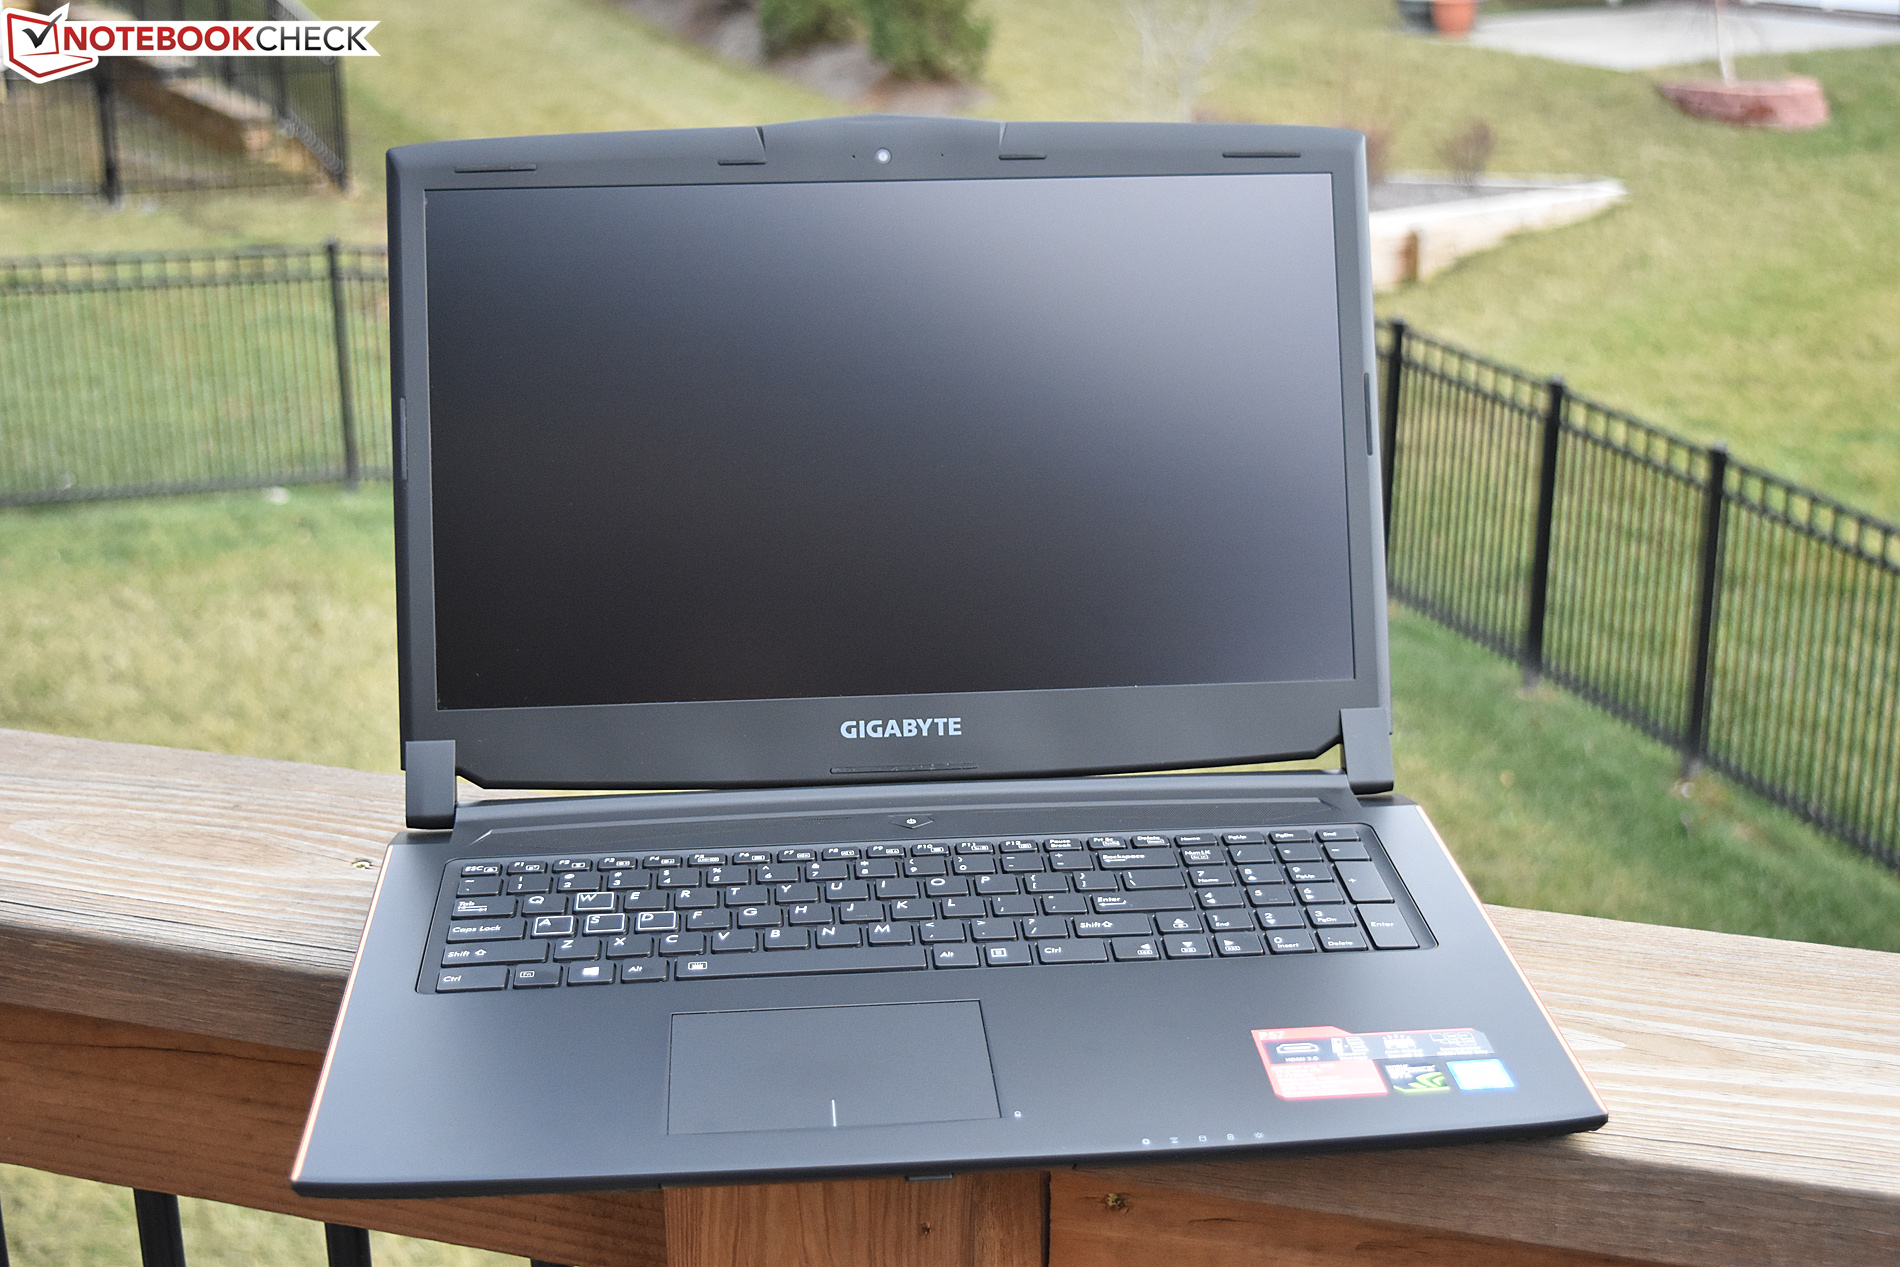
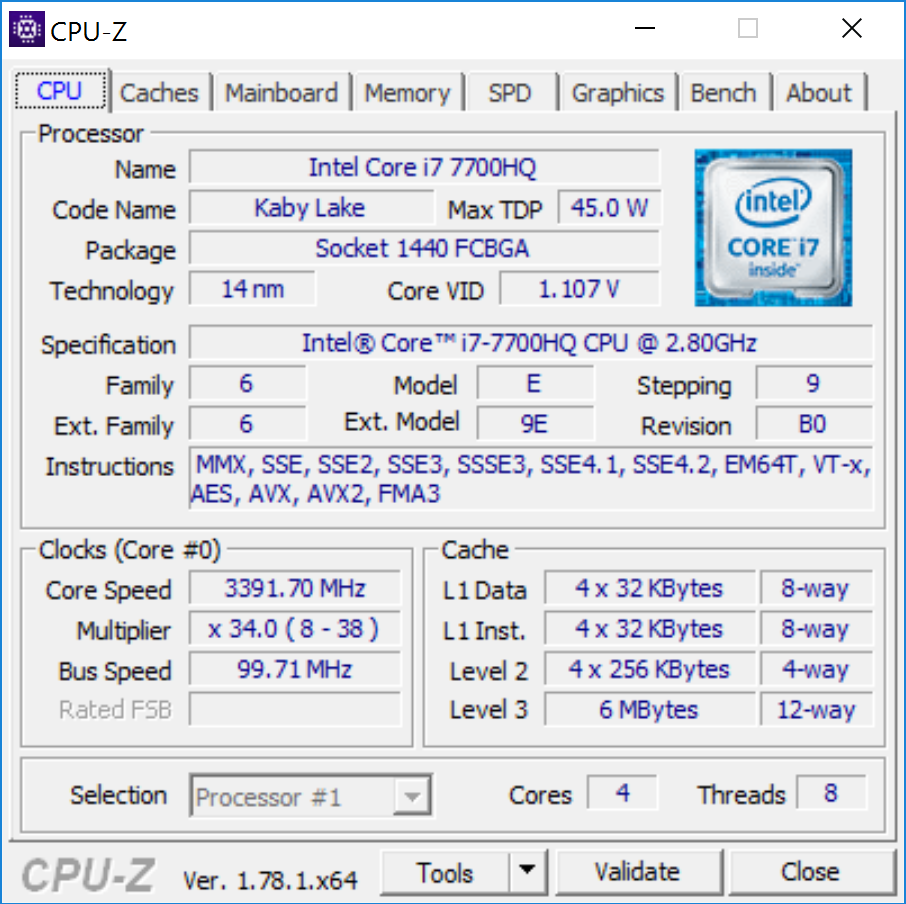
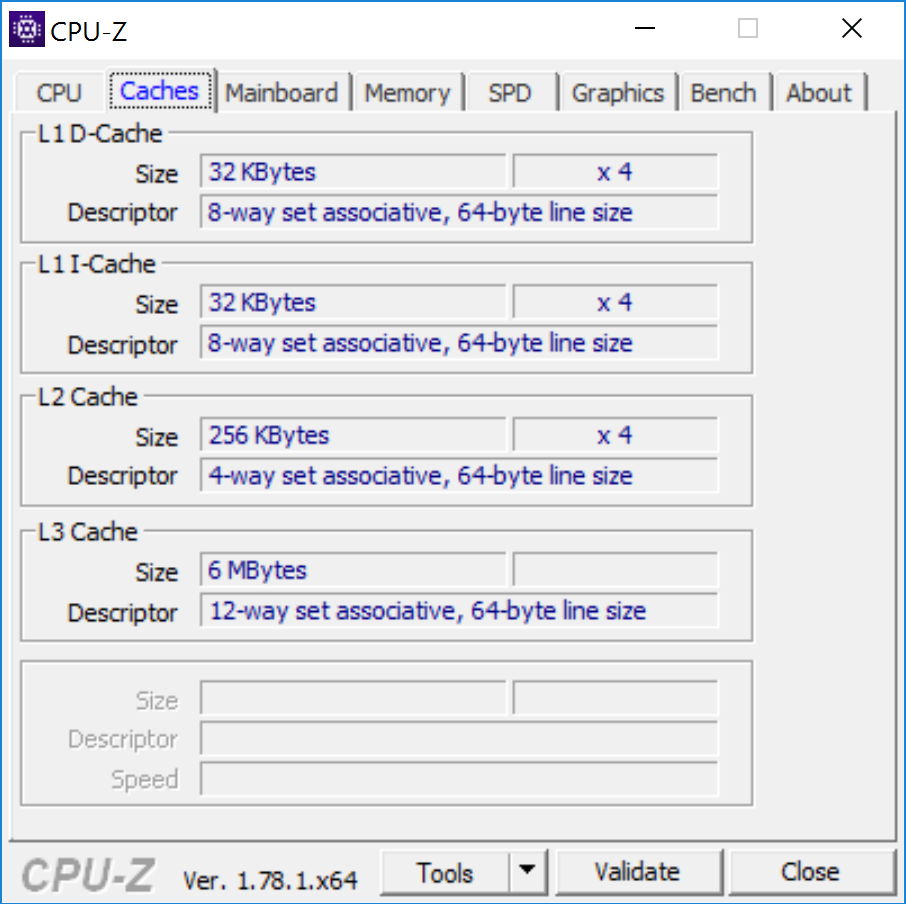
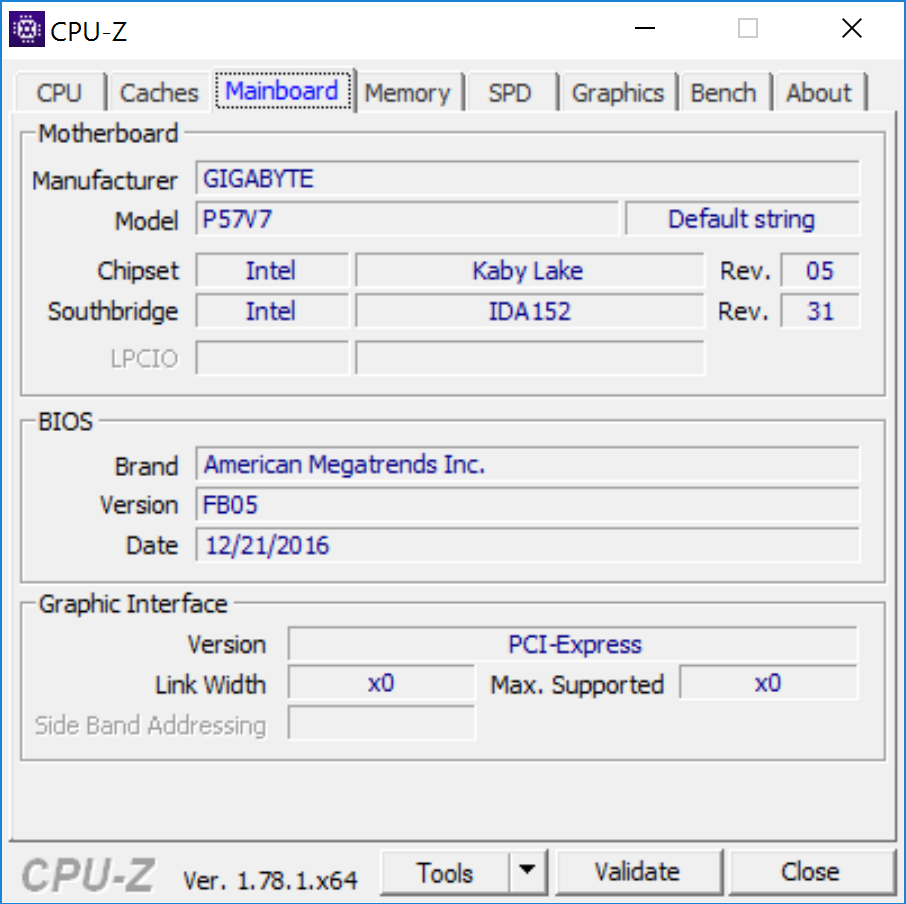
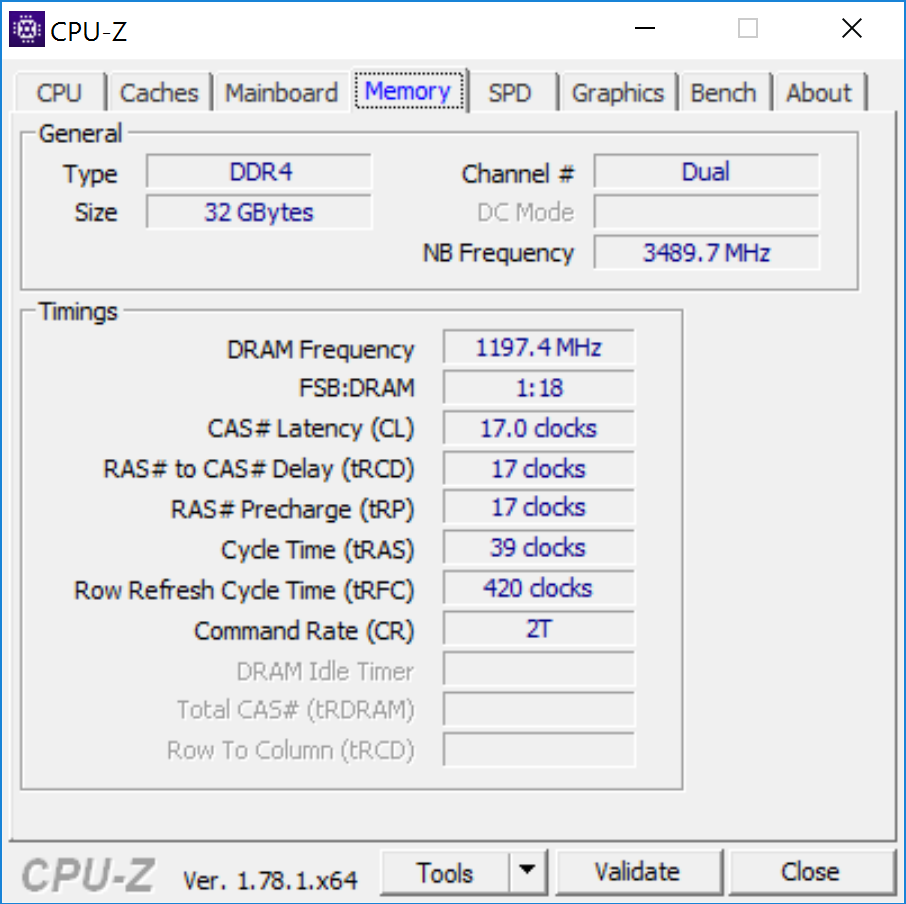
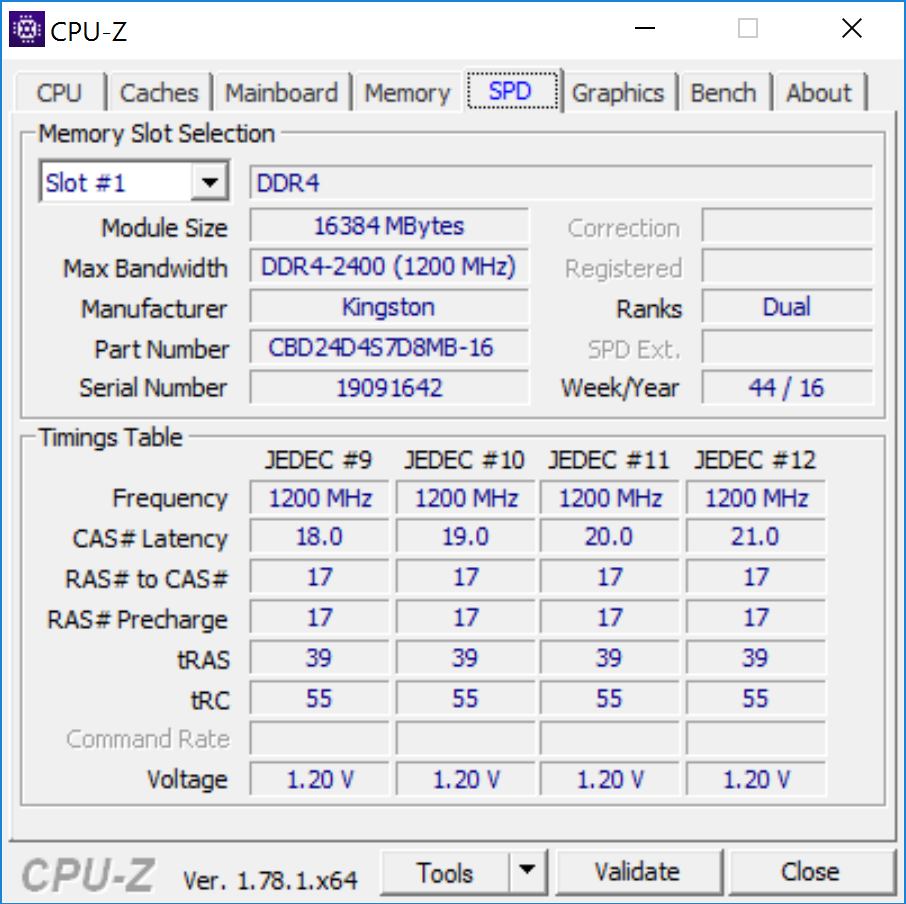
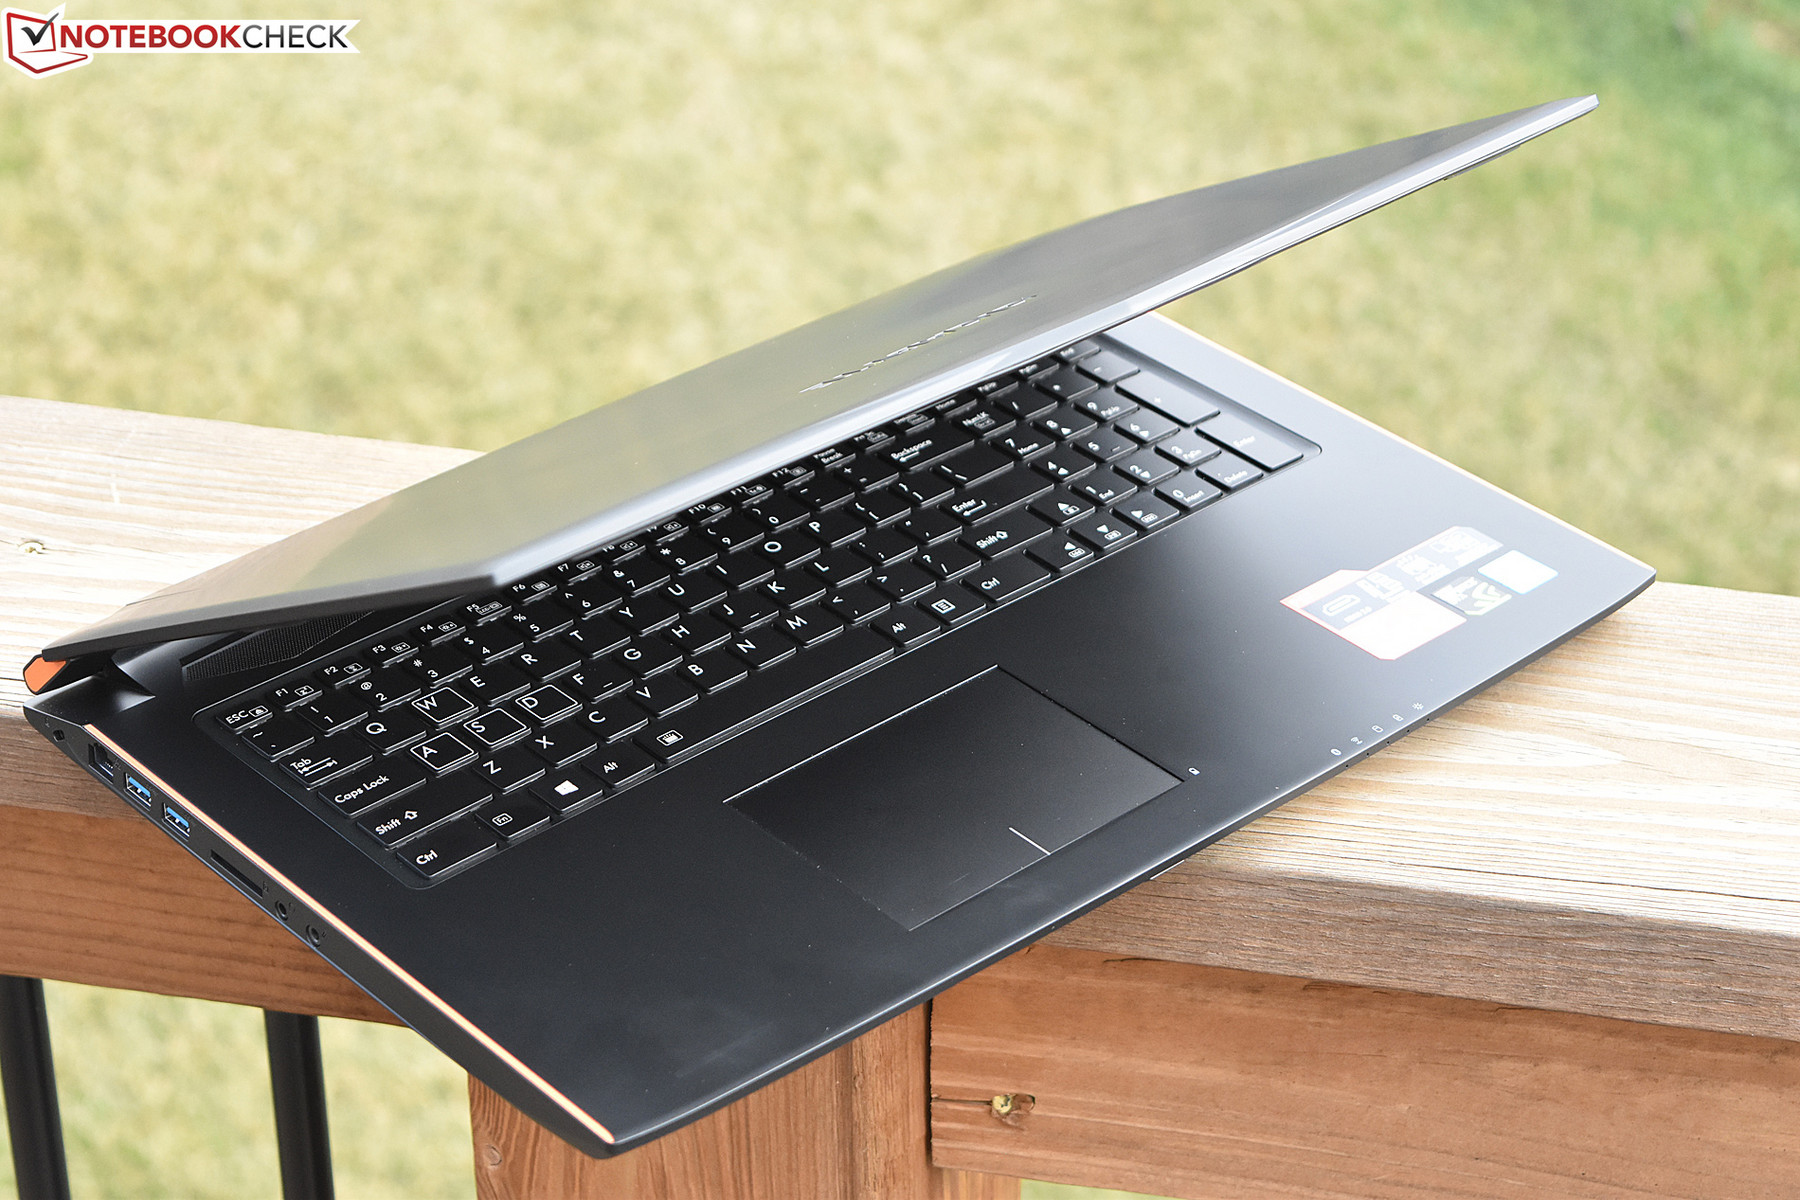
Egentligen har inte mycket förändrats mellan P57X v6 och den nyare v7 som vi testat idag. Båda har identiska plastchassin, liknande krestkort och interna komponenter, och till och med samma GPU och SSD. De största (och kanske enda märkbara) skillnaderna i v7 är en Kaby Lake Core i7-7700HQ-CPU, bättre 4K-skärm och dubbelt så mycket RAM (med snabbare minneshastighet).
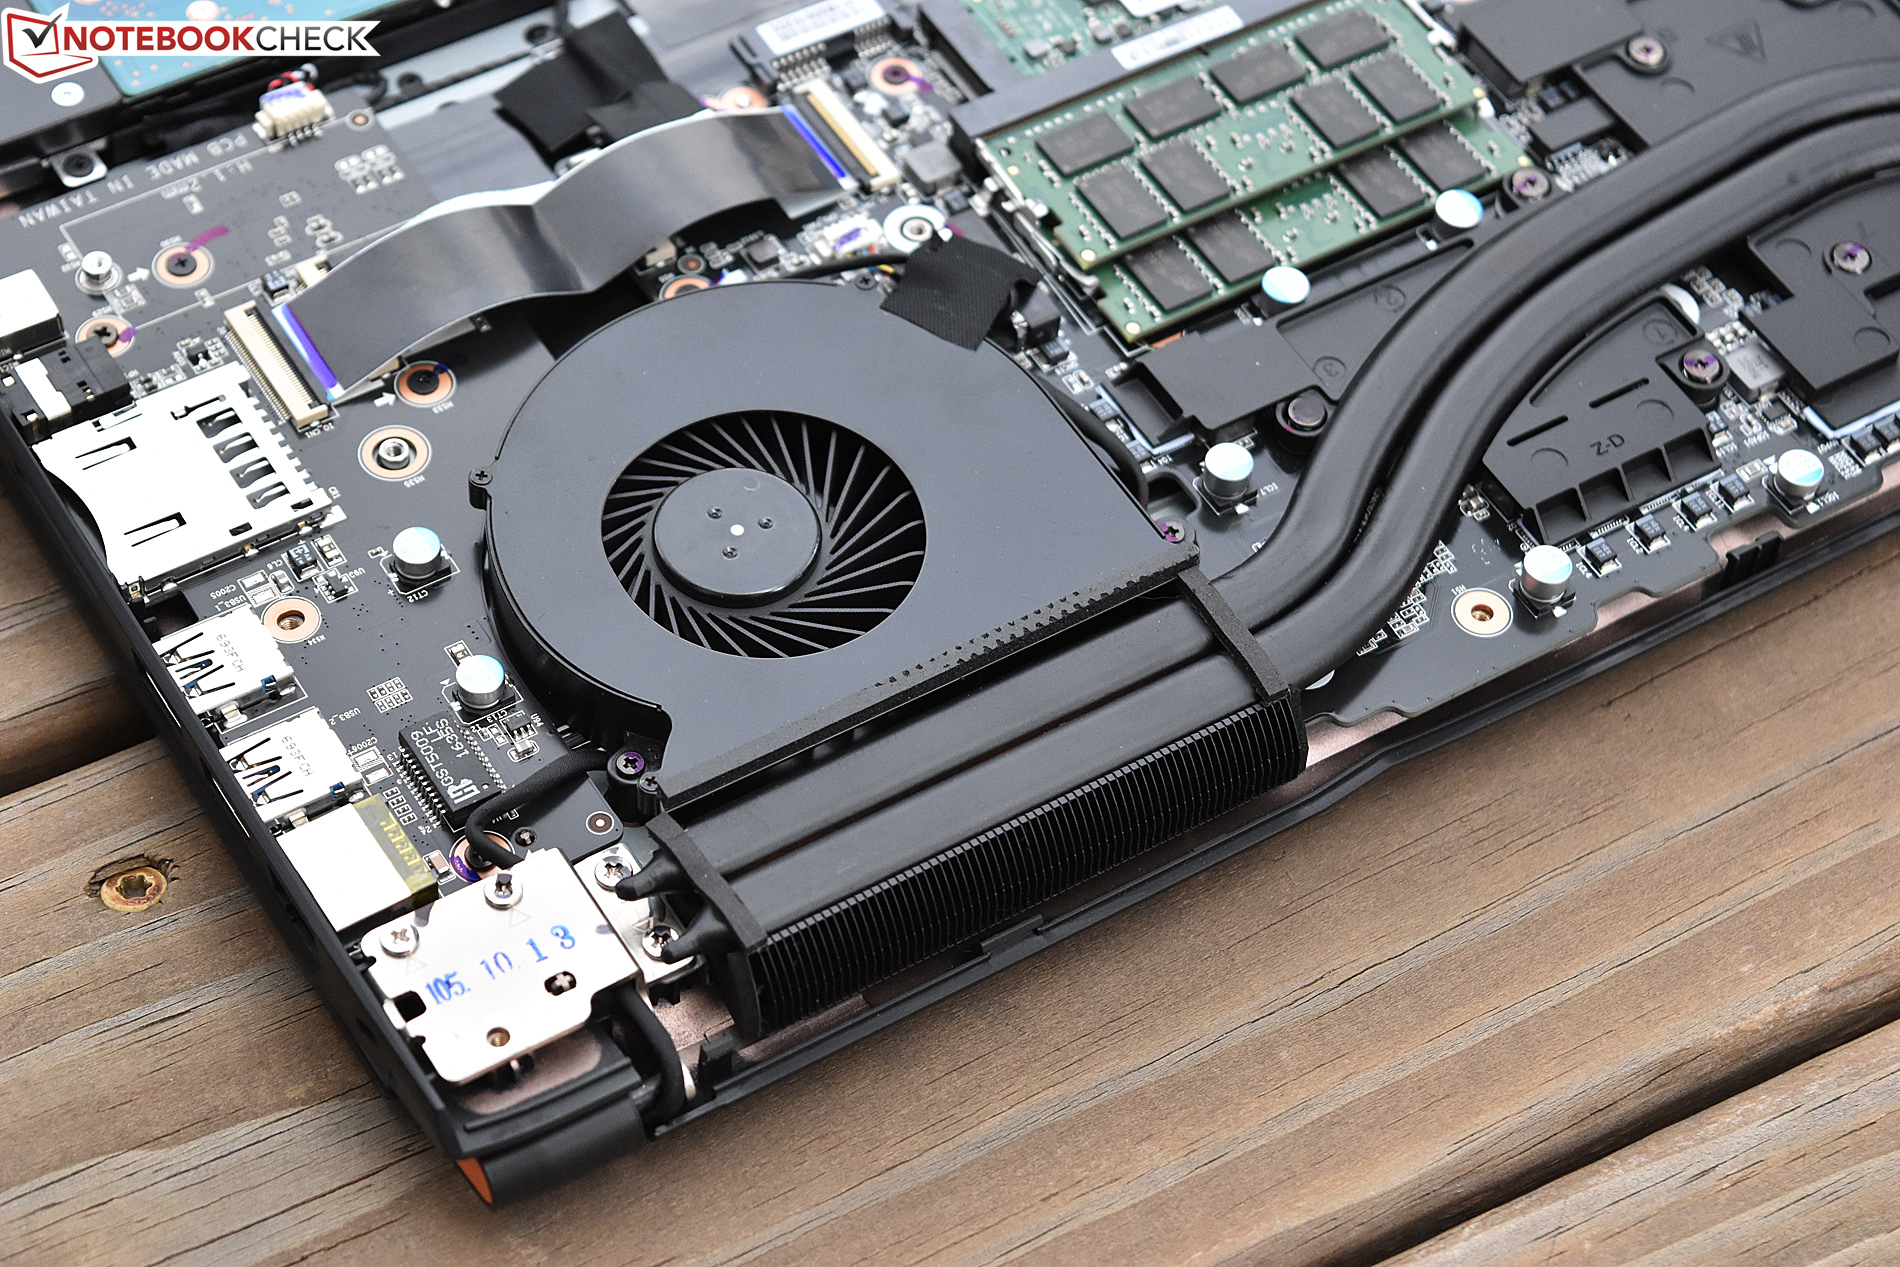
Allt detta bidrar till lägre fläktnivåer, mindre värmeutveckling (även om ett par specifika områden är särskilt varma), och en mycket trevligare visuell upplevelse tack vare den kraftigt förbättrade bildskärmen (bättre ljusstyrka, färgrymd och naturligtvis upplösning).
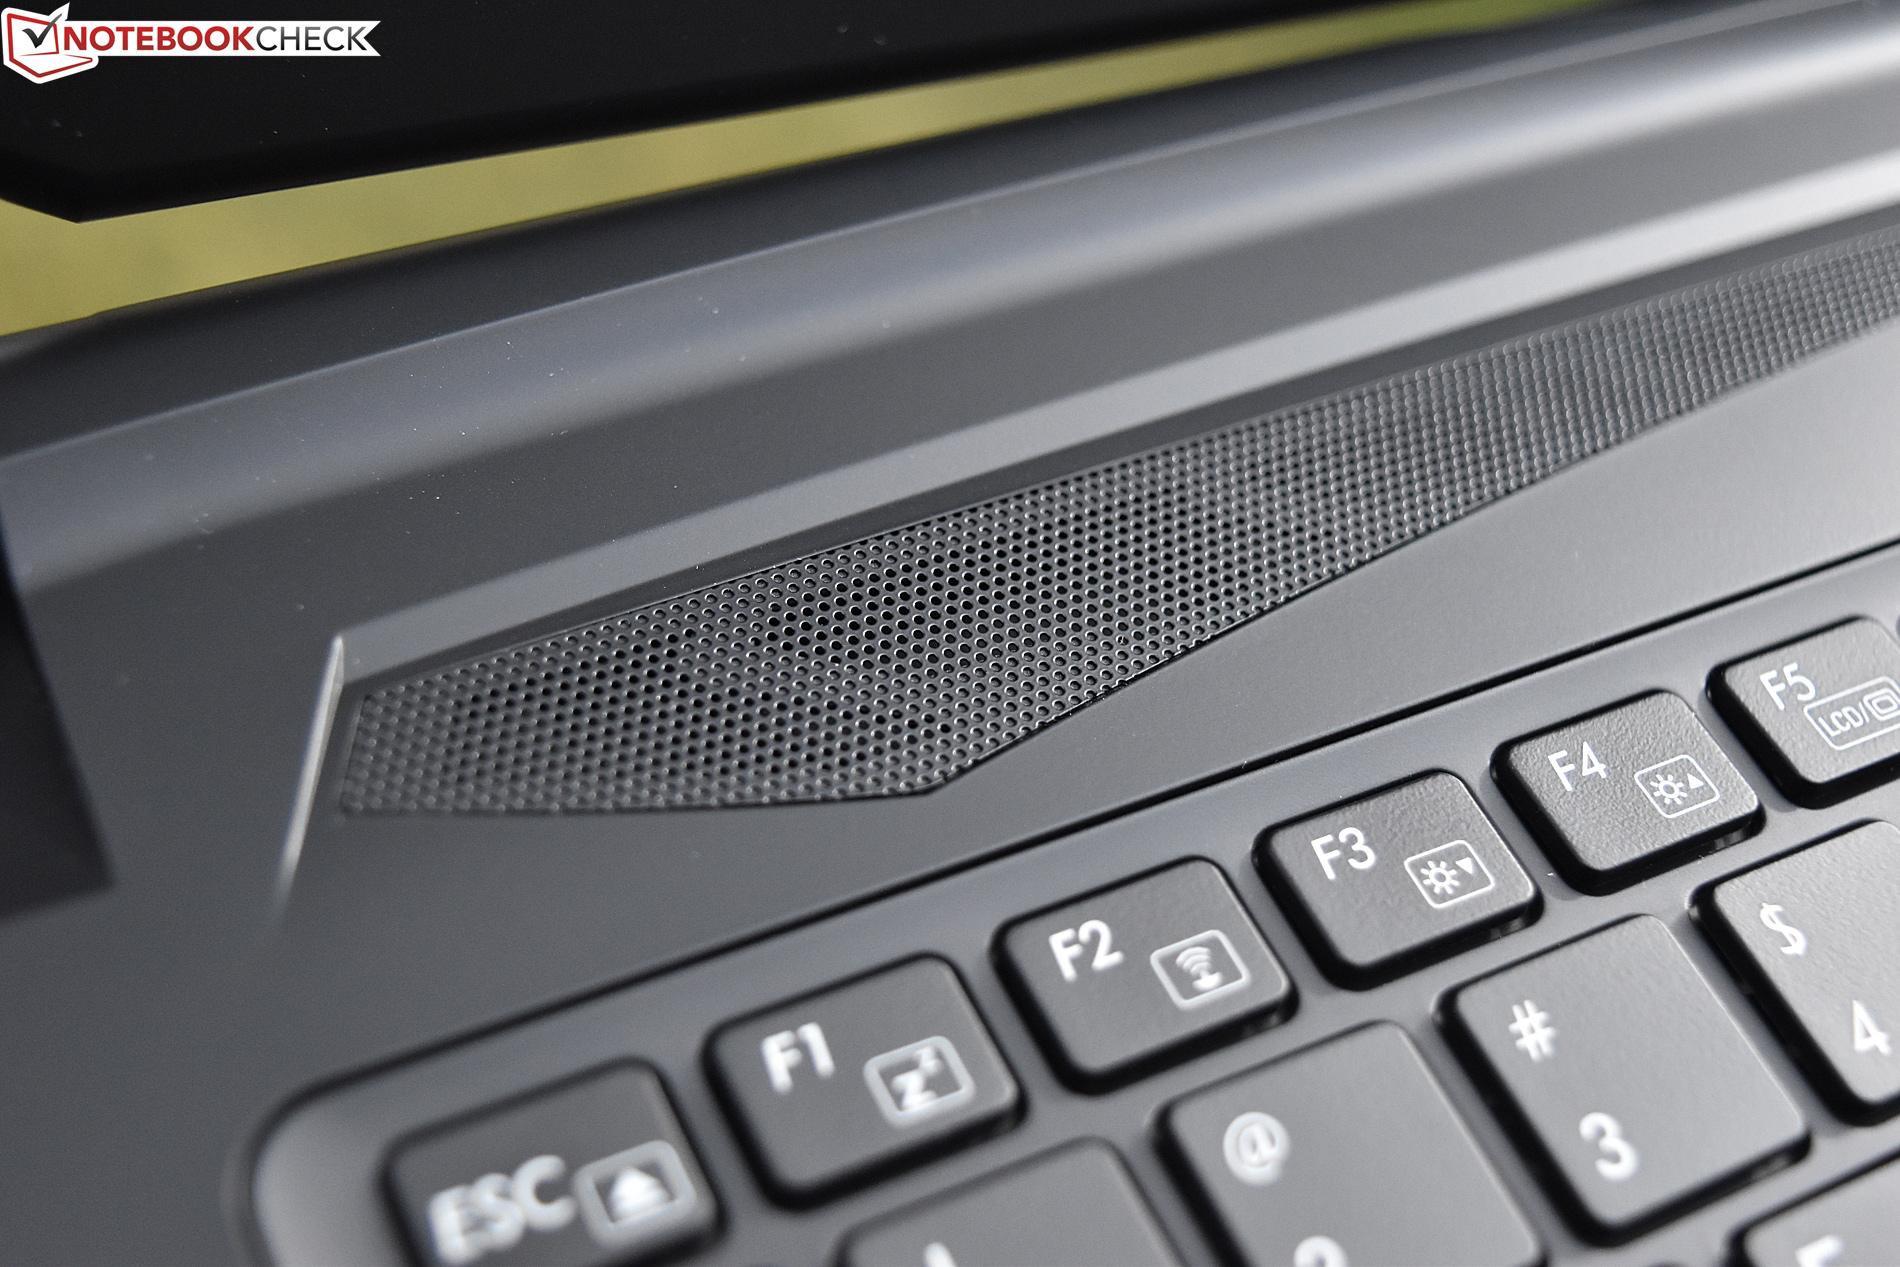
Däremot kvarstår problem på andra håll. Chassit är inte mycket att hurra för och locket på skärmen verkar lite tunt. Ljudet är fortfarande ganska högt (men programvara för ingår), och styrplattan är helt enkelt dålig. Batteritiden har också minskat sedan den senaste modellen. Det vore egentligen ingen överraskning med tanke på skärmupplösningen och mer RAM, om det inte vore för det faktum att våra mätningar av strömförbrukningen tyder på annat. Oavsett vilket är det här en bärbar speldator, så batteritiden är mindre viktig.
Svarstiderna är egentligen den enda negativa man kan säga om skärmen, då de skulle kunna vara problematiska i FPS-spel. Genom att välja en 1080p-panel skulle man sannolikt få bättre svarstider (så var fallet med v6-panelen), men som det är nu går det inte att få det bästa av två världar.
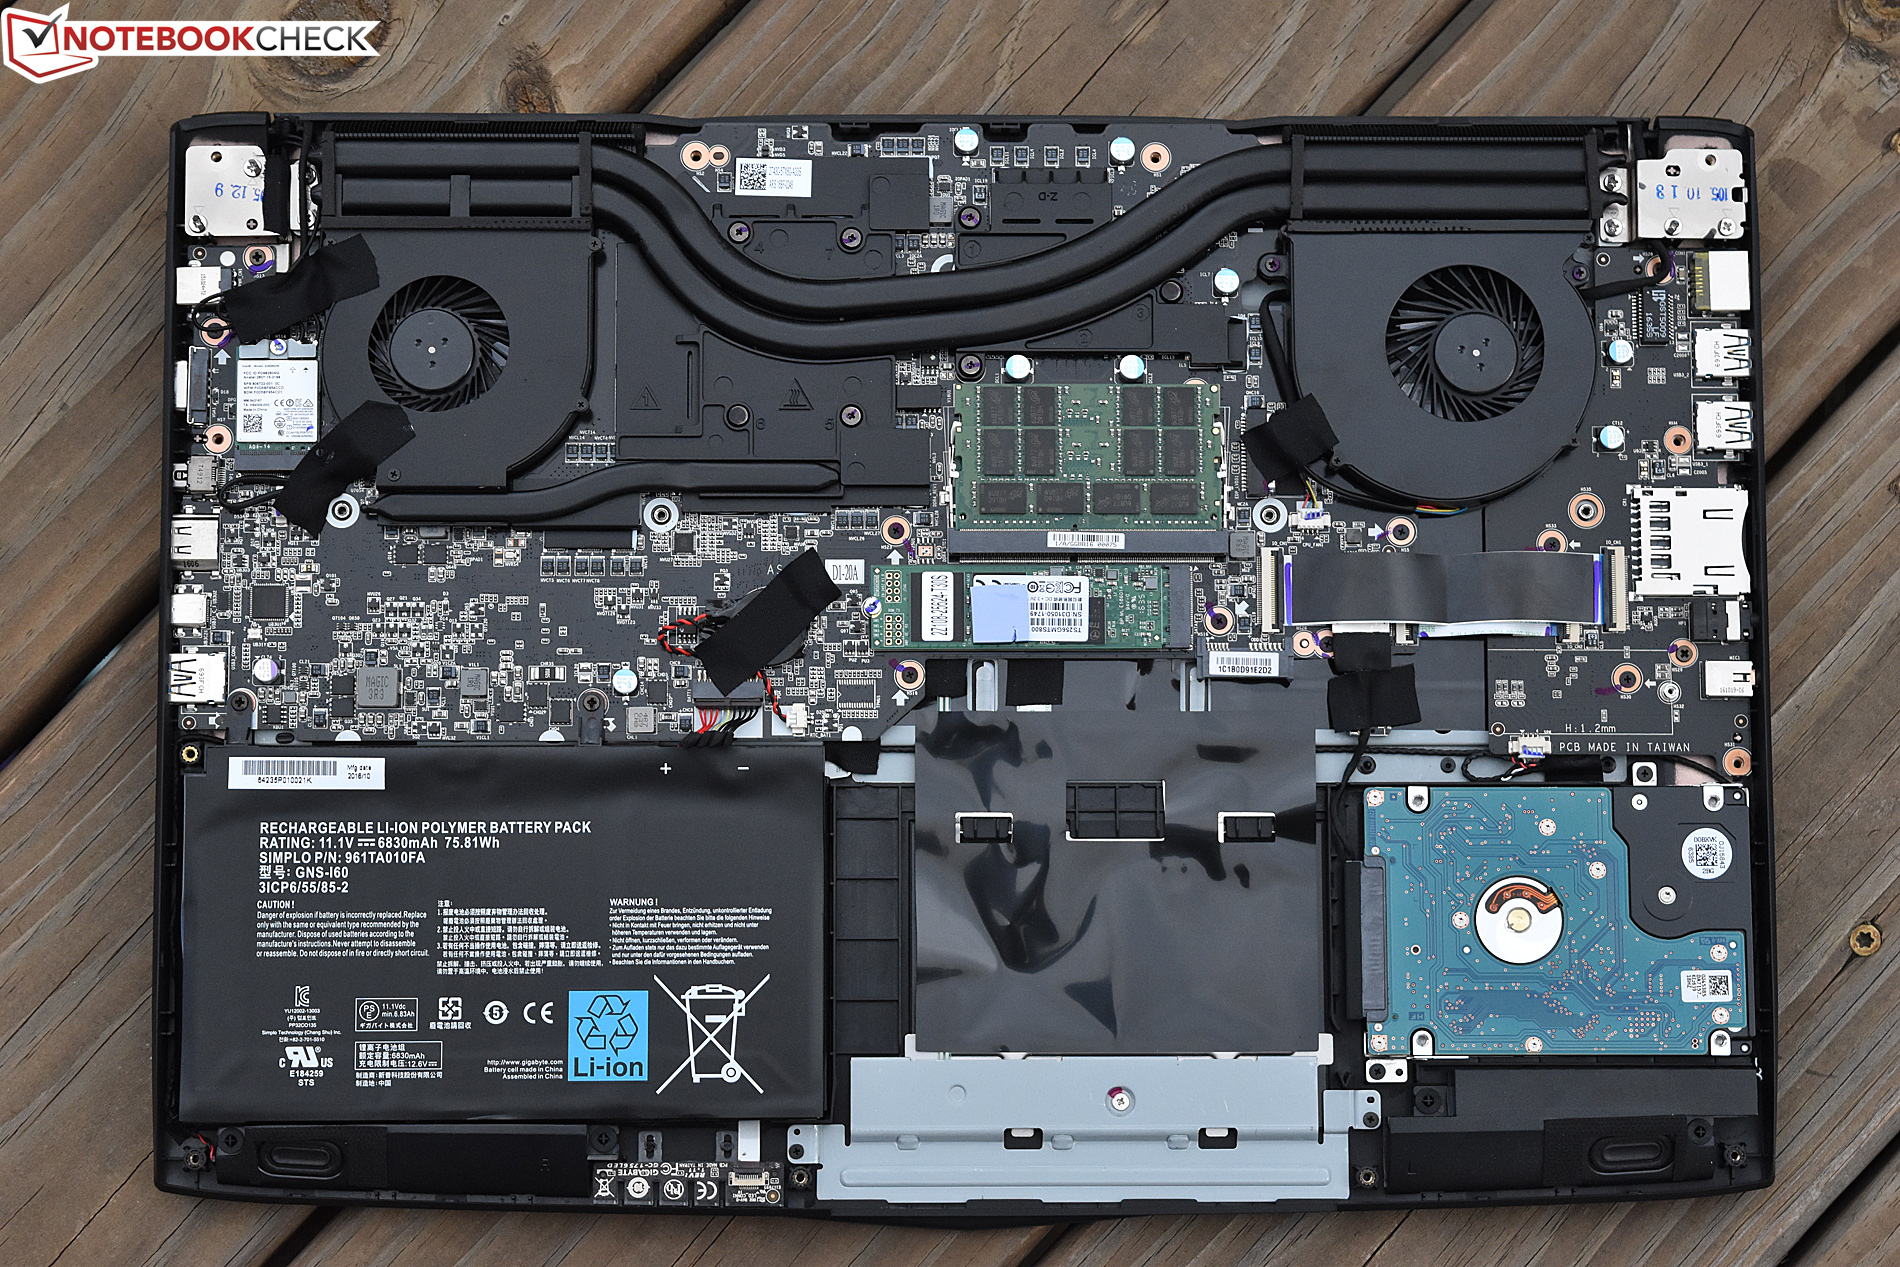
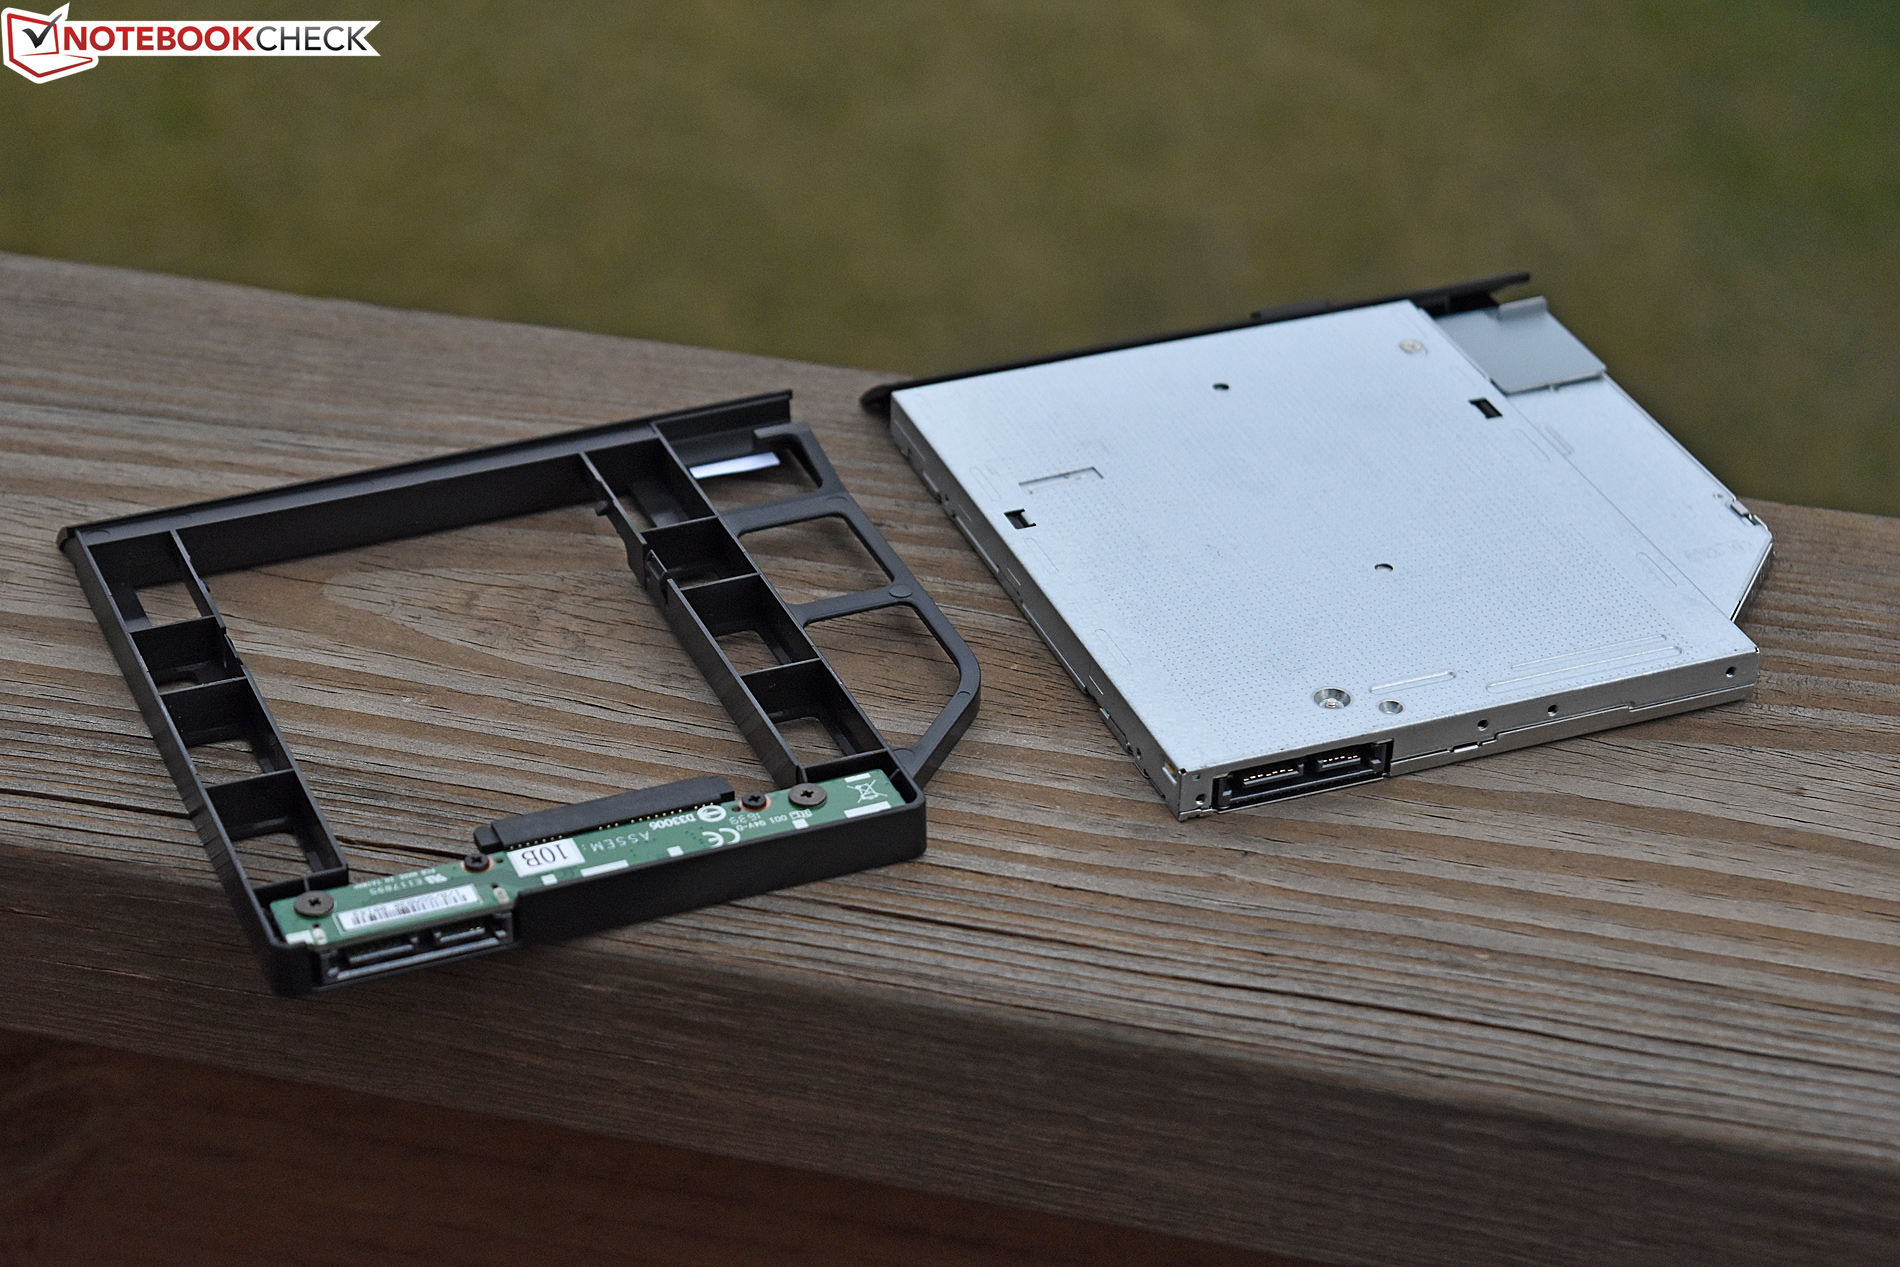
Även om det finns snabbare och mer välbyggda bärbara speldatorer är Gigabyte P57X v7 ett kraftfullt alternativ med bra skärm. Den hanterar hög belastning utan problem och har expansionsmöjligheter för den som gärna laborerar själv. Förutsatt att du inte lägger stor vikt vid batteritiden, eller besväras av chassit och den mediokra styrplattan, är datorn inget dåligt val.
Gigabyte P57X v7
- 04/25/2017 v6 (old)
Steve Schardein
Price comparison
