Test: Lenovo ThinkPad T14 - Comet Lake-uppdateringen tillför inte mycket (Sammanfattning)
Gradering | Datum | Modell | Vikt | Höjd | Storlek | Upplösning | Pris |
|---|---|---|---|---|---|---|---|
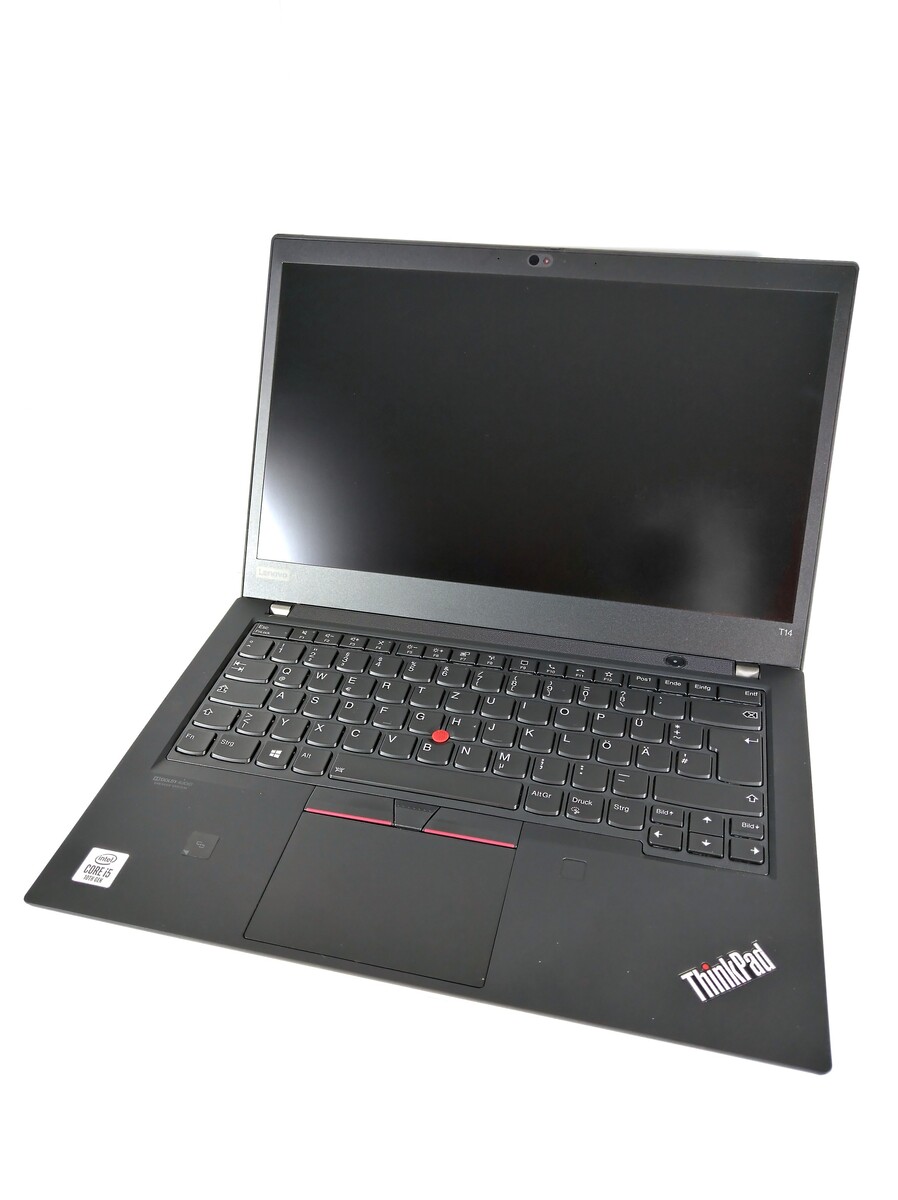
| 88 % v7 (old) | 07/2020 | Lenovo ThinkPad T14-20S1S06B00 i5-10210U, UHD Graphics 620 | 1.5 kg | 17.9 mm | 14.00" | 1920x1080 | |
| 87.9 % v7 (old) | 06/2019 | Lenovo ThinkPad T490-20N2004EGE i5-8265U, UHD Graphics 620 | 1.4 kg | 17.9 mm | 14.00" | 1920x1080 | |
| 87.2 % v7 (old) | 10/2019 | Dell Latitude 7400-8N6DH i7-8665U, UHD Graphics 620 | 1.5 kg | 18.9 mm | 14.00" | 1920x1080 | |
| 87.8 % v7 (old) | 06/2018 | HP EliteBook 840 G5-3JX61EA i5-8550U, UHD Graphics 620 | 1.5 kg | 17.9 mm | 14.00" | 1920x1080 | |
| 89.3 % v7 (old) | 05/2019 | Lenovo ThinkPad T490s-20NYS02A00 i5-8265U, UHD Graphics 620 | 1.3 kg | 16.1 mm | 14.00" | 1920x1080 |
| SD Card Reader | |
| average JPG Copy Test (av. of 3 runs) | |
| Dell Latitude 7400-8N6DH (Toshiba Exceria Pro M501 64 GB UHS-II) | |
| Lenovo ThinkPad T14-20S1S06B00 (Toshiba Exceria Pro M501 64 GB UHS-II) | |
| Lenovo ThinkPad T490 20RY0002US (Toshiba Exceria Pro M501 64 GB UHS-II) | |
| Lenovo ThinkPad T490s-20NYS02A00 (Toshiba Exceria Pro M501) | |
| Genomsnitt av klass Office (19.8 - 198.5, n=22, senaste 2 åren) | |
| maximum AS SSD Seq Read Test (1GB) | |
| Dell Latitude 7400-8N6DH (Toshiba Exceria Pro M501 64 GB UHS-II) | |
| Lenovo ThinkPad T490s-20NYS02A00 (Toshiba Exceria Pro M501) | |
| Lenovo ThinkPad T490 20RY0002US (Toshiba Exceria Pro M501 64 GB UHS-II) | |
| Lenovo ThinkPad T14-20S1S06B00 (Toshiba Exceria Pro M501 64 GB UHS-II) | |
| Genomsnitt av klass Office (27.4 - 249, n=21, senaste 2 åren) | |


| |||||||||||||||||||||||||
Distribution av ljusstyrkan: 90 %
Mitt på batteriet: 398 cd/m²
Kontrast: 1985:1 (Svärta: 0.2 cd/m²)
ΔE ColorChecker Calman: 3.6 | ∀{0.5-29.43 Ø4.71}
calibrated: 1.2
ΔE Greyscale Calman: 3.9 | ∀{0.09-98 Ø4.96}
96.6% sRGB (Argyll 1.6.3 3D)
61.4% AdobeRGB 1998 (Argyll 1.6.3 3D)
67.1% AdobeRGB 1998 (Argyll 3D)
96.8% sRGB (Argyll 3D)
66% Display P3 (Argyll 3D)
Gamma: 2.48
CCT: 7090 K
| Lenovo ThinkPad T14-20S1S06B00 B140HAN05.7, LTPS IPS LED, 1920x1080, 14" | Lenovo ThinkPad T490-20N2004EGE NE140FHM-N61, IGZO IPS LED, 1920x1080, 14" | Dell Latitude 7400-8N6DH AU Optronics B140HAN, IPS, 1920x1080, 14" | HP EliteBook 840 G5-3JX61EA IVO M140NVF7 R0, IPS, 1920x1080, 14" | Lenovo ThinkPad T490s-20NYS02A00 B140HAN05.7, IPS, 1920x1080, 14" | |
|---|---|---|---|---|---|
| Display | 0% | -0% | -8% | 2% | |
| Display P3 Coverage (%) | 66 | 69.2 5% | 66.1 0% | 61 -8% | 67.1 2% |
| sRGB Coverage (%) | 96.8 | 92.3 -5% | 95.3 -2% | 87.7 -9% | 97.6 1% |
| AdobeRGB 1998 Coverage (%) | 67.1 | 67.6 1% | 67.5 1% | 62.1 -7% | 68.5 2% |
| Response Times | -46% | -24% | 23% | -26% | |
| Response Time Grey 50% / Grey 80% * (ms) | 58.4 ? | 71.2 ? -22% | 62 ? -6% | 33 ? 43% | 61.6 ? -5% |
| Response Time Black / White * (ms) | 26.4 ? | 44.8 ? -70% | 37.6 ? -42% | 26 ? 2% | 38.8 ? -47% |
| PWM Frequency (Hz) | 2427 ? | 3125 ? | |||
| Screen | -22% | -18% | -22% | -0% | |
| Brightness middle (cd/m²) | 397 | 428 8% | 289 -27% | 655 65% | 391 -2% |
| Brightness (cd/m²) | 394 | 409 4% | 286 -27% | 630 60% | 389 -1% |
| Brightness Distribution (%) | 90 | 91 1% | 91 1% | 93 3% | 87 -3% |
| Black Level * (cd/m²) | 0.2 | 0.29 -45% | 0.16 20% | 0.56 -180% | 0.23 -15% |
| Contrast (:1) | 1985 | 1476 -26% | 1806 -9% | 1170 -41% | 1700 -14% |
| Colorchecker dE 2000 * | 3.6 | 4.6 -28% | 4.7 -31% | 3.27 9% | 3.4 6% |
| Colorchecker dE 2000 max. * | 5.9 | 8.2 -39% | 8.7 -47% | 5.92 -0% | 4.7 20% |
| Colorchecker dE 2000 calibrated * | 1.2 | 2 -67% | 1.3 -8% | 3.22 -168% | 1.1 8% |
| Greyscale dE 2000 * | 3.9 | 5.4 -38% | 6.4 -64% | 2.85 27% | 4 -3% |
| Gamma | 2.48 89% | 2.09 105% | 2.54 87% | 2.45 90% | 2.49 88% |
| CCT | 7090 92% | 7562 86% | 5977 109% | 6065 107% | 6809 95% |
| Color Space (Percent of AdobeRGB 1998) (%) | 61.4 | 60 -2% | 61.2 0% | 57 -7% | 62.4 2% |
| Color Space (Percent of sRGB) (%) | 96.6 | 92.2 -5% | 95.1 -2% | 88 -9% | 97.4 1% |
| Totalt genomsnitt (program/inställningar) | -23% /
-21% | -14% /
-15% | -2% /
-14% | -8% /
-3% |
* ... mindre är bättre
Visa svarstider
| ↔ Svarstid svart till vitt | ||
|---|---|---|
| 26.4 ms ... stiga ↗ och falla ↘ kombinerat | ↗ 12.4 ms stiga | 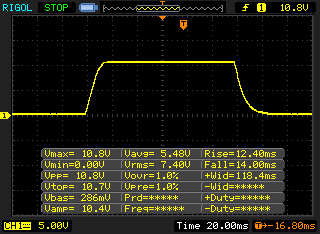 |
| ↘ 14 ms hösten | ||
| Skärmen visar relativt långsamma svarsfrekvenser i våra tester och kan vara för långsam för spelare. I jämförelse sträcker sig alla testade enheter från 0.1 (minst) till 240 (maximalt) ms. » 66 % av alla enheter är bättre. Detta innebär att den uppmätta svarstiden är sämre än genomsnittet av alla testade enheter (19.8 ms). | ||
| ↔ Svarstid 50 % grått till 80 % grått | ||
| 58.4 ms ... stiga ↗ och falla ↘ kombinerat | ↗ 28.4 ms stiga | 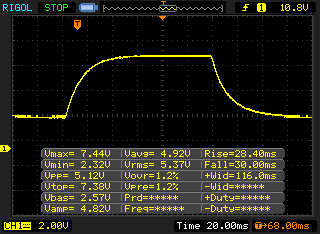 |
| ↘ 30 ms hösten | ||
| Skärmen visar långsamma svarsfrekvenser i våra tester och kommer att vara otillfredsställande för spelare. I jämförelse sträcker sig alla testade enheter från 0.165 (minst) till 636 (maximalt) ms. » 95 % av alla enheter är bättre. Detta innebär att den uppmätta svarstiden är sämre än genomsnittet av alla testade enheter (30.9 ms). | ||
Skärmflimmer / PWM (Puls-Width Modulation)
| Skärmflimmer / PWM upptäcktes inte | 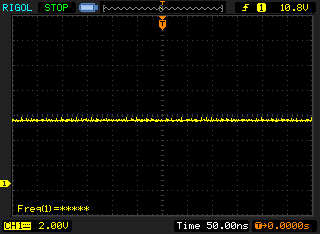 | ||
Som jämförelse: 52 % av alla testade enheter använder inte PWM för att dämpa skärmen. Om PWM upptäcktes mättes ett medelvärde av 7741 (minst: 5 - maximum: 343500) Hz. | |||
Cinebench R20: CPU (Multi Core) | CPU (Single Core)
Blender: v2.79 BMW27 CPU
7-Zip 18.03: 7z b 4 -mmt1 | 7z b 4
Geekbench 5.5: Single-Core | Multi-Core
HWBOT x265 Benchmark v2.2: 4k Preset
LibreOffice : 20 Documents To PDF
R Benchmark 2.5: Overall mean
| Cinebench R15 / CPU Multi 64Bit | |
| Genomsnitt av klass Office (250 - 3380, n=77, senaste 2 åren) | |
| Lenovo ThinkPad T14-20S1S06B00 | |
| Lenovo ThinkPad T490s-20NYS02A00 | |
| Dell Latitude 7400-8N6DH | |
| Lenovo ThinkPad T490 20RY0002US | |
| Lenovo ThinkPad T490-20N2004EGE | |
| Genomsnitt Intel Core i5-10210U (320 - 790, n=35) | |
| HP EliteBook 840 G5-3JX61EA | |
| Cinebench R15 / CPU Single 64Bit | |
| Genomsnitt av klass Office (99.5 - 316, n=77, senaste 2 åren) | |
| Lenovo ThinkPad T490 20RY0002US | |
| Dell Latitude 7400-8N6DH | |
| HP EliteBook 840 G5-3JX61EA | |
| Lenovo ThinkPad T14-20S1S06B00 | |
| Genomsnitt Intel Core i5-10210U (134 - 174, n=35) | |
| Lenovo ThinkPad T490-20N2004EGE | |
| Lenovo ThinkPad T490s-20NYS02A00 | |
| Cinebench R20 / CPU (Multi Core) | |
| Genomsnitt av klass Office (648 - 8840, n=75, senaste 2 åren) | |
| Lenovo ThinkPad T490 20RY0002US | |
| Lenovo ThinkPad T490s-20NYS02A00 | |
| Dell Latitude 7400-8N6DH | |
| Lenovo ThinkPad T490-20N2004EGE | |
| Lenovo ThinkPad T14-20S1S06B00 | |
| Genomsnitt Intel Core i5-10210U (722 - 1820, n=30) | |
| Cinebench R20 / CPU (Single Core) | |
| Genomsnitt av klass Office (345 - 816, n=75, senaste 2 åren) | |
| Lenovo ThinkPad T490 20RY0002US | |
| Dell Latitude 7400-8N6DH | |
| Lenovo ThinkPad T14-20S1S06B00 | |
| Genomsnitt Intel Core i5-10210U (322 - 428, n=30) | |
| Lenovo ThinkPad T490s-20NYS02A00 | |
| Lenovo ThinkPad T490-20N2004EGE | |
| Blender / v2.79 BMW27 CPU | |
| Lenovo ThinkPad T490-20N2004EGE | |
| Genomsnitt Intel Core i5-10210U (585 - 1339, n=24) | |
| Lenovo ThinkPad T14-20S1S06B00 | |
| Lenovo ThinkPad T490s-20NYS02A00 | |
| Dell Latitude 7400-8N6DH | |
| Genomsnitt av klass Office (158 - 1940, n=76, senaste 2 åren) | |
| 7-Zip 18.03 / 7z b 4 -mmt1 | |
| Genomsnitt av klass Office (3387 - 6469, n=77, senaste 2 åren) | |
| Dell Latitude 7400-8N6DH | |
| Lenovo ThinkPad T14-20S1S06B00 | |
| Genomsnitt Intel Core i5-10210U (3504 - 4467, n=24) | |
| Lenovo ThinkPad T490s-20NYS02A00 | |
| Lenovo ThinkPad T490-20N2004EGE | |
| 7-Zip 18.03 / 7z b 4 | |
| Genomsnitt av klass Office (7098 - 76886, n=77, senaste 2 åren) | |
| Lenovo ThinkPad T490s-20NYS02A00 | |
| Dell Latitude 7400-8N6DH | |
| Lenovo ThinkPad T14-20S1S06B00 | |
| Genomsnitt Intel Core i5-10210U (10920 - 21679, n=24) | |
| Lenovo ThinkPad T490-20N2004EGE | |
| Geekbench 5.5 / Single-Core | |
| Genomsnitt av klass Office (811 - 2175, n=73, senaste 2 åren) | |
| Genomsnitt Intel Core i5-10210U (949 - 1133, n=27) | |
| Lenovo ThinkPad T14-20S1S06B00 | |
| Geekbench 5.5 / Multi-Core | |
| Genomsnitt av klass Office (1483 - 16999, n=73, senaste 2 åren) | |
| Genomsnitt Intel Core i5-10210U (2079 - 4256, n=27) | |
| Lenovo ThinkPad T14-20S1S06B00 | |
| HWBOT x265 Benchmark v2.2 / 4k Preset | |
| Genomsnitt av klass Office (2.21 - 26, n=76, senaste 2 åren) | |
| Lenovo ThinkPad T490s-20NYS02A00 | |
| Dell Latitude 7400-8N6DH | |
| Lenovo ThinkPad T14-20S1S06B00 | |
| Genomsnitt Intel Core i5-10210U (2.36 - 6.28, n=24) | |
| Lenovo ThinkPad T490-20N2004EGE | |
| LibreOffice / 20 Documents To PDF | |
| Genomsnitt Intel Core i5-10210U (49.6 - 80.3, n=18) | |
| Lenovo ThinkPad T14-20S1S06B00 | |
| Genomsnitt av klass Office (39.9 - 102.3, n=76, senaste 2 åren) | |
| R Benchmark 2.5 / Overall mean | |
| Genomsnitt Intel Core i5-10210U (0.658 - 0.901, n=24) | |
| Lenovo ThinkPad T14-20S1S06B00 | |
| Genomsnitt av klass Office (0.393 - 0.888, n=76, senaste 2 åren) | |
* ... mindre är bättre
| PCMark 8 Home Score Accelerated v2 | 3544 poäng | |
| PCMark 8 Work Score Accelerated v2 | 5042 poäng | |
| PCMark 10 Score | 3932 poäng | |
Hjälp | ||
| DPC Latencies / LatencyMon - interrupt to process latency (max), Web, Youtube, Prime95 | |
| Lenovo ThinkPad T14-20S1S06B00 | |
* ... mindre är bättre
| Lenovo ThinkPad T14-20S1S06B00 Lite-On CA5-8D512 | Lenovo ThinkPad T490-20N2004EGE Toshiba KXG5AZNV256G | Dell Latitude 7400-8N6DH Samsung SSD PM981 MZVLB512HAJQ | HP EliteBook 840 G5-3JX61EA Toshiba KXG50ZNV1T02 | Lenovo ThinkPad T490s-20NYS02A00 Intel SSD Pro 7600p SSDPEKKF512G8L | Genomsnitt Lite-On CA5-8D512 | |
|---|---|---|---|---|---|---|
| CrystalDiskMark 5.2 / 6 | -16% | -3% | -23% | -12% | 13% | |
| Write 4K (MB/s) | 114.1 | 119.9 5% | 118.6 4% | 96.1 -16% | 122 7% | 132.9 ? 16% |
| Read 4K (MB/s) | 53.6 | 39.94 -25% | 44.68 -17% | 31.12 -42% | 45.56 -15% | 55 ? 3% |
| Write Seq (MB/s) | 1743 | 1334 -23% | 1866 7% | 919 -47% | 1497 -14% | 2155 ? 24% |
| Read Seq (MB/s) | 2092 | 1357 -35% | 2173 4% | 2089 0% | 2385 14% | 2264 ? 8% |
| Write 4K Q32T1 (MB/s) | 394.8 | 311.2 -21% | 330.9 -16% | 425.6 8% | 240.9 -39% | 470 ? 19% |
| Read 4K Q32T1 (MB/s) | 372.6 | 400.6 8% | 343.1 -8% | 275.3 -26% | 338 -9% | 500 ? 34% |
| Write Seq Q32T1 (MB/s) | 2176 | 1642 -25% | 1927 -11% | 958 -56% | 1528 -30% | 2217 ? 2% |
| Read Seq Q32T1 (MB/s) | 3204 | 2778 -13% | 3528 10% | 3118 -3% | 2915 -9% | 3228 ? 1% |

| 3DMark 11 Performance | 1926 poäng | |
| 3DMark Cloud Gate Standard Score | 7581 poäng | |
| 3DMark Fire Strike Score | 963 poäng | |
| 3DMark Time Spy Score | 410 poäng | |
Hjälp | ||
| låg | med. | hög | ultra | |
|---|---|---|---|---|
| The Witcher 3 (2015) | 15.5 | |||
| Dota 2 Reborn (2015) | 69.4 | 39.1 | 18.8 | 16.2 |
| X-Plane 11.11 (2018) | 12.8 | 11 | 10.8 | |
| Shadow of the Tomb Raider (2018) | 13 | |||
| Total War: Three Kingdoms (2019) | 23.7 |
Ljudnivå
| Låg belastning |
| 29.6 / 29.6 / 29.6 dB(A) |
| Hög belastning |
| 33.5 / 33.5 dB(A) |
 | ||
30 dB tyst 40 dB(A) hörbar 50 dB(A) högt ljud |
||
min: | ||
(-) Den maximala temperaturen på ovansidan är 53 °C / 127 F, jämfört med genomsnittet av 34.3 °C / 94 F , allt från 21.2 till 62.5 °C för klassen Office.
(-) Botten värms upp till maximalt 67.2 °C / 153 F, jämfört med genomsnittet av 36.8 °C / 98 F
(+) Vid tomgångsbruk är medeltemperaturen för ovansidan 25.4 °C / 78 F, jämfört med enhetsgenomsnittet på 29.5 °C / ### class_avg_f### F.
(+) Handledsstöden och pekplattan når maximal hudtemperatur (34.7 °C / 94.5 F) och är därför inte varma.
(-) Medeltemperaturen för handledsstödsområdet på liknande enheter var 27.6 °C / 81.7 F (-7.1 °C / -12.8 F).
Lenovo ThinkPad T14-20S1S06B00 ljudanalys
(-) | inte särskilt höga högtalare (70.6 dB)
Bas 100 - 315 Hz
(±) | reducerad bas - i genomsnitt 12.6% lägre än medianen
(±) | linjäriteten för basen är genomsnittlig (12.5% delta till föregående frekvens)
Mellan 400 - 2000 Hz
(±) | högre mellan - i genomsnitt 7.7% högre än median
(+) | mids är linjära (6.7% delta till föregående frekvens)
Högsta 2 - 16 kHz
(+) | balanserade toppar - endast 2.9% från medianen
(+) | toppar är linjära (5.8% delta till föregående frekvens)
Totalt 100 - 16 000 Hz
(±) | linjäriteten för det totala ljudet är genomsnittlig (24.5% skillnad mot median)
Jämfört med samma klass
» 71% av alla testade enheter i den här klassen var bättre, 8% liknande, 21% sämre
» Den bästa hade ett delta på 7%, genomsnittet var 21%, sämst var 53%
Jämfört med alla testade enheter
» 74% av alla testade enheter var bättre, 6% liknande, 20% sämre
» Den bästa hade ett delta på 4%, genomsnittet var 23%, sämst var 134%
Lenovo ThinkPad T490-20N3S02L00 ljudanalys
(-) | inte särskilt höga högtalare (70.9 dB)
Bas 100 - 315 Hz
(-) | nästan ingen bas - i genomsnitt 20.8% lägre än medianen
(±) | linjäriteten för basen är genomsnittlig (8.7% delta till föregående frekvens)
Mellan 400 - 2000 Hz
(±) | högre mellan - i genomsnitt 5.5% högre än median
(±) | linjäriteten för mids är genomsnittlig (8.8% delta till föregående frekvens)
Högsta 2 - 16 kHz
(+) | balanserade toppar - endast 3.4% från medianen
(±) | linjäriteten för toppar är genomsnittlig (7.3% delta till föregående frekvens)
Totalt 100 - 16 000 Hz
(±) | linjäriteten för det totala ljudet är genomsnittlig (28.9% skillnad mot median)
Jämfört med samma klass
» 90% av alla testade enheter i den här klassen var bättre, 2% liknande, 8% sämre
» Den bästa hade ett delta på 7%, genomsnittet var 21%, sämst var 53%
Jämfört med alla testade enheter
» 87% av alla testade enheter var bättre, 2% liknande, 11% sämre
» Den bästa hade ett delta på 4%, genomsnittet var 23%, sämst var 134%
| Av/Standby | |
| Låg belastning | |
| Hög belastning |
|
Förklaring:
min: | |
| Lenovo ThinkPad T14-20S1S06B00 i5-10210U, UHD Graphics 620, Lite-On CA5-8D512, LTPS IPS LED, 1920x1080, 14" | Lenovo ThinkPad T490-20N2004EGE i5-8265U, UHD Graphics 620, Toshiba KXG5AZNV256G, IGZO IPS LED, 1920x1080, 14" | Dell Latitude 7400-8N6DH i7-8665U, UHD Graphics 620, Samsung SSD PM981 MZVLB512HAJQ, IPS, 1920x1080, 14" | HP EliteBook 840 G5-3JX61EA i5-8550U, UHD Graphics 620, Toshiba KXG50ZNV1T02, IPS, 1920x1080, 14" | Lenovo ThinkPad T490s-20NYS02A00 i5-8265U, UHD Graphics 620, Intel SSD Pro 7600p SSDPEKKF512G8L, IPS, 1920x1080, 14" | Genomsnitt Intel UHD Graphics 620 | Genomsnitt av klass Office | |
|---|---|---|---|---|---|---|---|
| Power Consumption | 22% | 1% | 2% | 14% | 7% | -5% | |
| Idle Minimum * (Watt) | 3.2 | 2.34 27% | 3.9 -22% | 3.8 -19% | 2.62 18% | 3.81 ? -19% | 4.25 ? -33% |
| Idle Average * (Watt) | 6.1 | 5.22 14% | 6.1 -0% | 8.3 -36% | 5.16 15% | 6.94 ? -14% | 7.3 ? -20% |
| Idle Maximum * (Watt) | 10.4 | 8.82 15% | 8.2 21% | 10.7 -3% | 8.7 16% | 8.75 ? 16% | 8.57 ? 18% |
| Load Average * (Watt) | 45.6 | 35.8 21% | 41 10% | 35.5 22% | 40 12% | 35 ? 23% | 43.8 ? 4% |
| Load Maximum * (Watt) | 68.6 | 47.3 31% | 69.7 -2% | 37 46% | 64 7% | 47.5 ? 31% | 64.5 ? 6% |
* ... mindre är bättre
| Lenovo ThinkPad T14-20S1S06B00 i5-10210U, UHD Graphics 620, 50 Wh | Lenovo ThinkPad T490-20N2004EGE i5-8265U, UHD Graphics 620, 50 Wh | Dell Latitude 7400-8N6DH i7-8665U, UHD Graphics 620, 60 Wh | HP EliteBook 840 G5-3JX61EA i5-8550U, UHD Graphics 620, 50 Wh | Lenovo ThinkPad T490s-20NYS02A00 i5-8265U, UHD Graphics 620, 57 Wh | Genomsnitt av klass Office | |
|---|---|---|---|---|---|---|
| Batteridrifttid | 34% | 43% | -33% | 19% | 36% | |
| H.264 (h) | 10.4 | 11.3 9% | 14.4 38% | 13.9 34% | 15.4 ? 48% | |
| WiFi v1.3 (h) | 11 | 9.5 -14% | 11.6 5% | 7.4 -33% | 10.1 -8% | 13.2 ? 20% |
| Load (h) | 1.3 | 2.7 108% | 2.4 85% | 1.7 31% | 1.808 ? 39% |
För
Emot

Läs den fullständiga versionen av den här recensionen på engelska här.
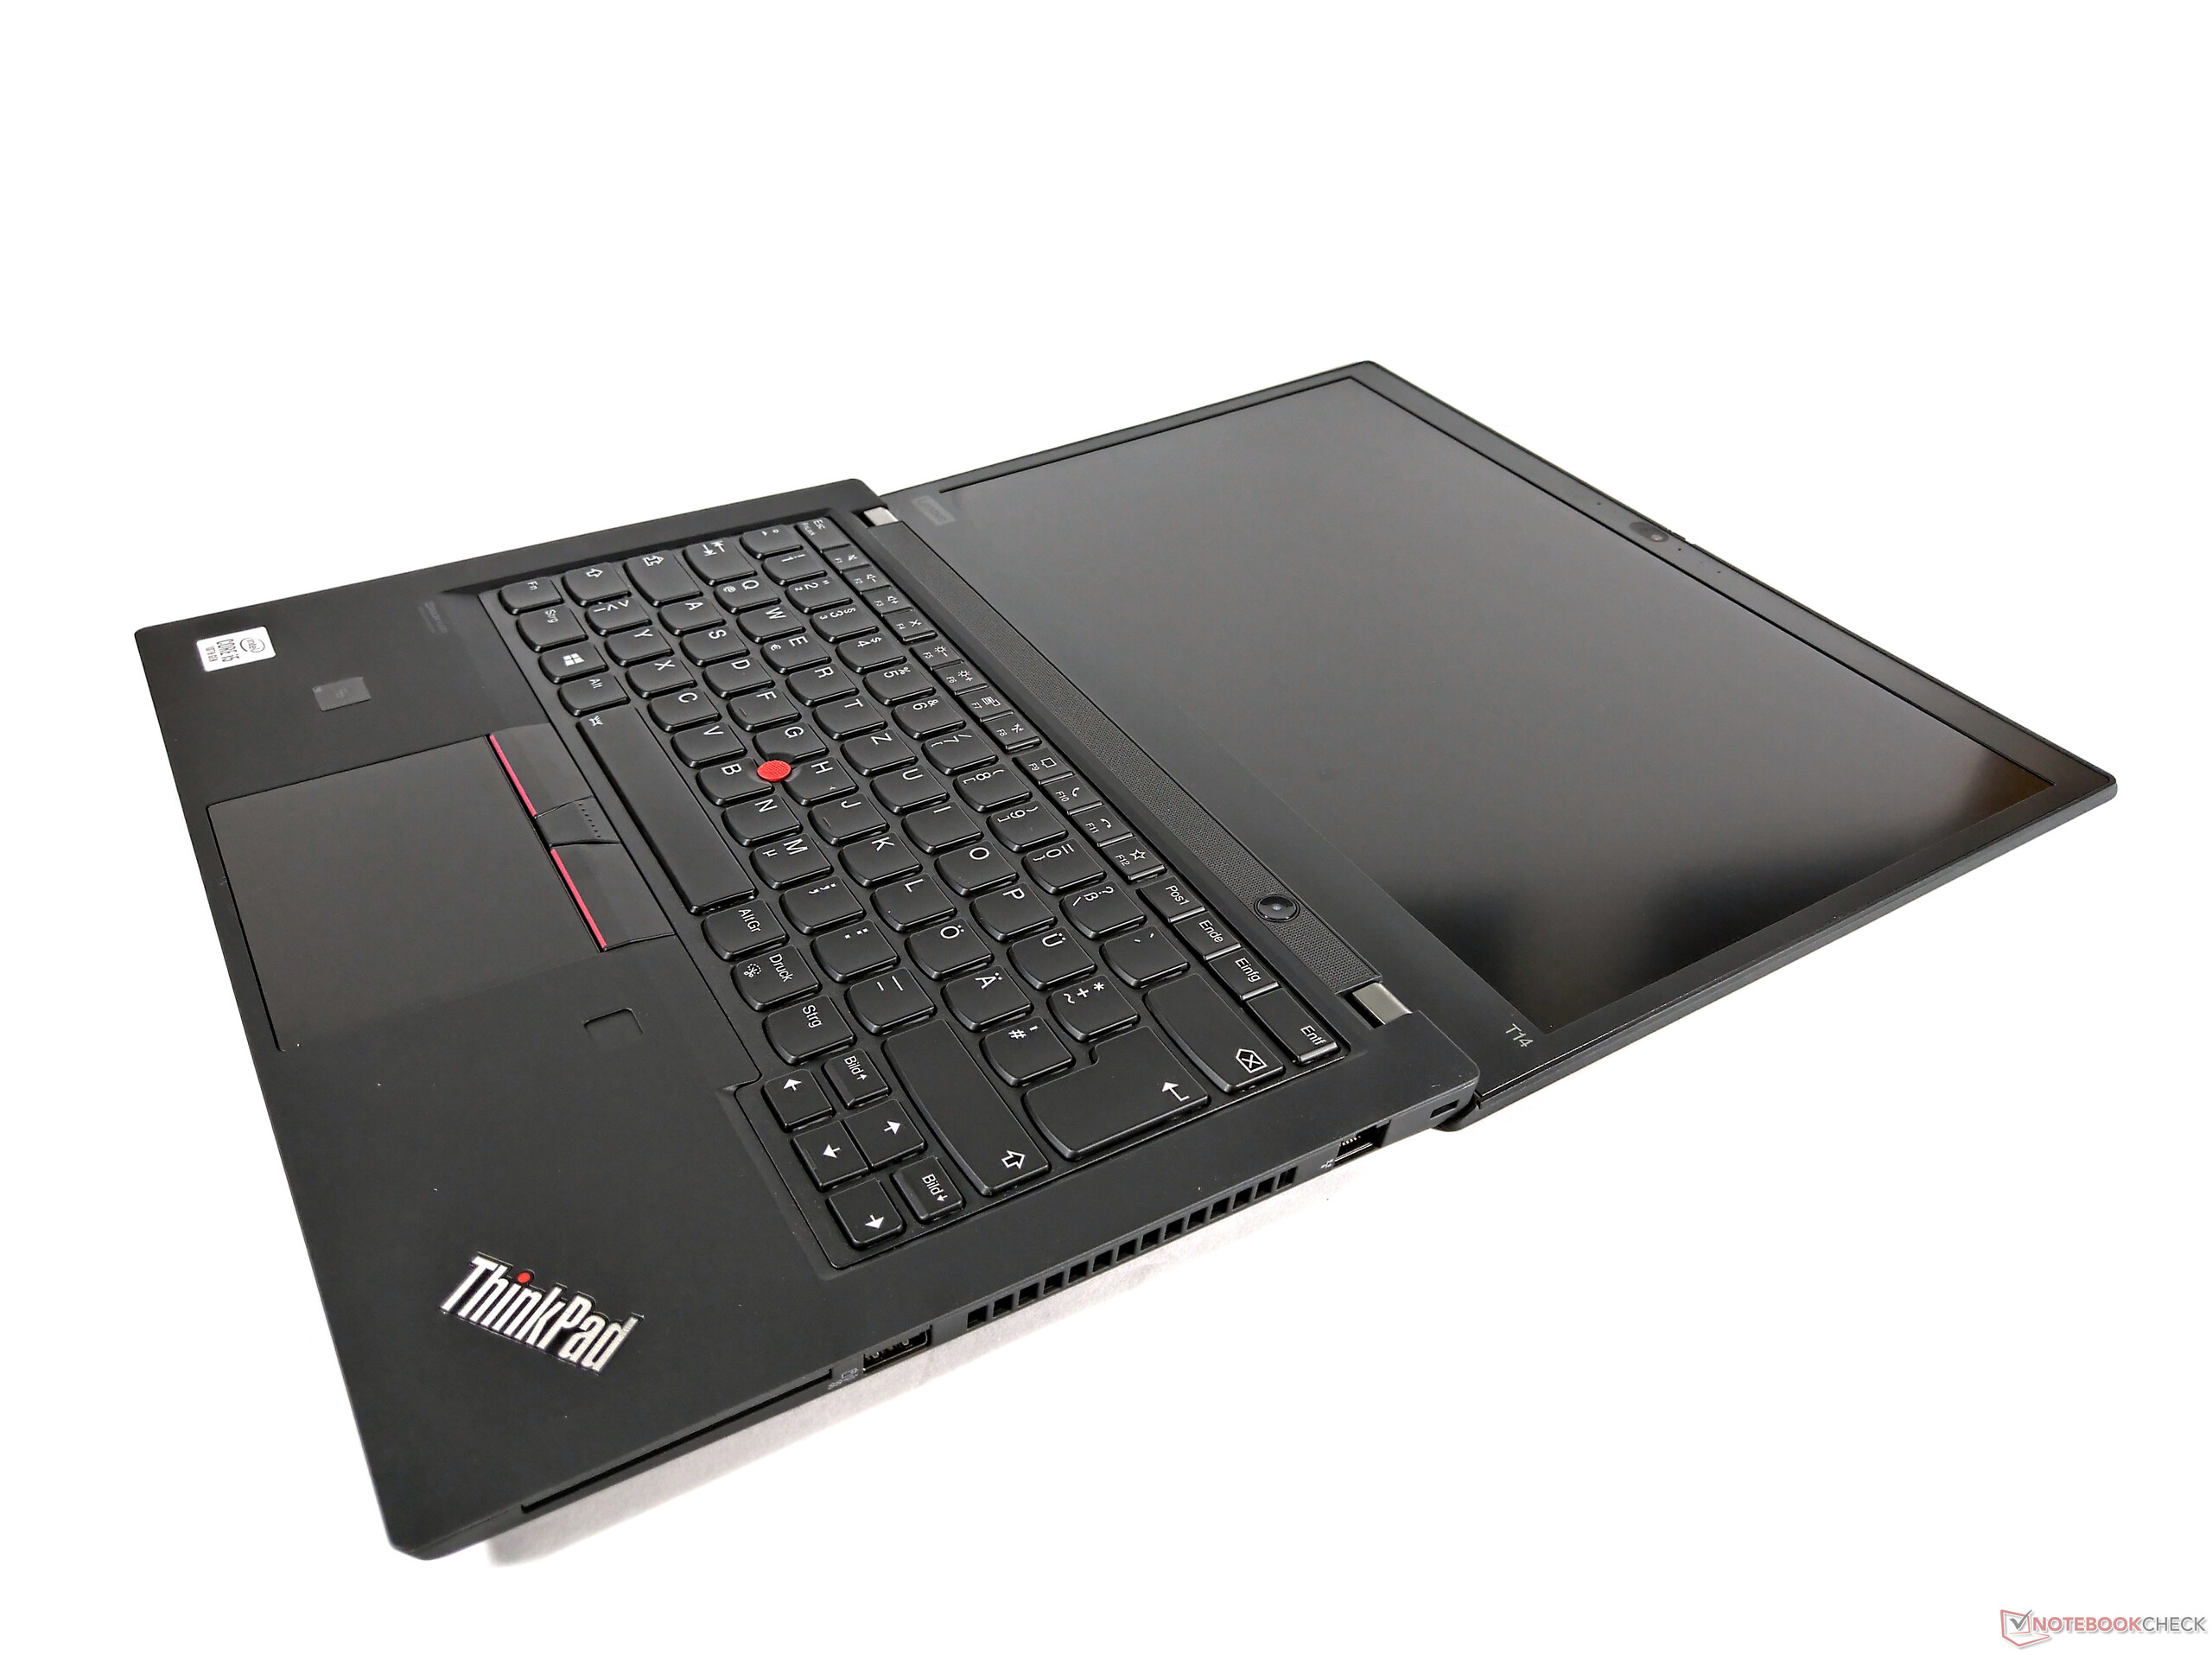
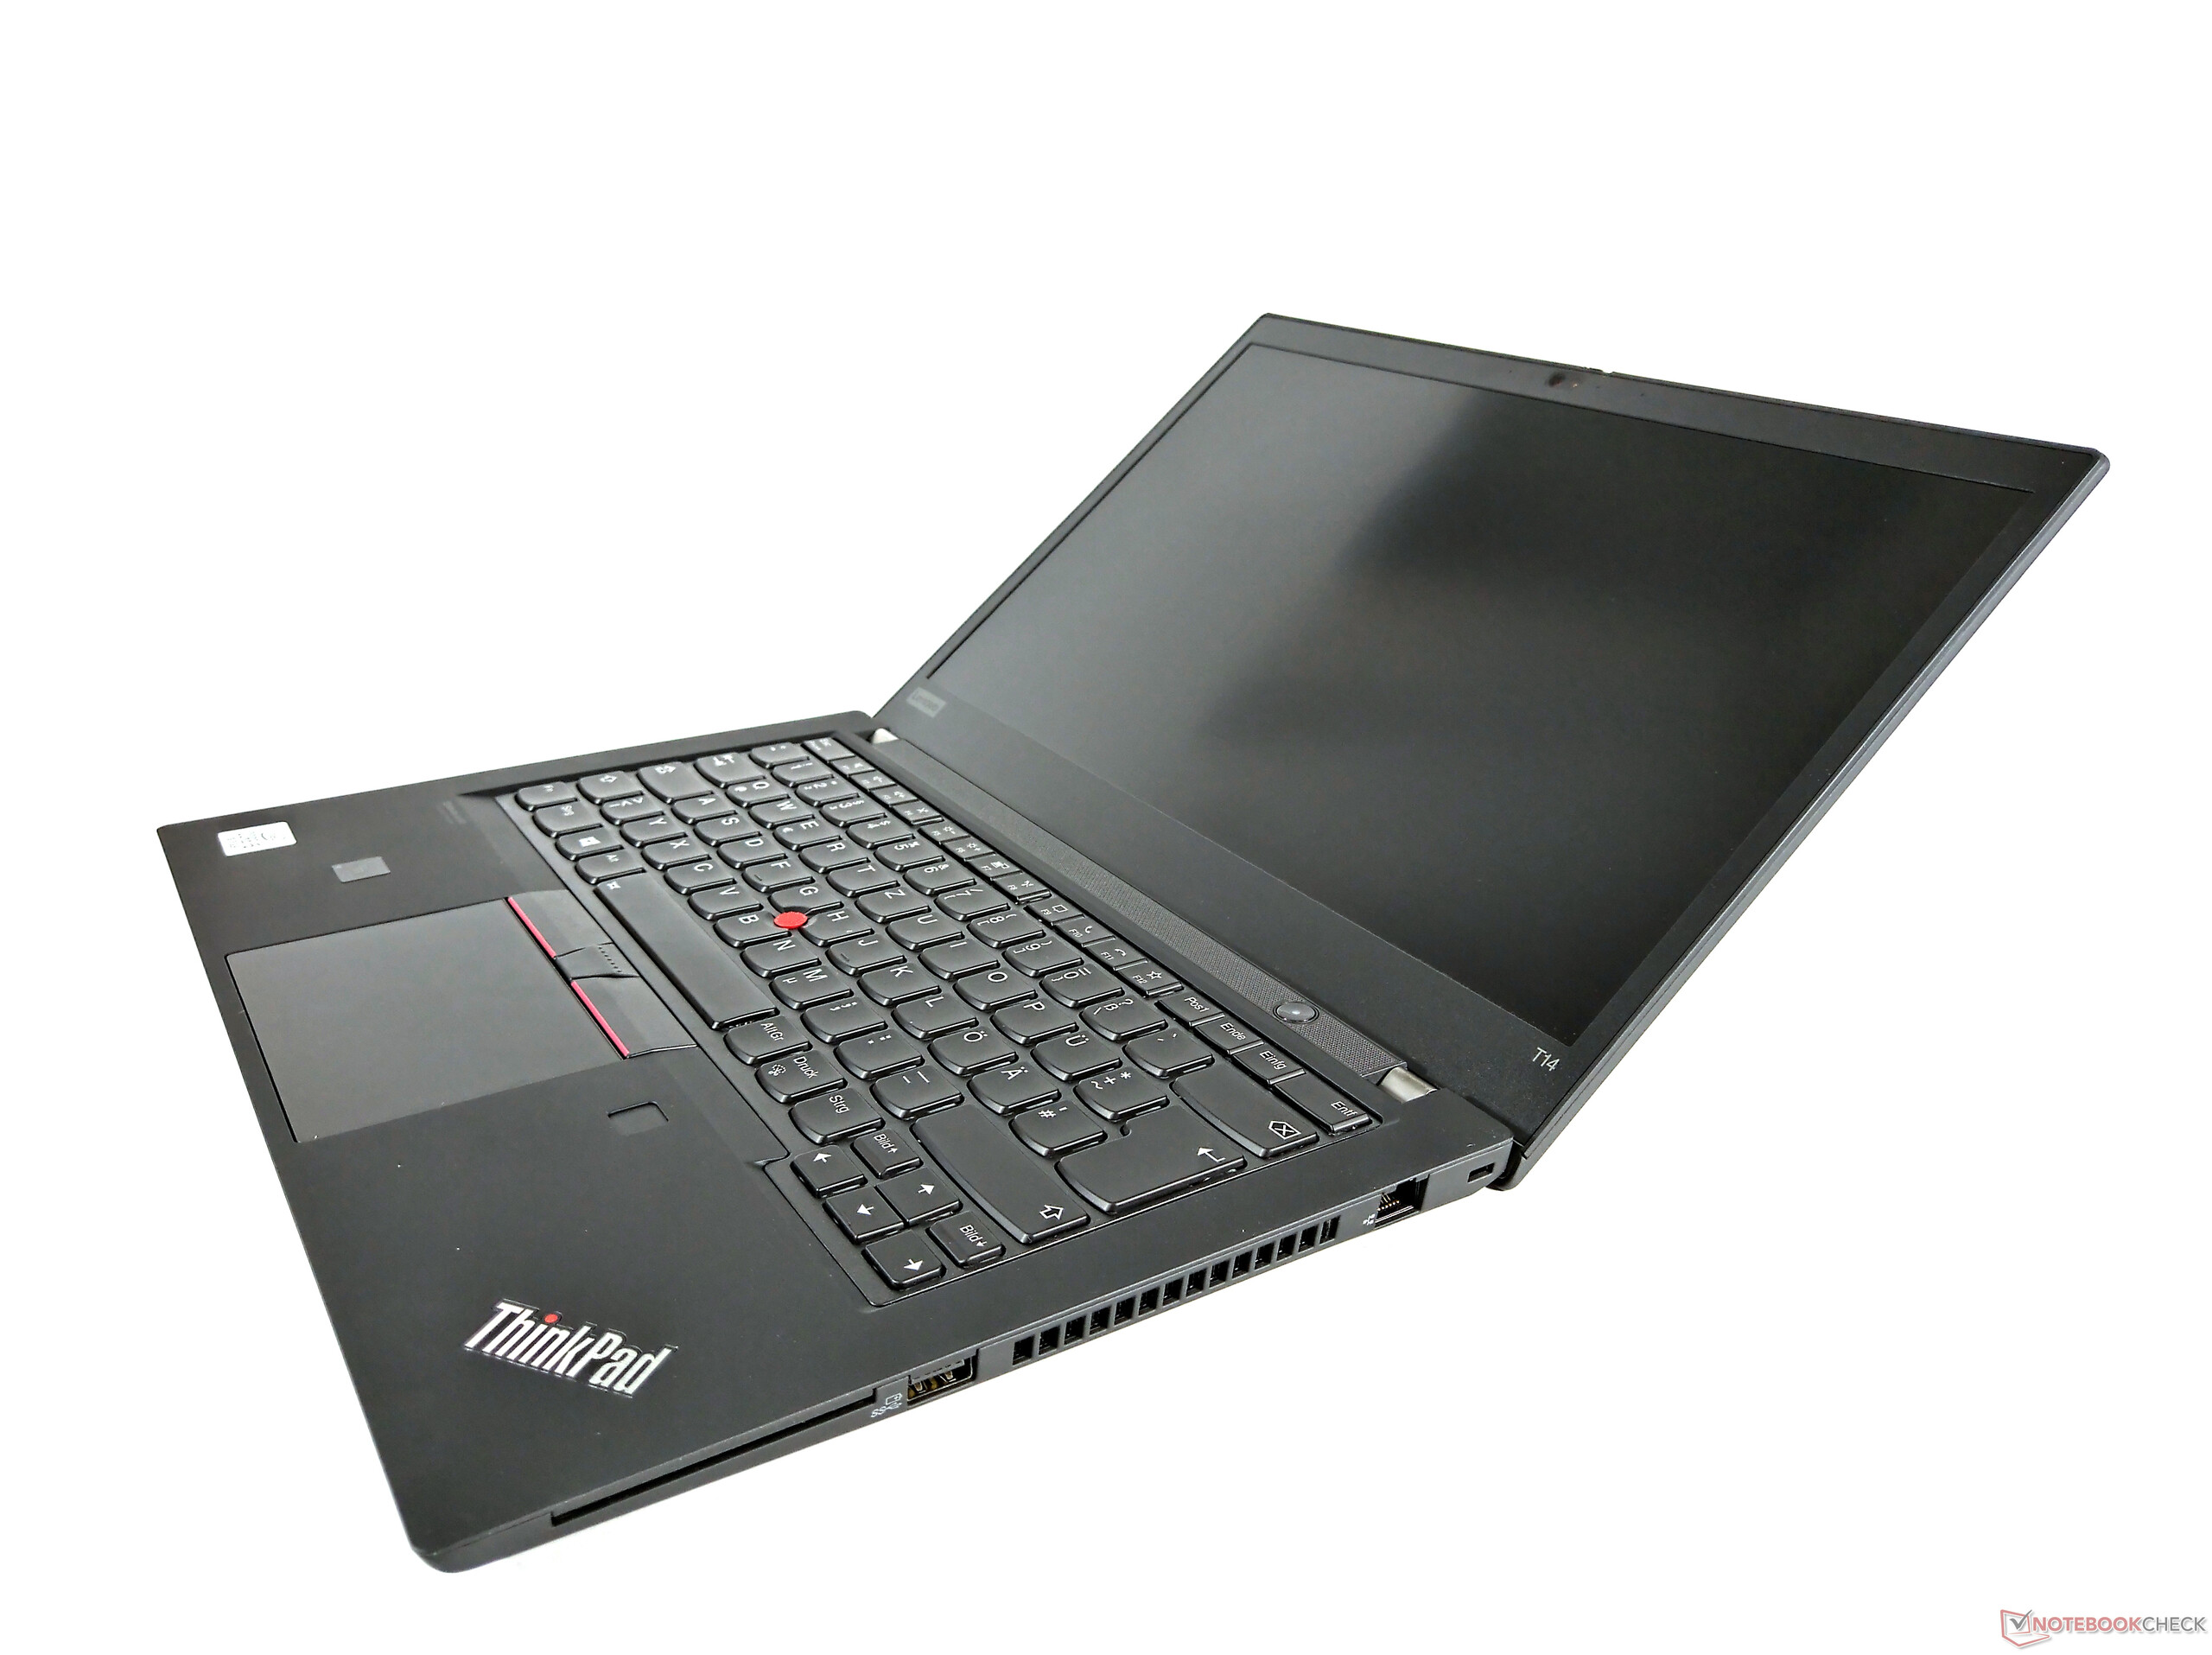
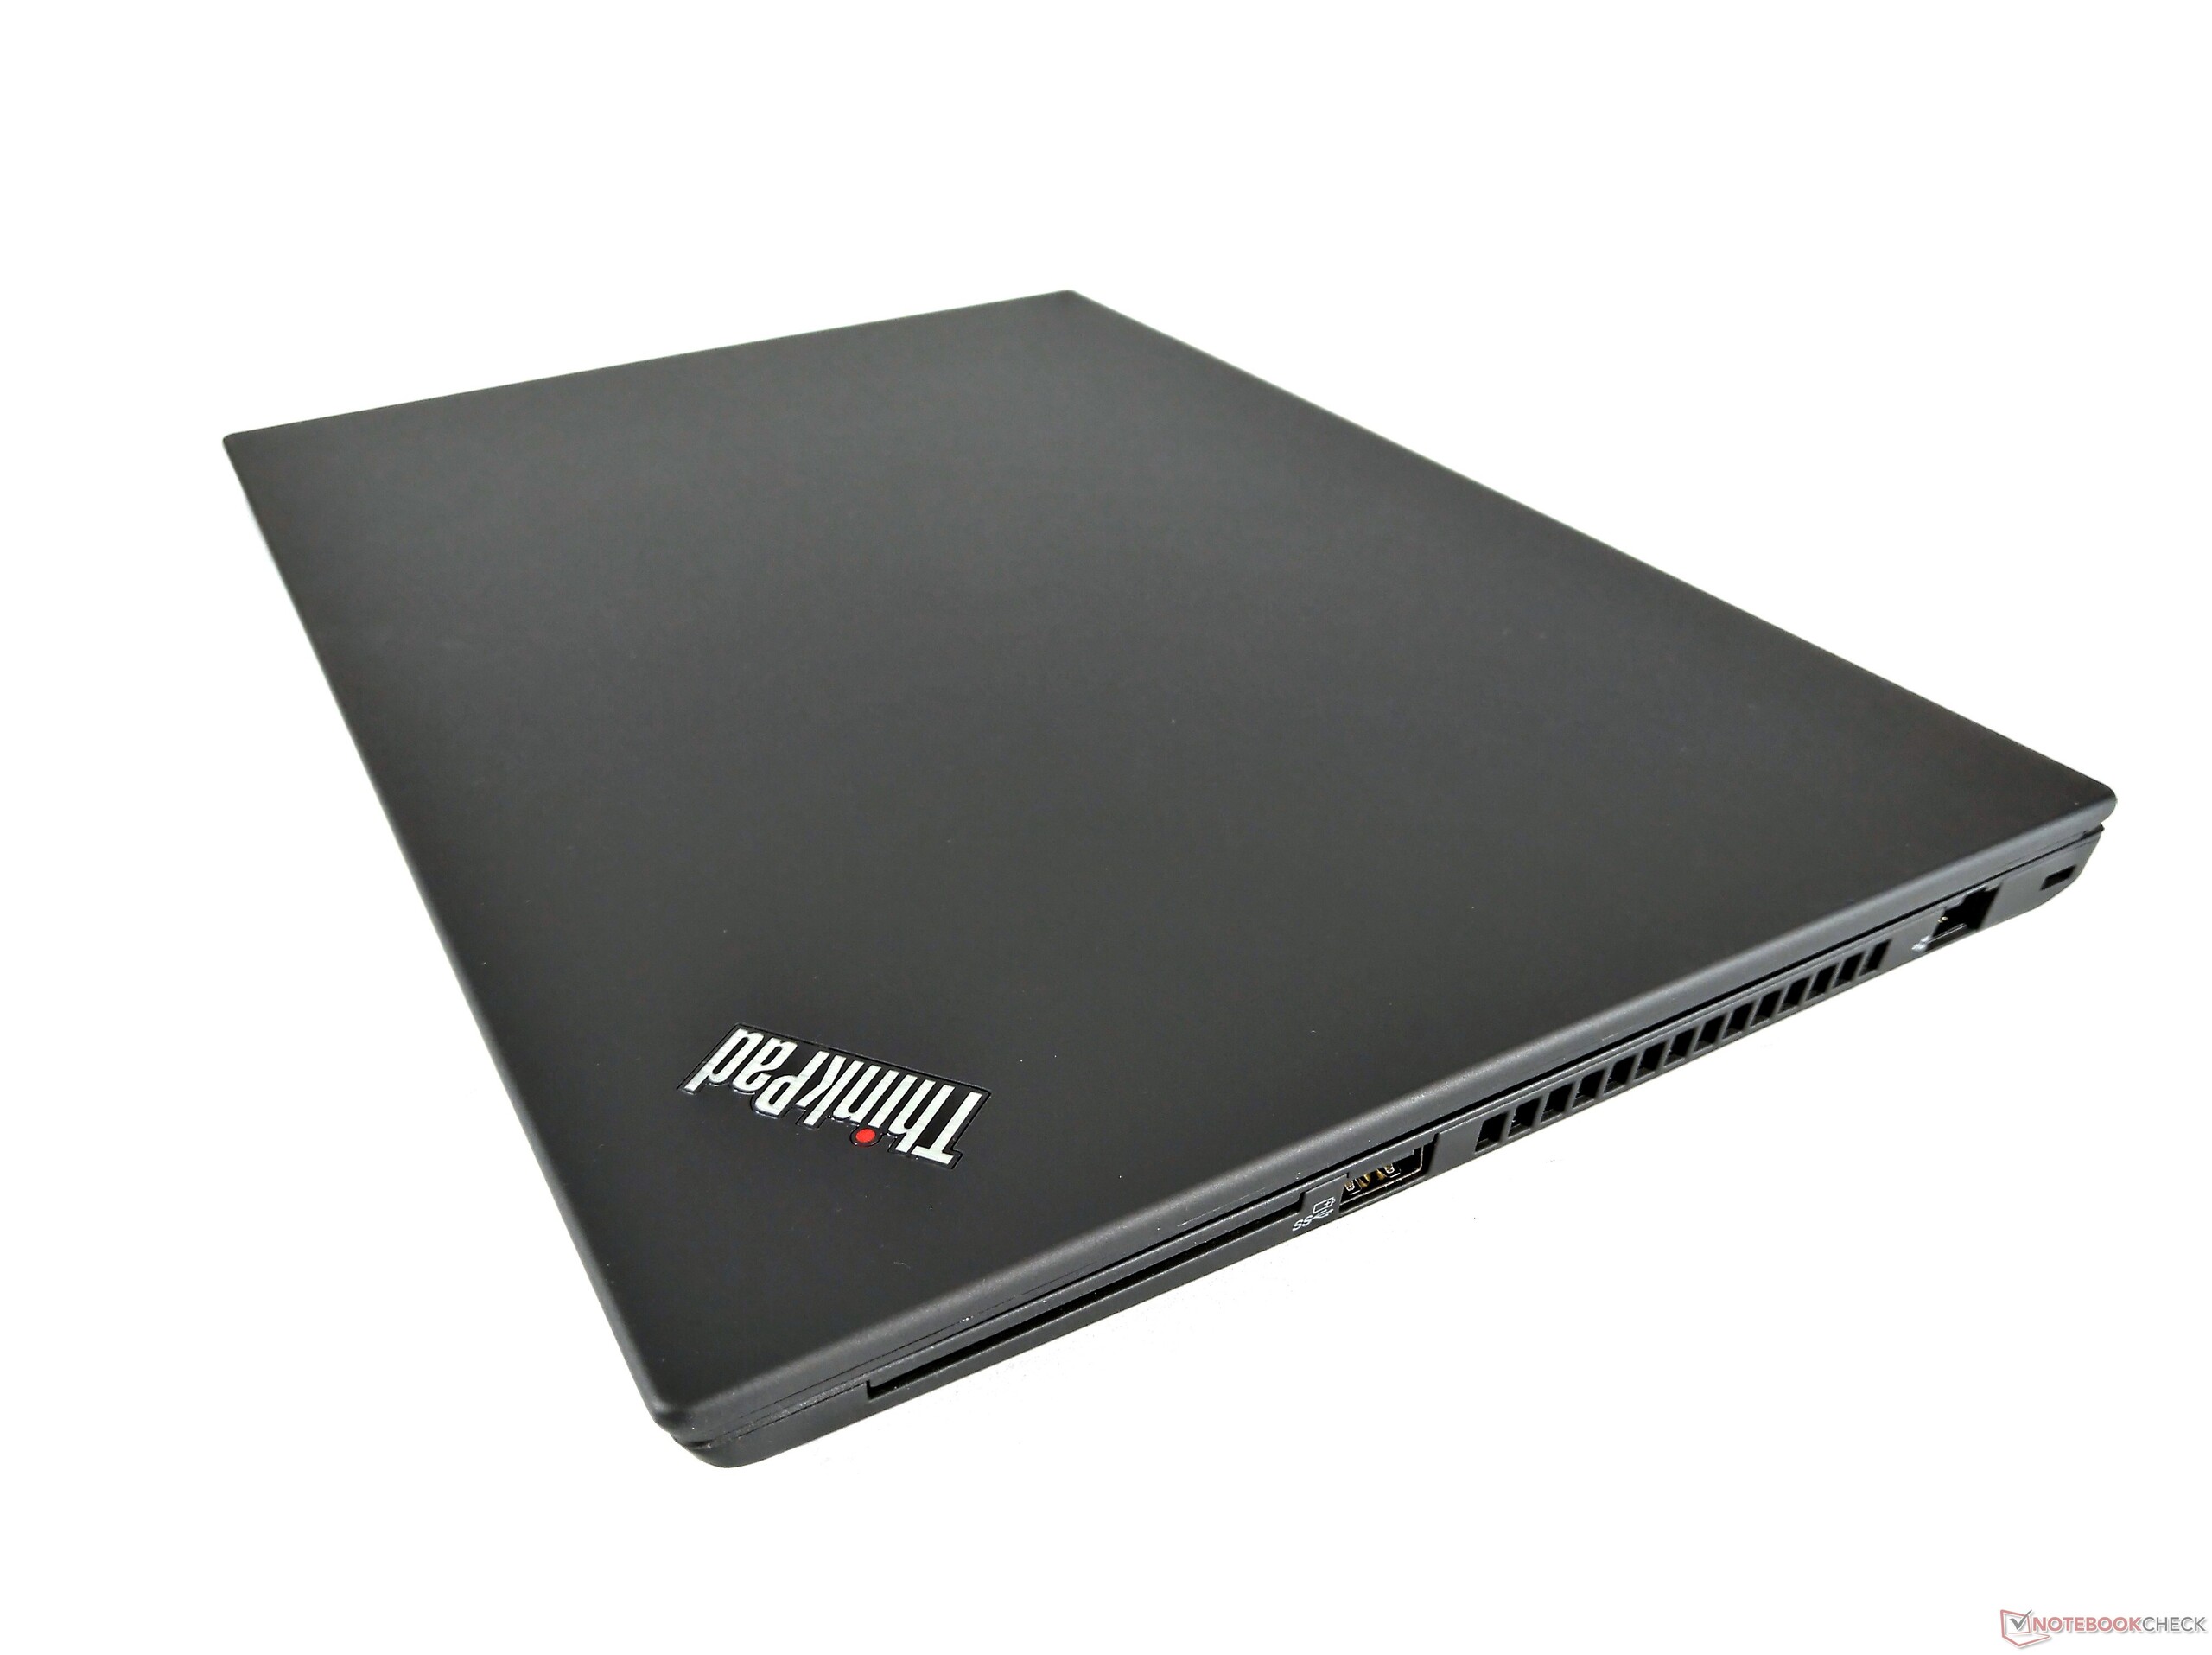
Ett nytt namn, men i övrigt samma: Lenovo ThinkPad T14 Gen 1 är bara en liten uppdatering av ThinkPad T490. En del mindre detaljer har förvisso förbättrats, men totalt sett är frågan om det verkligen behövdes.
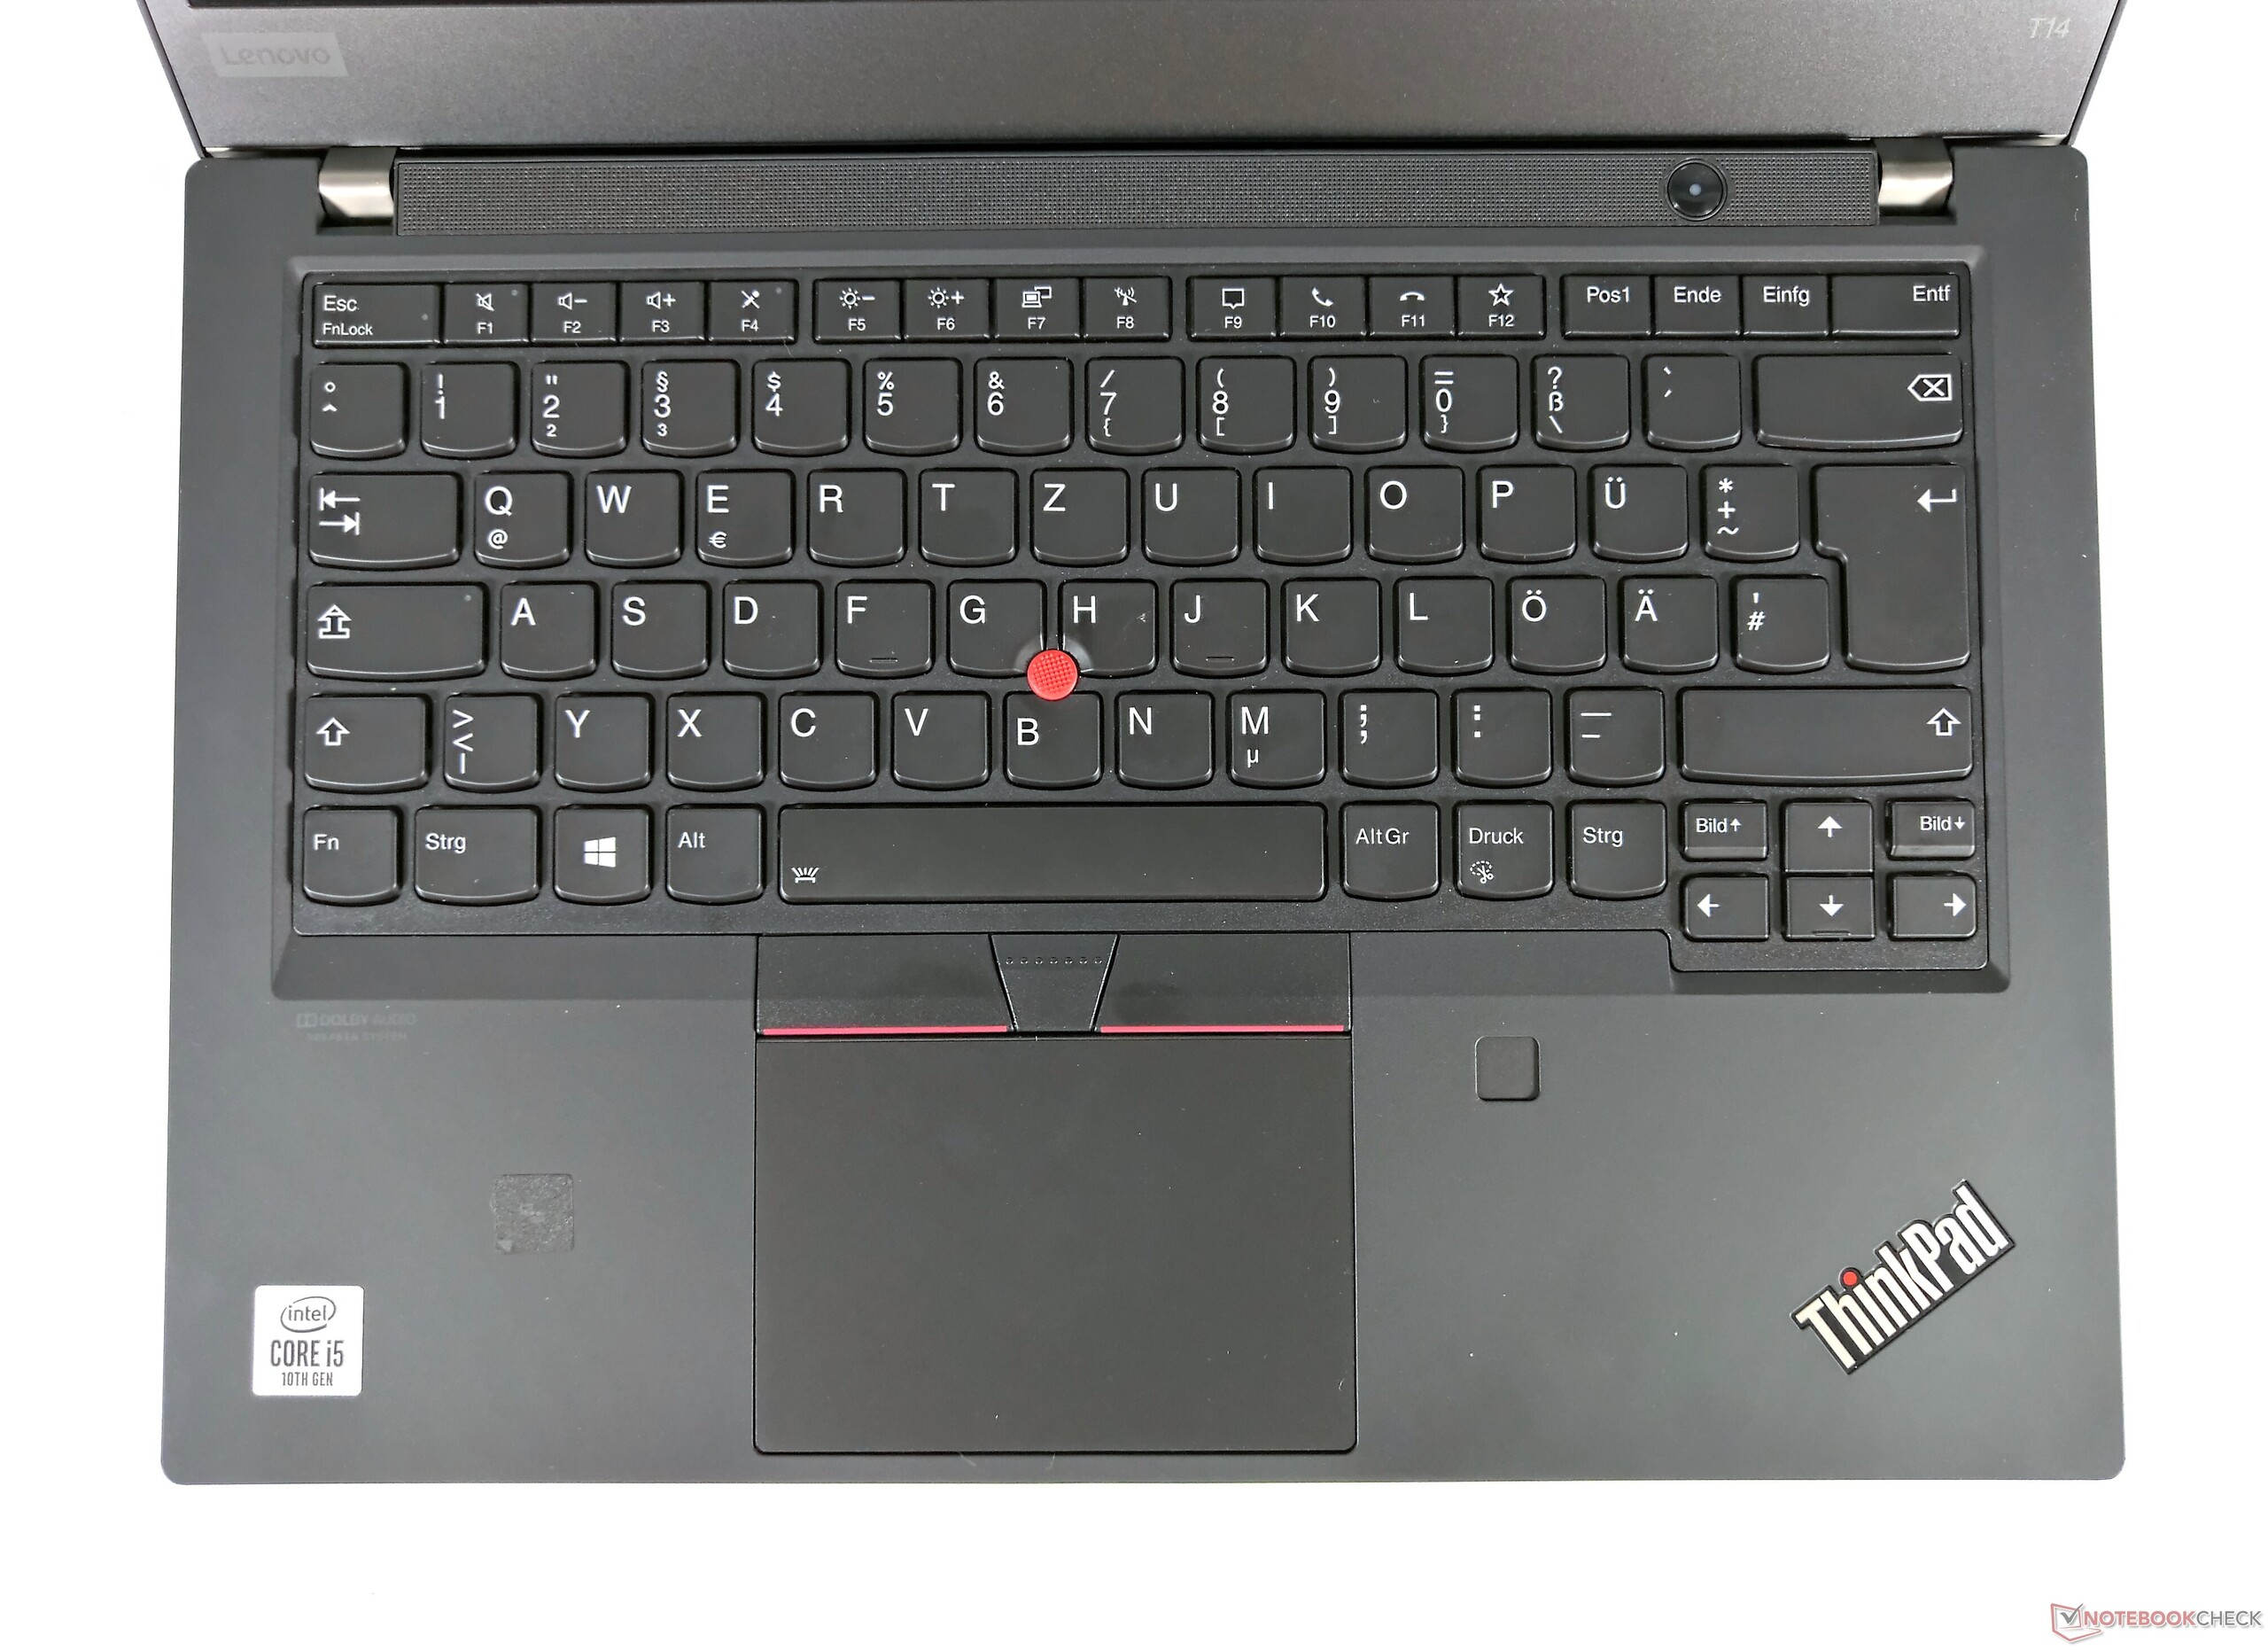
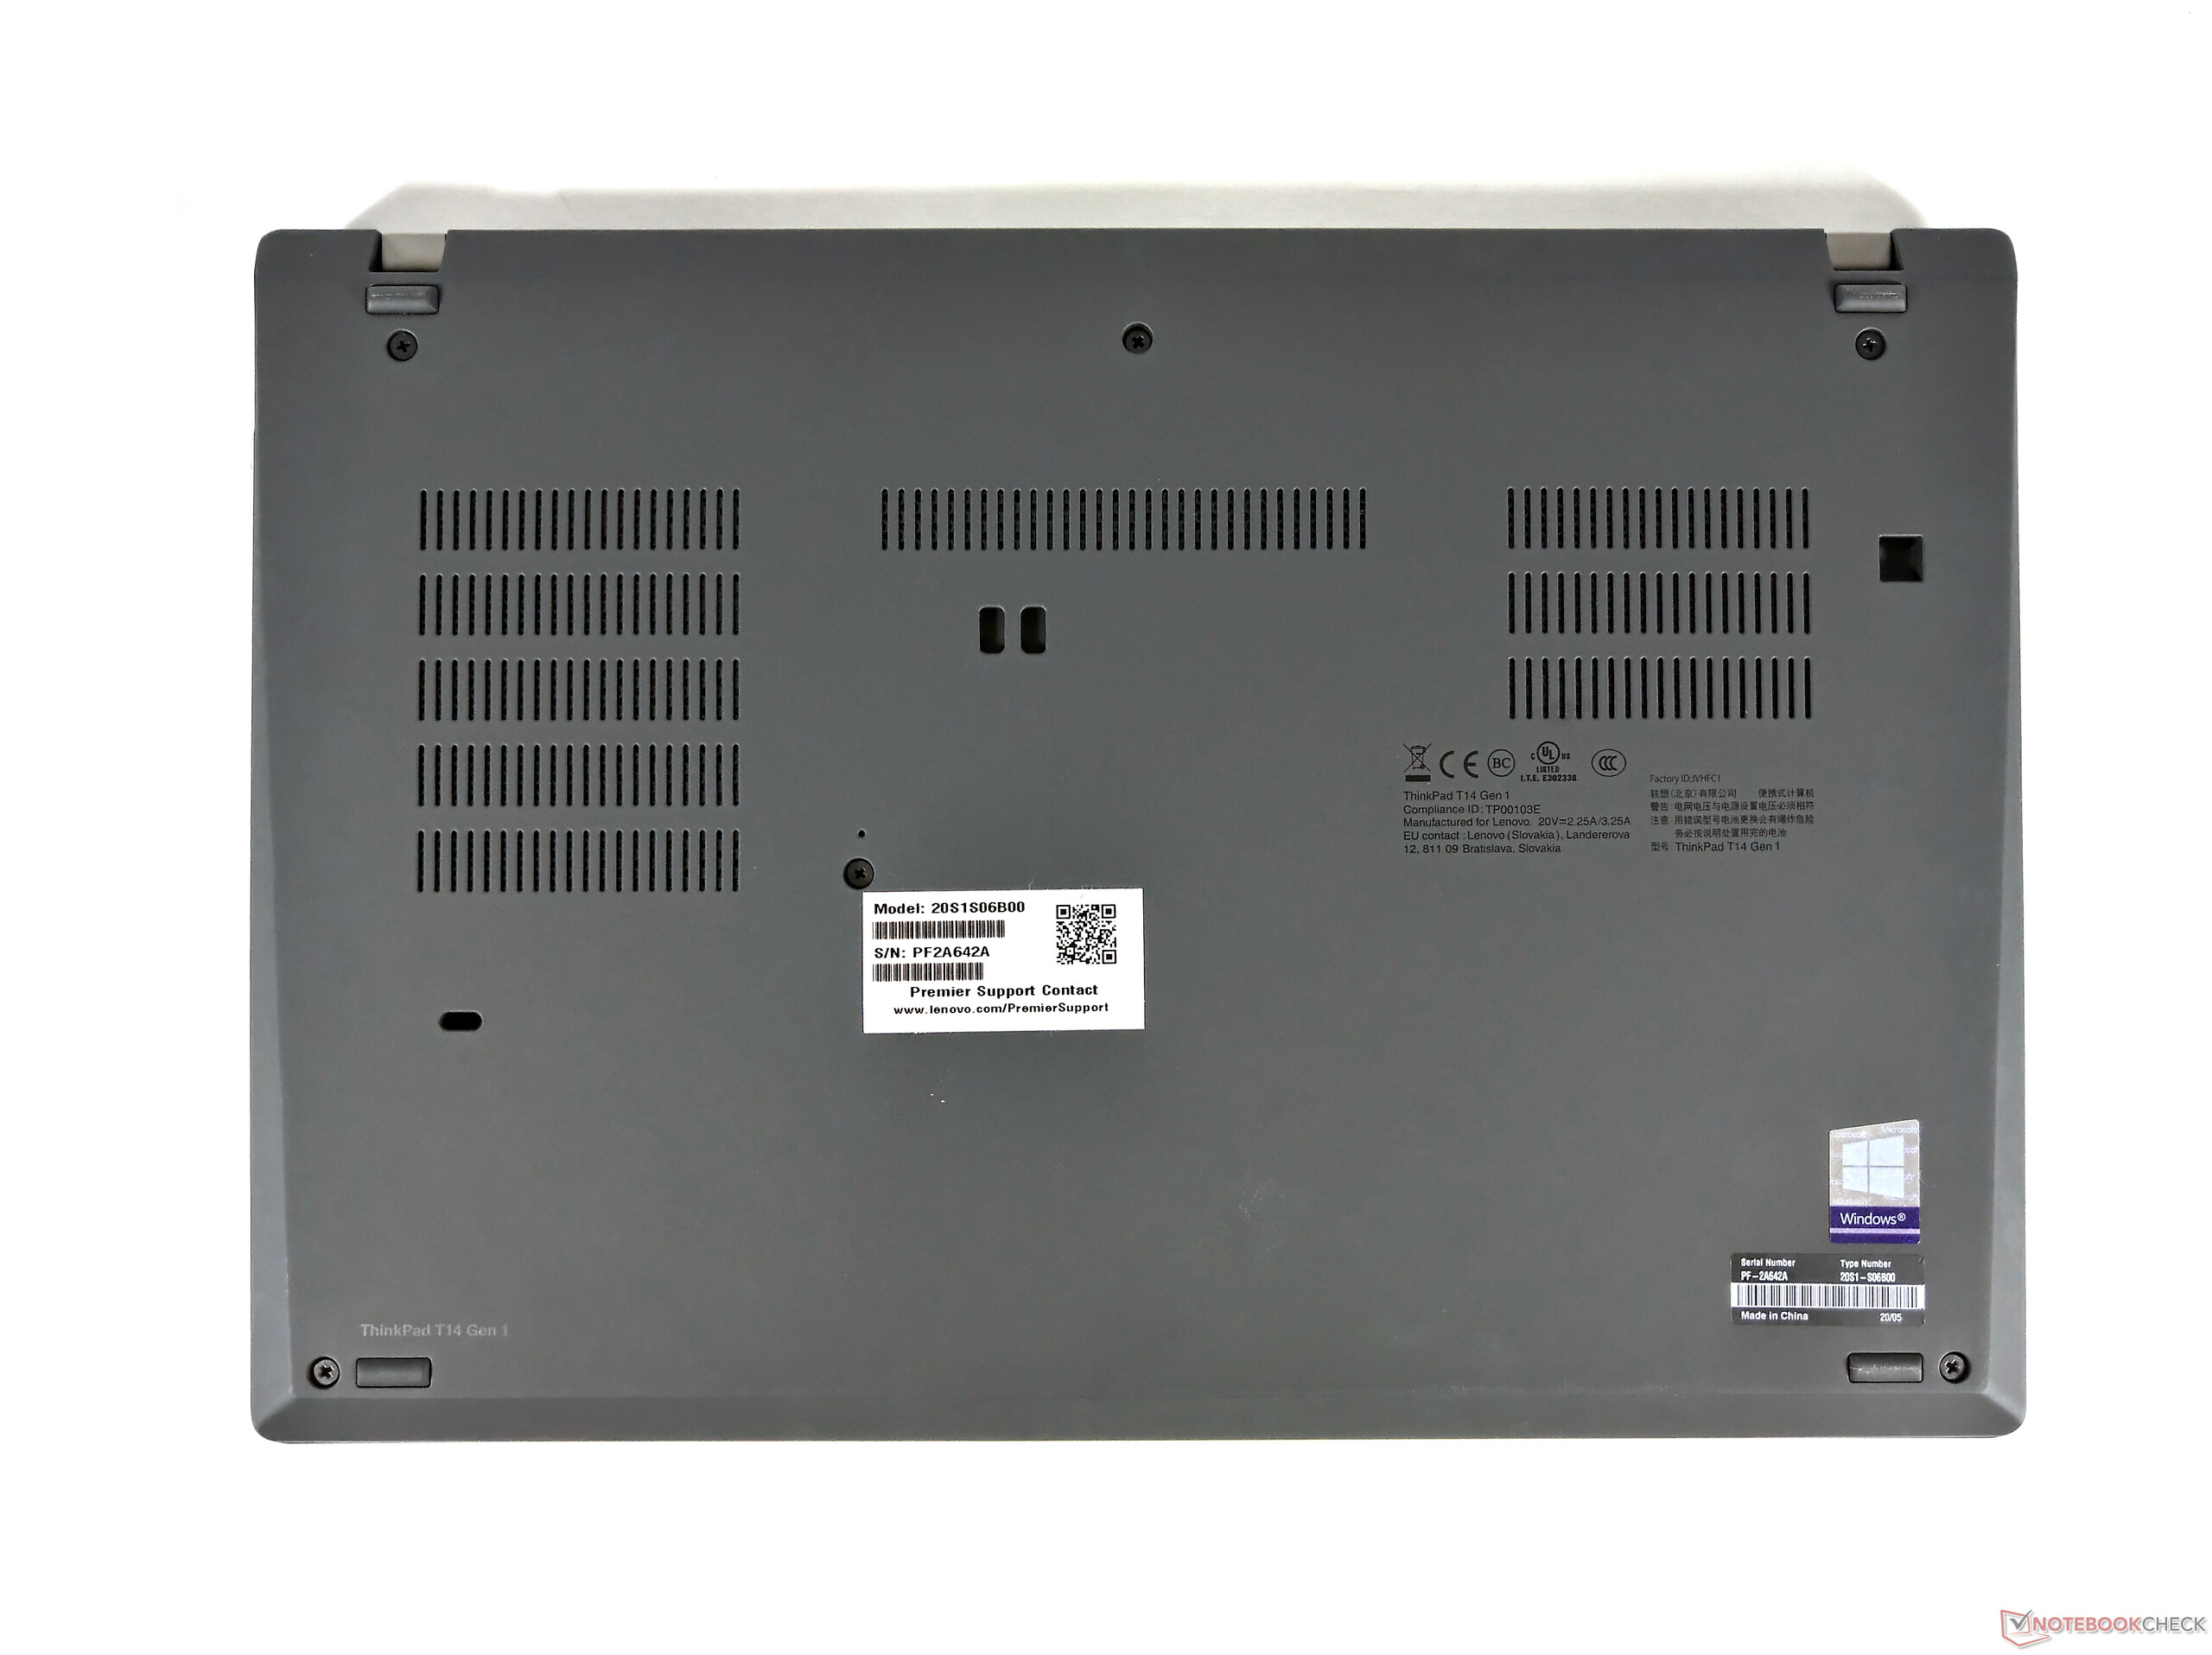
Den har ärvt sina styrkor från ThinkPad T490, men definitivt också dess svagheter. Detta inkluderar en Thunderbolt-anslutning med endast två PCIe-banor och ett hölje som är svårt att öppna. Dessutom saknar den en SD-kortläsare i full storlek. När det kommer till styrkorna har vi höljet, inmatningsenheterna, anslutbarheten, skärmen och garantin. Bland de positiva förändringarna har vi bättre högtalare och en ännu tystare fläkt.
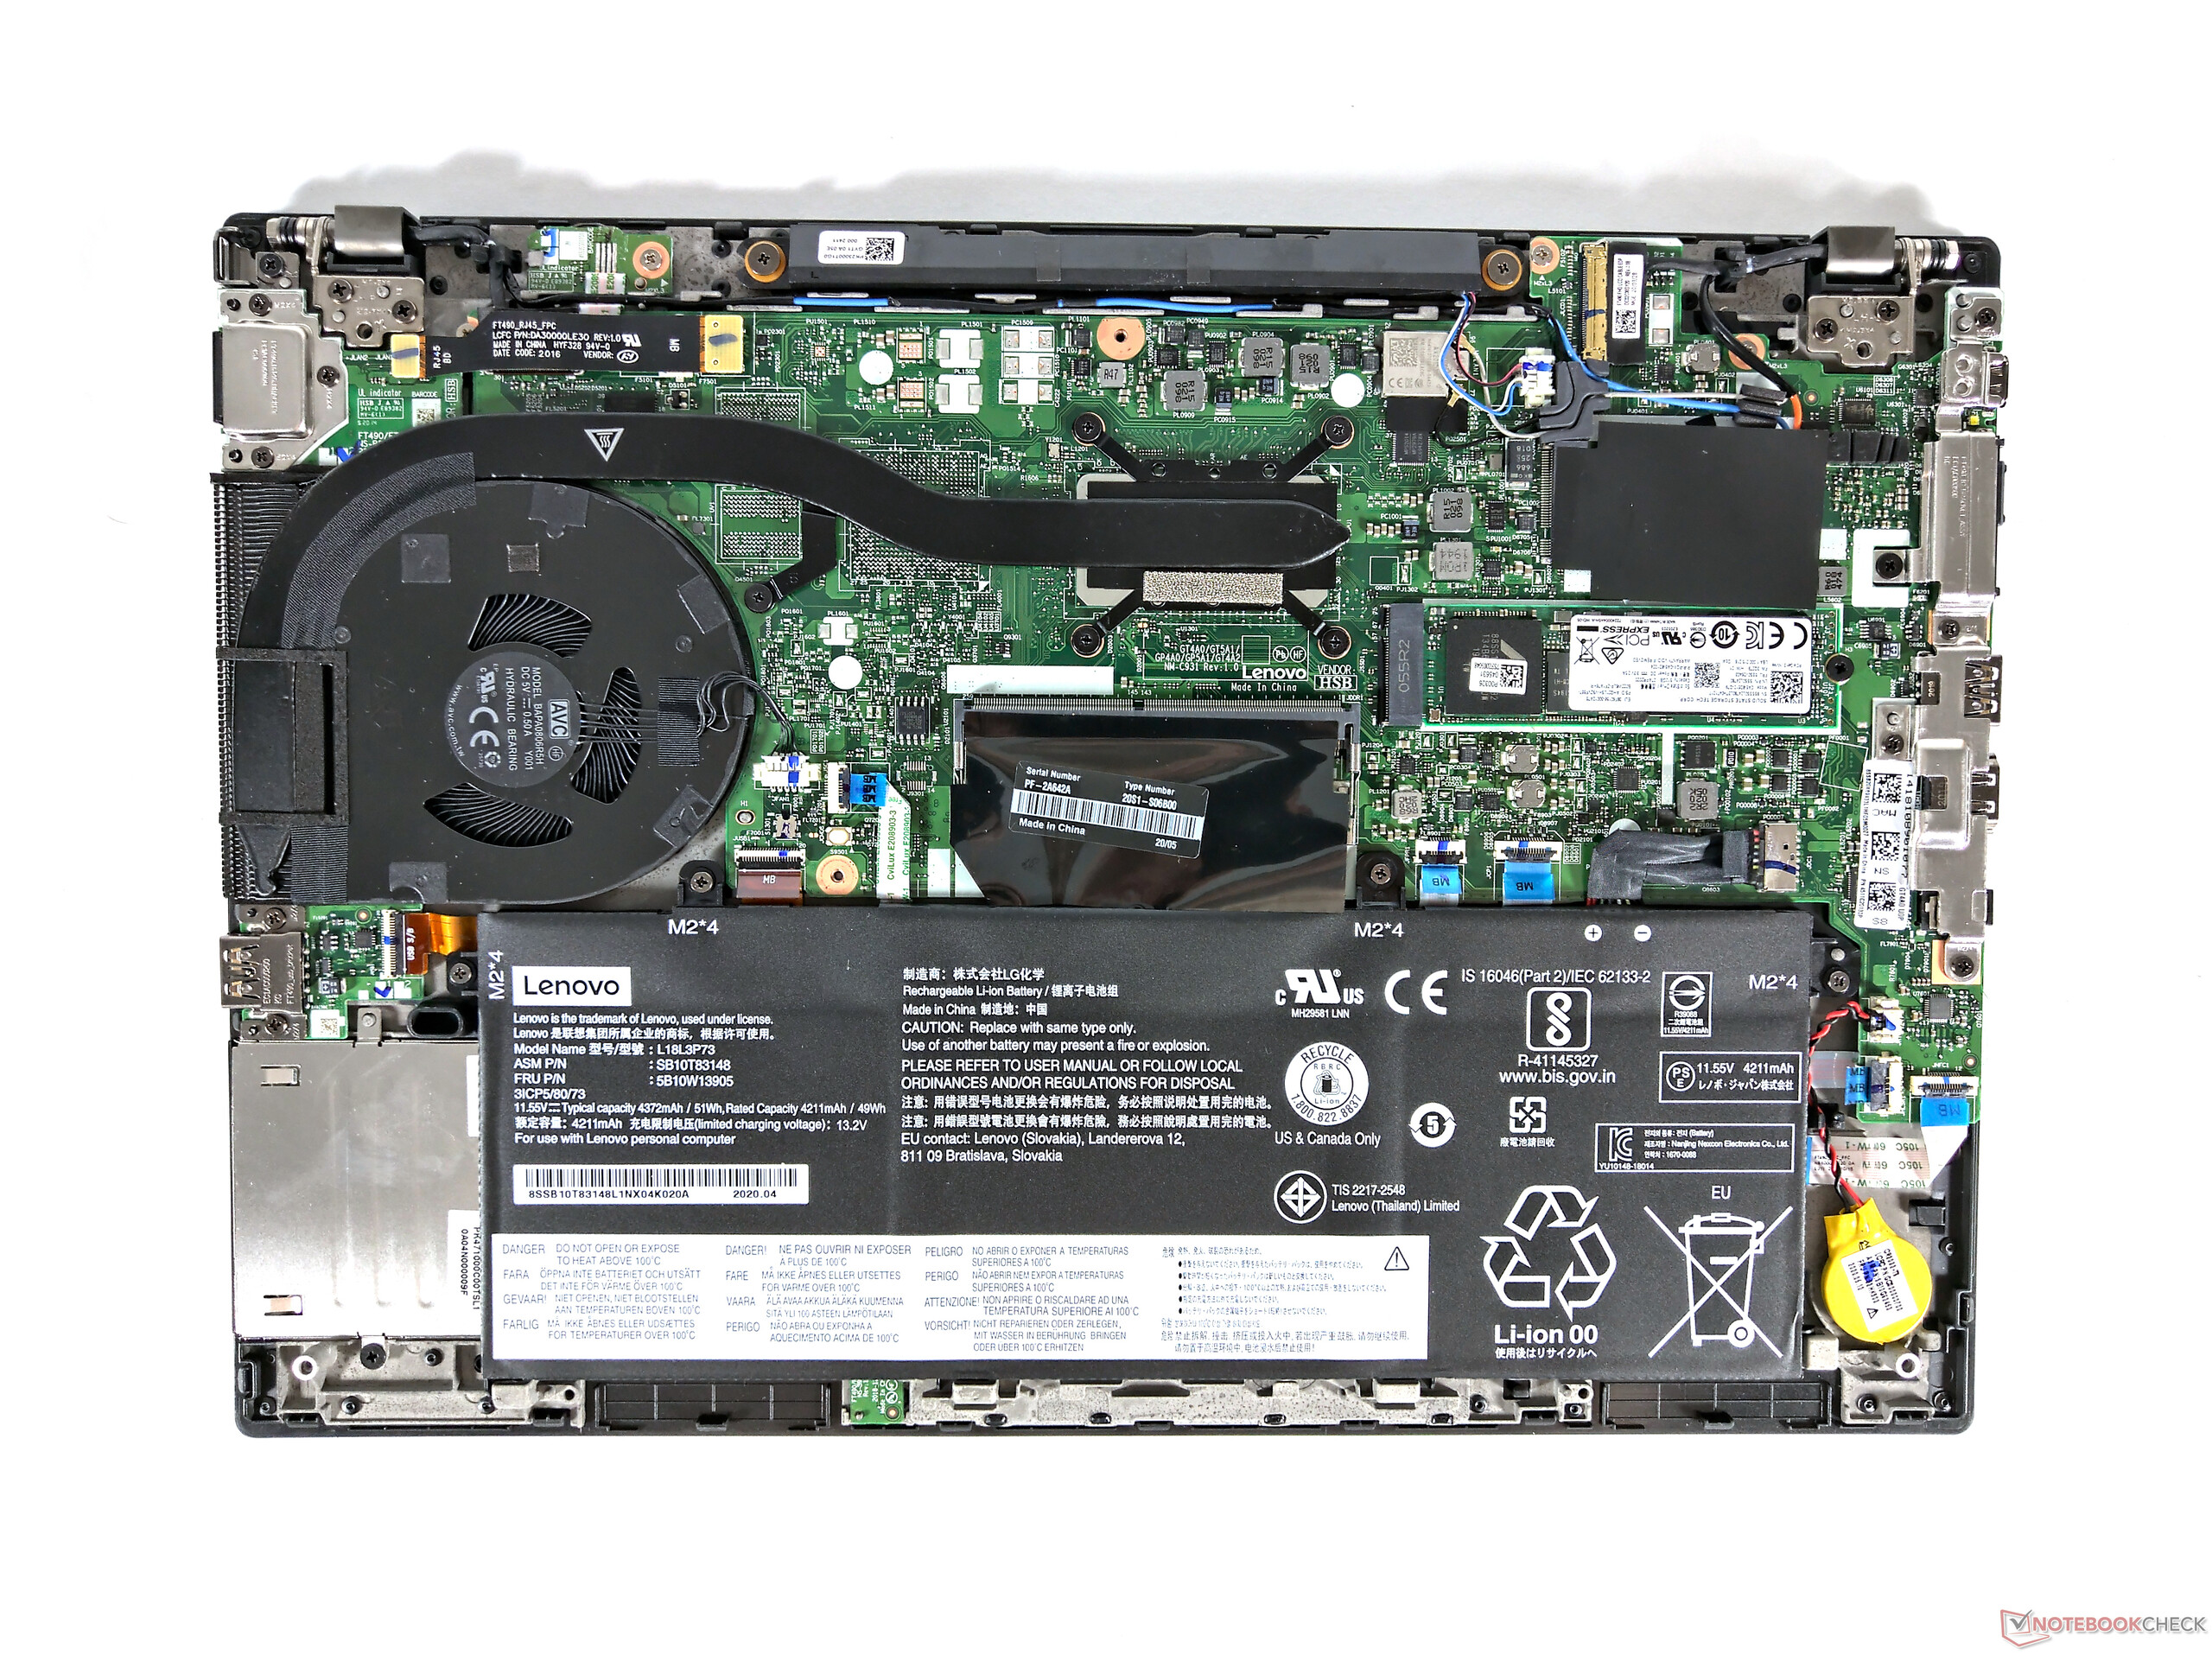
Ljudnivån kan för all del ses som en fördel. Men det kan också tänkas vara en negativ aspekt eftersom ThinkPad T14 2020 har problem med värmen. Över 65 °C på undersidan i vårt stresstest är alldeles för mycket (och det är för modellen med en iGPU!). Ett annat viktigt område är CPU-prestandan, som knappt har förbättrats alls och som på en del sätt till och med har blivit sämre. Det får en att undra över huruvida man ska välja den nya Intel-baserade ThinkPad-modellen överhuvudtaget.
Lenovo ThinkPad T14 kommer knappt med några argument för varför vi skulle välja den framför dess föregångare.
Borde man köpa ThinkPad T14 med en Intel Comet Lake CPU? Om AMD-modellen visar sig vara mycket snabbare är svaret nej. Det är bara Thunderbolt 3 och 4K UHD-skärmen som finns som tillval som gör Intel-modellen intressant överhuvudtaget. Annars gäller följande: AMD är troligen ett bättre val i år eftersom Comet Lake inte ger någon särskild anledning att uppgradera utöver WiFi 6.
Lenovo ThinkPad T14-20S1S06B00
- 07/01/2020 v7 (old)
Benjamin Herzig
Price comparison
