Test: Dell Vostro 15 3568 (7200U, 256GB) Laptop (Sammanfattning)

| SD Card Reader | |
| average JPG Copy Test (av. of 3 runs) | |
| Acer Aspire 3 A315-51-55E4 (Toshiba Exceria Pro SDXC 64 GB UHS-II) | |
| Asus VivoBook S15 S510UA (Toshiba Exceria Pro SDXC 64 GB UHS-II) | |
| Dell Vostro 15 3568 (Toshiba Exceria Pro SDXC 64 GB UHS-II) | |
| maximum AS SSD Seq Read Test (1GB) | |
| Acer Aspire 3 A315-51-55E4 (Toshiba Exceria Pro SDXC 64 GB UHS-II) | |
| Asus VivoBook S15 S510UA (Toshiba Exceria Pro SDXC 64 GB UHS-II) | |
| Dell Vostro 15 3568 (Toshiba Exceria Pro SDXC 64 GB UHS-II) | |
| Networking | |
| iperf3 transmit AX12 | |
| Lenovo ThinkPad E570-20H6S02M00 | |
| Asus VivoBook S15 S510UA | |
| Acer Aspire 3 A315-51-55E4 | |
| Dell Vostro 15 3568 | |
| iperf3 receive AX12 | |
| Asus VivoBook S15 S510UA | |
| Lenovo ThinkPad E570-20H6S02M00 | |
| Dell Vostro 15 3568 | |
| Acer Aspire 3 A315-51-55E4 | |
| |||||||||||||||||||||||||
Distribution av ljusstyrkan: 89 %
Mitt på batteriet: 195 cd/m²
Kontrast: 443:1 (Svärta: 0.44 cd/m²)
ΔE ColorChecker Calman: 12.23 | ∀{0.5-29.43 Ø4.71}
ΔE Greyscale Calman: 13.39 | ∀{0.09-98 Ø4.96}
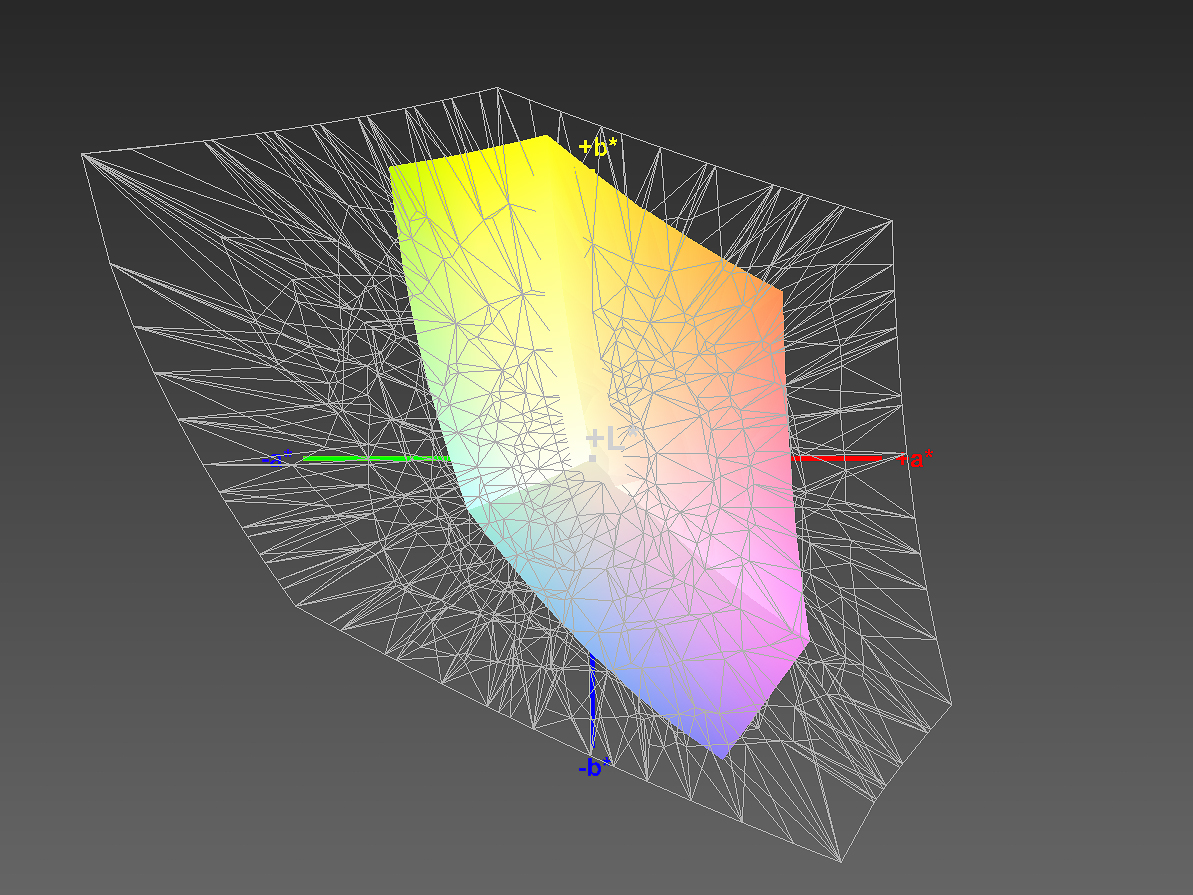
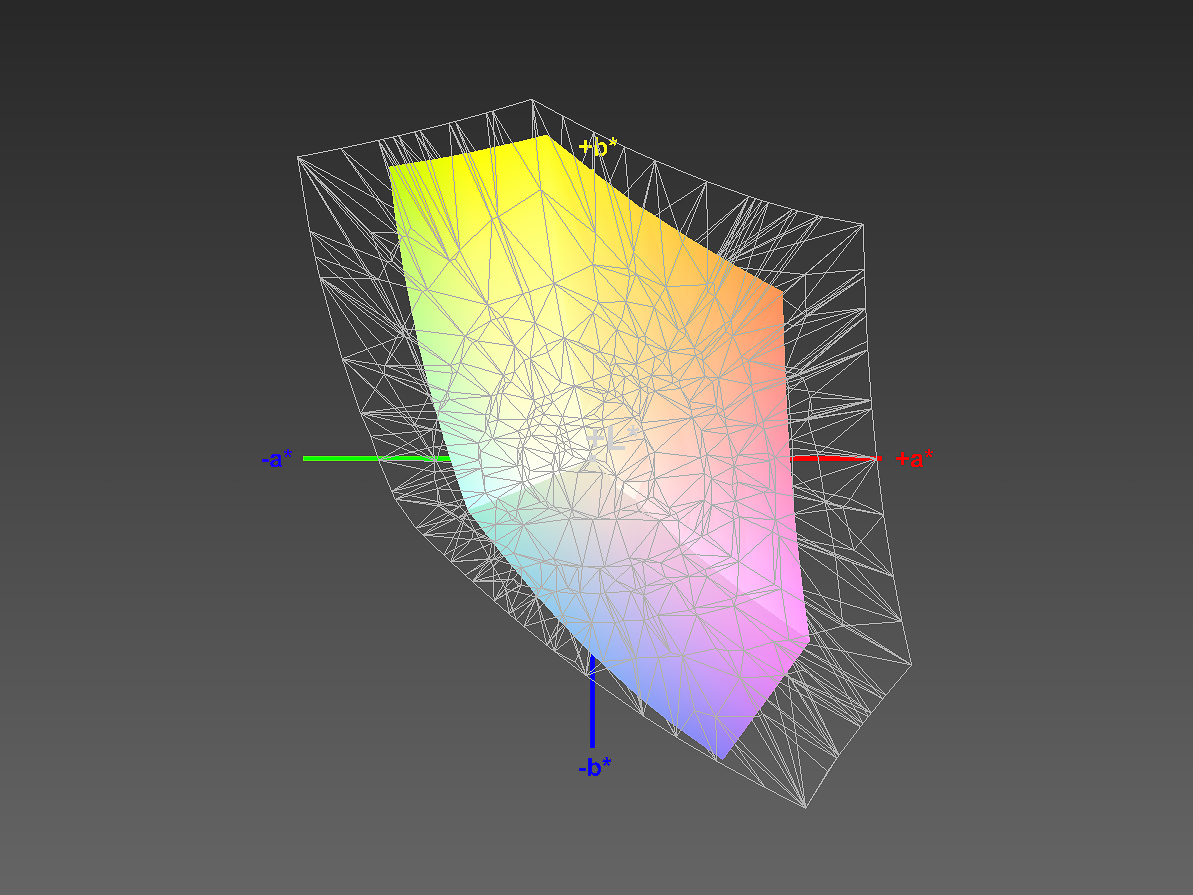
59% sRGB (Argyll 1.6.3 3D)
38% AdobeRGB 1998 (Argyll 1.6.3 3D)
40.69% AdobeRGB 1998 (Argyll 3D)
59.3% sRGB (Argyll 3D)
39.39% Display P3 (Argyll 3D)
Gamma: 2.5
CCT: 15759 K
| Dell Vostro 15 3568 BOE0690 / NT15N41 / Dell C1JFR, , 1920x1080, 15.6" | Acer Aspire 3 A315-51-55E4 AU Optronics AUO38ED, , 1920x1080, 15.6" | Lenovo ThinkPad E570-20H6S02M00 Lenovo NT156WHM-N42, , 1366x768, 15.6" | Asus VivoBook S15 S510UA ID: LGD0573, Name: LG Display LP156WF9-SPK2, , 1920x1080, 15.6" | |
|---|---|---|---|---|
| Display | -9% | -7% | 1% | |
| Display P3 Coverage (%) | 39.39 | 35.97 -9% | 36.79 -7% | 39.9 1% |
| sRGB Coverage (%) | 59.3 | 54.1 -9% | 55.4 -7% | 59.5 0% |
| AdobeRGB 1998 Coverage (%) | 40.69 | 37.17 -9% | 38.01 -7% | 41.11 1% |
| Response Times | -11% | -18% | -69% | |
| Response Time Grey 50% / Grey 80% * (ms) | 39 ? | 44 ? -13% | 46 ? -18% | 38.4 ? 2% |
| Response Time Black / White * (ms) | 11 ? | 12 ? -9% | 13 ? -18% | 26.4 ? -140% |
| PWM Frequency (Hz) | 28410 ? | 200 ? | ||
| Screen | 26% | -2% | 35% | |
| Brightness middle (cd/m²) | 195 | 241 24% | 242 24% | 277.5 42% |
| Brightness (cd/m²) | 195 | 229 17% | 233 19% | 265 36% |
| Brightness Distribution (%) | 89 | 87 -2% | 73 -18% | 89 0% |
| Black Level * (cd/m²) | 0.44 | 0.46 -5% | 0.59 -34% | 0.35 20% |
| Contrast (:1) | 443 | 524 18% | 410 -7% | 793 79% |
| Colorchecker dE 2000 * | 12.23 | 3.4 72% | 10.9 11% | 4.8 61% |
| Colorchecker dE 2000 max. * | 20.85 | 7.61 64% | 20.84 -0% | 17.8 15% |
| Greyscale dE 2000 * | 13.39 | 1.7 87% | 13.07 2% | 3 78% |
| Gamma | 2.5 88% | 2.36 93% | 2.37 93% | 2.39 92% |
| CCT | 15759 41% | 6750 96% | 13123 50% | 6854 95% |
| Color Space (Percent of AdobeRGB 1998) (%) | 38 | 34 -11% | 35 -8% | 37.7 -1% |
| Color Space (Percent of sRGB) (%) | 59 | 54 -8% | 55 -7% | 69.3 17% |
| Totalt genomsnitt (program/inställningar) | 2% /
14% | -9% /
-5% | -11% /
14% |
* ... mindre är bättre
Visa svarstider
| ↔ Svarstid svart till vitt | ||
|---|---|---|
| 11 ms ... stiga ↗ och falla ↘ kombinerat | ↗ 7 ms stiga | 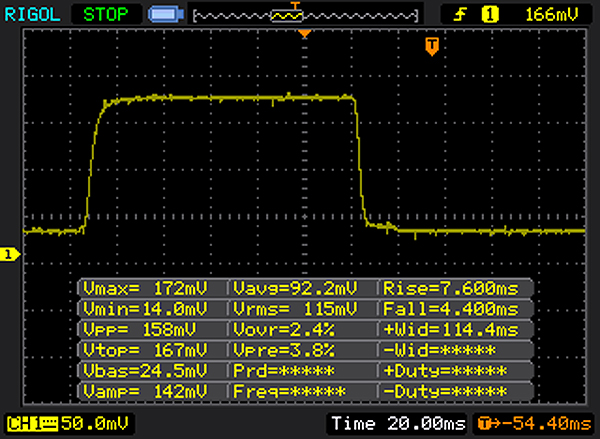 |
| ↘ 4 ms hösten | ||
| Skärmen visar bra svarsfrekvens i våra tester, men kan vara för långsam för konkurrenskraftiga spelare. I jämförelse sträcker sig alla testade enheter från 0.1 (minst) till 240 (maximalt) ms. » 30 % av alla enheter är bättre. Det betyder att den uppmätta svarstiden är bättre än genomsnittet av alla testade enheter (19.8 ms). | ||
| ↔ Svarstid 50 % grått till 80 % grått | ||
| 39 ms ... stiga ↗ och falla ↘ kombinerat | ↗ 21 ms stiga | 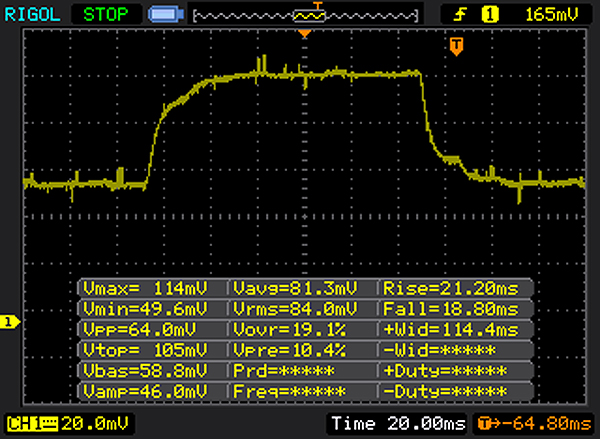 |
| ↘ 18 ms hösten | ||
| Skärmen visar långsamma svarsfrekvenser i våra tester och kommer att vara otillfredsställande för spelare. I jämförelse sträcker sig alla testade enheter från 0.165 (minst) till 636 (maximalt) ms. » 59 % av alla enheter är bättre. Detta innebär att den uppmätta svarstiden är sämre än genomsnittet av alla testade enheter (31 ms). | ||
Skärmflimmer / PWM (Puls-Width Modulation)
| Skärmflimmer / PWM upptäckt | 28410 Hz | ≤ 90 % ljusstyrka inställning | 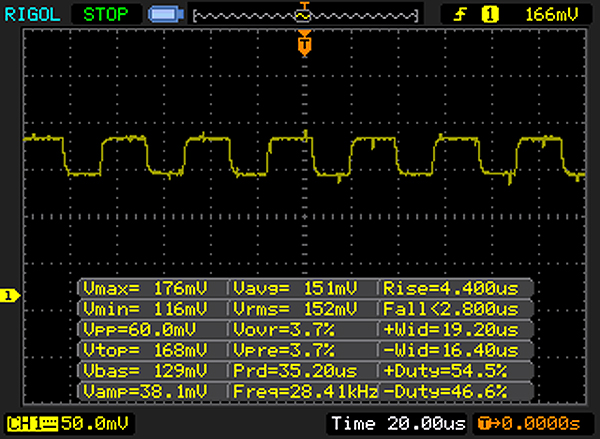 |
Displayens bakgrundsbelysning flimrar vid 28410 Hz (i värsta fall, t.ex. med PWM) Flimrande upptäckt vid en ljusstyrkeinställning på 90 % och lägre. Det ska inte finnas något flimmer eller PWM över denna ljusstyrkeinställning. Frekvensen för 28410 Hz är ganska hög, så de flesta användare som är känsliga för PWM bör inte märka något flimmer. Som jämförelse: 52 % av alla testade enheter använder inte PWM för att dämpa skärmen. Om PWM upptäcktes mättes ett medelvärde av 7754 (minst: 5 - maximum: 343500) Hz. | |||
| Cinebench R15 | |
| CPU Single 64Bit | |
| Asus VivoBook S15 S510UA | |
| Dell Vostro 15 3568 | |
| Lenovo ThinkPad E570-20H6S02M00 | |
| Acer Aspire 3 A315-51-55E4 | |
| CPU Multi 64Bit | |
| Asus VivoBook S15 S510UA | |
| Dell Vostro 15 3568 | |
| Acer Aspire 3 A315-51-55E4 | |
| Lenovo ThinkPad E570-20H6S02M00 | |
| PCMark 8 | |
| Home Score Accelerated v2 | |
| Asus VivoBook S15 S510UA | |
| Lenovo ThinkPad E570-20H6S02M00 | |
| Dell Vostro 15 3568 | |
| Acer Aspire 3 A315-51-55E4 | |
| Work Score Accelerated v2 | |
| Lenovo ThinkPad E570-20H6S02M00 | |
| Asus VivoBook S15 S510UA | |
| Dell Vostro 15 3568 | |
| Acer Aspire 3 A315-51-55E4 | |
| PCMark 8 Home Score Accelerated v2 | 3417 poäng | |
| PCMark 8 Work Score Accelerated v2 | 4544 poäng | |
Hjälp | ||
| Dell Vostro 15 3568 Micron 1100 MTFDDAV256TBN | Acer Aspire 3 A315-51-55E4 Micron 1100 MTFDDAV256TBN | Lenovo ThinkPad E570-20H6S02M00 Samsung PM961 MZVLW256HEHP | Asus VivoBook S15 S510UA Toshiba HG6 THNSNJ128G8NY | |
|---|---|---|---|---|
| CrystalDiskMark 3.0 | 53% | 237% | 21% | |
| Read Seq (MB/s) | 469.3 | 485.8 4% | 1589 239% | 503 7% |
| Write Seq (MB/s) | 179.7 | 456.1 154% | 1217 577% | 396 120% |
| Read 512 (MB/s) | 359.6 | 328 -9% | 1155 221% | 417.7 16% |
| Write 512 (MB/s) | 183.7 | 446.8 143% | 783 326% | 342 86% |
| Read 4k (MB/s) | 26.01 | 26.95 4% | 59.7 130% | 19.48 -25% |
| Write 4k (MB/s) | 68.7 | 86.7 26% | 148.8 117% | 64.6 -6% |
| Read 4k QD32 (MB/s) | 242.4 | 245.9 1% | 473.6 95% | 250.3 3% |
| Write 4k QD32 (MB/s) | 147.1 | 300.2 104% | 428.7 191% | 94.3 -36% |

| 3DMark 11 - 1280x720 Performance GPU | |
| Asus VivoBook S15 S510UA | |
| Dell Vostro 15 3568 | |
| Lenovo ThinkPad E570-20H6S02M00 | |
| Acer Aspire 3 A315-51-55E4 | |
| 3DMark | |
| 1280x720 Cloud Gate Standard Graphics | |
| Asus VivoBook S15 S510UA | |
| Lenovo ThinkPad E570-20H6S02M00 | |
| Dell Vostro 15 3568 | |
| Acer Aspire 3 A315-51-55E4 | |
| 1920x1080 Fire Strike Graphics | |
| Asus VivoBook S15 S510UA | |
| Lenovo ThinkPad E570-20H6S02M00 | |
| Acer Aspire 3 A315-51-55E4 | |
| 3DMark 11 Performance | 1532 poäng | |
| 3DMark Cloud Gate Standard Score | 5611 poäng | |
Hjälp | ||
| låg | med. | hög | ultra | |
|---|---|---|---|---|
| The Witcher 3 (2015) | 13.3 | |||
| Rise of the Tomb Raider (2016) | 13.1 | |||
| Farming Simulator 17 (2016) | 42.7 | 16.6 |
Ljudnivå
| Låg belastning |
| 30.2 / 30.2 / 30.2 dB(A) |
| DVD |
| 35.2 / dB(A) |
| Hög belastning |
| 36.4 / 36.5 dB(A) |
 | ||
30 dB tyst 40 dB(A) hörbar 50 dB(A) högt ljud |
||
min: | ||
(+) Den maximala temperaturen på ovansidan är 35.6 °C / 96 F, jämfört med genomsnittet av 34.3 °C / 94 F , allt från 21.2 till 62.5 °C för klassen Office.
(+) Botten värms upp till maximalt 35.3 °C / 96 F, jämfört med genomsnittet av 36.8 °C / 98 F
(+) Vid tomgångsbruk är medeltemperaturen för ovansidan 24.1 °C / 75 F, jämfört med enhetsgenomsnittet på 29.5 °C / ### class_avg_f### F.
(+) Handledsstöden och pekplattan är kallare än hudtemperaturen med maximalt 30.2 °C / 86.4 F och är därför svala att ta på.
(-) Medeltemperaturen för handledsstödsområdet på liknande enheter var 27.5 °C / 81.5 F (-2.7 °C / -4.9 F).
Dell Vostro 15 3568 ljudanalys
(-) | inte särskilt höga högtalare (71.1 dB)
Bas 100 - 315 Hz
(-) | nästan ingen bas - i genomsnitt 18.4% lägre än medianen
(±) | linjäriteten för basen är genomsnittlig (11% delta till föregående frekvens)
Mellan 400 - 2000 Hz
(±) | högre mellan - i genomsnitt 5.9% högre än median
(+) | mids är linjära (6.9% delta till föregående frekvens)
Högsta 2 - 16 kHz
(+) | balanserade toppar - endast 2% från medianen
(+) | toppar är linjära (5.8% delta till föregående frekvens)
Totalt 100 - 16 000 Hz
(±) | linjäriteten för det totala ljudet är genomsnittlig (20.5% skillnad mot median)
Jämfört med samma klass
» 46% av alla testade enheter i den här klassen var bättre, 10% liknande, 44% sämre
» Den bästa hade ett delta på 7%, genomsnittet var 21%, sämst var 53%
Jämfört med alla testade enheter
» 54% av alla testade enheter var bättre, 8% liknande, 38% sämre
» Den bästa hade ett delta på 4%, genomsnittet var 23%, sämst var 134%
Acer Aspire 3 A315-51-55E4 ljudanalys
(±) | högtalarljudstyrkan är genomsnittlig men bra (72 dB)
Bas 100 - 315 Hz
(-) | nästan ingen bas - i genomsnitt 23.3% lägre än medianen
(±) | linjäriteten för basen är genomsnittlig (9.3% delta till föregående frekvens)
Mellan 400 - 2000 Hz
(±) | högre mellan - i genomsnitt 7.4% högre än median
(±) | linjäriteten för mids är genomsnittlig (13.3% delta till föregående frekvens)
Högsta 2 - 16 kHz
(+) | balanserade toppar - endast 3.6% från medianen
(±) | linjäriteten för toppar är genomsnittlig (7.5% delta till föregående frekvens)
Totalt 100 - 16 000 Hz
(±) | linjäriteten för det totala ljudet är genomsnittlig (27.9% skillnad mot median)
Jämfört med samma klass
» 87% av alla testade enheter i den här klassen var bättre, 3% liknande, 10% sämre
» Den bästa hade ett delta på 7%, genomsnittet var 21%, sämst var 53%
Jämfört med alla testade enheter
» 85% av alla testade enheter var bättre, 3% liknande, 12% sämre
» Den bästa hade ett delta på 4%, genomsnittet var 23%, sämst var 134%
Lenovo ThinkPad E570-20H6S02M00 ljudanalys
(-) | inte särskilt höga högtalare (71.4 dB)
Bas 100 - 315 Hz
(-) | nästan ingen bas - i genomsnitt 17.1% lägre än medianen
(±) | linjäriteten för basen är genomsnittlig (10.9% delta till föregående frekvens)
Mellan 400 - 2000 Hz
(+) | balanserad mellan - endast 3.9% från medianen
(±) | linjäriteten för mids är genomsnittlig (8.2% delta till föregående frekvens)
Högsta 2 - 16 kHz
(+) | balanserade toppar - endast 3.4% från medianen
(±) | linjäriteten för toppar är genomsnittlig (7% delta till föregående frekvens)
Totalt 100 - 16 000 Hz
(±) | linjäriteten för det totala ljudet är genomsnittlig (20.3% skillnad mot median)
Jämfört med samma klass
» 45% av alla testade enheter i den här klassen var bättre, 10% liknande, 45% sämre
» Den bästa hade ett delta på 7%, genomsnittet var 21%, sämst var 53%
Jämfört med alla testade enheter
» 53% av alla testade enheter var bättre, 8% liknande, 39% sämre
» Den bästa hade ett delta på 4%, genomsnittet var 23%, sämst var 134%
Asus VivoBook S15 S510UA ljudanalys
(-) | inte särskilt höga högtalare (66.4 dB)
Bas 100 - 315 Hz
(-) | nästan ingen bas - i genomsnitt 15.3% lägre än medianen
(±) | linjäriteten för basen är genomsnittlig (12.2% delta till föregående frekvens)
Mellan 400 - 2000 Hz
(+) | balanserad mellan - endast 1.6% från medianen
(+) | mids är linjära (6.8% delta till föregående frekvens)
Högsta 2 - 16 kHz
(+) | balanserade toppar - endast 3.8% från medianen
(±) | linjäriteten för toppar är genomsnittlig (10.6% delta till föregående frekvens)
Totalt 100 - 16 000 Hz
(±) | linjäriteten för det totala ljudet är genomsnittlig (19.8% skillnad mot median)
Jämfört med samma klass
» 65% av alla testade enheter i den här klassen var bättre, 6% liknande, 28% sämre
» Den bästa hade ett delta på 5%, genomsnittet var 17%, sämst var 45%
Jämfört med alla testade enheter
» 51% av alla testade enheter var bättre, 7% liknande, 42% sämre
» Den bästa hade ett delta på 4%, genomsnittet var 23%, sämst var 134%
| Av/Standby | |
| Låg belastning | |
| Hög belastning |
|
Förklaring:
min: | |
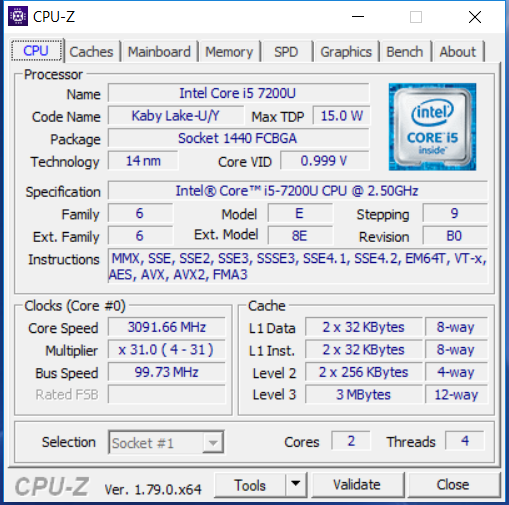
| Dell Vostro 15 3568 i5-7200U, HD Graphics 620, Micron 1100 MTFDDAV256TBN, TN LED, 1920x1080, 15.6" | Acer Aspire 3 A315-51-55E4 i5-7200U, HD Graphics 620, Micron 1100 MTFDDAV256TBN, TN LED, 1920x1080, 15.6" | Lenovo ThinkPad E570-20H6S02M00 i5-7200U, HD Graphics 620, Samsung PM961 MZVLW256HEHP, TN LED, 1366x768, 15.6" | Asus VivoBook S15 S510UA i5-7200U, HD Graphics 620, Toshiba HG6 THNSNJ128G8NY, IPS, 1920x1080, 15.6" | |
|---|---|---|---|---|
| Power Consumption | -27% | -6% | -38% | |
| Idle Minimum * (Watt) | 3 | 4.1 -37% | 2.9 3% | 4.6 -53% |
| Idle Average * (Watt) | 5.5 | 7.5 -36% | 5.8 -5% | 7.6 -38% |
| Idle Maximum * (Watt) | 5.7 | 8.9 -56% | 6.6 -16% | 7.7 -35% |
| Load Average * (Watt) | 27 | 28.1 -4% | 29 -7% | 35.1 -30% |
| Load Maximum * (Watt) | 27.4 | 28.3 -3% | 29.4 -7% | 36.2 -32% |
* ... mindre är bättre
| Dell Vostro 15 3568 i5-7200U, HD Graphics 620, 40 Wh | Acer Aspire 3 A315-51-55E4 i5-7200U, HD Graphics 620, 37 Wh | Lenovo ThinkPad E570-20H6S02M00 i5-7200U, HD Graphics 620, 42 Wh | Asus VivoBook S15 S510UA i5-7200U, HD Graphics 620, 42 Wh | |
|---|---|---|---|---|
| Batteridrifttid | -11% | 9% | -32% | |
| Reader / Idle (h) | 14.6 | 14.3 -2% | 18.1 24% | 10.2 -30% |
| WiFi v1.3 (h) | 6.3 | 5.8 -8% | 7.2 14% | 4.3 -32% |
| Load (h) | 1.8 | 1.4 -22% | 1.6 -11% | 1.2 -33% |
| H.264 (h) | 6.5 |
För
Emot
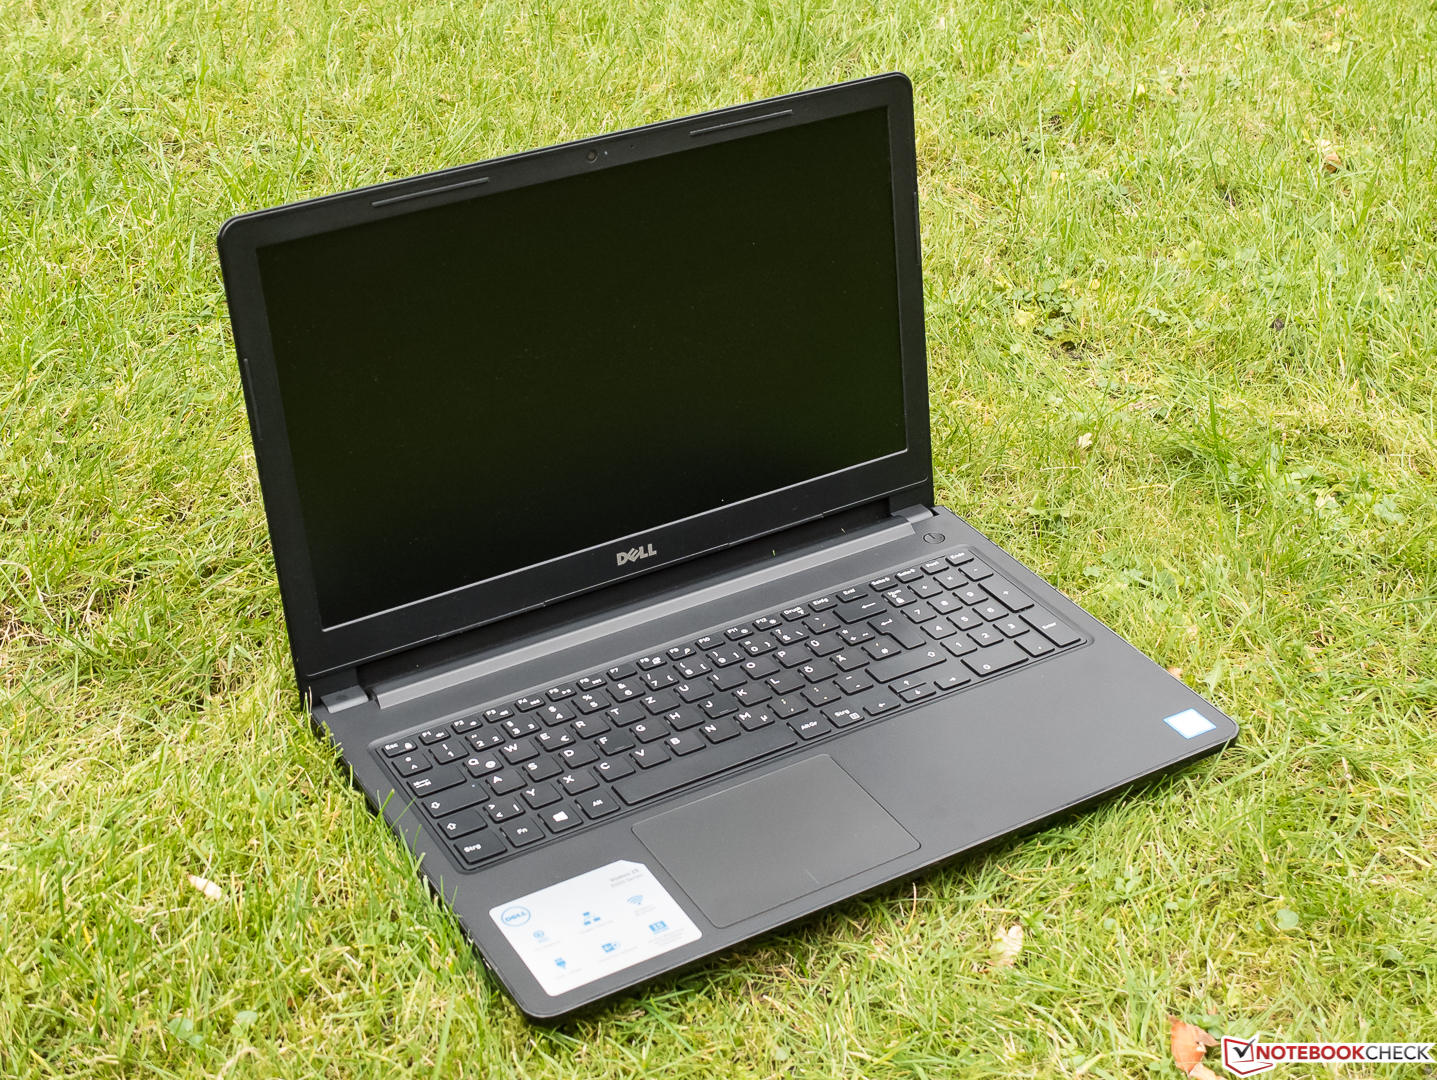
Den riktigt risiga skärmen med en extrem blå ton redan vid leverans, vars like vi aldrig sett innan, är den enda komponenten hos den nya Dell Vostro 15 3568 som vi kan hålla mot tillverkaren, trots det väldigt låga priset för denna instegs-konfiguration. Den bästa delen av skärmen är dess riktigt matta yta.
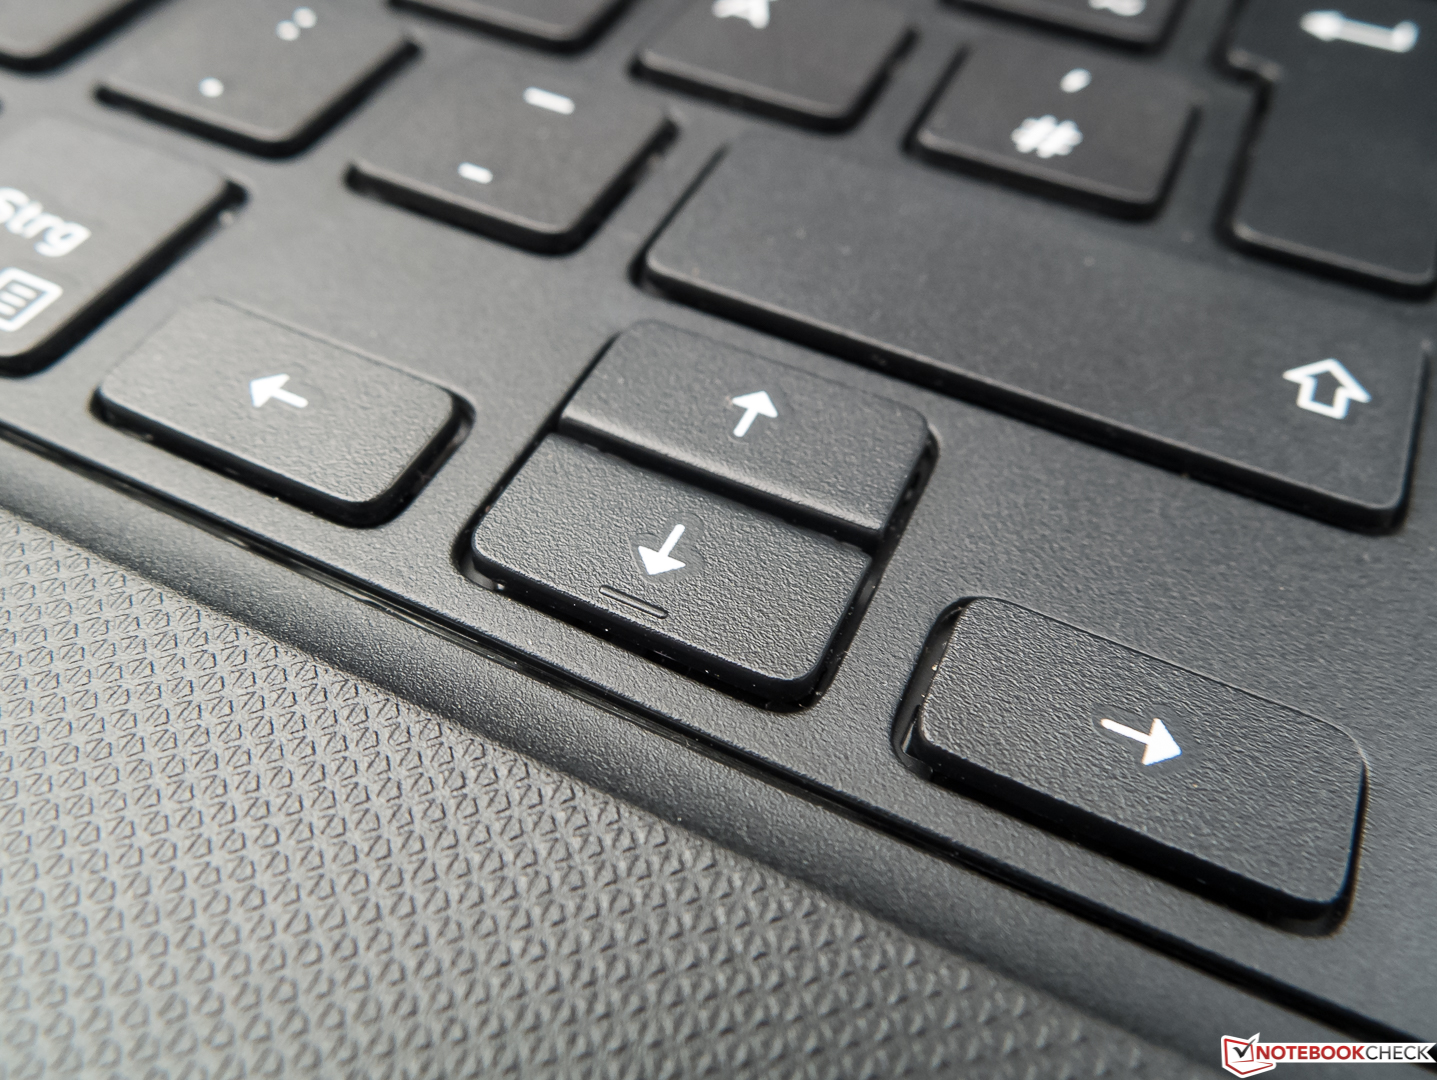
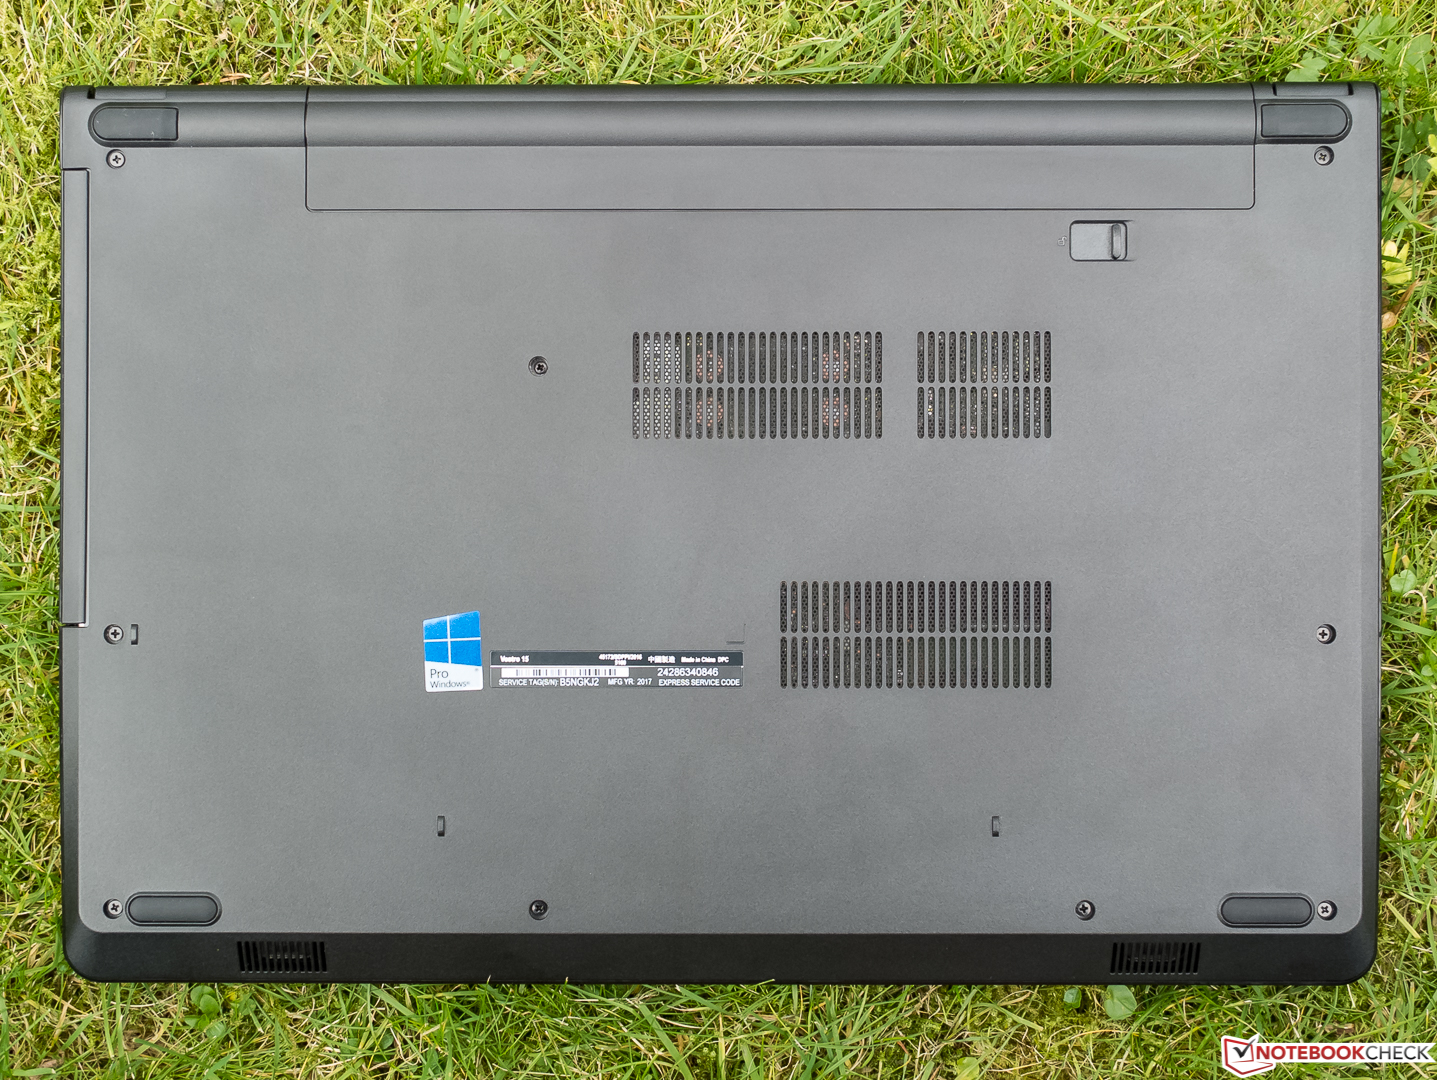
Om du kan ignorera skärmen (som förvånansvärt många användare gör) så får du en enkel företagslaptop med begränsad mobilitet som hanterar sina uppgifter på ett lämpligt sätt. Batteriet kan lätt bytas ut, en TPM-modul för säkerhet är inbyggd och Windows 10 Pro leder vägen mot hårddisk-kryptering och utökade administrativa möjligheter i företagsnätverk. På den positiva sidan borde vi också nämna dom hyfsade inmatningsenheterna och den svala och vanligtvis tysta driften.
Höjdpunkterna för vår version av Dell Vostro 15 3568, som i mångt och mycket är lyckad, är dess 256 GB SSD och W10 Pro, som kan kompensera för den dåliga skärmen i en del användares ögon.
En SSD och Pro-versionen av Windows 10 är bara tillgängliga mot en extra kostand, vilket tar priset närmare testets motståndare. Den som väljer minimi-varianten kommer fortfarande ha tillräckligt med prestanda för kontoret. Men på grund av skärmen kan vi trots allt inte rekommendera ett köp.
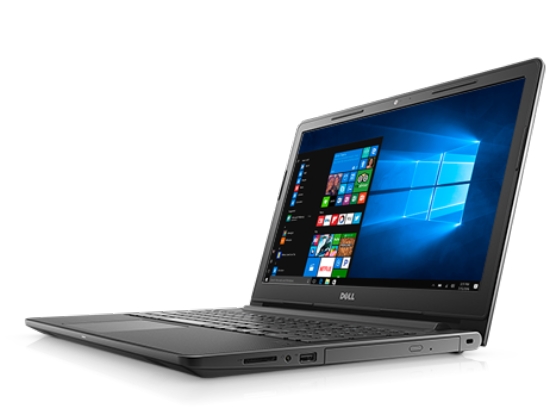
Dell Vostro 15 3568
- 12/12/2017 v6 (old)
Sven Kloevekorn