Test: HP ZBook Studio x360 G5 (i7, P1000, FHD) Arbetsstation (Sammanfattning)


| SD Card Reader | |
| average JPG Copy Test (av. of 3 runs) | |
| Lenovo ThinkPad P1-20MD002LUS (Toshiba Exceria Pro SDXC 64 GB UHS-II) | |
| HP ZBook Studio x360 G5-4QH13EA (Toshiba Exceria Pro SDXC 64 GB UHS-II) | |
| Dell Precision 5530 Xeon E-2176M (Toshiba Exceria Pro SDXC 64 GB UHS-II) | |
| Genomsnitt av klass Workstation (49.6 - 681, n=14, senaste 2 åren) | |
| Dell Precision 5530 2-in-1 (Toshiba Exceria Pro M501 UHS-II) | |
| maximum AS SSD Seq Read Test (1GB) | |
| Lenovo ThinkPad P1-20MD002LUS (Toshiba Exceria Pro SDXC 64 GB UHS-II) | |
| Genomsnitt av klass Workstation (87.6 - 1455, n=14, senaste 2 åren) | |
| Dell Precision 5530 2-in-1 (Toshiba Exceria Pro M501 UHS-II) | |
| Dell Precision 5530 Xeon E-2176M (Toshiba Exceria Pro SDXC 64 GB UHS-II) | |
| HP ZBook Studio x360 G5-4QH13EA (Toshiba Exceria Pro SDXC 64 GB UHS-II) | |
| |||||||||||||||||||||||||
Distribution av ljusstyrkan: 85 %
Mitt på batteriet: 386 cd/m²
Kontrast: 1121:1 (Svärta: 0.34 cd/m²)
ΔE ColorChecker Calman: 1.8 | ∀{0.5-29.43 Ø4.73}
calibrated: 1
ΔE Greyscale Calman: 1.8 | ∀{0.09-98 Ø4.97}
97.7% sRGB (Argyll 1.6.3 3D)
62.5% AdobeRGB 1998 (Argyll 1.6.3 3D)
67.6% AdobeRGB 1998 (Argyll 3D)
98% sRGB (Argyll 3D)
66.5% Display P3 (Argyll 3D)
Gamma: 2.25
CCT: 6735 K
| HP ZBook Studio x360 G5-4QH13EA LGD05A9, , 1920x1080, 15.6" | Dell Precision 5530 Xeon E-2176M Sharp SHP148D / LQ156D1, , 3840x2160, 15.6" | Dell Precision 5530 2-in-1 Sharp SHP148D, , 3840x2160, 15.6" | Lenovo ThinkPad P1-20MD002LUS B156ZAN03.2, , 3840x2160, 15.6" | HP ZBook Studio G5-4QH10EA AUO30EB, , 3840x2160, 15.6" | Apple MacBook Pro 15 2018 (2.6 GHz, 560X) APPA040, , 2880x1800, 15.4" | |
|---|---|---|---|---|---|---|
| Display | 9% | 29% | 26% | 1% | 26% | |
| Display P3 Coverage (%) | 66.5 | 76.5 15% | 91.2 37% | 86.4 30% | 68.2 3% | 98.7 48% |
| sRGB Coverage (%) | 98 | 98.4 0% | 99.9 2% | 99.9 2% | 96.2 -2% | 99.9 2% |
| AdobeRGB 1998 Coverage (%) | 67.6 | 76.4 13% | 99.4 47% | 99.1 47% | 68.8 2% | 86.6 28% |
| Response Times | -18% | -27% | -22% | -32% | -8% | |
| Response Time Grey 50% / Grey 80% * (ms) | 41.6 ? | 48 ? -15% | 49.6 ? -19% | 55.6 ? -34% | 60.8 ? -46% | 43.2 ? -4% |
| Response Time Black / White * (ms) | 28 ? | 33.6 ? -20% | 37.6 ? -34% | 30.8 ? -10% | 32.8 ? -17% | 31.2 ? -11% |
| PWM Frequency (Hz) | 1000 | 990 ? | 117000 ? | |||
| Screen | -39% | -35% | -62% | -36% | 24% | |
| Brightness middle (cd/m²) | 381 | 451.7 19% | 430.9 13% | 397.6 4% | 417 9% | 520 36% |
| Brightness (cd/m²) | 362 | 440 22% | 398 10% | 396 9% | 412 14% | 492 36% |
| Brightness Distribution (%) | 85 | 90 6% | 79 -7% | 85 0% | 85 0% | 88 4% |
| Black Level * (cd/m²) | 0.34 | 0.4 -18% | 0.35 -3% | 0.25 26% | 0.29 15% | 0.39 -15% |
| Contrast (:1) | 1121 | 1129 1% | 1231 10% | 1590 42% | 1438 28% | 1333 19% |
| Colorchecker dE 2000 * | 1.8 | 3.11 -73% | 3.29 -83% | 4.95 -175% | 4.4 -144% | 1.2 33% |
| Colorchecker dE 2000 max. * | 4.6 | 8.62 -87% | 7.46 -62% | 10.23 -122% | 6.7 -46% | 2.3 50% |
| Colorchecker dE 2000 calibrated * | 1 | 3.07 -207% | 3.58 -258% | 4.22 -322% | 1.9 -90% | |
| Greyscale dE 2000 * | 1.8 | 3.7 -106% | 2.6 -44% | 5.1 -183% | 5 -178% | 1.3 28% |
| Gamma | 2.25 98% | 2.11 104% | 2.19 100% | 2.234 98% | 2.28 96% | 2.18 101% |
| CCT | 6735 97% | 6492 100% | 6870 95% | 7543 86% | 7575 86% | 6738 96% |
| Color Space (Percent of AdobeRGB 1998) (%) | 62.5 | 69 10% | 87.2 40% | 87.6 40% | 62.3 0% | |
| Color Space (Percent of sRGB) (%) | 97.7 | 98 0% | 100 2% | 100 2% | 96 -2% | |
| Totalt genomsnitt (program/inställningar) | -16% /
-28% | -11% /
-22% | -19% /
-40% | -22% /
-28% | 14% /
20% |
* ... mindre är bättre
Visa svarstider
| ↔ Svarstid svart till vitt | ||
|---|---|---|
| 28 ms ... stiga ↗ och falla ↘ kombinerat | ↗ 16.4 ms stiga | 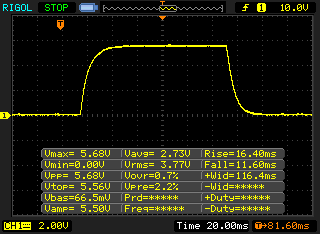 |
| ↘ 11.6 ms hösten | ||
| Skärmen visar relativt långsamma svarsfrekvenser i våra tester och kan vara för långsam för spelare. I jämförelse sträcker sig alla testade enheter från 0.1 (minst) till 240 (maximalt) ms. » 71 % av alla enheter är bättre. Detta innebär att den uppmätta svarstiden är sämre än genomsnittet av alla testade enheter (19.9 ms). | ||
| ↔ Svarstid 50 % grått till 80 % grått | ||
| 41.6 ms ... stiga ↗ och falla ↘ kombinerat | ↗ 22 ms stiga | 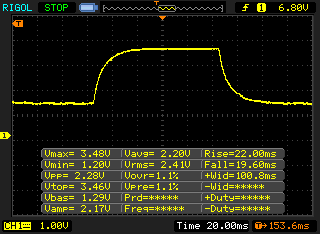 |
| ↘ 19.6 ms hösten | ||
| Skärmen visar långsamma svarsfrekvenser i våra tester och kommer att vara otillfredsställande för spelare. I jämförelse sträcker sig alla testade enheter från 0.165 (minst) till 636 (maximalt) ms. » 67 % av alla enheter är bättre. Detta innebär att den uppmätta svarstiden är sämre än genomsnittet av alla testade enheter (31.1 ms). | ||
Skärmflimmer / PWM (Puls-Width Modulation)
| Skärmflimmer / PWM upptäcktes inte | 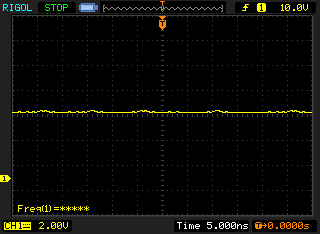 | ||
Som jämförelse: 52 % av alla testade enheter använder inte PWM för att dämpa skärmen. Om PWM upptäcktes mättes ett medelvärde av 7798 (minst: 5 - maximum: 343500) Hz. | |||
| PCMark 8 Home Score Accelerated v2 | 4244 poäng | |
| PCMark 8 Creative Score Accelerated v2 | 5138 poäng | |
| PCMark 8 Work Score Accelerated v2 | 5335 poäng | |
| PCMark 10 Score | 4735 poäng | |
Hjälp | ||
| HP ZBook Studio x360 G5-4QH13EA Samsung SSD PM981 MZVLB512HAJQ | Dell Precision 5530 Xeon E-2176M SK hynix PC400 512 GB | Dell Precision 5530 2-in-1 SK Hynix PC401 512GB M.2 (HFS512GD9TNG) | Lenovo ThinkPad P1-20MD002LUS Samsung SSD PM981 MZVLB2T0HMLB | Apple MacBook Pro 15 2018 (2.6 GHz, 560X) Apple SSD AP0512 | Genomsnitt Samsung SSD PM981 MZVLB512HAJQ | |
|---|---|---|---|---|---|---|
| CrystalDiskMark 5.2 / 6 | -1% | -6% | 1% | -21% | 12% | |
| Write 4K (MB/s) | 105.1 | 97.8 -7% | 128.9 23% | 108 3% | 43.59 -59% 35.92 -66% | 126.7 ? 21% |
| Read 4K (MB/s) | 42.66 | 41.21 -3% | 45.7 7% | 37.24 -13% | 12.68 -70% 11.67 -73% | 44 ? 3% |
| Write Seq (MB/s) | 1571 | 1312 -16% | 635 -60% | 1476 -6% | 1605 2% 1522 -3% | 1617 ? 3% |
| Read Seq (MB/s) | 1427 | 1667 17% | 2065 45% | 1367 -4% | 1595 12% 1528 7% | 1716 ? 20% |
| Write 4K Q32T1 (MB/s) | 291.2 | 449.5 54% | 336.6 16% | 302.4 4% | 232.7 -20% 204.5 -30% | 413 ? 42% |
| Read 4K Q32T1 (MB/s) | 369.9 | 327.4 -11% | 393.6 6% | 375 1% | 404 9% 393.3 6% | 420 ? 14% |
| Write Seq Q32T1 (MB/s) | 2024 | 1385 -32% | 662 -67% | 2433 20% | 1770 -13% 1756 -13% | 2076 ? 3% |
| Read Seq Q32T1 (MB/s) | 3392 | 2948 -13% | 2664 -21% | 3493 3% | 2993 -12% 2805 -17% | 3130 ? -8% |

| SiSoft Sandra 2016 | |
| Image Processing | |
| Genomsnitt NVIDIA Quadro P1000 (264 - 269, n=3) | |
| HP ZBook Studio x360 G5-4QH13EA | |
| HP ZBook Studio G5-4QH10EA | |
| GP Cryptography (Higher Security AES256+SHA2-512) | |
| HP ZBook Studio x360 G5-4QH13EA | |
| Genomsnitt NVIDIA Quadro P1000 (10.8 - 11, n=3) | |
| HP ZBook Studio G5-4QH10EA | |
| GP Financial Analysis (FP High/Double Precision) | |
| Genomsnitt NVIDIA Quadro P1000 (23.2 - 23.8, n=3) | |
| HP ZBook Studio G5-4QH10EA | |
| HP ZBook Studio x360 G5-4QH13EA | |
| 3DMark 11 Performance | 6506 poäng | |
| 3DMark Cloud Gate Standard Score | 21290 poäng | |
| 3DMark Fire Strike Score | 4508 poäng | |
Hjälp | ||
| The Witcher 3 - 1920x1080 Ultra Graphics & Postprocessing (HBAO+) | |
| Genomsnitt av klass Workstation (26.3 - 91.7, n=3, senaste 2 åren) | |
| Dell Precision 5530 Xeon E-2176M | |
| Lenovo ThinkPad P1-20MD002LUS | |
| Dell Precision 5530 2-in-1 | |
| HP EliteBook 1050 G1-4QY20EA | |
| HP ZBook Studio x360 G5-4QH13EA | |
| Genomsnitt NVIDIA Quadro P1000 (15.7 - 16.9, n=3) | |
| BioShock Infinite - 1920x1080 Ultra Preset, DX11 (DDOF) | |
| Dell Precision 5530 Xeon E-2176M | |
| Lenovo ThinkPad P1-20MD002LUS | |
| HP EliteBook 1050 G1-4QY20EA | |
| Dell Precision 5530 2-in-1 | |
| HP ZBook Studio x360 G5-4QH13EA | |
| Genomsnitt NVIDIA Quadro P1000 (51 - 51.7, n=3) | |
| låg | med. | hög | ultra | |
|---|---|---|---|---|
| BioShock Infinite (2013) | 276.8 | 155.4 | 133.8 | 51.7 |
| The Witcher 3 (2015) | 89.4 | 52.5 | 26.1 | 16.9 |
| Rainbow Six Siege (2015) | 172.7 | 115.1 | 62.8 | 56.1 |
| Rise of the Tomb Raider (2016) | 88.3 | 55.7 | 29.6 | 24.1 |
| Battlefield 1 (2016) | 135.8 | 80.5 | 38.7 | 35.3 |
| For Honor (2017) | 117.6 | 44.3 | 42 | 33 |
| Ghost Recon Wildlands (2017) | 71.7 | 31.9 | 29.1 | 15.8 |
| Final Fantasy XV Benchmark (2018) | 51.9 | 25.3 | 18.2 | |
| F1 2018 (2018) | 96 | 53 | 41 | 25 |
| FIFA 19 (2018) | 204.6 | 107.8 | 99.9 | 89.5 |
Ljudnivå
| Låg belastning |
| 28.7 / 28.7 / 33.3 dB(A) |
| Hög belastning |
| 38 / 42.3 dB(A) |
 | ||
30 dB tyst 40 dB(A) hörbar 50 dB(A) högt ljud |
||
min: | ||
(±) Den maximala temperaturen på ovansidan är 42 °C / 108 F, jämfört med genomsnittet av 38.2 °C / 101 F , allt från 22.2 till 69.8 °C för klassen Workstation.
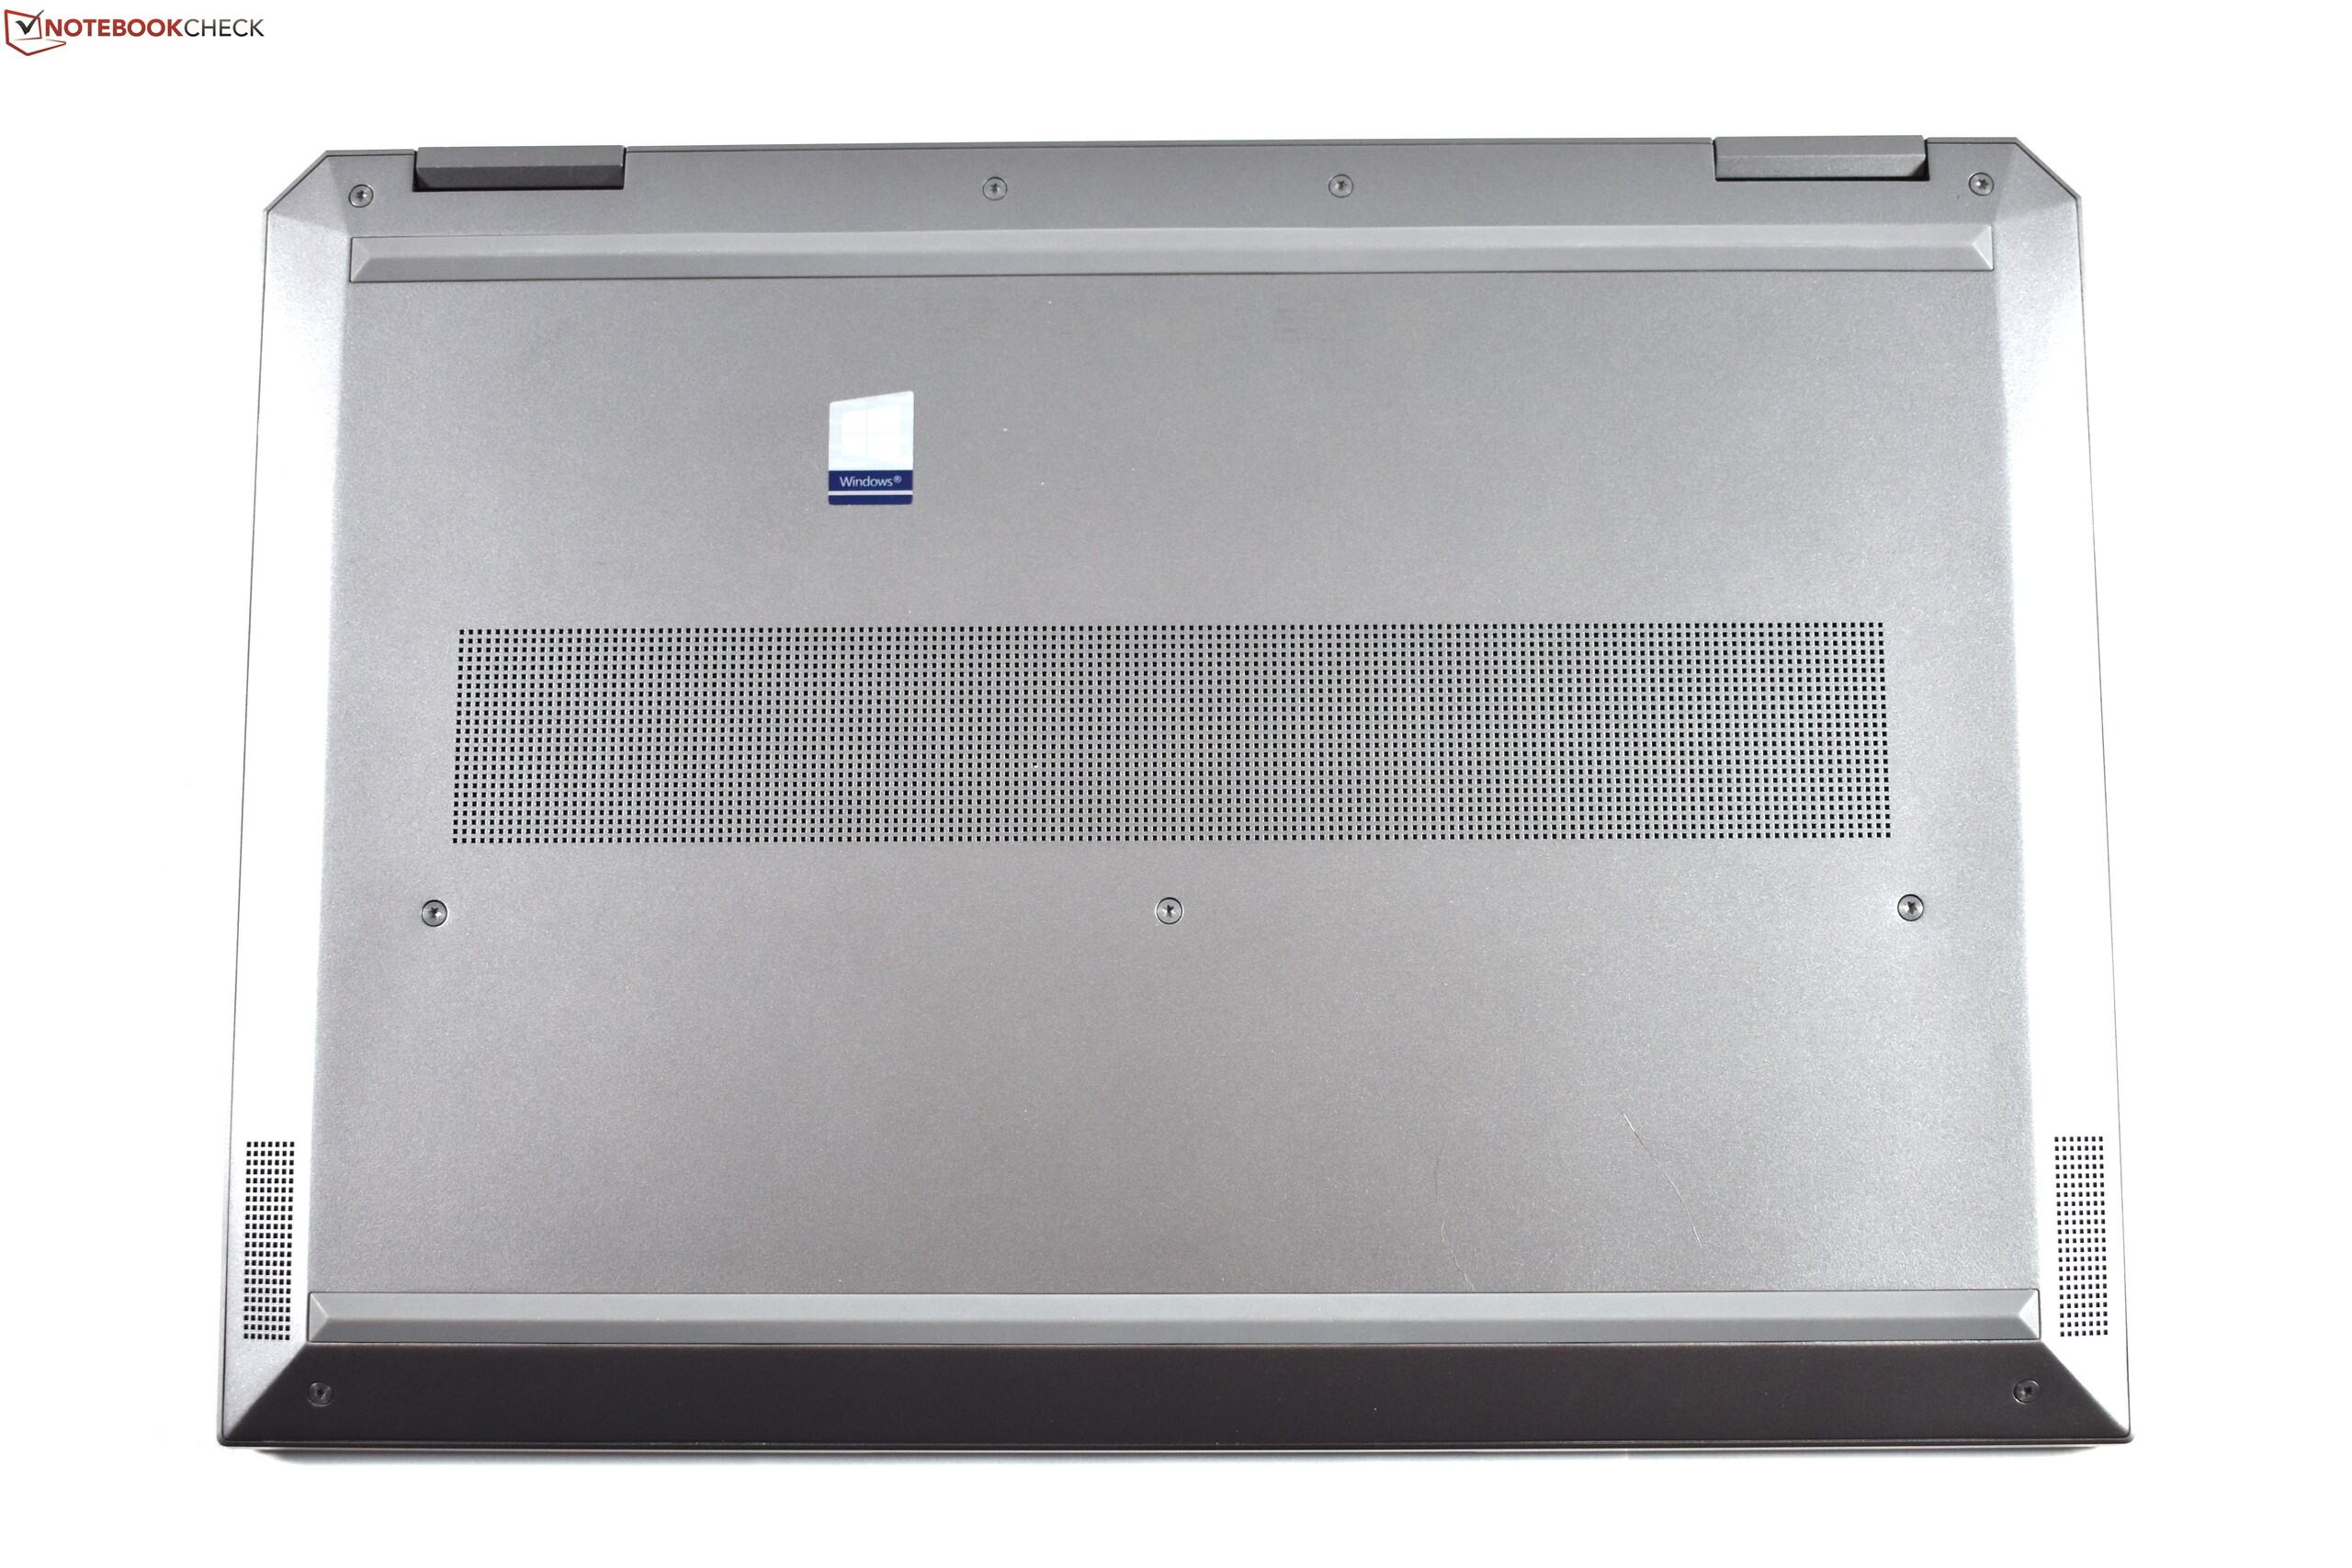
(±) Botten värms upp till maximalt 44.7 °C / 112 F, jämfört med genomsnittet av 41.1 °C / 106 F
(+) Vid tomgångsbruk är medeltemperaturen för ovansidan 24.4 °C / 76 F, jämfört med enhetsgenomsnittet på 32 °C / ### class_avg_f### F.
(±) När du spelar The Witcher 3 är medeltemperaturen för ovansidan 34.7 °C / 94 F, jämfört med enhetsgenomsnittet på 32 °C / ## #class_avg_f### F.
(+) Handledsstöden och pekplattan är kallare än hudtemperaturen med maximalt 29.4 °C / 84.9 F och är därför svala att ta på.
(±) Medeltemperaturen för handledsstödsområdet på liknande enheter var 27.8 °C / 82 F (-1.6 °C / -2.9 F).
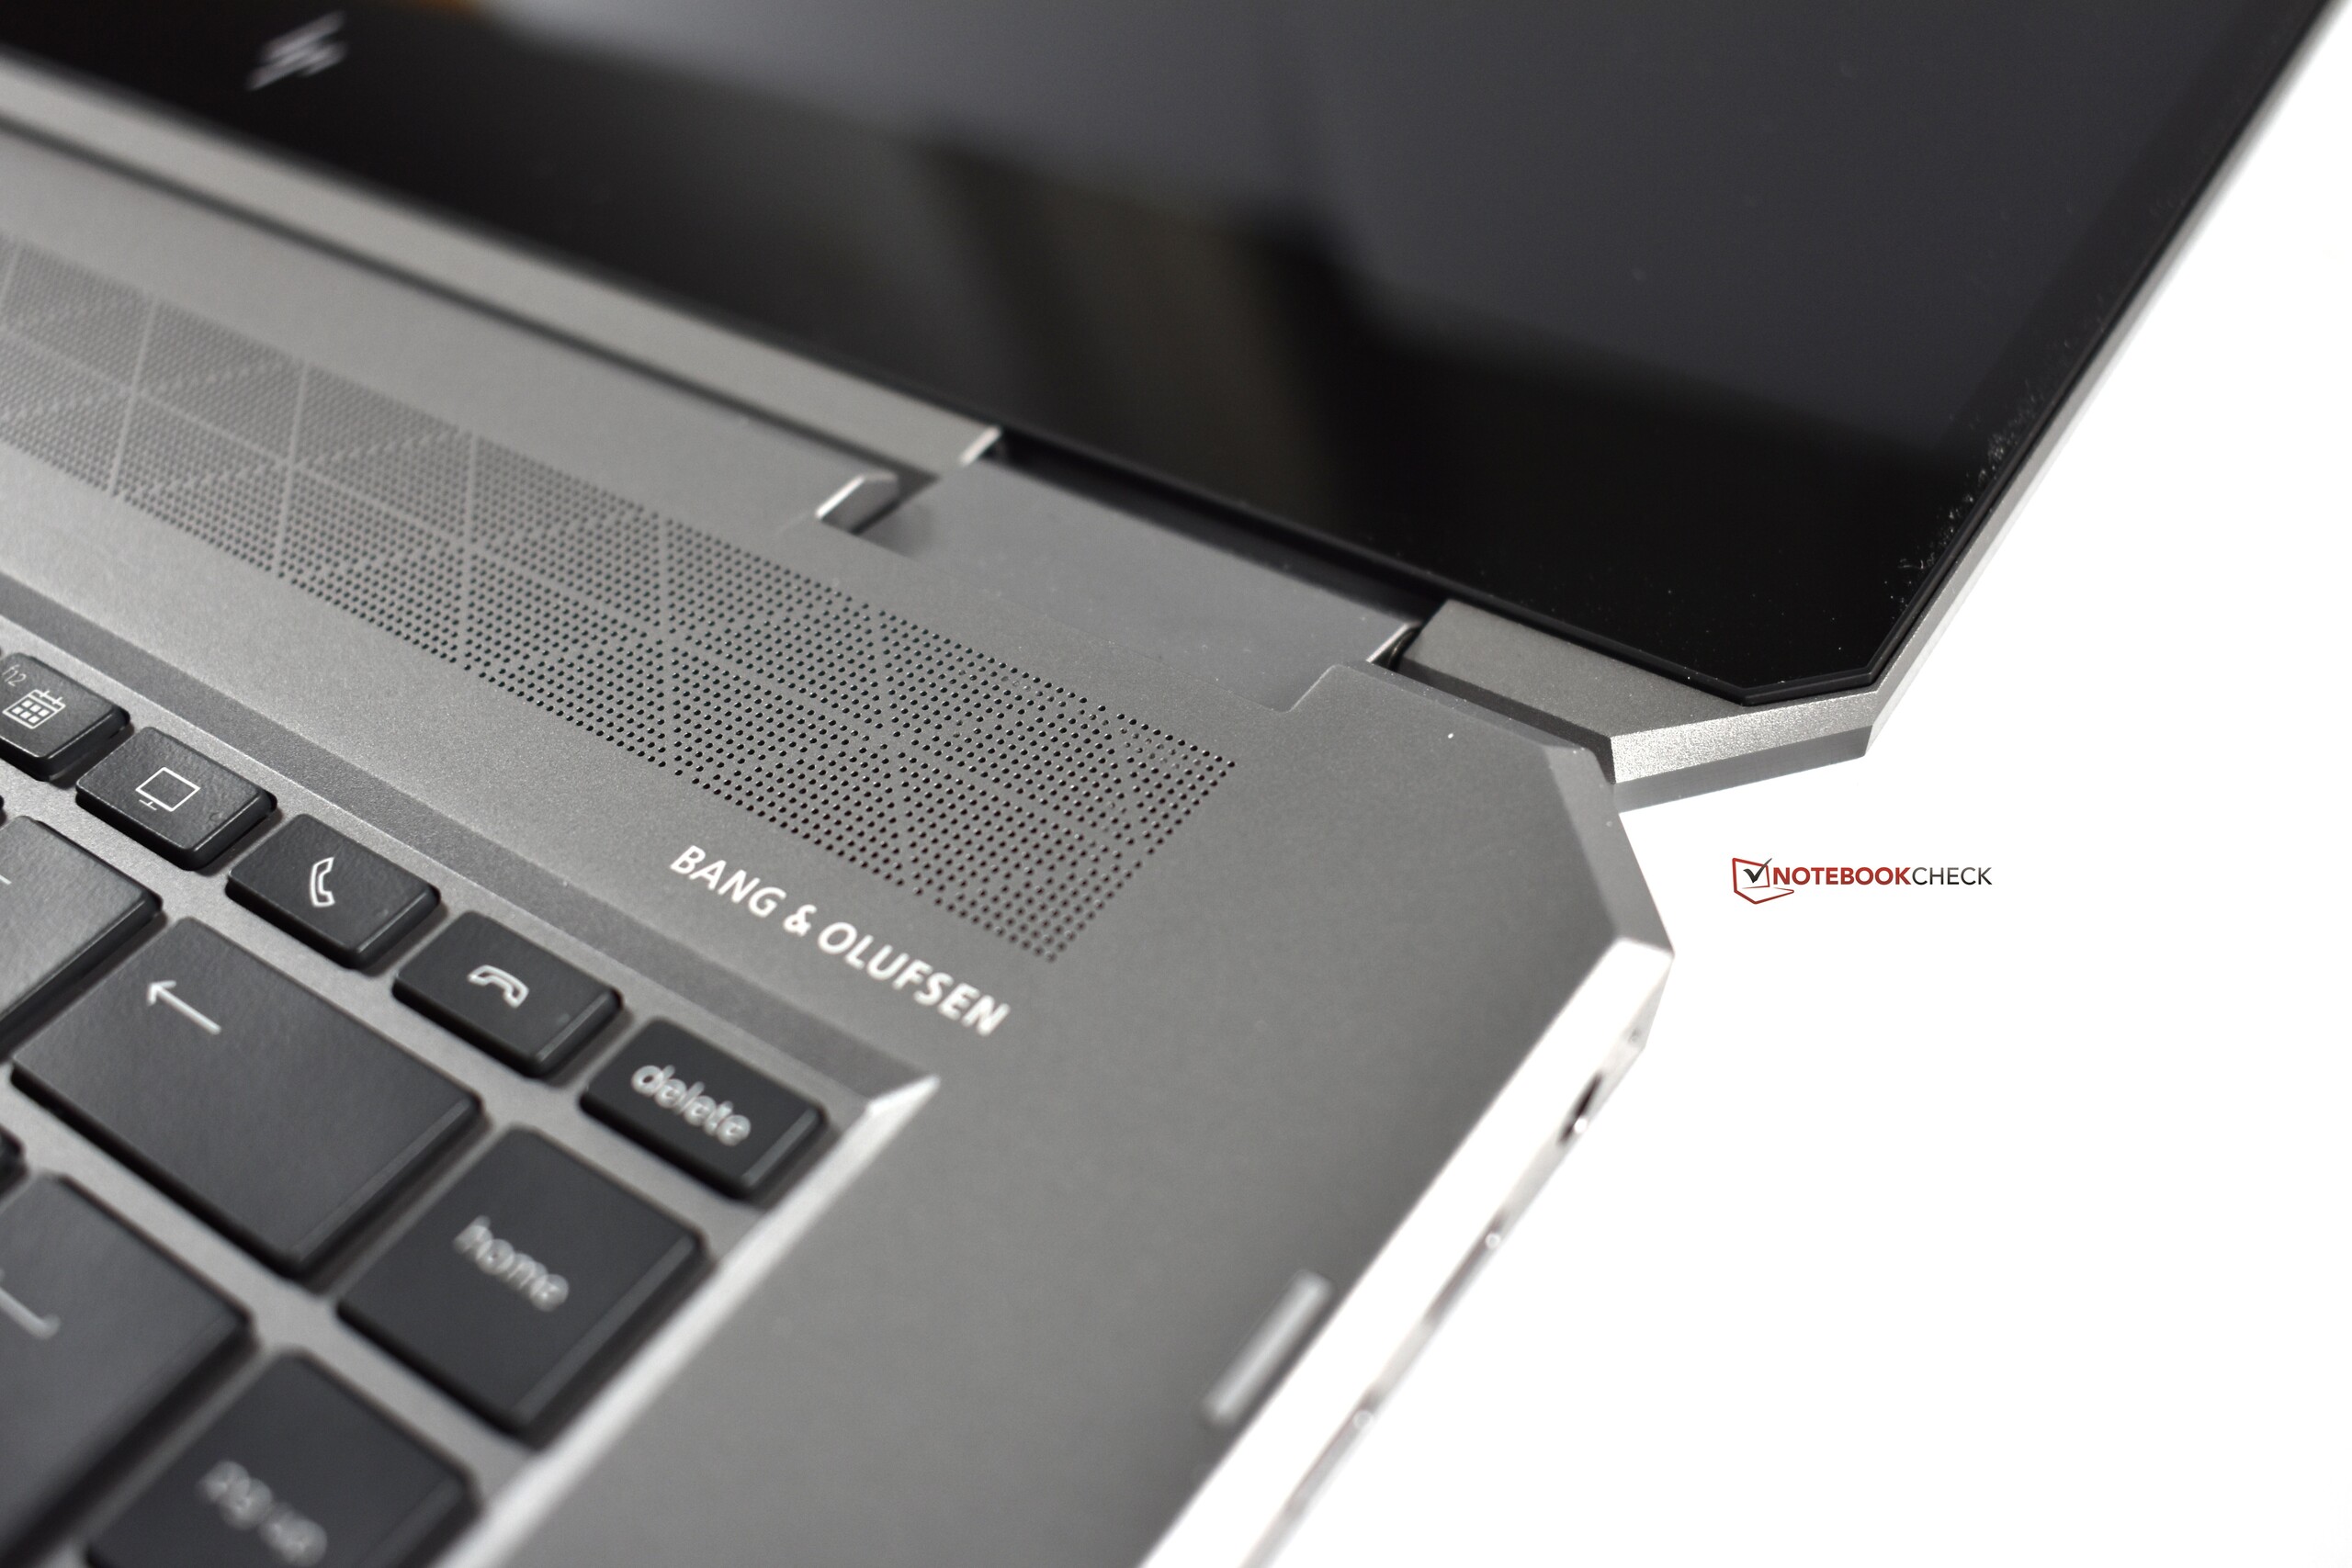
HP ZBook Studio x360 G5-4QH13EA ljudanalys
(±) | högtalarljudstyrkan är genomsnittlig men bra (75.5 dB)
Bas 100 - 315 Hz
(±) | reducerad bas - i genomsnitt 9.8% lägre än medianen
(±) | linjäriteten för basen är genomsnittlig (8.2% delta till föregående frekvens)
Mellan 400 - 2000 Hz
(±) | högre mellan - i genomsnitt 5.1% högre än median
(+) | mids är linjära (5.7% delta till föregående frekvens)
Högsta 2 - 16 kHz
(+) | balanserade toppar - endast 4.1% från medianen
(+) | toppar är linjära (5.9% delta till föregående frekvens)
Totalt 100 - 16 000 Hz
(±) | linjäriteten för det totala ljudet är genomsnittlig (17.4% skillnad mot median)
Jämfört med samma klass
» 53% av alla testade enheter i den här klassen var bättre, 10% liknande, 37% sämre
» Den bästa hade ett delta på 7%, genomsnittet var 17%, sämst var 35%
Jämfört med alla testade enheter
» 33% av alla testade enheter var bättre, 8% liknande, 59% sämre
» Den bästa hade ett delta på 4%, genomsnittet var 24%, sämst var 134%
Dell Precision 5530 2-in-1 ljudanalys
(±) | högtalarljudstyrkan är genomsnittlig men bra (72.5 dB)
Bas 100 - 315 Hz
(±) | reducerad bas - i genomsnitt 9.6% lägre än medianen
(±) | linjäriteten för basen är genomsnittlig (13% delta till föregående frekvens)
Mellan 400 - 2000 Hz
(+) | balanserad mellan - endast 3.2% från medianen
(+) | mids är linjära (6.9% delta till föregående frekvens)
Högsta 2 - 16 kHz
(+) | balanserade toppar - endast 2.8% från medianen
(±) | linjäriteten för toppar är genomsnittlig (9.7% delta till föregående frekvens)
Totalt 100 - 16 000 Hz
(+) | det totala ljudet är linjärt (13.9% skillnad mot median)
Jämfört med samma klass
» 28% av alla testade enheter i den här klassen var bättre, 4% liknande, 67% sämre
» Den bästa hade ett delta på 7%, genomsnittet var 17%, sämst var 35%
Jämfört med alla testade enheter
» 16% av alla testade enheter var bättre, 4% liknande, 80% sämre
» Den bästa hade ett delta på 4%, genomsnittet var 24%, sämst var 134%
| Av/Standby | |
| Låg belastning | |
| Hög belastning |
|
Förklaring:
min: | |
| HP ZBook Studio x360 G5-4QH13EA i7-8750H, Quadro P1000, Samsung SSD PM981 MZVLB512HAJQ, IPS LED, 1920x1080, 15.6" | Dell Precision 5530 Xeon E-2176M E-2176M, Quadro P2000, SK hynix PC400 512 GB, IGZO, 3840x2160, 15.6" | Dell Precision 5530 2-in-1 i7-8706G, WX Vega M GL, SK Hynix PC401 512GB M.2 (HFS512GD9TNG), IPS, 3840x2160, 15.6" | Lenovo ThinkPad P1-20MD002LUS E-2176M, Quadro P2000 Max-Q, Samsung SSD PM981 MZVLB2T0HMLB, IPS, 3840x2160, 15.6" | Apple MacBook Pro 15 2018 (2.6 GHz, 560X) i7-8850H, Radeon Pro 560X, Apple SSD AP0512, IPS, 2880x1800, 15.4" | Genomsnitt NVIDIA Quadro P1000 | Genomsnitt av klass Workstation | |
|---|---|---|---|---|---|---|---|
| Power Consumption | -45% | -18% | -23% | 3% | -4% | -50% | |
| Idle Minimum * (Watt) | 4.44 | 9.8 -121% | 7.4 -67% | 7.1 -60% | 3.4 23% | 5.09 ? -15% | 8.94 ? -101% |
| Idle Average * (Watt) | 9.24 | 16.8 -82% | 12.4 -34% | 14.4 -56% | 11 -19% | 9.25 ? -0% | 13.8 ? -49% |
| Idle Maximum * (Watt) | 13.3 | 16.9 -27% | 13.3 -0% | 14.6 -10% | 14.9 -12% | 13 ? 2% | 17.5 ? -32% |
| Load Average * (Watt) | 80.4 | 102.3 -27% | 79.2 1% | 93.9 -17% | 78.9 2% | 78.2 ? 3% | 95 ? -18% |
| Witcher 3 ultra * (Watt) | 66 | 76.5 -16% | 82.2 -25% | 77.9 -18% | |||
| Load Maximum * (Watt) | 118 | 114.5 3% | 96.5 18% | 88.3 25% | 91.2 23% | 132.7 ? -12% | 175.2 ? -48% |
* ... mindre är bättre
| HP ZBook Studio x360 G5-4QH13EA i7-8750H, Quadro P1000, 97.2 Wh | Dell Precision 5530 Xeon E-2176M E-2176M, Quadro P2000, 97 Wh | Dell Precision 5530 2-in-1 i7-8706G, WX Vega M GL, 75 Wh | Lenovo ThinkPad P1-20MD002LUS E-2176M, Quadro P2000 Max-Q, 80 Wh | Apple MacBook Pro 15 2018 (2.6 GHz, 560X) i7-8850H, Radeon Pro 560X, 83 Wh | Genomsnitt av klass Workstation | |
|---|---|---|---|---|---|---|
| Batteridrifttid | -26% | -44% | -57% | 4% | -14% | |
| Reader / Idle (h) | 24.1 | 16.5 -32% | 12.3 -49% | 26.1 ? 8% | ||
| H.264 (h) | 9.4 | 11.7 24% | 9.51 ? 1% | |||
| WiFi v1.3 (h) | 12.3 | 8.4 -32% | 7.3 -41% | 5.3 -57% | 10.2 -17% | 8.53 ? -31% |
| Load (h) | 2.1 | 1.8 -14% | 1.2 -43% | 1.429 ? -32% | ||
| Witcher 3 ultra (h) | 1.5 |
För
Emot
Läs den fullständiga versionen av den här recensionen på engelska här.
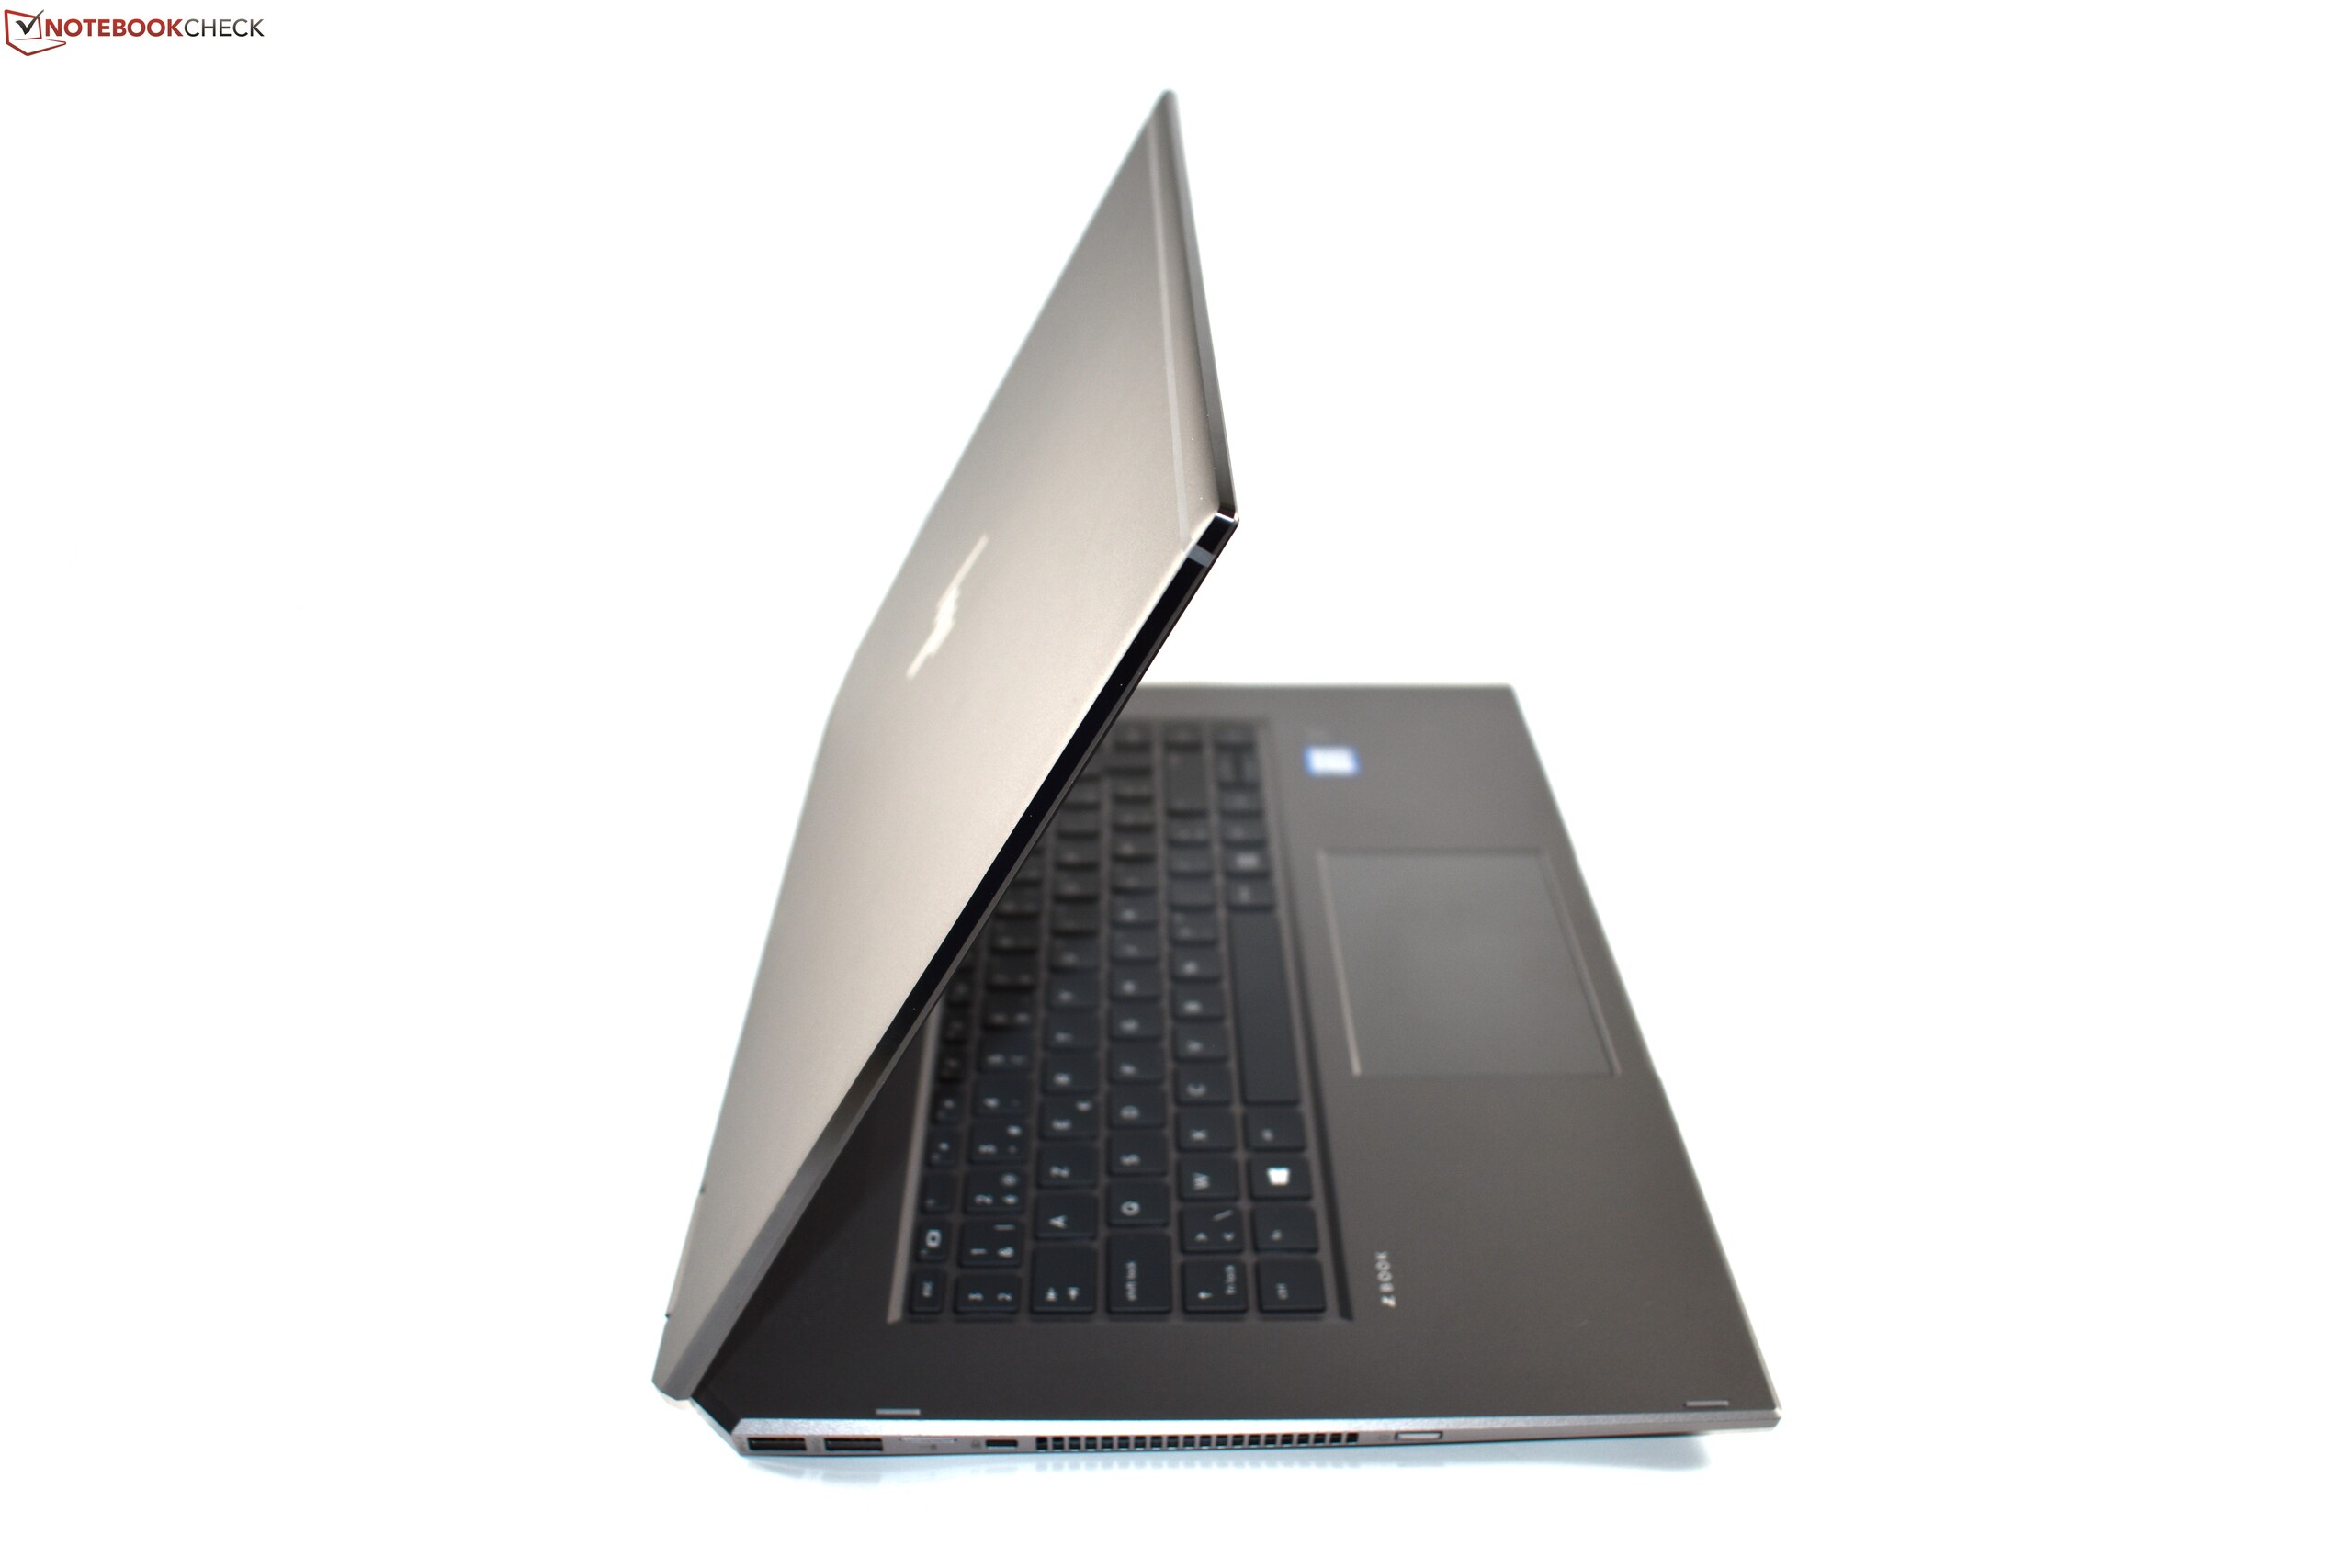
Till viss del är HP ZBook Studio x360 G5 en unik laptop. Kombinationen av omvandlingsbara funktioner, en arbetsstationsdesign och aktuella sexkärniga processorer är något som ingen annan för tillfället erbjuder. Men innebär denna unikhet att ZBook Studio x360 G5 också är en bra laptop?
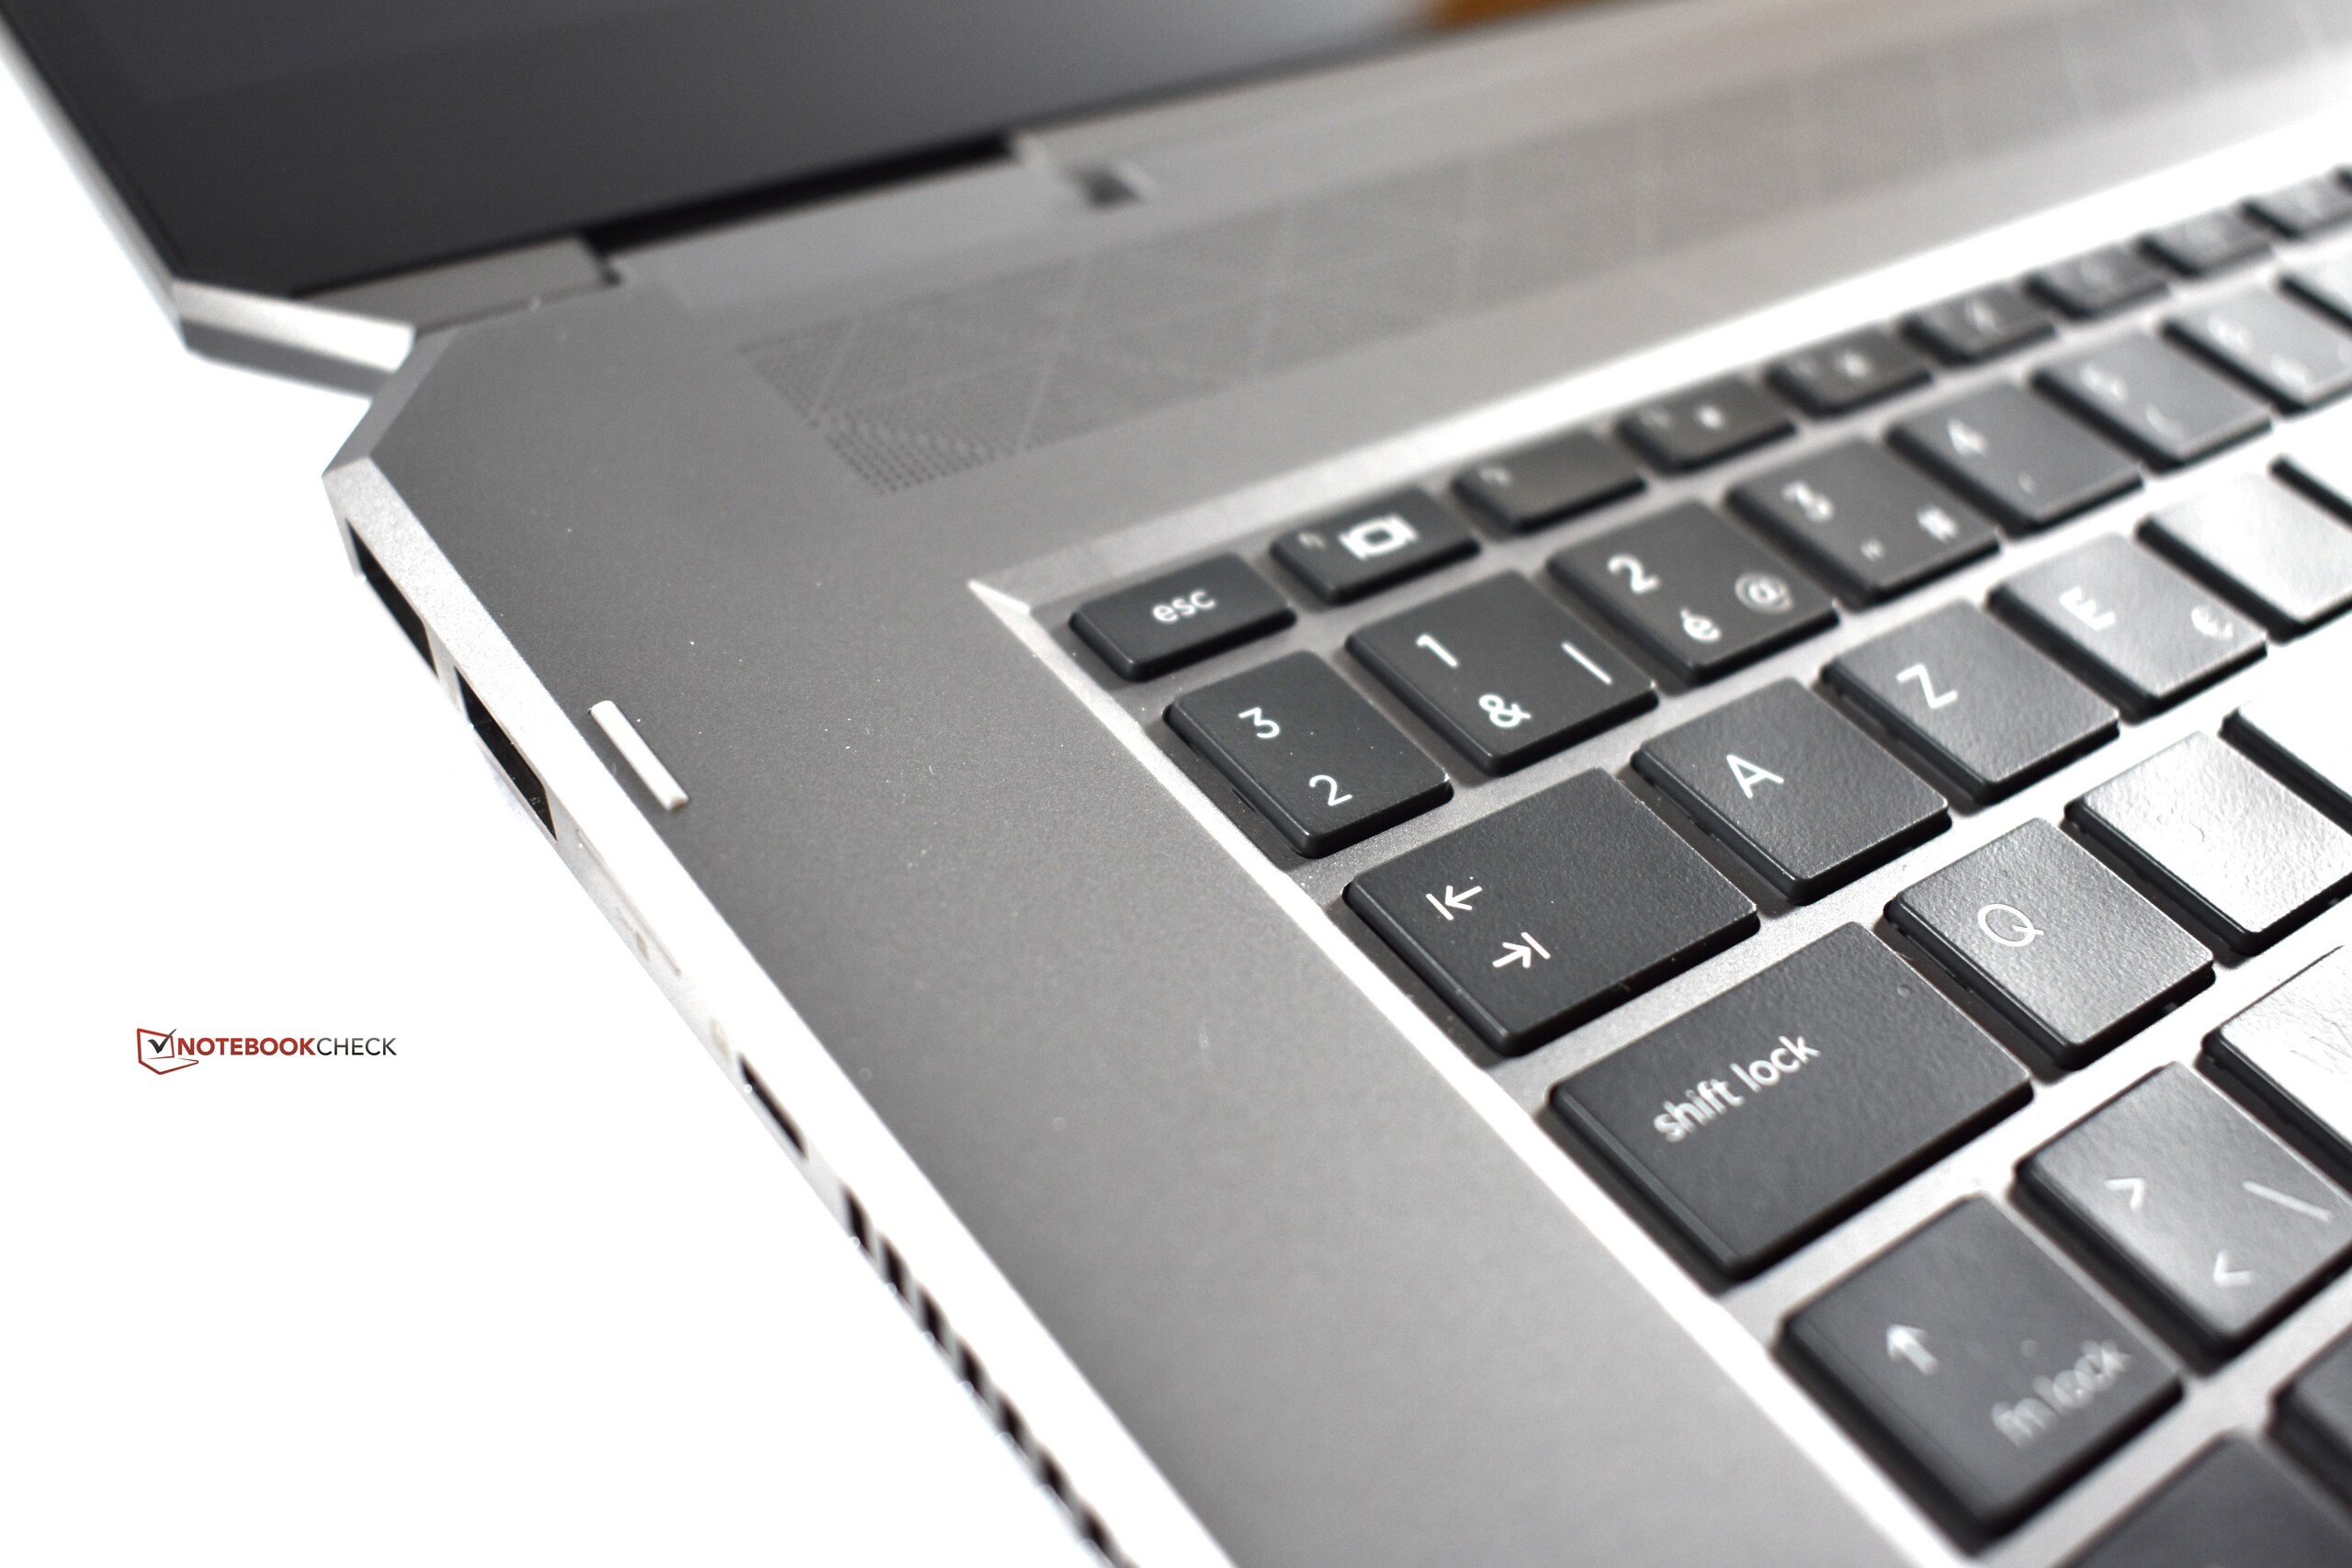
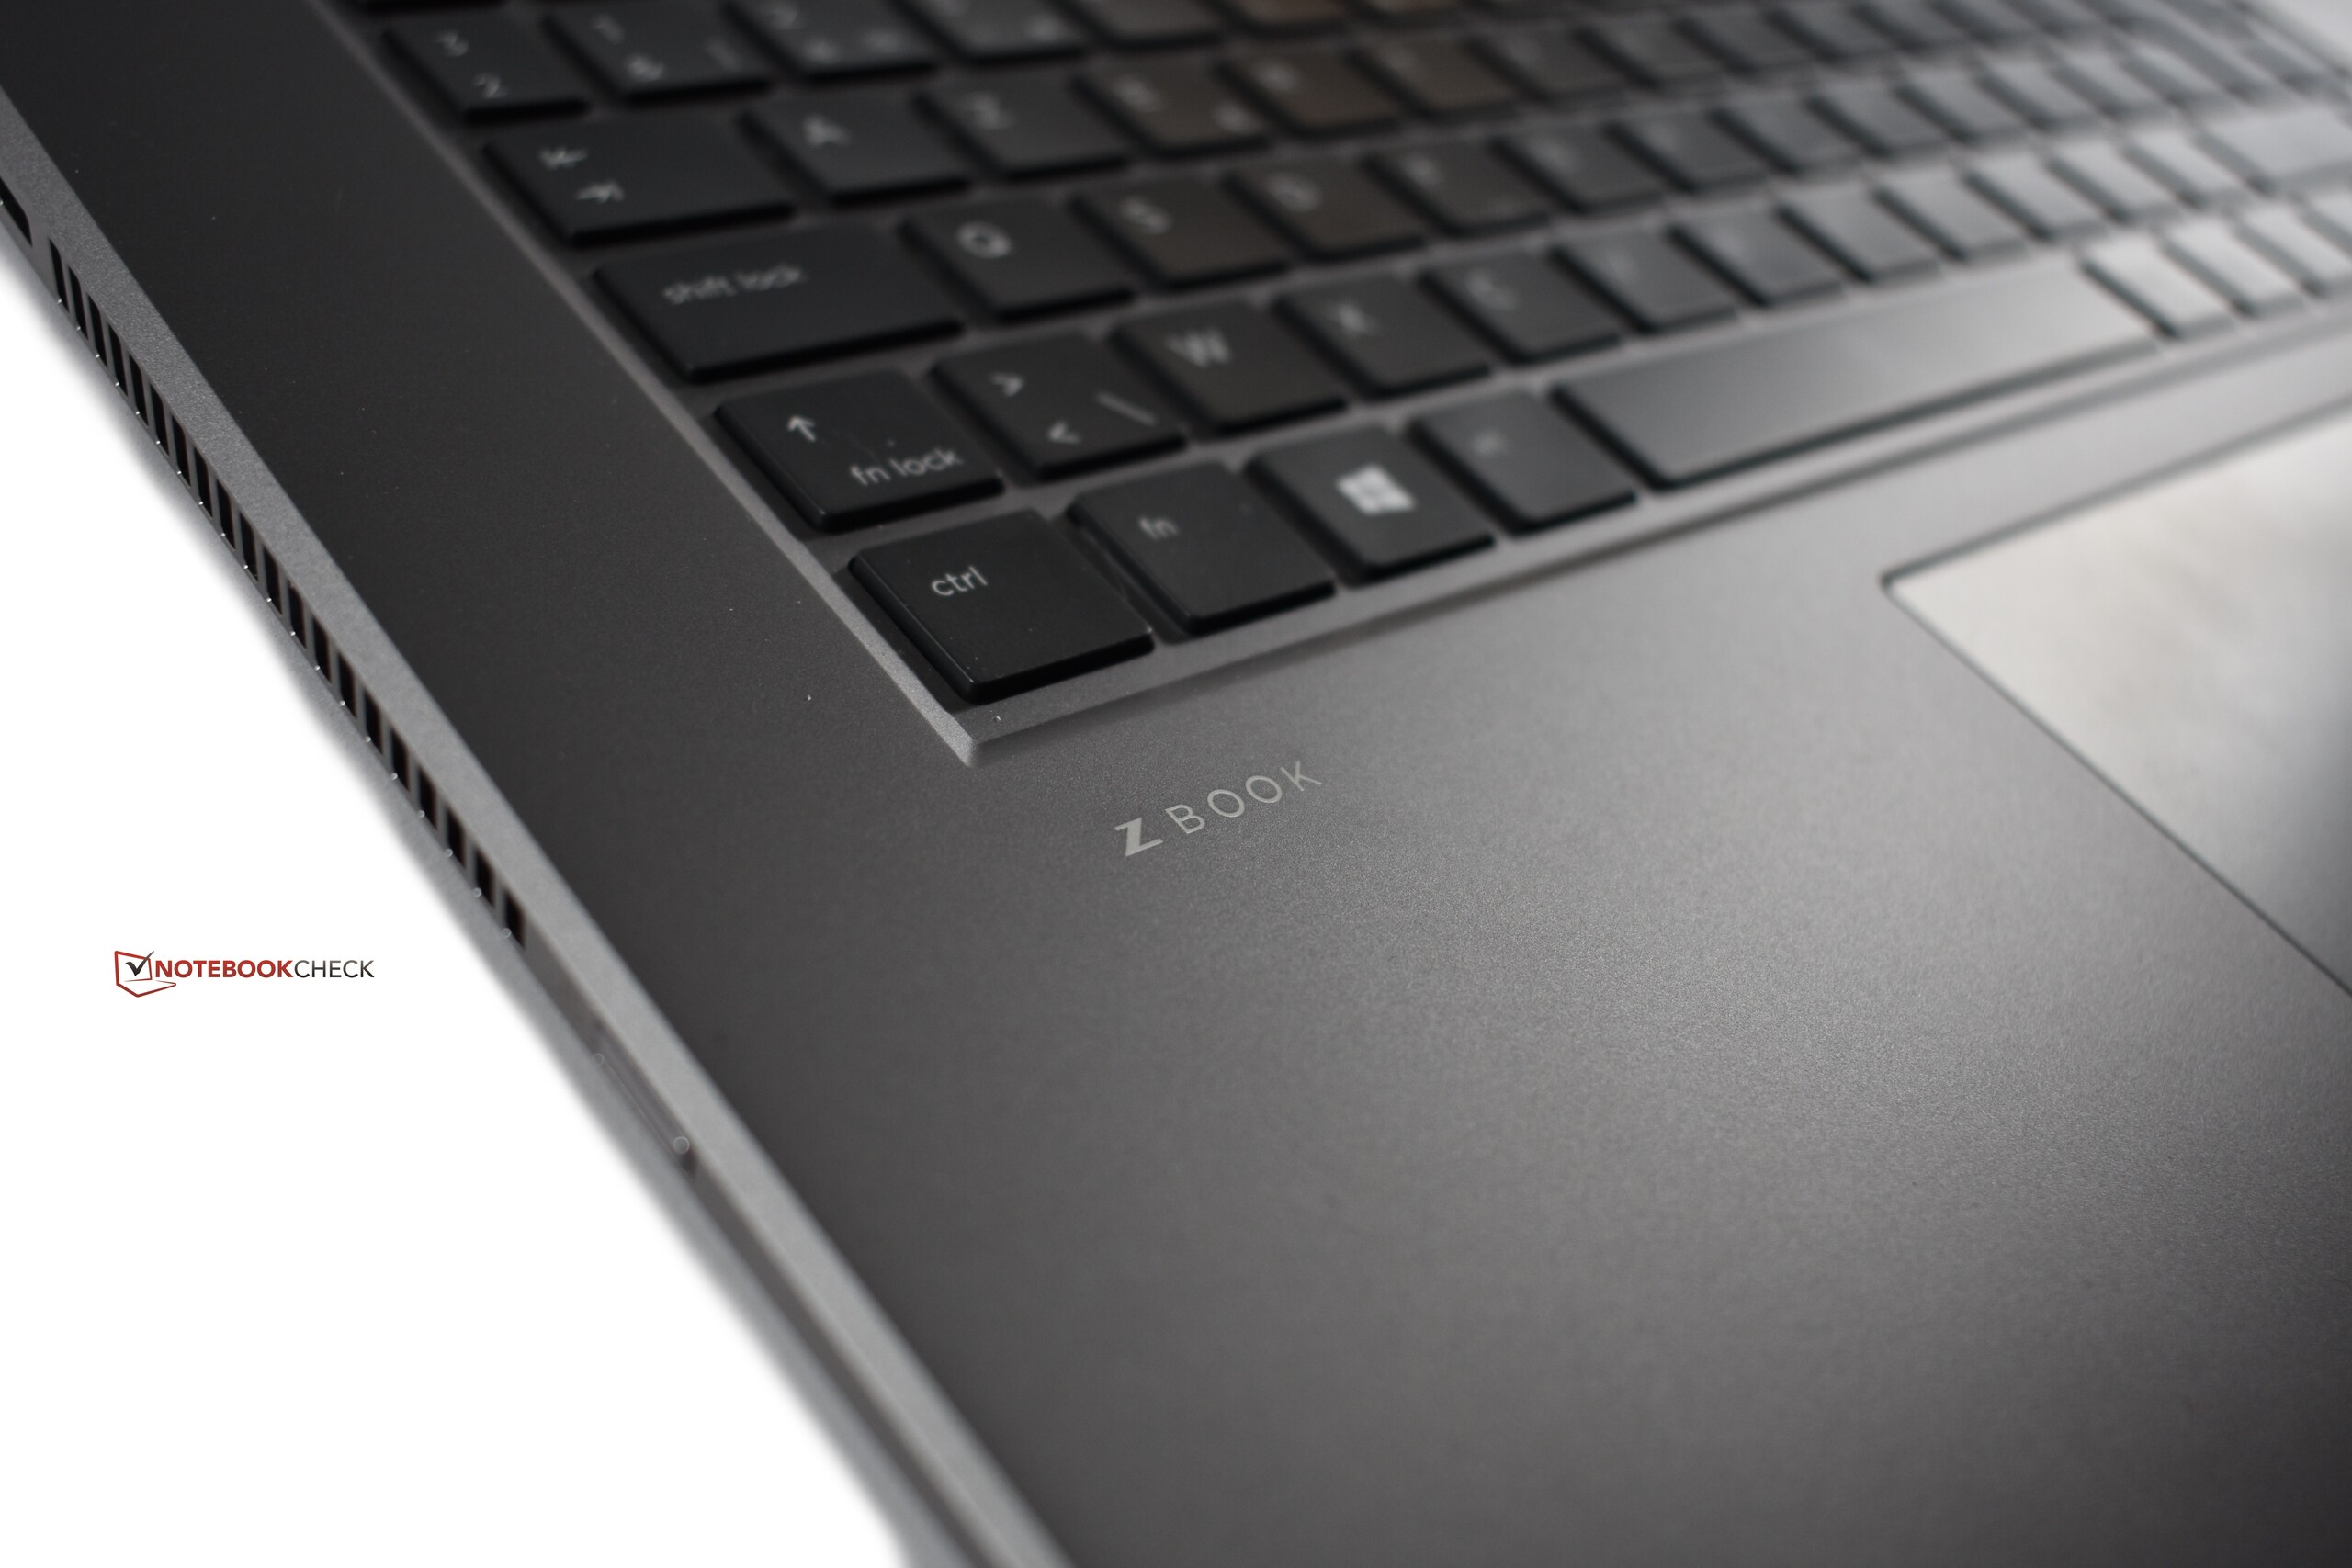
På många sätt gör ZBook Studio sitt höga pris på över 20.000 kronor rättvisa. Detta inkluderar exempelvis ett extremt högkvalitativt och stabilt chassi. Dessutom är det billigaste skärmalternativet bra, trots att den missar målet på 400 cd/m². Den blanka ytan kan dock vara en riktigt nackdel med skärmen. Å andra sidan övertygar poängen från batteritidssektionen ordentligt: Mer än 12 timmar i WiFi-testet är ett riktigt bra resultat. Den håller en låg temperatur på chassits utsida vid belastning och ZBook Studio x360 går att uppgradera ordentligt med två RAM-platser och två SSD-platser. Sist men inte minst har vi börjat gilla tangentbordet trots att vår enhet hade en irriterande AZERTY-layout.
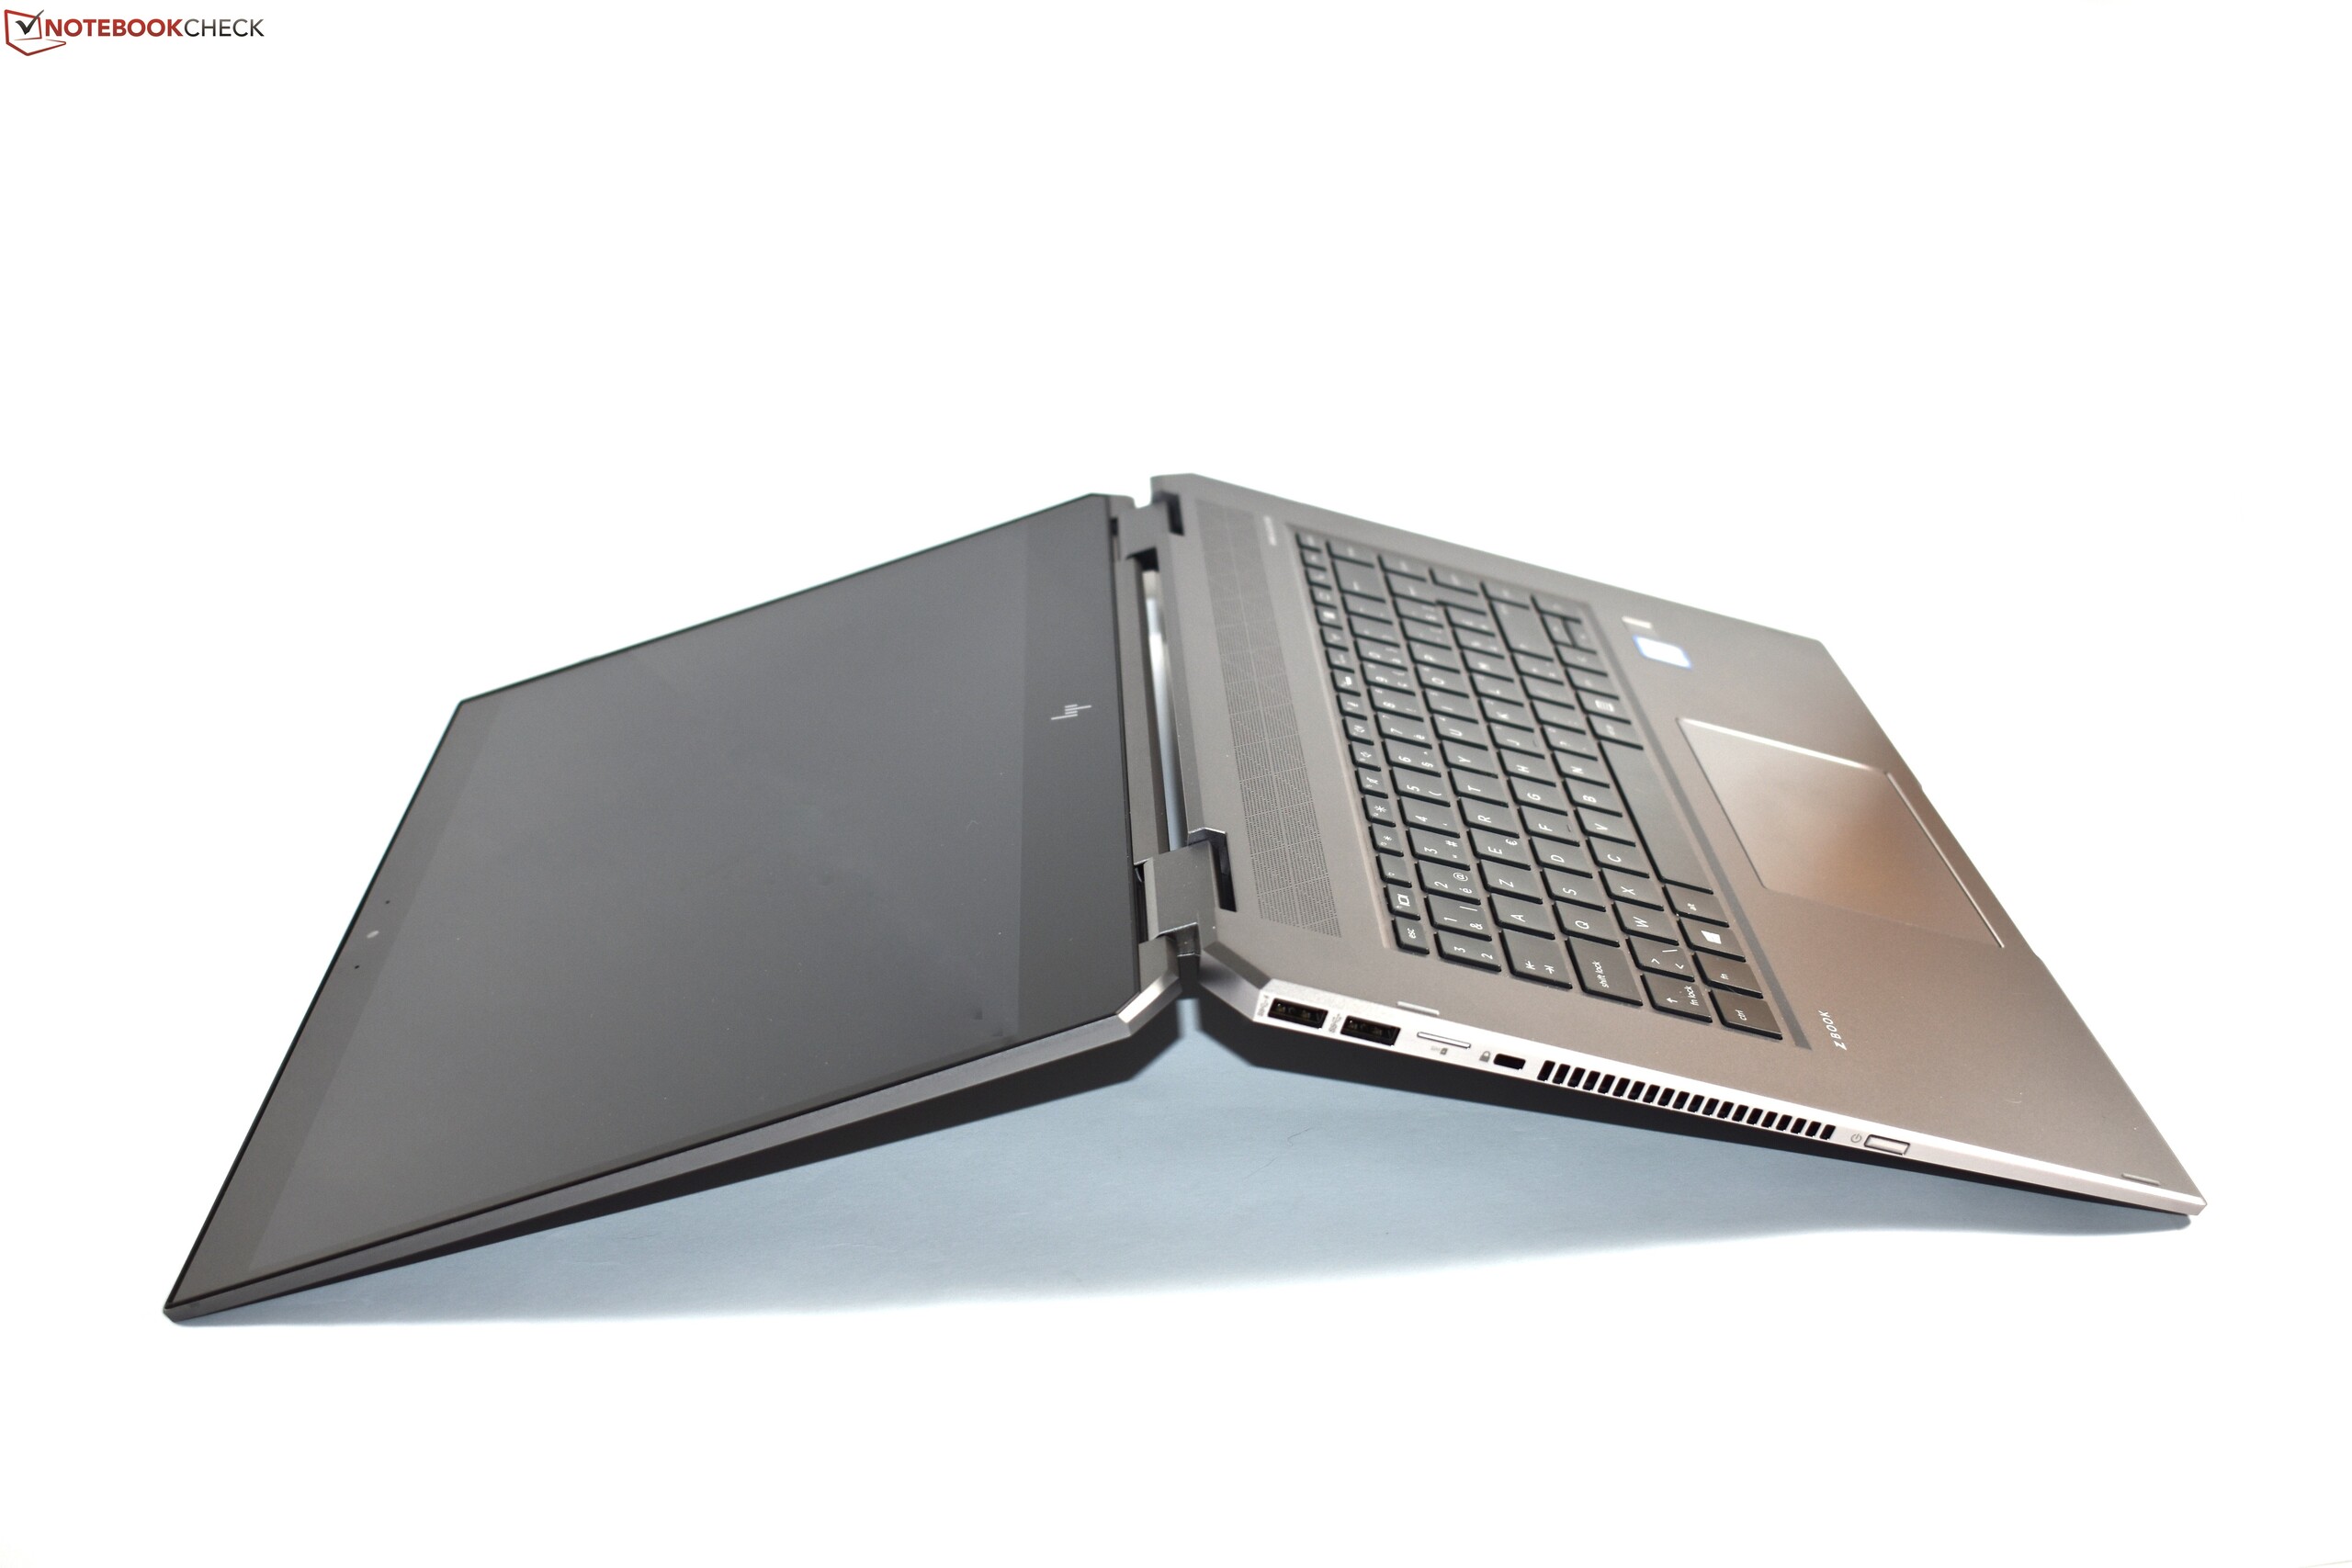
Men HP uppnår inte perfektion med ZBook Studio x360; den har också ett antal brister. På en del sätt hör de faktiskt ihop med ZBooks styrkor. Som exempel så resulterar det stora batteriet och det stabila metallchassit i en jämförelsevis hög vikt på 2.4 kg, mycket mer än dess direkta konkurrenter. I synnerhet begränsas dess funktion som en surfplatta av den höga vikten. Vidare erbjuder ZBook Studio x360 mycket mer CPU-prestanda än den omvandlingsbara konkurrenten Dell Precision 5530 2-in-1, men vanliga Dell Precision 5530 och Lenovo ThinkPad P1 har både högre och mer konsekvent prestanda vid belastning. Konkurrenterna är dessutom tystare vid tomgång. På tal om hårdvara gillade vi styrplattan på ZBook Studio x360 G5, men drivrutinen lämnar en hel del att önska: ibland registreras inte klickningar korrekt.
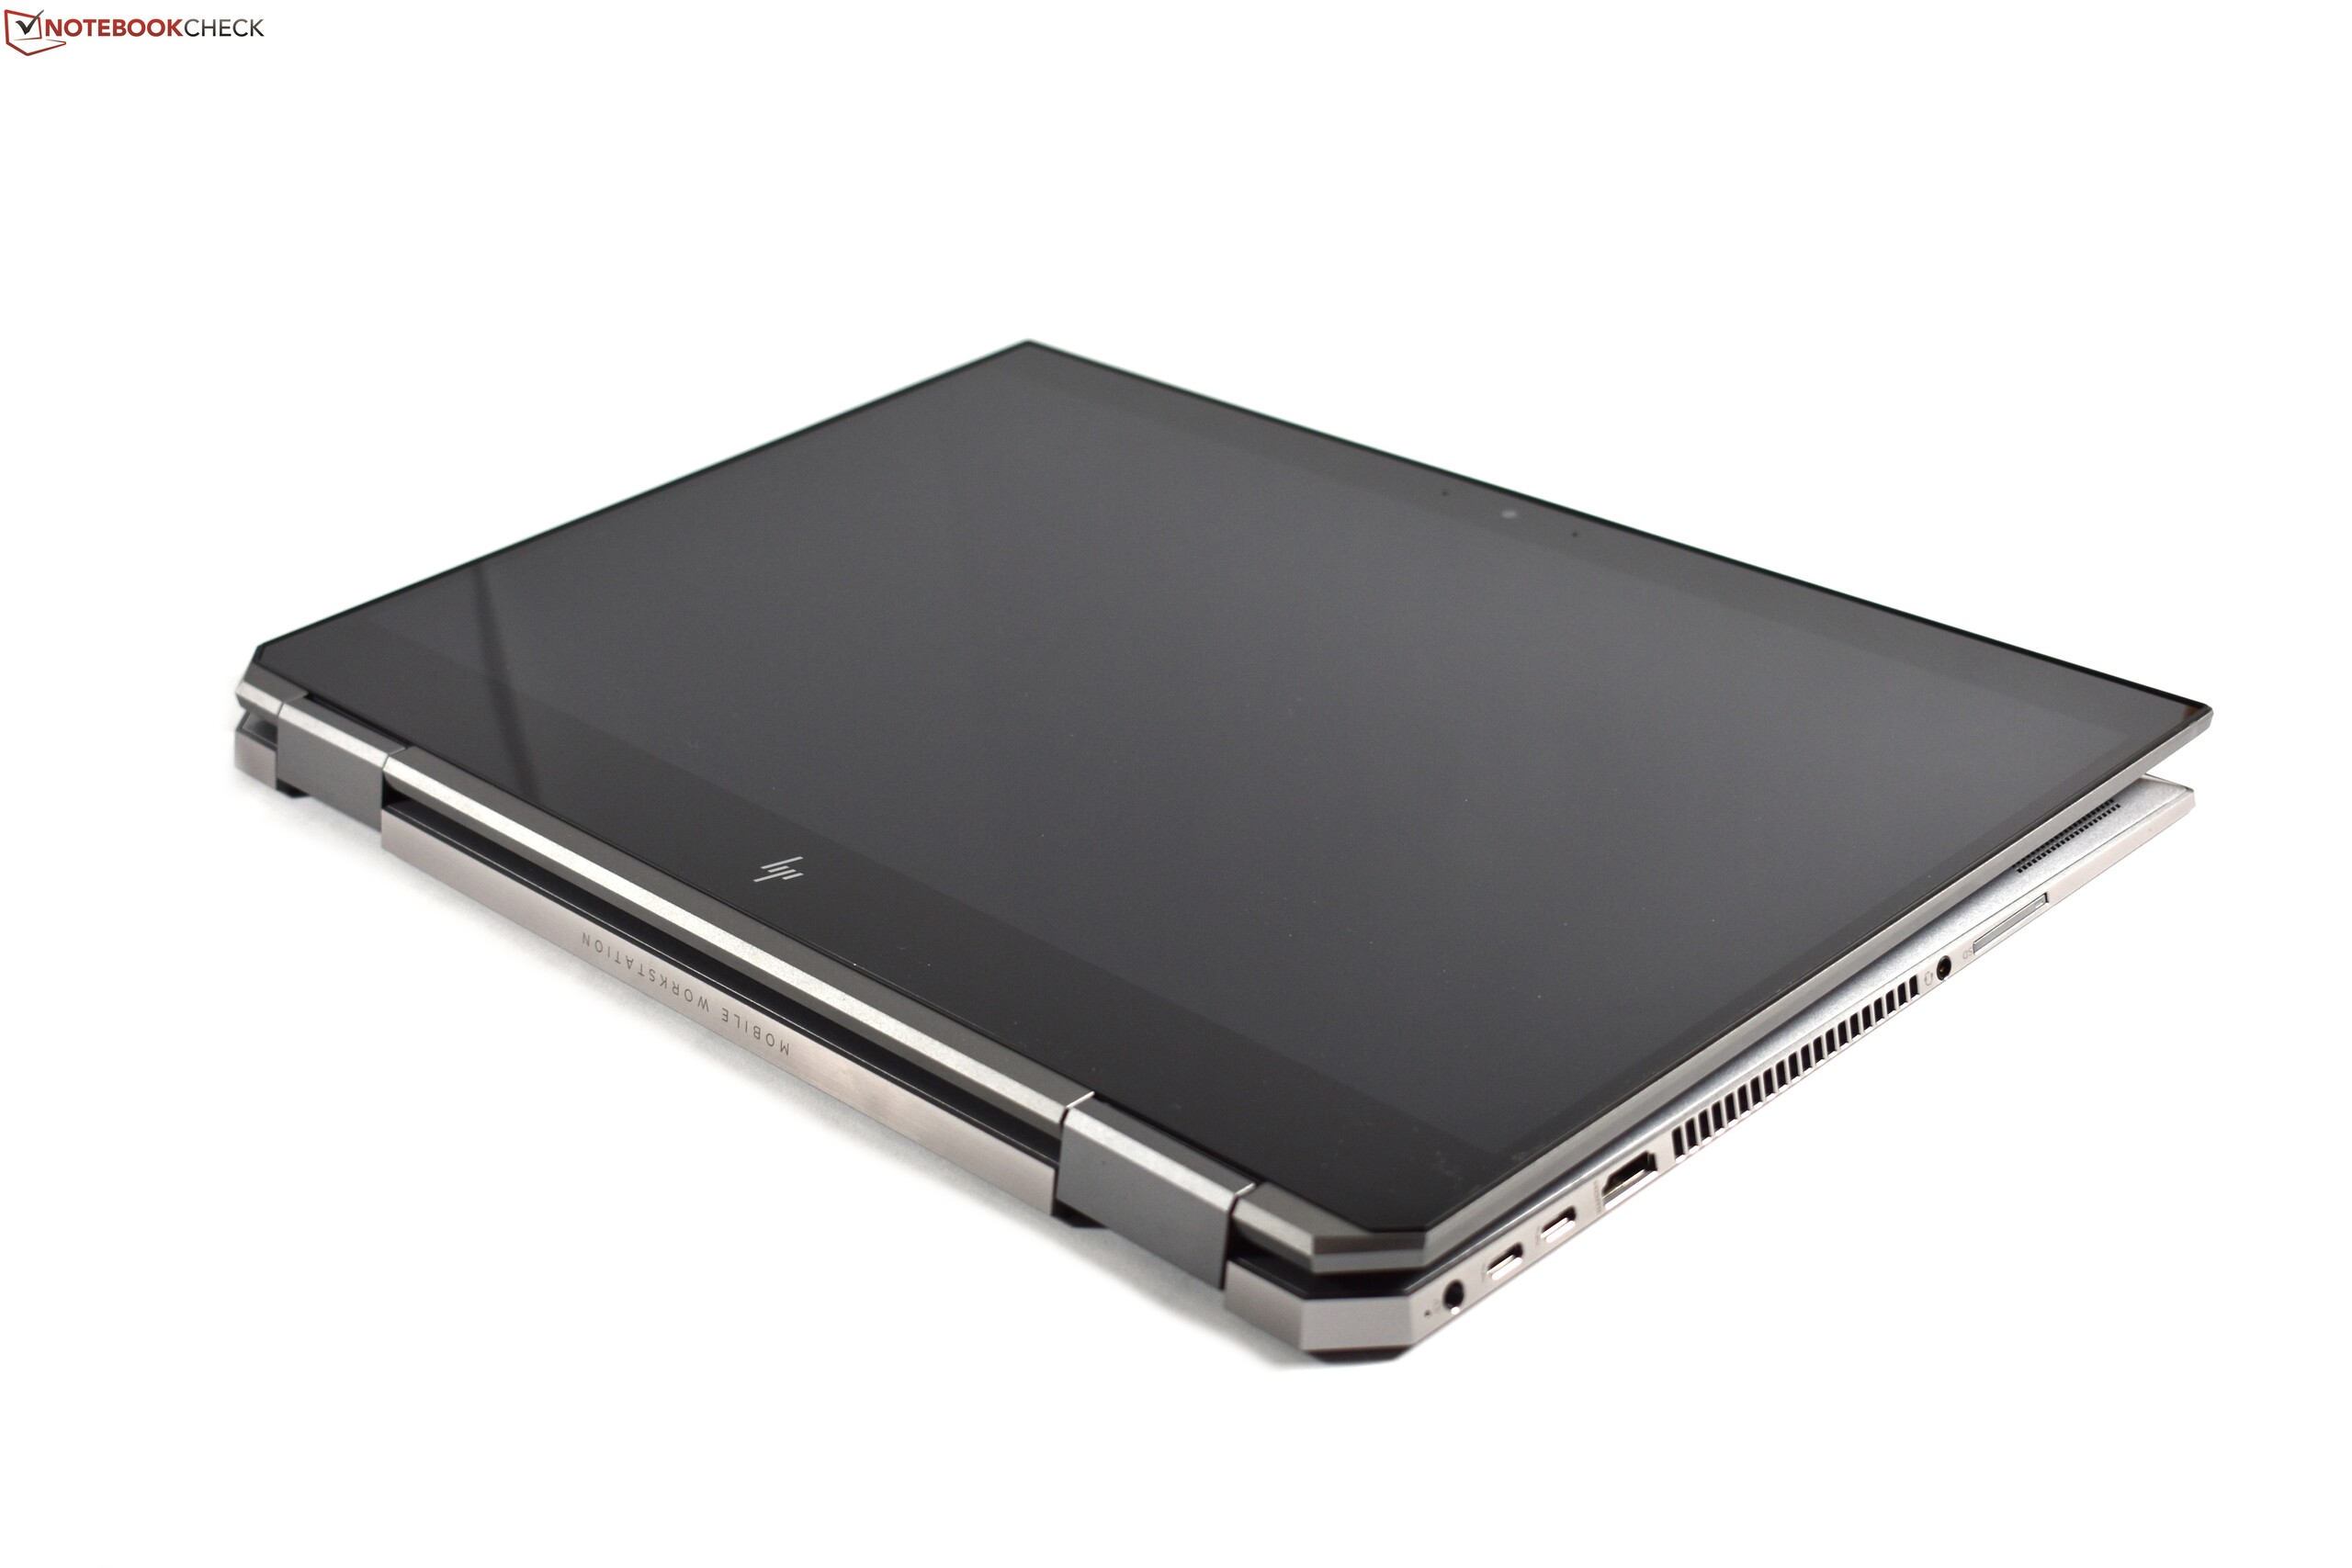
Hög kvalitet, högt pris och hög vikt: HP ZBook Studio x360 G5 är en omvandlingsbar arbetsstation i en helt egen klass – men den är definitivt inte det bästa valet för alla arbetsstationsanvändare.
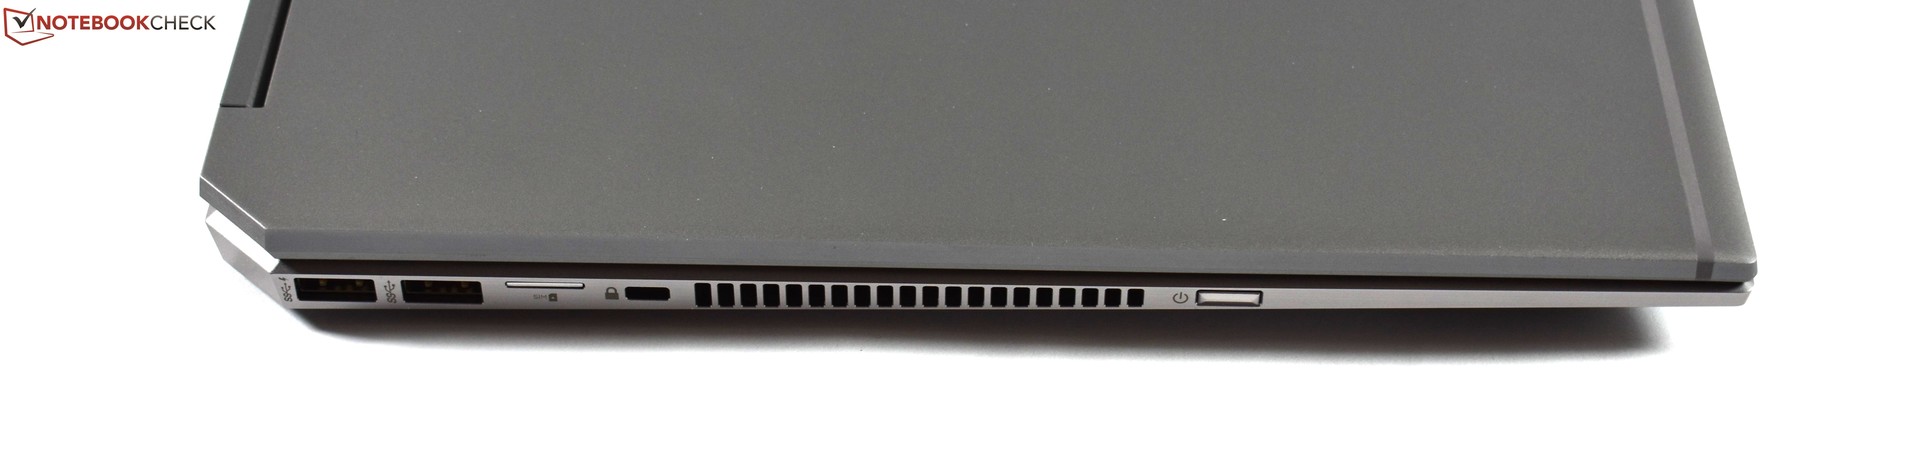
Kritiken är inte tillräcklig för att vi ska vägra en rekommendation av ZBook Studio x360 G5. Totalt sett är det en dyr enhet, men också en högkvalitativ laptop som kommer göra de flesta användare nöjda och produktiva. Frågan om huruvida konkurrenterna är bättre kvarstår förstås. Dell Precision 5530 och Lenovo ThinkPad P1 är förstås starka konkurrenter, särskilt om man inte behöver en omvandlingsbar modell. Men om en sådan önskas är HP ZBook Studio x360 G5 i princip det enda alternativet. Det är bara Dell Precision 5530 2-in-1 som har en liknande kombination av funktioner – även om de har ganska olika specifikationer. ZBook har fler portar, ett mer traditionellt tangentbord och bättre CPU-prestanda. Dell Precision har högre GPU-prestanda och lägre vikt. Det är vad köparen prioriterar som i slutändan får avgöra vilken modell som är bäst.
HP ZBook Studio x360 G5-4QH13EA
- 03/26/2020 v7 (old)
Benjamin Herzig
Price comparison
