Test: HP Spectre 13 (Core i7, Full-HD) (sammanfattning)
| Networking | |
| iperf3 transmit AX12 | |
| Apple MacBook Pro 13 2016 (2.9 GHz) | |
| HP Spectre 13-v131ng | |
| Dell XPS 13 9360 FHD i5 | |
| iperf3 receive AX12 | |
| Apple MacBook Pro 13 2016 (2.9 GHz) | |
| Dell XPS 13 9360 FHD i5 | |
| HP Spectre 13-v131ng | |
| |||||||||||||||||||||||||
Distribution av ljusstyrkan: 91 %
Mitt på batteriet: 384 cd/m²
Kontrast: 1154:1 (Svärta: 0.35 cd/m²)
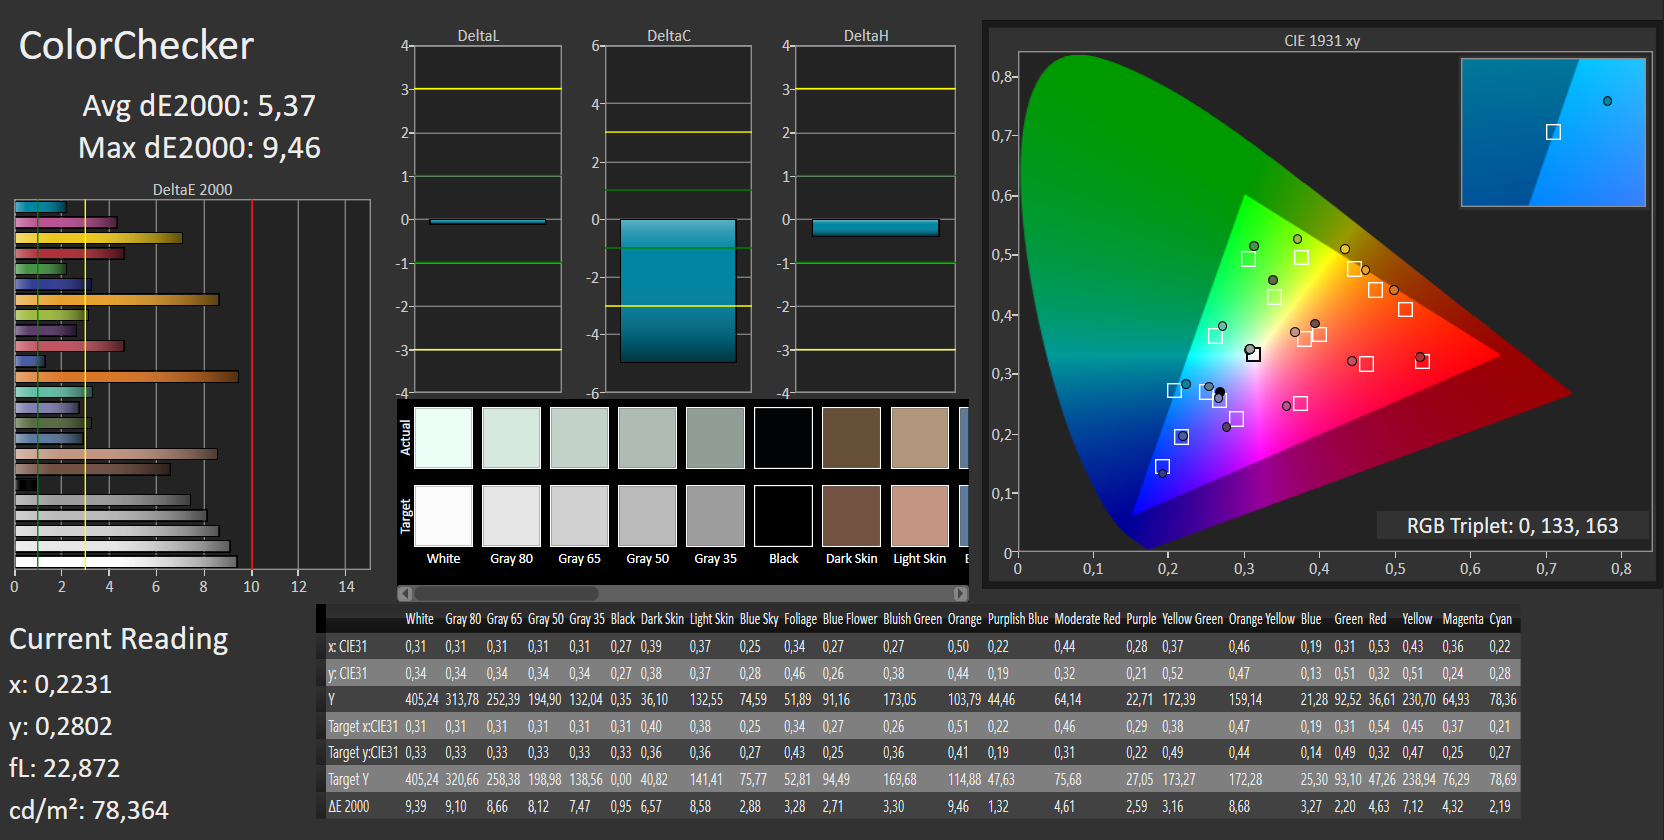
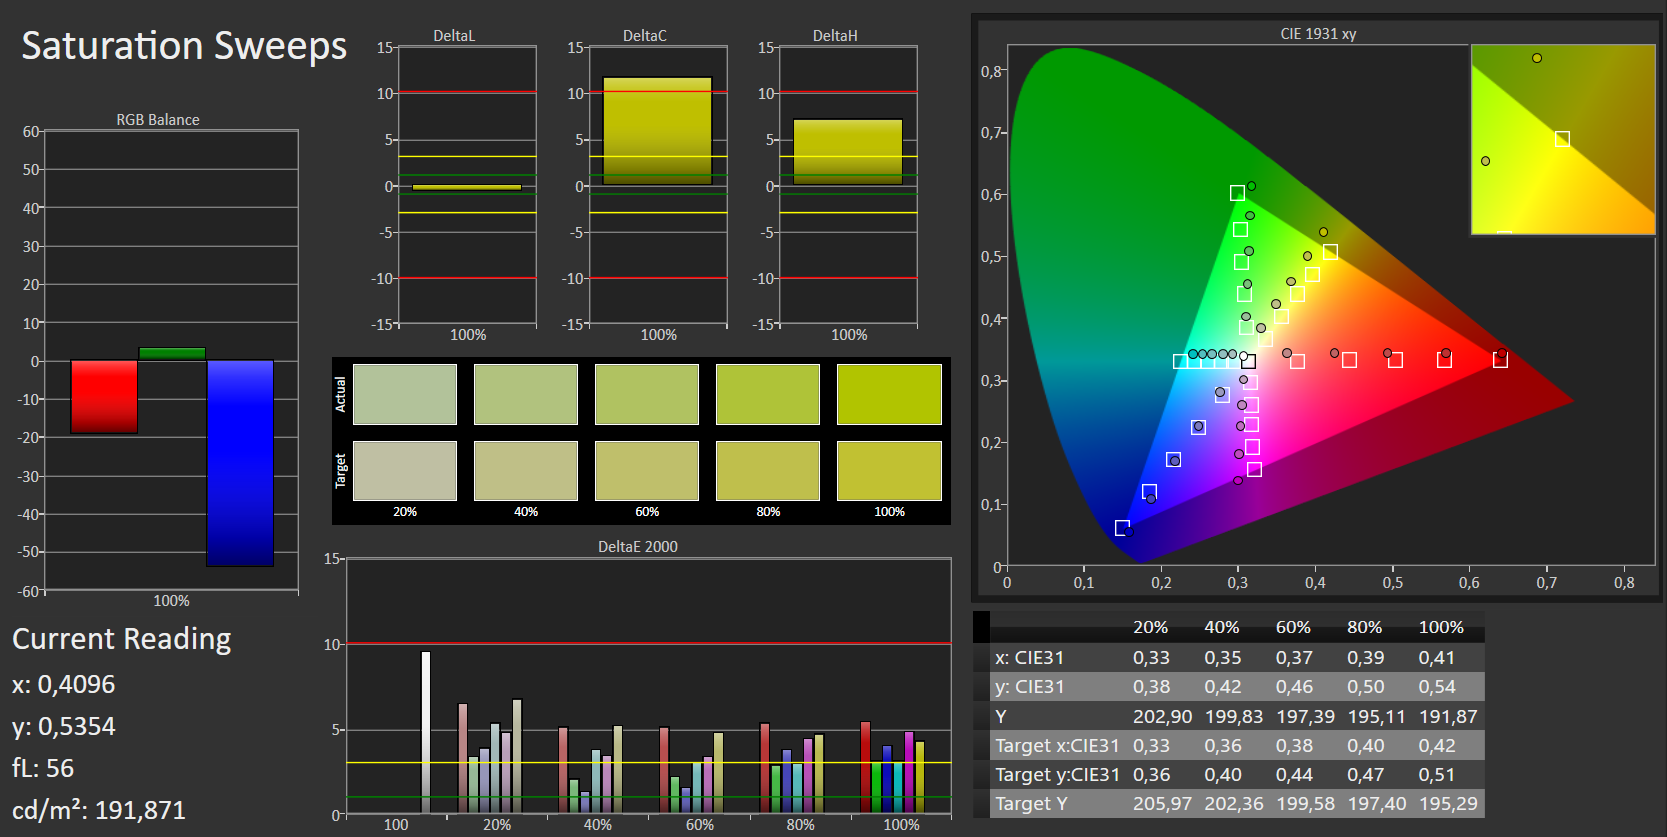
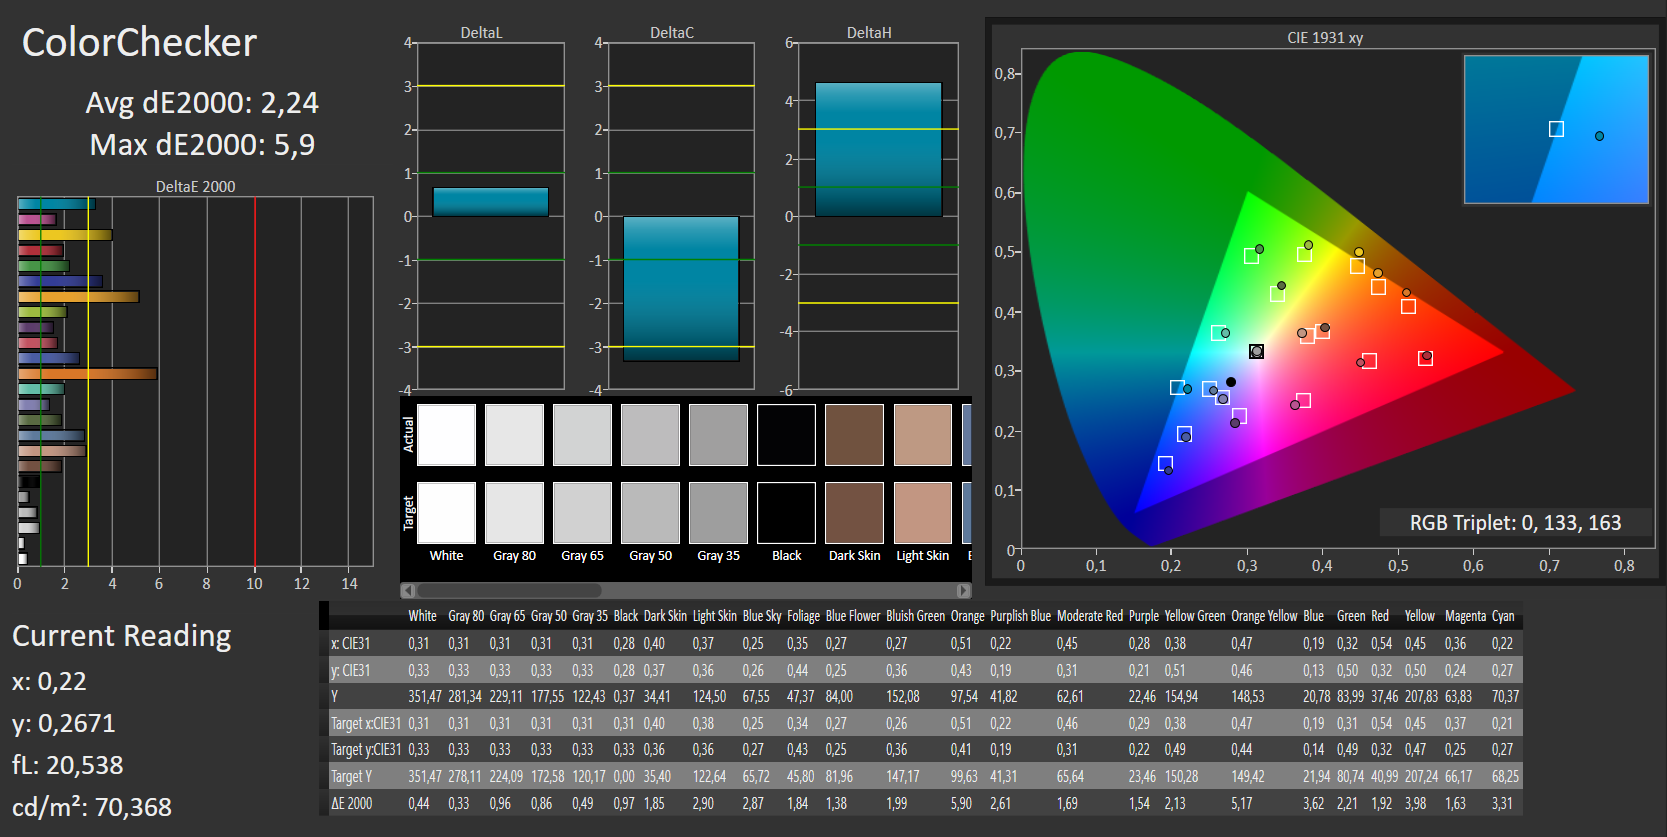
ΔE ColorChecker Calman: 5.37 | ∀{0.5-29.43 Ø4.71}
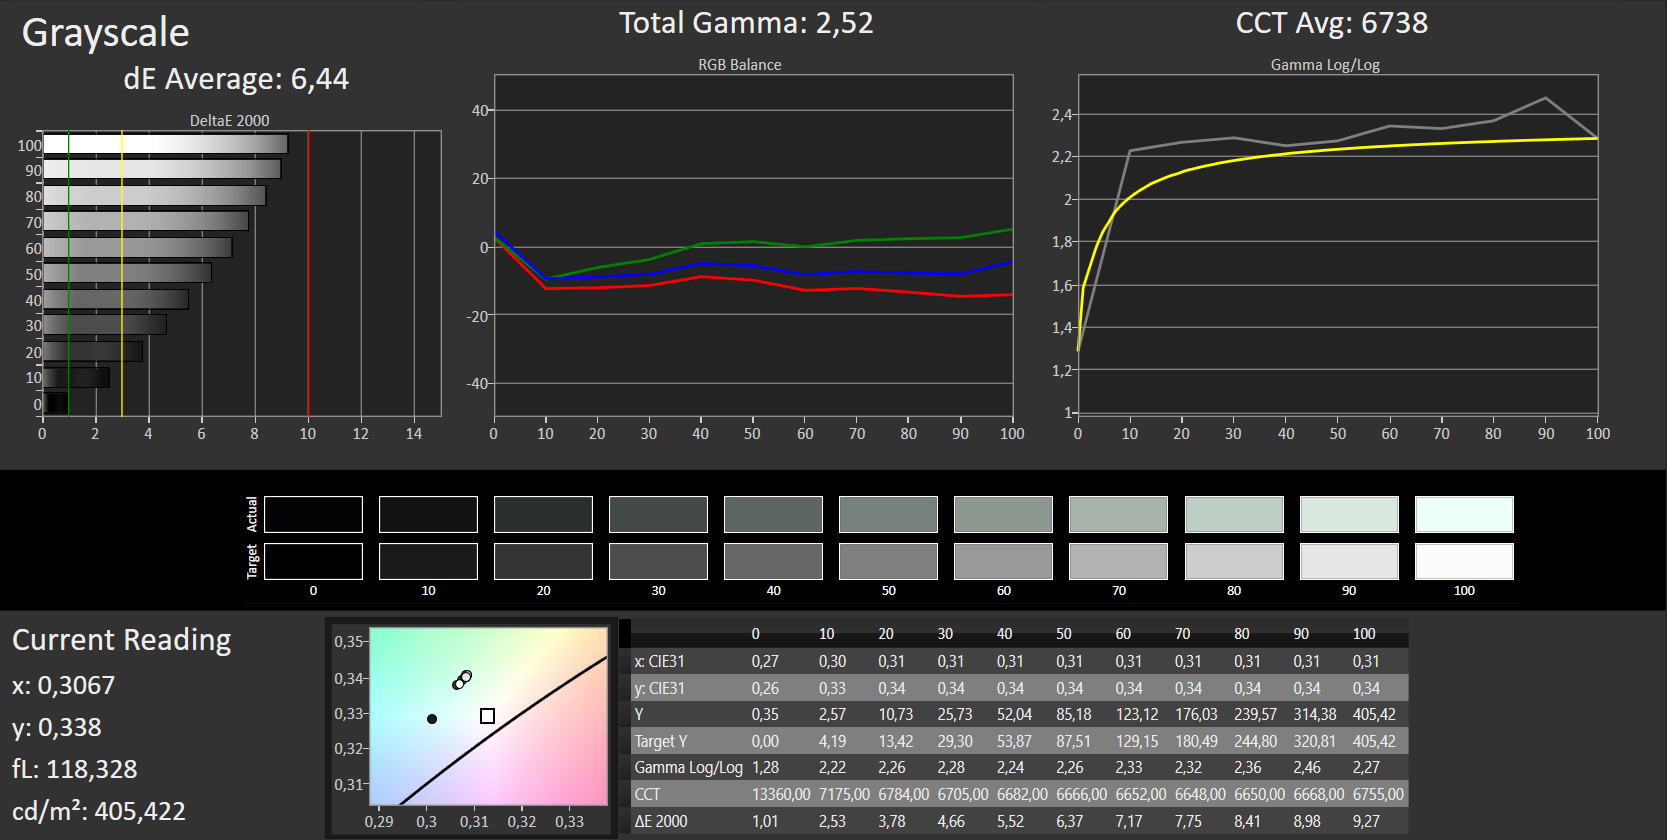
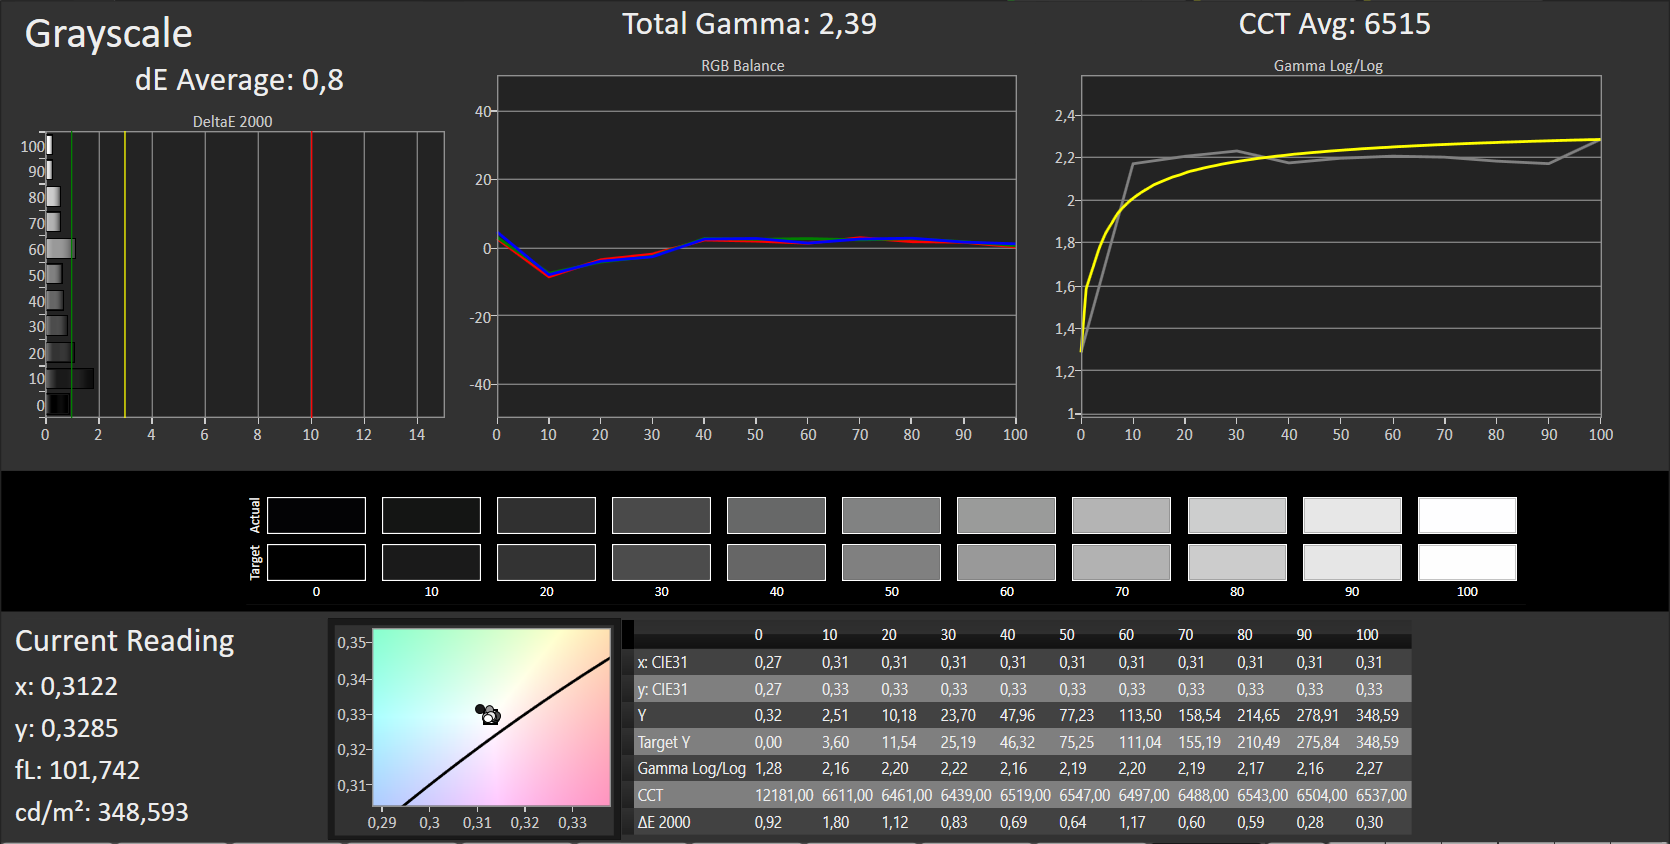
ΔE Greyscale Calman: 6.44 | ∀{0.09-98 Ø4.96}
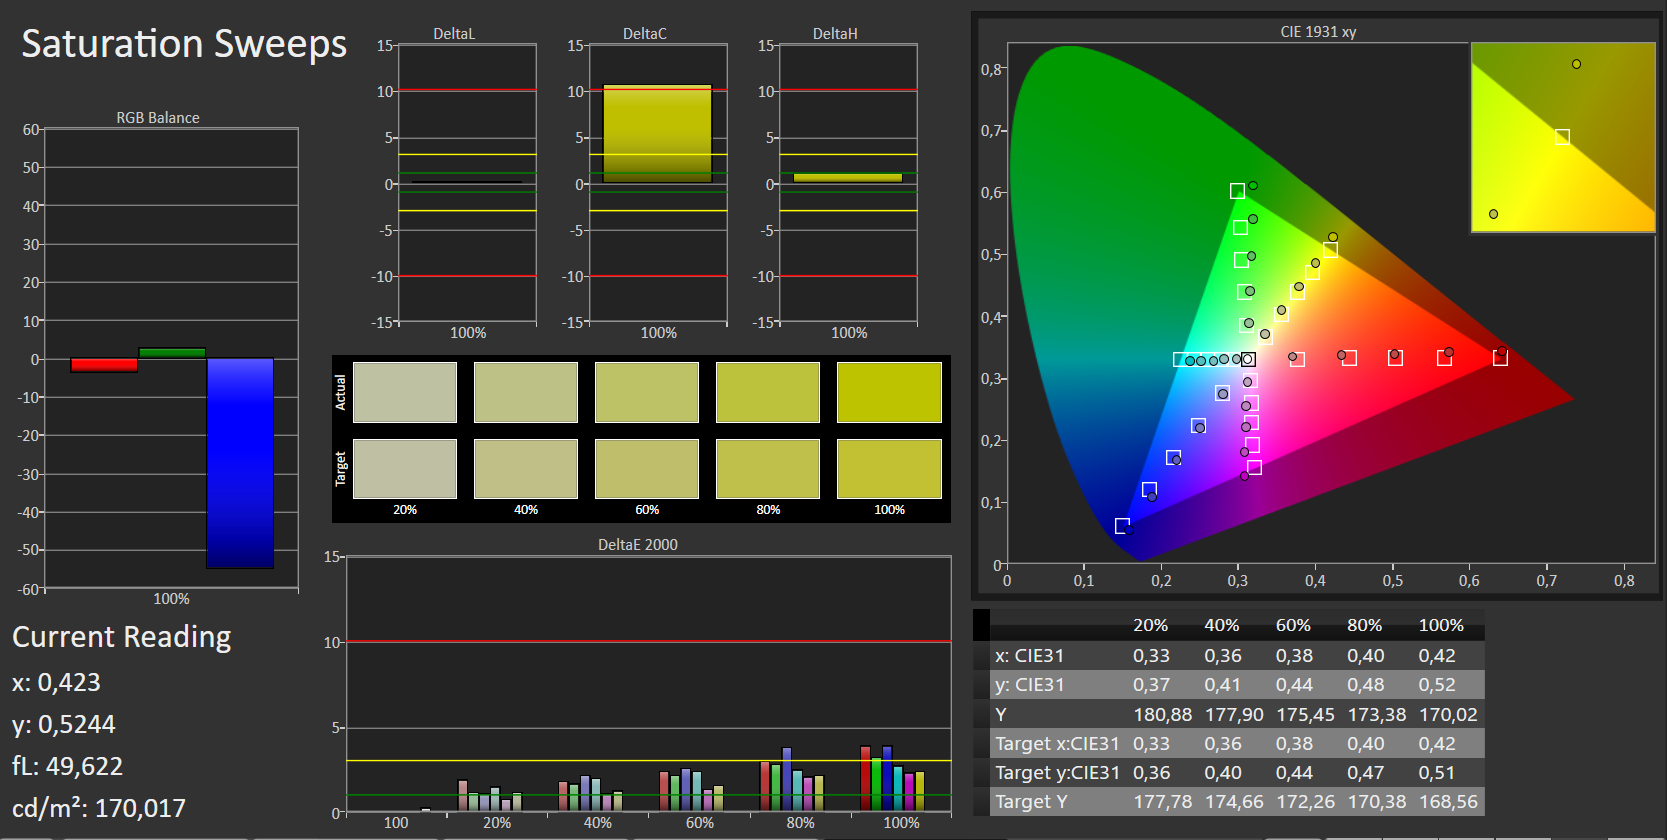
89% sRGB (Argyll 1.6.3 3D)
58% AdobeRGB 1998 (Argyll 1.6.3 3D)
64.8% AdobeRGB 1998 (Argyll 3D)
88.8% sRGB (Argyll 3D)
64.6% Display P3 (Argyll 3D)
Gamma: 2.52
CCT: 6738 K
| HP Spectre 13-v131ng CMN1374, 1920x1080, 13.3" | HP Spectre 13 1920x1080, 13.3" | Apple MacBook Pro 13 2016 (2.9 GHz) APPA033, 2560x1600, 13.3" | Dell XPS 13 9360 FHD i5 Sharp SHP1449 LQ133M1, 1920x1080, 13.3" | Asus Zenbook UX305CA-FB055T Samsung 133YL04-P02, 3200x1800, 13.3" | HP EliteBook 1030 G1-X2F03EA Sharp SHP1465, 3200x1800, 13.3" | |
|---|---|---|---|---|---|---|
| Display | 4% | 34% | -21% | -6% | 6% | |
| Display P3 Coverage (%) | 64.6 | 65.6 2% | 99.2 54% | 48.94 -24% | 59.1 -9% | 67.6 5% |
| sRGB Coverage (%) | 88.8 | 94.7 7% | 99.9 13% | 73.3 -17% | 85.5 -4% | 94.7 7% |
| AdobeRGB 1998 Coverage (%) | 64.8 | 67.5 4% | 87.6 35% | 50.5 -22% | 61 -6% | 69 6% |
| Response Times | -6% | -32% | 14% | 18% | 15% | |
| Response Time Grey 50% / Grey 80% * (ms) | 46 ? | 50.8 ? -10% | 47.2 ? -3% | 32.8 ? 29% | 38 ? 17% | 42.4 ? 8% |
| Response Time Black / White * (ms) | 33 ? | 33.2 ? -1% | 53 ? -61% | 33.2 ? -1% | 27 ? 18% | 25.6 ? 22% |
| PWM Frequency (Hz) | 1429 ? | |||||
| Screen | 19% | 27% | 0% | -6% | 10% | |
| Brightness middle (cd/m²) | 404 | 300.5 -26% | 569 41% | 351.2 -13% | 390 -3% | 401 -1% |
| Brightness (cd/m²) | 382 | 305 -20% | 542 42% | 325 -15% | 352 -8% | 369 -3% |
| Brightness Distribution (%) | 91 | 76 -16% | 90 -1% | 89 -2% | 81 -11% | 85 -7% |
| Black Level * (cd/m²) | 0.35 | 0.184 47% | 0.56 -60% | 0.195 44% | 0.69 -97% | 0.35 -0% |
| Contrast (:1) | 1154 | 1633 42% | 1016 -12% | 1801 56% | 565 -51% | 1146 -1% |
| Colorchecker dE 2000 * | 5.37 | 2.64 51% | 1.4 74% | 7.4 -38% | 3.04 43% | 3.5 35% |
| Colorchecker dE 2000 max. * | 9.46 | 5.06 47% | 2.9 69% | 9.08 4% | 7.01 26% | 6.33 33% |
| Greyscale dE 2000 * | 6.44 | 2.8 57% | 1.8 72% | 6.71 -4% | 2.88 55% | 4.13 36% |
| Gamma | 2.52 87% | 2.16 102% | 2.16 102% | 2.74 80% | 2.43 91% | 2.28 96% |
| CCT | 6738 96% | 6999 93% | 6877 95% | 7222 90% | 6848 95% | 6508 100% |
| Color Space (Percent of AdobeRGB 1998) (%) | 58 | 60.9 5% | 78.4 35% | 50.48 -13% | 55 -5% | 61.56 6% |
| Color Space (Percent of sRGB) (%) | 89 | 94.3 6% | 99.3 12% | 73.31 -18% | 85 -4% | 94.64 6% |
| Totalt genomsnitt (program/inställningar) | 6% /
13% | 10% /
21% | -2% /
-2% | 2% /
-3% | 10% /
10% |
* ... mindre är bättre
Visa svarstider
| ↔ Svarstid svart till vitt | ||
|---|---|---|
| 33 ms ... stiga ↗ och falla ↘ kombinerat | ↗ 21 ms stiga | 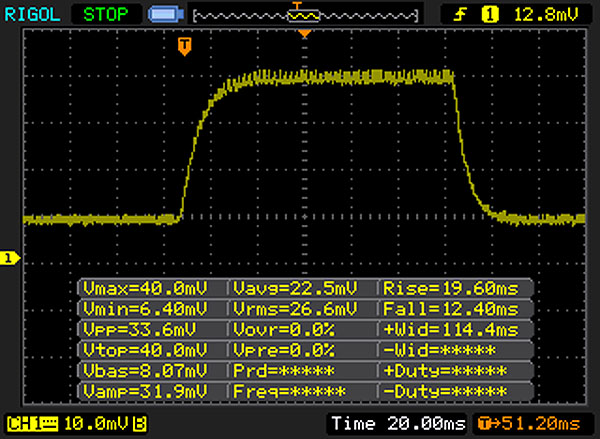 |
| ↘ 12 ms hösten | ||
| Skärmen visar långsamma svarsfrekvenser i våra tester och kommer att vara otillfredsställande för spelare. I jämförelse sträcker sig alla testade enheter från 0.1 (minst) till 240 (maximalt) ms. » 89 % av alla enheter är bättre. Detta innebär att den uppmätta svarstiden är sämre än genomsnittet av alla testade enheter (19.8 ms). | ||
| ↔ Svarstid 50 % grått till 80 % grått | ||
| 46 ms ... stiga ↗ och falla ↘ kombinerat | ↗ 26 ms stiga | 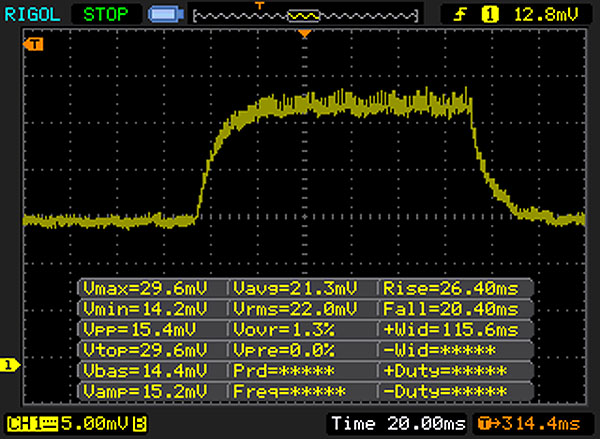 |
| ↘ 20 ms hösten | ||
| Skärmen visar långsamma svarsfrekvenser i våra tester och kommer att vara otillfredsställande för spelare. I jämförelse sträcker sig alla testade enheter från 0.165 (minst) till 636 (maximalt) ms. » 79 % av alla enheter är bättre. Detta innebär att den uppmätta svarstiden är sämre än genomsnittet av alla testade enheter (31 ms). | ||
Skärmflimmer / PWM (Puls-Width Modulation)
| Skärmflimmer / PWM upptäcktes inte | ||
Som jämförelse: 52 % av alla testade enheter använder inte PWM för att dämpa skärmen. Om PWM upptäcktes mättes ett medelvärde av 7754 (minst: 5 - maximum: 343500) Hz. | ||
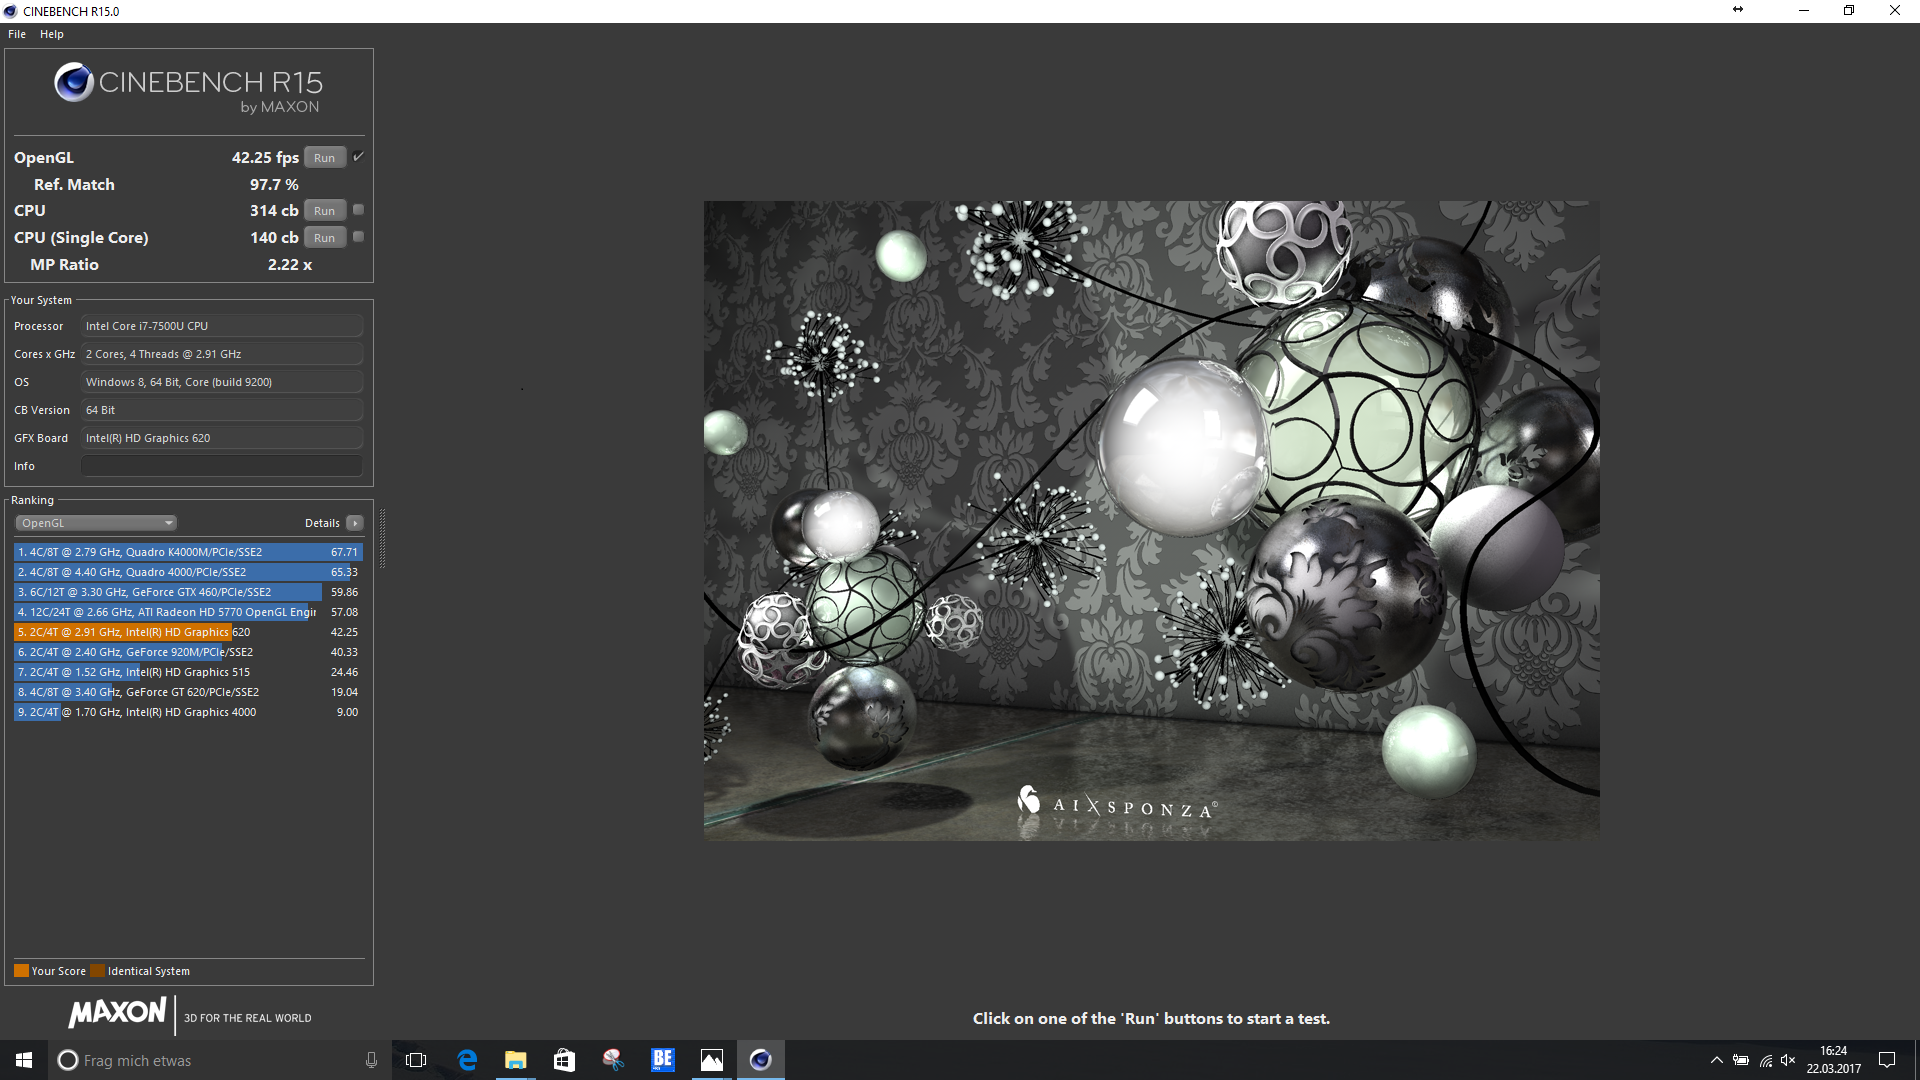
| Cinebench R15 | |
| CPU Single 64Bit | |
| HP Spectre 13-v131ng | |
| Apple MacBook Pro 13 2016 (2.9 GHz) | |
| HP Spectre 13 | |
| Dell XPS 13 9360 FHD i5 | |
| HP EliteBook 1030 G1-X2F03EA | |
| Asus Zenbook UX305CA-FB055T | |
| CPU Multi 64Bit | |
| Apple MacBook Pro 13 2016 (2.9 GHz) | |
| Dell XPS 13 9360 FHD i5 | |
| HP Spectre 13-v131ng | |
| HP EliteBook 1030 G1-X2F03EA | |
| HP Spectre 13 | |
| Asus Zenbook UX305CA-FB055T | |
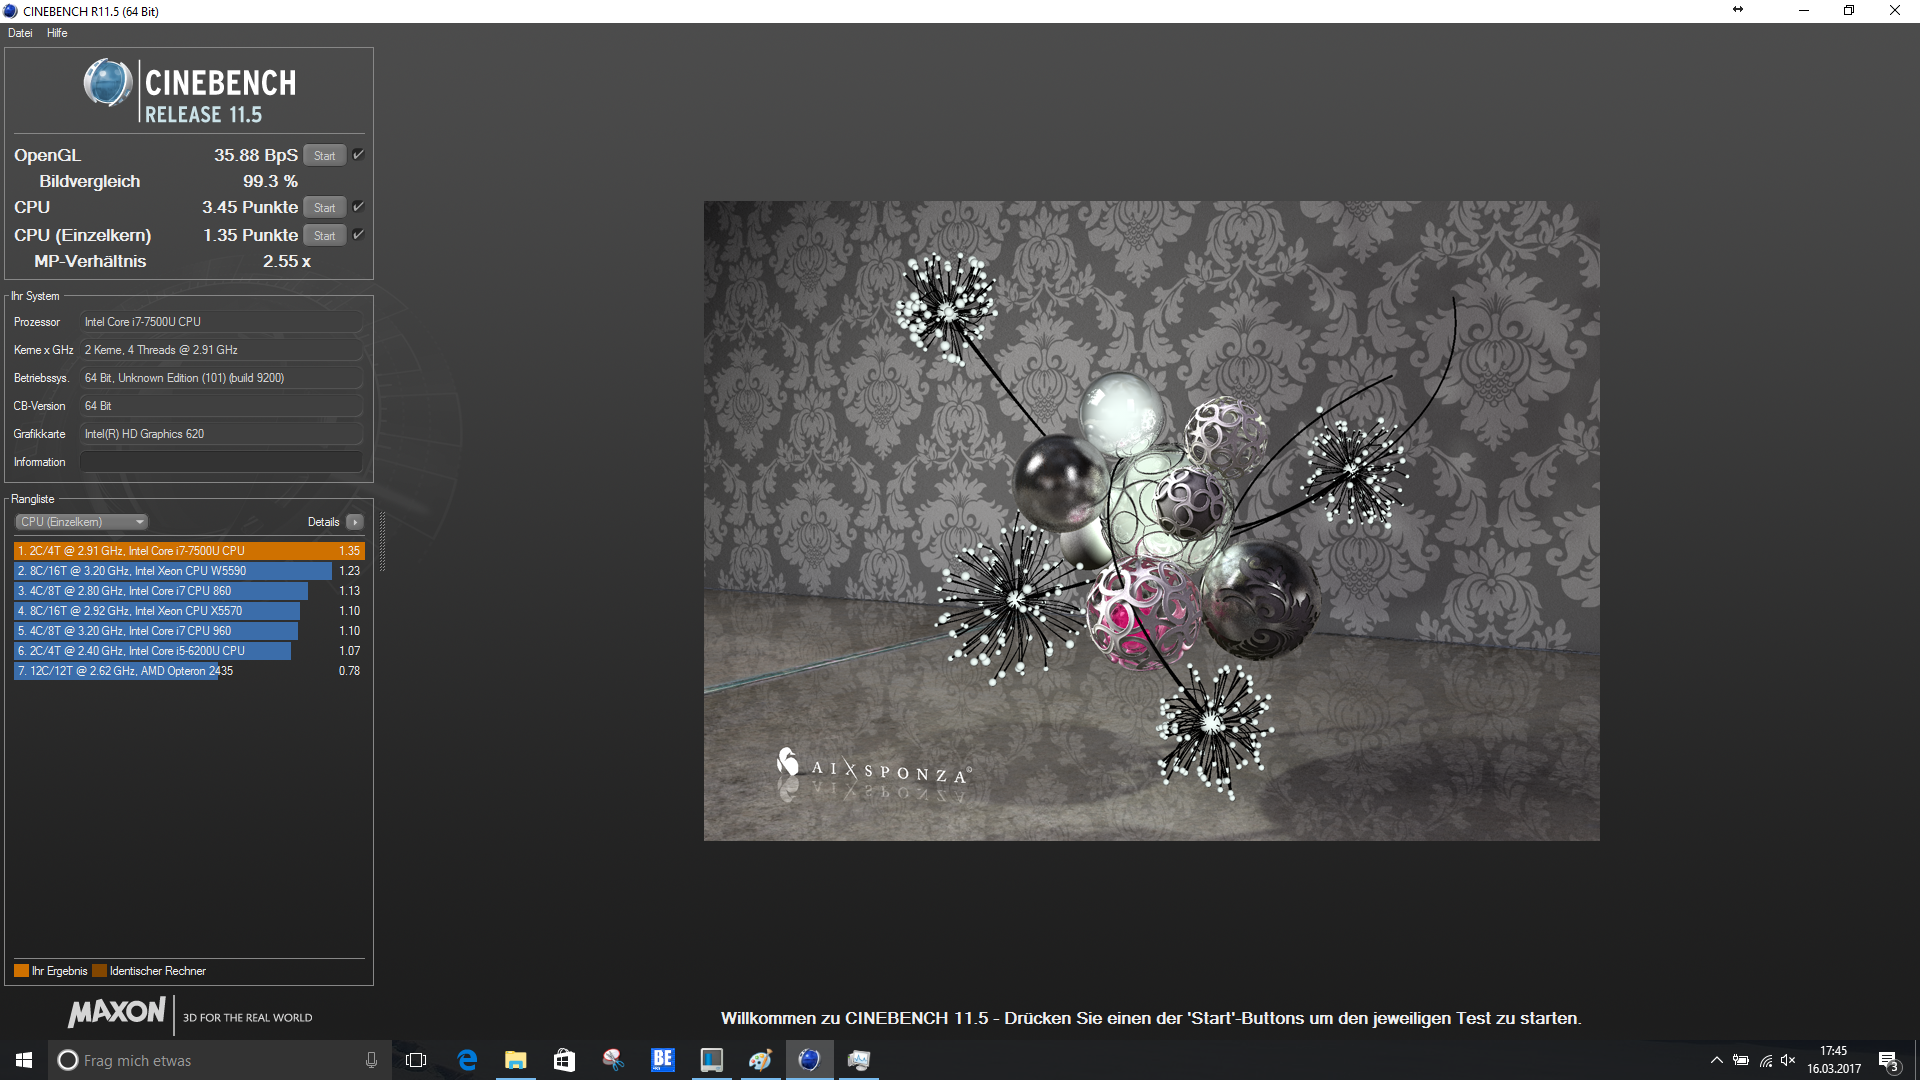
| Cinebench R11.5 | |
| CPU Single 64Bit | |
| Dell XPS 13 9360 FHD i5 | |
| HP Spectre 13 | |
| HP EliteBook 1030 G1-X2F03EA | |
| HP Spectre 13-v131ng | |
| Asus Zenbook UX305CA-FB055T | |
| CPU Multi 64Bit | |
| Dell XPS 13 9360 FHD i5 | |
| HP Spectre 13-v131ng | |
| HP EliteBook 1030 G1-X2F03EA | |
| HP Spectre 13 | |
| Asus Zenbook UX305CA-FB055T | |
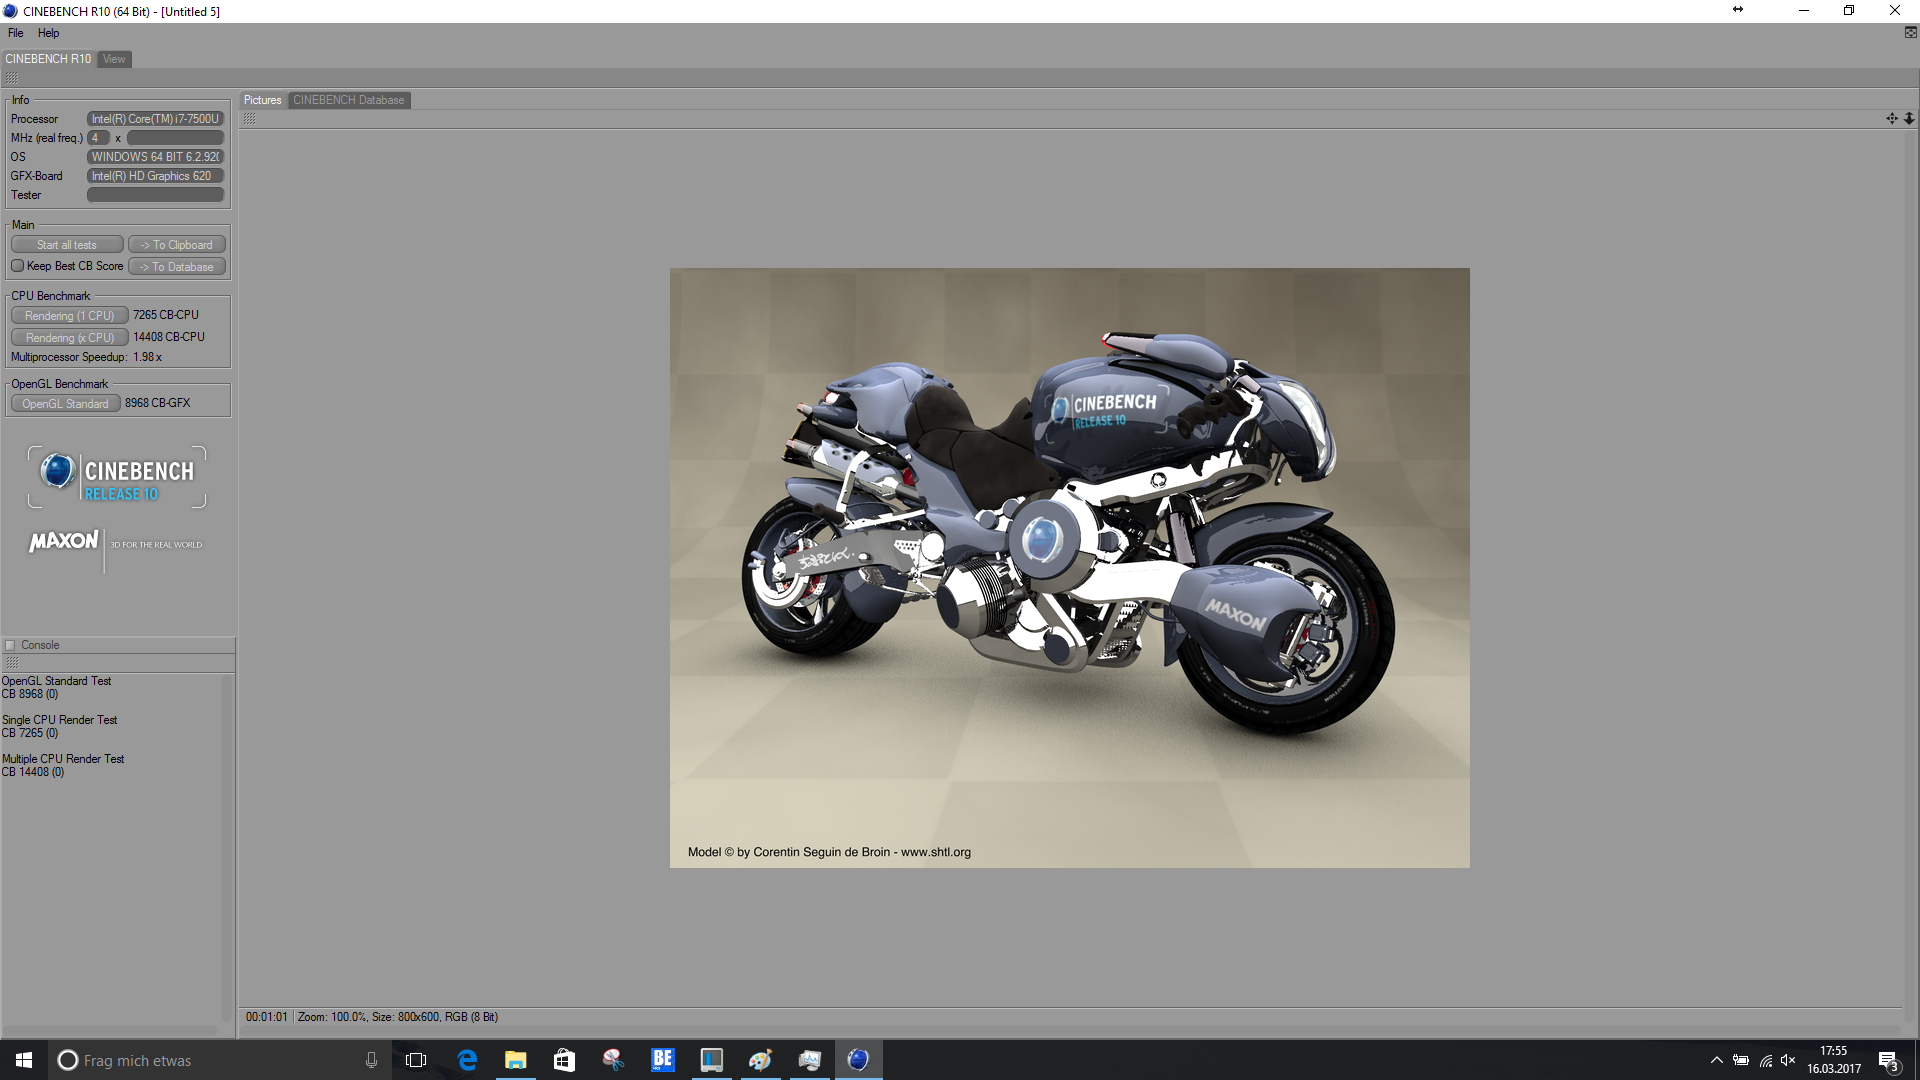
| Cinebench R10 | |
| Rendering Single CPUs 64Bit | |
| HP Spectre 13-v131ng | |
| Rendering Multiple CPUs 64Bit | |
| HP Spectre 13-v131ng | |
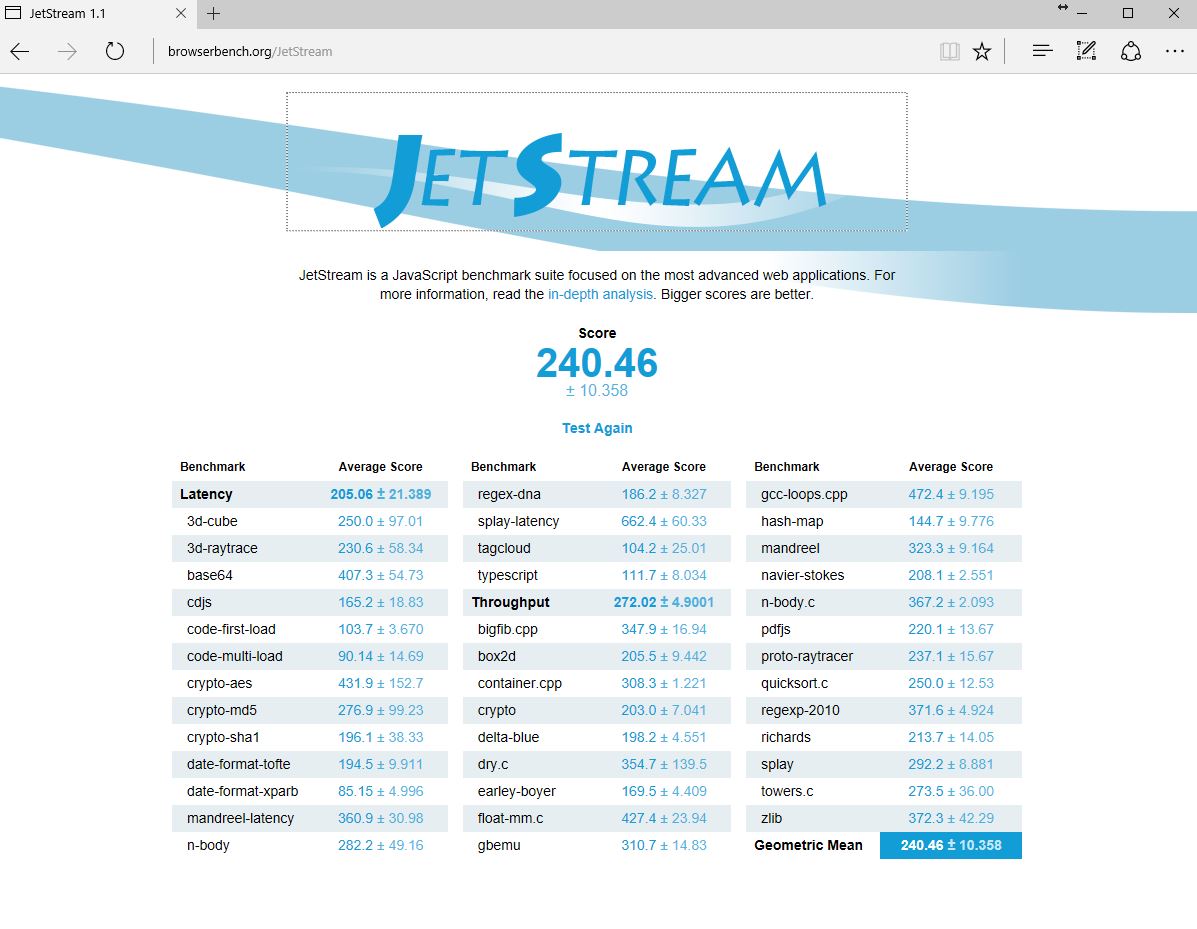
| JetStream 1.1 - 1.1 Total | |
| HP Spectre 13-v131ng | |
| Apple MacBook Pro 13 2016 (2.9 GHz) | |
| Apple MacBook Pro 13 2016 (2.9 GHz) | |
| HP EliteBook 1030 G1-X2F03EA | |
| Asus Zenbook UX305CA-FB055T | |
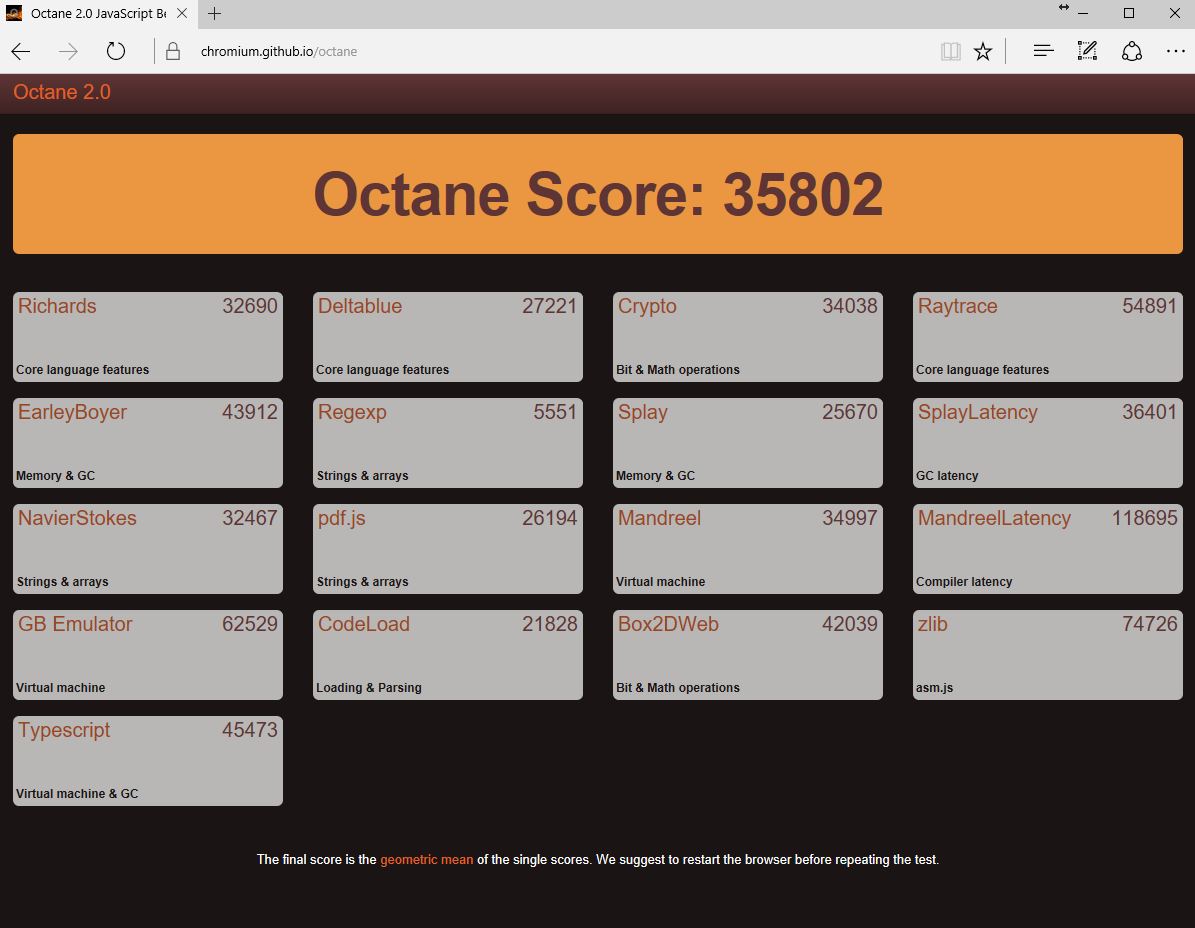
| Octane V2 - Total Score | |
| HP Spectre 13-v131ng | |
| Dell XPS 13 9360 FHD i5 | |
| HP EliteBook 1030 G1-X2F03EA | |
| Asus Zenbook UX305CA-FB055T | |
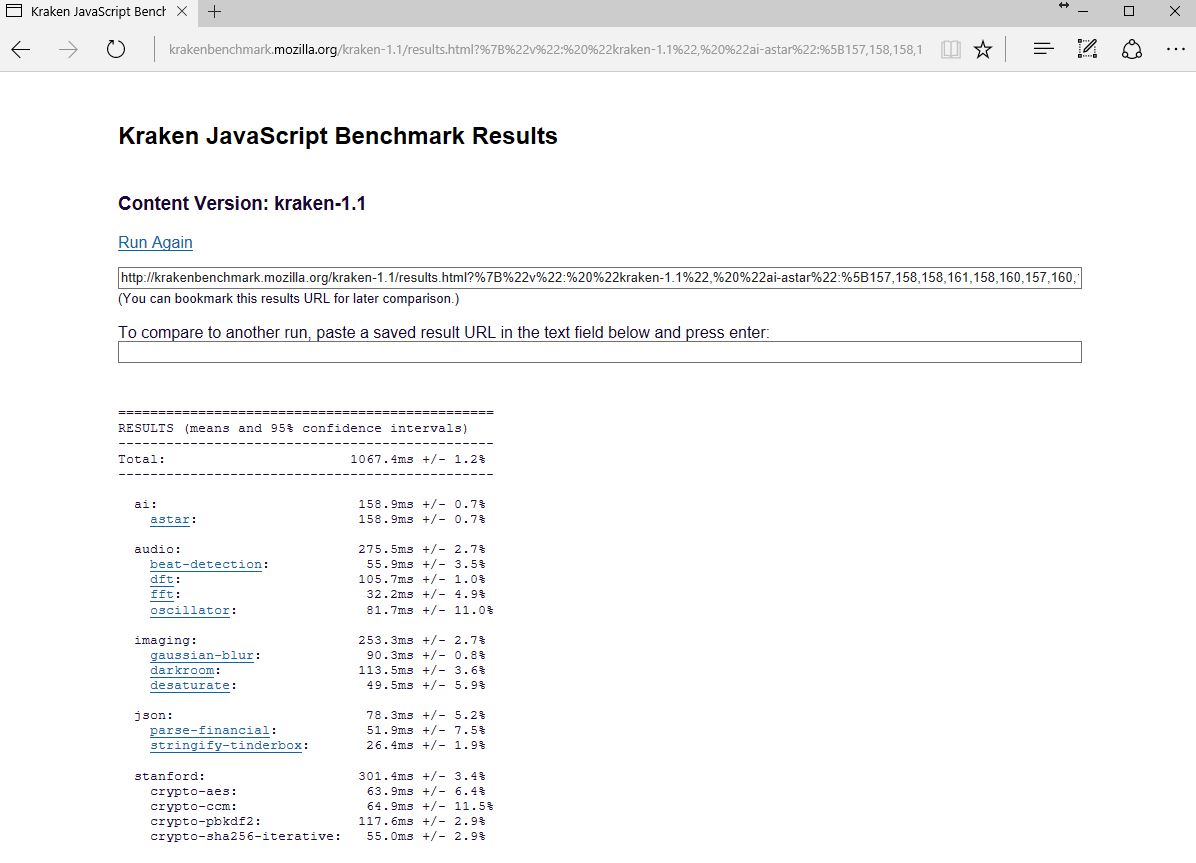
| Mozilla Kraken 1.1 - Total | |
| Asus Zenbook UX305CA-FB055T | |
| HP EliteBook 1030 G1-X2F03EA | |
| Apple MacBook Pro 13 2016 (2.9 GHz) | |
| Apple MacBook Pro 13 2016 (2.9 GHz) | |
| HP Spectre 13-v131ng | |
* ... mindre är bättre
| PCMark 8 | |
| Home Score Accelerated v2 | |
| HP Spectre 13-v131ng | |
| Apple MacBook Pro 13 2016 (2.9 GHz) | |
| HP Spectre 13 | |
| Dell XPS 13 9360 FHD i5 | |
| HP EliteBook 1030 G1-X2F03EA | |
| Asus Zenbook UX305CA-FB055T | |
| Work Score Accelerated v2 | |
| HP Spectre 13-v131ng | |
| Dell XPS 13 9360 FHD i5 | |
| HP Spectre 13 | |
| Apple MacBook Pro 13 2016 (2.9 GHz) | |
| HP EliteBook 1030 G1-X2F03EA | |
| Asus Zenbook UX305CA-FB055T | |
| Creative Score Accelerated v2 | |
| HP Spectre 13-v131ng | |
| HP Spectre 13 | |
| Dell XPS 13 9360 FHD i5 | |
| HP EliteBook 1030 G1-X2F03EA | |
| Asus Zenbook UX305CA-FB055T | |
| PCMark 7 | |
| Score | |
| HP Spectre 13-v131ng | |
| HP EliteBook 1030 G1-X2F03EA | |
| Asus Zenbook UX305CA-FB055T | |
| Productivity | |
| HP Spectre 13-v131ng | |
| Asus Zenbook UX305CA-FB055T | |
| HP EliteBook 1030 G1-X2F03EA | |
| PCMark Vantage Result | 17414 poäng | |
| PCMark 7 Score | 5610 poäng | |
| PCMark 8 Home Score Accelerated v2 | 3789 poäng | |
| PCMark 8 Creative Score Accelerated v2 | 4655 poäng | |
| PCMark 8 Work Score Accelerated v2 | 5053 poäng | |
Hjälp | ||
| HP Spectre 13-v131ng Samsung PM961 NVMe MZVLW512HMJP | HP Spectre 13 Samsung PM951 NVMe MZVLV256 | Apple MacBook Pro 13 2016 (2.9 GHz) Apple SSD AP0256 | Dell XPS 13 9360 FHD i5 Toshiba NVMe THNSN5256GPUK | Asus Zenbook UX305CA-FB055T Micron M600 MTFDDAV512MBF M.2 | HP EliteBook 1030 G1-X2F03EA Sandisk X300 SD7SN6S-512G-1006 | |
|---|---|---|---|---|---|---|
| CrystalDiskMark 3.0 | -28% | 9% | -19% | -49% | -56% | |
| Read Seq (MB/s) | 1090 | 1322 21% | 1662 52% | 1233 13% | 475.2 -56% | 387.5 -64% |
| Write Seq (MB/s) | 1088 | 305.5 -72% | 1336 23% | 733 -33% | 423.7 -61% | 348.7 -68% |
| Read 512 (MB/s) | 753 | 621 -18% | 1183 57% | 1036 38% | 404.8 -46% | 239.9 -68% |
| Write 512 (MB/s) | 911 | 306 -66% | 1481 63% | 439.9 -52% | 396.2 -57% | 335.3 -63% |
| Read 4k (MB/s) | 57.5 | 40.09 -30% | 16.1 -72% | 29.31 -49% | 28.57 -50% | 30.34 -47% |
| Write 4k (MB/s) | 140.2 | 119 -15% | 23.5 -83% | 116.9 -17% | 90.7 -35% | 75.9 -46% |
| Read 4k QD32 (MB/s) | 497.1 | 513 3% | 657 32% | 479.2 -4% | 288.9 -42% | 311.3 -37% |
| Write 4k QD32 (MB/s) | 416 | 231.5 -44% | 419 1% | 218.3 -48% | 242.3 -42% | 192.8 -54% |


| 3DMark | |
| 1280x720 Cloud Gate Standard Graphics | |
| Apple MacBook Pro 13 2016 (2.9 GHz) | |
| Dell XPS 13 9360 FHD i5 | |
| HP Spectre 13-v131ng | |
| HP Spectre 13 | |
| HP EliteBook 1030 G1-X2F03EA | |
| Asus Zenbook UX305CA-FB055T | |
| 1920x1080 Fire Strike Graphics | |
| Apple MacBook Pro 13 2016 (2.9 GHz) | |
| Dell XPS 13 9360 FHD i5 | |
| HP Spectre 13-v131ng | |
| HP Spectre 13 | |
| HP EliteBook 1030 G1-X2F03EA | |
| Asus Zenbook UX305CA-FB055T | |
| 3DMark 11 - 1280x720 Performance GPU | |
| Apple MacBook Pro 13 2016 (2.9 GHz) | |
| HP Spectre 13-v131ng | |
| Dell XPS 13 9360 FHD i5 | |
| HP Spectre 13 | |
| HP EliteBook 1030 G1-X2F03EA | |
| Asus Zenbook UX305CA-FB055T | |
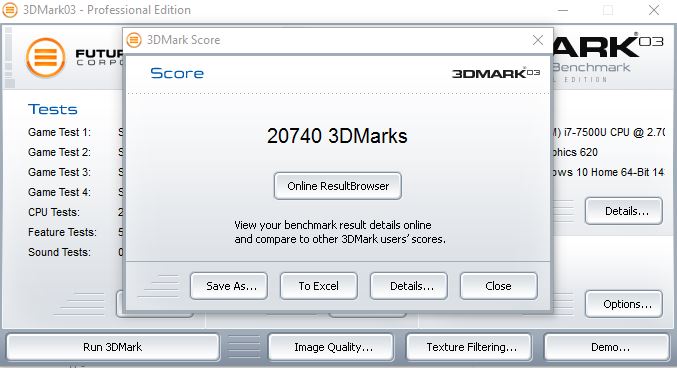
| 3DMark 03 Standard | 20740 poäng | |
| 3DMark 05 Standard | 11865 poäng | |
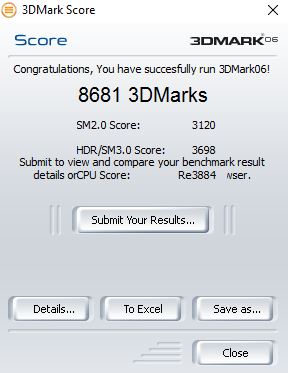
| 3DMark 06 Standard Score | 8681 poäng | |
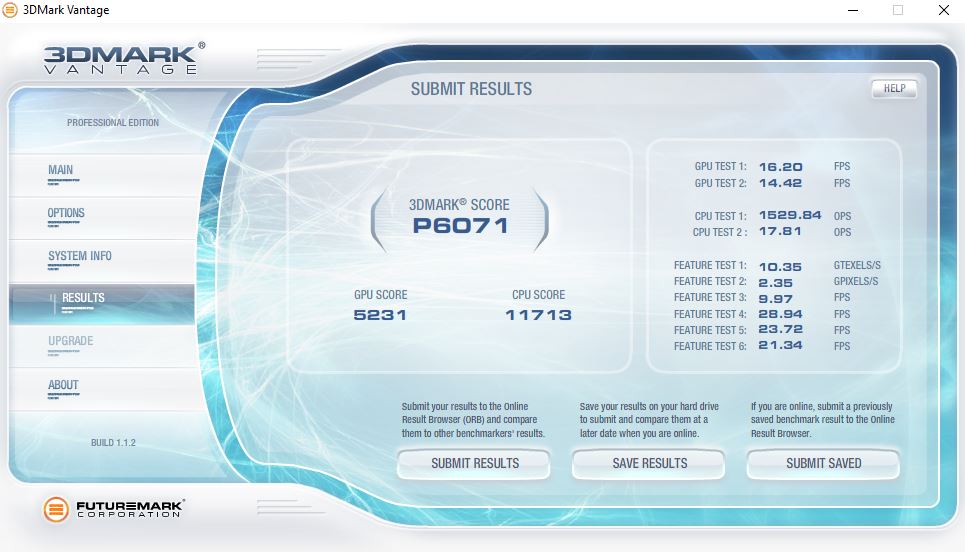
| 3DMark Vantage P Result | 6071 poäng | |
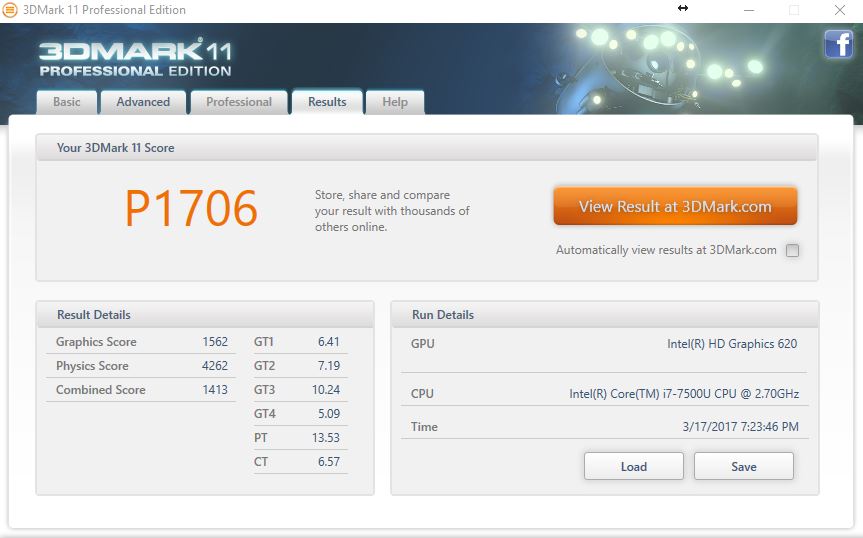
| 3DMark 11 Performance | 1706 poäng | |
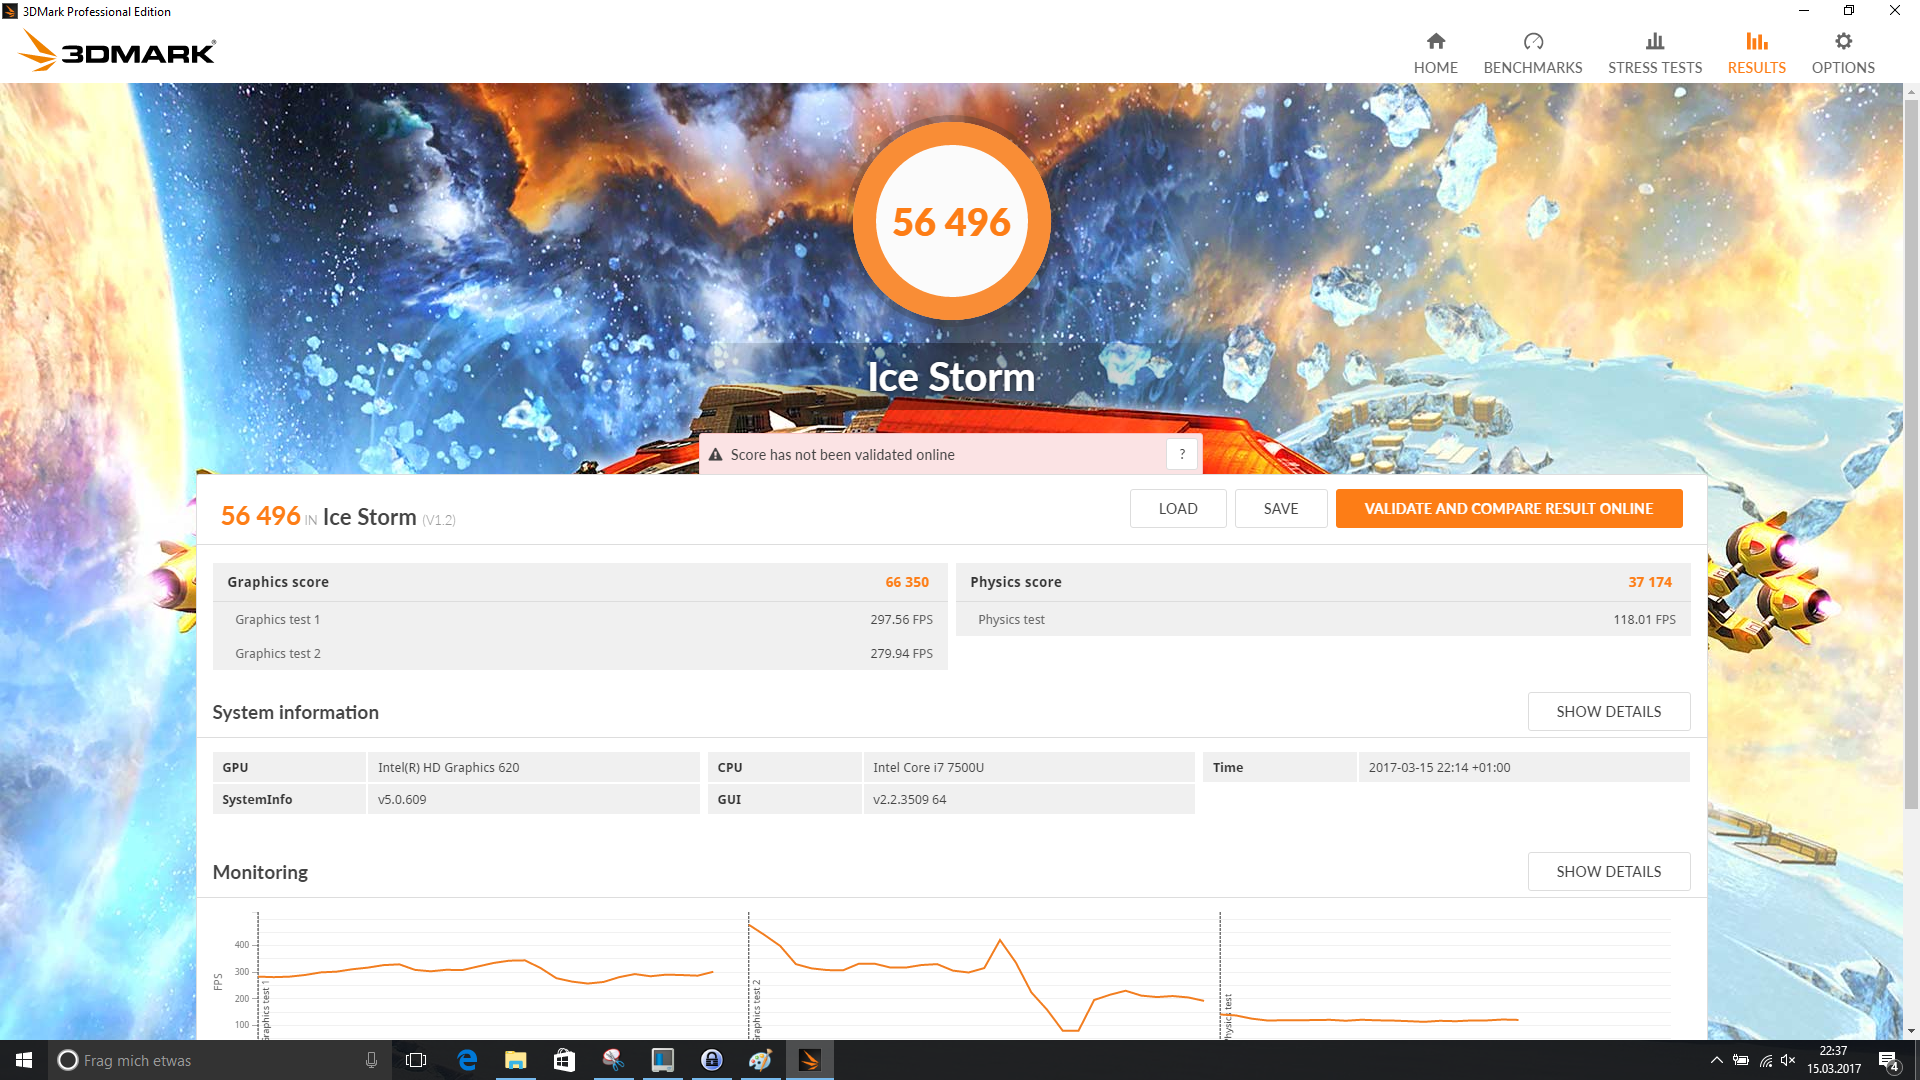
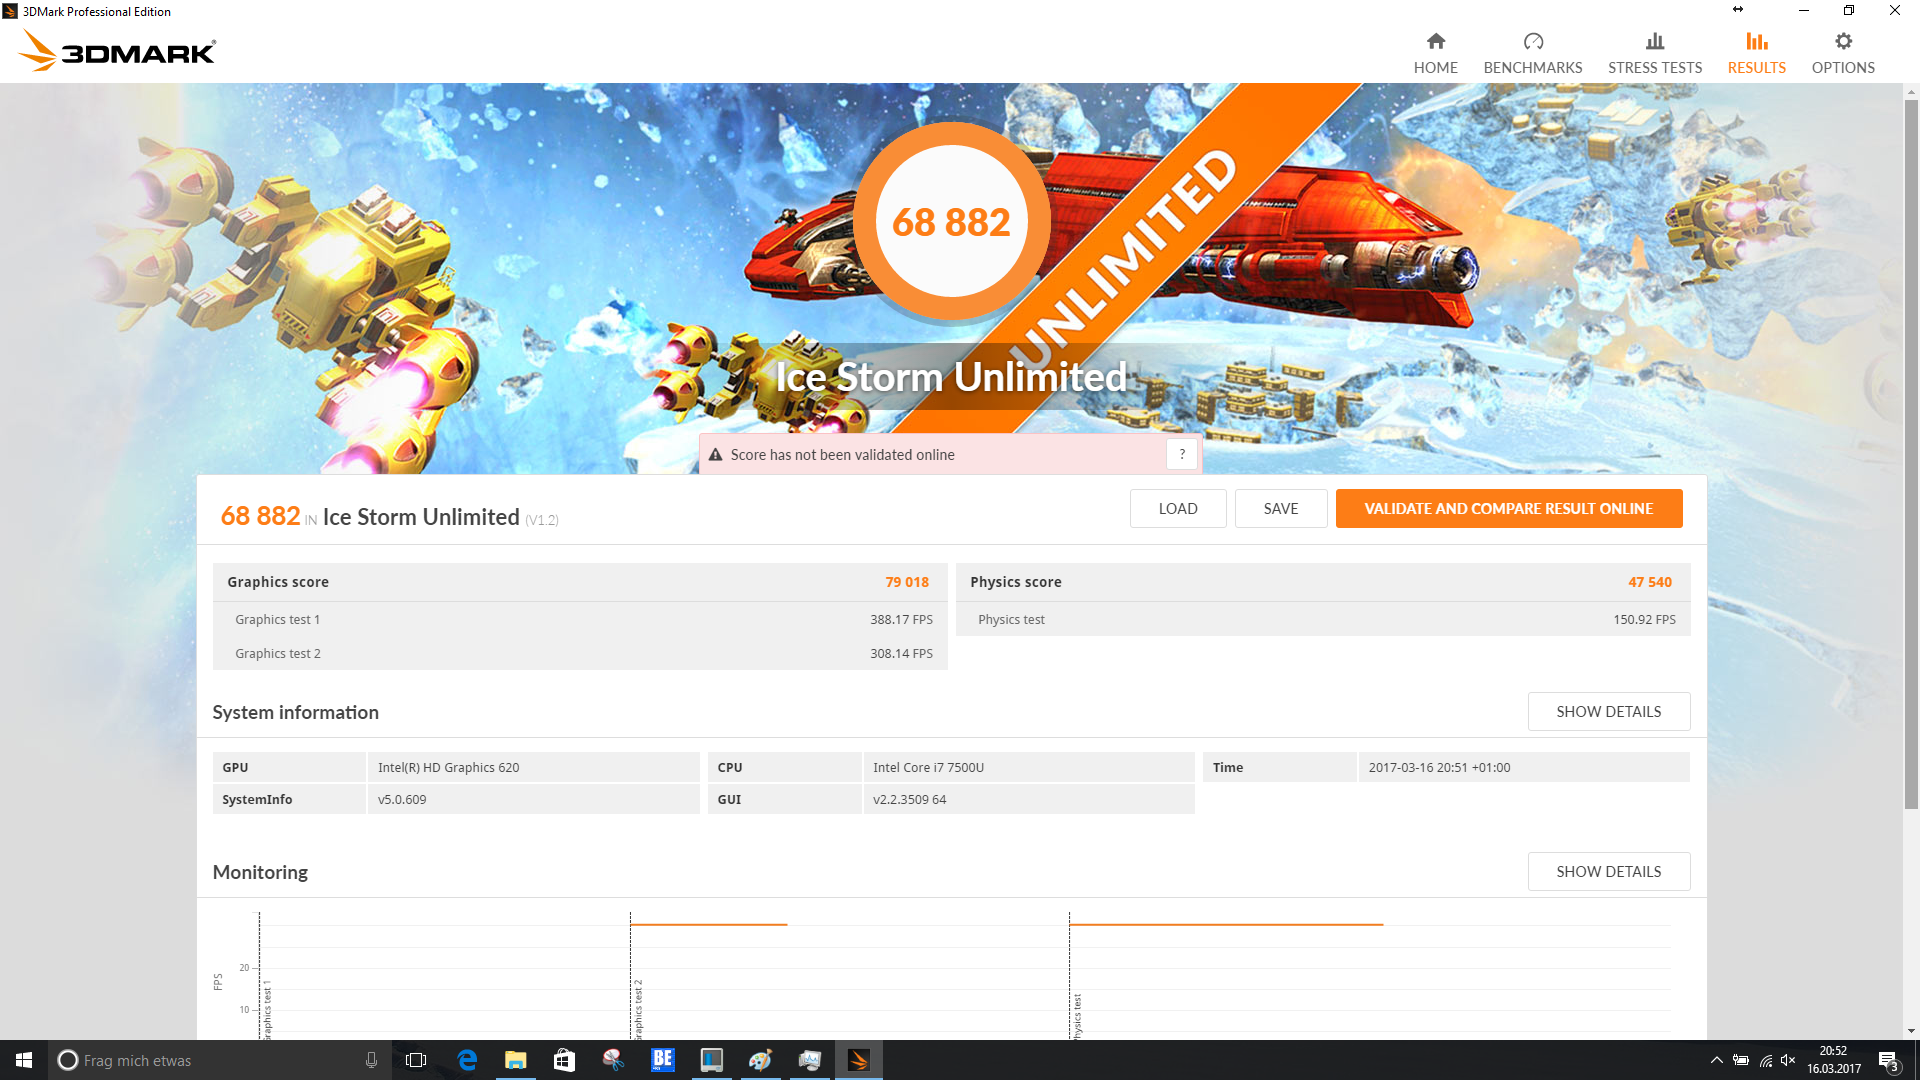
| 3DMark Ice Storm Standard Score | 56496 poäng | |
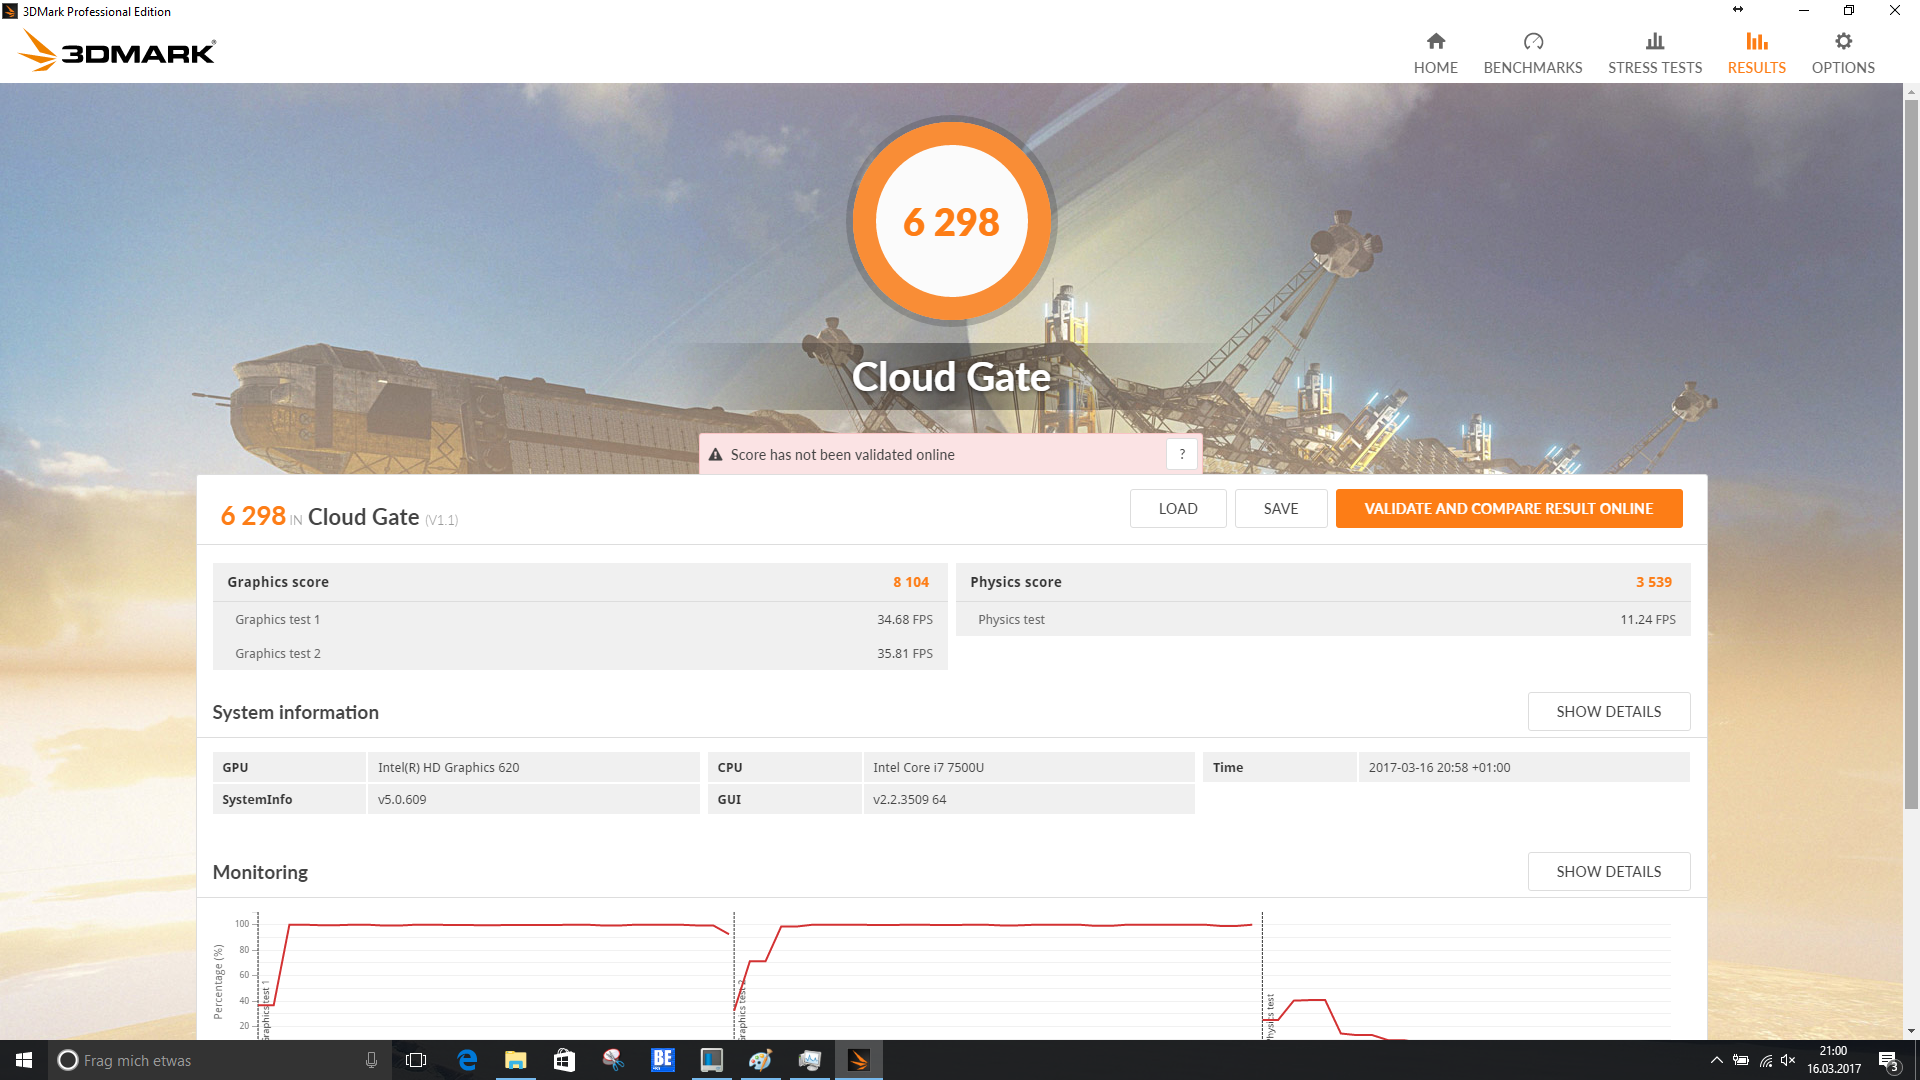
| 3DMark Cloud Gate Standard Score | 6298 poäng | |
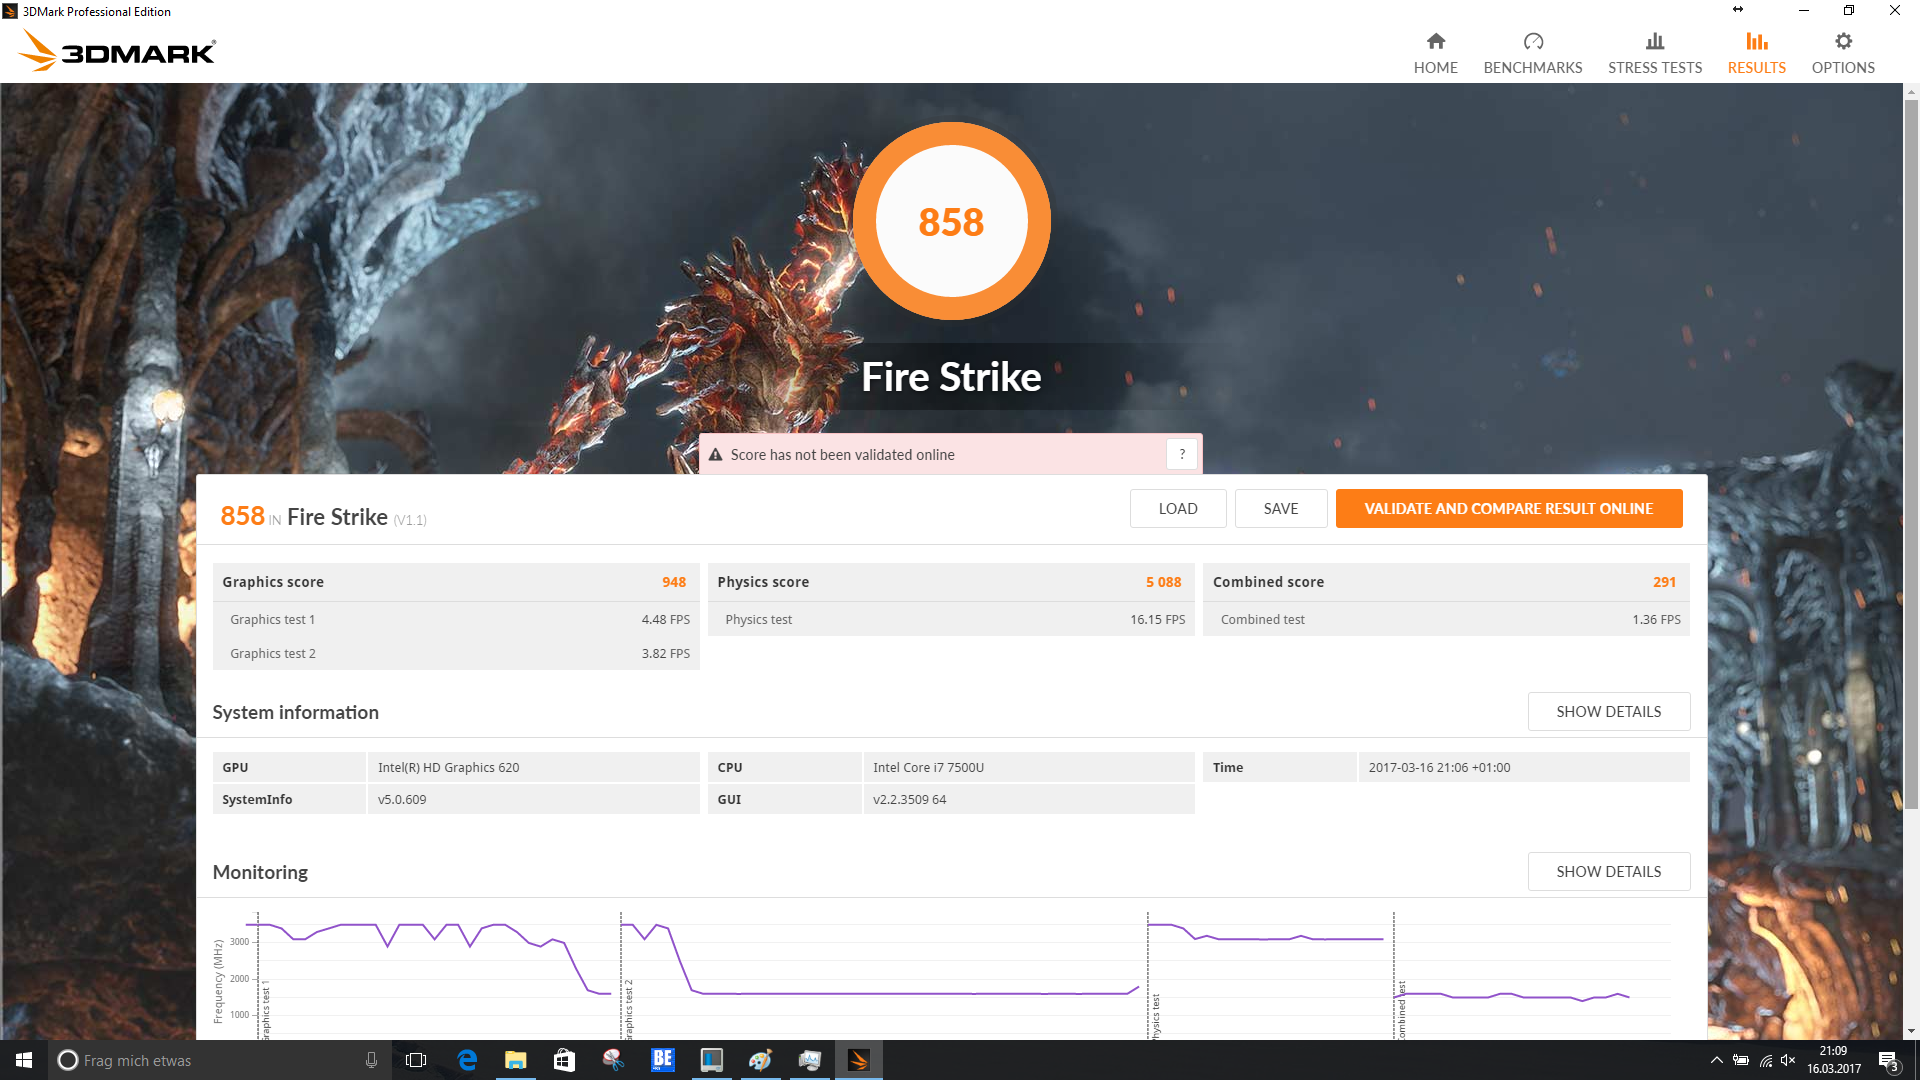
| 3DMark Fire Strike Score | 858 poäng | |
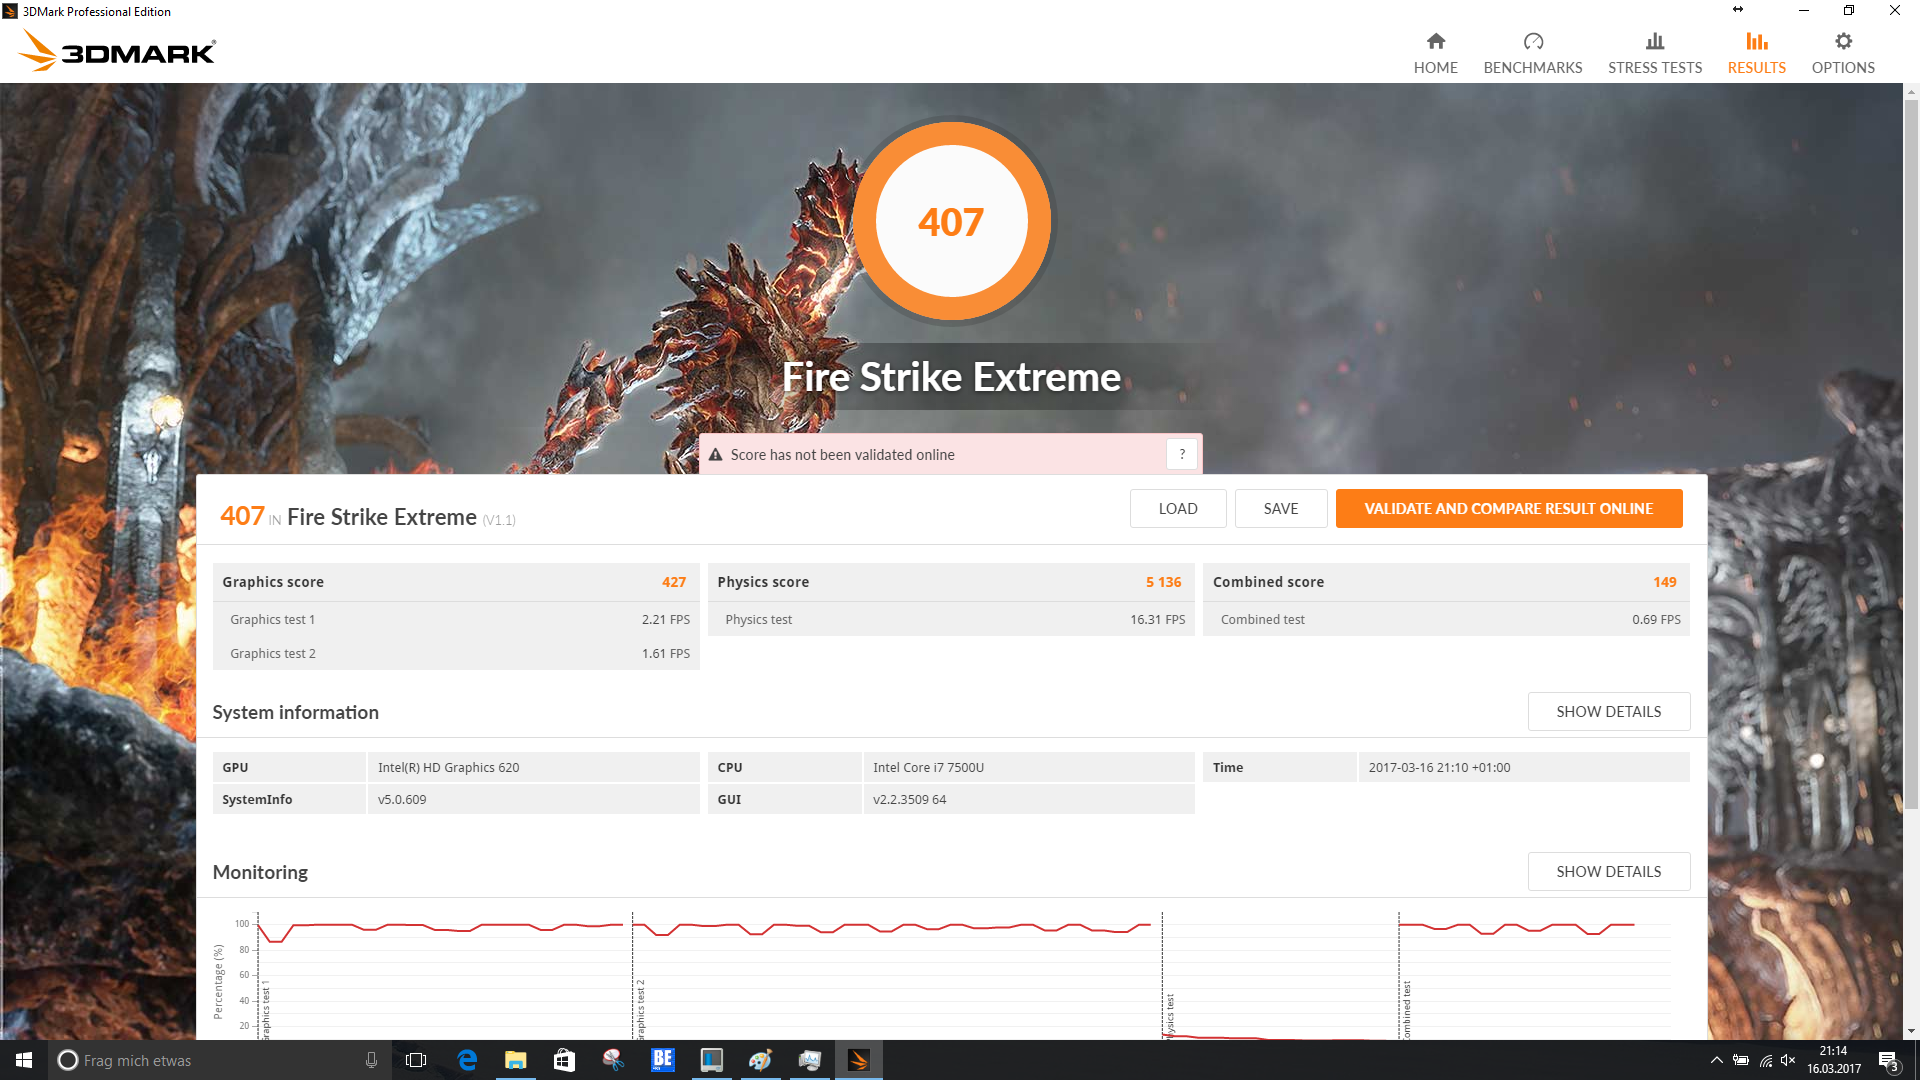
| 3DMark Fire Strike Extreme Score | 407 poäng | |
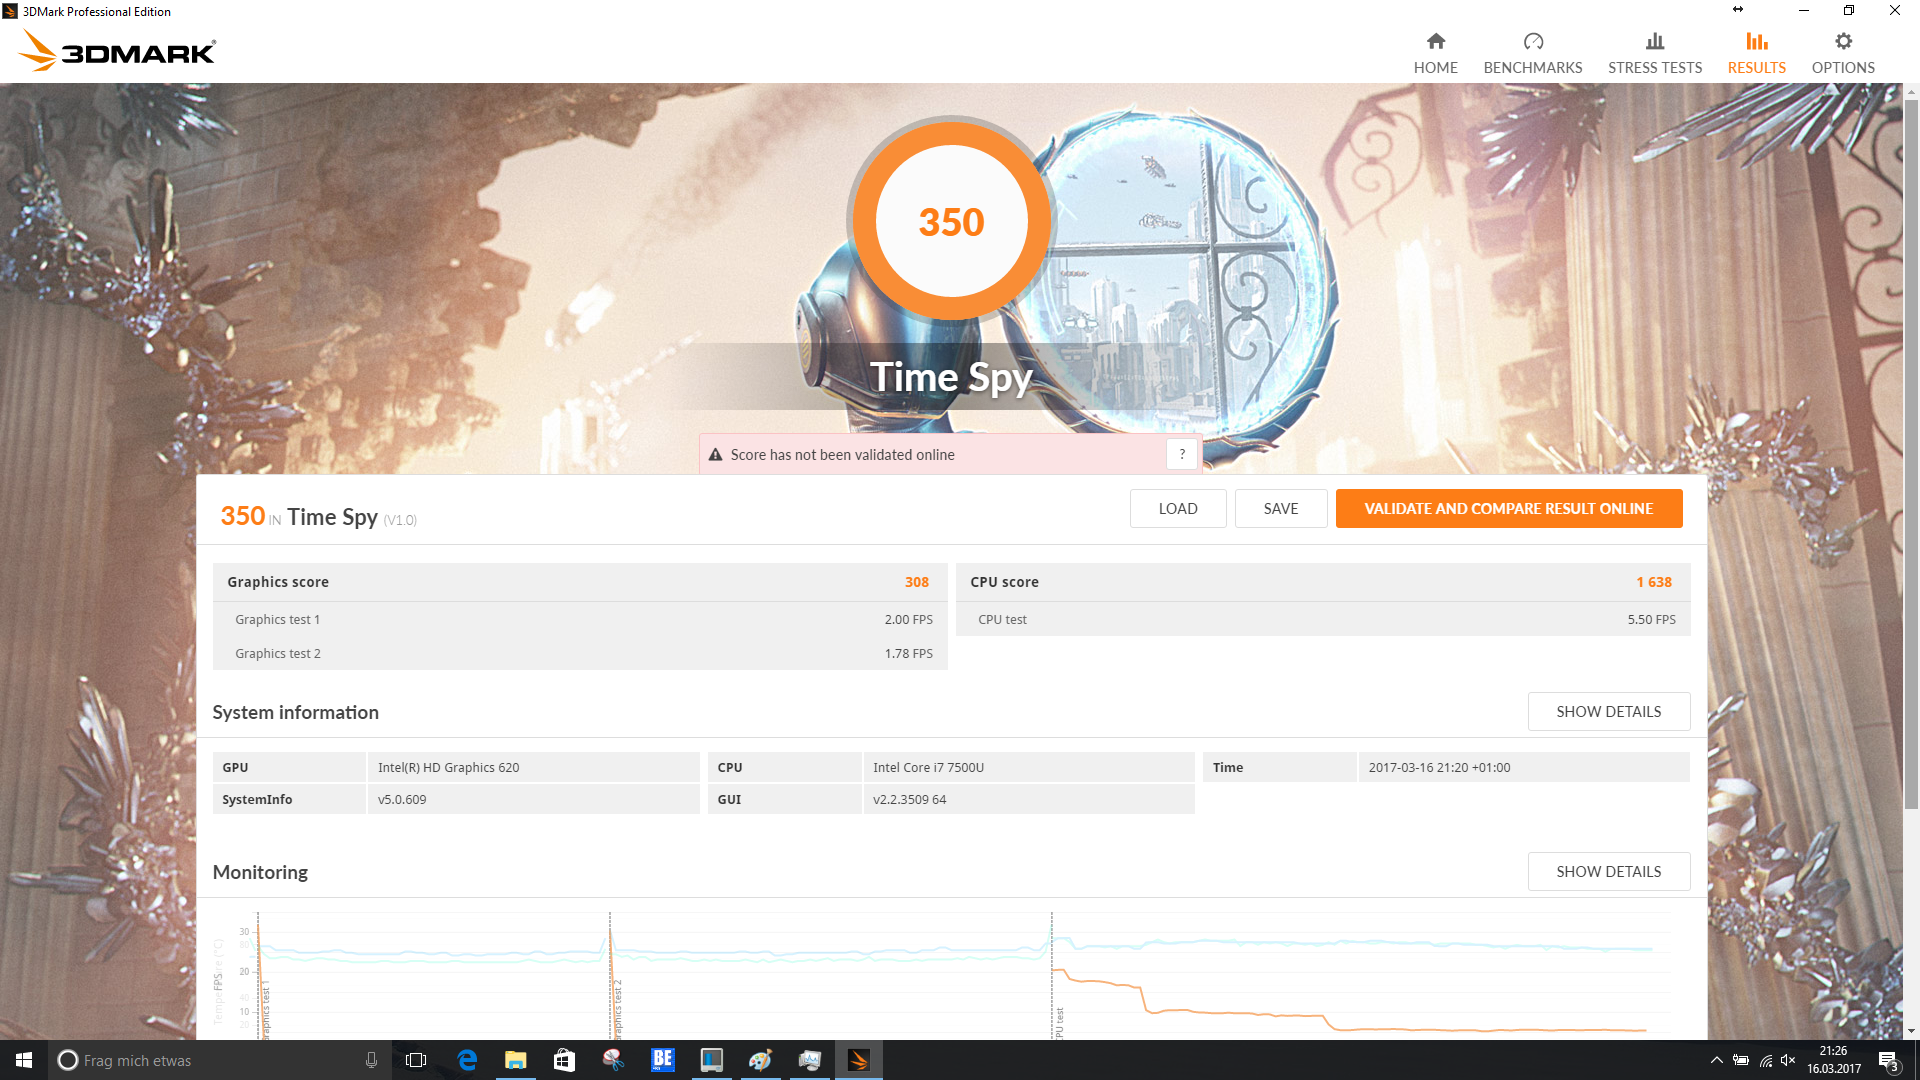
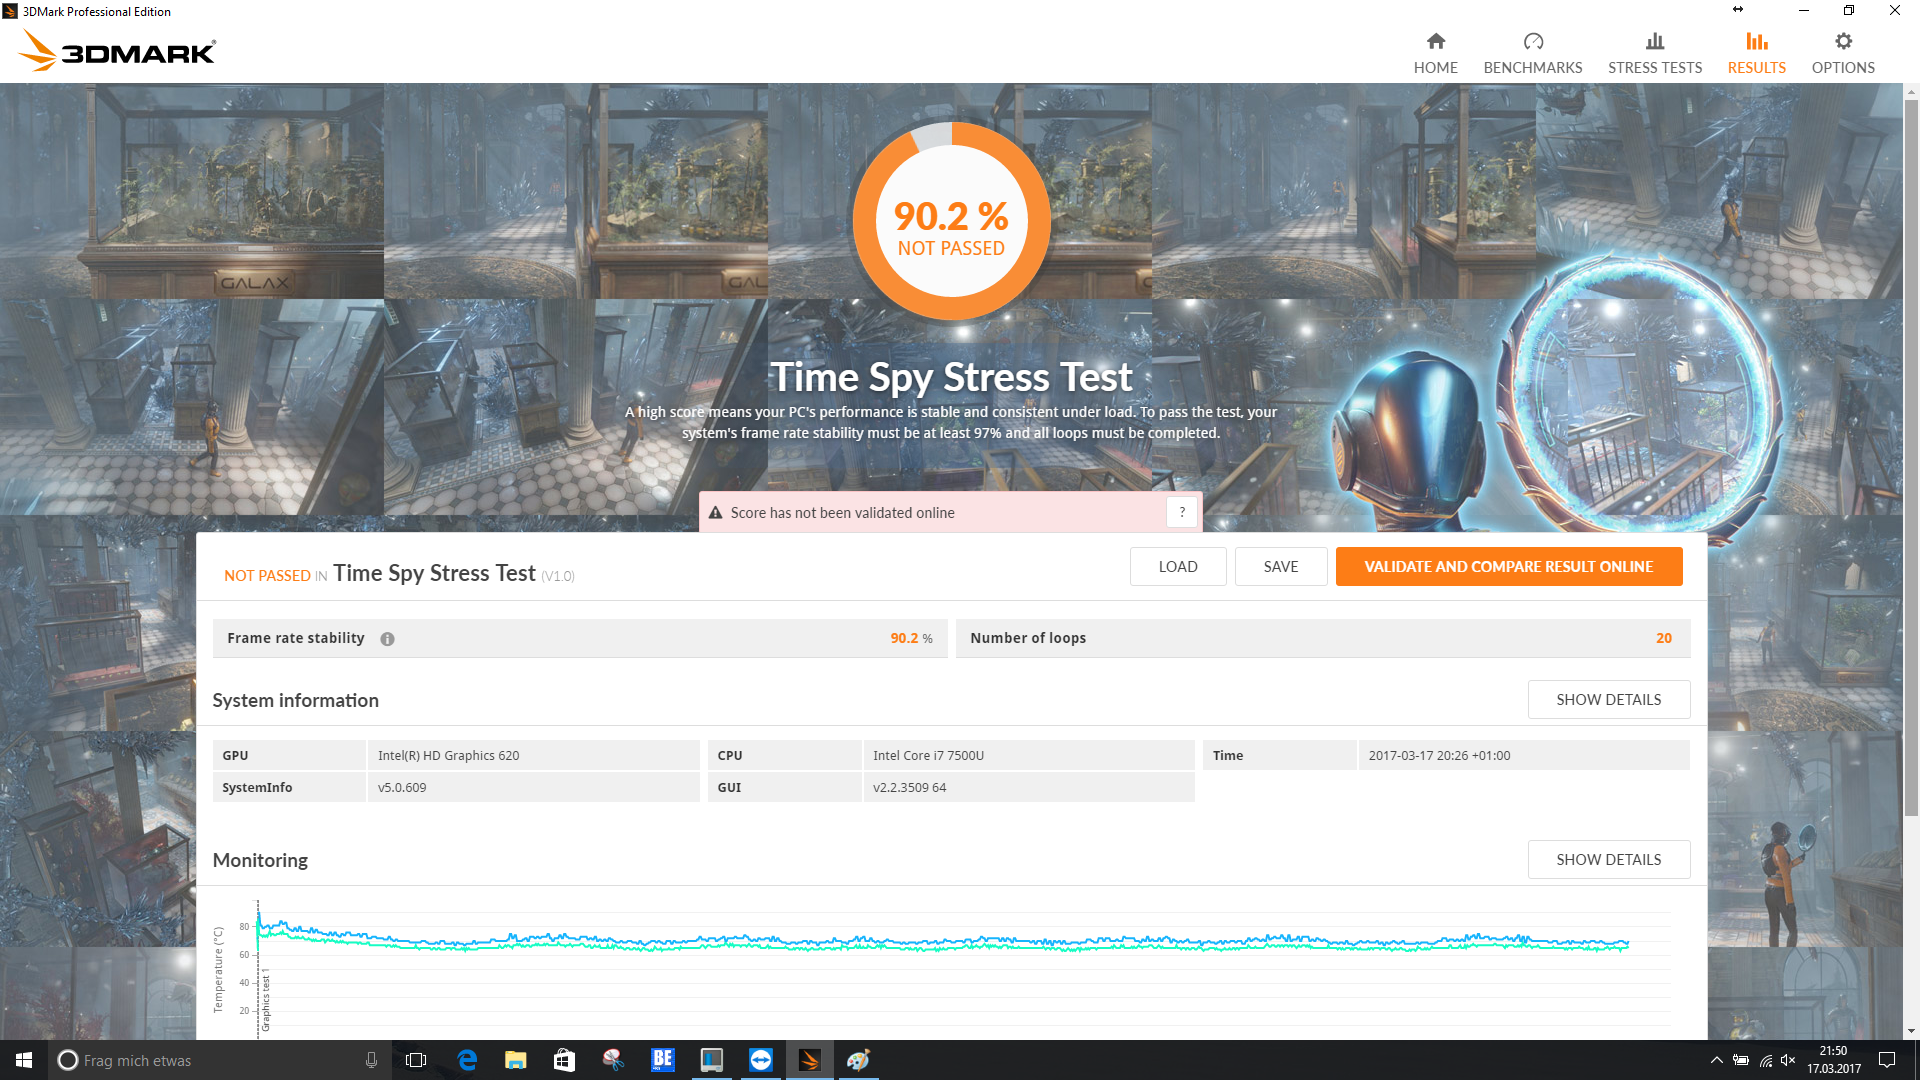
| 3DMark Time Spy Score | 350 poäng | |
Hjälp | ||
| låg | med. | hög | ultra | |
|---|---|---|---|---|
| BioShock Infinite (2013) | 46.9 | 29.3 | 24.6 | 7.8 |
| Battlefield 4 (2013) | 35 | 27 | 17 | 6 |
| The Witcher 3 (2015) | 13 | 9 | 4 | |
| Rise of the Tomb Raider (2016) | 15 | 8 | 6 |
Ljudnivå
| Låg belastning |
| 30.4 / 30.4 / 30.4 dB(A) |
| Hög belastning |
| 40 / 40 dB(A) |
 | ||
30 dB tyst 40 dB(A) hörbar 50 dB(A) högt ljud |
||
min: | ||
| HP Spectre 13-v131ng i7-7500U, HD Graphics 620 | HP Spectre 13 6500U, HD Graphics 520 | Apple MacBook Pro 13 2016 (2.9 GHz) 6267U, Iris Graphics 550 | Dell XPS 13 9360 FHD i5 i5-7200U, HD Graphics 620 | Asus Zenbook UX305CA-FB055T 6Y75, HD Graphics 515 | HP EliteBook 1030 G1-X2F03EA 6Y75, HD Graphics 515 | |
|---|---|---|---|---|---|---|
| Noise | 1% | 5% | 11% | 5% | ||
| av / miljö * (dB) | 30.4 | 28.5 6% | 30.2 1% | 31.3 -3% | ||
| Idle Minimum * (dB) | 30.4 | 28.5 6% | 30.2 1% | 28.9 5% | 31.3 -3% | |
| Idle Average * (dB) | 30.4 | 30.9 -2% | 30.2 1% | 28.9 5% | 31.3 -3% | |
| Idle Maximum * (dB) | 30.4 | 31.6 -4% | 30.2 1% | 28.9 5% | 31.3 -3% | |
| Load Average * (dB) | 40 | 38.8 3% | 33 17% | 30.9 23% | 31.3 22% | |
| Load Maximum * (dB) | 40 | 41.4 -3% | 36.2 9% | 33.5 16% | 31.3 22% |
* ... mindre är bättre

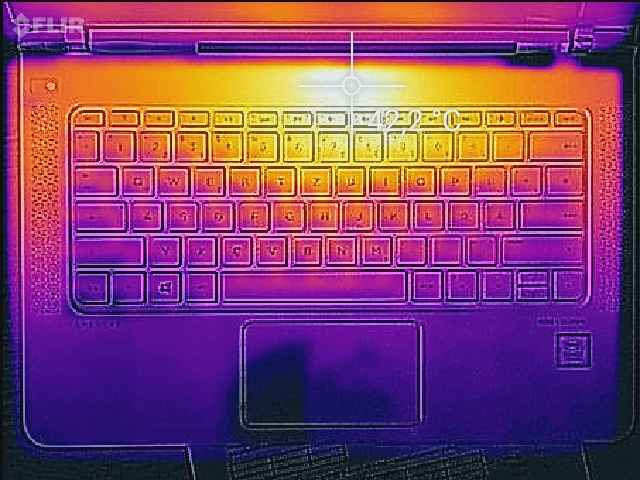
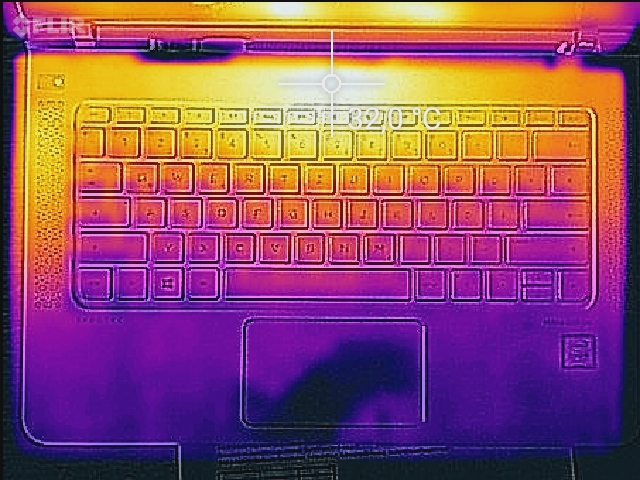
(-) Den maximala temperaturen på ovansidan är 54.2 °C / 130 F, jämfört med genomsnittet av 35.9 °C / 97 F , allt från 21.4 till 59 °C för klassen Subnotebook.
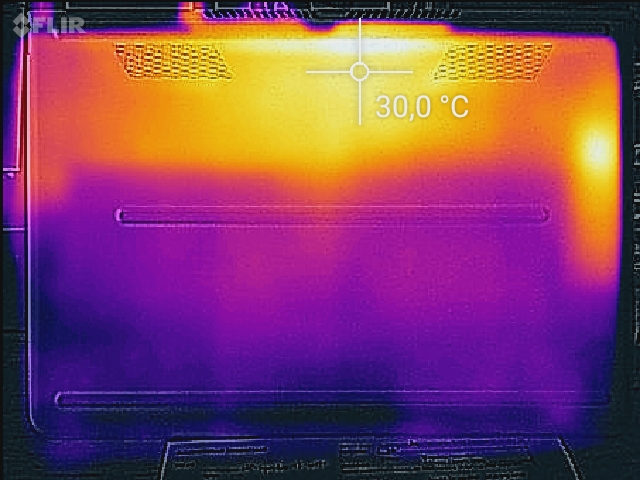
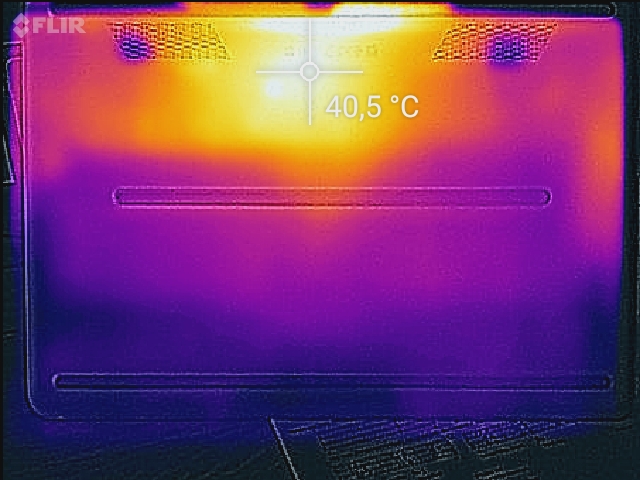
(+) Botten värms upp till maximalt 37.7 °C / 100 F, jämfört med genomsnittet av 39.2 °C / 103 F
(+) Vid tomgångsbruk är medeltemperaturen för ovansidan 24.9 °C / 77 F, jämfört med enhetsgenomsnittet på 30.8 °C / ### class_avg_f### F.
(+) Handledsstöden och pekplattan är kallare än hudtemperaturen med maximalt 24 °C / 75.2 F och är därför svala att ta på.
(+) Medeltemperaturen för handledsstödsområdet på liknande enheter var 28.2 °C / 82.8 F (+4.2 °C / 7.6 F).
| HP Spectre 13-v131ng i7-7500U, HD Graphics 620 | HP Spectre 13 6500U, HD Graphics 520 | Apple MacBook Pro 13 2016 (2.9 GHz) 6267U, Iris Graphics 550 | Dell XPS 13 9360 FHD i5 i5-7200U, HD Graphics 620 | Asus Zenbook UX305CA-FB055T 6Y75, HD Graphics 515 | HP EliteBook 1030 G1-X2F03EA 6Y75, HD Graphics 515 | |
|---|---|---|---|---|---|---|
| Heat | -12% | 9% | 1% | 11% | -8% | |
| Maximum Upper Side * (°C) | 54.2 | 45.2 17% | 45 17% | 43.4 20% | 39.1 28% | 43.4 20% |
| Maximum Bottom * (°C) | 37.7 | 50.2 -33% | 39 -3% | 49.2 -31% | 38.7 -3% | 44.5 -18% |
| Idle Upper Side * (°C) | 29 | 32.4 -12% | 26 10% | 26.4 9% | 26 10% | 32.6 -12% |
| Idle Bottom * (°C) | 27.6 | 33 -20% | 24 13% | 26.4 4% | 25.7 7% | 33.5 -21% |
* ... mindre är bättre
HP Spectre 13-v131ng ljudanalys
(-) | inte särskilt höga högtalare (68 dB)
Bas 100 - 315 Hz
(-) | nästan ingen bas - i genomsnitt 23.7% lägre än medianen
(±) | linjäriteten för basen är genomsnittlig (9.6% delta till föregående frekvens)
Mellan 400 - 2000 Hz
(±) | reducerade mids - i genomsnitt 5.1% lägre än median
(±) | linjäriteten för mids är genomsnittlig (7.6% delta till föregående frekvens)
Högsta 2 - 16 kHz
(±) | högre toppar - i genomsnitt 7.7% högre än medianen
(+) | toppar är linjära (3.1% delta till föregående frekvens)
Totalt 100 - 16 000 Hz
(±) | linjäriteten för det totala ljudet är genomsnittlig (28.6% skillnad mot median)
Jämfört med samma klass
» 90% av alla testade enheter i den här klassen var bättre, 2% liknande, 7% sämre
» Den bästa hade ett delta på 5%, genomsnittet var 18%, sämst var 53%
Jämfört med alla testade enheter
» 86% av alla testade enheter var bättre, 3% liknande, 11% sämre
» Den bästa hade ett delta på 4%, genomsnittet var 23%, sämst var 134%
Apple MacBook 12 (Early 2016) 1.1 GHz ljudanalys
(+) | högtalare kan spela relativt högt (83.6 dB)
Bas 100 - 315 Hz
(±) | reducerad bas - i genomsnitt 11.3% lägre än medianen
(±) | linjäriteten för basen är genomsnittlig (14.2% delta till föregående frekvens)
Mellan 400 - 2000 Hz
(+) | balanserad mellan - endast 2.4% från medianen
(+) | mids är linjära (5.5% delta till föregående frekvens)
Högsta 2 - 16 kHz
(+) | balanserade toppar - endast 2% från medianen
(+) | toppar är linjära (4.5% delta till föregående frekvens)
Totalt 100 - 16 000 Hz
(+) | det totala ljudet är linjärt (10.2% skillnad mot median)
Jämfört med samma klass
» 7% av alla testade enheter i den här klassen var bättre, 2% liknande, 90% sämre
» Den bästa hade ett delta på 5%, genomsnittet var 18%, sämst var 53%
Jämfört med alla testade enheter
» 5% av alla testade enheter var bättre, 1% liknande, 94% sämre
» Den bästa hade ett delta på 4%, genomsnittet var 23%, sämst var 134%
| Av/Standby | |
| Låg belastning | |
| Hög belastning |
|
Förklaring:
min: | |
| HP Spectre 13-v131ng i7-7500U, HD Graphics 620 | HP Spectre 13 6500U, HD Graphics 520 | Apple MacBook Pro 13 2016 (2.9 GHz) 6267U, Iris Graphics 550 | Dell XPS 13 9360 FHD i5 i5-7200U, HD Graphics 620 | Asus Zenbook UX305CA-FB055T 6Y75, HD Graphics 515 | HP EliteBook 1030 G1-X2F03EA 6Y75, HD Graphics 515 | |
|---|---|---|---|---|---|---|
| Power Consumption | -48% | -21% | 23% | 9% | -2% | |
| Idle Minimum * (Watt) | 3.6 | 8.6 -139% | 2.1 42% | 4.1 -14% | 4.2 -17% | 4 -11% |
| Idle Average * (Watt) | 6.4 | 11 -72% | 7.6 -19% | 4.2 34% | 8.4 -31% | 8 -25% |
| Idle Maximum * (Watt) | 9.2 | 11.3 -23% | 8.2 11% | 5.1 45% | 8.9 3% | 8.6 7% |
| Load Average * (Watt) | 34 | 33.8 1% | 56.4 -66% | 22.1 35% | 15.9 53% | 26.5 22% |
| Load Maximum * (Watt) | 34.4 | 36.2 -5% | 59.8 -74% | 29.4 15% | 22.5 35% | 34.8 -1% |
* ... mindre är bättre

| HP Spectre 13-v131ng i7-7500U, HD Graphics 620, 38 Wh | HP Spectre 13 6500U, HD Graphics 520, 38 Wh | Apple MacBook Pro 13 2016 (2.9 GHz) 6267U, Iris Graphics 550, 49.2 Wh | Dell XPS 13 9360 FHD i5 i5-7200U, HD Graphics 620, 60 Wh | Asus Zenbook UX305CA-FB055T 6Y75, HD Graphics 515, 45 Wh | HP EliteBook 1030 G1-X2F03EA 6Y75, HD Graphics 515, 40 Wh | |
|---|---|---|---|---|---|---|
| Batteridrifttid | -5% | 20% | 84% | 47% | 13% | |
| Reader / Idle (h) | 12 | 11.9 -1% | 21.6 80% | 16.9 41% | 10.3 -14% | |
| H.264 (h) | 6.1 | 8.1 33% | 7 15% | 6.3 3% | ||
| WiFi v1.3 (h) | 6.6 | 5.6 -15% | 9.4 42% | 11.3 71% | 6.7 2% | 5.1 -23% |
| Load (h) | 1.3 | 1.3 0% | 1.1 -15% | 2.6 100% | 3 131% | 2.4 85% |
För
Emot
Läs originaltestet på engelska här.
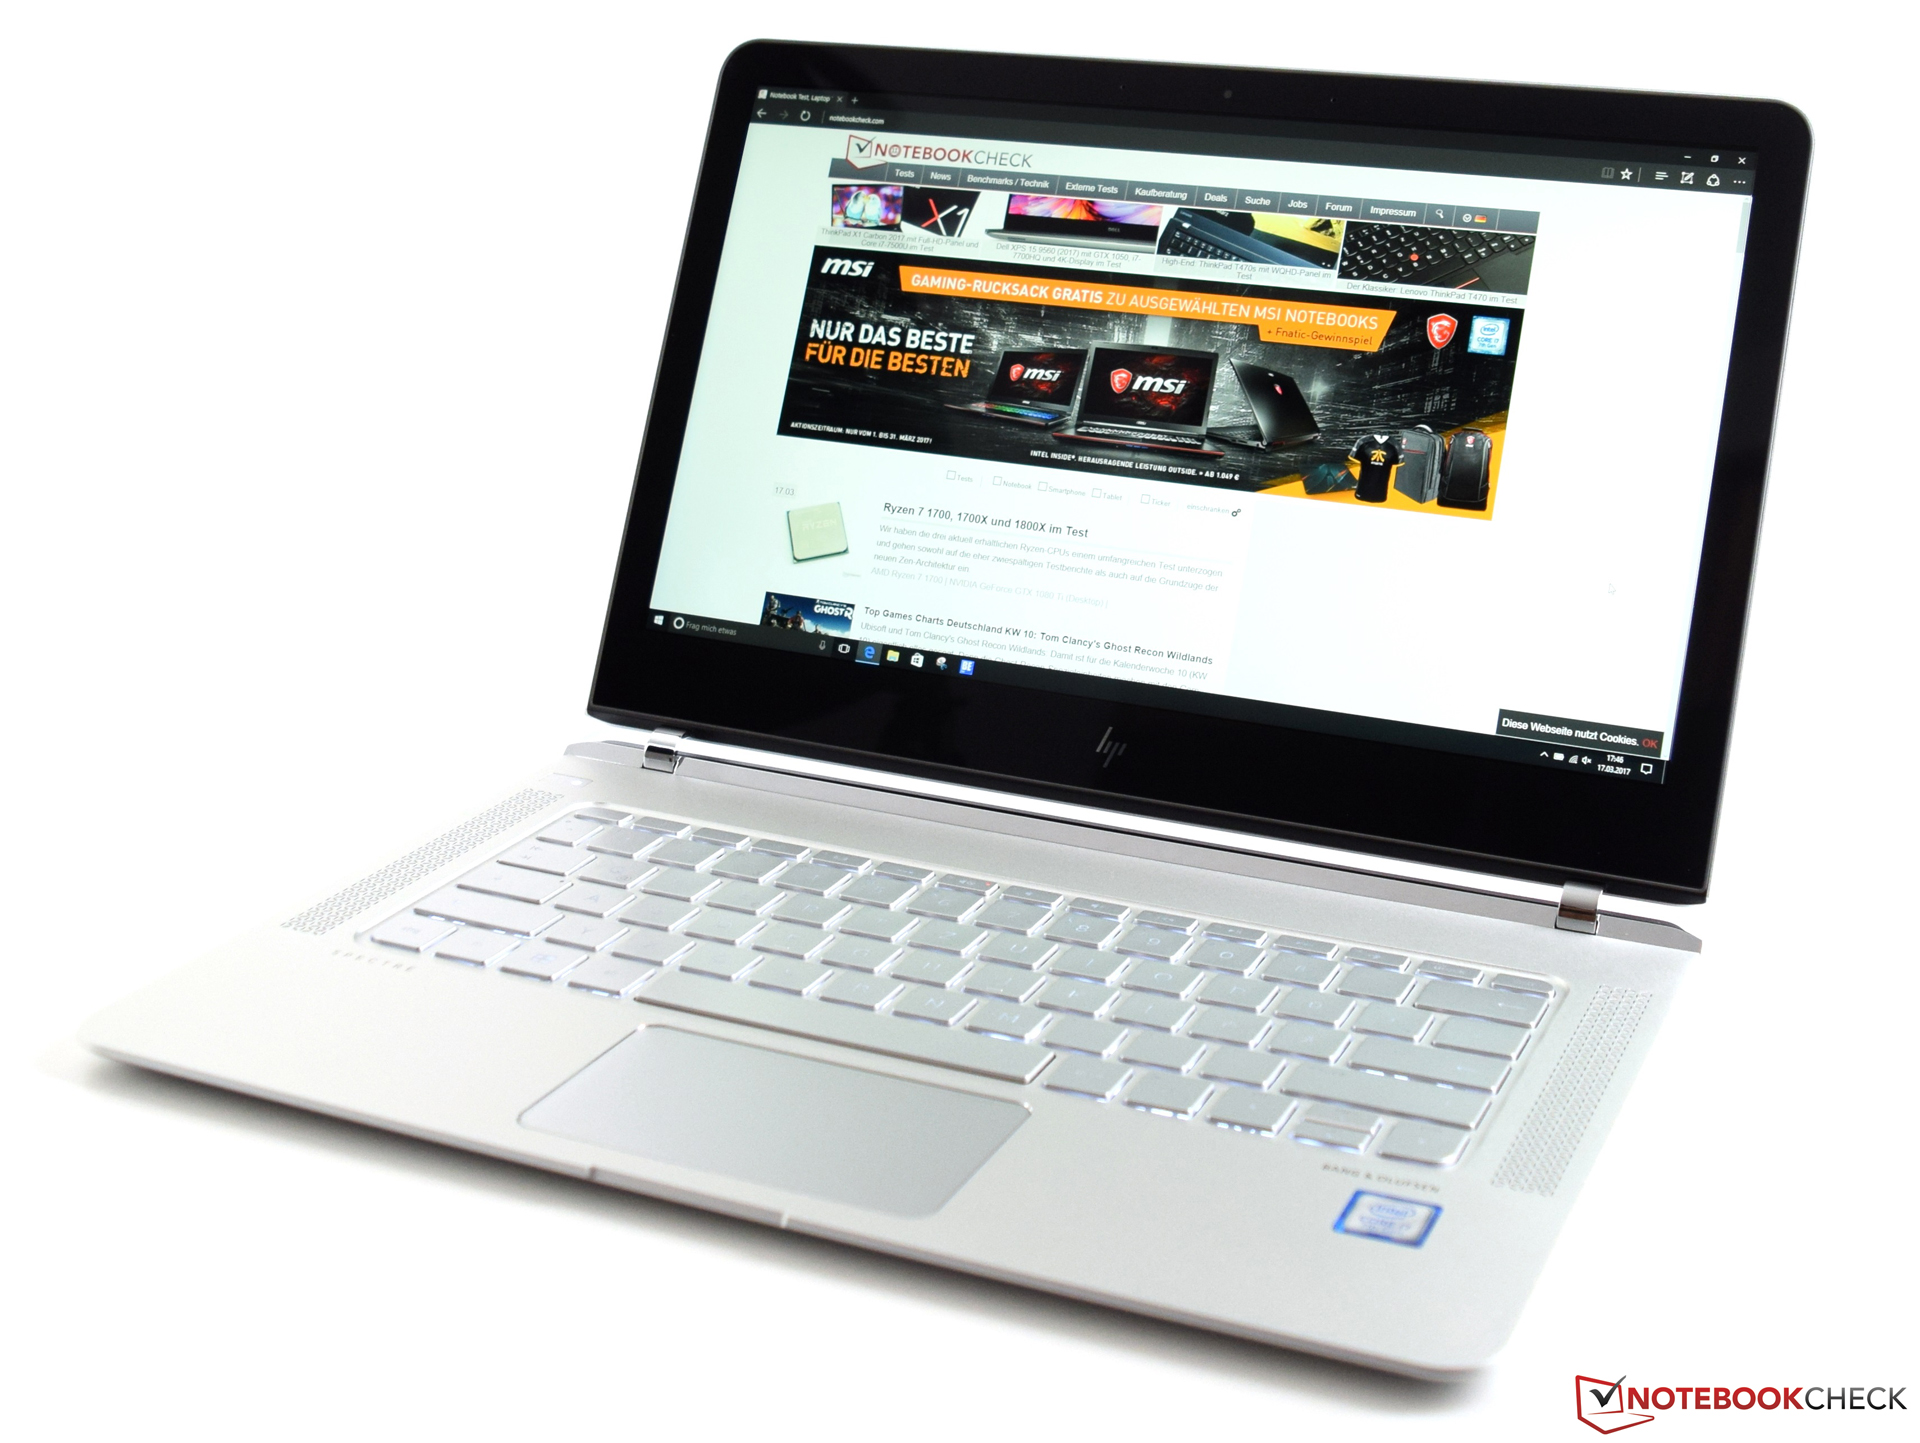
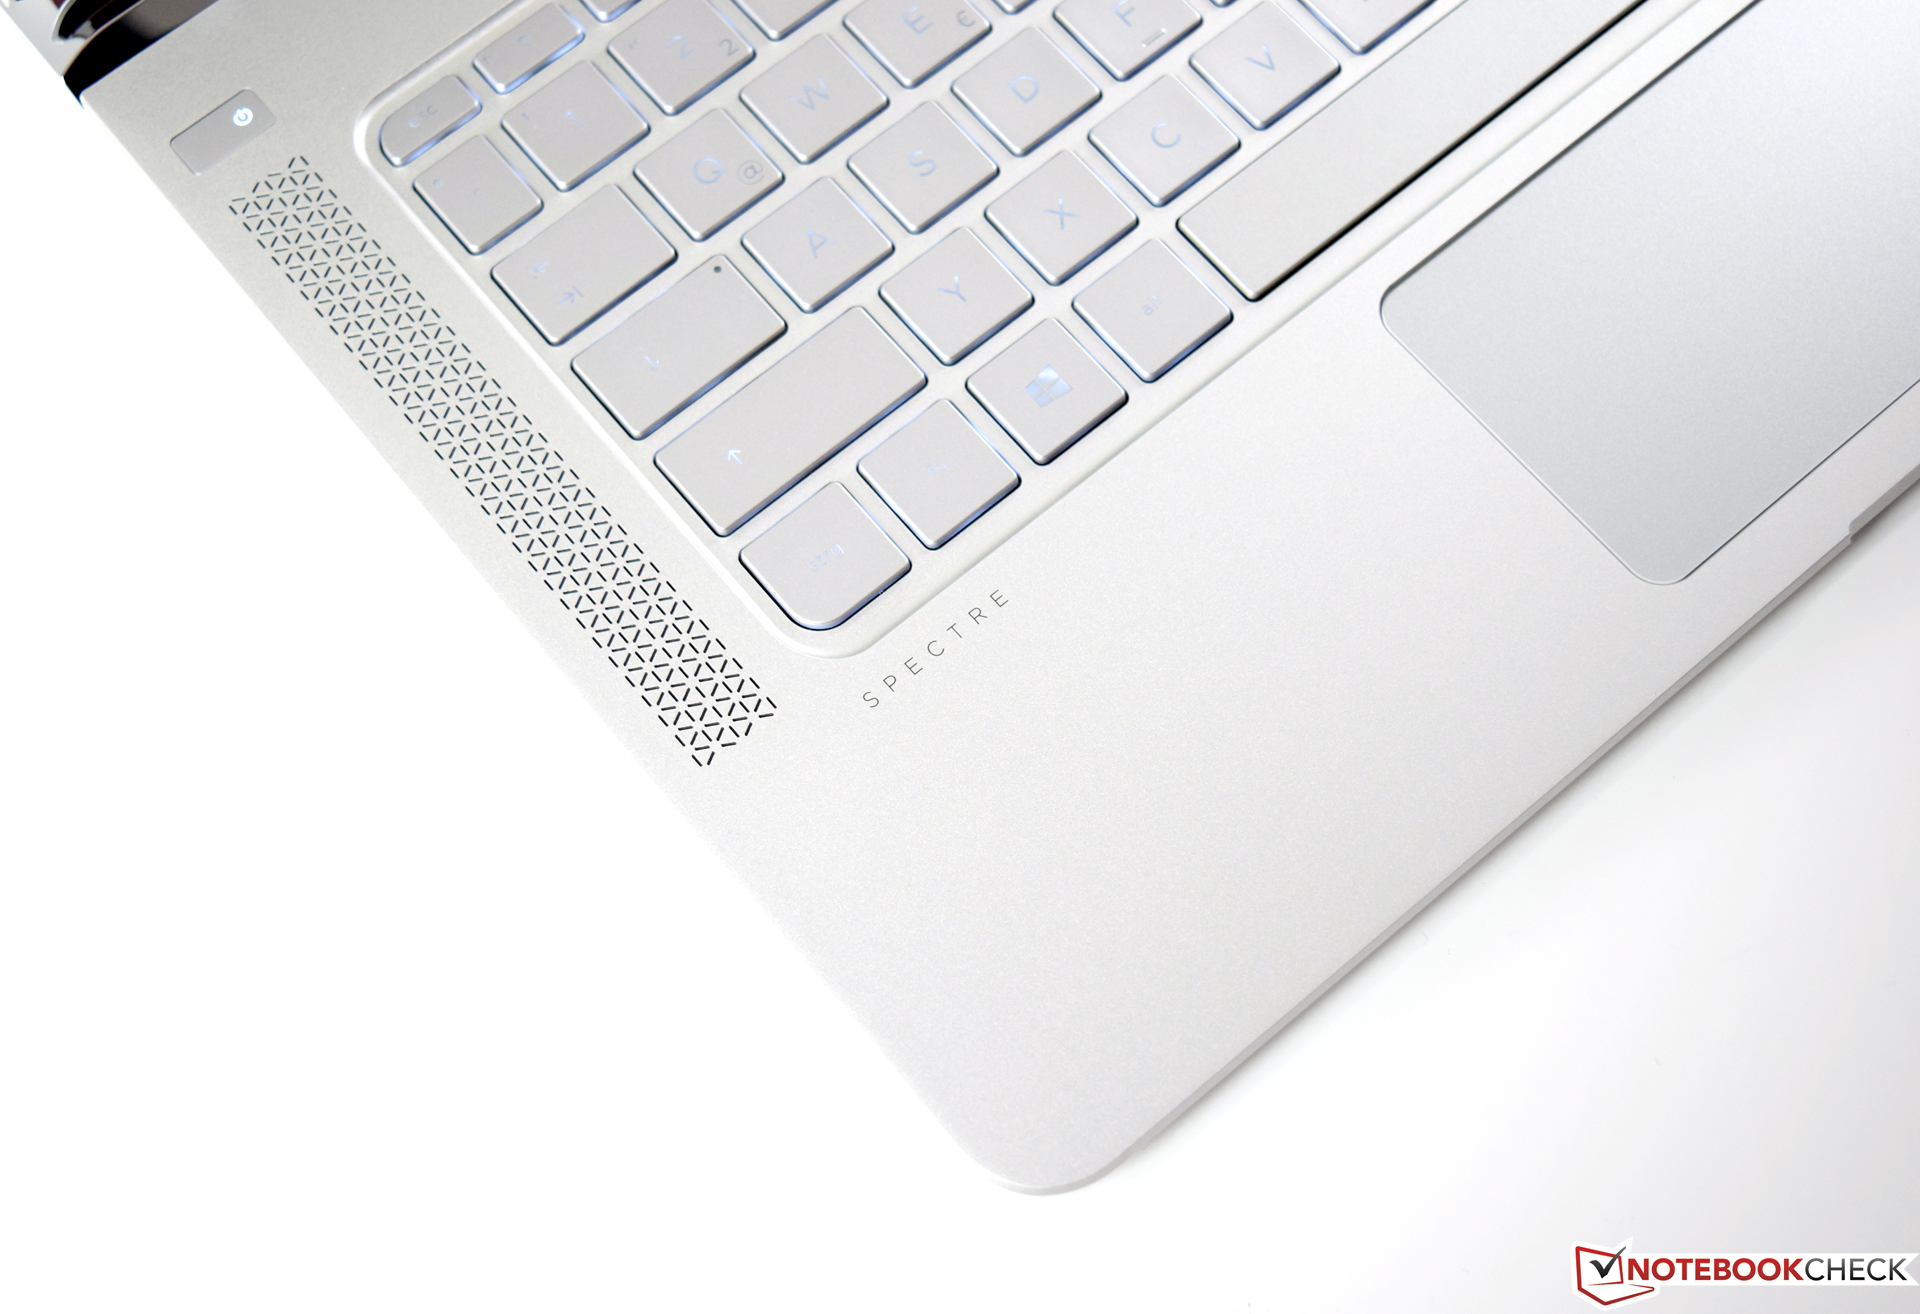
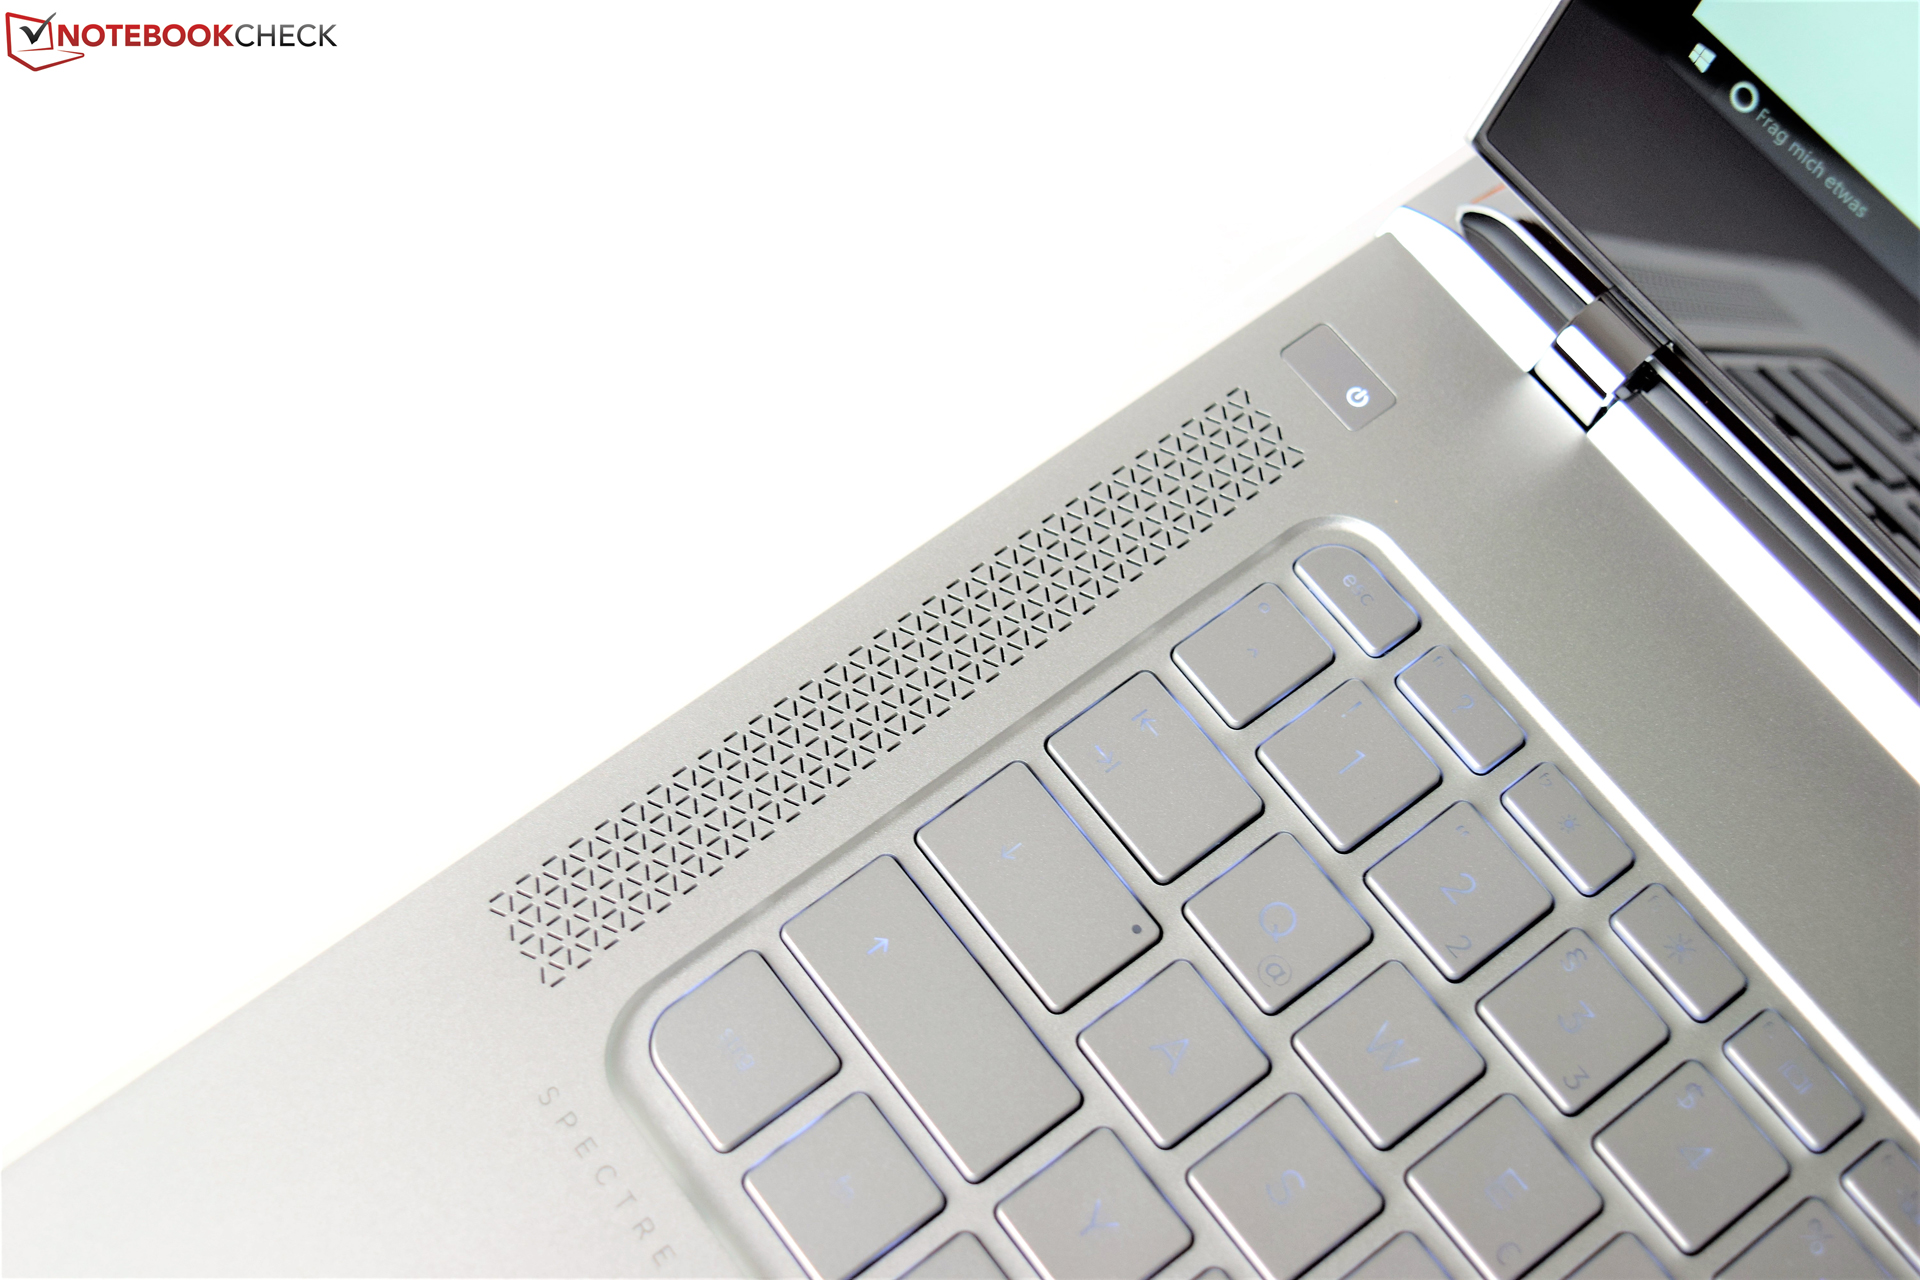
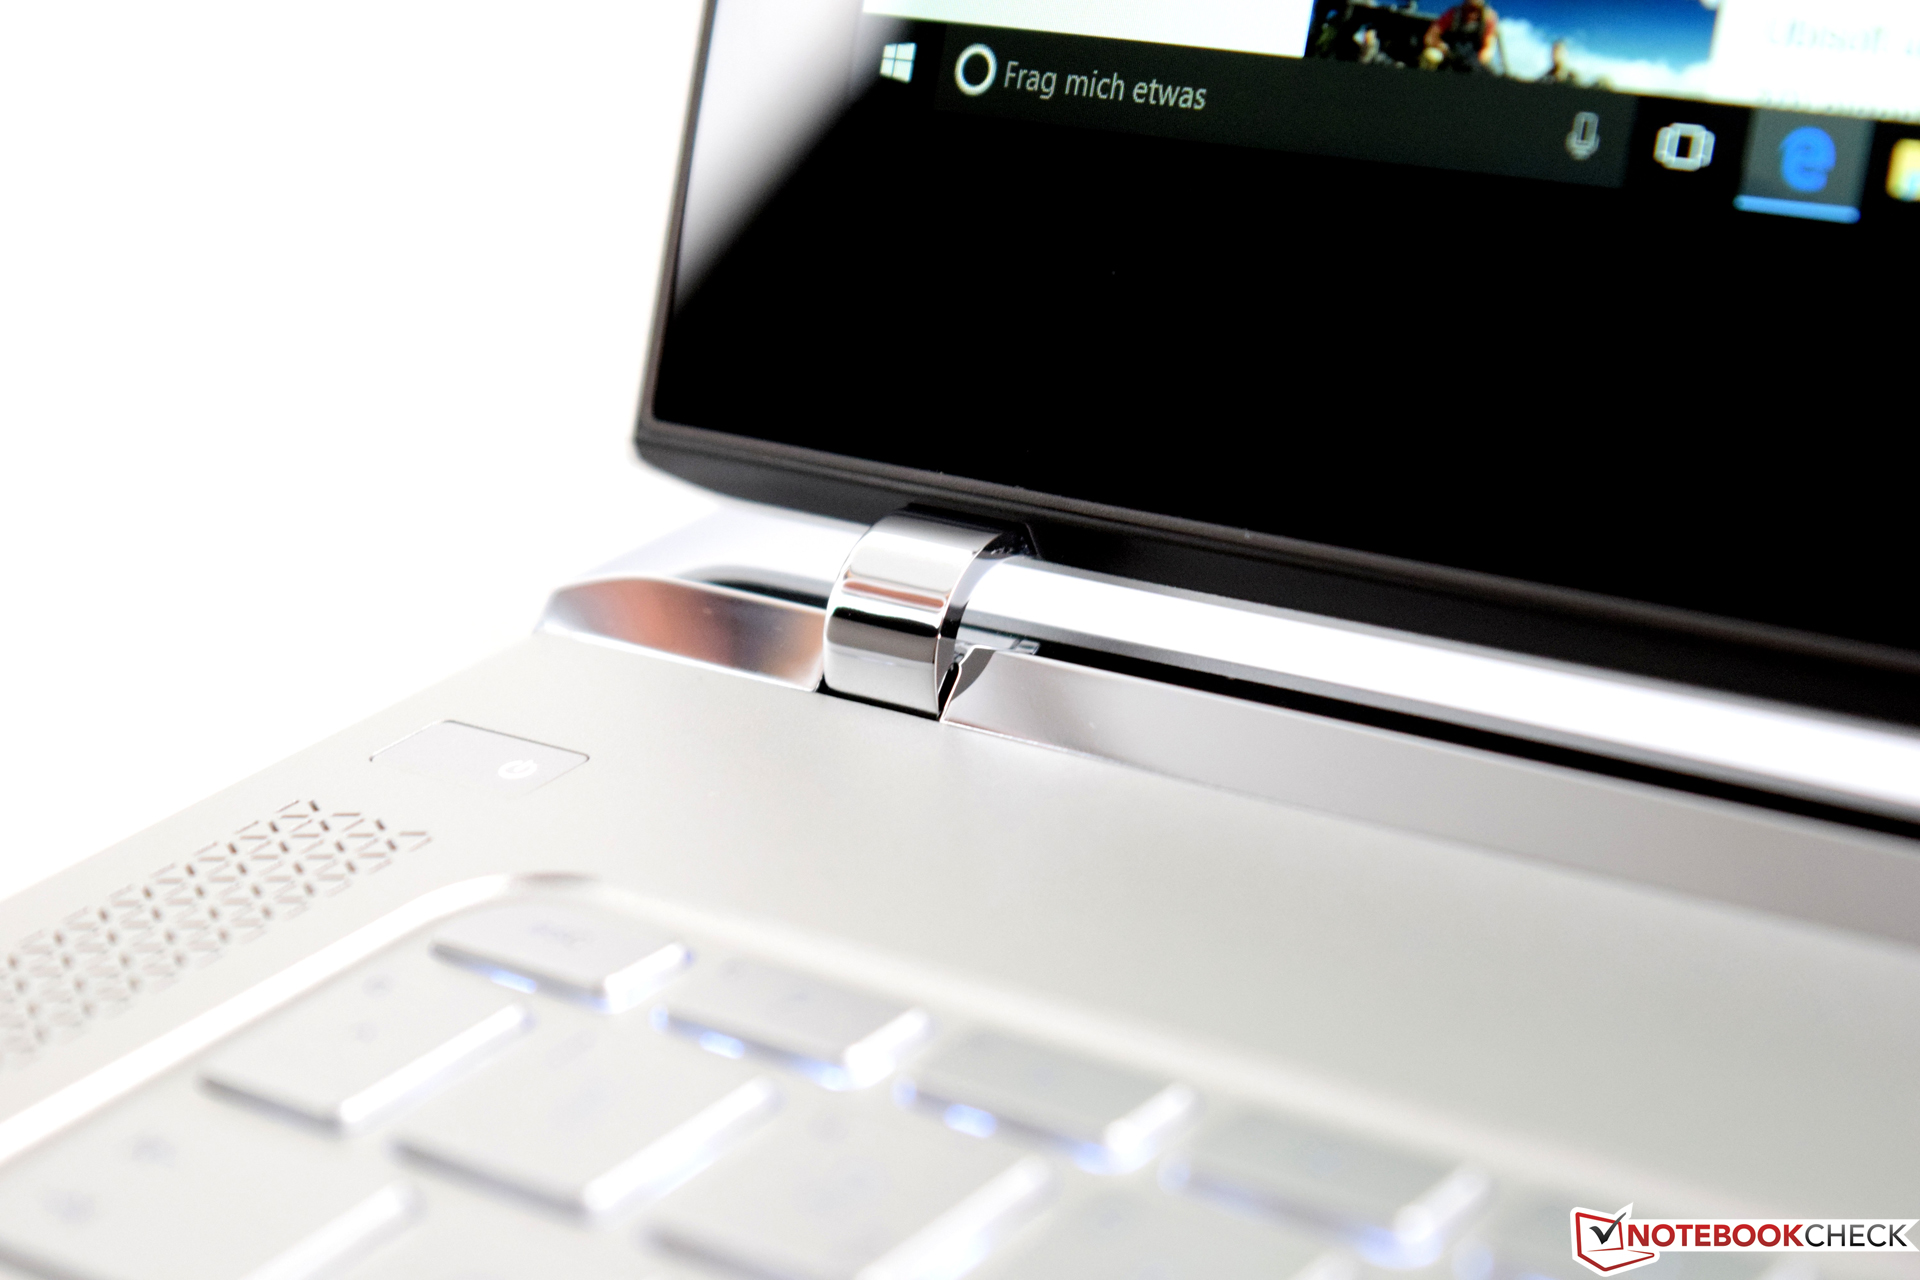
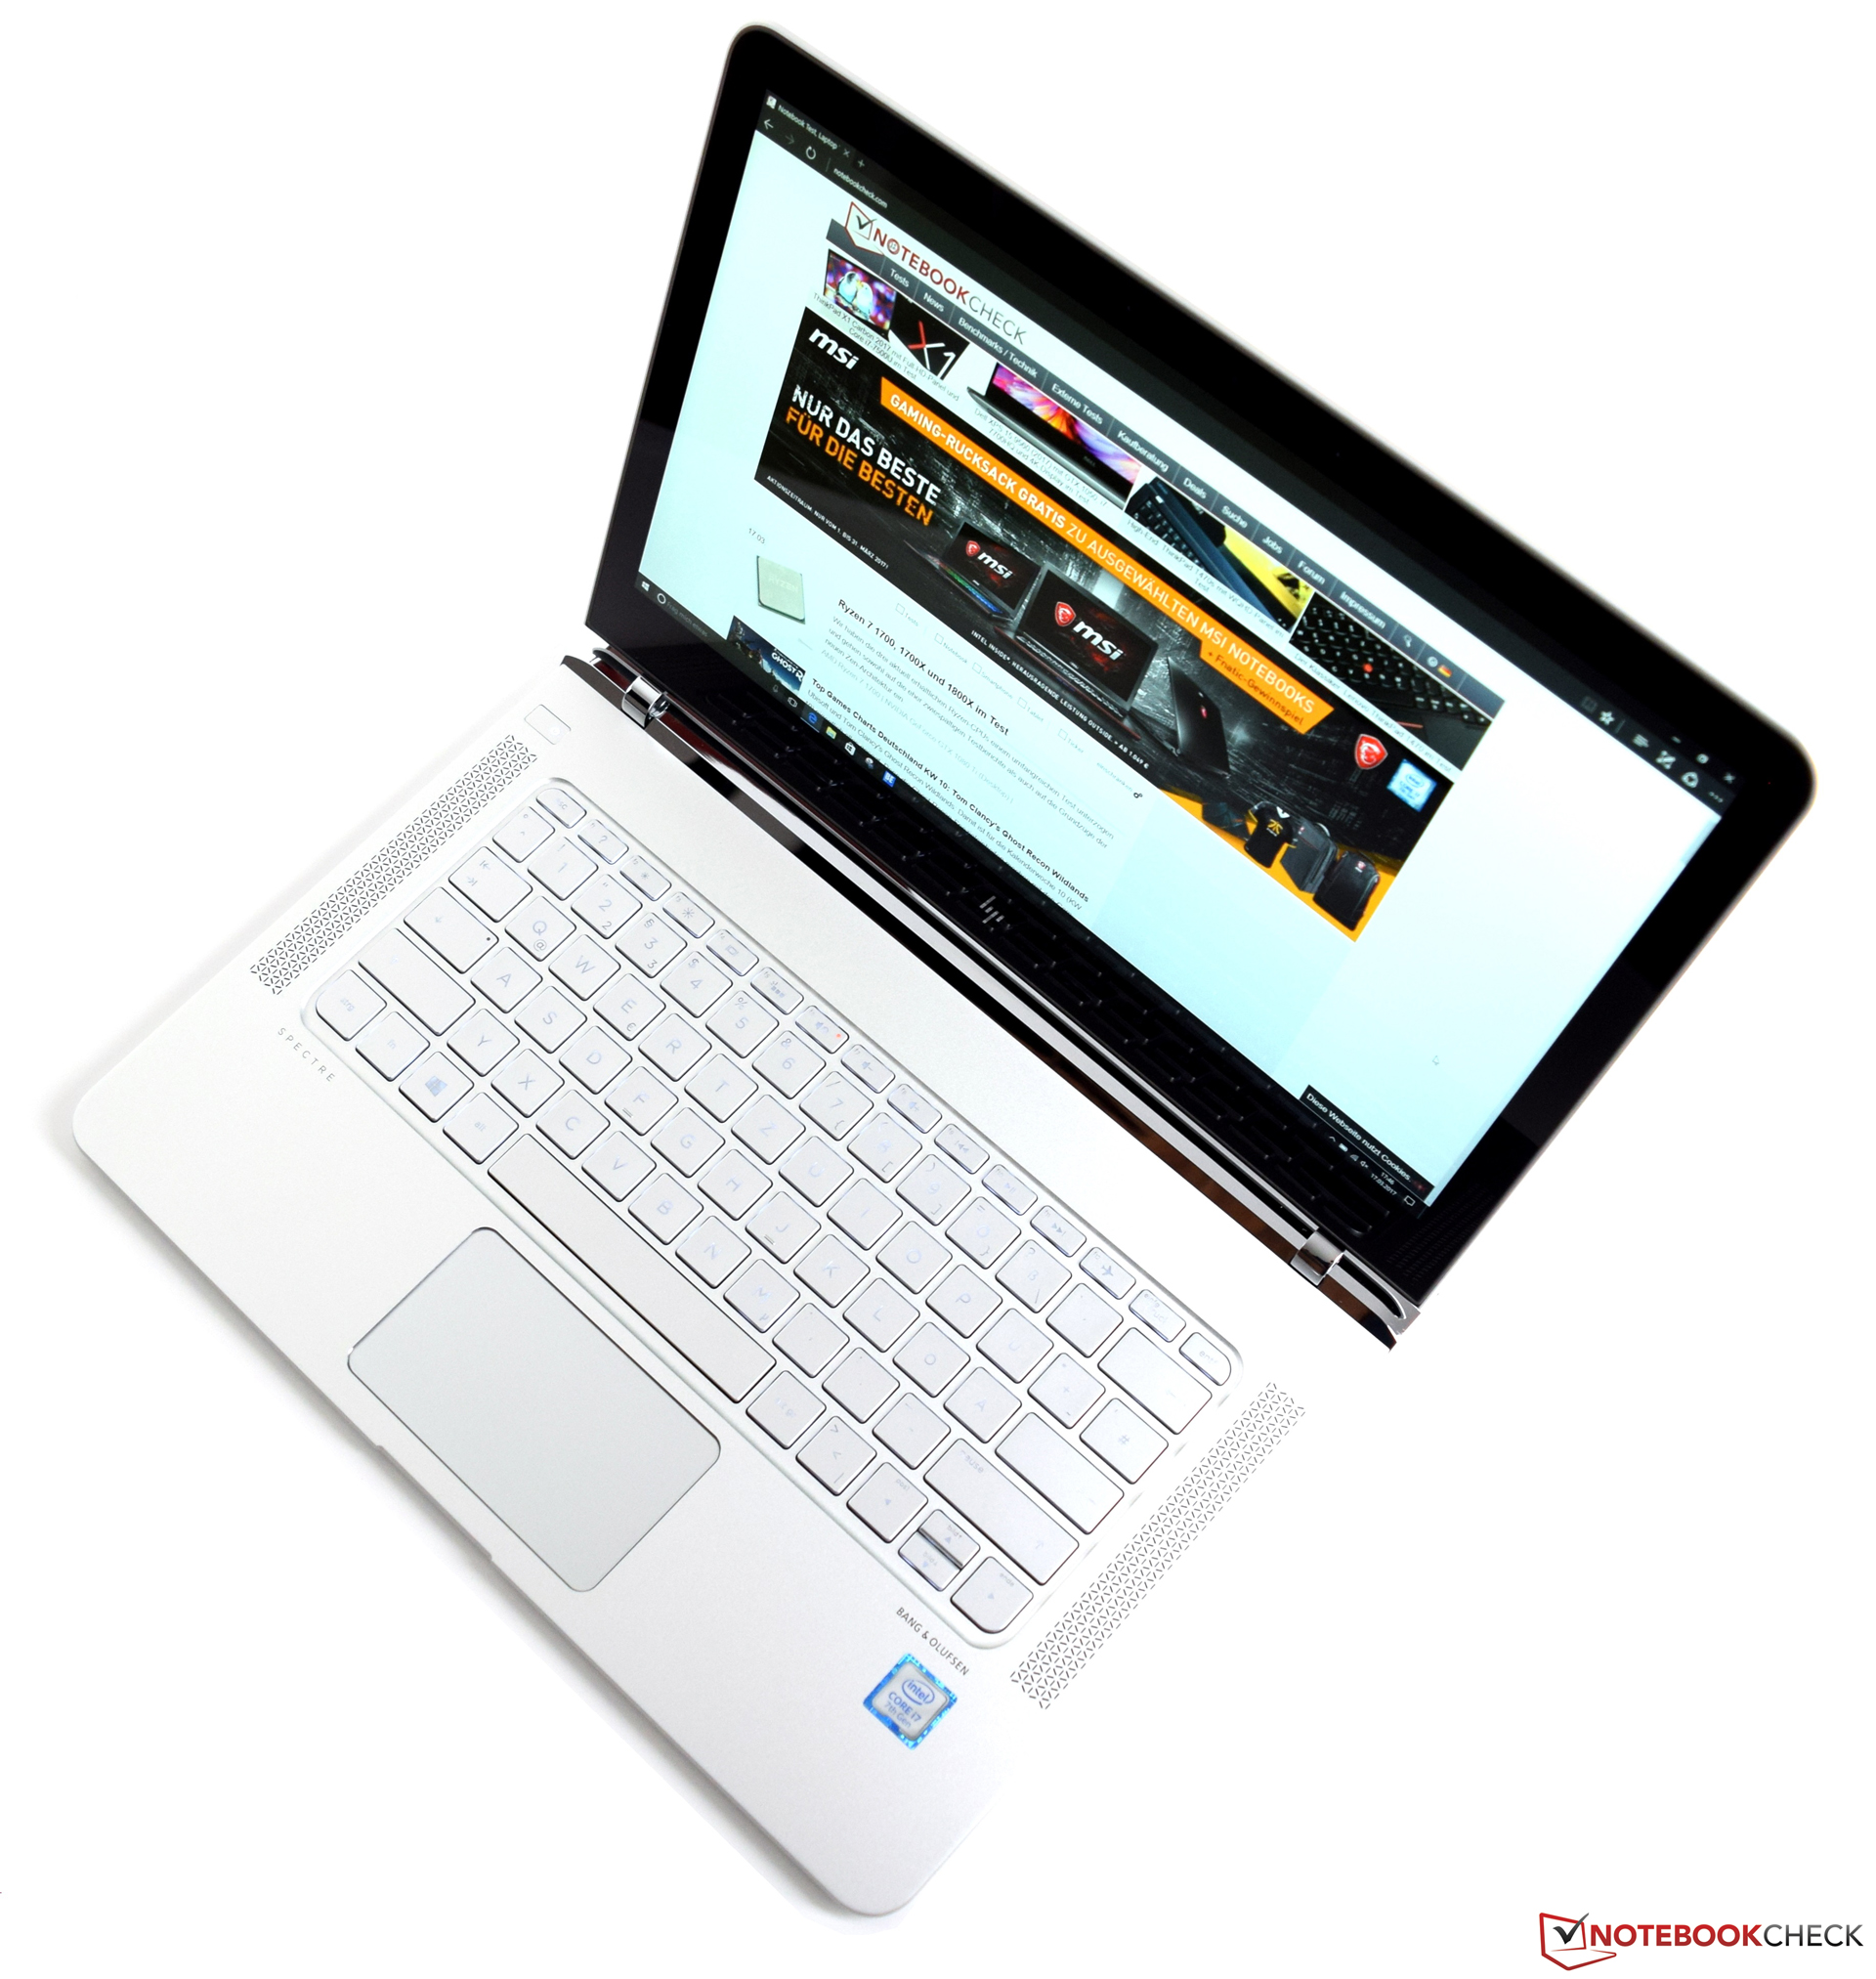
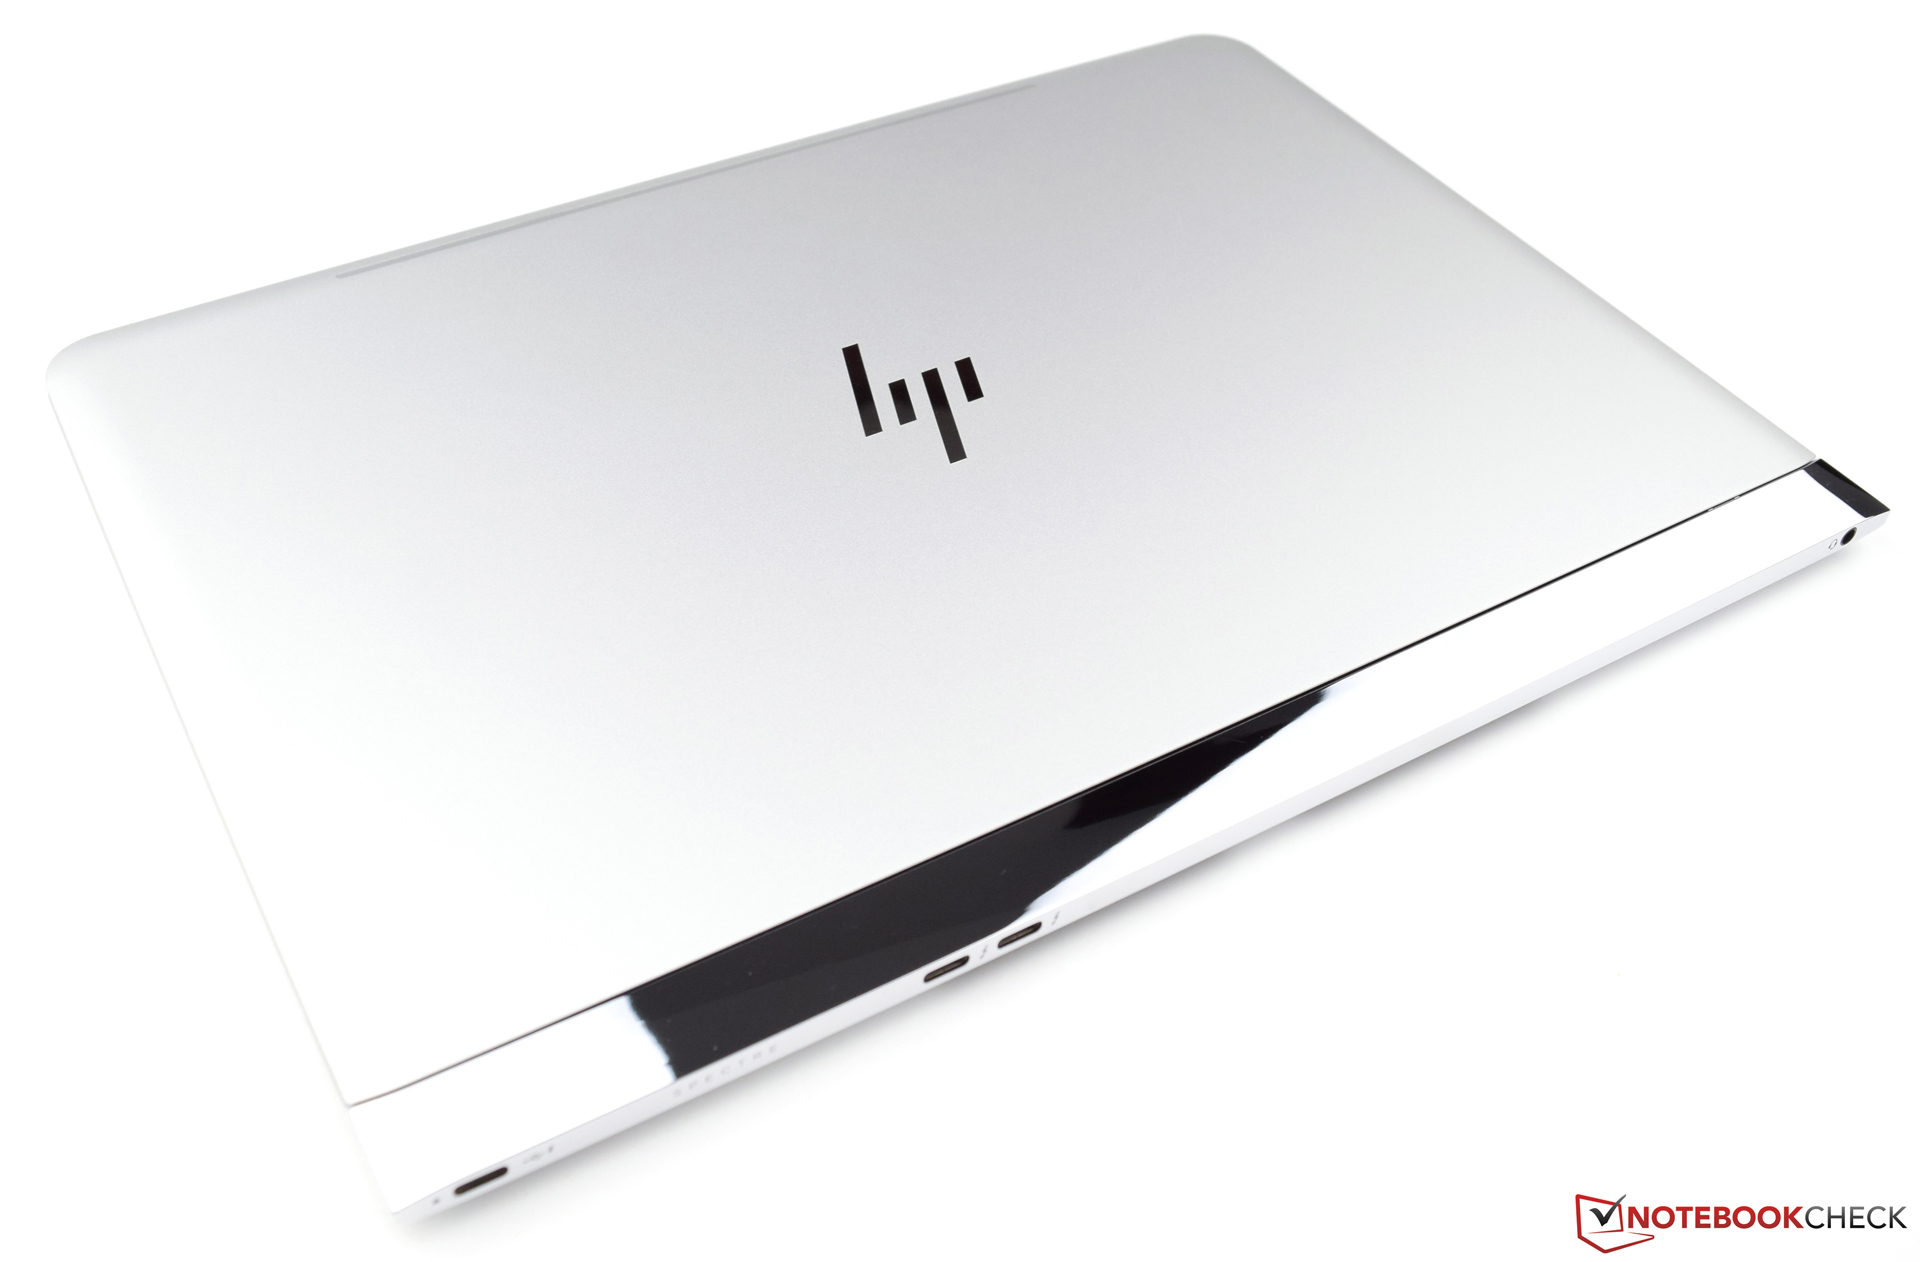
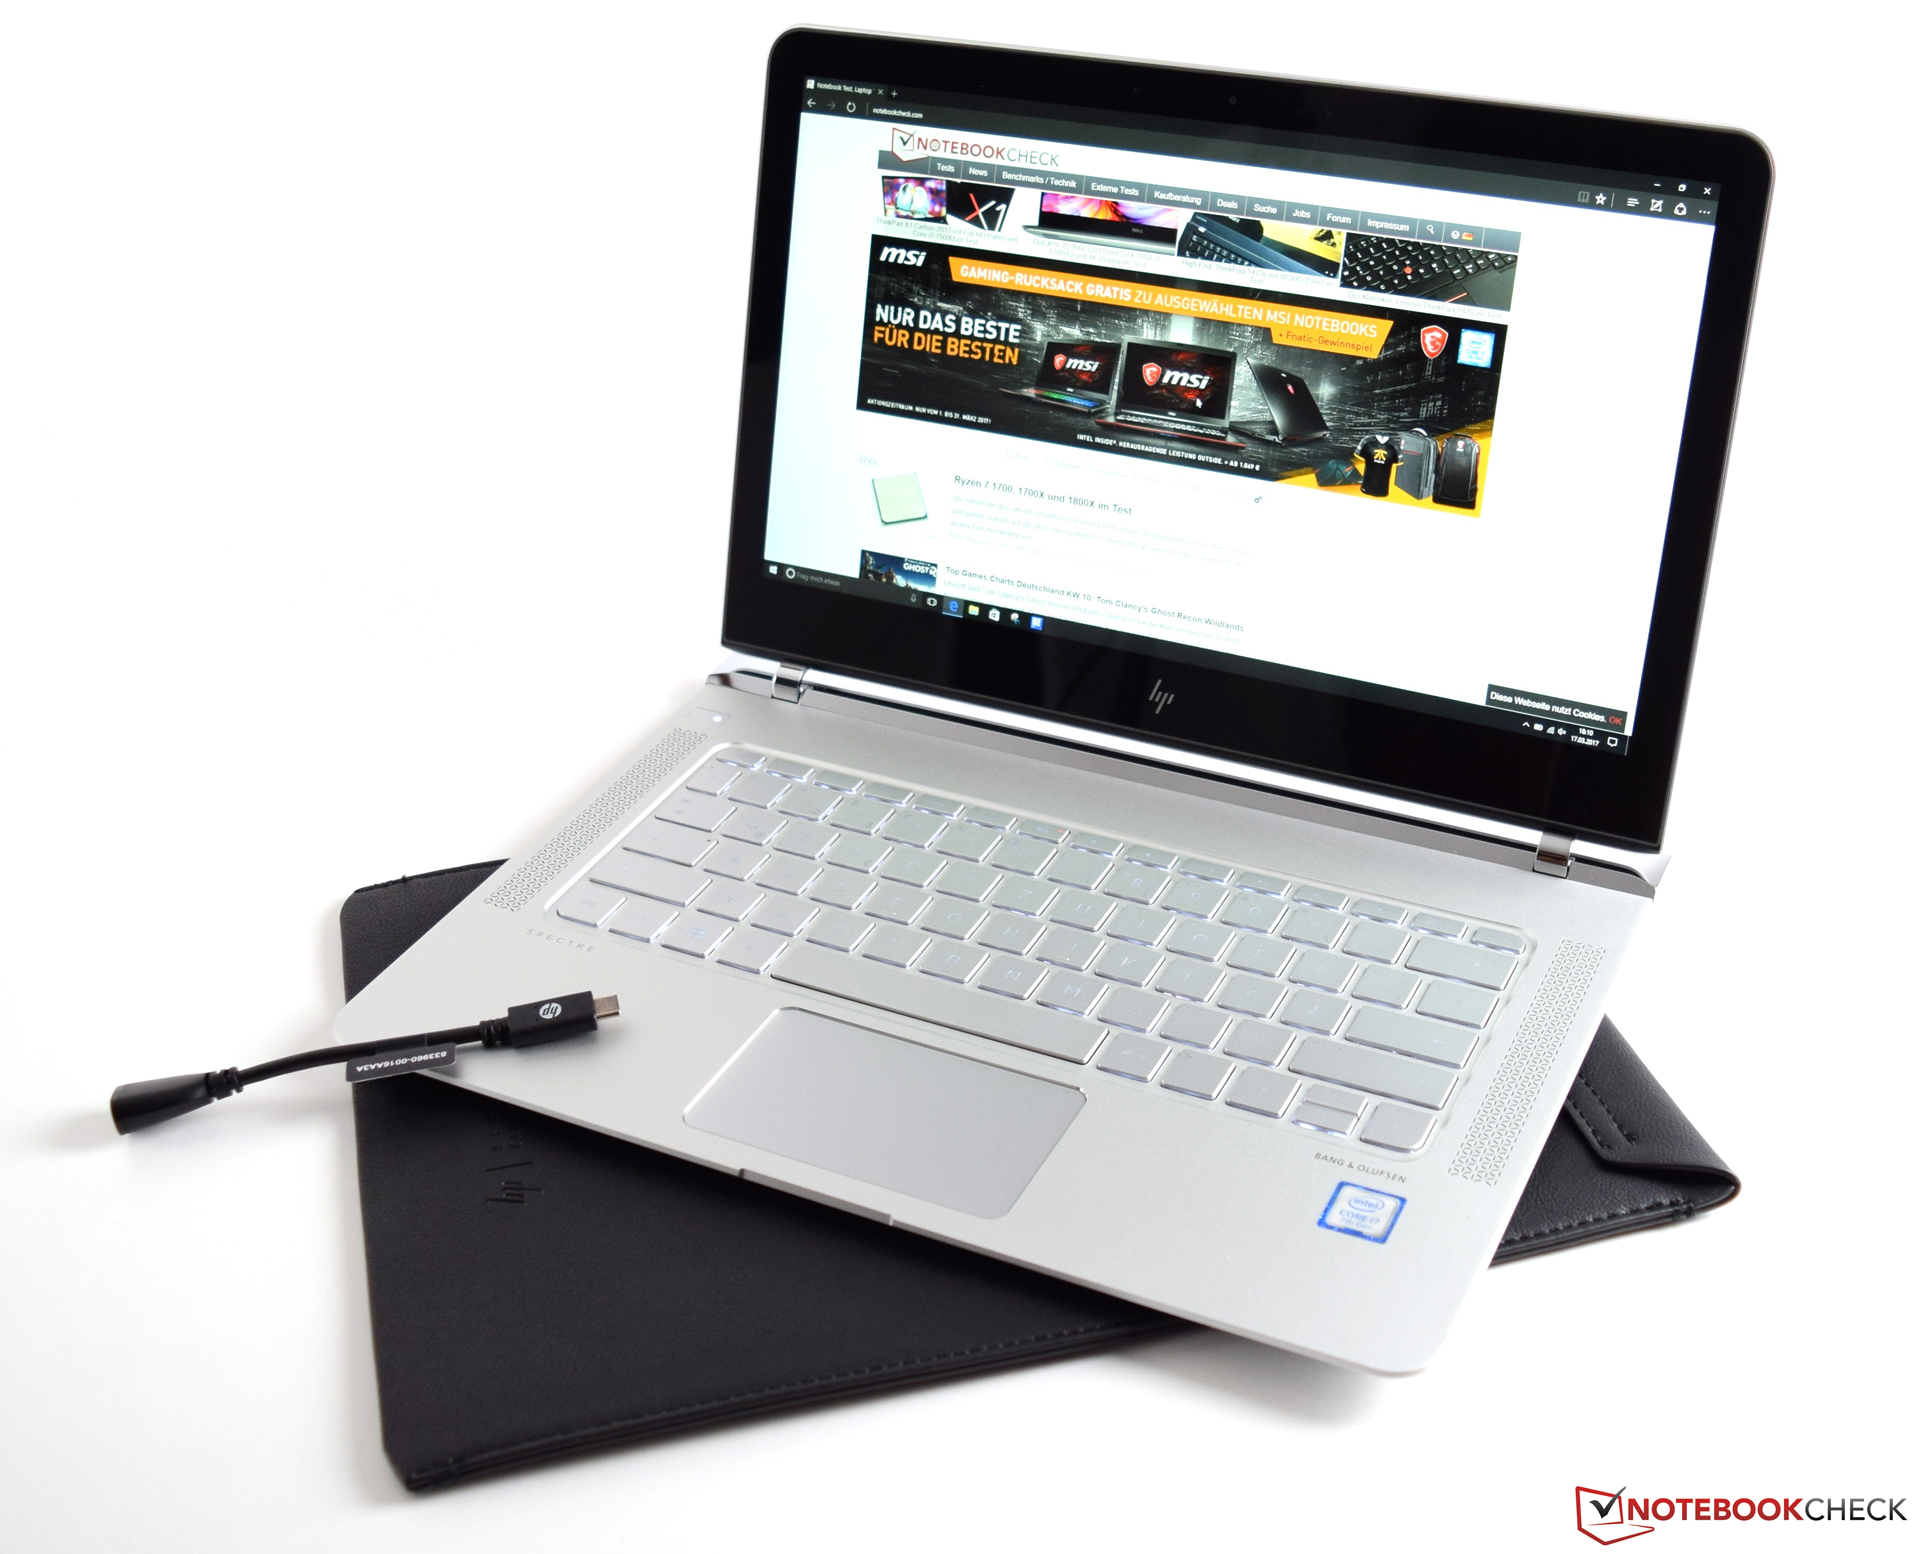
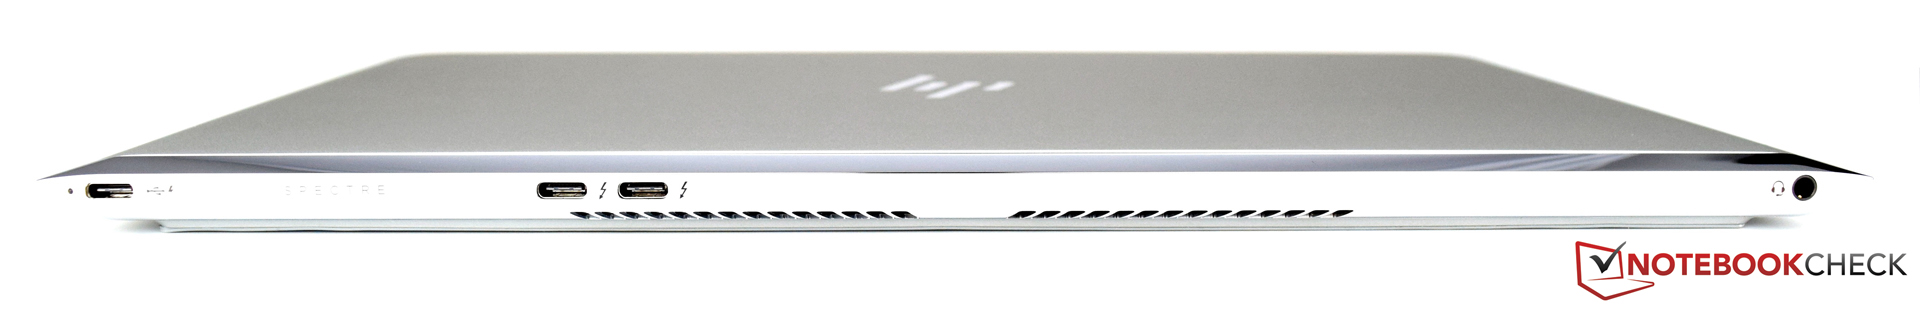
Det är ingen tvekan om att HP:s Spectre 13 fortfarande är en av de tunnaste bärbara datorerna i 13,3-tumsformat. HP har hittat en bra kompromiss mellan mobilitet, design och prestanda.
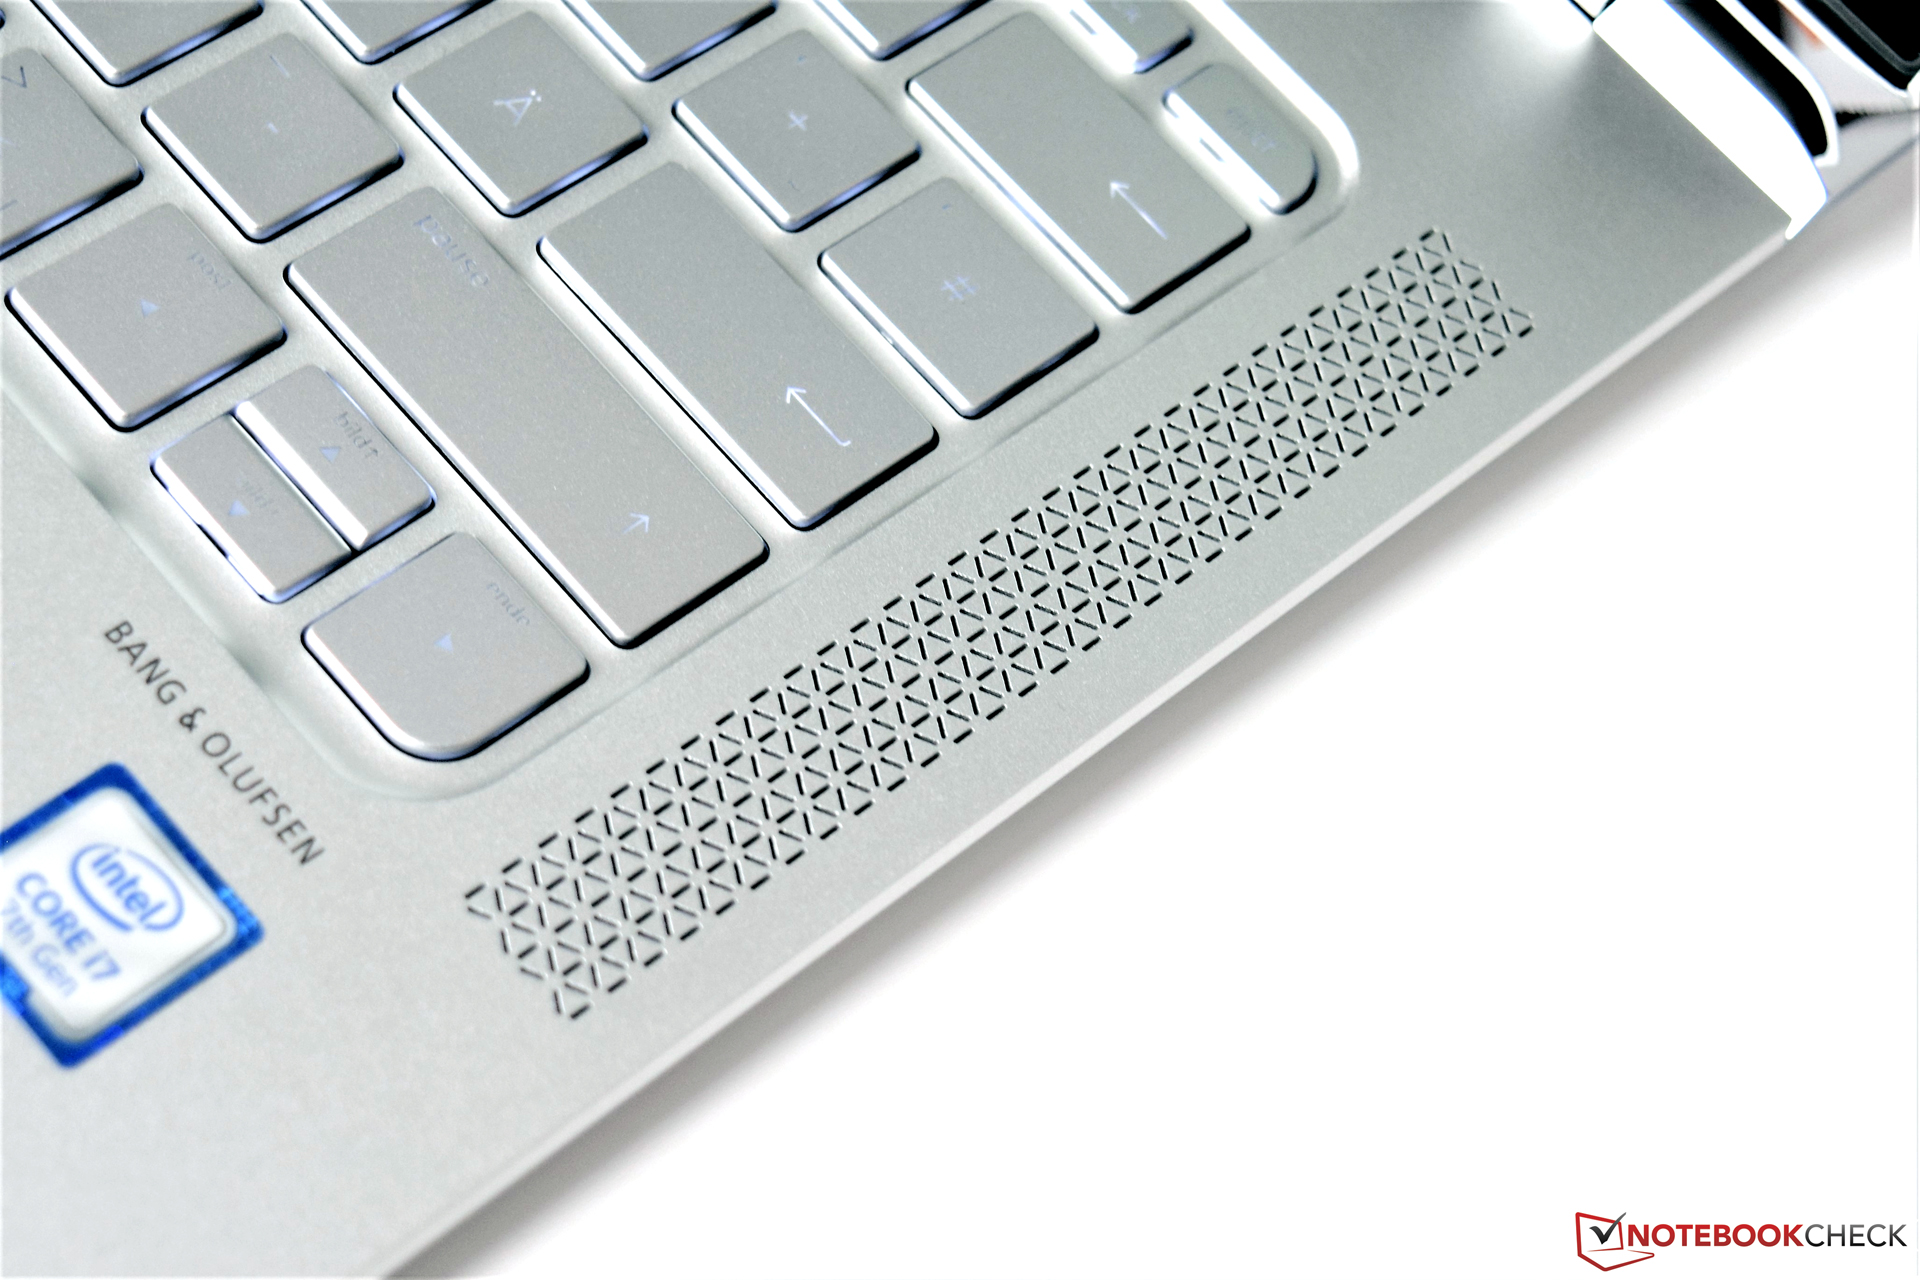
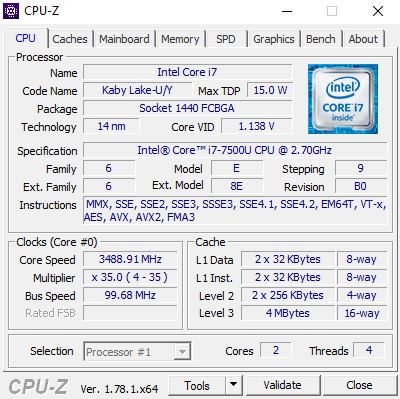
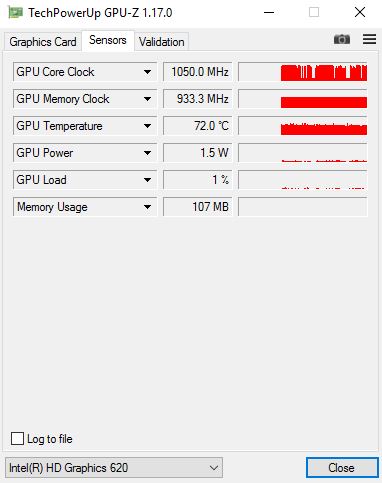
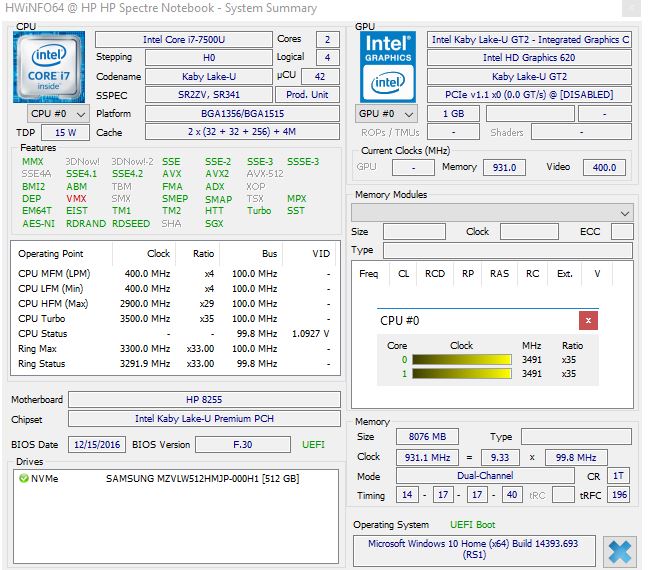
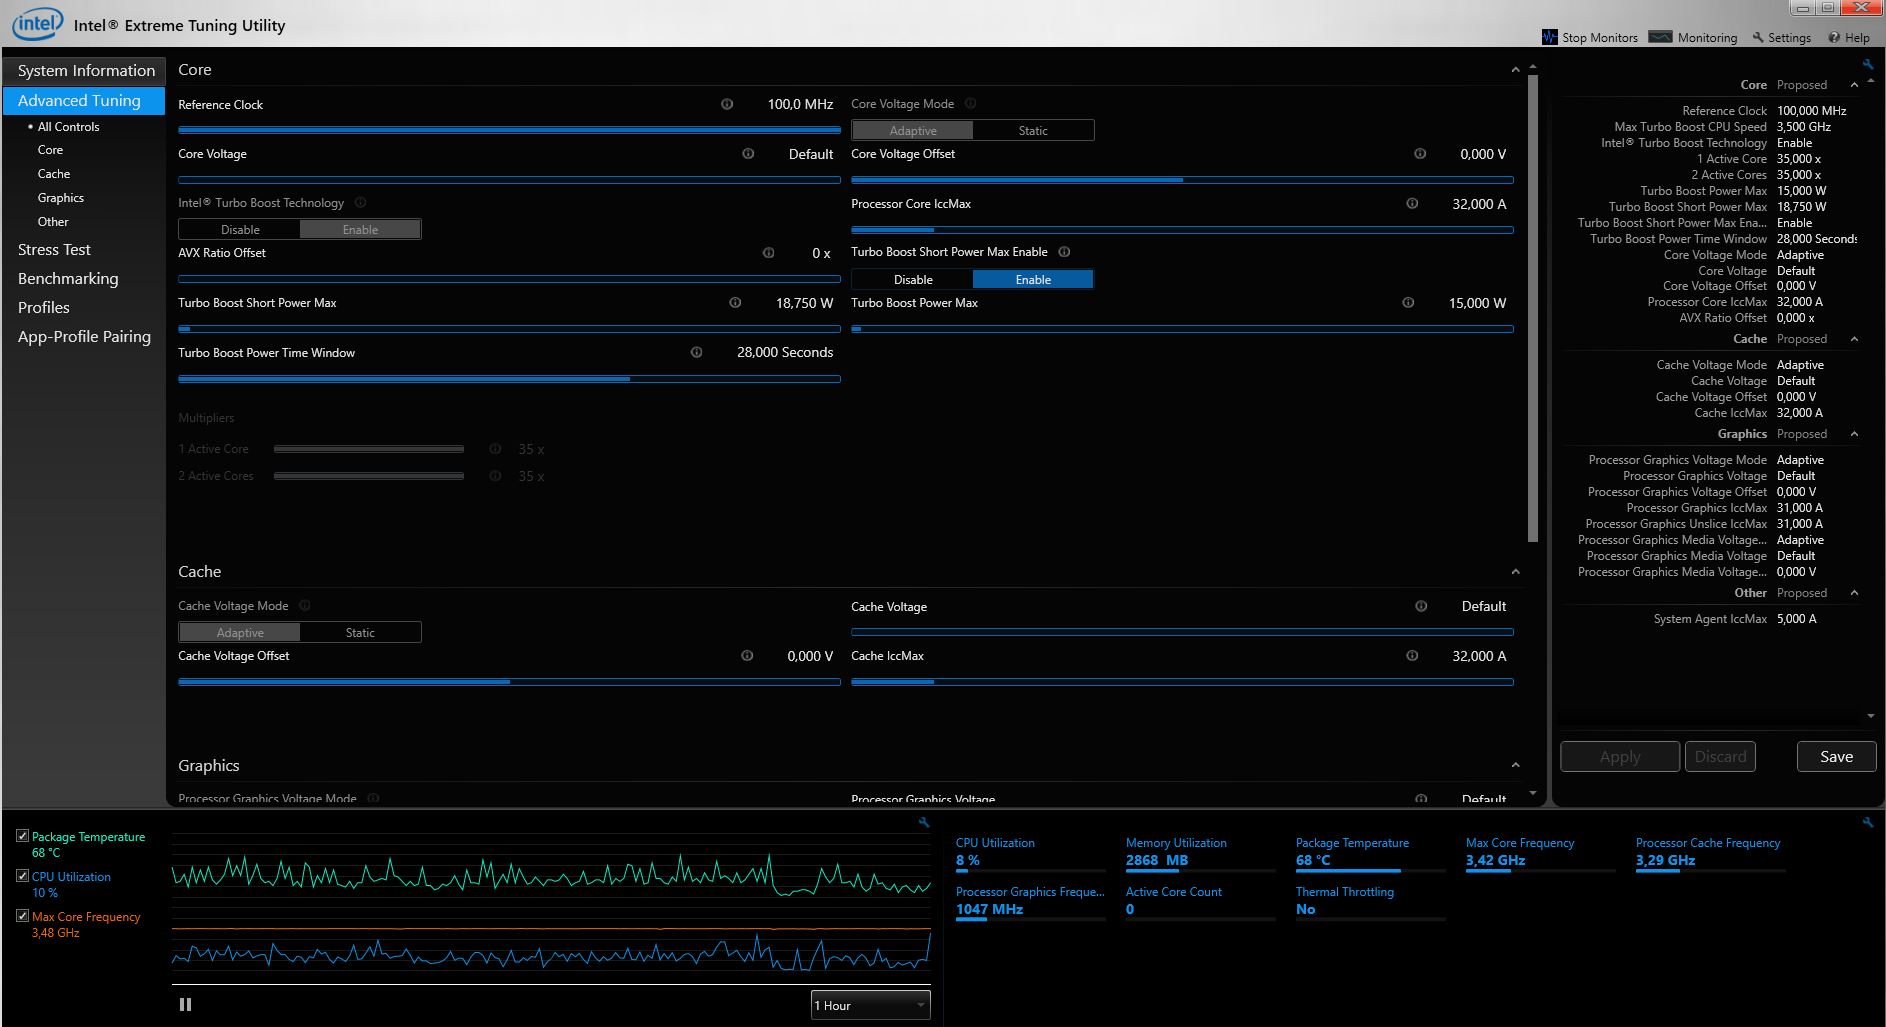
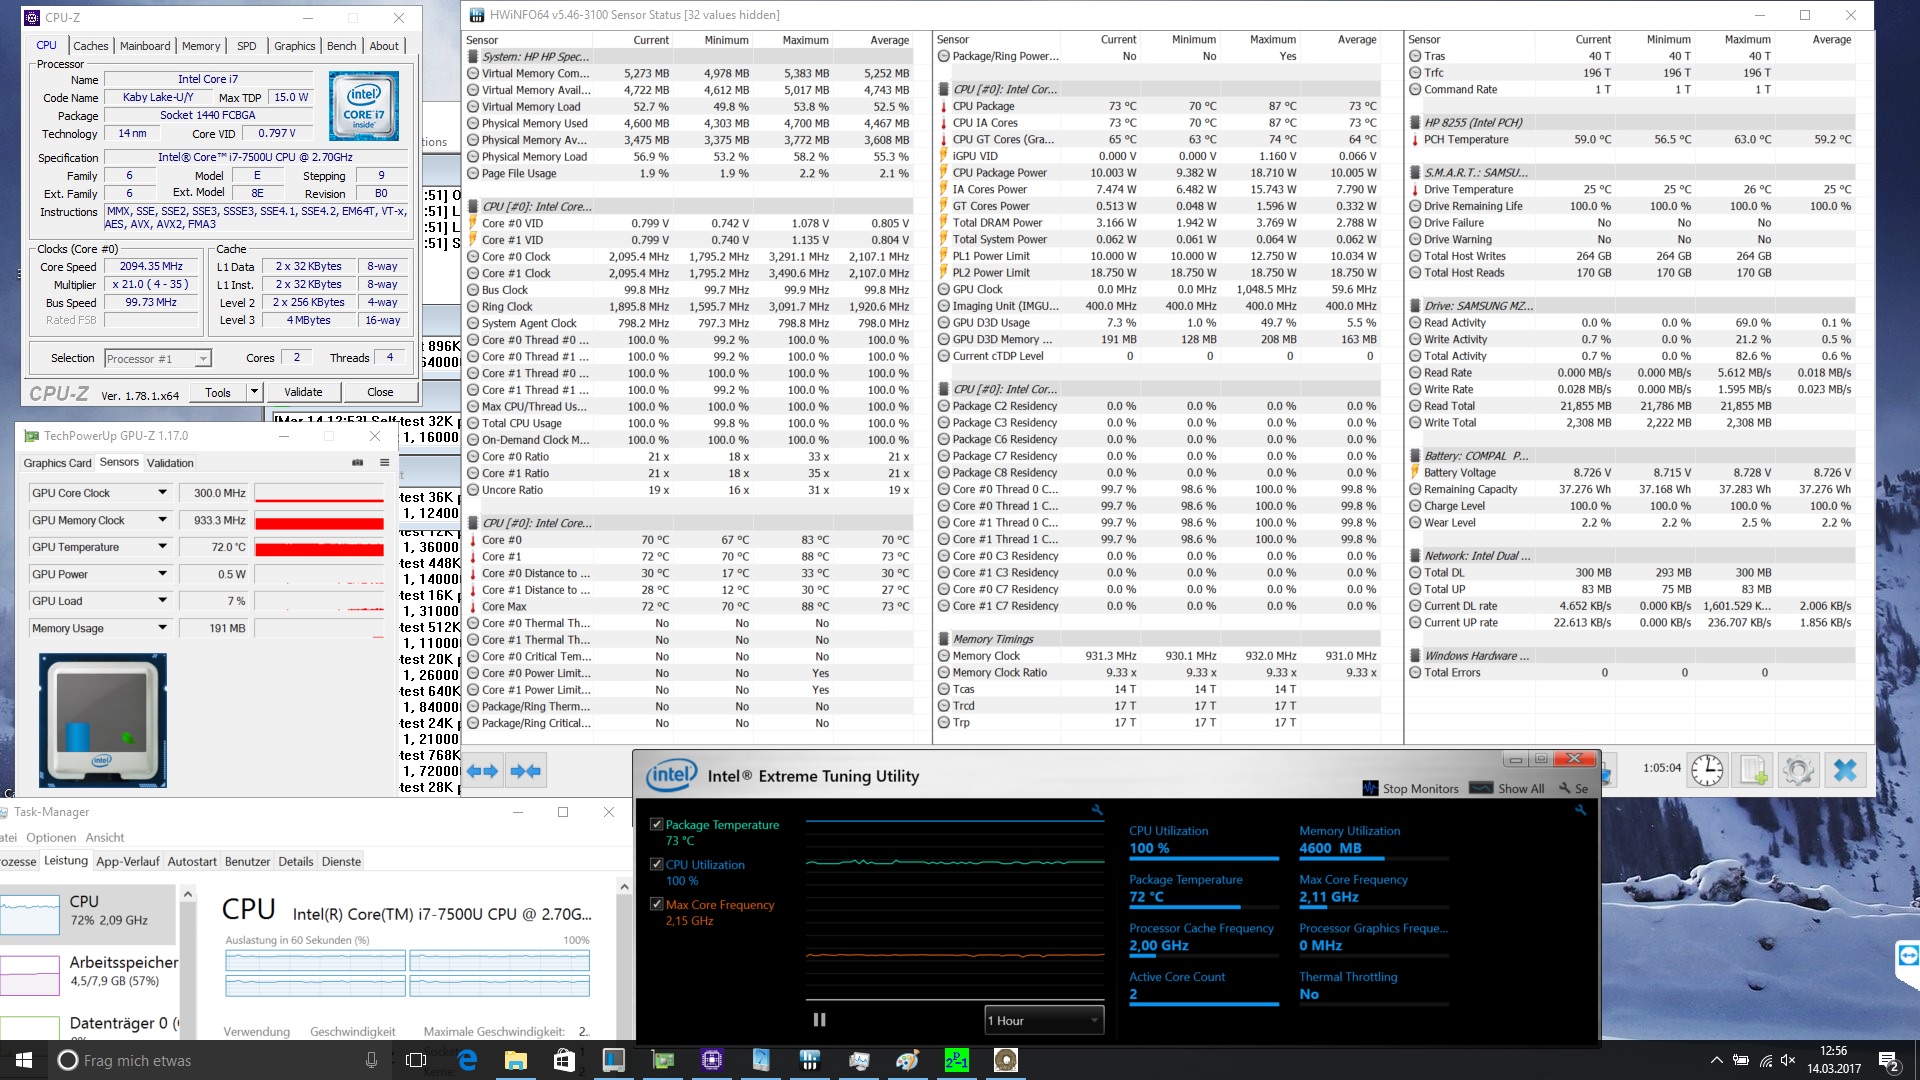
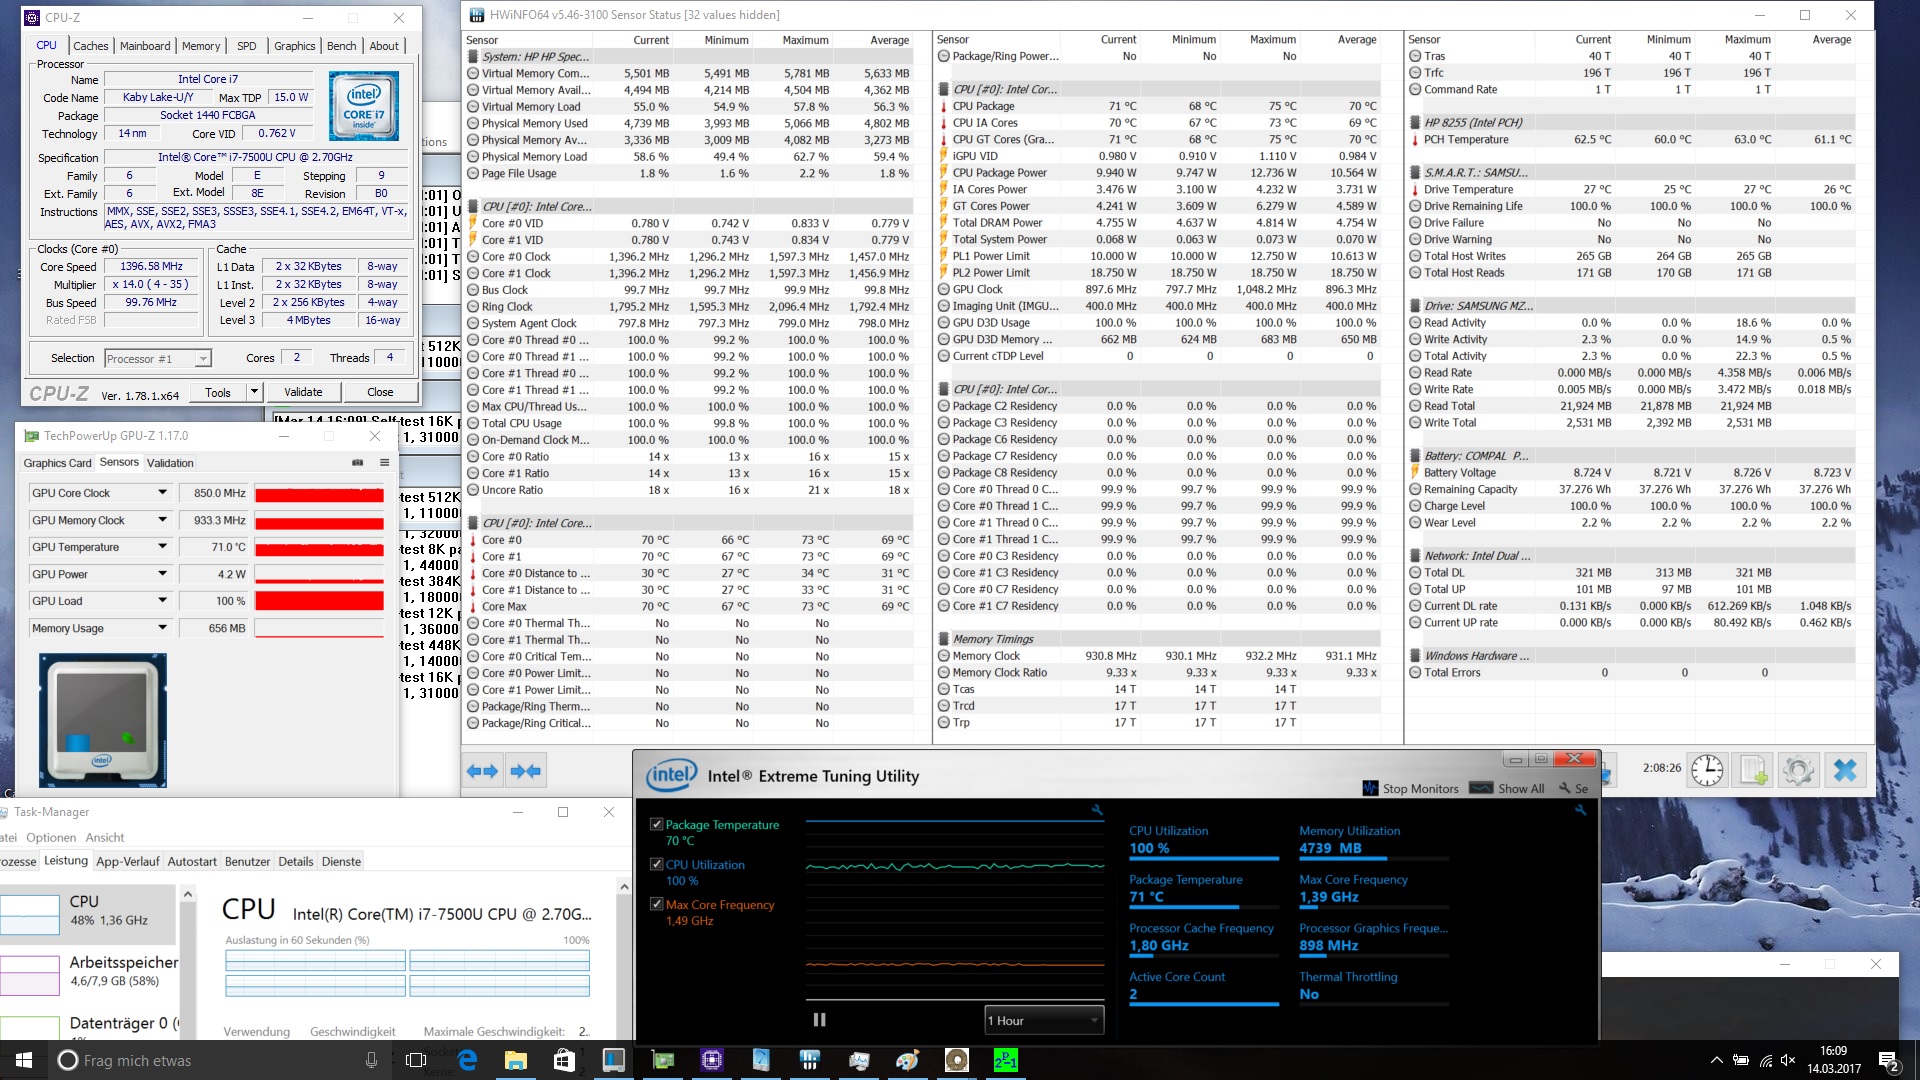
Vårt testexemplar är utrustat med en snabb Intel Core i7-7500U-processor, som dessvärre inte kan utnyttja sitt Turbo-läge permanent. Trots det har den tillräckligt med kraft för att leverera mycket bra systemprestanda, särskilt i kombination med den mycket snabba NVMe-disken. I vår mening är 8 GB DDR 3 RAM tillräckligt för närvarande, men 16 GB DDR4 RAM skulle vara betydligt mer framtidssäkert.
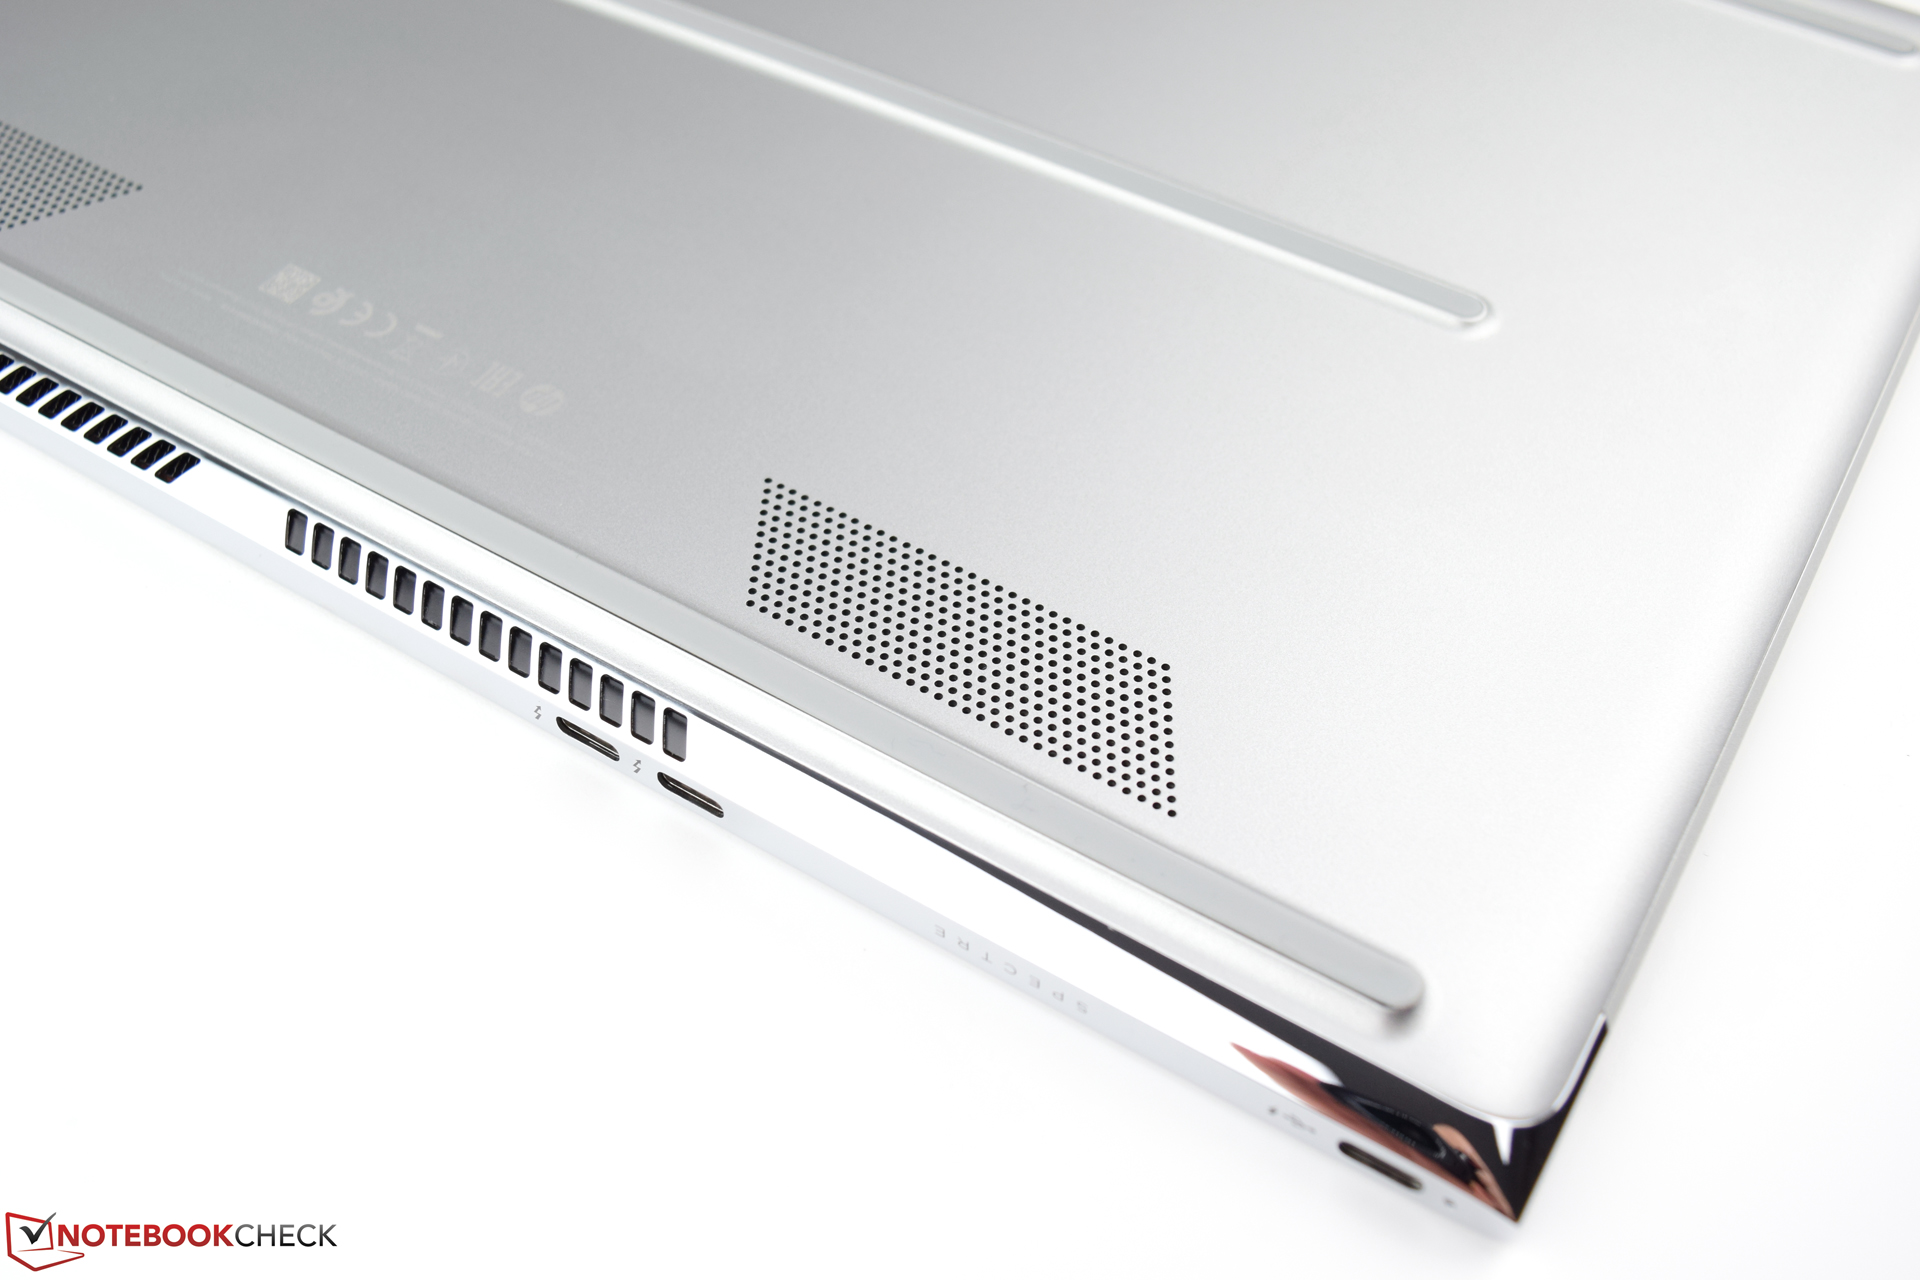
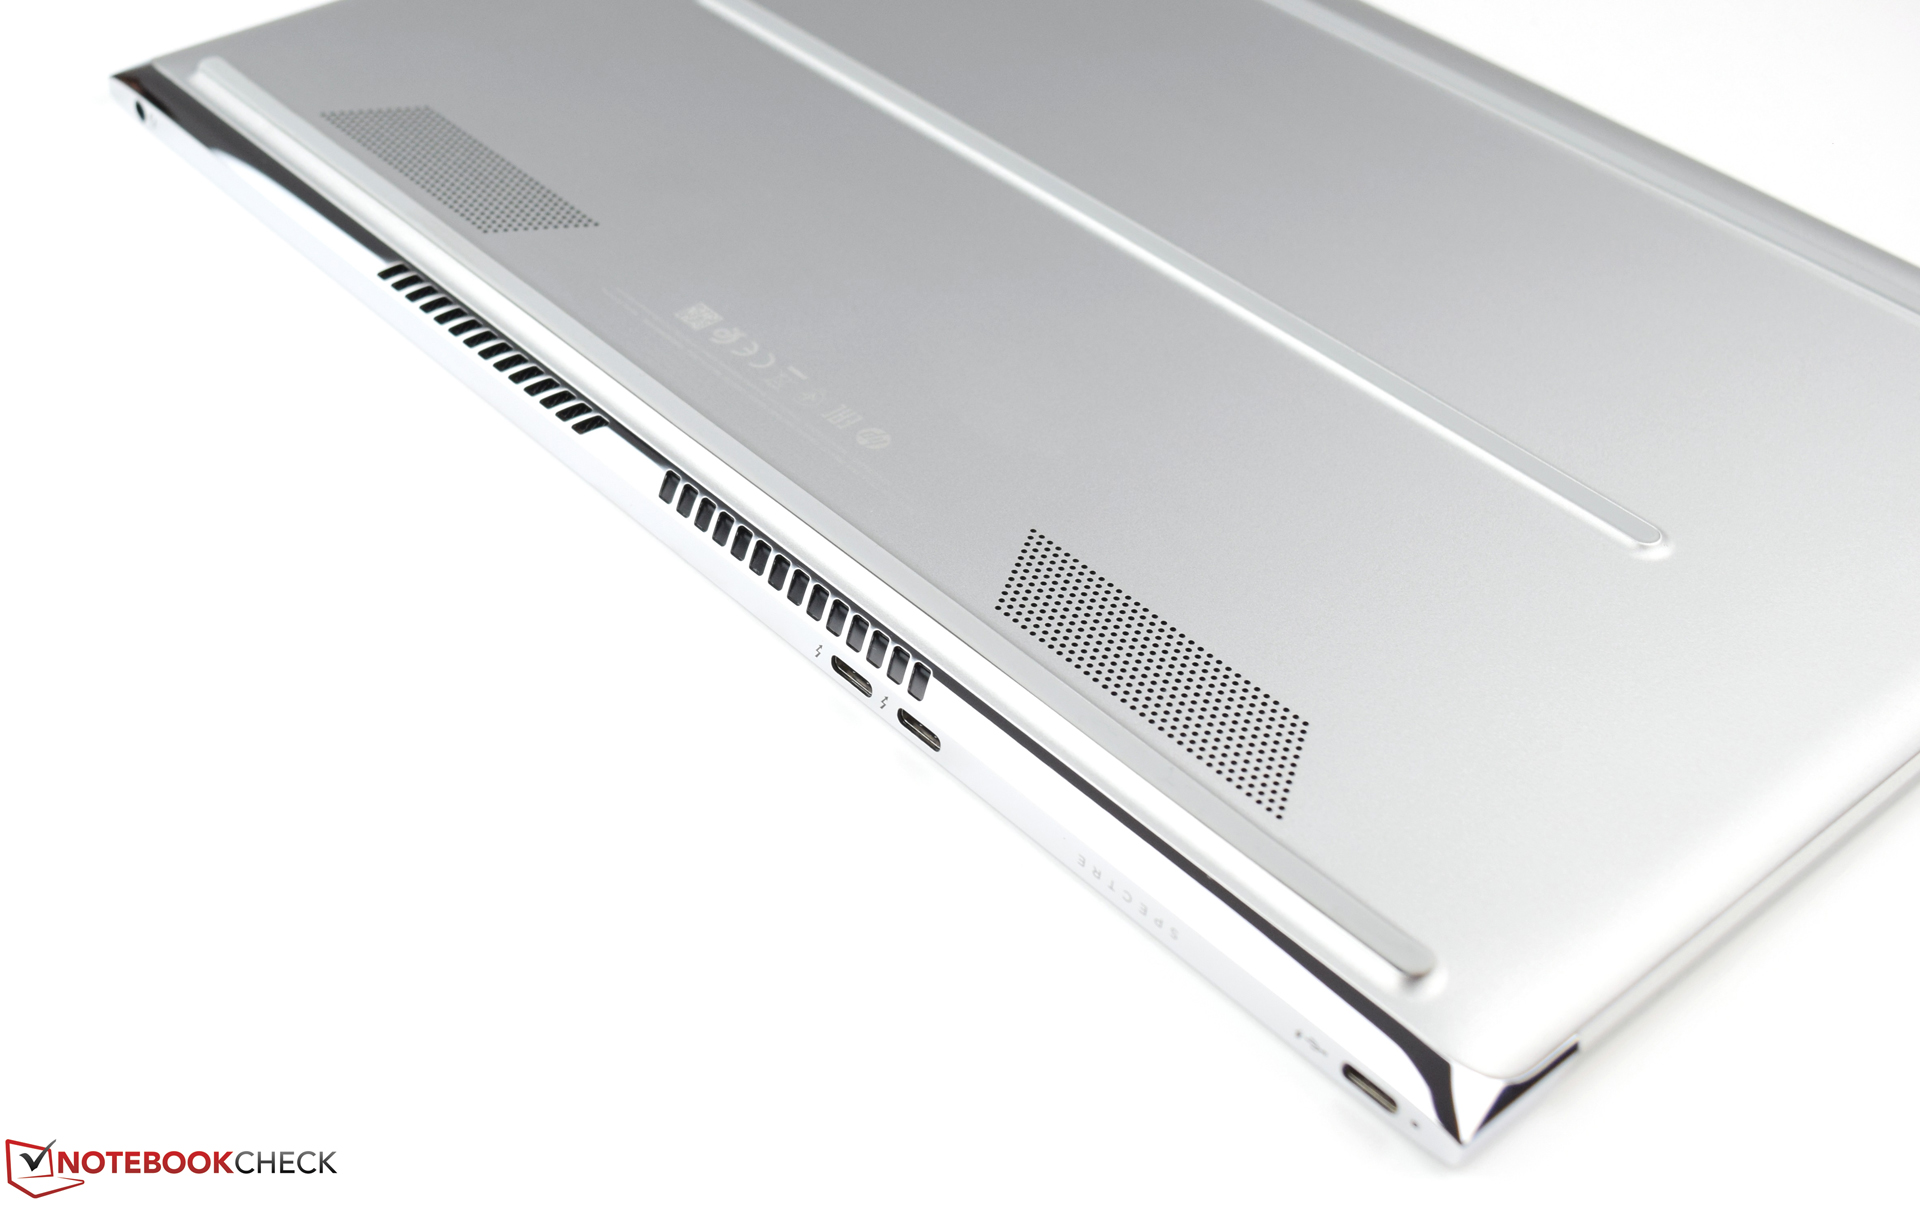
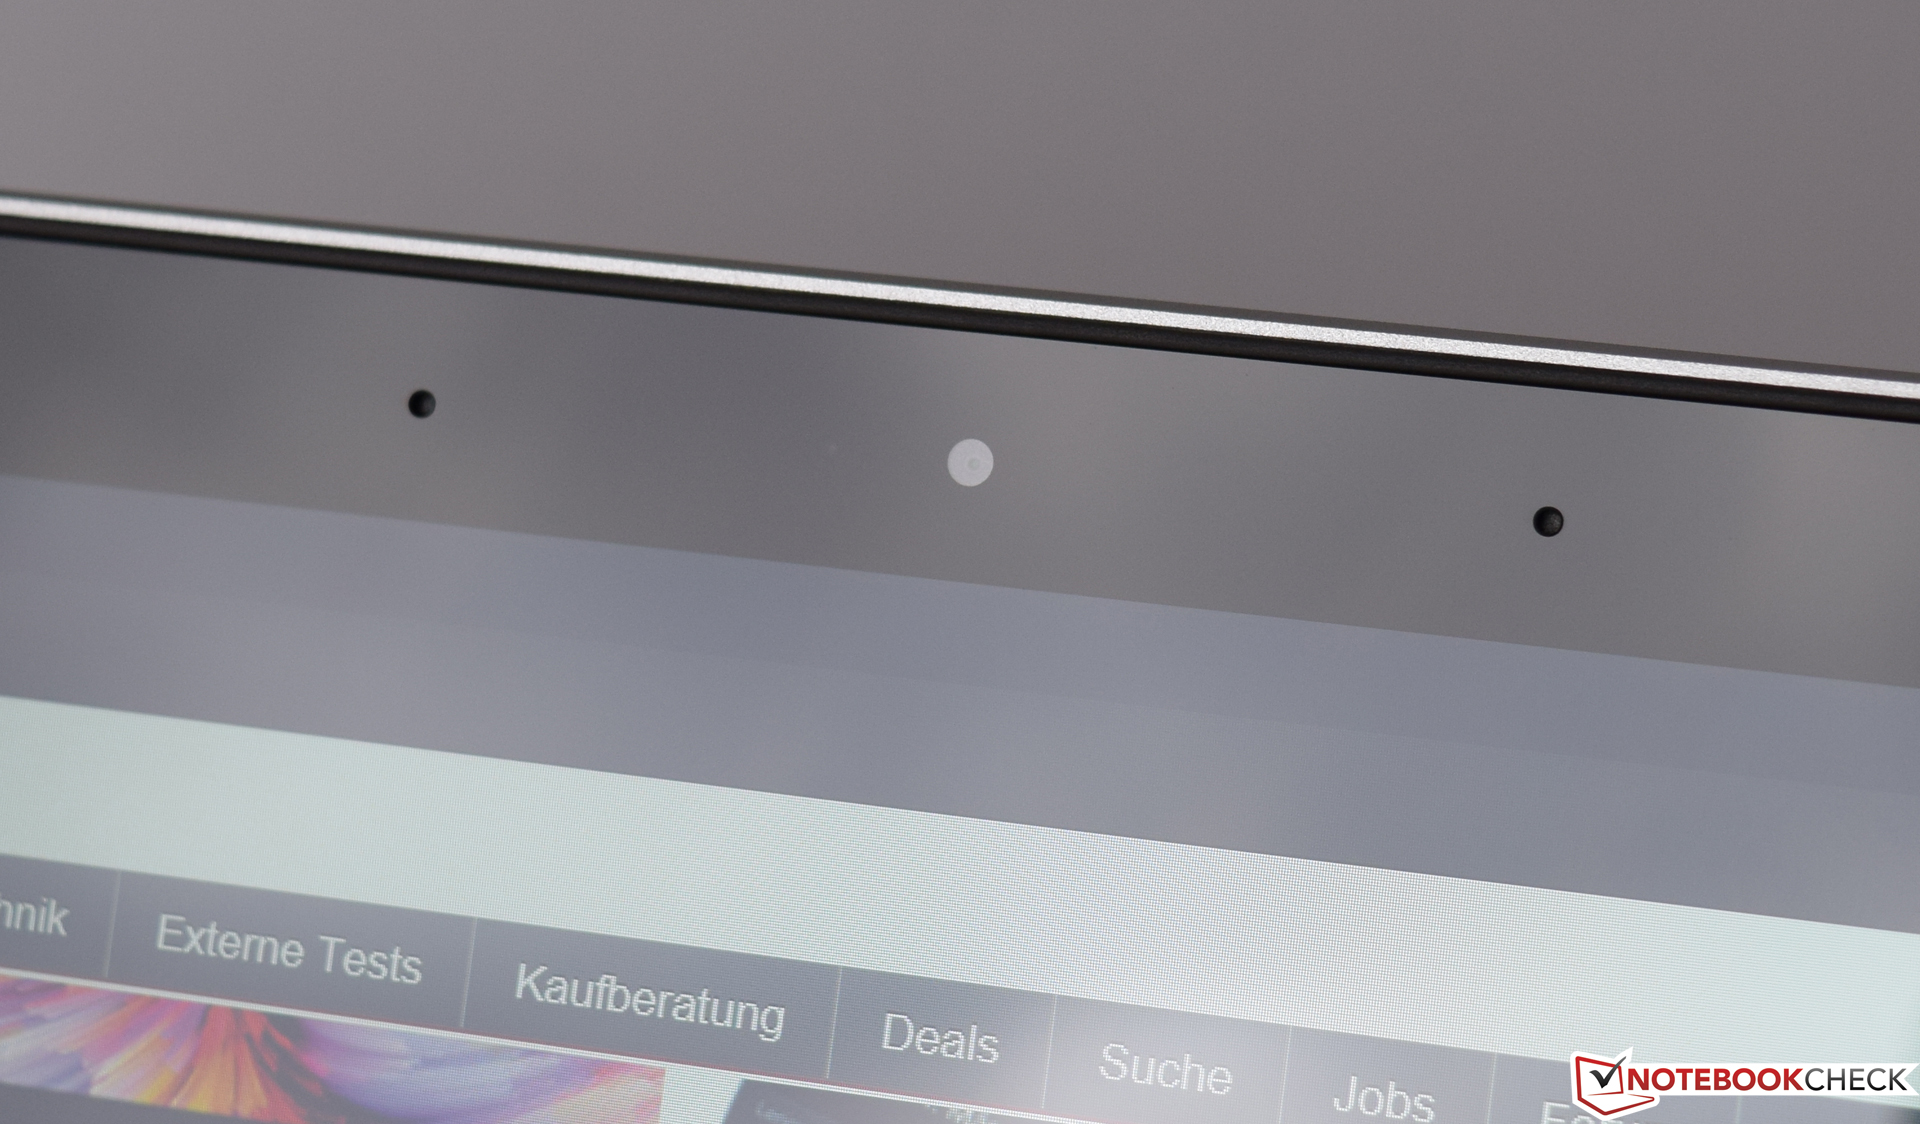
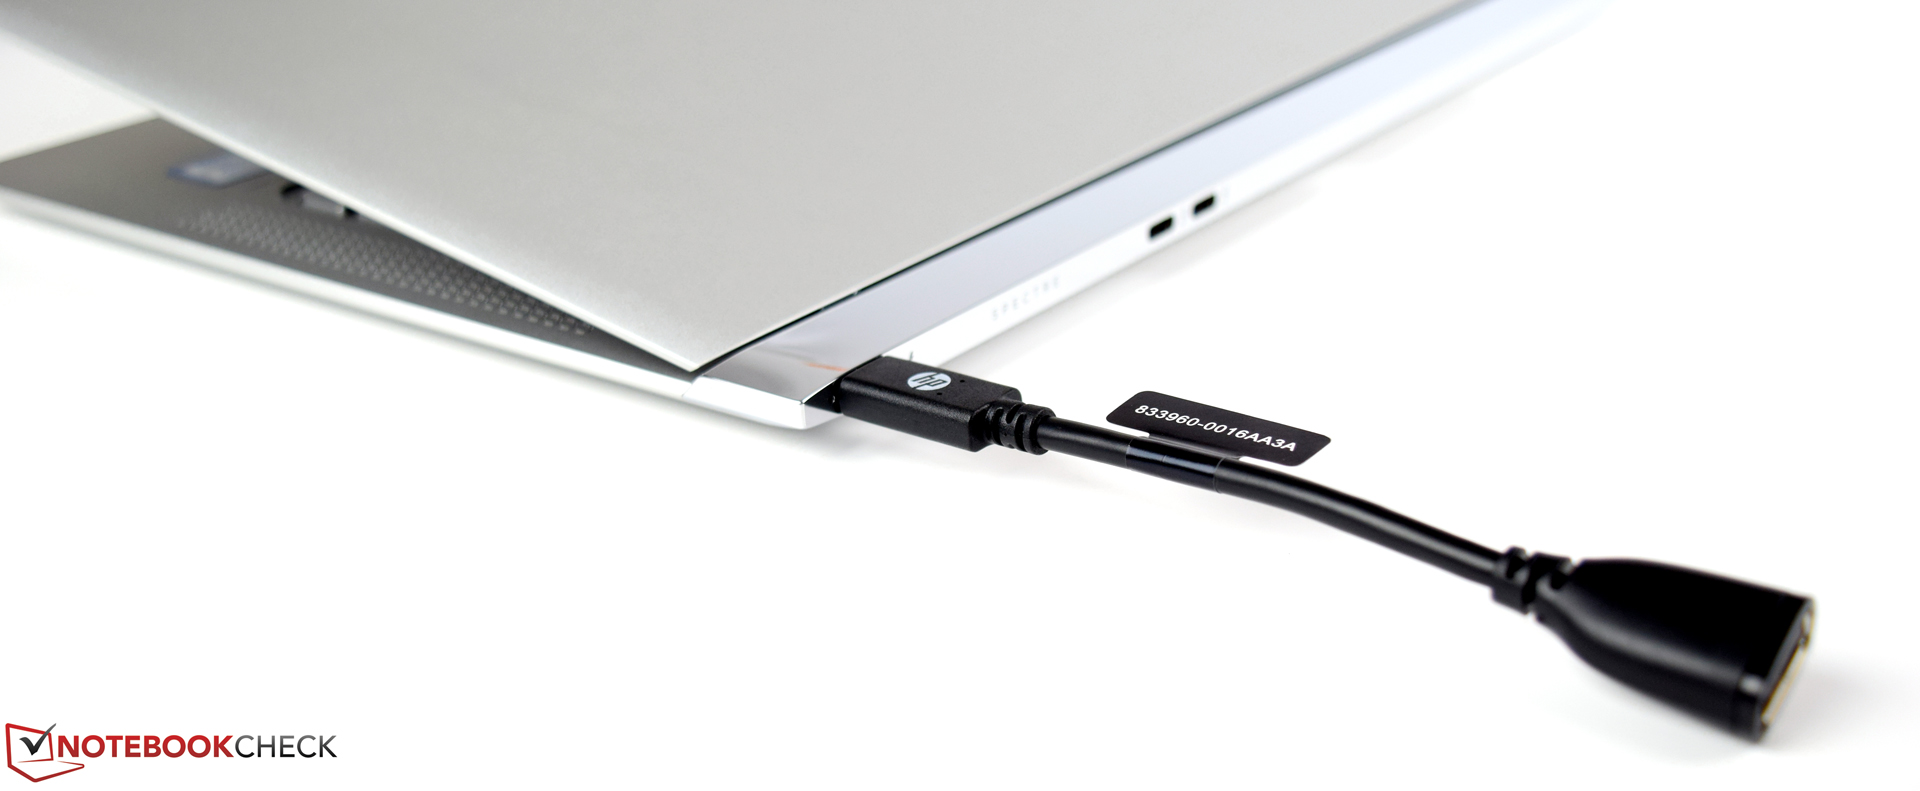
Men allt som glittrar är inte guld och vissa aspekter av HP Spectre 13 kan kritiseras. De begränsade skärmalternativen är tråkiga, eftersom en QHD+-skärm skulle se bra ut i Spectre 13. Många portar har också prioriterats bort av designrelaterade skäl. Även om utbudet har moderniserats – och två av de tre USB-C-portarna stöder Thunderbolt 3 – kan användningen av adaptrar ibland bli irriterande.
Prislappen är också väl tilltagen, men som köpare får man trots allt en dator i premiumsegmentet.
HP Spectre 13-v131ng
- 03/26/2017 v6 (old)
Sebastian Bade