Test: Dell Latitude 7490 (i7-8650U, FHD Touchscreen) Laptop (Sammanfattning)

| SD Card Reader | |
| average JPG Copy Test (av. of 3 runs) | |
| Lenovo ThinkPad X1 Carbon 2018-20KGS03900 (Toshiba Exceria Pro M501) | |
| Dell Latitude 7490 (Toshiba Exceria Pro M501 UHS-II) | |
| Lenovo ThinkPad T480-20L6S01V00 (Toshiba Exceria Pro SDXC 64 GB UHS-II) | |
| Dell Latitude 7480 (Toshiba (Exceria Pro SDXC UHS-II 64 GB) | |
| Toshiba Tecra X40-D | |
| Lenovo ThinkPad T480s-20L8S02E00 (Toshiba Exceria Pro SDXC 64 GB UHS-II) | |
| Genomsnitt av klass Office (19.8 - 198.5, n=22, senaste 2 åren) | |
| maximum AS SSD Seq Read Test (1GB) | |
| Lenovo ThinkPad X1 Carbon 2018-20KGS03900 (Toshiba Exceria Pro M501) | |
| Dell Latitude 7490 (Toshiba Exceria Pro M501 UHS-II) | |
| Dell Latitude 7480 (Toshiba (Exceria Pro SDXC UHS-II 64 GB) | |
| Lenovo ThinkPad T480s-20L8S02E00 (Toshiba Exceria Pro SDXC 64 GB UHS-II) | |
| Toshiba Tecra X40-D | |
| Lenovo ThinkPad T480-20L6S01V00 (Toshiba Exceria Pro SDXC 64 GB UHS-II) | |
| Genomsnitt av klass Office (27.4 - 249, n=21, senaste 2 åren) | |
| |||||||||||||||||||||||||
Distribution av ljusstyrkan: 87 %
Mitt på batteriet: 328.2 cd/m²
Kontrast: 887:1 (Svärta: 0.37 cd/m²)
ΔE ColorChecker Calman: 3.82 | ∀{0.5-29.43 Ø4.71}
calibrated: 3.5
ΔE Greyscale Calman: 3 | ∀{0.09-98 Ø4.96}
88% sRGB (Argyll 1.6.3 3D)
58% AdobeRGB 1998 (Argyll 1.6.3 3D)
64.8% AdobeRGB 1998 (Argyll 3D)
88.8% sRGB (Argyll 3D)
63.6% Display P3 (Argyll 3D)
Gamma: 2.36
CCT: 6962 K
| Dell Latitude 7490 AU Optronics AU0223D, IPS, 14", 1920x1080 | Dell Latitude 7480 LG Philips LGD0557, IPS, 14", 1920x1080 | Lenovo ThinkPad T480-20L6S01V00 Lenovo LP140WF6-SPB7, IPS, 14", 1920x1080 | Lenovo ThinkPad T480s-20L8S02E00 LP140QH2-SPB1, IPS LED, 14", 2560x1440 | Lenovo ThinkPad X1 Carbon 2018-20KGS03900 B140QAN02.0, IPS, 14", 2560x1440 | Toshiba Tecra X40-D Toshiba TOS508F, IPS, 14", 1920x1080 | Asus ASUSPRO B9440UA-GV0100T AU Optronics AUO353D / B140HAN03.5, IPS, 14", 1920x1080 | HP Elitebook 1040 G4-2XU40UT Chi Mei CMN14D7, IPS, 14", 1920x1080 | |
|---|---|---|---|---|---|---|---|---|
| Display | 3% | -36% | 11% | 35% | -34% | 1% | 7% | |
| Display P3 Coverage (%) | 63.6 | 65.4 3% | 39.24 -38% | 71.4 12% | 87.7 38% | 40.55 -36% | 64 1% | 66.8 5% |
| sRGB Coverage (%) | 88.8 | 92.3 4% | 58.8 -34% | 96.6 9% | 100 13% | 61 -31% | 89.1 0% | 97.1 9% |
| AdobeRGB 1998 Coverage (%) | 64.8 | 65.8 2% | 40.56 -37% | 72.1 11% | 99.9 54% | 41.89 -35% | 65.2 1% | 69 6% |
| Response Times | 10% | 25% | 20% | -14% | 19% | 2% | 18% | |
| Response Time Grey 50% / Grey 80% * (ms) | 48.4 ? | 40.8 ? 16% | 35.6 ? 26% | 36 ? 26% | 59.2 ? -22% | 38 ? 21% | 48.8 ? -1% | 34.4 ? 29% |
| Response Time Black / White * (ms) | 32.4 ? | 31.2 ? 4% | 24.8 ? 23% | 28 ? 14% | 34.4 ? -6% | 26.8 ? 17% | 30.8 ? 5% | 30 ? 7% |
| PWM Frequency (Hz) | 20410 ? | 26040 ? | ||||||
| Screen | 7% | -36% | 5% | 40% | -45% | -40% | 1% | |
| Brightness middle (cd/m²) | 328.2 | 344 5% | 307 -6% | 311 -5% | 578 76% | 283.9 -13% | 319 -3% | 295.9 -10% |
| Brightness (cd/m²) | 305 | 321 5% | 295 -3% | 302 -1% | 533 75% | 261 -14% | 294 -4% | 287 -6% |
| Brightness Distribution (%) | 87 | 85 -2% | 90 3% | 91 5% | 84 -3% | 85 -2% | 87 0% | 87 0% |
| Black Level * (cd/m²) | 0.37 | 0.32 14% | 0.25 32% | 0.36 3% | 0.38 -3% | 0.25 32% | 0.26 30% | 0.23 38% |
| Contrast (:1) | 887 | 1075 21% | 1228 38% | 864 -3% | 1521 71% | 1136 28% | 1227 38% | 1287 45% |
| Colorchecker dE 2000 * | 3.82 | 2.6 32% | 5.7 -49% | 3 21% | 1.9 50% | 6.4 -68% | 7.1 -86% | 2.83 26% |
| Colorchecker dE 2000 max. * | 5.58 | 7.8 -40% | 21.3 -282% | 6.1 -9% | 3.8 32% | 18.7 -235% | 13.7 -146% | 7.34 -32% |
| Colorchecker dE 2000 calibrated * | 3.5 | 4.7 -34% | 1.7 51% | 0.8 77% | ||||
| Greyscale dE 2000 * | 3 | 2.6 13% | 3.7 -23% | 4 -33% | 3 -0% | 6.3 -110% | 9.61 -220% | 5.2 -73% |
| Gamma | 2.36 93% | 2.28 96% | 2.11 104% | 2.17 101% | 2.14 103% | 2.39 92% | 2.33 94% | 2.28 96% |
| CCT | 6962 93% | 7050 92% | 7353 88% | 6961 93% | 6377 102% | 6511 100% | 6021 108% | 7056 92% |
| Color Space (Percent of AdobeRGB 1998) (%) | 58 | 65.82 13% | 37.4 -36% | 66.7 15% | 88.8 53% | 38 -34% | 54.01 -7% | 63 9% |
| Color Space (Percent of sRGB) (%) | 88 | 92.27 5% | 58.7 -33% | 96.7 10% | 100 14% | 60 -32% | 83.02 -6% | 97 10% |
| Totalt genomsnitt (program/inställningar) | 7% /
6% | -16% /
-28% | 12% /
8% | 20% /
32% | -20% /
-34% | -12% /
-27% | 9% /
4% |
* ... mindre är bättre
Visa svarstider
| ↔ Svarstid svart till vitt | ||
|---|---|---|
| 32.4 ms ... stiga ↗ och falla ↘ kombinerat | ↗ 18.8 ms stiga | 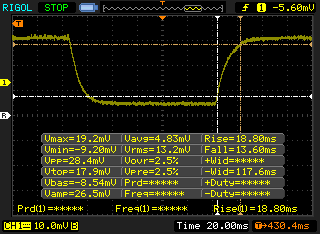 |
| ↘ 13.6 ms hösten | ||
| Skärmen visar långsamma svarsfrekvenser i våra tester och kommer att vara otillfredsställande för spelare. I jämförelse sträcker sig alla testade enheter från 0.1 (minst) till 240 (maximalt) ms. » 88 % av alla enheter är bättre. Detta innebär att den uppmätta svarstiden är sämre än genomsnittet av alla testade enheter (19.8 ms). | ||
| ↔ Svarstid 50 % grått till 80 % grått | ||
| 48.4 ms ... stiga ↗ och falla ↘ kombinerat | ↗ 27.6 ms stiga | 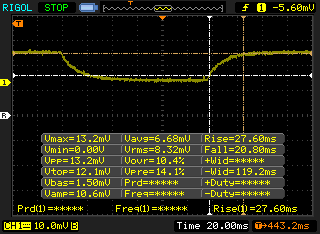 |
| ↘ 20.8 ms hösten | ||
| Skärmen visar långsamma svarsfrekvenser i våra tester och kommer att vara otillfredsställande för spelare. I jämförelse sträcker sig alla testade enheter från 0.165 (minst) till 636 (maximalt) ms. » 84 % av alla enheter är bättre. Detta innebär att den uppmätta svarstiden är sämre än genomsnittet av alla testade enheter (31 ms). | ||
Skärmflimmer / PWM (Puls-Width Modulation)
| Skärmflimmer / PWM upptäcktes inte | 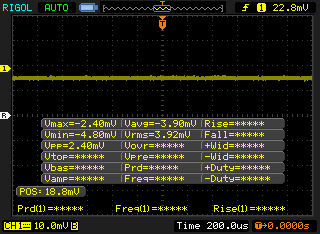 | ||
Som jämförelse: 52 % av alla testade enheter använder inte PWM för att dämpa skärmen. Om PWM upptäcktes mättes ett medelvärde av 7757 (minst: 5 - maximum: 343500) Hz. | |||
* ... mindre är bättre
| PCMark 8 Home Score Accelerated v2 | 4029 poäng | |
| PCMark 8 Creative Score Accelerated v2 | 5165 poäng | |
| PCMark 8 Work Score Accelerated v2 | 5155 poäng | |
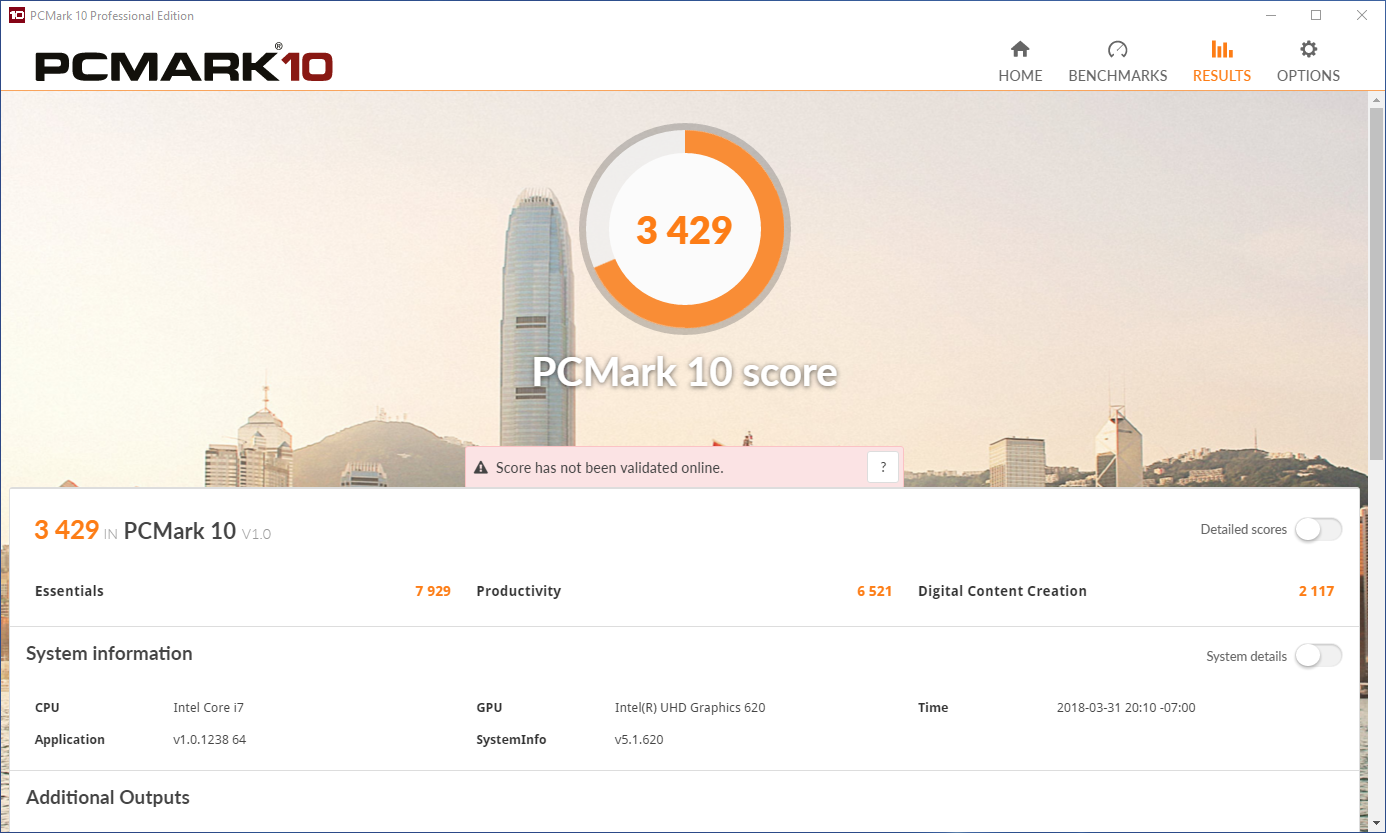
| PCMark 10 Score | 3429 poäng | |
Hjälp | ||
| Dell Latitude 7490 Samsung PM961 MZVLW256HEHP | Dell Latitude 7480 Intel SSDSCKKF256H6 | Lenovo ThinkPad T480-20L6S01V00 Samsung SSD PM981 MZVLB512HAJQ | Lenovo ThinkPad T480s-20L8S02E00 Samsung SSD PM981 MZVLB512HAJQ | Lenovo ThinkPad X1 Carbon 2018-20KGS03900 Samsung SSD PM981 MZVLB512HAJQ | Toshiba Tecra X40-D Samsung PM961 MZVLW256HEHP | Asus ASUSPRO B9440UA-GV0100T Micron SSD 1100 (MTFDDAV256TBN) | HP Elitebook 1040 G4-2XU40UT Toshiba XG4 NVMe (THNSN5512GPUK) | Genomsnitt Samsung PM961 MZVLW256HEHP | |
|---|---|---|---|---|---|---|---|---|---|
| AS SSD | -59% | -603% | 76% | 78% | 22% | -62% | -16% | -98% | |
| Copy Game MB/s (MB/s) | 382.3 | 228.1 -40% | 676 77% | 1110 190% | 1107 190% | 394.2 3% | 537 ? 40% | ||
| Copy Program MB/s (MB/s) | 227.1 | 148.2 -35% | 254.8 12% | 387.5 71% | 460.2 103% | 133.7 -41% | 343 ? 51% | ||
| Copy ISO MB/s (MB/s) | 872 | 262.3 -70% | 921 6% | 1412 62% | 1247 43% | 534 -39% | 1004 ? 15% | ||
| Score Total (Points) | 2350 | 764 -67% | 2348 0% | 4115 75% | 3529 50% | 3576 52% | 842 -64% | 2299 -2% | 2565 ? 9% |
| Score Write (Points) | 536 | 249 -54% | 147 -73% | 1708 219% | 1801 236% | 675 26% | 372 -31% | 848 58% | 587 ? 10% |
| Score Read (Points) | 1242 | 338 -73% | 1480 19% | 1623 31% | 1168 -6% | 1963 58% | 307 -75% | 979 -21% | 1378 ? 11% |
| Access Time Write * (ms) | 0.03 | 0.042 -40% | 2.515 -8283% | 0.033 -10% | 0.027 10% | 0.028 7% | 0.054 -80% | 0.038 -27% | 0.4637 ? -1446% |
| Access Time Read * (ms) | 0.04 | 0.082 -105% | 0.041 -2% | 0.045 -13% | 0.029 27% | 0.061 -53% | 0.088 -120% | 0.105 -163% | 0.06777 ? -69% |
| 4K-64 Write (MB/s) | 329.6 | 125.4 -62% | 96.2 -71% | 1456 342% | 1529 364% | 438.4 33% | 252.9 -23% | 662 101% | 419 ? 27% |
| 4K-64 Read (MB/s) | 955 | 260 -73% | 1278 34% | 1329 39% | 876 -8% | 1663 74% | 234 -75% | 782 -18% | 1112 ? 16% |
| 4K Write (MB/s) | 114.9 | 86.6 -25% | 1.76 -98% | 114.4 0% | 134.3 17% | 124.8 9% | 77.5 -33% | 100.1 -13% | 91.6 ? -20% |
| 4K Read (MB/s) | 48.13 | 28.89 -40% | 58 21% | 49.81 3% | 52.4 9% | 51.6 7% | 24.21 -50% | 38.49 -20% | 45.1 ? -6% |
| Seq Write (MB/s) | 919 | 367.5 -60% | 487.1 -47% | 1382 50% | 1376 50% | 1117 22% | 419.6 -54% | 863 -6% | 960 ? 4% |
| Seq Read (MB/s) | 2385 | 492.8 -79% | 1441 -40% | 2440 2% | 2396 0% | 2479 4% | 490.2 -79% | 1585 -34% | 2019 ? -15% |
* ... mindre är bättre

| 3DMark Cloud Gate Standard Score | 8591 poäng | |
| 3DMark Fire Strike Score | 1077 poäng | |
Hjälp | ||
| Rocket League | |
| 1280x720 Performance (sortera efter värde) | |
| Dell Latitude 7490 | |
| Genomsnitt Intel UHD Graphics 620 (20.1 - 95, n=26) | |
| 1920x1080 Performance (sortera efter värde) | |
| Dell Latitude 7490 | |
| Genomsnitt Intel UHD Graphics 620 (17.1 - 78.4, n=13) | |
| 1920x1080 Quality AA:Medium FX (sortera efter värde) | |
| Dell Latitude 7490 | |
| Genomsnitt Intel UHD Graphics 620 (13.1 - 43, n=24) | |
| 1920x1080 High Quality AA:High FX (sortera efter värde) | |
| Dell Latitude 7490 | |
| Asus Zephyrus M GM501 | |
| Genomsnitt Intel UHD Graphics 620 (13.2 - 24.7, n=21) | |
| låg | med. | hög | ultra | |
|---|---|---|---|---|
| BioShock Infinite (2013) | 53 | 35 | 30 | 10 |
| Civilization 6 (2016) | 33 | 15 | 6 | 5 |
| Rocket League (2017) | 50 | 32 | 20 |
Ljudnivå
| Låg belastning |
| 28.2 / 28.2 / 31.4 dB(A) |
| Hög belastning |
| 31.7 / 41.2 dB(A) |
 | ||
30 dB tyst 40 dB(A) hörbar 50 dB(A) högt ljud |
||
min: | ||
| Dell Latitude 7490 UHD Graphics 620, i7-8650U, Samsung PM961 MZVLW256HEHP | Dell Latitude 7480 HD Graphics 620, i7-7600U, Intel SSDSCKKF256H6 | Lenovo ThinkPad T480-20L6S01V00 GeForce MX150, i5-8550U, Samsung SSD PM981 MZVLB512HAJQ | Lenovo ThinkPad T480s-20L8S02E00 GeForce MX150, i5-8550U, Samsung SSD PM981 MZVLB512HAJQ | Lenovo ThinkPad X1 Carbon 2018-20KGS03900 UHD Graphics 620, i5-8550U, Samsung SSD PM981 MZVLB512HAJQ | Toshiba Tecra X40-D HD Graphics 620, i7-7600U, Samsung PM961 MZVLW256HEHP | Asus ASUSPRO B9440UA-GV0100T HD Graphics 620, i5-7200U, Micron SSD 1100 (MTFDDAV256TBN) | HP Elitebook 1040 G4-2XU40UT HD Graphics 630, i7-7820HQ, Toshiba XG4 NVMe (THNSN5512GPUK) | |
|---|---|---|---|---|---|---|---|---|
| Noise | 7% | 0% | -2% | -1% | 2% | -3% | 3% | |
| av / miljö * (dB) | 28.2 | 29 -3% | 29 -3% | 28.9 -2% | 28 1% | 29 -3% | 28.2 -0% | |
| Idle Minimum * (dB) | 28.2 | 28.6 -1% | 29 -3% | 29 -3% | 28.9 -2% | 28 1% | 29 -3% | 28.2 -0% |
| Idle Average * (dB) | 28.2 | 28.6 -1% | 29 -3% | 29 -3% | 28.9 -2% | 28 1% | 29 -3% | 28.2 -0% |
| Idle Maximum * (dB) | 31.4 | 28.6 9% | 29 8% | 29 8% | 32.5 -4% | 28.2 10% | 29 8% | 28.2 10% |
| Load Average * (dB) | 31.7 | 30.2 5% | 35.6 -12% | 36.5 -15% | 35.1 -11% | 33.2 -5% | 36.7 -16% | 33.3 -5% |
| Load Maximum * (dB) | 41.2 | 31.2 24% | 35.6 14% | 38.2 7% | 35.1 15% | 39.9 3% | 40.2 2% | 35.3 14% |
| Witcher 3 ultra * (dB) | 32.5 | 32.8 |
* ... mindre är bättre
(±) Den maximala temperaturen på ovansidan är 45 °C / 113 F, jämfört med genomsnittet av 34.3 °C / 94 F , allt från 21.2 till 62.5 °C för klassen Office.
(-) Botten värms upp till maximalt 56 °C / 133 F, jämfört med genomsnittet av 36.8 °C / 98 F
(+) Vid tomgångsbruk är medeltemperaturen för ovansidan 25.2 °C / 77 F, jämfört med enhetsgenomsnittet på 29.5 °C / ### class_avg_f### F.
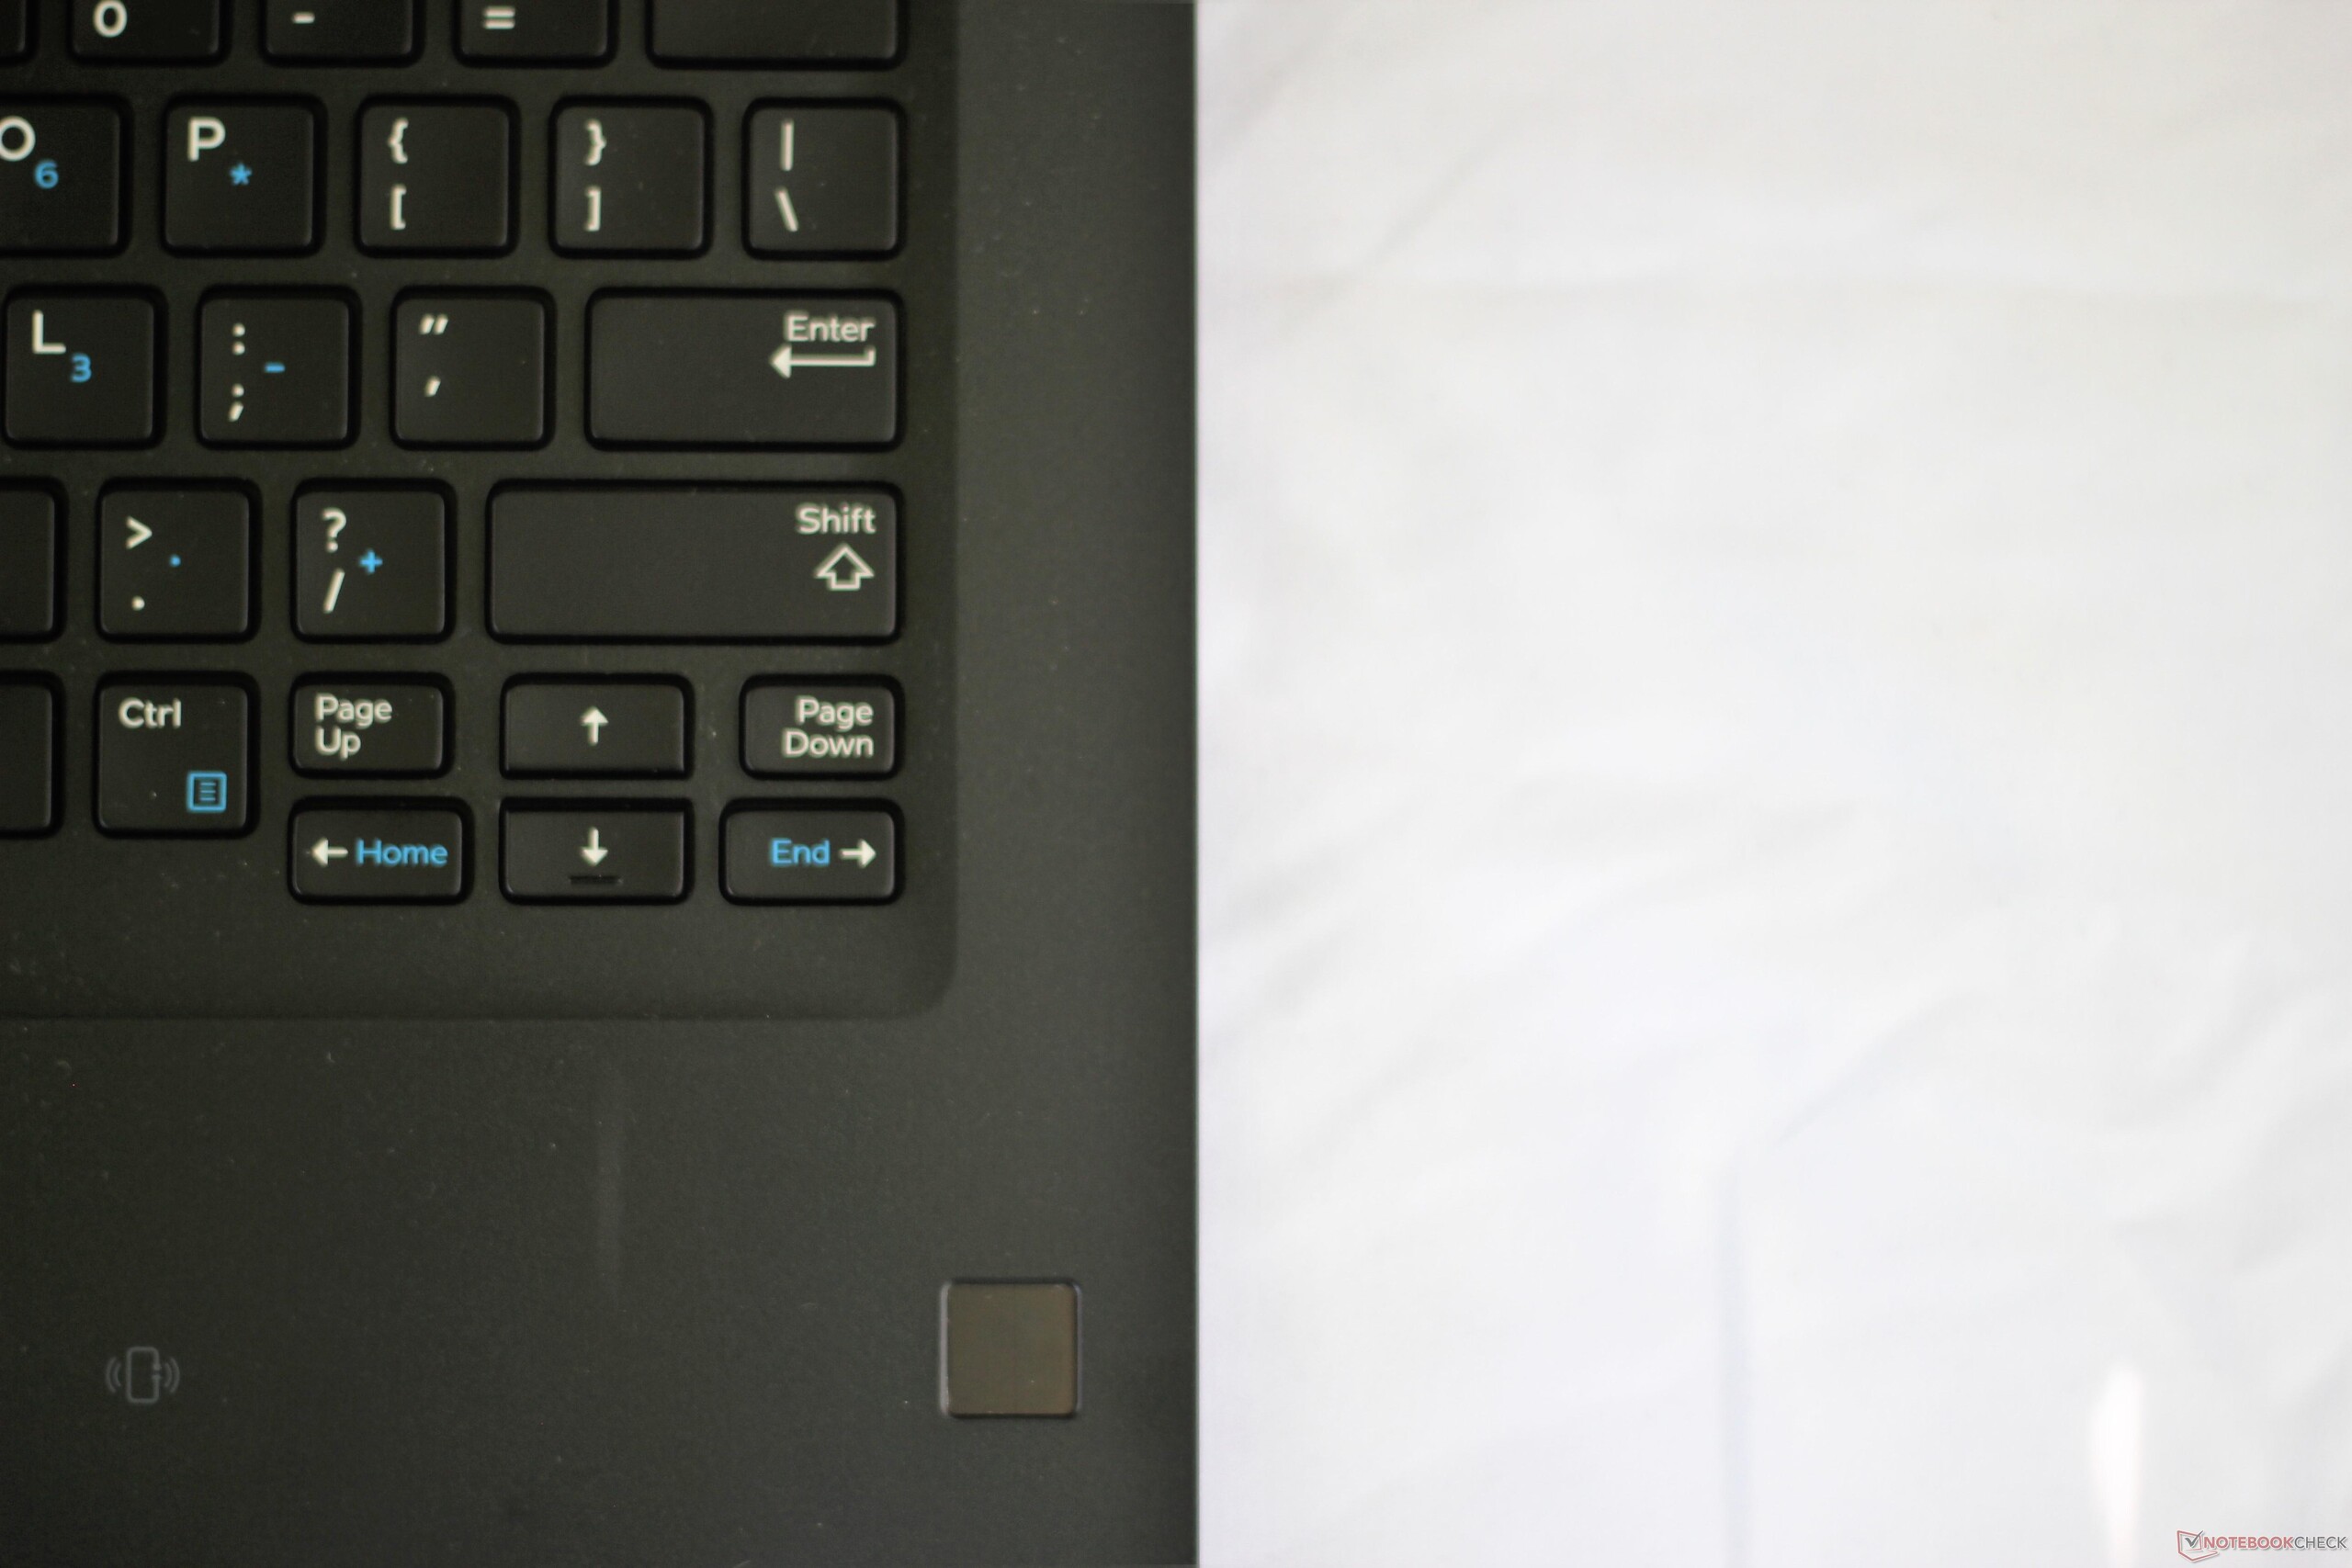
(+) Handledsstöden och pekplattan är kallare än hudtemperaturen med maximalt 28 °C / 82.4 F och är därför svala att ta på.
(±) Medeltemperaturen för handledsstödsområdet på liknande enheter var 27.5 °C / 81.5 F (-0.5 °C / -0.9 F).
Dell Latitude 7490 ljudanalys
(±) | högtalarljudstyrkan är genomsnittlig men bra (73.8 dB)
Bas 100 - 315 Hz
(±) | reducerad bas - i genomsnitt 14.8% lägre än medianen
(±) | linjäriteten för basen är genomsnittlig (9.4% delta till föregående frekvens)
Mellan 400 - 2000 Hz
(+) | balanserad mellan - endast 4.4% från medianen
(±) | linjäriteten för mids är genomsnittlig (8% delta till föregående frekvens)
Högsta 2 - 16 kHz
(+) | balanserade toppar - endast 4.4% från medianen
(±) | linjäriteten för toppar är genomsnittlig (8.2% delta till föregående frekvens)
Totalt 100 - 16 000 Hz
(±) | linjäriteten för det totala ljudet är genomsnittlig (19.9% skillnad mot median)
Jämfört med samma klass
» 42% av alla testade enheter i den här klassen var bättre, 9% liknande, 49% sämre
» Den bästa hade ett delta på 7%, genomsnittet var 21%, sämst var 53%
Jämfört med alla testade enheter
» 51% av alla testade enheter var bättre, 7% liknande, 42% sämre
» Den bästa hade ett delta på 4%, genomsnittet var 23%, sämst var 134%
Lenovo ThinkPad T480s-20L8S02E00 ljudanalys
(±) | högtalarljudstyrkan är genomsnittlig men bra (78.9 dB)
Bas 100 - 315 Hz
(-) | nästan ingen bas - i genomsnitt 19.4% lägre än medianen
(±) | linjäriteten för basen är genomsnittlig (12.1% delta till föregående frekvens)
Mellan 400 - 2000 Hz
(±) | högre mellan - i genomsnitt 6.5% högre än median
(±) | linjäriteten för mids är genomsnittlig (9.6% delta till föregående frekvens)
Högsta 2 - 16 kHz
(+) | balanserade toppar - endast 3.5% från medianen
(±) | linjäriteten för toppar är genomsnittlig (7.6% delta till föregående frekvens)
Totalt 100 - 16 000 Hz
(±) | linjäriteten för det totala ljudet är genomsnittlig (22.1% skillnad mot median)
Jämfört med samma klass
» 58% av alla testade enheter i den här klassen var bättre, 8% liknande, 34% sämre
» Den bästa hade ett delta på 7%, genomsnittet var 21%, sämst var 53%
Jämfört med alla testade enheter
» 64% av alla testade enheter var bättre, 6% liknande, 30% sämre
» Den bästa hade ett delta på 4%, genomsnittet var 23%, sämst var 134%
| Av/Standby | |
| Låg belastning | |
| Hög belastning |
|
Förklaring:
min: | |
| Dell Latitude 7490 i7-8650U, UHD Graphics 620, Samsung PM961 MZVLW256HEHP, IPS, 1920x1080, 14" | Dell Latitude 7480 i7-7600U, HD Graphics 620, Intel SSDSCKKF256H6, IPS, 1920x1080, 14" | Lenovo ThinkPad T480-20L6S01V00 i5-8550U, GeForce MX150, Samsung SSD PM981 MZVLB512HAJQ, IPS, 1920x1080, 14" | Lenovo ThinkPad T480s-20L8S02E00 i5-8550U, GeForce MX150, Samsung SSD PM981 MZVLB512HAJQ, IPS LED, 2560x1440, 14" | Lenovo ThinkPad X1 Carbon 2018-20KGS03900 i5-8550U, UHD Graphics 620, Samsung SSD PM981 MZVLB512HAJQ, IPS, 2560x1440, 14" | Toshiba Tecra X40-D i7-7600U, HD Graphics 620, Samsung PM961 MZVLW256HEHP, IPS, 1920x1080, 14" | Asus ASUSPRO B9440UA-GV0100T i5-7200U, HD Graphics 620, Micron SSD 1100 (MTFDDAV256TBN), IPS, 1920x1080, 14" | HP Elitebook 1040 G4-2XU40UT i7-7820HQ, HD Graphics 630, Toshiba XG4 NVMe (THNSN5512GPUK), IPS, 1920x1080, 14" | |
|---|---|---|---|---|---|---|---|---|
| Power Consumption | 8% | -31% | -31% | -29% | 2% | 11% | -31% | |
| Idle Minimum * (Watt) | 3.1 | 4.32 -39% | 3.6 -16% | 3.4 -10% | 3.8 -23% | 5.2 -68% | 3.1 -0% | 5.1 -65% |
| Idle Average * (Watt) | 6.5 | 6.27 4% | 7.1 -9% | 7.5 -15% | 8.9 -37% | 6.9 -6% | 6.1 6% | 7 -8% |
| Idle Maximum * (Watt) | 7.6 | 6.35 16% | 9.5 -25% | 10.8 -42% | 11.9 -57% | 7 8% | 6.8 11% | 11.7 -54% |
| Load Average * (Watt) | 43 | 29.82 31% | 63.9 -49% | 55.4 -29% | 47.5 -10% | 24.6 43% | 27.4 36% | 41.2 4% |
| Load Maximum * (Watt) | 43.8 | 30.64 30% | 67.3 -54% | 70.3 -61% | 52.5 -20% | 30.1 31% | 43.7 -0% | 56.9 -30% |
| Witcher 3 ultra * (Watt) | 53.9 | 34 |
* ... mindre är bättre
| Dell Latitude 7490 i7-8650U, UHD Graphics 620, 60 Wh | Dell Latitude 7480 i7-7600U, HD Graphics 620, 60 Wh | Lenovo ThinkPad T480-20L6S01V00 i5-8550U, GeForce MX150, 72 Wh | Lenovo ThinkPad T480s-20L8S02E00 i5-8550U, GeForce MX150, 57 Wh | Lenovo ThinkPad X1 Carbon 2018-20KGS03900 i5-8550U, UHD Graphics 620, 57 Wh | Toshiba Tecra X40-D i7-7600U, HD Graphics 620, 48 Wh | Asus ASUSPRO B9440UA-GV0100T i5-7200U, HD Graphics 620, 48 Wh | HP Elitebook 1040 G4-2XU40UT i7-7820HQ, HD Graphics 630, 67 Wh | |
|---|---|---|---|---|---|---|---|---|
| Batteridrifttid | 57% | 57% | 1% | 11% | -6% | 12% | 15% | |
| Reader / Idle (h) | 18.6 | 27.7 49% | 27.9 50% | 22.8 23% | 22.1 19% | 14.6 -22% | 19 2% | 22.5 21% |
| WiFi v1.3 (h) | 9.4 | 12 28% | 13.2 40% | 8.8 -6% | 8.7 -7% | 6 -36% | 8.9 -5% | 11.1 18% |
| Load (h) | 1.5 | 2.9 93% | 2.7 80% | 1.3 -13% | 1.8 20% | 2.1 40% | 2.1 40% | 1.6 7% |
För
Emot
Läs den fullständiga versionen av den här recensionen på engelska här.
Dell har gjort ett utmärkt jobb med Latitude 7490, men i huvudsak på grund av att dom gjorde ett bra jobb med 7480. I princip allt har helt enkelt följt med sen förra årets modell. Den största styrkan Latitude 7490 har framför 7480 är att den inkluderar Intels fyrkärniga 8:e generation av CPU:er. Trots att dom har samma TDP på 15 W som tidigare processorer från U-serien så dubblerar nästan Kaby Lake R-modellerna prestandan jämfört med sina motsvarigheter från den 7:e generationen. Latitude 7490 är ett bra exempel på fördelarna i applikationsprestanda som går att få med en uppgradering till Kaby Lake R, men den är också ett exempel på en del av dom uppoffringar som dom nya chippen gör. Värmestrypning är ett stort problem här. Vid tung belastning så kan CPU:n använda boost fullt ut, men bara under korta stunder.
Vi ska vara uppriktiga: om du redan äger en Latitude 7480 kan du strunta i 7490. Den extra CPU-prestandan kommer bara att märkas i processor-intensiva uppgifter; om ditt arbetsflöde inte inkluderar tung användning av kalkylblad eller annat CPU-tungt arbete så är processoruppgraderingen inte värd kostnaden av en helt ny maskin. Men om du letar efter en ny företagslaptop eller vill byta ut en maskin som vid det här laget är några år gammal så borde Latitude 7490 definitivt övervägas. Dell har skapat en utmärkt maskin som kan stå emot branschens andra kämpar.
Dell Latitude 7490
- 04/08/2018 v6 (old)
Sam Medley
Price comparison
