Test: Dell Inspiron 13 7370 (i5-8250U) Laptop (Sammanfattning)

| SD Card Reader | |
| average JPG Copy Test (av. of 3 runs) | |
| Toshiba Tecra X40-D | |
| Dell Inspiron 13 7370 (Toshiba Exceria Pro SDXC 64 GB UHS-II) | |
| maximum AS SSD Seq Read Test (1GB) | |
| Toshiba Tecra X40-D | |
| Dell Inspiron 13 7370 (Toshiba Exceria Pro SDXC 64 GB UHS-II) | |
| Networking | |
| iperf3 transmit AX12 | |
| Dell Inspiron 13 7370 | |
| HP Spectre 13-v131ng | |
| Microsoft Surface Laptop i5 | |
| Toshiba Tecra X40-D | |
| iperf3 receive AX12 | |
| Toshiba Tecra X40-D | |
| Microsoft Surface Laptop i5 | |
| Dell Inspiron 13 7370 | |
| HP Spectre 13-v131ng | |
| |||||||||||||||||||||||||
Distribution av ljusstyrkan: 87 %
Mitt på batteriet: 246 cd/m²
Kontrast: 912:1 (Svärta: 0.33 cd/m²)
ΔE ColorChecker Calman: 5.39 | ∀{0.5-29.43 Ø4.71}
ΔE Greyscale Calman: 5.93 | ∀{0.09-98 Ø4.96}
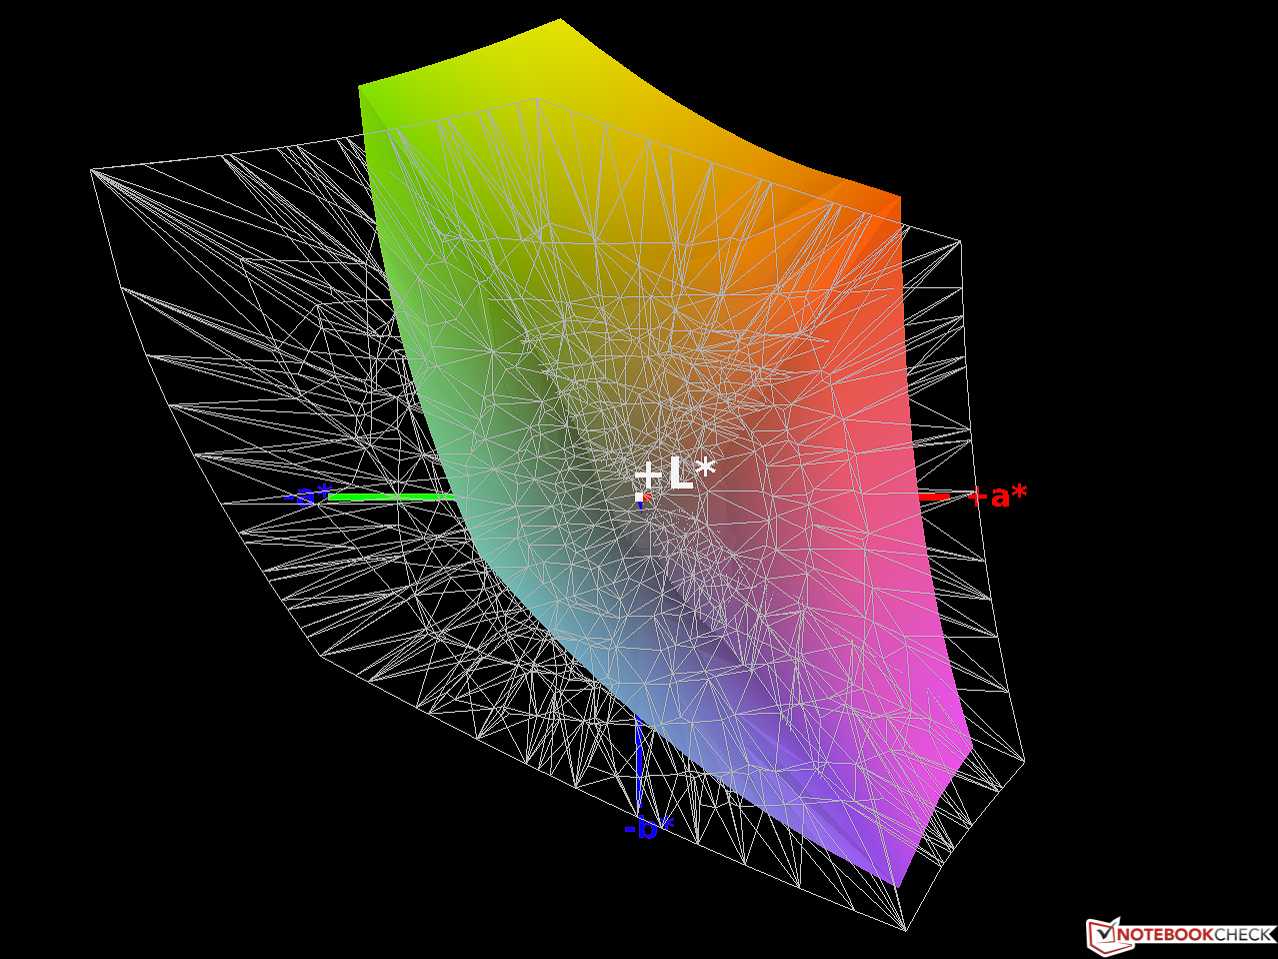
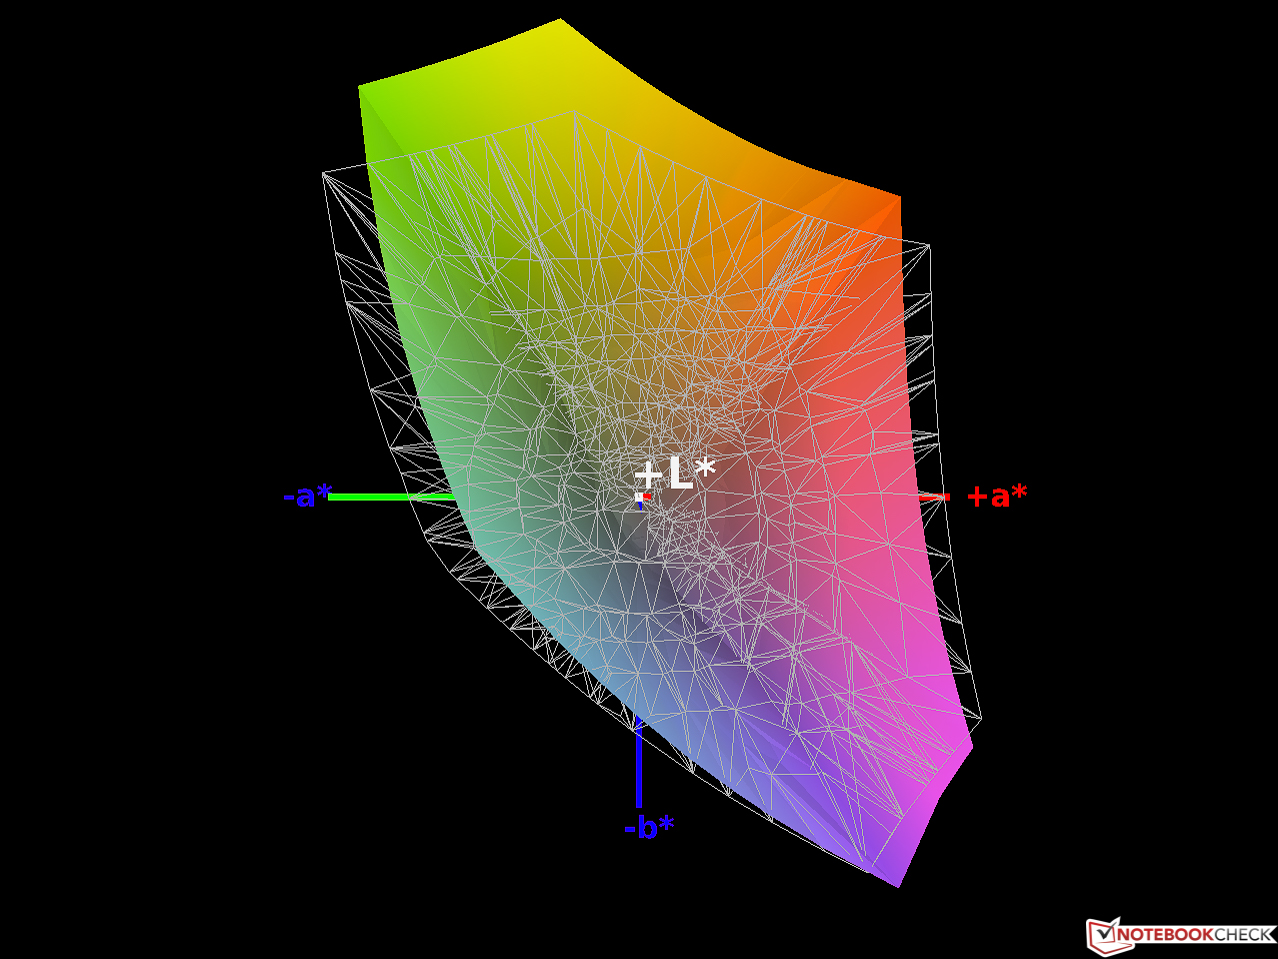
86% sRGB (Argyll 1.6.3 3D)
56% AdobeRGB 1998 (Argyll 1.6.3 3D)
63% AdobeRGB 1998 (Argyll 3D)
86.2% sRGB (Argyll 3D)
66.7% Display P3 (Argyll 3D)
Gamma: 2.6
CCT: 6358 K
| Dell Inspiron 13 7370 BOE071A / NV13FHM / Dell G64PY, , 1920x1080, 13.3" | HP Spectre 13-v131ng CMN1374, , 1920x1080, 13.3" | Toshiba Tecra X40-D Toshiba TOS508F, , 1920x1080, 14" | Microsoft Surface Laptop i5 ID: MEI96A2, Name: Panasonic VVX14T092N00, , 2256x1504, 13.5" | |
|---|---|---|---|---|
| Display | 1% | -34% | 7% | |
| Display P3 Coverage (%) | 66.7 | 64.6 -3% | 40.55 -39% | 67.8 2% |
| sRGB Coverage (%) | 86.2 | 88.8 3% | 61 -29% | 94.3 9% |
| AdobeRGB 1998 Coverage (%) | 63 | 64.8 3% | 41.89 -34% | 69.5 10% |
| Response Times | 0% | 18% | -12% | |
| Response Time Grey 50% / Grey 80% * (ms) | 46 ? | 46 ? -0% | 38 ? 17% | 50.8 ? -10% |
| Response Time Black / White * (ms) | 33 ? | 33 ? -0% | 26.8 ? 19% | 37.2 ? -13% |
| PWM Frequency (Hz) | 201 ? | 20410 ? | ||
| Screen | 8% | -17% | 29% | |
| Brightness middle (cd/m²) | 301 | 404 34% | 283.9 -6% | 384.2 28% |
| Brightness (cd/m²) | 291 | 382 31% | 261 -10% | 378 30% |
| Brightness Distribution (%) | 87 | 91 5% | 85 -2% | 90 3% |
| Black Level * (cd/m²) | 0.33 | 0.35 -6% | 0.25 24% | 0.36 -9% |
| Contrast (:1) | 912 | 1154 27% | 1136 25% | 1067 17% |
| Colorchecker dE 2000 * | 5.39 | 5.37 -0% | 6.4 -19% | 1.8 67% |
| Colorchecker dE 2000 max. * | 8.56 | 9.46 -11% | 18.7 -118% | 4.2 51% |
| Greyscale dE 2000 * | 5.93 | 6.44 -9% | 6.3 -6% | 1.2 80% |
| Gamma | 2.6 85% | 2.52 87% | 2.39 92% | 2.21 100% |
| CCT | 6358 102% | 6738 96% | 6511 100% | 6708 97% |
| Color Space (Percent of AdobeRGB 1998) (%) | 56 | 58 4% | 38 -32% | 63.7 14% |
| Color Space (Percent of sRGB) (%) | 86 | 89 3% | 60 -30% | 94.2 10% |
| Totalt genomsnitt (program/inställningar) | 3% /
5% | -11% /
-16% | 8% /
19% |
* ... mindre är bättre
Visa svarstider
| ↔ Svarstid svart till vitt | ||
|---|---|---|
| 33 ms ... stiga ↗ och falla ↘ kombinerat | ↗ 17 ms stiga | 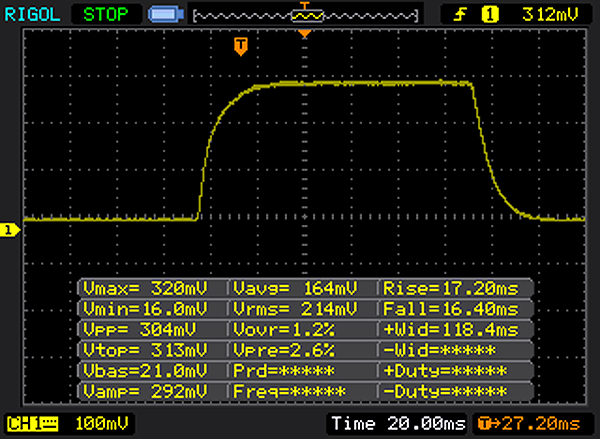 |
| ↘ 16 ms hösten | ||
| Skärmen visar långsamma svarsfrekvenser i våra tester och kommer att vara otillfredsställande för spelare. I jämförelse sträcker sig alla testade enheter från 0.1 (minst) till 240 (maximalt) ms. » 89 % av alla enheter är bättre. Detta innebär att den uppmätta svarstiden är sämre än genomsnittet av alla testade enheter (19.8 ms). | ||
| ↔ Svarstid 50 % grått till 80 % grått | ||
| 46 ms ... stiga ↗ och falla ↘ kombinerat | ↗ 21 ms stiga | 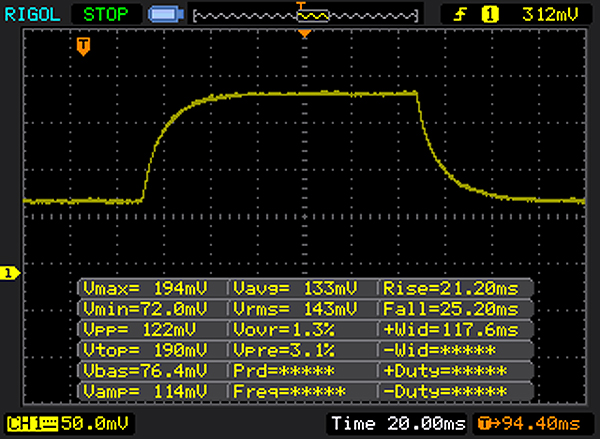 |
| ↘ 25 ms hösten | ||
| Skärmen visar långsamma svarsfrekvenser i våra tester och kommer att vara otillfredsställande för spelare. I jämförelse sträcker sig alla testade enheter från 0.165 (minst) till 636 (maximalt) ms. » 79 % av alla enheter är bättre. Detta innebär att den uppmätta svarstiden är sämre än genomsnittet av alla testade enheter (31 ms). | ||
Skärmflimmer / PWM (Puls-Width Modulation)
| Skärmflimmer / PWM upptäckt | 201 Hz | ≤ 90 % ljusstyrka inställning | 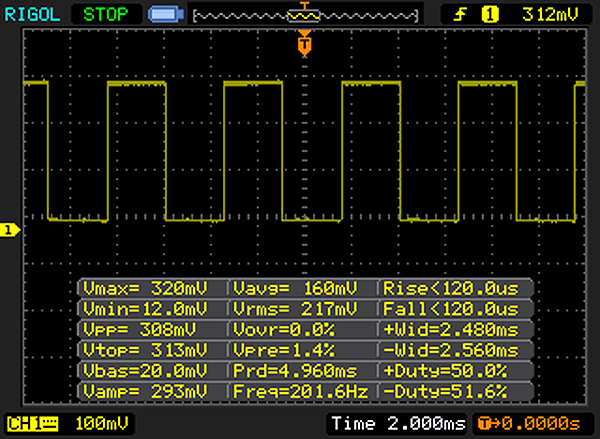 |
Displayens bakgrundsbelysning flimrar vid 201 Hz (i värsta fall, t.ex. med PWM) Flimrande upptäckt vid en ljusstyrkeinställning på 90 % och lägre. Det ska inte finnas något flimmer eller PWM över denna ljusstyrkeinställning. Frekvensen för 201 Hz är relativt låg, så känsliga användare kommer sannolikt att märka flimmer och uppleva ansträngda ögon vid den angivna ljusstyrkeinställningen och nedan. Som jämförelse: 52 % av alla testade enheter använder inte PWM för att dämpa skärmen. Om PWM upptäcktes mättes ett medelvärde av 7757 (minst: 5 - maximum: 343500) Hz. | |||
| Cinebench R15 | |
| CPU Single 64Bit | |
| Toshiba Tecra X40-D | |
| Dell Inspiron 13 7370 | |
| HP Spectre 13-v131ng | |
| Microsoft Surface Laptop i5 | |
| CPU Multi 64Bit | |
| Dell Inspiron 13 7370 | |
| Toshiba Tecra X40-D | |
| Microsoft Surface Laptop i5 | |
| HP Spectre 13-v131ng | |
| PCMark 8 | |
| Home Score Accelerated v2 | |
| Dell Inspiron 13 7370 | |
| HP Spectre 13-v131ng | |
| Toshiba Tecra X40-D | |
| Microsoft Surface Laptop i5 | |
| Work Score Accelerated v2 | |
| HP Spectre 13-v131ng | |
| Toshiba Tecra X40-D | |
| Dell Inspiron 13 7370 | |
| Microsoft Surface Laptop i5 | |
| PCMark 8 Home Score Accelerated v2 | 3902 poäng | |
| PCMark 8 Work Score Accelerated v2 | 4786 poäng | |
Hjälp | ||
| Dell Inspiron 13 7370 Micron 1100 MTFDDAV256TBN | HP Spectre 13-v131ng Samsung PM961 NVMe MZVLW512HMJP | Microsoft Surface Laptop i5 Toshiba THNSN0128GTYA | |
|---|---|---|---|
| CrystalDiskMark 3.0 | 153% | -40% | |
| Read Seq (MB/s) | 476.8 | 1090 129% | 425.6 -11% |
| Write Seq (MB/s) | 458.3 | 1088 137% | 128.2 -72% |
| Read 512 (MB/s) | 351 | 753 115% | 278.5 -21% |
| Write 512 (MB/s) | 298.2 | 911 205% | 126.7 -58% |
| Read 4k (MB/s) | 20.79 | 57.5 177% | 22.15 7% |
| Write 4k (MB/s) | 65.8 | 140.2 113% | 40.45 -39% |
| Read 4k QD32 (MB/s) | 172.8 | 497.1 188% | 77.8 -55% |
| Write 4k QD32 (MB/s) | 160.3 | 416 160% | 41.18 -74% |

| 3DMark 11 - 1280x720 Performance GPU | |
| Dell Inspiron 13 7370 | |
| Toshiba Tecra X40-D | |
| HP Spectre 13-v131ng | |
| Microsoft Surface Laptop i5 | |
| 3DMark | |
| 1280x720 Cloud Gate Standard Graphics | |
| Dell Inspiron 13 7370 | |
| Toshiba Tecra X40-D | |
| HP Spectre 13-v131ng | |
| Microsoft Surface Laptop i5 | |
| 1920x1080 Fire Strike Graphics | |
| Dell Inspiron 13 7370 | |
| Toshiba Tecra X40-D | |
| HP Spectre 13-v131ng | |
| Microsoft Surface Laptop i5 | |
| 3DMark 11 Performance | 1935 poäng | |
| 3DMark Cloud Gate Standard Score | 8527 poäng | |
| 3DMark Fire Strike Score | 1059 poäng | |
Hjälp | ||
| låg | med. | hög | ultra | |
|---|---|---|---|---|
| Rise of the Tomb Raider (2016) | 21.1 | |||
| Deus Ex Mankind Divided (2016) | 16.8 | |||
| Farming Simulator 17 (2016) | 95.9 | 63.3 | 25.4 |
Ljudnivå
| Låg belastning |
| 30.3 / 30.3 / 30.3 dB(A) |
| Hög belastning |
| 33.6 / 36.8 dB(A) |
 | ||
30 dB tyst 40 dB(A) hörbar 50 dB(A) högt ljud |
||
min: | ||
(±) Den maximala temperaturen på ovansidan är 41.1 °C / 106 F, jämfört med genomsnittet av 34.3 °C / 94 F , allt från 21.2 till 62.5 °C för klassen Office.
(-) Botten värms upp till maximalt 47.6 °C / 118 F, jämfört med genomsnittet av 36.8 °C / 98 F
(+) Vid tomgångsbruk är medeltemperaturen för ovansidan 26.2 °C / 79 F, jämfört med enhetsgenomsnittet på 29.5 °C / ### class_avg_f### F.
(+) Handledsstöden och pekplattan är kallare än hudtemperaturen med maximalt 30 °C / 86 F och är därför svala att ta på.
(-) Medeltemperaturen för handledsstödsområdet på liknande enheter var 27.5 °C / 81.5 F (-2.5 °C / -4.5 F).
Dell Inspiron 13 7370 ljudanalys
(-) | inte särskilt höga högtalare (70 dB)
Bas 100 - 315 Hz
(-) | nästan ingen bas - i genomsnitt 19.5% lägre än medianen
(±) | linjäriteten för basen är genomsnittlig (10.2% delta till föregående frekvens)
Mellan 400 - 2000 Hz
(±) | högre mellan - i genomsnitt 6.7% högre än median
(±) | linjäriteten för mids är genomsnittlig (12.5% delta till föregående frekvens)
Högsta 2 - 16 kHz
(+) | balanserade toppar - endast 3.2% från medianen
(±) | linjäriteten för toppar är genomsnittlig (8.9% delta till föregående frekvens)
Totalt 100 - 16 000 Hz
(±) | linjäriteten för det totala ljudet är genomsnittlig (26% skillnad mot median)
Jämfört med samma klass
» 79% av alla testade enheter i den här klassen var bättre, 7% liknande, 14% sämre
» Den bästa hade ett delta på 7%, genomsnittet var 21%, sämst var 53%
Jämfört med alla testade enheter
» 80% av alla testade enheter var bättre, 4% liknande, 16% sämre
» Den bästa hade ett delta på 4%, genomsnittet var 23%, sämst var 134%
HP Spectre 13-v131ng ljudanalys
(-) | inte särskilt höga högtalare (68 dB)
Bas 100 - 315 Hz
(-) | nästan ingen bas - i genomsnitt 23.7% lägre än medianen
(±) | linjäriteten för basen är genomsnittlig (9.6% delta till föregående frekvens)
Mellan 400 - 2000 Hz
(±) | reducerade mids - i genomsnitt 5.1% lägre än median
(±) | linjäriteten för mids är genomsnittlig (7.6% delta till föregående frekvens)
Högsta 2 - 16 kHz
(±) | högre toppar - i genomsnitt 7.7% högre än medianen
(+) | toppar är linjära (3.1% delta till föregående frekvens)
Totalt 100 - 16 000 Hz
(±) | linjäriteten för det totala ljudet är genomsnittlig (28.6% skillnad mot median)
Jämfört med samma klass
» 90% av alla testade enheter i den här klassen var bättre, 2% liknande, 7% sämre
» Den bästa hade ett delta på 5%, genomsnittet var 18%, sämst var 53%
Jämfört med alla testade enheter
» 86% av alla testade enheter var bättre, 3% liknande, 11% sämre
» Den bästa hade ett delta på 4%, genomsnittet var 23%, sämst var 134%
Toshiba Tecra X40-D ljudanalys
(±) | högtalarljudstyrkan är genomsnittlig men bra (77.3 dB)
Bas 100 - 315 Hz
(-) | nästan ingen bas - i genomsnitt 15.2% lägre än medianen
(±) | linjäriteten för basen är genomsnittlig (7.2% delta till föregående frekvens)
Mellan 400 - 2000 Hz
(+) | balanserad mellan - endast 3.6% från medianen
(+) | mids är linjära (5.7% delta till föregående frekvens)
Högsta 2 - 16 kHz
(±) | högre toppar - i genomsnitt 5.6% högre än medianen
(+) | toppar är linjära (5.2% delta till föregående frekvens)
Totalt 100 - 16 000 Hz
(±) | linjäriteten för det totala ljudet är genomsnittlig (22% skillnad mot median)
Jämfört med samma klass
» 58% av alla testade enheter i den här klassen var bättre, 8% liknande, 34% sämre
» Den bästa hade ett delta på 7%, genomsnittet var 21%, sämst var 53%
Jämfört med alla testade enheter
» 64% av alla testade enheter var bättre, 6% liknande, 30% sämre
» Den bästa hade ett delta på 4%, genomsnittet var 23%, sämst var 134%
Microsoft Surface Laptop i5 ljudanalys
(-) | inte särskilt höga högtalare (64.6 dB)
Bas 100 - 315 Hz
(±) | reducerad bas - i genomsnitt 7.1% lägre än medianen
(±) | linjäriteten för basen är genomsnittlig (11.8% delta till föregående frekvens)
Mellan 400 - 2000 Hz
(+) | balanserad mellan - endast 4.1% från medianen
(+) | mids är linjära (5.6% delta till föregående frekvens)
Högsta 2 - 16 kHz
(+) | balanserade toppar - endast 1.2% från medianen
(+) | toppar är linjära (4.7% delta till föregående frekvens)
Totalt 100 - 16 000 Hz
(±) | linjäriteten för det totala ljudet är genomsnittlig (15.6% skillnad mot median)
Jämfört med samma klass
» 36% av alla testade enheter i den här klassen var bättre, 5% liknande, 58% sämre
» Den bästa hade ett delta på 5%, genomsnittet var 18%, sämst var 53%
Jämfört med alla testade enheter
» 23% av alla testade enheter var bättre, 5% liknande, 72% sämre
» Den bästa hade ett delta på 4%, genomsnittet var 23%, sämst var 134%
| Av/Standby | |
| Låg belastning | |
| Hög belastning |
|
Förklaring:
min: | |
| Dell Inspiron 13 7370 i5-8250U, UHD Graphics 620, Micron 1100 MTFDDAV256TBN, IPS, 1920x1080, 13.3" | HP Spectre 13-v131ng i7-7500U, HD Graphics 620, Samsung PM961 NVMe MZVLW512HMJP, IPS UWVA, 1920x1080, 13.3" | Toshiba Tecra X40-D i7-7600U, HD Graphics 620, Samsung PM961 MZVLW256HEHP, IPS, 1920x1080, 14" | Microsoft Surface Laptop i5 i5-7200U, HD Graphics 620, Toshiba THNSN0128GTYA, IPS, 2256x1504, 13.5" | |
|---|---|---|---|---|
| Power Consumption | 3% | 5% | 12% | |
| Idle Minimum * (Watt) | 3.6 | 3.6 -0% | 5.2 -44% | 3.2 11% |
| Idle Average * (Watt) | 6.8 | 6.4 6% | 6.9 -1% | 6.5 4% |
| Idle Maximum * (Watt) | 8.9 | 9.2 -3% | 7 21% | 6.8 24% |
| Load Average * (Watt) | 36 | 34 6% | 24.6 32% | 28.2 22% |
| Load Maximum * (Watt) | 36.5 | 34.4 6% | 30.1 18% | 36 1% |
* ... mindre är bättre
| Dell Inspiron 13 7370 i5-8250U, UHD Graphics 620, 38 Wh | HP Spectre 13-v131ng i7-7500U, HD Graphics 620, 38 Wh | Toshiba Tecra X40-D i7-7600U, HD Graphics 620, 48 Wh | Microsoft Surface Laptop i5 i5-7200U, HD Graphics 620, 45 Wh | |
|---|---|---|---|---|
| Batteridrifttid | 2% | 26% | 69% | |
| Reader / Idle (h) | 12.9 | 12 -7% | 14.6 13% | 22.5 74% |
| WiFi v1.3 (h) | 5.8 | 6.6 14% | 6 3% | 10 72% |
| Load (h) | 1.3 | 1.3 0% | 2.1 62% | 2.1 62% |
| H.264 (h) | 6.1 |
För
Emot
 courtesy of Cyberport.de")
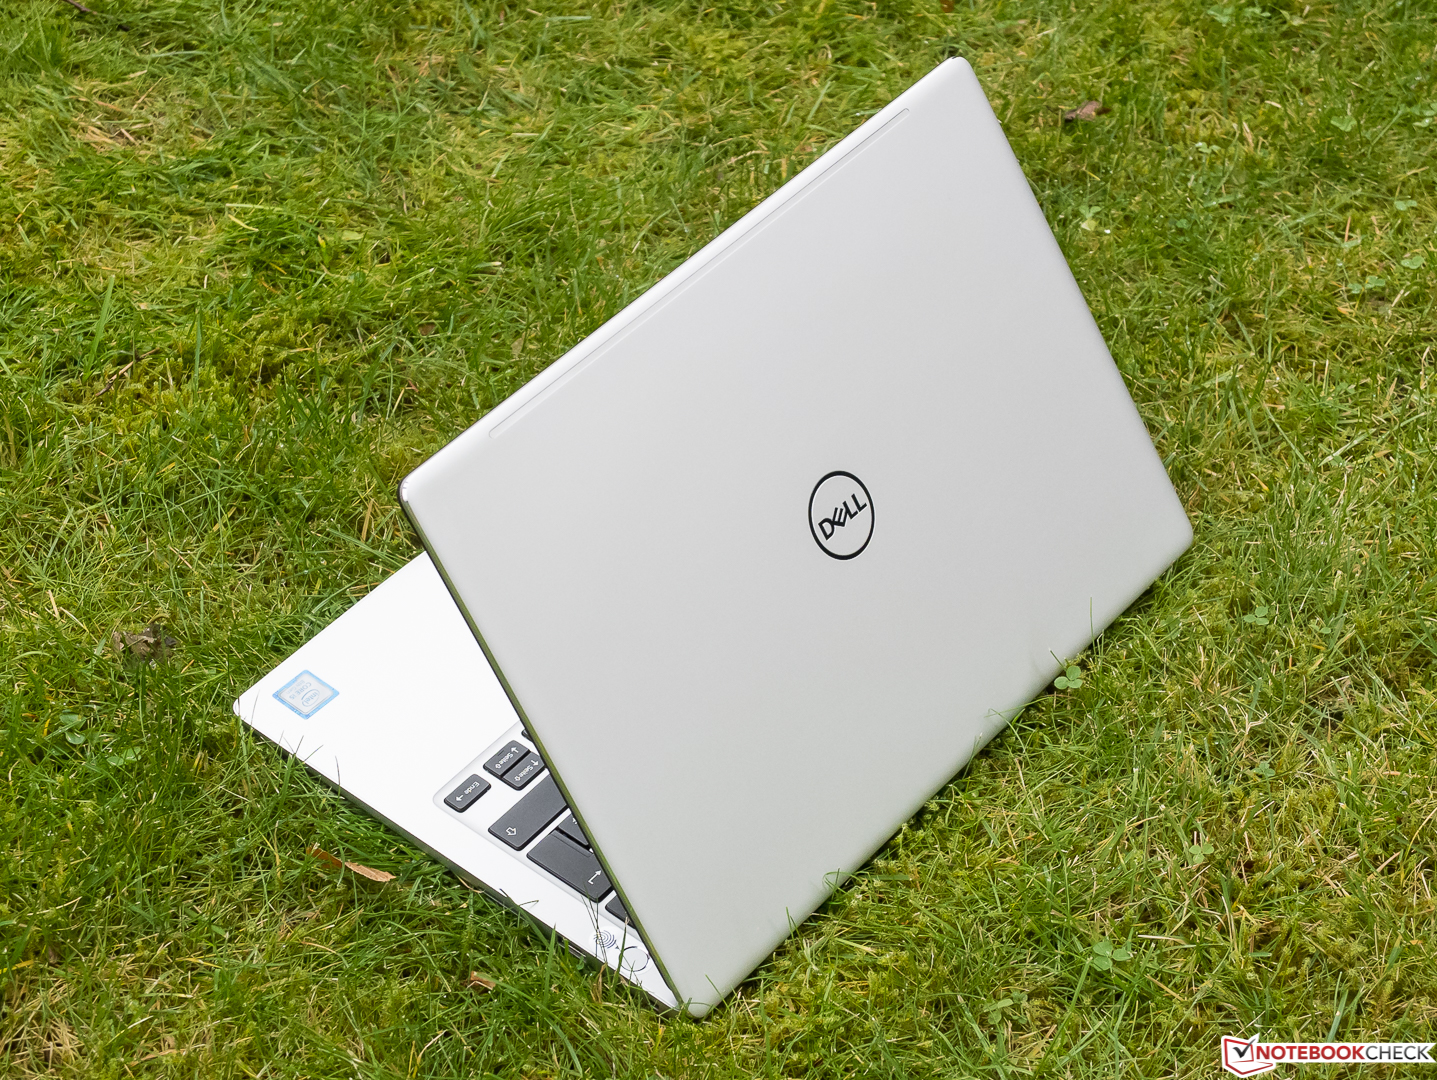
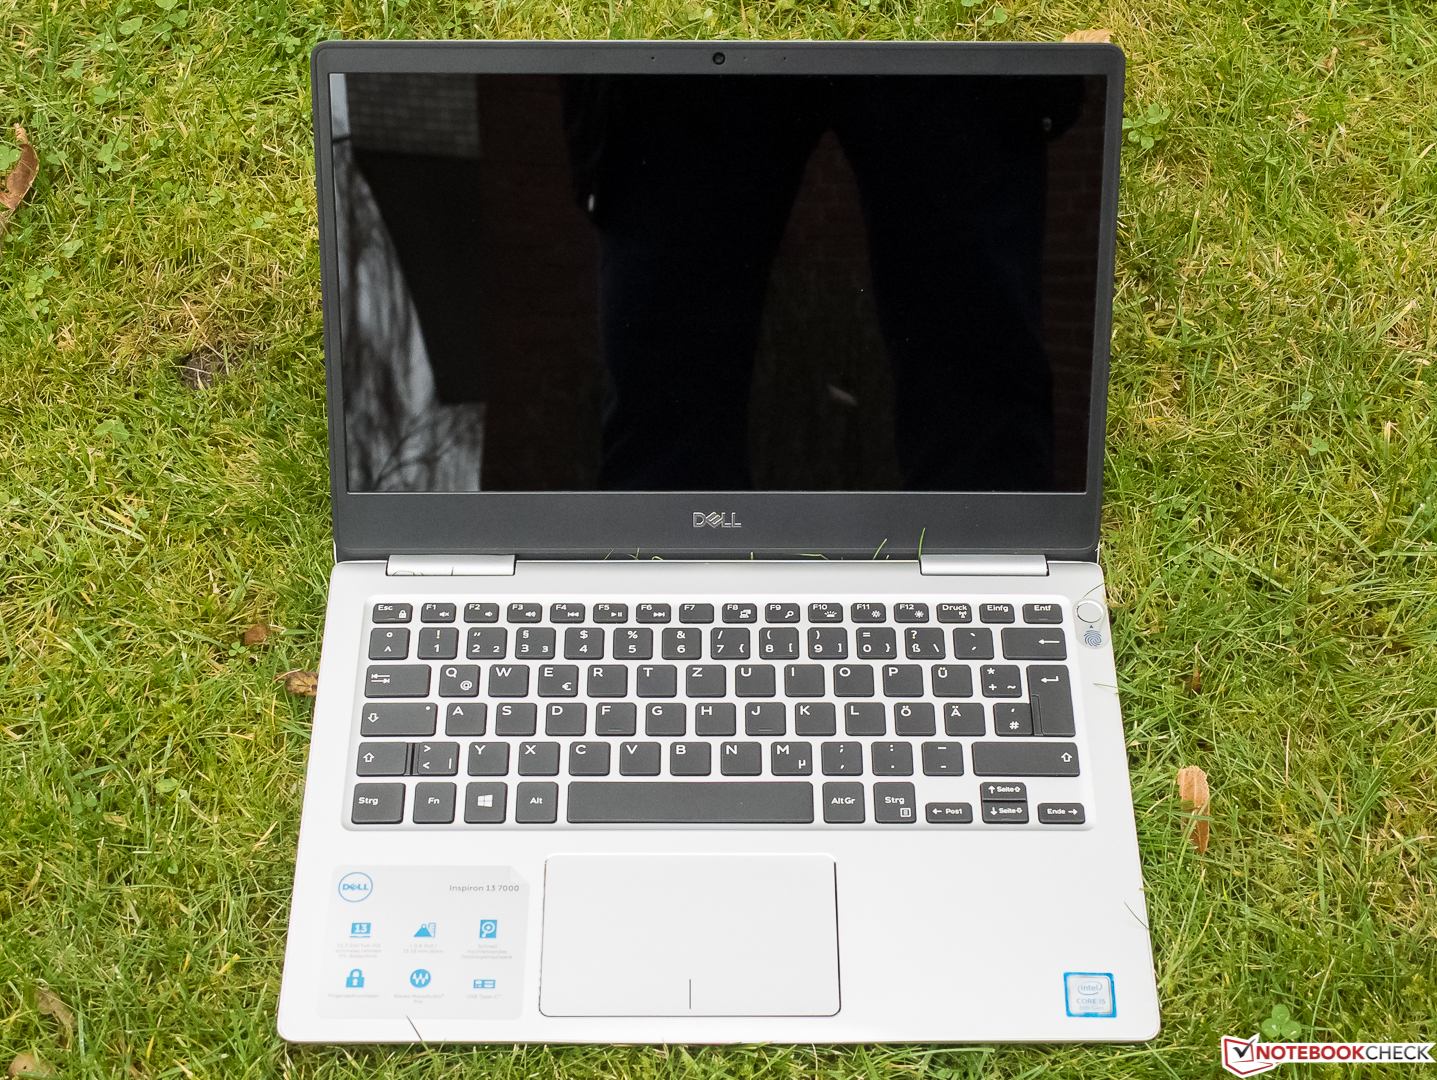
Om vi ignorerar den aningen korta batteritiden, skärmreflektionerna och den låga PWM-frekvensen på 200 Hz, så har den rena och eleganta Dell Inspiron 13 7370 inga större genomgående svagheter.
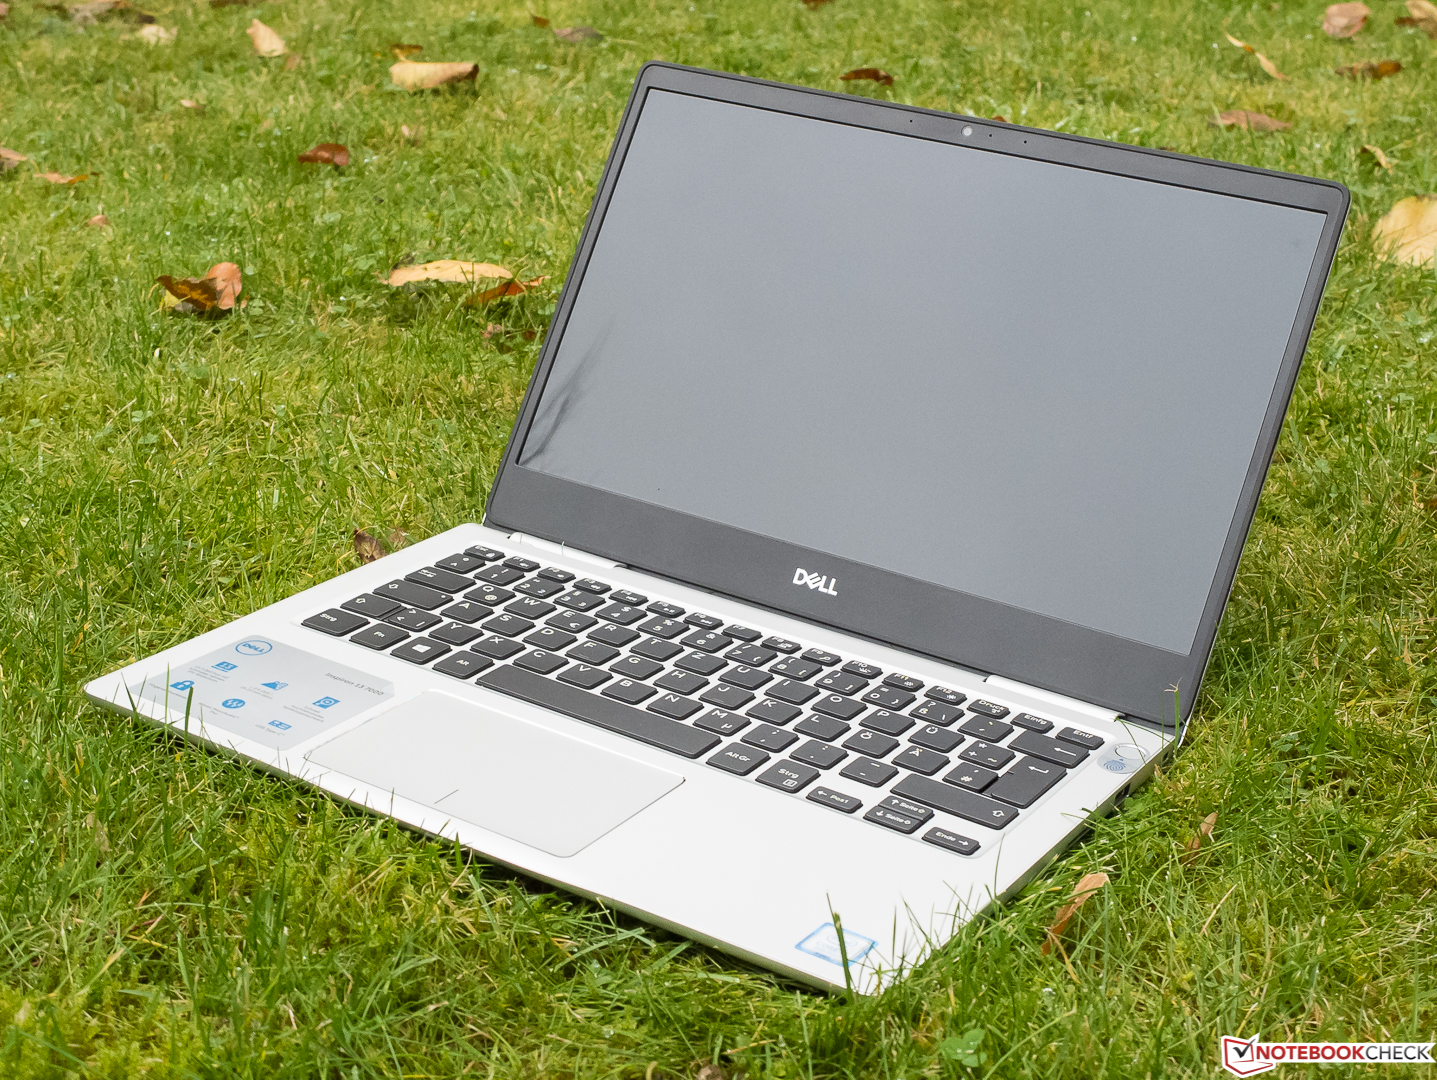
Dom fyra kärnorna med hypertrådning kan definitivt ses som en förbättring över tidigare modeller, för det finns inga värmeproblem och det finns ingen nämnvärd ökning av energiåtgången för vår testmodell. Men vi är också av åsikten att dom flesta kontorsanvändare inte kommer hitta någon väsentlig användning för dom åtta trådarna och kan för det mesta arbeta precis lika bra med en traditionell dual-kärnad ULV-processor med Hypertrådning. Detta är förstås inte fallet om mjukvaran som ska användas är väloptimerad för att köras parallellt.
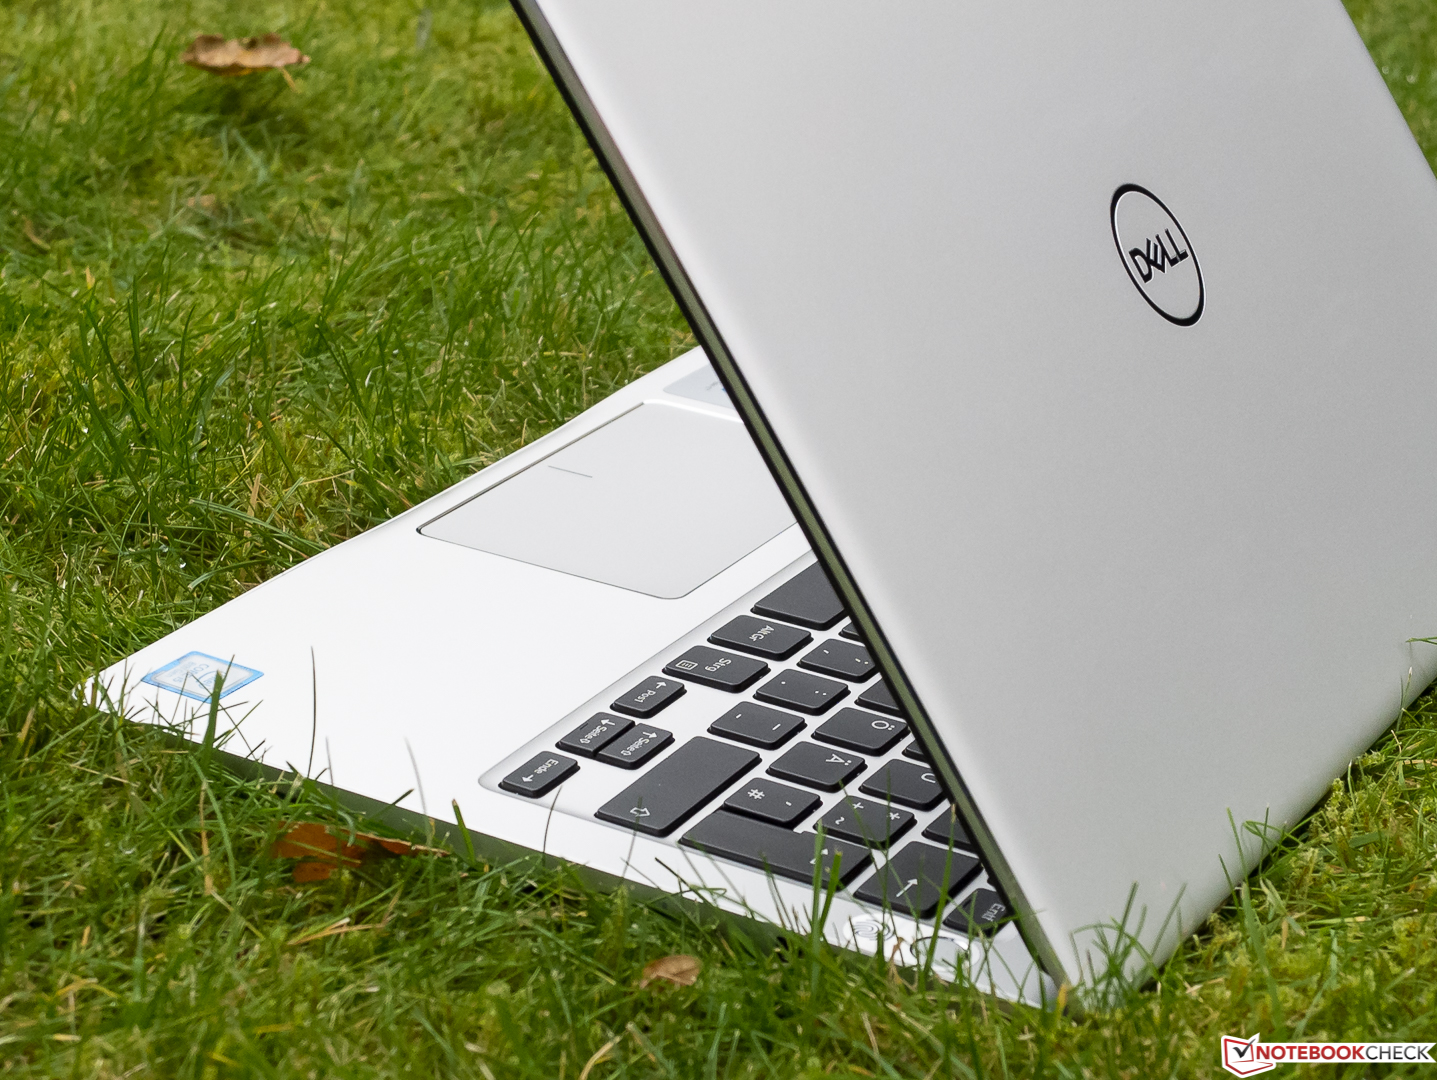
Exakt varför Dell valde att använda en glänsande behandling på skärmen kommer troligen förbli deras hemlighet, men vi stötte ändå inte på några större problem med reflektioner på skärmen. Skärmen kunde ha varit lite ljusstarkare och visat ett bredare urval av färger, SD-kortläsaren torterar fotografer men sin onödigt långa kopieringsprocess och det ser inte bra ut när det kommer till reparationsmöjligheterna.
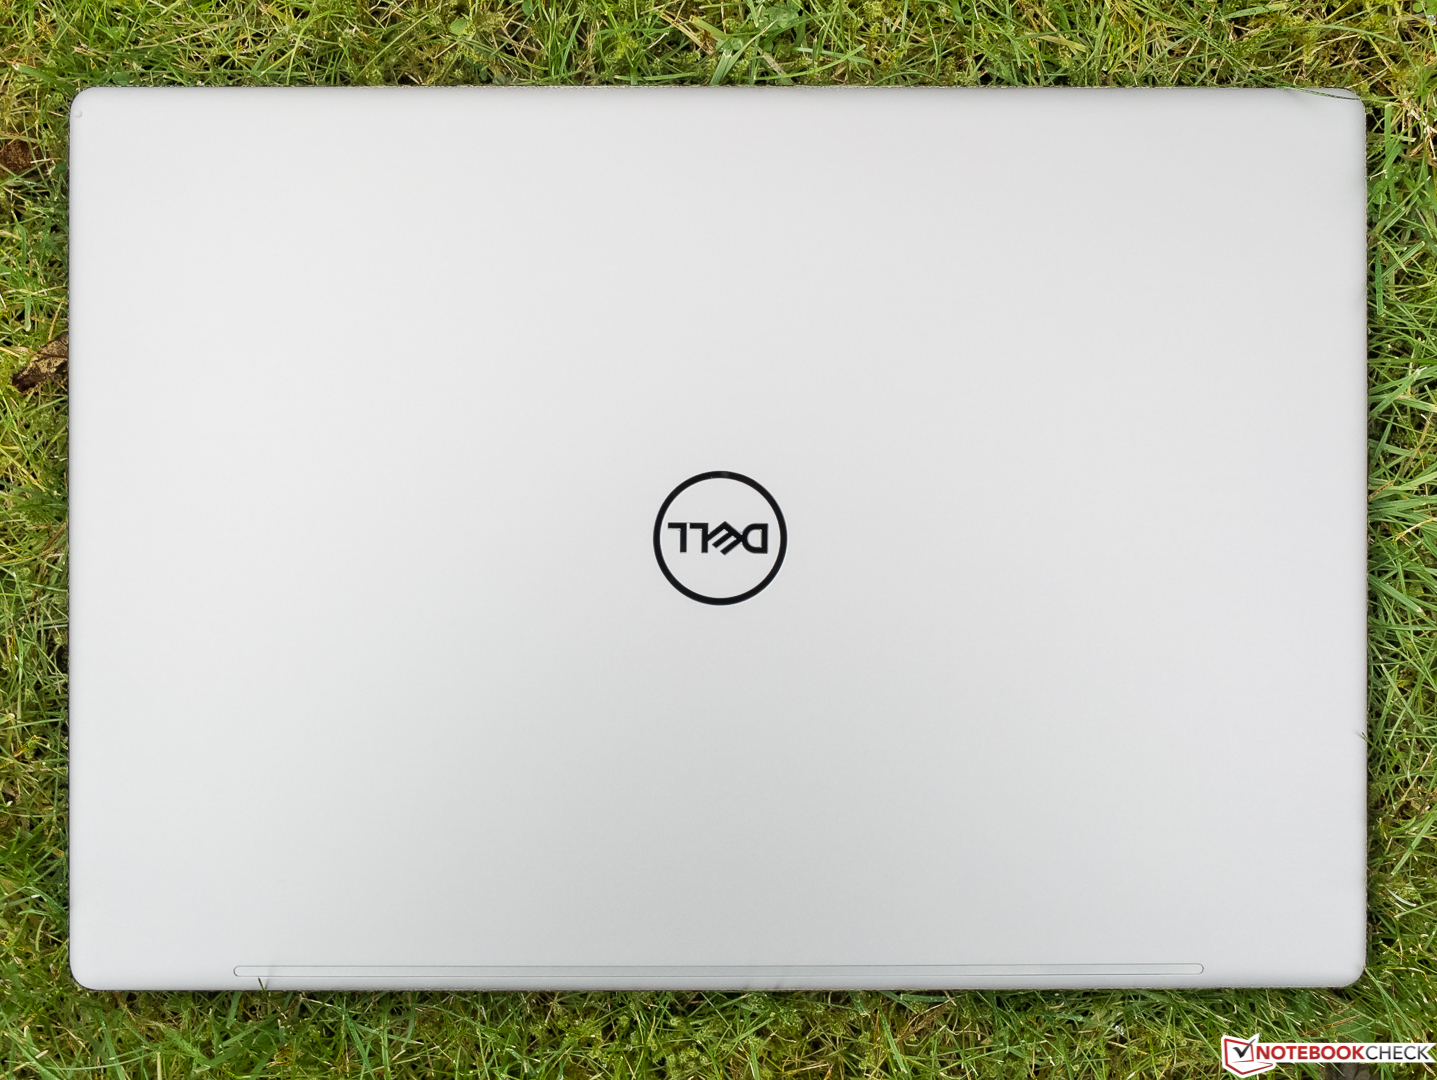
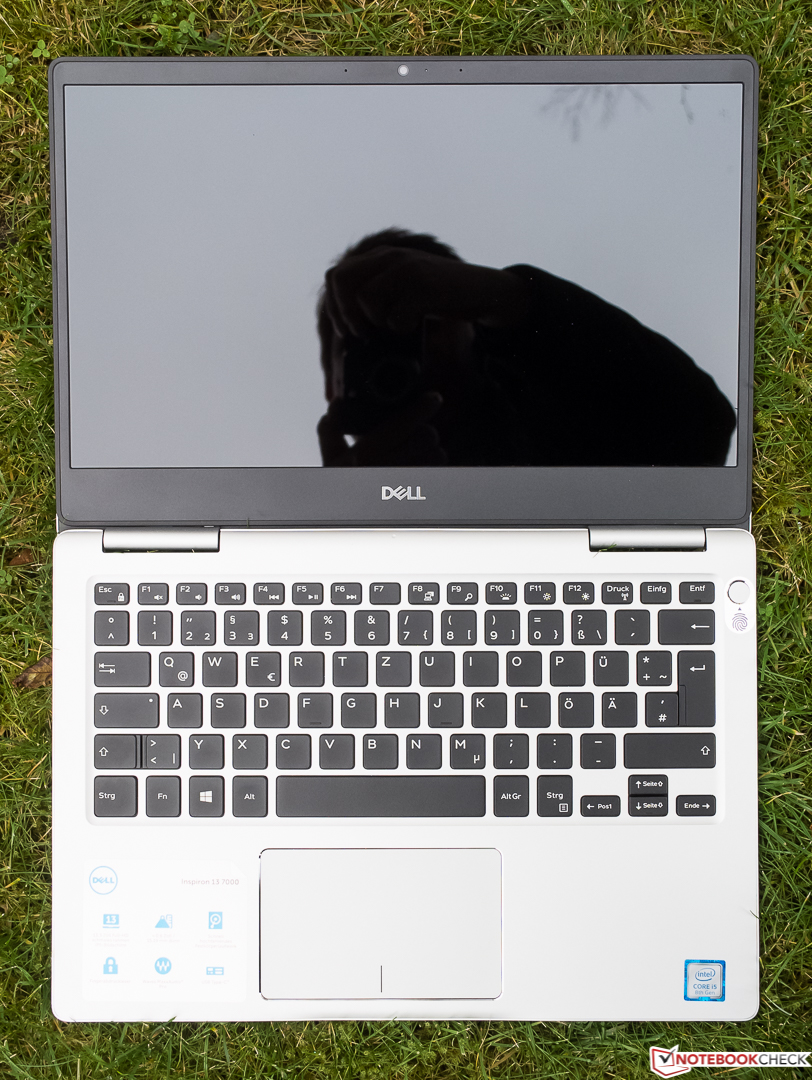
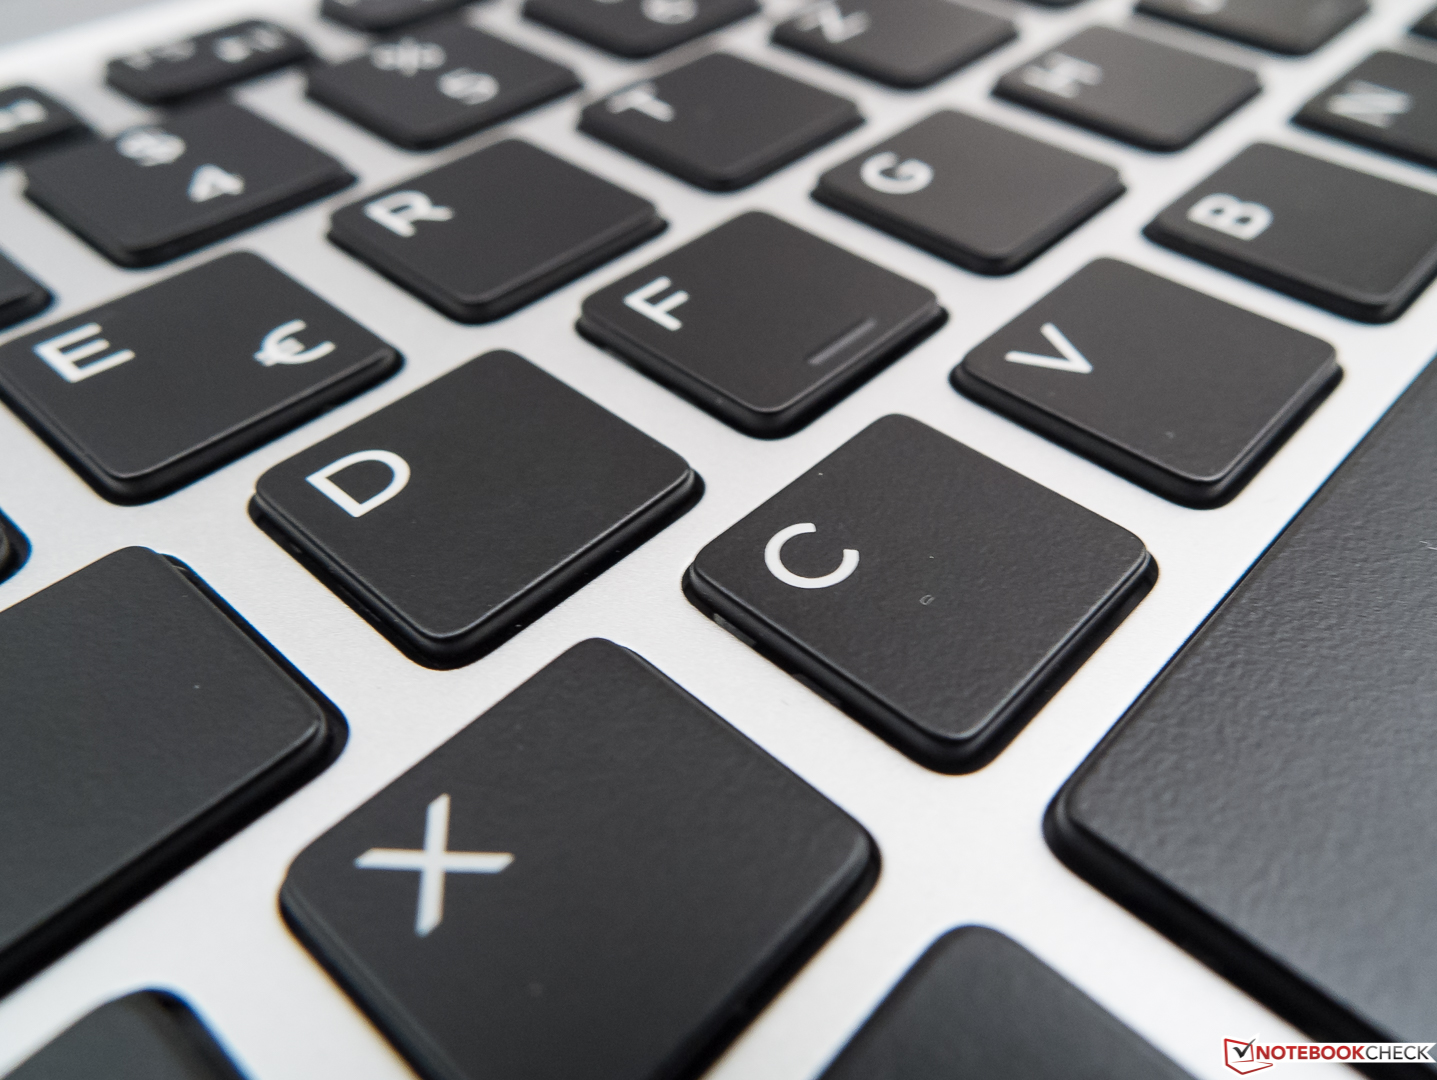
På plus-sidan så finns det vältillverkade, stabila och imponerande höljet, den lätta och kompakta designen, den vanligtvis svala och tysta körningen samt dom utmärkta inmatningsenheterna. Inspiron 7370 missar bara precis det totala betyget "väldigt bra", även om inget står i vägen för en köprekommendation. Den mest jämförbara enheten i fråga om kompakt design är HP Spectre 13, som är aningen plattare, har en ljusare skärm, en snabbare NVMe-SSD och erbjuder andra generationens USB Typ-C portar med Thunderbolt. Men den har också högljudda och irriterande fläktar, har ingen SD-kortläsare alls och kan inte dra nytta av turbo-läget.
Dell Inspiron 13 7370
- 11/16/2017 v6 (old)
Sven Kloevekorn