Test: Dell Inspiron 13 7386 2-in-1 Black Edition (i7-8565U, 16 GB RAM, 512 GB SSD) Omvandlingsbar (Sammanfattning)


| SD Card Reader | |
| average JPG Copy Test (av. of 3 runs) | |
| HP ProBook x360 440 G1 (Toshiba Exceria Pro M501 microSDXC 64GB) | |
| Lenovo ThinkPad L380 Yoga-20M7001BGE (Toshiba Exceria Pro M501 microSDXC 64GB) | |
| Genomsnitt av klass Convertible (28.1 - 197, n=23, senaste 2 åren) | |
| Lenovo Yoga 530-14IKB-81EK00CWGE (Toshiba Exceria Pro SDXC 64 GB UHS-II) | |
| maximum AS SSD Seq Read Test (1GB) | |
| Genomsnitt av klass Convertible (28.9 - 254, n=22, senaste 2 åren) | |
| Lenovo ThinkPad L380 Yoga-20M7001BGE (Toshiba Exceria Pro M501 microSDXC 64GB) | |
| HP ProBook x360 440 G1 (Toshiba Exceria Pro M501 microSDXC 64GB) | |
| Dell Inspiron 13 7386 (Toshiba Exceria Pro M501 microSDXC 64GB) | |
| Lenovo Yoga 530-14IKB-81EK00CWGE (Toshiba Exceria Pro SDXC 64 GB UHS-II) | |
| Networking | |
| iperf3 transmit AX12 | |
| Lenovo ThinkPad L380 Yoga-20M7001BGE | |
| Dell Inspiron 13 7386 | |
| HP ProBook x360 440 G1 | |
| Lenovo Yoga 530-14IKB-81EK00CWGE | |
| iperf3 receive AX12 | |
| Dell Inspiron 13 7386 | |
| HP ProBook x360 440 G1 | |
| Lenovo ThinkPad L380 Yoga-20M7001BGE | |
| Lenovo Yoga 530-14IKB-81EK00CWGE | |
| |||||||||||||||||||||||||
Distribution av ljusstyrkan: 81 %
Mitt på batteriet: 281 cd/m²
Kontrast: 1767:1 (Svärta: 0.18 cd/m²)
ΔE ColorChecker Calman: 2.91 | ∀{0.5-29.43 Ø4.72}
calibrated: 2.91
ΔE Greyscale Calman: 4.37 | ∀{0.09-98 Ø4.97}
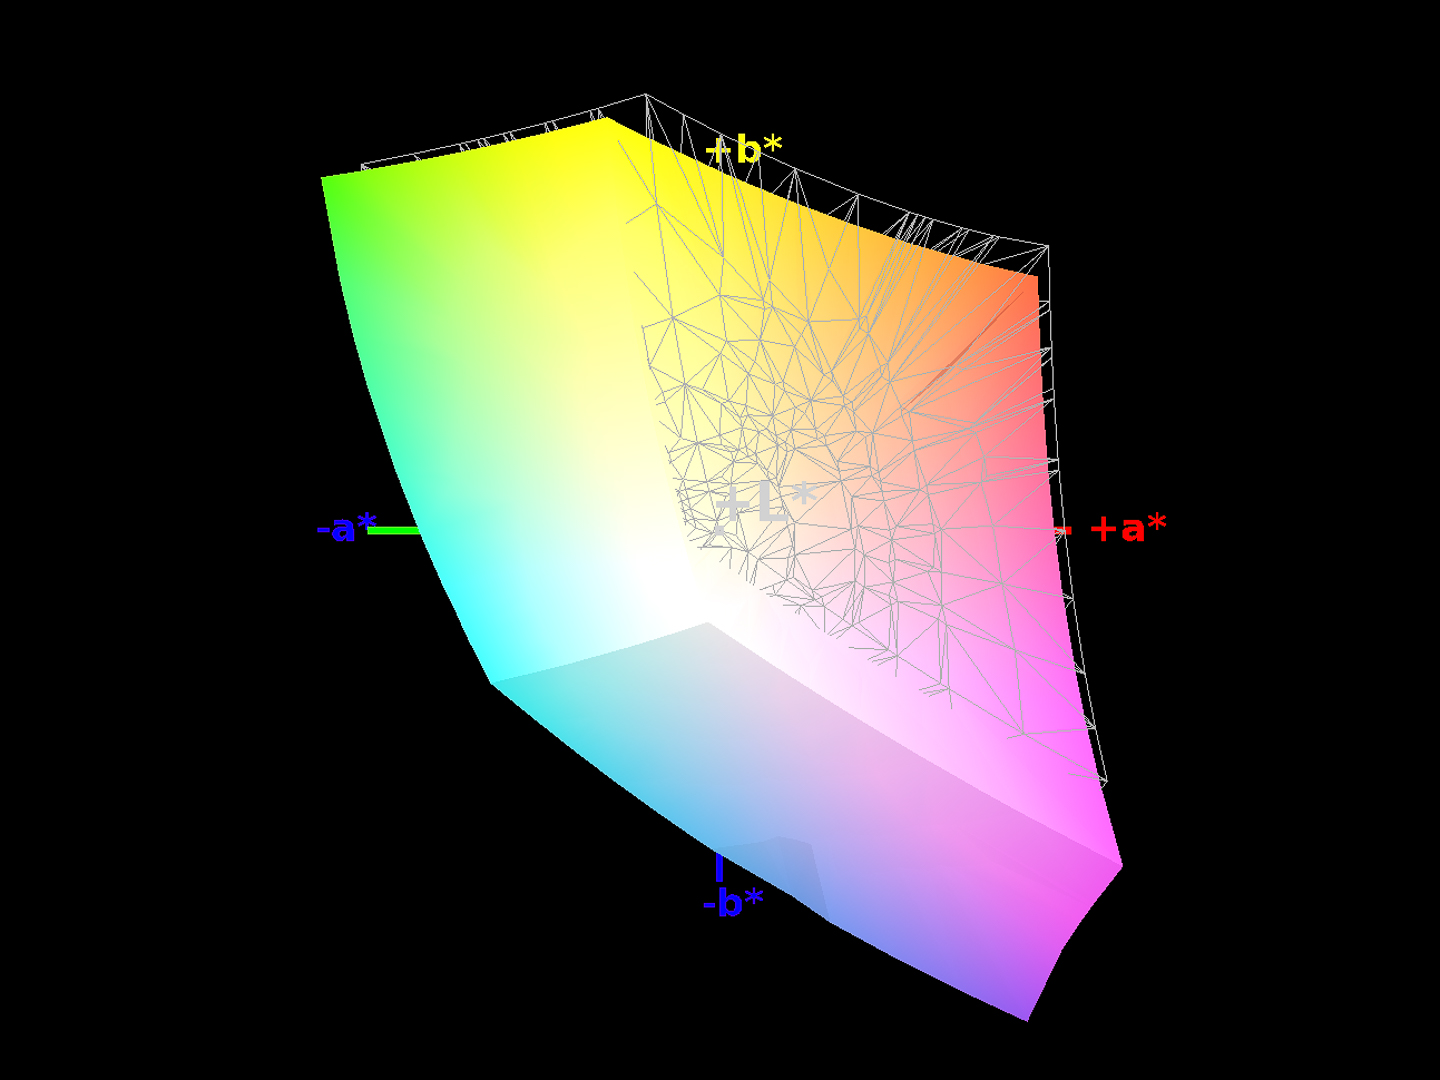
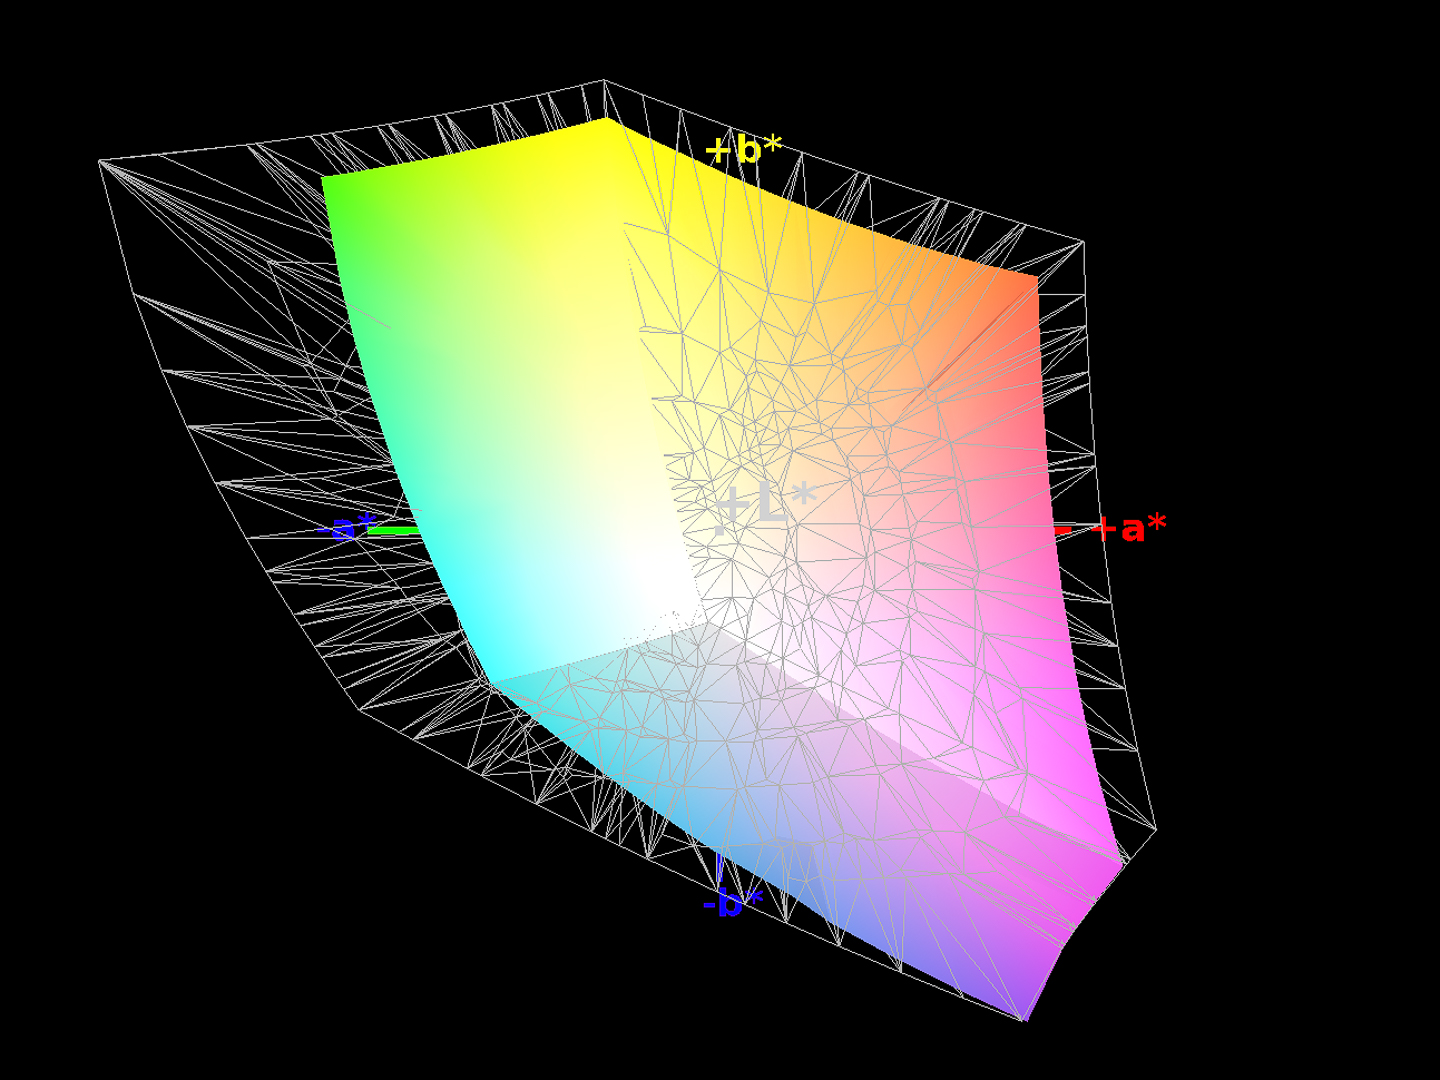
93% sRGB (Argyll 1.6.3 3D)
70% AdobeRGB 1998 (Argyll 1.6.3 3D)
70% AdobeRGB 1998 (Argyll 3D)
99.8% sRGB (Argyll 3D)
68.2% Display P3 (Argyll 3D)
Gamma: 2.26
CCT: 6448 K
| Dell Inspiron 13 7386 Chi Mei CMN1385 / 133DCE / Dell 3GRT6, , 3840x2160, 13.3" | Lenovo Yoga 530-14IKB-81EK00CWGE InfoVision M140NWF5 R2, , 1920x1080, 14" | HP ProBook x360 440 G1 Chi MEi, CMN14E0, , 1920x1080, 14" | Lenovo ThinkPad L380 Yoga-20M7001BGE M133NWF4-R3, , 1920x1080, 13.3" | |
|---|---|---|---|---|
| Display | -39% | -3% | -4% | |
| Display P3 Coverage (%) | 68.2 | 41.52 -39% | 65.8 -4% | 65.1 -5% |
| sRGB Coverage (%) | 99.8 | 62.1 -38% | 98.2 -2% | 95.5 -4% |
| AdobeRGB 1998 Coverage (%) | 70 | 42.92 -39% | 67.8 -3% | 66.9 -4% |
| Response Times | 11% | 37% | 13% | |
| Response Time Grey 50% / Grey 80% * (ms) | 57 ? | 45 ? 21% | 34 ? 40% | 47 ? 18% |
| Response Time Black / White * (ms) | 30 ? | 30 ? -0% | 20 ? 33% | 28 ? 7% |
| PWM Frequency (Hz) | 26000 ? | 520 ? | 26000 ? | 217 ? |
| Screen | -16% | 20% | -21% | |
| Brightness middle (cd/m²) | 318 | 240 -25% | 408 28% | 323 2% |
| Brightness (cd/m²) | 278 | 234 -16% | 375 35% | 310 12% |
| Brightness Distribution (%) | 81 | 93 15% | 87 7% | 88 9% |
| Black Level * (cd/m²) | 0.18 | 0.11 39% | 0.34 -89% | 0.22 -22% |
| Contrast (:1) | 1767 | 2182 23% | 1200 -32% | 1468 -17% |
| Colorchecker dE 2000 * | 2.91 | 4.98 -71% | 1.2 59% | 5 -72% |
| Colorchecker dE 2000 max. * | 6.11 | 10.75 -76% | 2.44 60% | 9.56 -56% |
| Colorchecker dE 2000 calibrated * | 2.91 | 3.33 -14% | 0.67 77% | |
| Greyscale dE 2000 * | 4.37 | 3.51 20% | 0.98 78% | 6.64 -52% |
| Gamma | 2.26 97% | 2.2 100% | 2.32 95% | 2.2 100% |
| CCT | 6448 101% | 6606 98% | 6485 100% | 6638 98% |
| Color Space (Percent of AdobeRGB 1998) (%) | 70 | 40 -43% | 62 -11% | 61 -13% |
| Color Space (Percent of sRGB) (%) | 93 | 62 -33% | 98 5% | 95 2% |
| Totalt genomsnitt (program/inställningar) | -15% /
-17% | 18% /
18% | -4% /
-13% |
* ... mindre är bättre
Visa svarstider
| ↔ Svarstid svart till vitt | ||
|---|---|---|
| 30 ms ... stiga ↗ och falla ↘ kombinerat | ↗ 15 ms stiga | 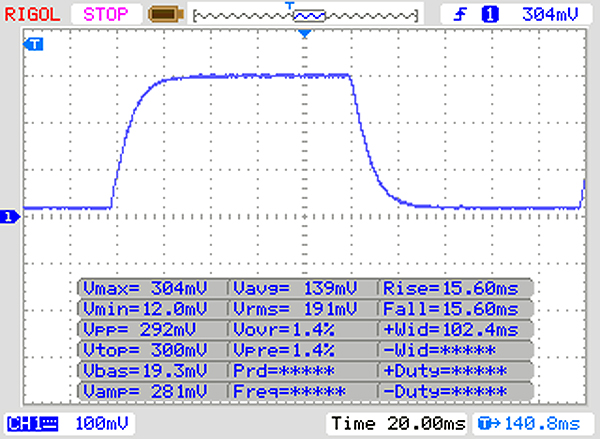 |
| ↘ 15 ms hösten | ||
| Skärmen visar långsamma svarsfrekvenser i våra tester och kommer att vara otillfredsställande för spelare. I jämförelse sträcker sig alla testade enheter från 0.1 (minst) till 240 (maximalt) ms. » 80 % av alla enheter är bättre. Detta innebär att den uppmätta svarstiden är sämre än genomsnittet av alla testade enheter (19.8 ms). | ||
| ↔ Svarstid 50 % grått till 80 % grått | ||
| 57 ms ... stiga ↗ och falla ↘ kombinerat | ↗ 27 ms stiga | 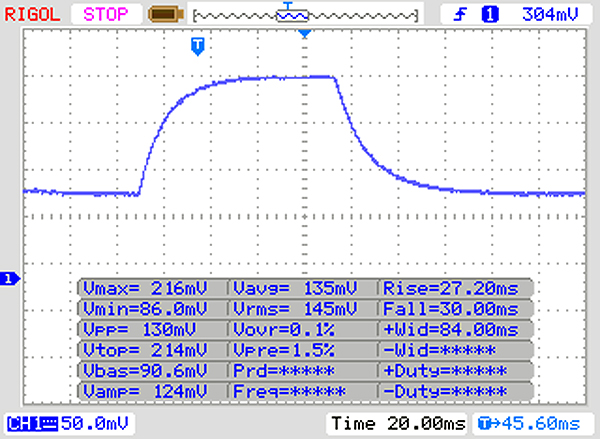 |
| ↘ 30 ms hösten | ||
| Skärmen visar långsamma svarsfrekvenser i våra tester och kommer att vara otillfredsställande för spelare. I jämförelse sträcker sig alla testade enheter från 0.165 (minst) till 636 (maximalt) ms. » 94 % av alla enheter är bättre. Detta innebär att den uppmätta svarstiden är sämre än genomsnittet av alla testade enheter (31 ms). | ||
Skärmflimmer / PWM (Puls-Width Modulation)
| Skärmflimmer / PWM upptäckt | 26000 Hz | ≤ 20 % ljusstyrka inställning | 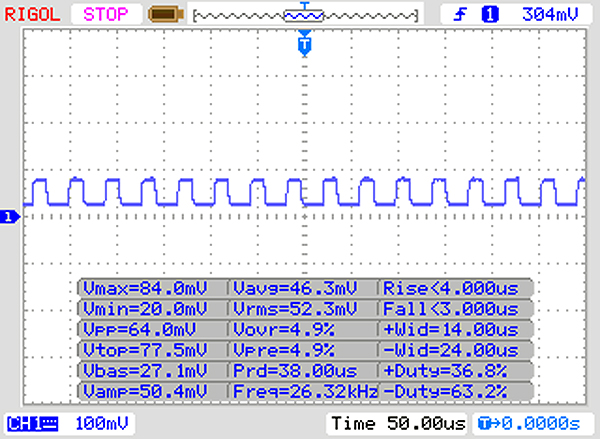 |
Displayens bakgrundsbelysning flimrar vid 26000 Hz (i värsta fall, t.ex. med PWM) Flimrande upptäckt vid en ljusstyrkeinställning på 20 % och lägre. Det ska inte finnas något flimmer eller PWM över denna ljusstyrkeinställning. Frekvensen för 26000 Hz är ganska hög, så de flesta användare som är känsliga för PWM bör inte märka något flimmer. Som jämförelse: 52 % av alla testade enheter använder inte PWM för att dämpa skärmen. Om PWM upptäcktes mättes ett medelvärde av 7763 (minst: 5 - maximum: 343500) Hz. | |||

| Cinebench R15 | |
| CPU Single 64Bit | |
| Genomsnitt av klass Convertible (149.8 - 317, n=51, senaste 2 åren) | |
| Genomsnitt Intel Core i7-8565U (138.3 - 193, n=51) | |
| Dell Inspiron 13 7386 | |
| HP ProBook x360 440 G1 | |
| Lenovo Yoga 530-14IKB-81EK00CWGE | |
| Lenovo ThinkPad L380 Yoga-20M7001BGE | |
| CPU Multi 64Bit | |
| Genomsnitt av klass Convertible (478 - 4940, n=51, senaste 2 åren) | |
| Genomsnitt Intel Core i7-8565U (452 - 815, n=52) | |
| Dell Inspiron 13 7386 | |
| HP ProBook x360 440 G1 | |
| Lenovo Yoga 530-14IKB-81EK00CWGE | |
| Lenovo ThinkPad L380 Yoga-20M7001BGE | |
| Dell Inspiron 13 7386 SK Hynix BC501 HFM512GDJTNG | Lenovo Yoga 530-14IKB-81EK00CWGE SK hynix PC401 HFS256GD9TNG | HP ProBook x360 440 G1 Toshiba KBG30ZMV256G | Lenovo ThinkPad L380 Yoga-20M7001BGE Samsung PM961 MZVLW256HEHP | Genomsnitt SK Hynix BC501 HFM512GDJTNG | |
|---|---|---|---|---|---|
| CrystalDiskMark 5.2 / 6 | 23% | -8% | 55% | 5% | |
| Write 4K (MB/s) | 97.4 | 123.1 26% | 98.8 1% | 123.4 27% | 95.5 ? -2% |
| Read 4K (MB/s) | 38.05 | 43.24 14% | 44.32 16% | 42.24 11% | 38.3 ? 1% |
| Write Seq (MB/s) | 656 | 763 16% | 685 4% | 920 40% | 759 ? 16% |
| Read Seq (MB/s) | 1043 | 1632 56% | 665 -36% | 1991 91% | 1022 ? -2% |
| Write 4K Q32T1 (MB/s) | 331.5 | 268.6 -19% | 278 -16% | 531 60% | 303 ? -9% |
| Read 4K Q32T1 (MB/s) | 253.8 | 345.2 36% | 307.3 21% | 373.6 47% | 317 ? 25% |
| Write Seq Q32T1 (MB/s) | 879 | 800 -9% | 657 -25% | 1360 55% | 885 ? 1% |
| Read Seq Q32T1 (MB/s) | 1639 | 2620 60% | 1202 -27% | 3394 107% | 1803 ? 10% |
| Write 4K Q8T8 (MB/s) | 536 | 306 ? | |||
| Read 4K Q8T8 (MB/s) | 560 | 698 ? | |||
| AS SSD | -19% | -82% | 1% | -4% | |
| Seq Read (MB/s) | 1122 | 2071 85% | 1255 12% | 1609 43% | 1323 ? 18% |
| Seq Write (MB/s) | 619 | 721 16% | 625 1% | 859 39% | 697 ? 13% |
| 4K Read (MB/s) | 39.58 | 34.44 -13% | 42.09 6% | 49.34 25% | 40.4 ? 2% |
| 4K Write (MB/s) | 108.5 | 91 -16% | 96.1 -11% | 117 8% | 100.8 ? -7% |
| 4K-64 Read (MB/s) | 776 | 448.2 -42% | 624 -20% | 774 0% | 686 ? -12% |
| 4K-64 Write (MB/s) | 671 | 268.9 -60% | 298.3 -56% | 299.9 -55% | 660 ? -2% |
| Access Time Read * (ms) | 0.045 | 0.046 -2% | 0.122 -171% | 0.049 -9% | 0.06071 ? -35% |
| Access Time Write * (ms) | 0.033 | 0.054 -64% | 0.224 -579% | 0.031 6% | 0.037 ? -12% |
| Score Read (Points) | 928 | 690 -26% | 791 -15% | 984 6% | 858 ? -8% |
| Score Write (Points) | 841 | 432 -49% | 457 -46% | 503 -40% | 830 ? -1% |
| Score Total (Points) | 2228 | 1416 -36% | 1634 -27% | 1966 -12% | 2107 ? -5% |
| Totalt genomsnitt (program/inställningar) | 2% /
-1% | -45% /
-51% | 28% /
24% | 1% /
-0% |
* ... mindre är bättre

| 3DMark 11 - 1280x720 Performance GPU | |
| Genomsnitt av klass Convertible (1505 - 40732, n=50, senaste 2 åren) | |
| Dell Inspiron 13 7386 | |
| HP ProBook x360 440 G1 | |
| Genomsnitt Intel UHD Graphics 620 (1144 - 3432, n=244) | |
| Lenovo Yoga 530-14IKB-81EK00CWGE | |
| Lenovo ThinkPad L380 Yoga-20M7001BGE | |
| 3DMark | |
| 1280x720 Cloud Gate Standard Graphics | |
| Genomsnitt av klass Convertible (7885 - 57566, n=34, senaste 2 åren) | |
| Dell Inspiron 13 7386 | |
| HP ProBook x360 440 G1 | |
| Genomsnitt Intel UHD Graphics 620 (6205 - 16400, n=225) | |
| Lenovo Yoga 530-14IKB-81EK00CWGE | |
| Lenovo ThinkPad L380 Yoga-20M7001BGE | |
| 1920x1080 Fire Strike Graphics | |
| Genomsnitt av klass Convertible (1185 - 27447, n=50, senaste 2 åren) | |
| Dell Inspiron 13 7386 | |
| HP ProBook x360 440 G1 | |
| Genomsnitt Intel UHD Graphics 620 (557 - 2608, n=213) | |
| Lenovo Yoga 530-14IKB-81EK00CWGE | |
| Lenovo ThinkPad L380 Yoga-20M7001BGE | |
| 3DMark 11 Performance | 2073 poäng | |
| 3DMark Cloud Gate Standard Score | 8917 poäng | |
| 3DMark Fire Strike Score | 1218 poäng | |
Hjälp | ||
| BioShock Infinite | |
| 1280x720 Very Low Preset | |
| Dell Inspiron 13 7386 | |
| HP ProBook x360 440 G1 | |
| Genomsnitt Intel UHD Graphics 620 (18.3 - 90.2, n=187) | |
| Lenovo Yoga 530-14IKB-81EK00CWGE | |
| Lenovo ThinkPad L380 Yoga-20M7001BGE | |
| 1366x768 Medium Preset | |
| HP ProBook x360 440 G1 | |
| Dell Inspiron 13 7386 | |
| Genomsnitt Intel UHD Graphics 620 (11.5 - 45.5, n=187) | |
| Lenovo Yoga 530-14IKB-81EK00CWGE | |
| Lenovo ThinkPad L380 Yoga-20M7001BGE | |
| 1366x768 High Preset | |
| Dell Inspiron 13 7386 | |
| HP ProBook x360 440 G1 | |
| Genomsnitt Intel UHD Graphics 620 (8.1 - 35.9, n=187) | |
| Lenovo Yoga 530-14IKB-81EK00CWGE | |
| Lenovo ThinkPad L380 Yoga-20M7001BGE | |
| 1920x1080 Ultra Preset, DX11 (DDOF) | |
| Lenovo Yoga 530-14IKB-81EK00CWGE | |
| HP ProBook x360 440 G1 | |
| Dell Inspiron 13 7386 | |
| Genomsnitt Intel UHD Graphics 620 (4.5 - 17, n=176) | |
| Rainbow Six Siege | |
| 1024x768 Low Preset AA:T AF:Linear | |
| Dell Inspiron 13 7386 | |
| Genomsnitt Intel UHD Graphics 620 (28.2 - 48.4, n=5) | |
| 1366x768 Medium Preset AA:T AF:2x | |
| Dell Inspiron 13 7386 | |
| Genomsnitt Intel UHD Graphics 620 (16.1 - 29.4, n=5) | |
| 1920x1080 High Preset AA:T AF:4x | |
| Dell Inspiron 13 7386 | |
| Genomsnitt Intel UHD Graphics 620 (14.5 - 16.2, n=2) | |
| Farming Simulator 19 | |
| 1280x720 Low Preset | |
| Dell Inspiron 13 7386 | |
| Genomsnitt Intel UHD Graphics 620 (46.8 - 67.7, n=5) | |
| 1920x1080 Medium Preset | |
| Dell Inspiron 13 7386 | |
| Genomsnitt Intel UHD Graphics 620 (17.4 - 60.9, n=5) | |
| 1920x1080 Very High Preset | |
| Dell Inspiron 13 7386 | |
| Genomsnitt Intel UHD Graphics 620 (n=1) | |
| låg | med. | hög | ultra | |
|---|---|---|---|---|
| BioShock Infinite (2013) | 80.3 | 37.5 | 34.5 | 10.5 |
| Rainbow Six Siege (2015) | 47.1 | 29.4 | 16.2 | |
| Farming Simulator 19 (2018) | 67.7 | 60.9 | 25.2 | 12.9 |
Ljudnivå
| Låg belastning |
| 30.4 / 30.4 / 30.4 dB(A) |
| Hög belastning |
| 34.3 / 34.2 dB(A) |
 | ||
30 dB tyst 40 dB(A) hörbar 50 dB(A) högt ljud |
||
min: | ||
(±) Den maximala temperaturen på ovansidan är 40.5 °C / 105 F, jämfört med genomsnittet av 35.4 °C / 96 F , allt från 19.6 till 60 °C för klassen Convertible.
(±) Botten värms upp till maximalt 41.6 °C / 107 F, jämfört med genomsnittet av 36.9 °C / 98 F
(+) Vid tomgångsbruk är medeltemperaturen för ovansidan 24.8 °C / 77 F, jämfört med enhetsgenomsnittet på 30.3 °C / ### class_avg_f### F.
(+) Handledsstöden och pekplattan är kallare än hudtemperaturen med maximalt 29.6 °C / 85.3 F och är därför svala att ta på.
(±) Medeltemperaturen för handledsstödsområdet på liknande enheter var 28 °C / 82.4 F (-1.6 °C / -2.9 F).
Dell Inspiron 13 7386 ljudanalys
(-) | inte särskilt höga högtalare (64.1 dB)
Bas 100 - 315 Hz
(±) | reducerad bas - i genomsnitt 9.5% lägre än medianen
(+) | basen är linjär (5.3% delta till föregående frekvens)
Mellan 400 - 2000 Hz
(±) | högre mellan - i genomsnitt 5.3% högre än median
(+) | mids är linjära (5% delta till föregående frekvens)
Högsta 2 - 16 kHz
(+) | balanserade toppar - endast 1.8% från medianen
(+) | toppar är linjära (6.6% delta till föregående frekvens)
Totalt 100 - 16 000 Hz
(±) | linjäriteten för det totala ljudet är genomsnittlig (18.1% skillnad mot median)
Jämfört med samma klass
» 39% av alla testade enheter i den här klassen var bättre, 7% liknande, 54% sämre
» Den bästa hade ett delta på 6%, genomsnittet var 20%, sämst var 57%
Jämfört med alla testade enheter
» 38% av alla testade enheter var bättre, 8% liknande, 54% sämre
» Den bästa hade ett delta på 4%, genomsnittet var 24%, sämst var 134%
Lenovo Yoga 530-14IKB-81EK00CWGE ljudanalys
(-) | inte särskilt höga högtalare (69.9 dB)
Bas 100 - 315 Hz
(-) | nästan ingen bas - i genomsnitt 23.6% lägre än medianen
(±) | linjäriteten för basen är genomsnittlig (13.4% delta till föregående frekvens)
Mellan 400 - 2000 Hz
(+) | balanserad mellan - endast 3.5% från medianen
(±) | linjäriteten för mids är genomsnittlig (8.7% delta till föregående frekvens)
Högsta 2 - 16 kHz
(+) | balanserade toppar - endast 2.6% från medianen
(±) | linjäriteten för toppar är genomsnittlig (7.2% delta till föregående frekvens)
Totalt 100 - 16 000 Hz
(±) | linjäriteten för det totala ljudet är genomsnittlig (21.2% skillnad mot median)
Jämfört med samma klass
» 57% av alla testade enheter i den här klassen var bättre, 11% liknande, 32% sämre
» Den bästa hade ett delta på 6%, genomsnittet var 20%, sämst var 57%
Jämfört med alla testade enheter
» 59% av alla testade enheter var bättre, 7% liknande, 34% sämre
» Den bästa hade ett delta på 4%, genomsnittet var 24%, sämst var 134%
HP ProBook x360 440 G1 ljudanalys
(±) | högtalarljudstyrkan är genomsnittlig men bra (73.3 dB)
Bas 100 - 315 Hz
(-) | nästan ingen bas - i genomsnitt 26.8% lägre än medianen
(±) | linjäriteten för basen är genomsnittlig (8.9% delta till föregående frekvens)
Mellan 400 - 2000 Hz
(+) | balanserad mellan - endast 3.7% från medianen
(±) | linjäriteten för mids är genomsnittlig (7.5% delta till föregående frekvens)
Högsta 2 - 16 kHz
(±) | högre toppar - i genomsnitt 5.6% högre än medianen
(±) | linjäriteten för toppar är genomsnittlig (7.1% delta till föregående frekvens)
Totalt 100 - 16 000 Hz
(±) | linjäriteten för det totala ljudet är genomsnittlig (24.6% skillnad mot median)
Jämfört med samma klass
» 74% av alla testade enheter i den här klassen var bättre, 6% liknande, 19% sämre
» Den bästa hade ett delta på 6%, genomsnittet var 20%, sämst var 57%
Jämfört med alla testade enheter
» 75% av alla testade enheter var bättre, 5% liknande, 20% sämre
» Den bästa hade ett delta på 4%, genomsnittet var 24%, sämst var 134%
Lenovo ThinkPad L380 Yoga-20M7001BGE ljudanalys
(-) | inte särskilt höga högtalare (66.7 dB)
Bas 100 - 315 Hz
(-) | nästan ingen bas - i genomsnitt 17.5% lägre än medianen
(±) | linjäriteten för basen är genomsnittlig (13.8% delta till föregående frekvens)
Mellan 400 - 2000 Hz
(+) | balanserad mellan - endast 2.9% från medianen
(+) | mids är linjära (5.1% delta till föregående frekvens)
Högsta 2 - 16 kHz
(+) | balanserade toppar - endast 2.4% från medianen
(±) | linjäriteten för toppar är genomsnittlig (8.7% delta till föregående frekvens)
Totalt 100 - 16 000 Hz
(±) | linjäriteten för det totala ljudet är genomsnittlig (17.3% skillnad mot median)
Jämfört med samma klass
» 33% av alla testade enheter i den här klassen var bättre, 8% liknande, 59% sämre
» Den bästa hade ett delta på 6%, genomsnittet var 20%, sämst var 57%
Jämfört med alla testade enheter
» 32% av alla testade enheter var bättre, 8% liknande, 59% sämre
» Den bästa hade ett delta på 4%, genomsnittet var 24%, sämst var 134%
| Av/Standby | |
| Låg belastning | |
| Hög belastning |
|
Förklaring:
min: | |
| Dell Inspiron 13 7386 i7-8565U, UHD Graphics 620, SK Hynix BC501 HFM512GDJTNG, IPS, 3840x2160, 13.3" | Lenovo Yoga 530-14IKB-81EK00CWGE i5-8250U, UHD Graphics 620, SK hynix PC401 HFS256GD9TNG, IPS, 1920x1080, 14" | HP ProBook x360 440 G1 i5-8250U, UHD Graphics 620, Toshiba KBG30ZMV256G, IPS, 1920x1080, 14" | Lenovo ThinkPad L380 Yoga-20M7001BGE i5-8250U, UHD Graphics 620, Samsung PM961 MZVLW256HEHP, IPS LED, 1920x1080, 13.3" | Genomsnitt Intel UHD Graphics 620 | Genomsnitt av klass Convertible | |
|---|---|---|---|---|---|---|
| Power Consumption | 37% | 20% | 35% | 21% | 5% | |
| Idle Minimum * (Watt) | 6.5 | 3.3 49% | 4.6 29% | 3.44 47% | 3.81 ? 41% | 4.23 ? 35% |
| Idle Average * (Watt) | 12.2 | 5.8 52% | 7.5 39% | 6.9 43% | 6.94 ? 43% | 6.95 ? 43% |
| Idle Maximum * (Watt) | 12.7 | 8 37% | 9.6 24% | 9.2 28% | 8.75 ? 31% | 8.59 ? 32% |
| Load Average * (Watt) | 39 | 29.2 25% | 37 5% | 27.6 29% | 35 ? 10% | 43.5 ? -12% |
| Load Maximum * (Watt) | 39 | 31.1 20% | 38.8 1% | 29 26% | 47.5 ? -22% | 67 ? -72% |
* ... mindre är bättre
| Dell Inspiron 13 7386 i7-8565U, UHD Graphics 620, 38 Wh | Lenovo Yoga 530-14IKB-81EK00CWGE i5-8250U, UHD Graphics 620, 45 Wh | HP ProBook x360 440 G1 i5-8250U, UHD Graphics 620, 48 Wh | Lenovo ThinkPad L380 Yoga-20M7001BGE i5-8250U, UHD Graphics 620, 45 Wh | Genomsnitt av klass Convertible | |
|---|---|---|---|---|---|
| Batteridrifttid | 73% | 104% | 64% | 180% | |
| Reader / Idle (h) | 6.7 | 15.3 128% | 17.3 158% | 13.9 107% | 27.7 ? 313% |
| H.264 (h) | 5.5 | 9.1 65% | 8.3 51% | 8.5 55% | 15.3 ? 178% |
| WiFi v1.3 (h) | 3.9 | 7 79% | 8.9 128% | 7 79% | 12.1 ? 210% |
| Load (h) | 1.5 | 1.8 20% | 2.7 80% | 1.7 13% | 1.779 ? 19% |
För
Emot
Läs den fullständiga versionen av den här recensionen på engelska här.
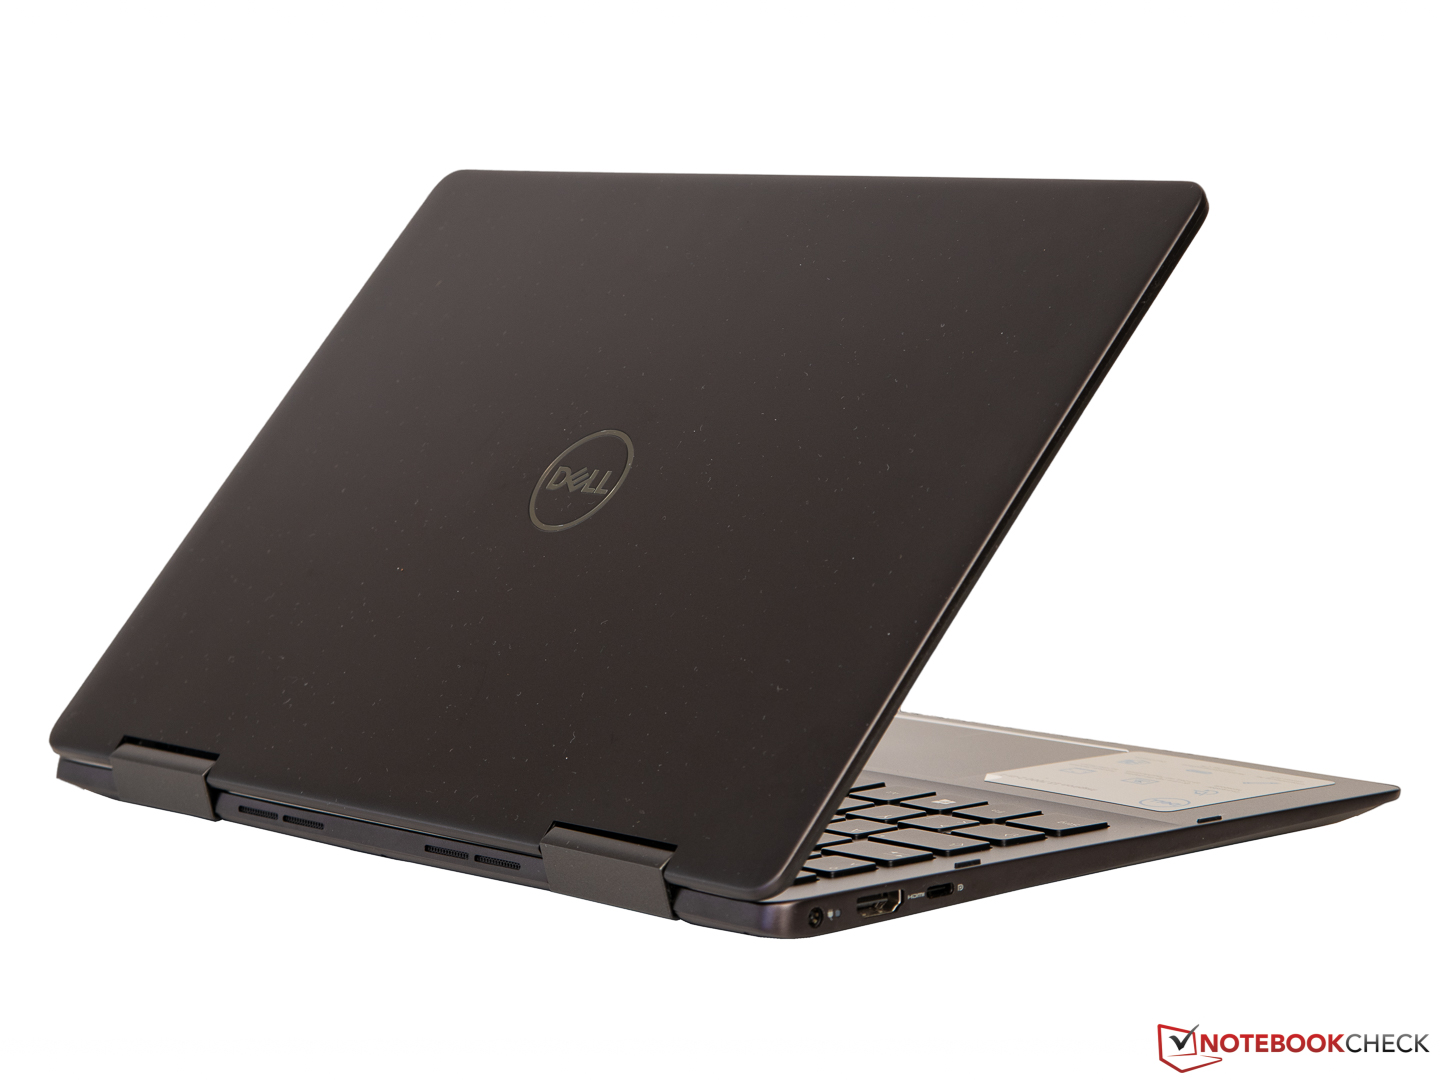
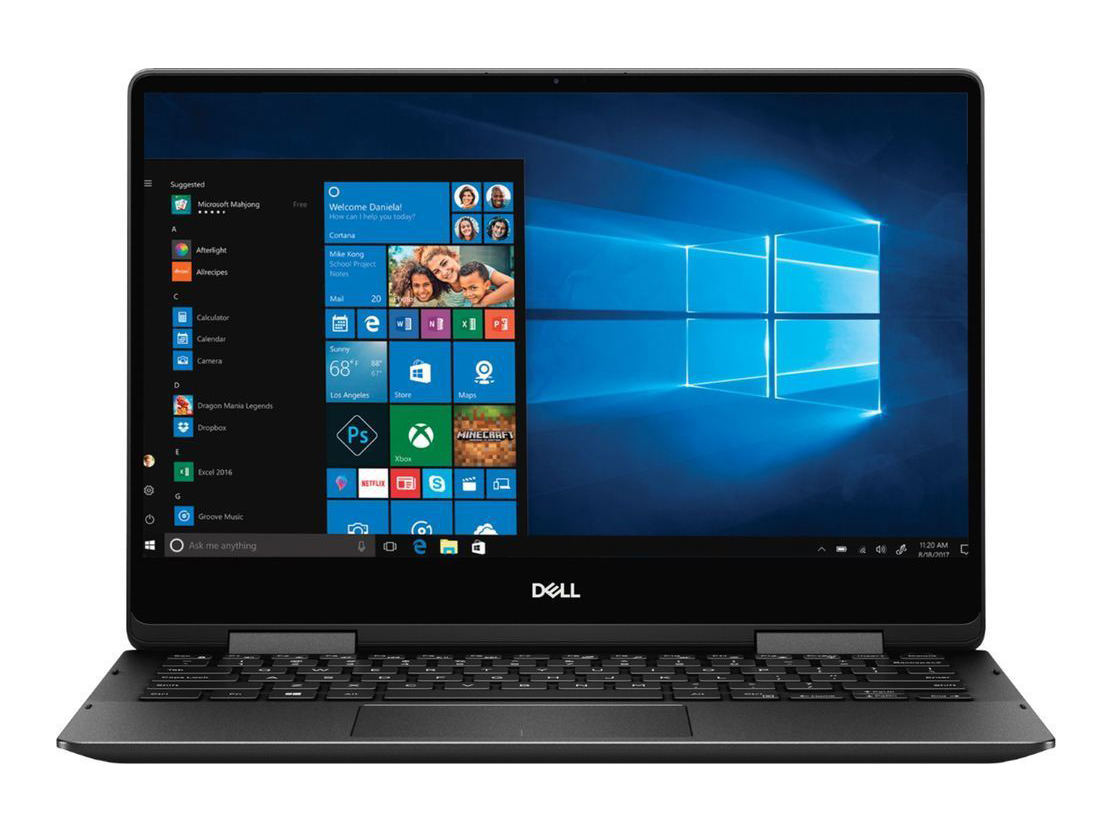
Dell Inspiron 13 7386 2-in-1 Black Edition är på papperet en bra laptop. Den har en kraftfull processor, rikligt med RAM och en stor SSD-enhet. Vidare har denna omvandlingsbara en skärm med högre upplösning än våra jämförelseenheter och dess aluminiumhölje ser lyxigt ut.
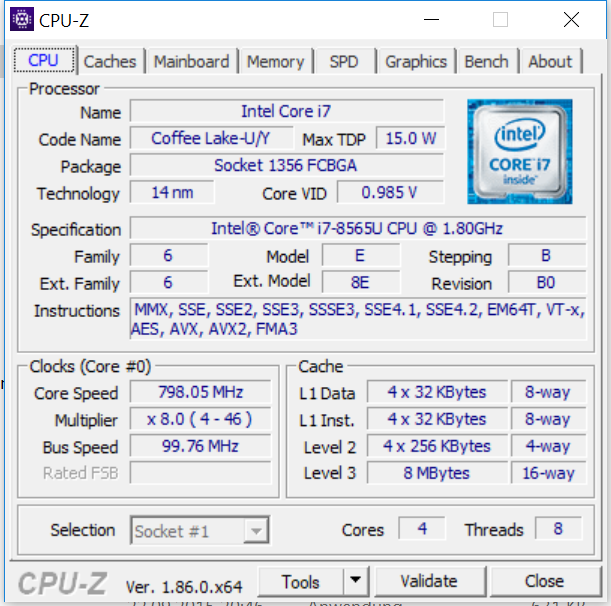
Tyvärr faller det samman när vi genomför våra tester på enheten. Core i7-8565U processorn presterar sämre än den Core i5-8250U som satt i våra jämförelseenheter, SSD-enheten var inte särskilt snabb och UHD-skärmen är inte värd de extra 2.000 kronorna som Dell för tillfället tar för den jämfört med FHD-alternativet. Höljet drar dessutom åt sig fingeravtryck som en magnet och batteritiden är avskyvärd.
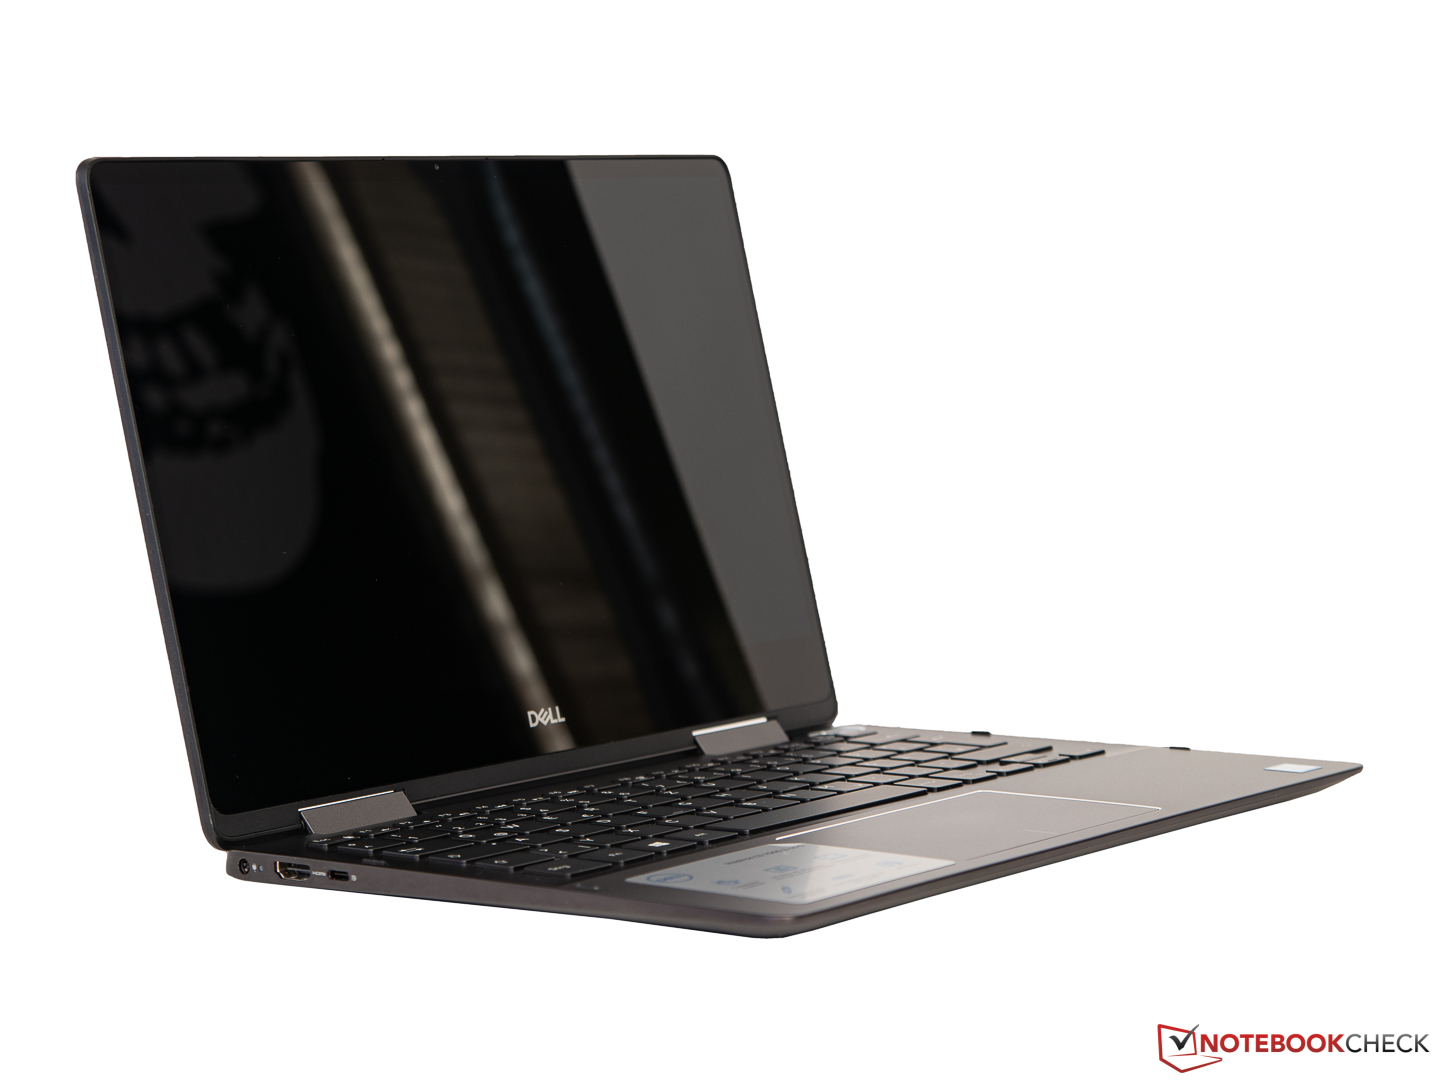
Dell Inspiron 13 7386 2-in-1 Black Edition har potentialen att vara en fantastisk omvandlingsbar men den hålls tillbaka av batteritid som var en besvikelse, hög energiförbrukning och svag prestanda.
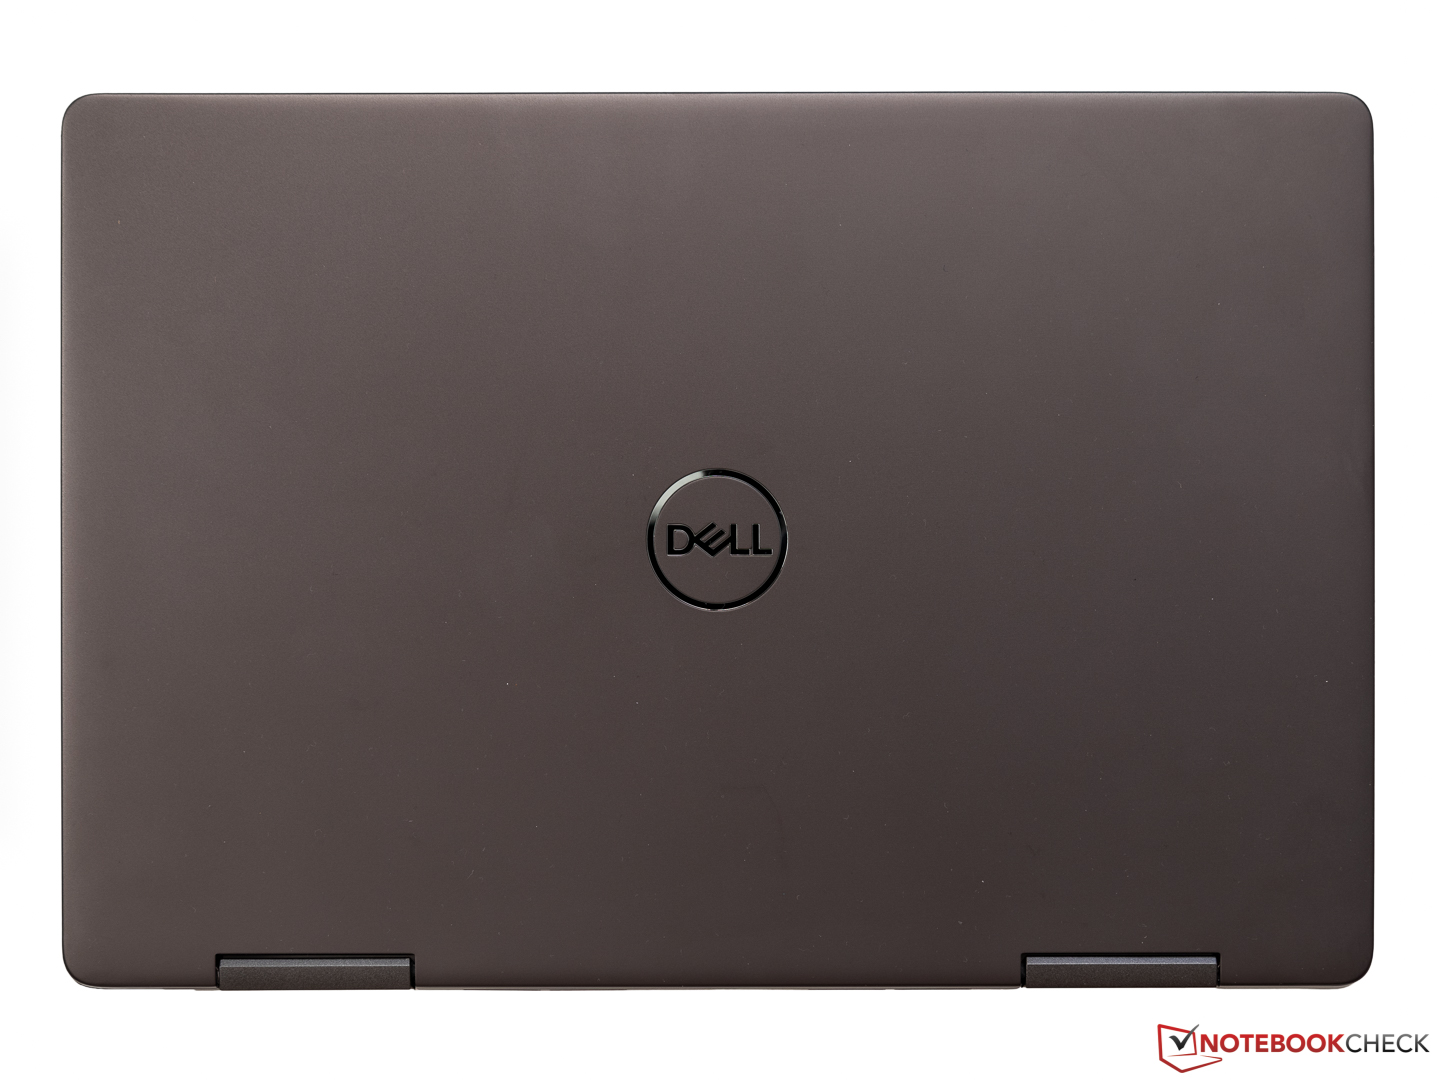
Till Dells fördel ska det sägas att 7386 är välgjord och har rejäla inmatningsenheter. Skärmen har dessutom god färgprecision, även om den bara är tillräcklig för icke-professionellt bildarbete. Högtalarna överraskade oss dessutom positivt då de var imponerande för att vara på laptopnivå. Det finns också många konfigurationsalternativ så enheten kan anpassas efter behov.
Kom ihåg att en del av nackdelarna specifikt rörde vår testenhet, såsom att den vänstra musknappen inte fungerade. Om du gillade Inspiron 13 7000 2-in-1 serien rekommenderar vi att du överväger basmodellen av 7386 istället. Den är mer prisvärd, Core i5-8265U processorn värmestryps inte lika kraftigt, den bör ha längre batteritid och dessutom borde FHD-skärmen hjälpa till med att minska energiförbrukningen.
Dell Inspiron 13 7386
- 01/22/2019 v6 (old)
Sven Kloevekorn
Price comparison
