Test: Dell Inspiron 13 7368 (sammanfattning)
| SD Card Reader | |
| average JPG Copy Test (av. of 3 runs) | |
| Dell XPS 13 2016 9350 (FHD, i7-6560U) | |
| Apple MacBook Pro Retina 13 inch 2013-10 | |
| Lenovo IdeaPad 710S-13ISK 80SW0031US | |
| Dell Inspiron 13 7386 | |
| maximum AS SSD Seq Read Test (1GB) | |
| Dell XPS 13 2016 9350 (FHD, i7-6560U) | |
| Lenovo IdeaPad 710S-13ISK 80SW0031US | |
| Dell Inspiron 13 7386 | |
| |||||||||||||||||||||||||
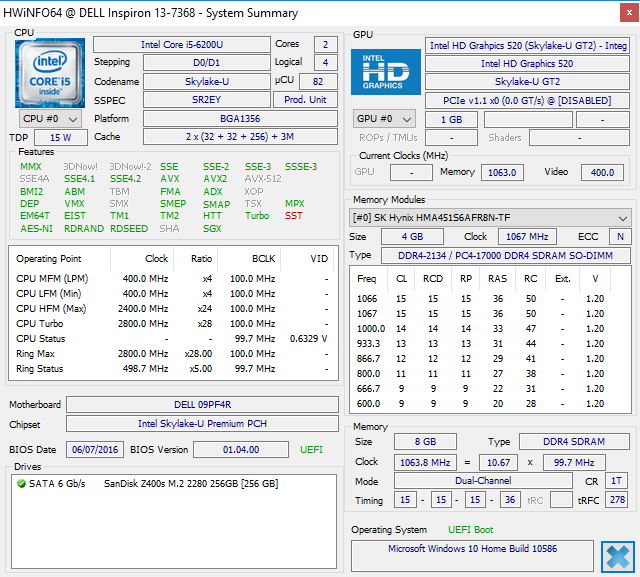
Distribution av ljusstyrkan: 91 %
Mitt på batteriet: 226.4 cd/m²
Kontrast: 858:1 (Svärta: 0.264 cd/m²)
ΔE ColorChecker Calman: 4.96 | ∀{0.5-29.43 Ø4.71}
ΔE Greyscale Calman: 3.71 | ∀{0.09-98 Ø4.96}
60.5% sRGB (Argyll 1.6.3 3D)
38.6% AdobeRGB 1998 (Argyll 1.6.3 3D)
42.19% AdobeRGB 1998 (Argyll 3D)
61.1% sRGB (Argyll 3D)
40.82% Display P3 (Argyll 3D)
Gamma: 2.18
CCT: 7215 K
| Dell Inspiron 13 7386 IPS, 13.3", 1920x1080 | Acer Aspire R13 R7-372T-746N Sharp LQ133T1JW02, IPS, 13.3", 2560x1440 | Dell Inspiron 13-7348 IPS, 13.3", 1920x1080 | HP Spectre x360 13-4104ng LG Philips LGD0000, IPS, 13.3", 2560x1440 | Lenovo Yoga 900-13ISK 80MK IPS, 13.3", 3200x1800 | Microsoft Surface Book Core i5 IPS, 13.5", 3000x2000 | |
|---|---|---|---|---|---|---|
| Display | 66% | 57% | 59% | 51% | 61% | |
| Display P3 Coverage (%) | 40.82 | 69.6 71% | 65.2 60% | 66.8 64% | 63.2 55% | 67 64% |
| sRGB Coverage (%) | 61.1 | 98 60% | 93.5 53% | 92.8 52% | 88.7 45% | 95.8 57% |
| AdobeRGB 1998 Coverage (%) | 42.19 | 70.7 68% | 67.1 59% | 67.3 60% | 64.9 54% | 68.9 63% |
| Response Times | 17% | 46% | 27% | 1% | ||
| Response Time Grey 50% / Grey 80% * (ms) | 56 ? | 36 ? 36% | 24 ? 57% | 38.8 ? 31% | 48.4 ? 14% | |
| Response Time Black / White * (ms) | 29.2 ? | 30 ? -3% | 19 ? 35% | 22.4 ? 23% | 32.8 ? -12% | |
| PWM Frequency (Hz) | 203.3 ? | 1000 ? | 1316 | |||
| Screen | 42% | -11% | 19% | -2% | 56% | |
| Brightness middle (cd/m²) | 226.4 | 320 41% | 375 66% | 324 43% | 319.8 41% | 430.9 90% |
| Brightness (cd/m²) | 218 | 308 41% | 351 61% | 324 49% | 302 39% | 410 88% |
| Brightness Distribution (%) | 91 | 91 0% | 89 -2% | 90 -1% | 88 -3% | 93 2% |
| Black Level * (cd/m²) | 0.264 | 0.17 36% | 0.44 -67% | 0.34 -29% | 0.835 -216% | 0.254 4% |
| Contrast (:1) | 858 | 1882 119% | 852 -1% | 953 11% | 383 -55% | 1696 98% |
| Colorchecker dE 2000 * | 4.96 | 3.18 36% | 7.37 -49% | 4.36 12% | 2.68 46% | 2.06 58% |
| Colorchecker dE 2000 max. * | 13 | 9.91 24% | ||||
| Greyscale dE 2000 * | 3.71 | 4.13 -11% | 9.54 -157% | 4.62 -25% | 2.35 37% | 2.22 40% |
| Gamma | 2.18 101% | 2.03 108% | 2.69 82% | 2.18 101% | 2.09 105% | 2.13 103% |
| CCT | 7215 90% | 6752 96% | 6685 97% | 6857 95% | 6975 93% | 6520 100% |
| Color Space (Percent of AdobeRGB 1998) (%) | 38.6 | 65 68% | 61 58% | 60 55% | 57 48% | 64 66% |
| Color Space (Percent of sRGB) (%) | 60.5 | 98 62% | 93 54% | 88 45% | 96 59% | |
| Totalt genomsnitt (program/inställningar) | 42% /
43% | 23% /
7% | 41% /
31% | 25% /
14% | 39% /
49% |
* ... mindre är bättre
Visa svarstider
| ↔ Svarstid svart till vitt | ||
|---|---|---|
| 29.2 ms ... stiga ↗ och falla ↘ kombinerat | ↗ 7.6 ms stiga | 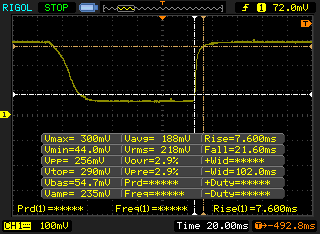 |
| ↘ 21.6 ms hösten | ||
| Skärmen visar relativt långsamma svarsfrekvenser i våra tester och kan vara för långsam för spelare. I jämförelse sträcker sig alla testade enheter från 0.1 (minst) till 240 (maximalt) ms. » 78 % av alla enheter är bättre. Detta innebär att den uppmätta svarstiden är sämre än genomsnittet av alla testade enheter (19.8 ms). | ||
| ↔ Svarstid 50 % grått till 80 % grått | ||
| 56 ms ... stiga ↗ och falla ↘ kombinerat | ↗ 22.8 ms stiga | 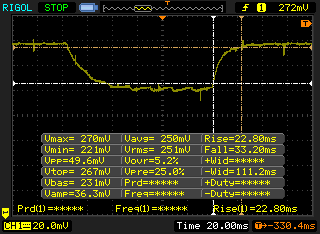 |
| ↘ 33.2 ms hösten | ||
| Skärmen visar långsamma svarsfrekvenser i våra tester och kommer att vara otillfredsställande för spelare. I jämförelse sträcker sig alla testade enheter från 0.165 (minst) till 636 (maximalt) ms. » 93 % av alla enheter är bättre. Detta innebär att den uppmätta svarstiden är sämre än genomsnittet av alla testade enheter (31 ms). | ||
Skärmflimmer / PWM (Puls-Width Modulation)
| Skärmflimmer / PWM upptäckt | 203.3 Hz | ≤ 99 % ljusstyrka inställning | 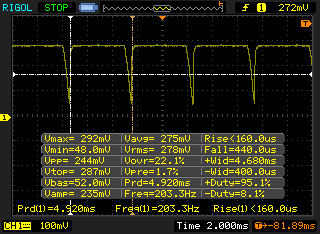 |
Displayens bakgrundsbelysning flimrar vid 203.3 Hz (i värsta fall, t.ex. med PWM) Flimrande upptäckt vid en ljusstyrkeinställning på 99 % och lägre. Det ska inte finnas något flimmer eller PWM över denna ljusstyrkeinställning. Frekvensen för 203.3 Hz är relativt låg, så känsliga användare kommer sannolikt att märka flimmer och uppleva ansträngda ögon vid den angivna ljusstyrkeinställningen och nedan. Som jämförelse: 52 % av alla testade enheter använder inte PWM för att dämpa skärmen. Om PWM upptäcktes mättes ett medelvärde av 7754 (minst: 5 - maximum: 343500) Hz. | |||
* ... mindre är bättre
| PCMark 8 Home Score Accelerated v2 | 3223 poäng | |
| PCMark 8 Creative Score Accelerated v2 | 4072 poäng | |
| PCMark 8 Work Score Accelerated v2 | 4343 poäng | |
Hjälp | ||
| Dell Inspiron 13 7386 SanDisk Z400s 256 GB M.2 2280 | Acer Aspire R13 R7-372T-746N Lite-On CV1-8B256 | Dell Inspiron 13-7348 Samsung PM851 Series MZMTE256HMHP | HP Spectre 13-4001ng x360 ADATA AXNS381E-256GM-B | Lenovo Yoga 900-13ISK 80MK Samsung SSD PM871 MZNLN512HCJH | Microsoft Surface Book Core i7 Samsung MZFLV512 NVMe | |
|---|---|---|---|---|---|---|
| CrystalDiskMark 3.0 | 27% | 22% | 22% | 37% | 120% | |
| Read Seq (MB/s) | 493.5 | 507 3% | 514 4% | 475.6 -4% | 514 4% | 953 93% |
| Write Seq (MB/s) | 329.4 | 354.4 8% | 268 -19% | 288.6 -12% | 459.5 39% | 592 80% |
| Read 512 (MB/s) | 289.8 | 355.3 23% | 411.8 42% | 322.9 11% | 413.4 43% | 520 79% |
| Write 512 (MB/s) | 304.1 | 353.9 16% | 268.6 -12% | 285.2 -6% | 424.5 40% | 591 94% |
| Read 4k (MB/s) | 19.62 | 32.66 66% | 26.94 37% | 31.87 62% | 36.34 85% | 42.66 117% |
| Write 4k (MB/s) | 72.3 | 81.6 13% | 74.5 3% | 102.7 42% | 100.1 38% | 136.3 89% |
| Read 4k QD32 (MB/s) | 147.8 | 277.6 88% | 325.9 121% | 276.7 87% | 313.8 112% | 615 316% |
| Write 4k QD32 (MB/s) | 268 | 261.2 -3% | 266.7 0% | 261.6 -2% | 96.8 -64% | 517 93% |

| 3DMark 11 | |
| 1280x720 Performance GPU (sortera efter värde) | |
| Dell Inspiron 13 7386 | |
| Acer TravelMate P278-MG-76L2 | |
| Toshiba Tecra Z40-C-11F | |
| Dell Latitude 3470 N2P7L347014EMEA | |
| Fujitsu Lifebook E544 | |
| Asus Transformer Book T300LA-C4006H | |
| 1280x720 Performance Combined (sortera efter värde) | |
| Dell Inspiron 13 7386 | |
| Acer TravelMate P278-MG-76L2 | |
| Toshiba Tecra Z40-C-11F | |
| Dell Latitude 3470 N2P7L347014EMEA | |
| Fujitsu Lifebook E544 | |
| Asus Transformer Book T300LA-C4006H | |
| 3DMark | |
| 1280x720 Cloud Gate Standard Graphics (sortera efter värde) | |
| Dell Inspiron 13 7386 | |
| Acer TravelMate P278-MG-76L2 | |
| Toshiba Tecra Z40-C-11F | |
| Dell Latitude 3470 N2P7L347014EMEA | |
| Fujitsu Lifebook E544 | |
| Asus Transformer Book T300LA-C4006H | |
| 1920x1080 Fire Strike Graphics (sortera efter värde) | |
| Dell Inspiron 13 7386 | |
| Acer TravelMate P278-MG-76L2 | |
| Toshiba Tecra Z40-C-11F | |
| Dell Latitude 3470 N2P7L347014EMEA | |
| Asus Transformer Book T300LA-C4006H | |
| 1920x1080 Ice Storm Extreme Graphics (sortera efter värde) | |
| Dell Inspiron 13 7386 | |
| Acer TravelMate P278-MG-76L2 | |
| Toshiba Tecra Z40-C-11F | |
| Dell Latitude 3470 N2P7L347014EMEA | |
| 3DMark 11 Performance | 1615 poäng | |
| 3DMark Ice Storm Standard Score | 55696 poäng | |
| 3DMark Cloud Gate Standard Score | 5941 poäng | |
| 3DMark Fire Strike Score | 882 poäng | |
| 3DMark Fire Strike Extreme Score | 401 poäng | |
Hjälp | ||
| BioShock Infinite | |
| 1366x768 Medium Preset | |
| Acer TravelMate P278-MG-76L2 | |
| Intel NUC6i5SYH | |
| Dell Inspiron 13 7386 | |
| Dell Latitude 3470 N2P7L347014EMEA | |
| Lenovo B50-70 MCC2GGE | |
| Fujitsu Lifebook E544 | |
| 1366x768 High Preset | |
| Acer TravelMate P278-MG-76L2 | |
| Intel NUC6i5SYH | |
| Dell Inspiron 13 7386 | |
| Dell Latitude 3470 N2P7L347014EMEA | |
| Lenovo B50-70 MCC2GGE | |
| Fujitsu Lifebook E544 | |
| låg | med. | hög | ultra | |
|---|---|---|---|---|
| StarCraft II: Heart of the Swarm (2013) | 156.2 | 52.5 | 35.5 | 18.4 |
| BioShock Infinite (2013) | 31.3 | 19.5 | 16.7 | 7.1 |
| Overwatch (2016) | 34.1 | 24.8 | 15.8 |
Ljudnivå
| Låg belastning |
| 29.4 / 29.4 / 29.4 dB(A) |
| Hög belastning |
| 32.2 / 35 dB(A) |
 | ||
30 dB tyst 40 dB(A) hörbar 50 dB(A) högt ljud |
||
min: | ||
| Dell Inspiron 13 7386 HD Graphics 520, 6200U, SanDisk Z400s 256 GB M.2 2280 | Acer Aspire R13 R7-372T-746N HD Graphics 520, 6500U, Lite-On CV1-8B256 | Dell Inspiron 13-7348 HD Graphics 5500, 5500U, Samsung PM851 Series MZMTE256HMHP | HP Spectre x360 13-4104ng HD Graphics 520, 6200U, Samsung SSD PM851 256 GB MZNTE256HMHP | Lenovo Yoga 900-13ISK 80MK HD Graphics 520, 6500U, Samsung SSD PM871 MZNLN512HCJH | Microsoft Surface Book Core i7 Maxwell GPU (940M, GDDR5), 6600U, Samsung MZFLV512 NVMe | |
|---|---|---|---|---|---|---|
| Noise | -10% | -6% | -7% | -3% | -10% | |
| av / miljö * (dB) | 29.4 | 31.3 -6% | 31.3 -6% | |||
| Idle Minimum * (dB) | 29.4 | 31.3 -6% | 29.6 -1% | 29.6 -1% | 29.7 -1% | 31.3 -6% |
| Idle Average * (dB) | 29.4 | 31.3 -6% | 29.6 -1% | 29.6 -1% | 29.8 -1% | 31.3 -6% |
| Idle Maximum * (dB) | 29.4 | 31.8 -8% | 29.6 -1% | 34.6 -18% | 30 -2% | 31.3 -6% |
| Load Average * (dB) | 32.2 | 39.2 -22% | 35.4 -10% | 34.7 -8% | 32 1% | 38 -18% |
| Load Maximum * (dB) | 35 | 39.1 -12% | 41.4 -18% | 37.9 -8% | 38.5 -10% | 40.5 -16% |
* ... mindre är bättre
(±) Den maximala temperaturen på ovansidan är 43.2 °C / 110 F, jämfört med genomsnittet av 35.4 °C / 96 F , allt från 19.6 till 60 °C för klassen Convertible.
(-) Botten värms upp till maximalt 45.2 °C / 113 F, jämfört med genomsnittet av 36.9 °C / 98 F
(+) Vid tomgångsbruk är medeltemperaturen för ovansidan 26.3 °C / 79 F, jämfört med enhetsgenomsnittet på 30.3 °C / ### class_avg_f### F.
(+) Handledsstöden och pekplattan når maximal hudtemperatur (33.6 °C / 92.5 F) och är därför inte varma.
(-) Medeltemperaturen för handledsstödsområdet på liknande enheter var 28 °C / 82.4 F (-5.6 °C / -10.1 F).
| Av/Standby | |
| Låg belastning | |
| Hög belastning |
|
Förklaring:
min: | |
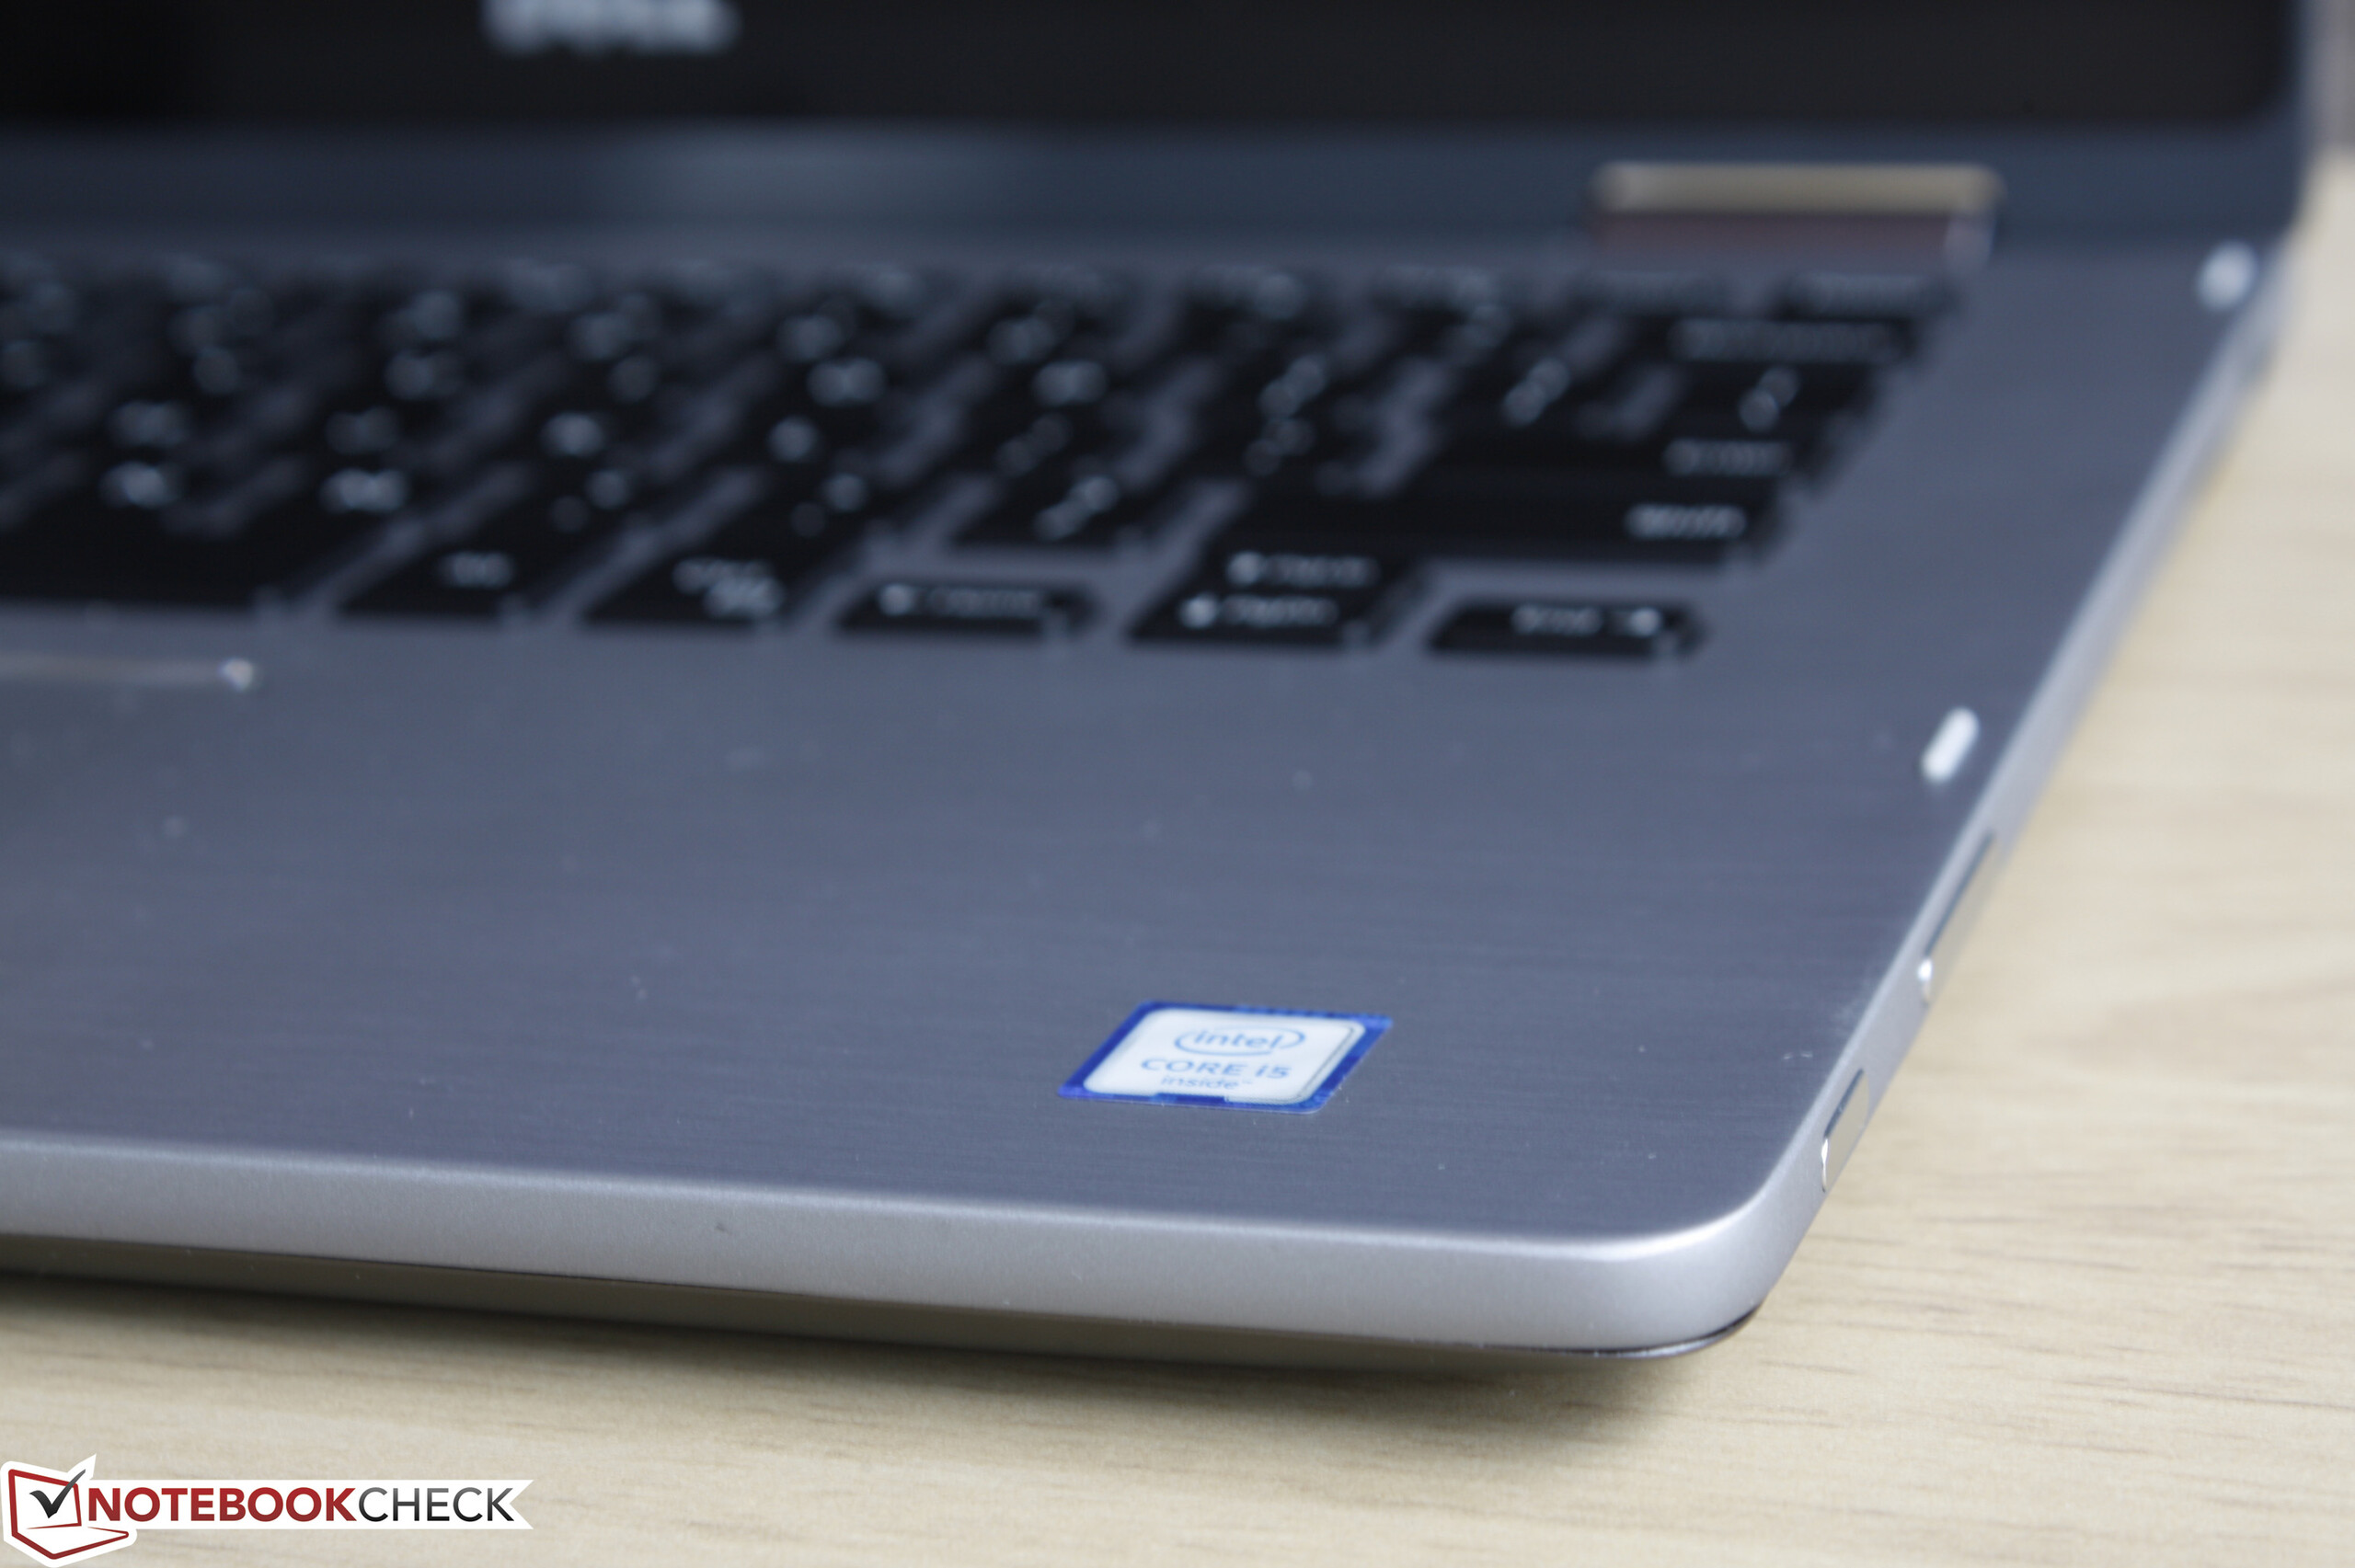
| Dell Inspiron 13 7386 6200U, HD Graphics 520, SanDisk Z400s 256 GB M.2 2280, IPS, 1920x1080, 13.3" | Acer Aspire R13 R7-372T-746N 6500U, HD Graphics 520, Lite-On CV1-8B256, IPS, 2560x1440, 13.3" | Dell Inspiron 13-7348 5500U, HD Graphics 5500, Samsung PM851 Series MZMTE256HMHP, IPS, 1920x1080, 13.3" | HP Spectre x360 13-4104ng 6200U, HD Graphics 520, Samsung SSD PM851 256 GB MZNTE256HMHP, IPS, 2560x1440, 13.3" | HP Spectre 13 6500U, HD Graphics 520, Samsung PM951 NVMe MZVLV256, IPS UWVA, 1920x1080, 13.3" | Microsoft Surface Book Core i7 6600U, Maxwell GPU (940M, GDDR5), Samsung MZFLV512 NVMe, IPS, 3000x2000, 13.5" | |
|---|---|---|---|---|---|---|
| Power Consumption | -37% | 8% | -3% | -50% | -54% | |
| Idle Minimum * (Watt) | 4.6 | 6.2 -35% | 3.5 24% | 3.9 15% | 8.6 -87% | 4.5 2% |
| Idle Average * (Watt) | 7 | 8 -14% | 5.6 20% | 7.4 -6% | 11 -57% | 9.8 -40% |
| Idle Maximum * (Watt) | 7.7 | 11.6 -51% | 7.6 1% | 9.2 -19% | 11.3 -47% | 12.2 -58% |
| Load Average * (Watt) | 24.8 | 40 -61% | 26.3 -6% | 28.1 -13% | 33.8 -36% | 46 -85% |
| Load Maximum * (Watt) | 29.3 | 36.6 -25% | 29 1% | 27.6 6% | 36.2 -24% | 56 -91% |
* ... mindre är bättre
| Dell Inspiron 13 7386 6200U, HD Graphics 520, 42 Wh | Acer Aspire R13 R7-372T-746N 6500U, HD Graphics 520, 49 Wh | Dell Inspiron 13-7348 5500U, HD Graphics 5500, 43 Wh | HP Spectre x360 13-4104ng 6200U, HD Graphics 520, 56 Wh | Lenovo Yoga 900-13ISK 80MK 6500U, HD Graphics 520, 66 Wh | Microsoft Surface Book Core i5 6300U, Maxwell GPU (940M, GDDR5), 78 Wh | |
|---|---|---|---|---|---|---|
| Batteridrifttid | -9% | -19% | 32% | 14% | 33% | |
| Reader / Idle (h) | 12.6 | 11.2 -11% | 8.7 -31% | 14.1 12% | 17.8 41% | |
| WiFi v1.3 (h) | 6.3 | 6.4 2% | 8.3 32% | 6.7 6% | 6.7 6% | |
| Load (h) | 1.7 | 1.4 -18% | 1.6 -6% | 2.1 24% | 2.6 53% | |
| WiFi (h) | 6.6 |
För
Emot
Läs en längre version av texten på engelska här.
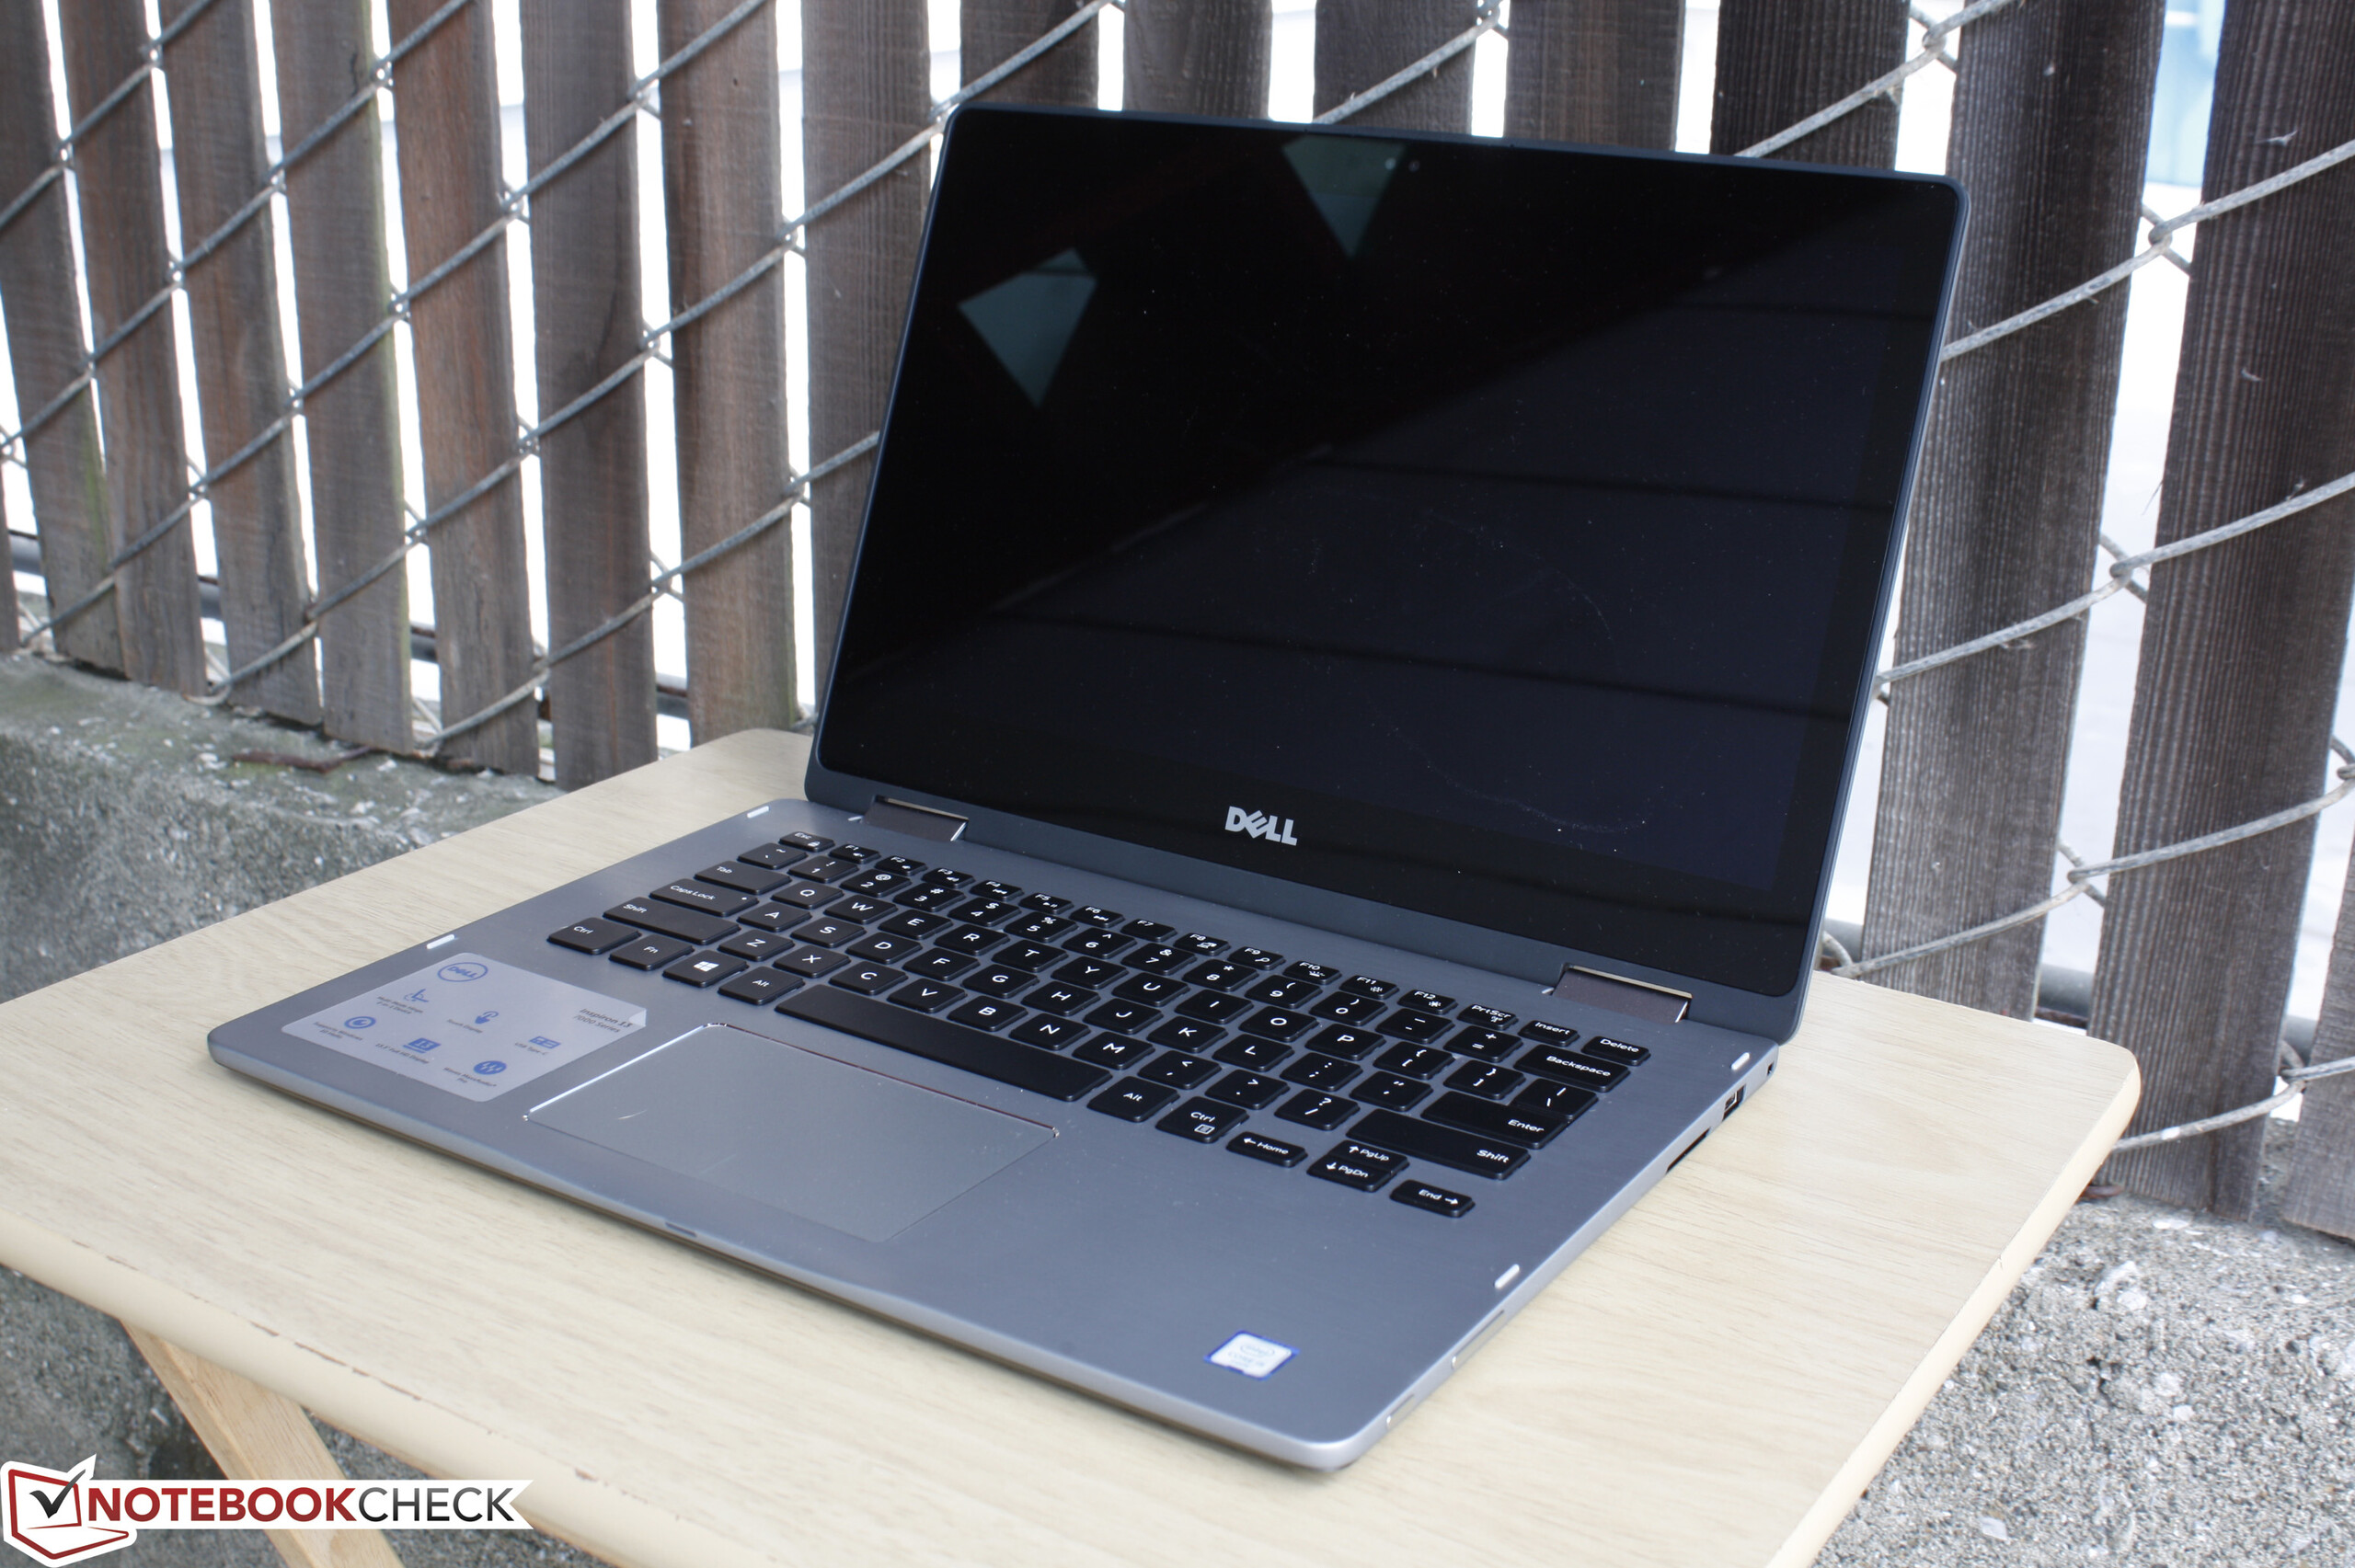
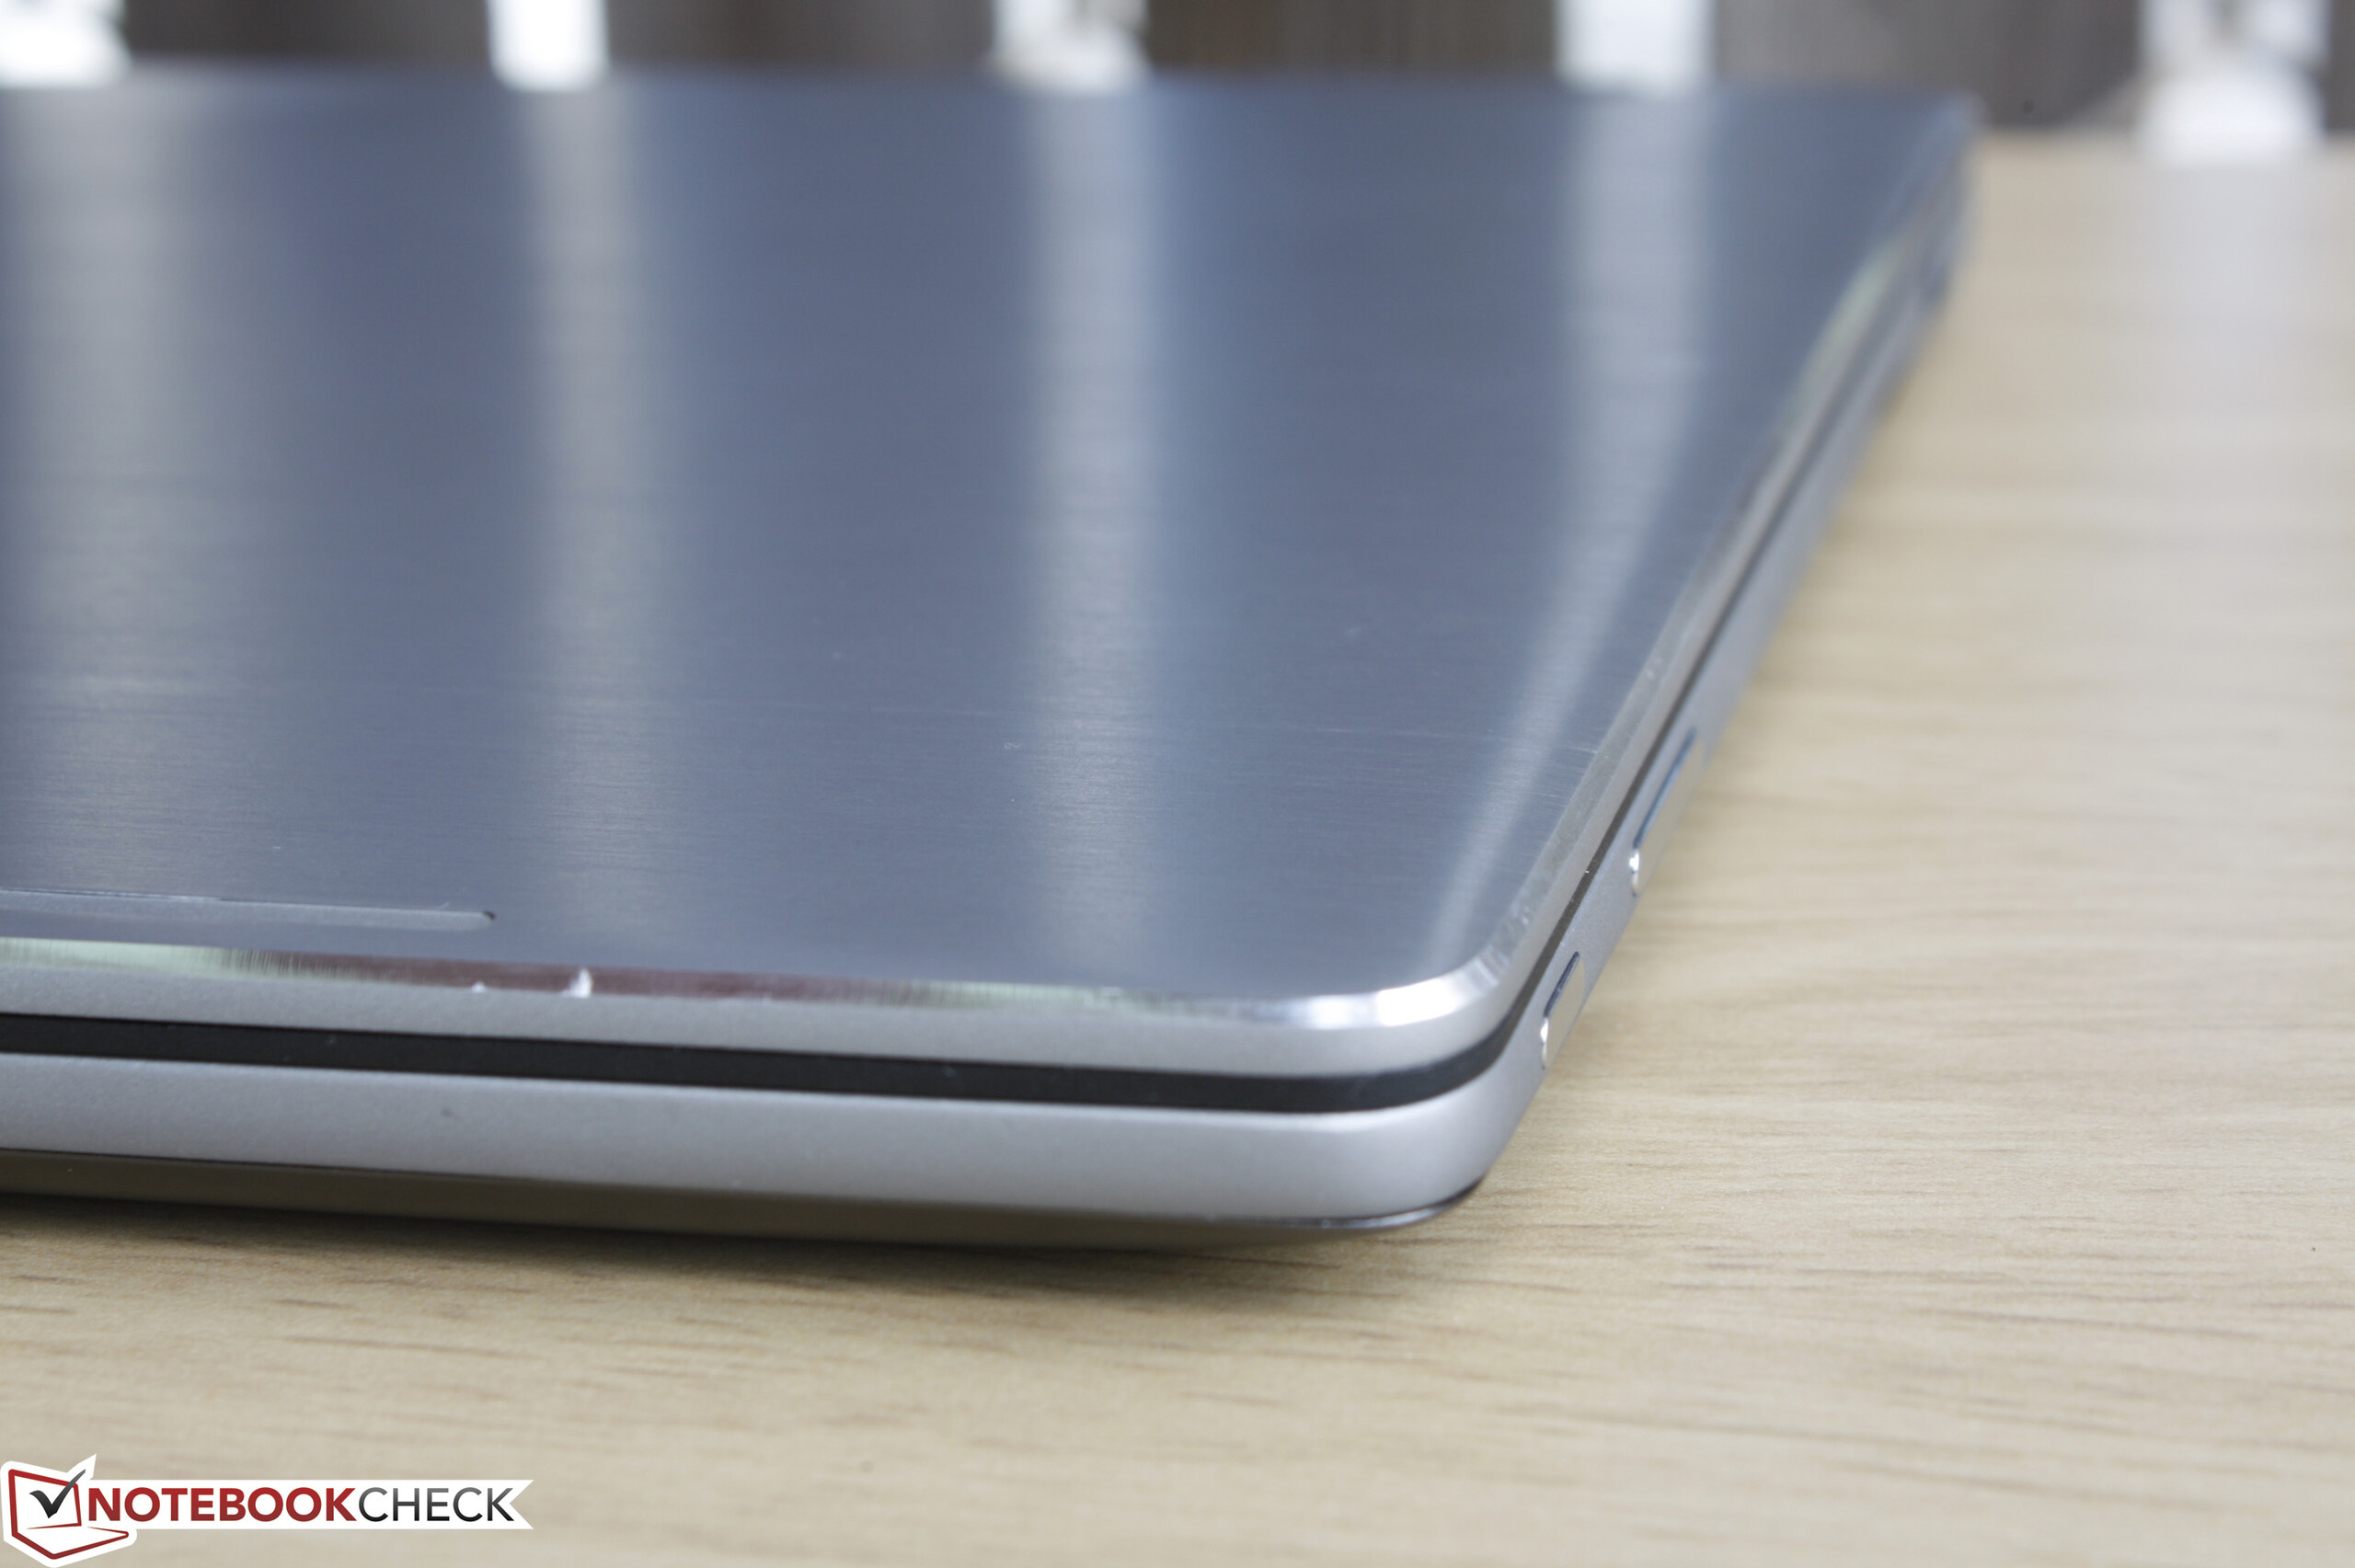
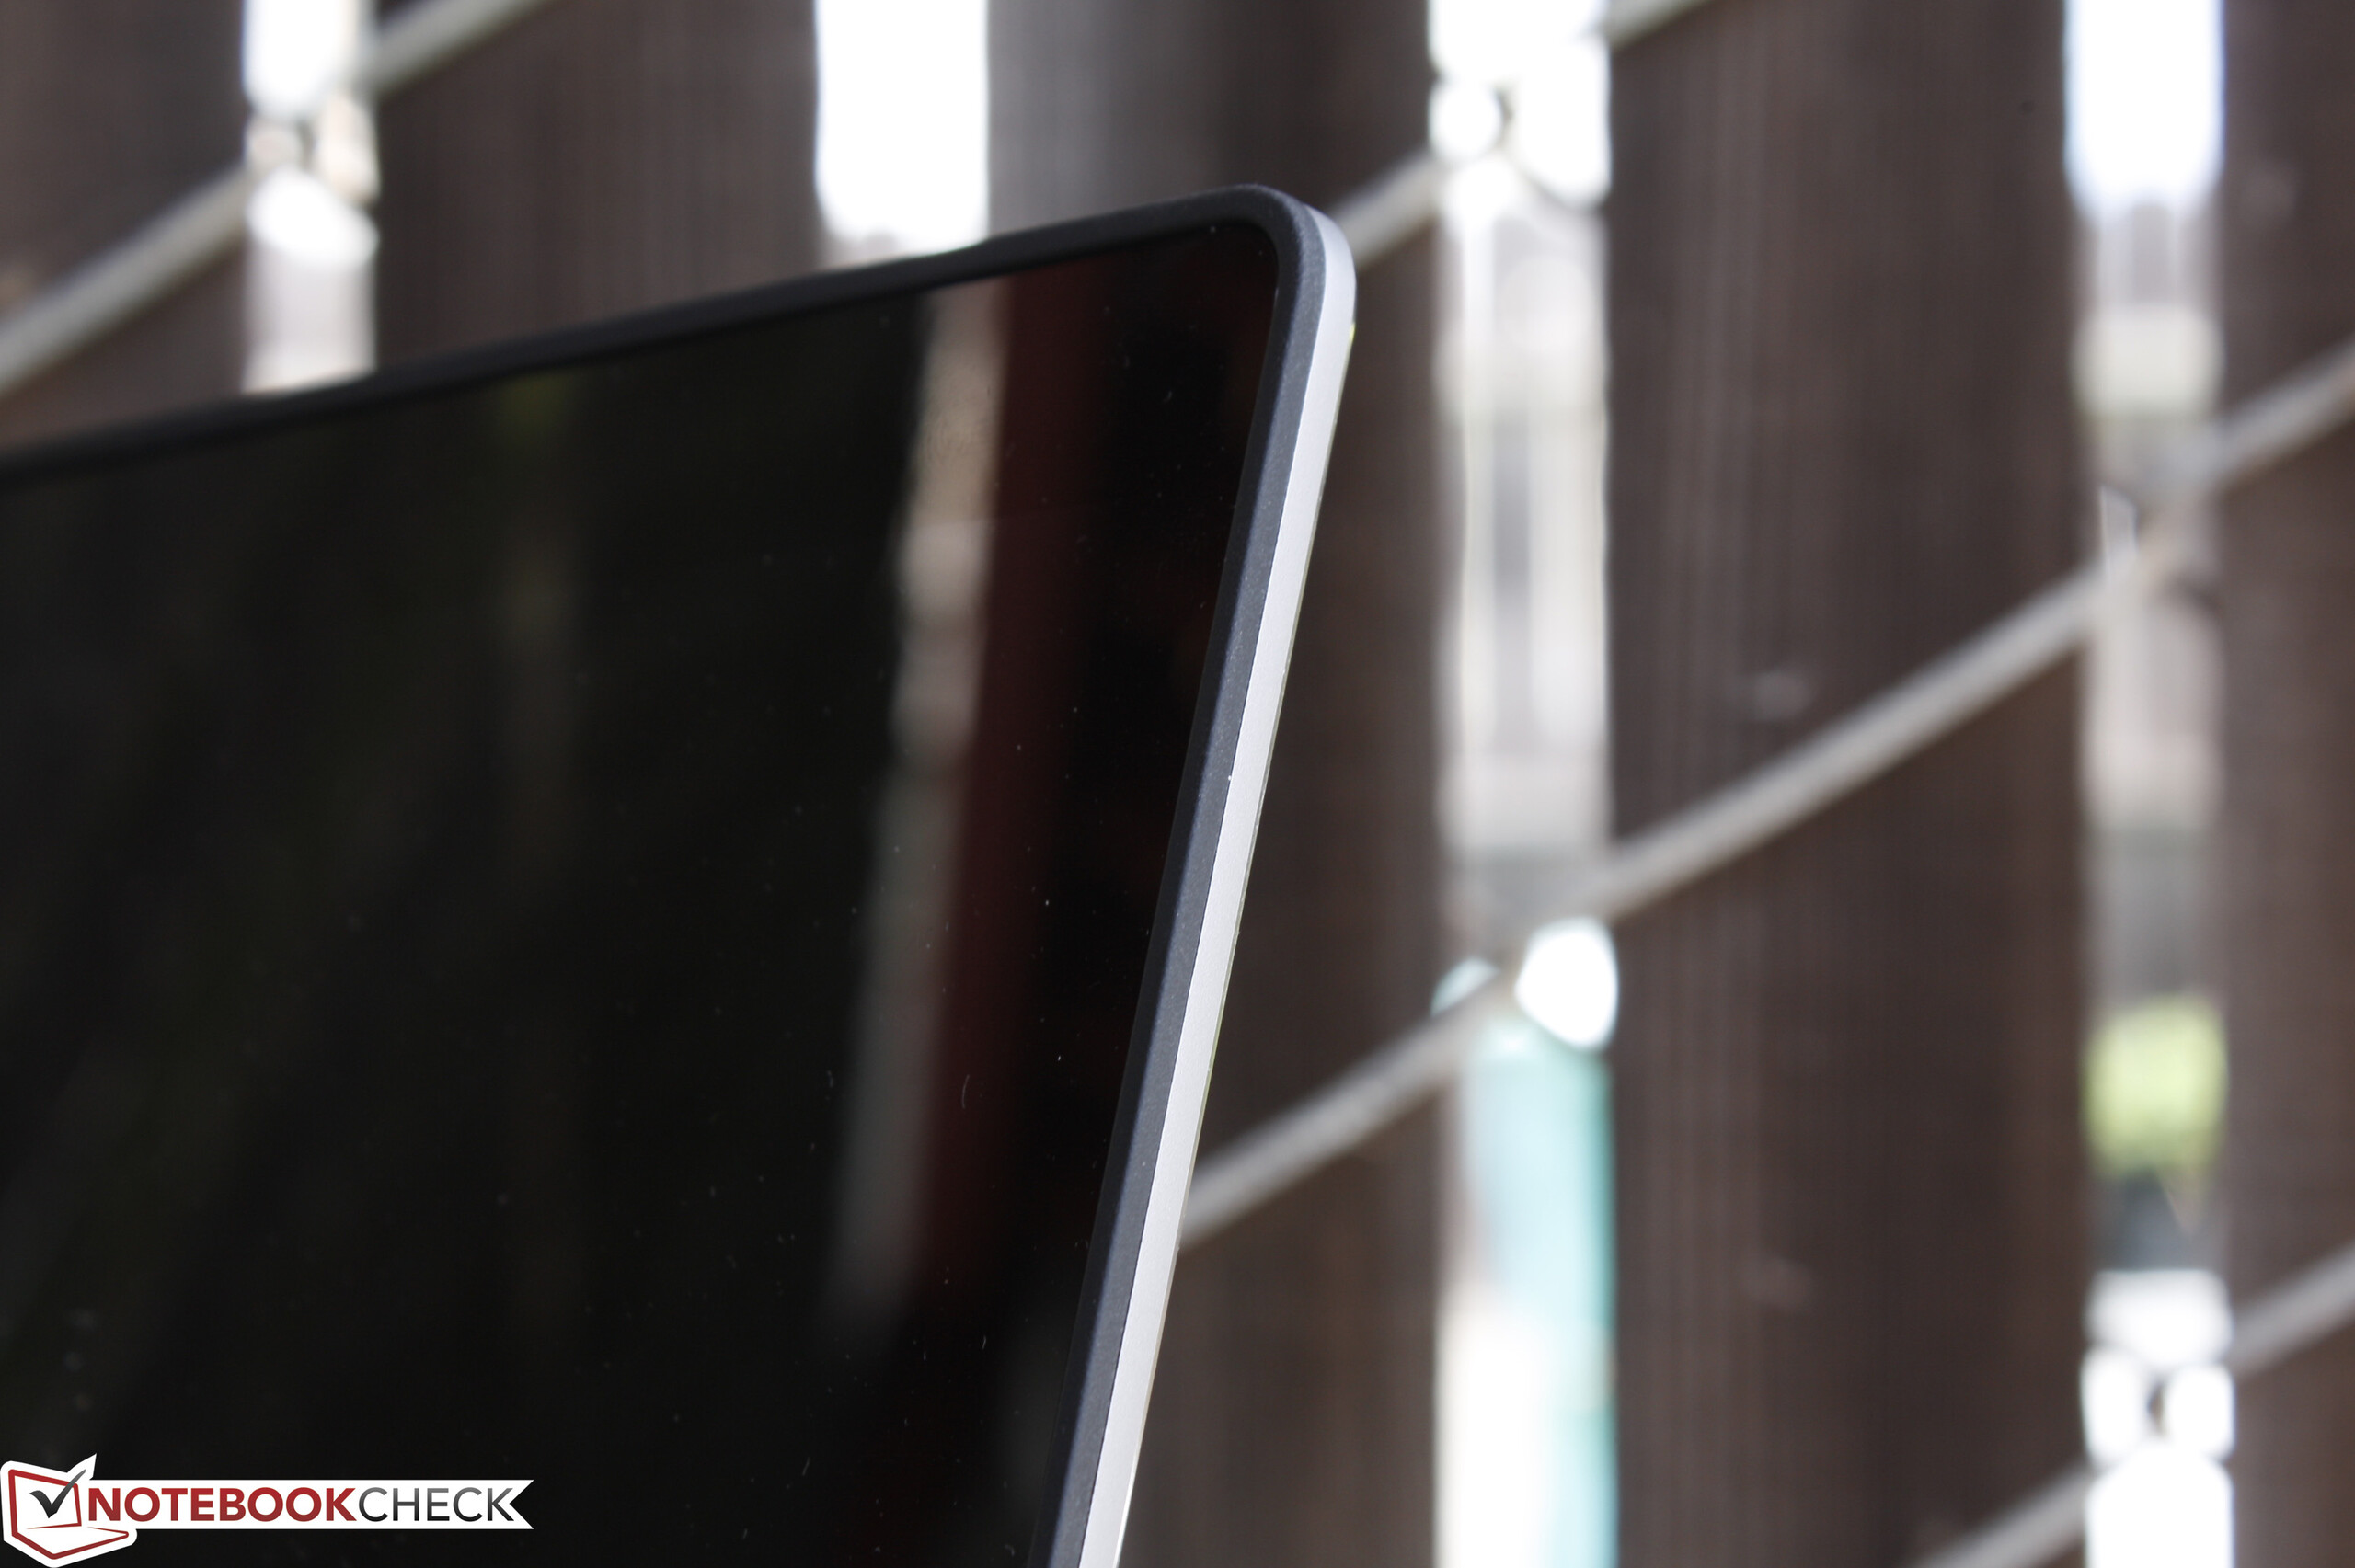
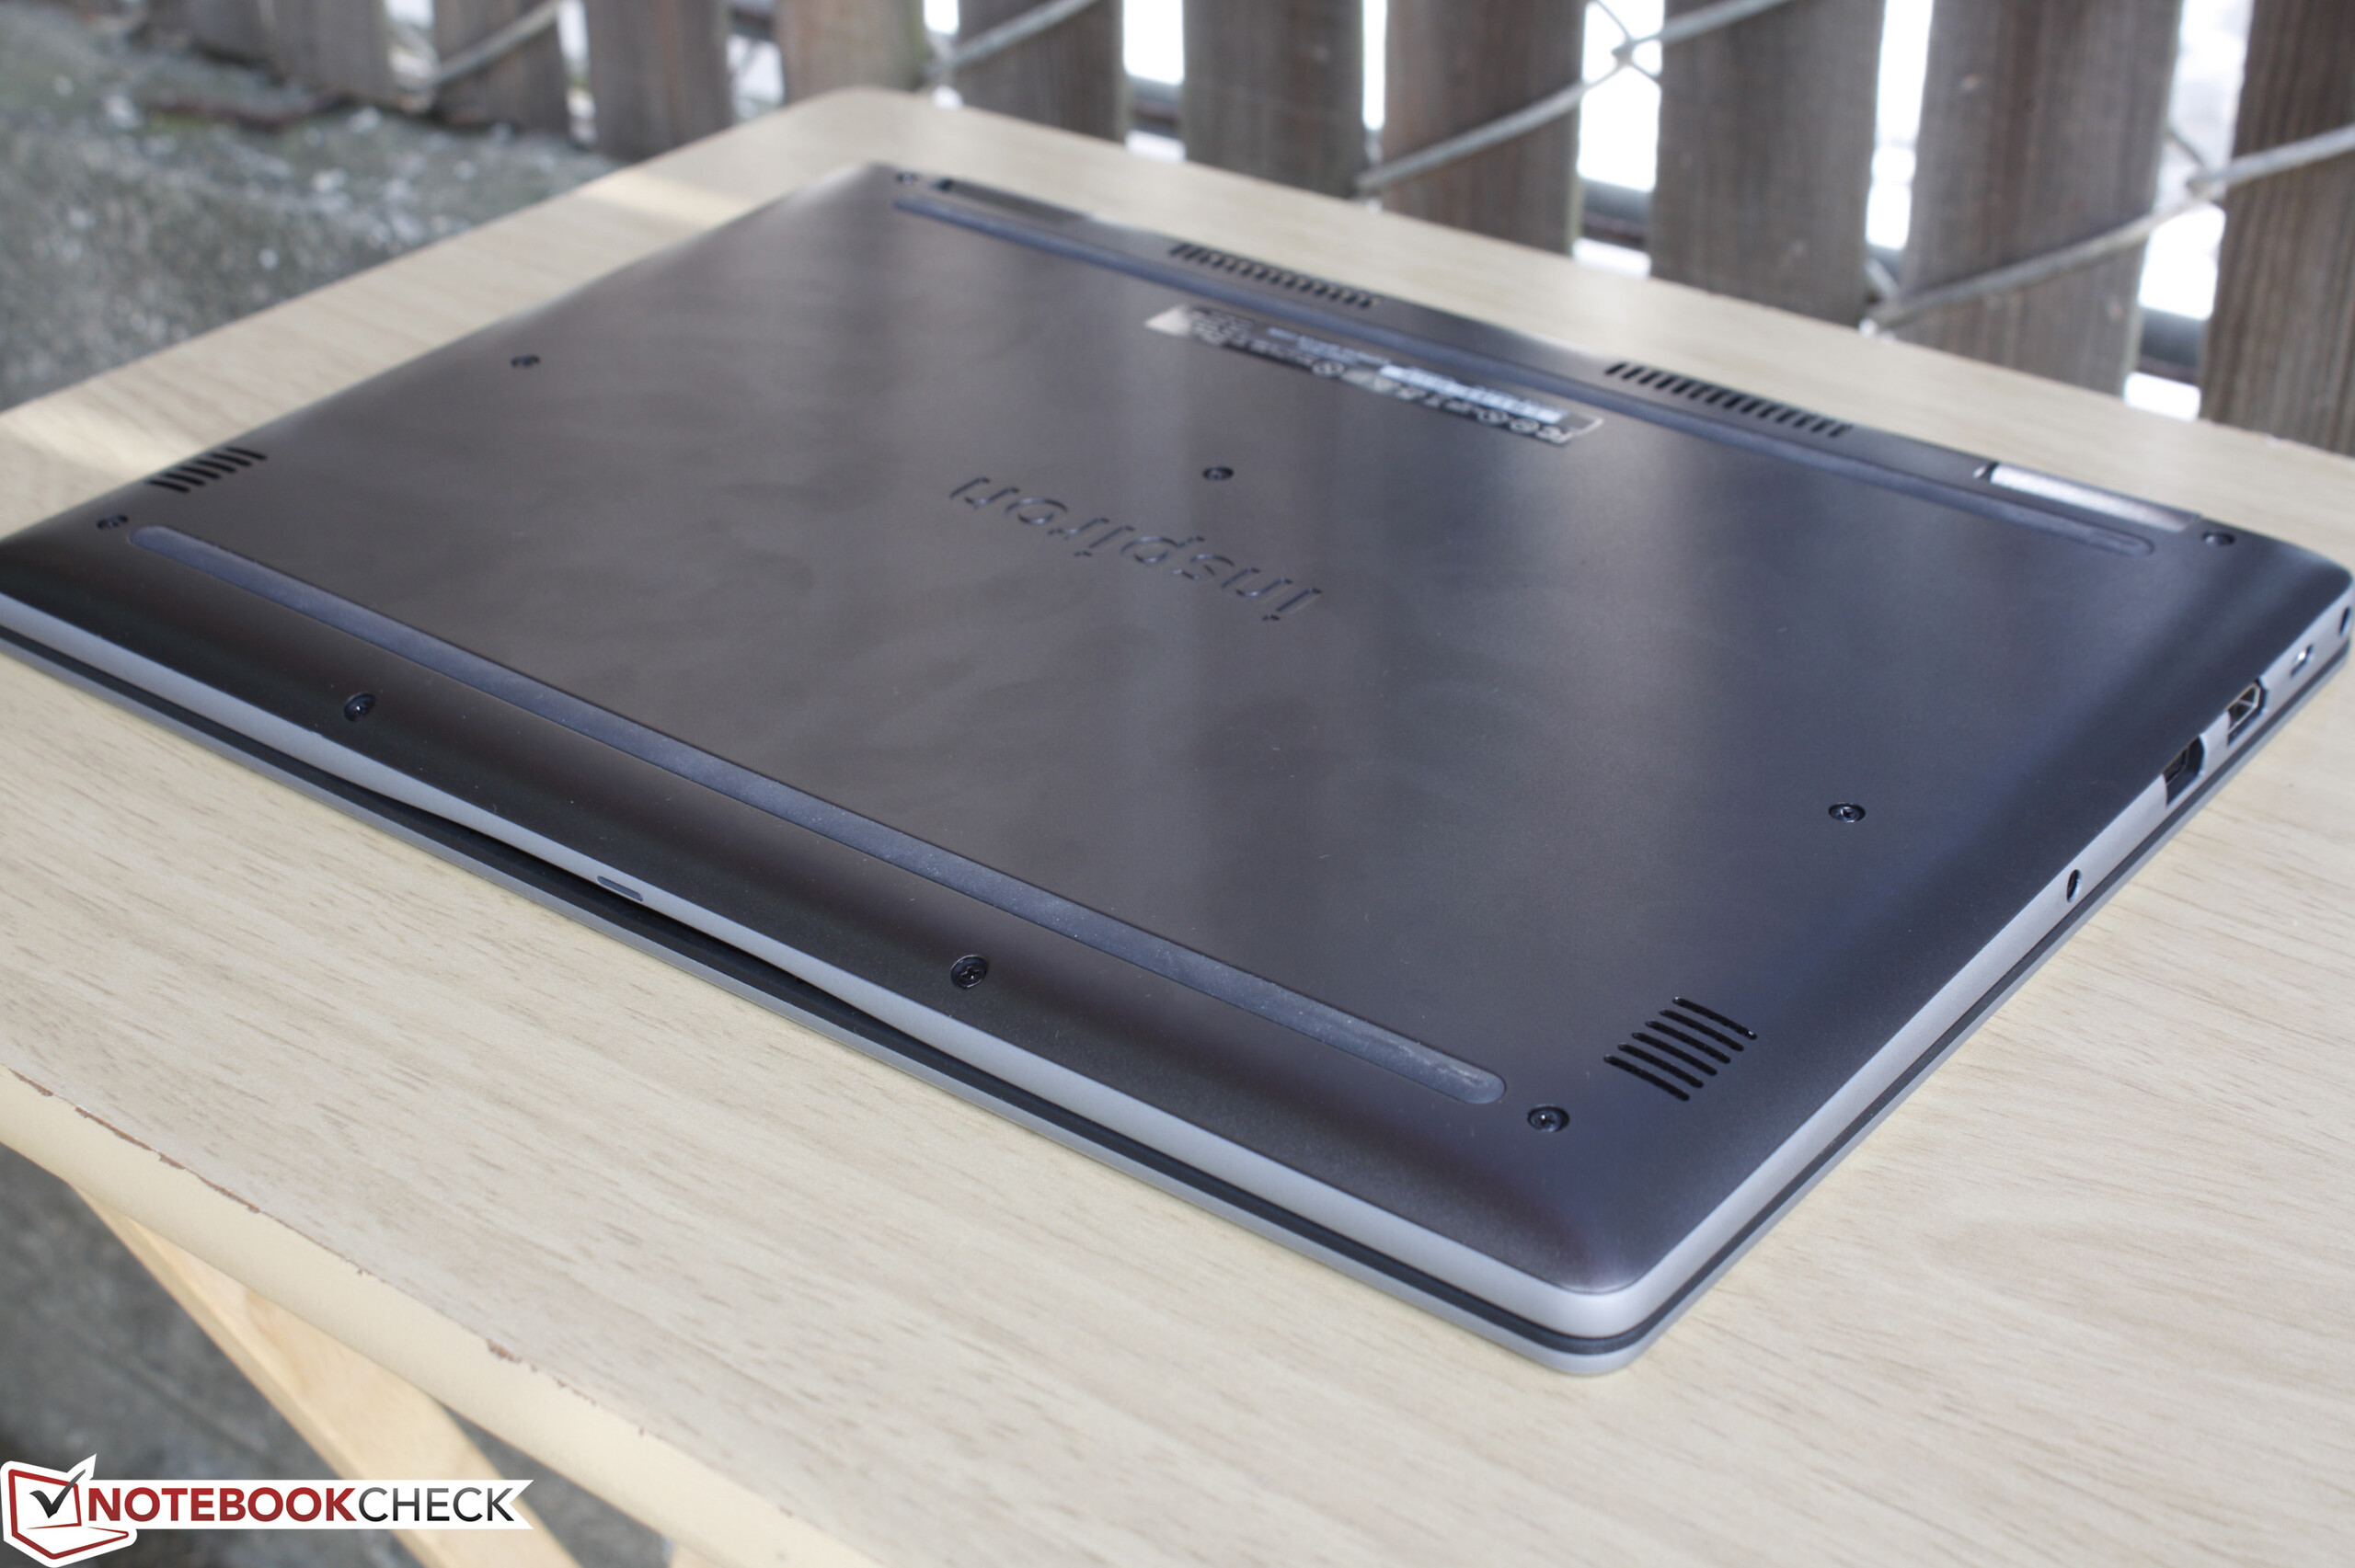
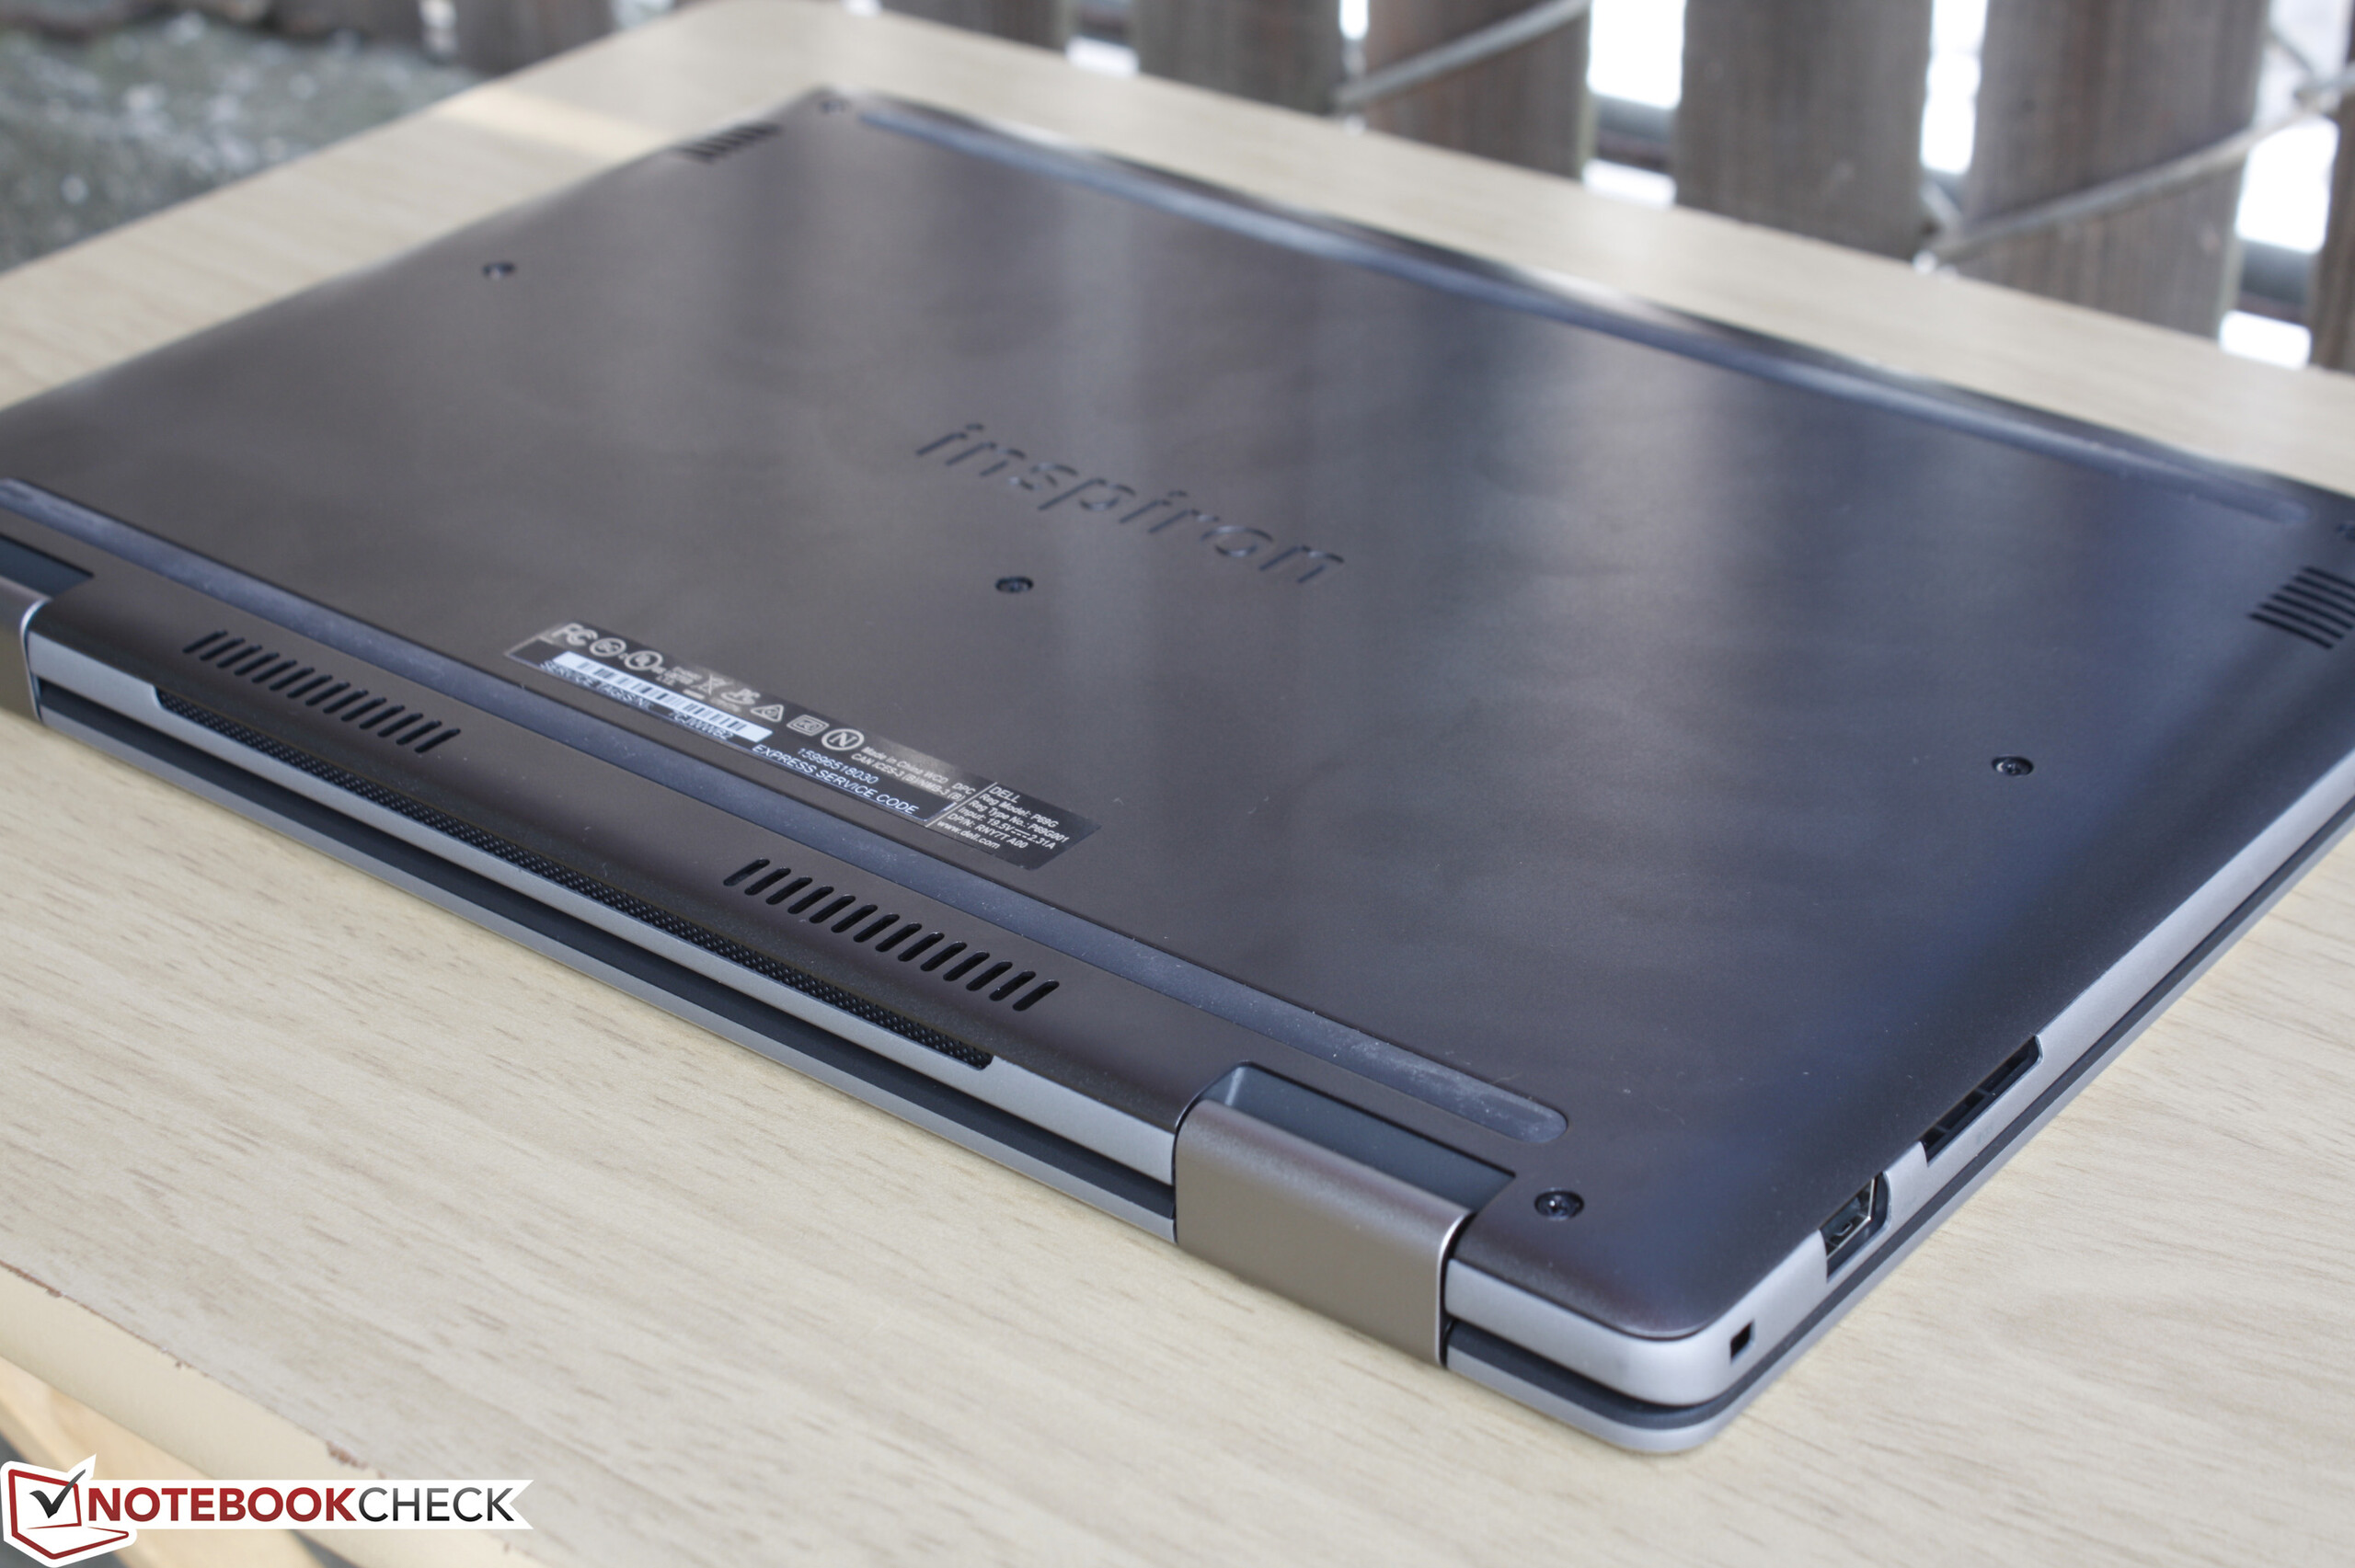
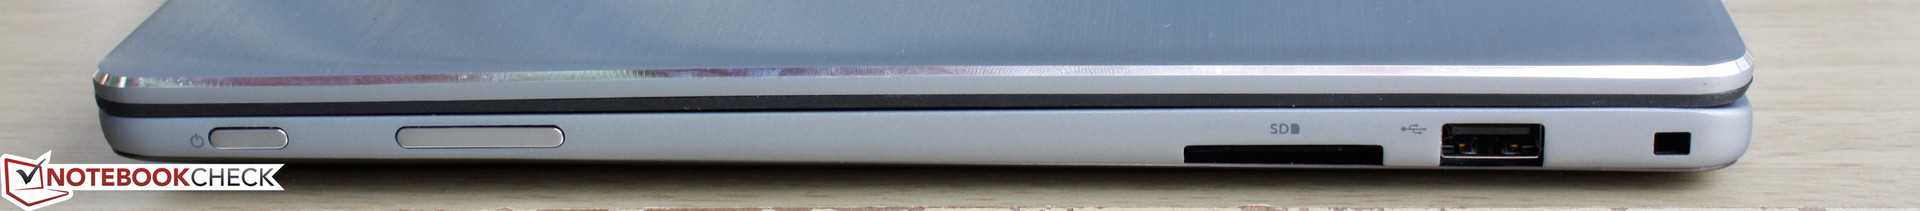
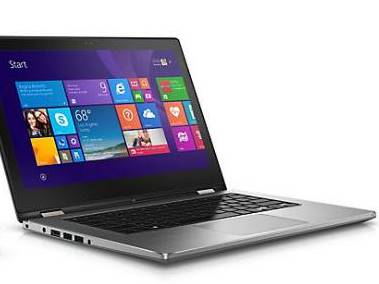
Inspiron 13 7368 är tystare och ser nättare ut än sin föregångare Inspiron 7348. Tyvärr är den fortfarande lite för tung och bildskärmens ljusstyrka är lägre än den gamla modellen, så funktionaliteten som surfplatta är i hög grad begränsad till inomhusbruk.
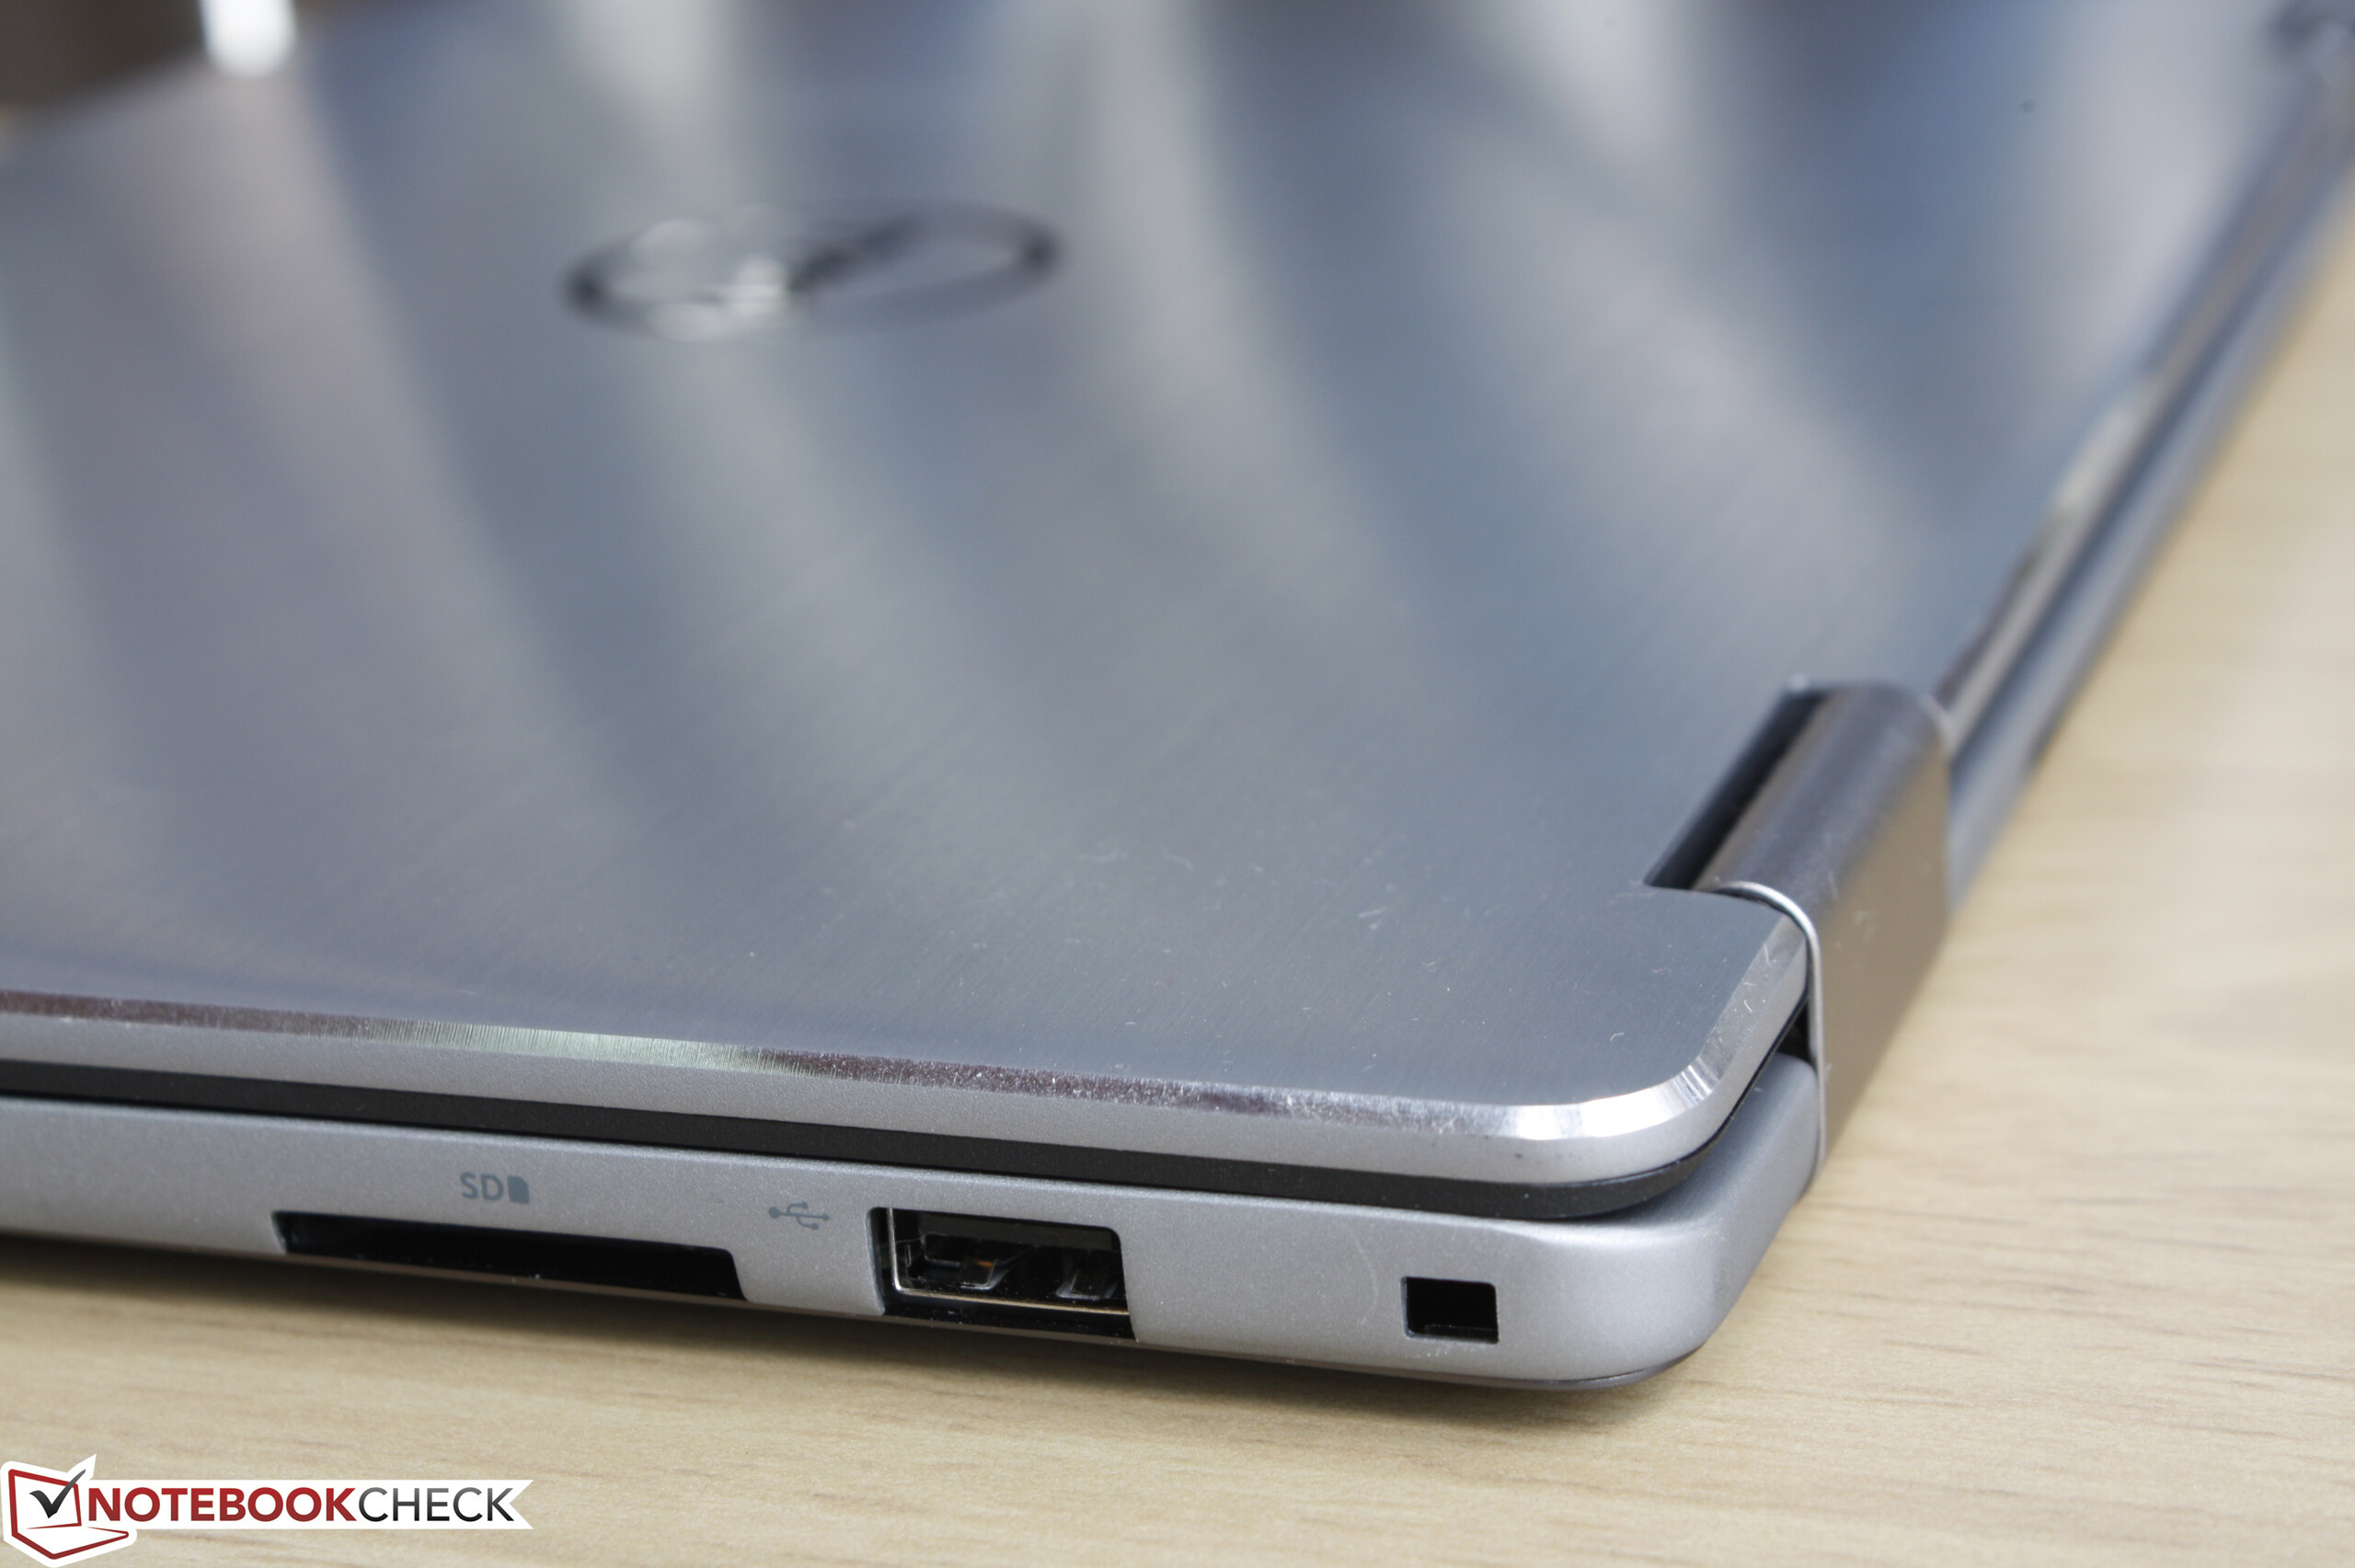
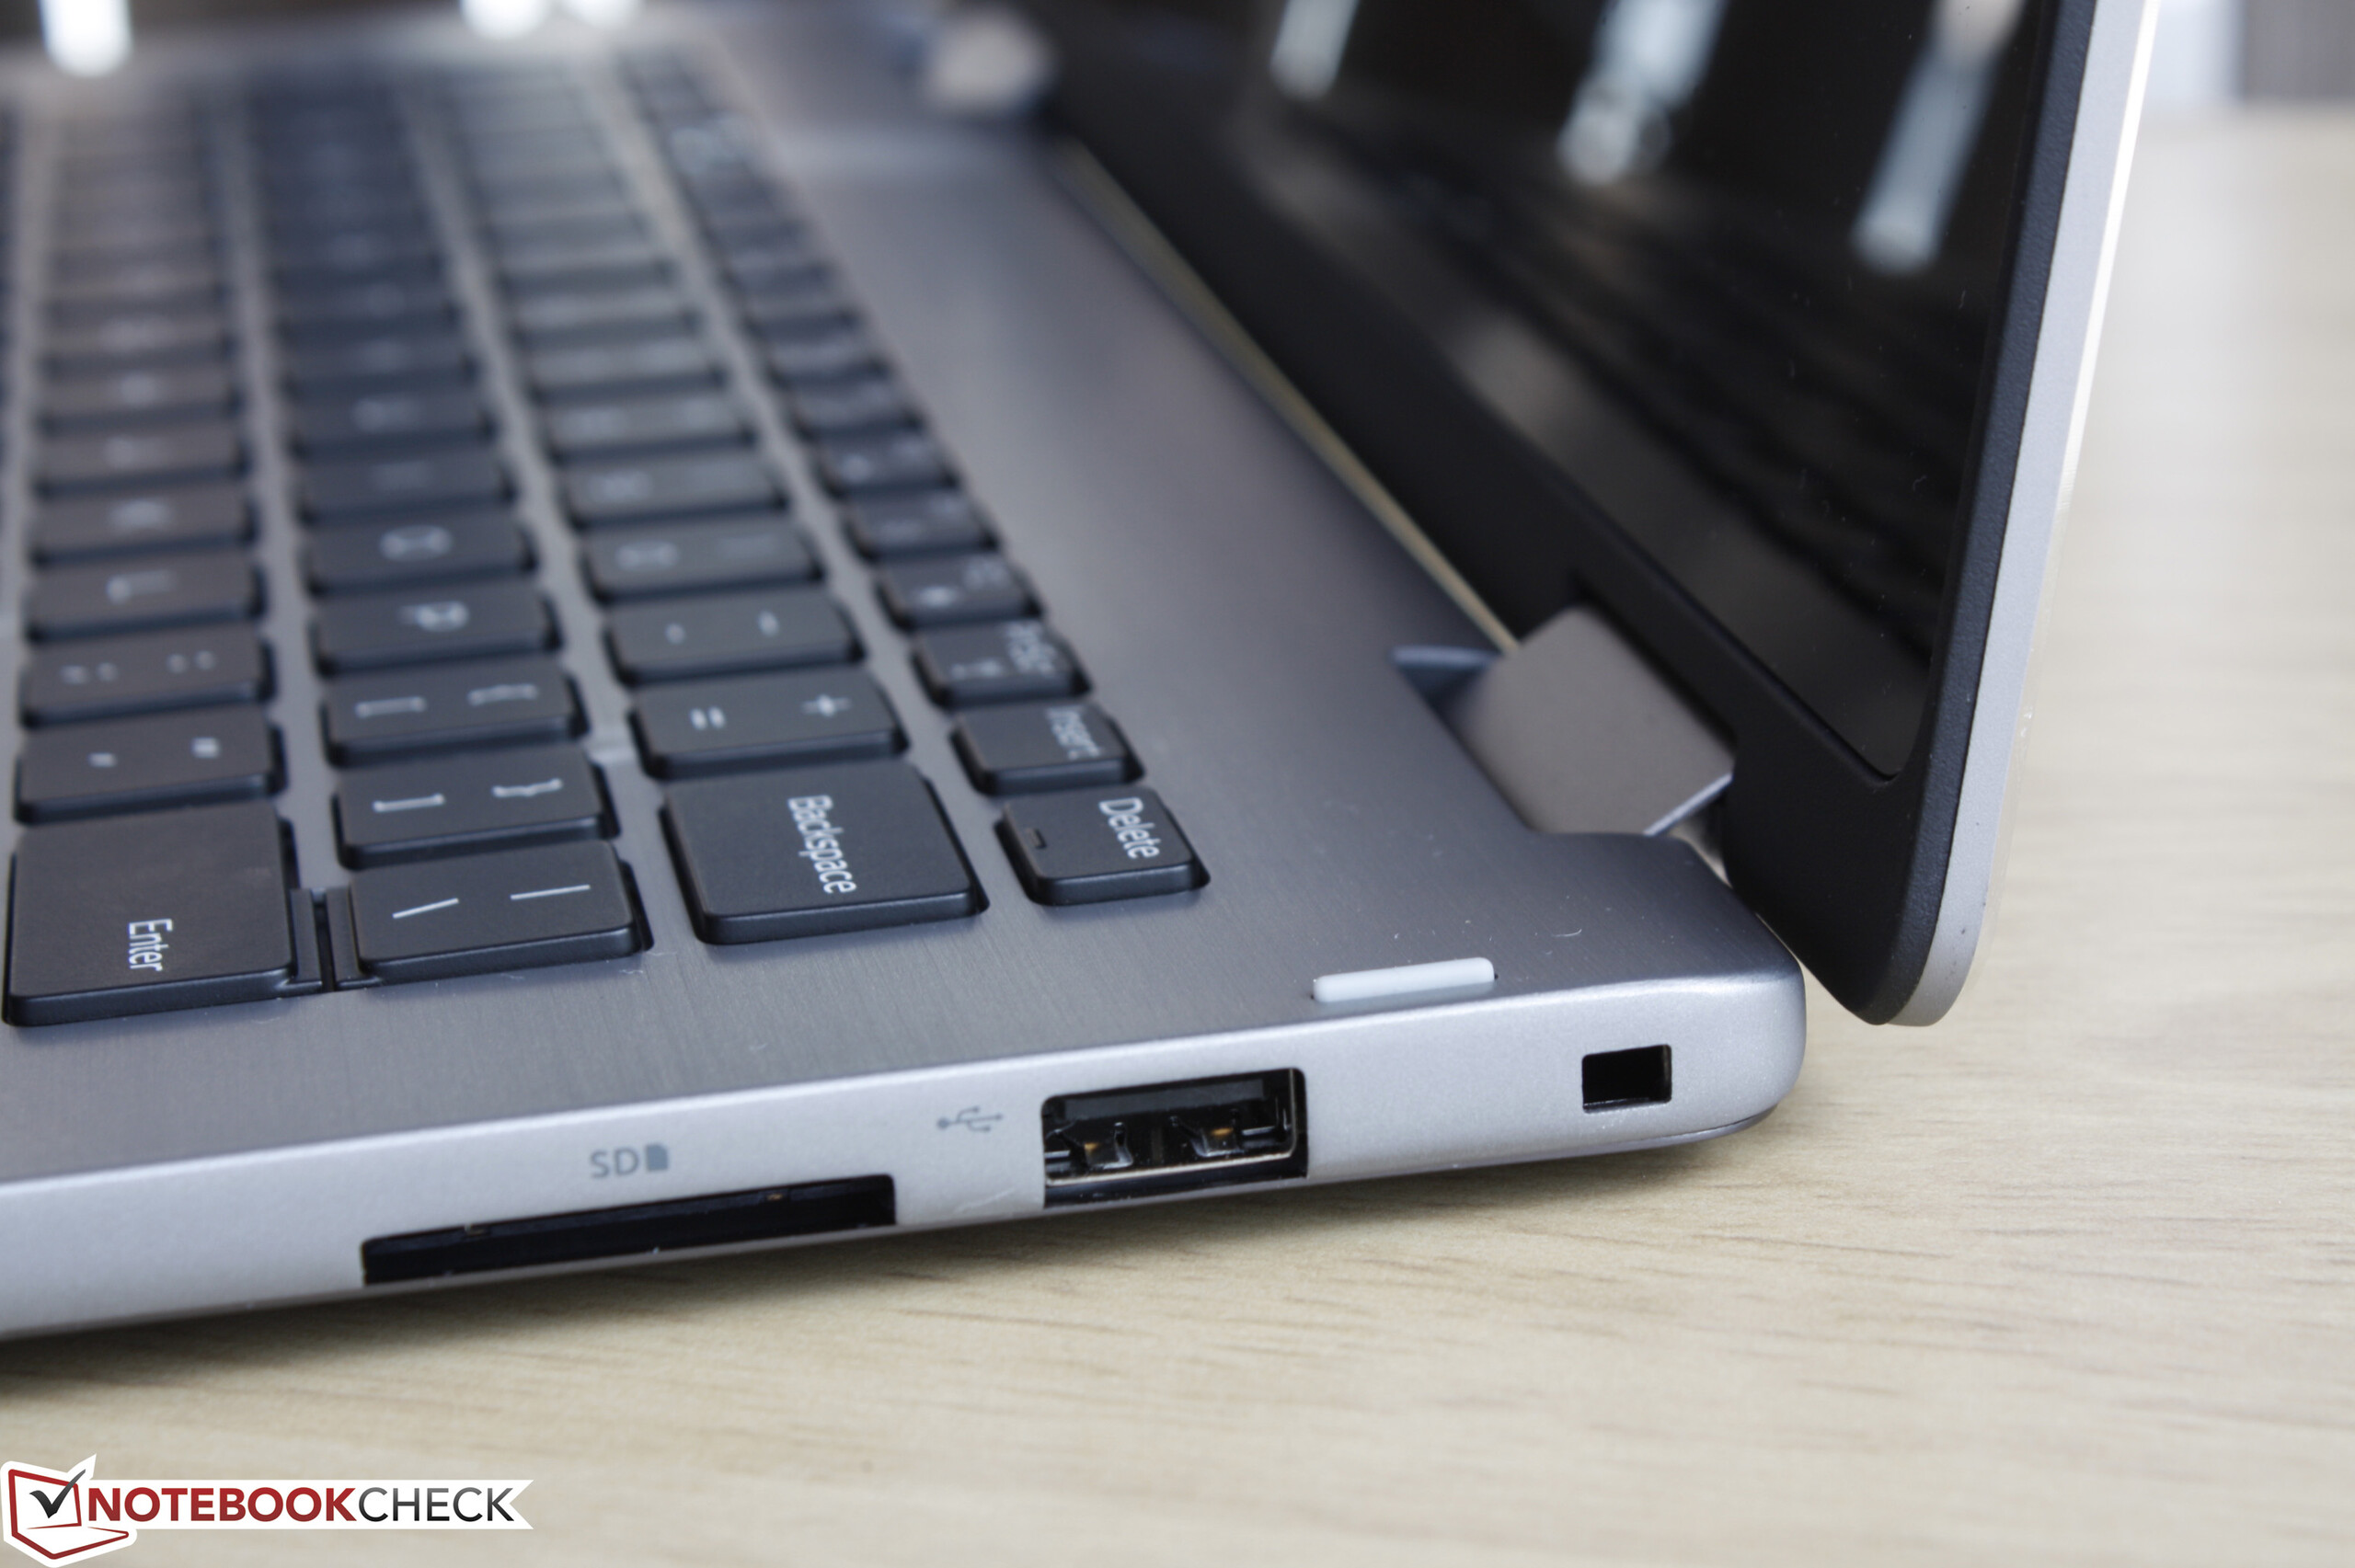
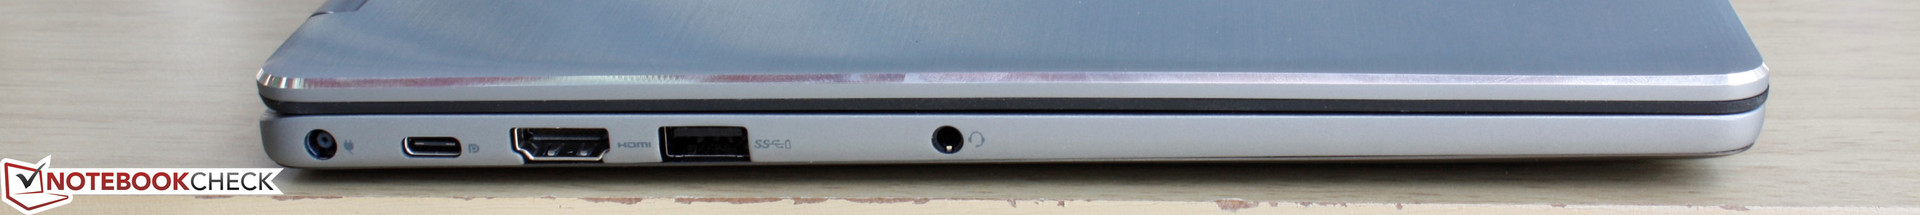
Tangenterna är mjuka och systemet har färre fullstora USB-portar än föregångaren. Vi tycker inte att de små konstruktionsändringarna och den tillagda USB Typ-C-porten är tillräckligt stora förbättringar för att den ska vara värd en rekommendation.
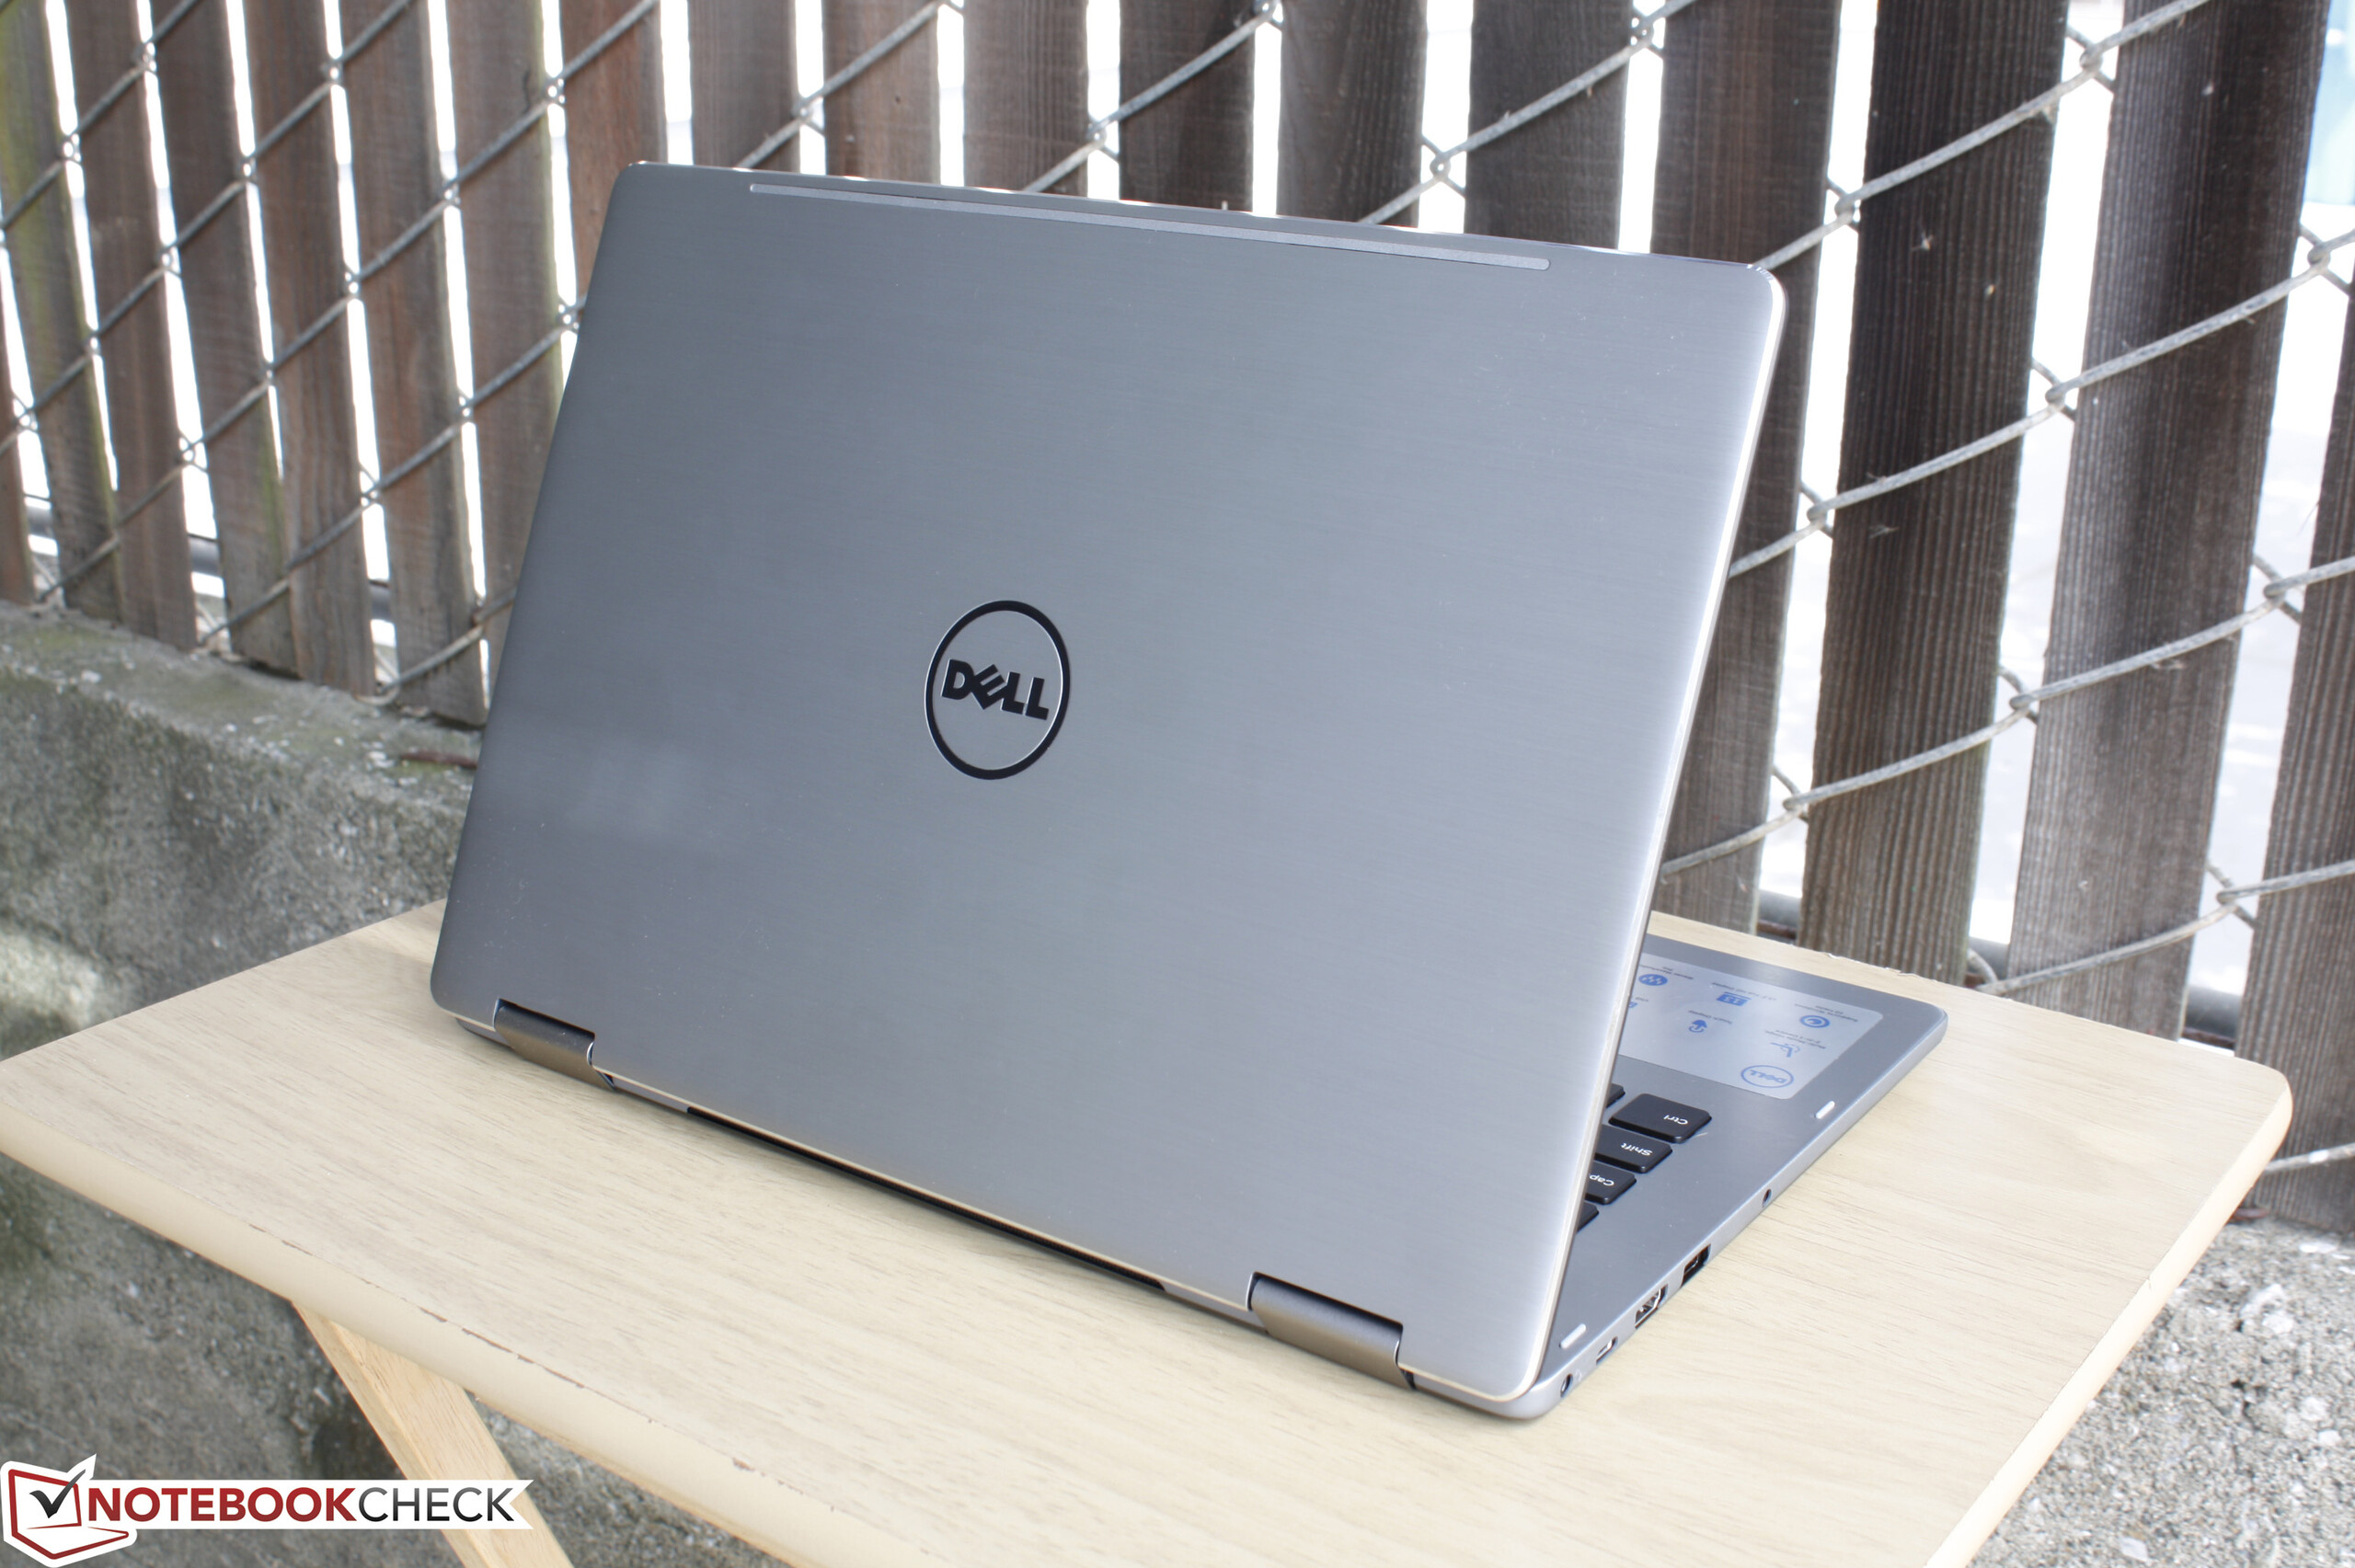
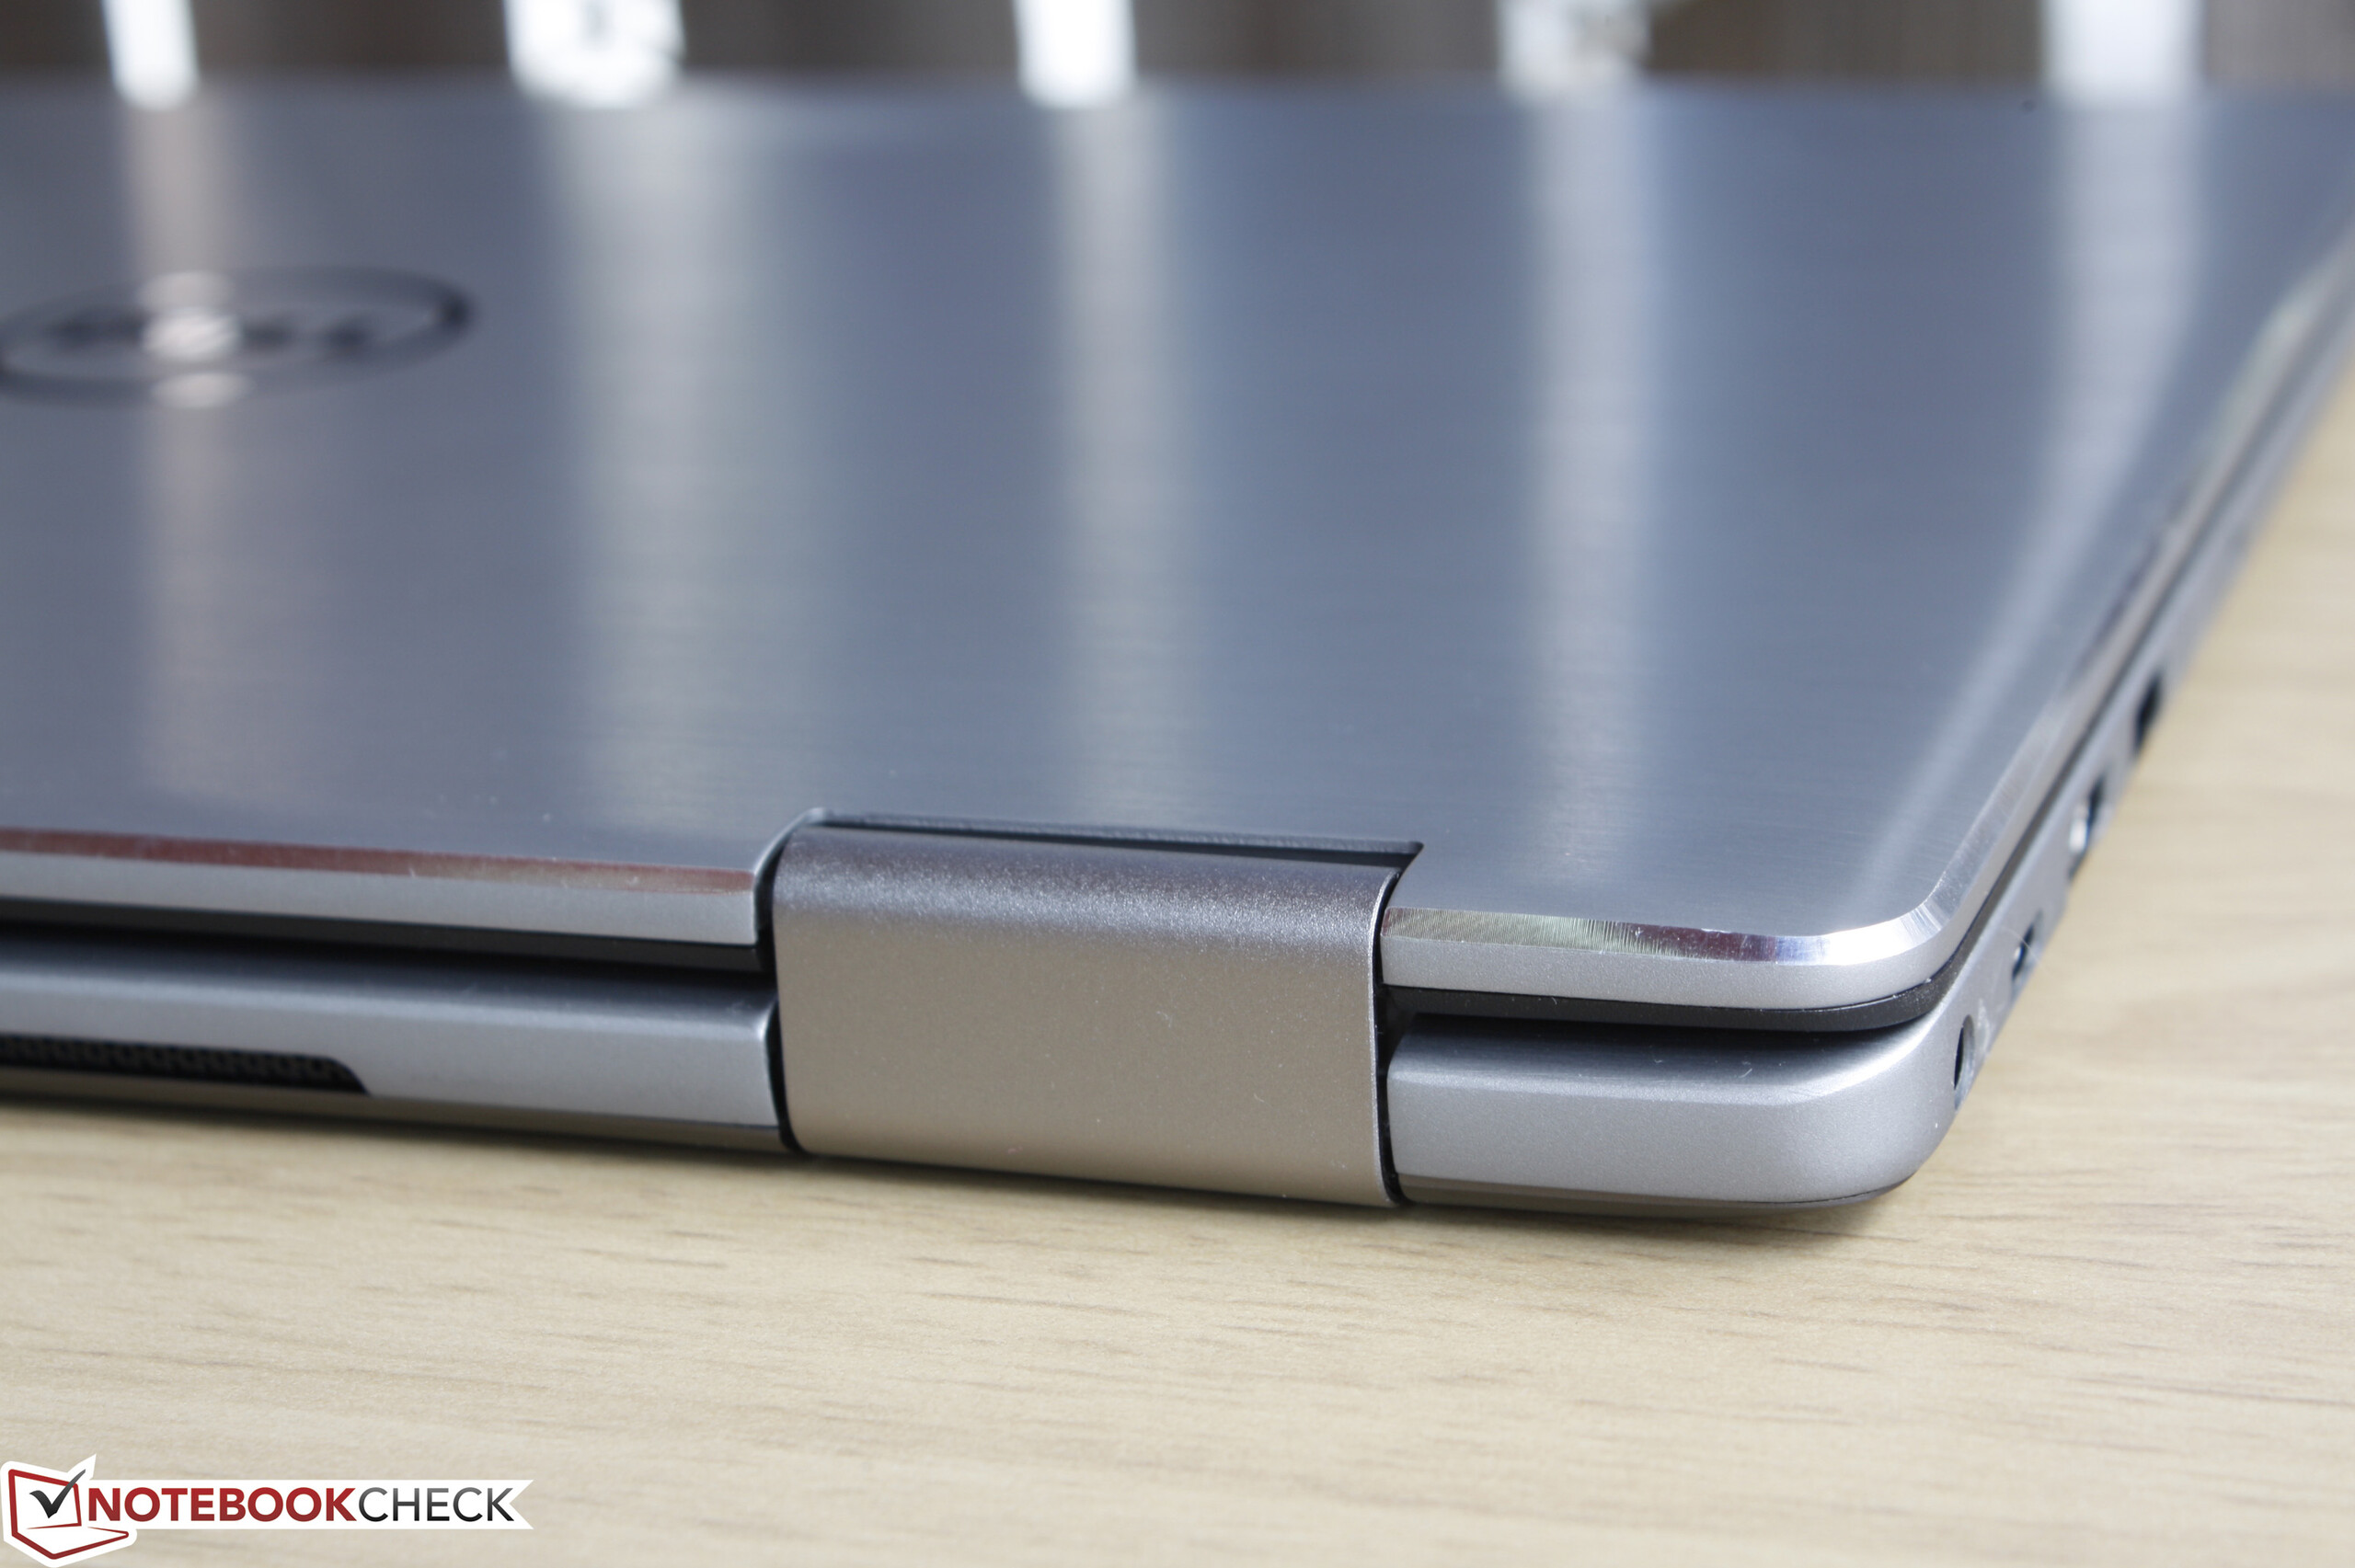
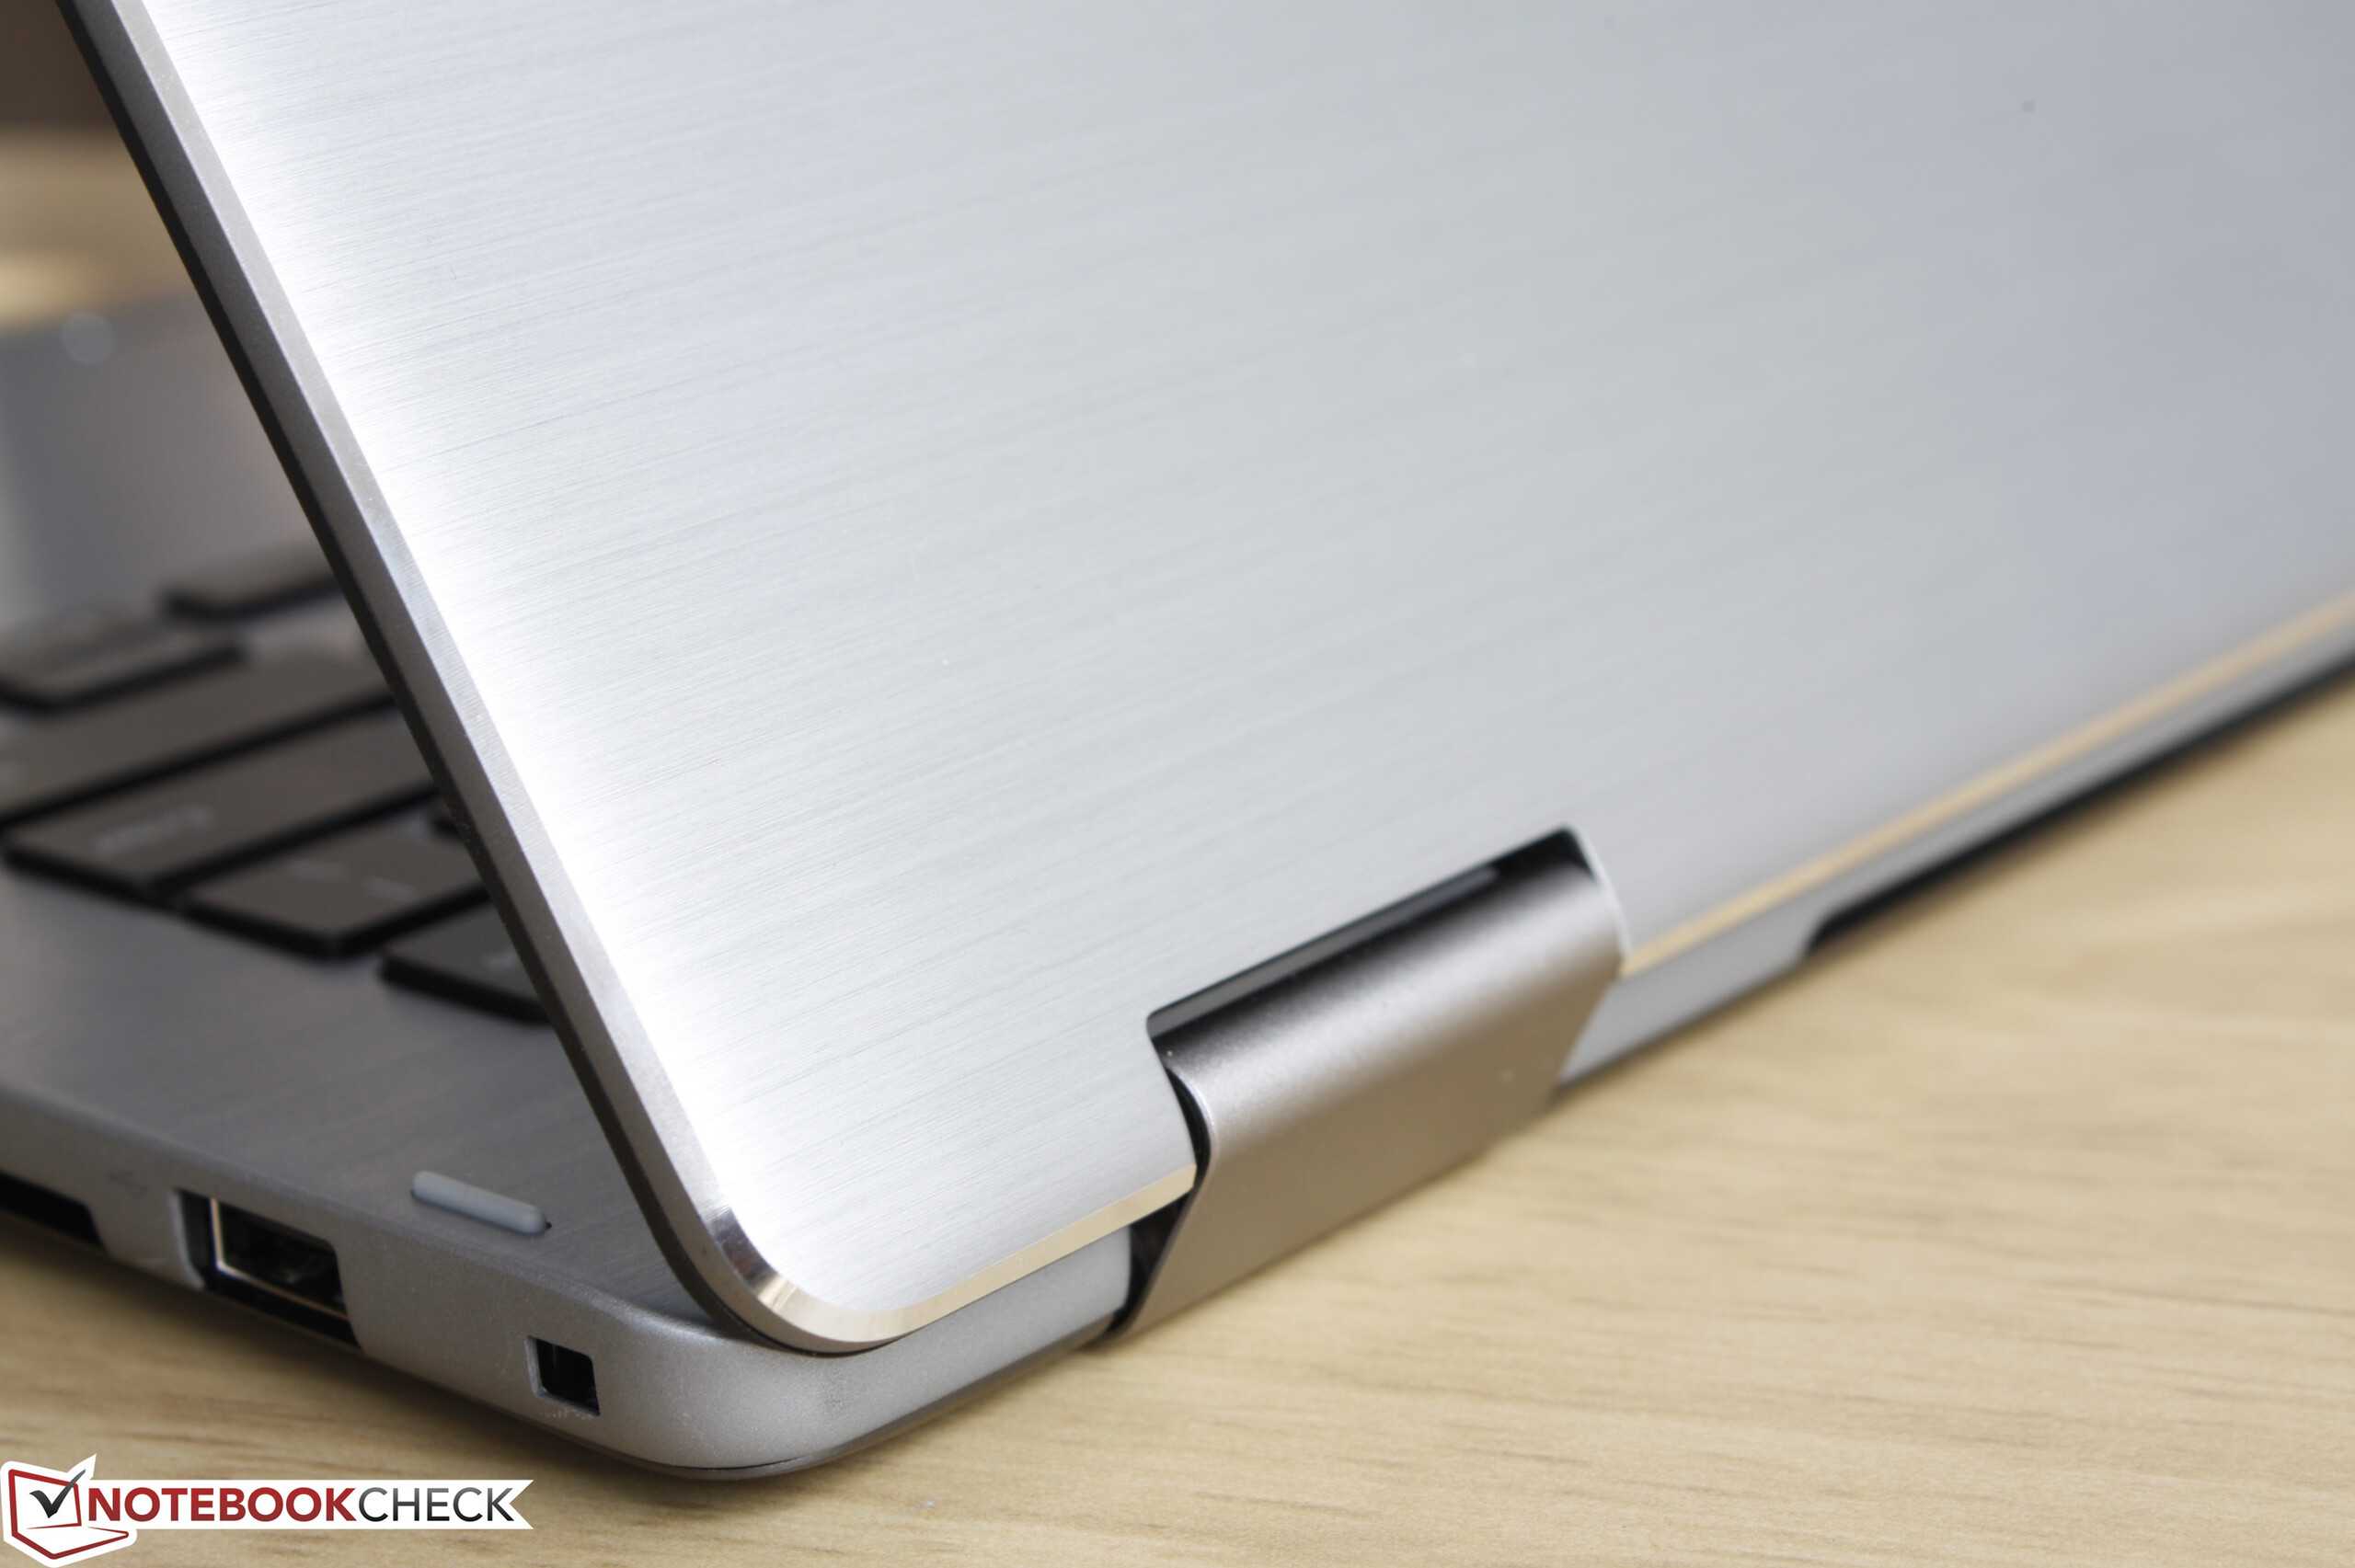
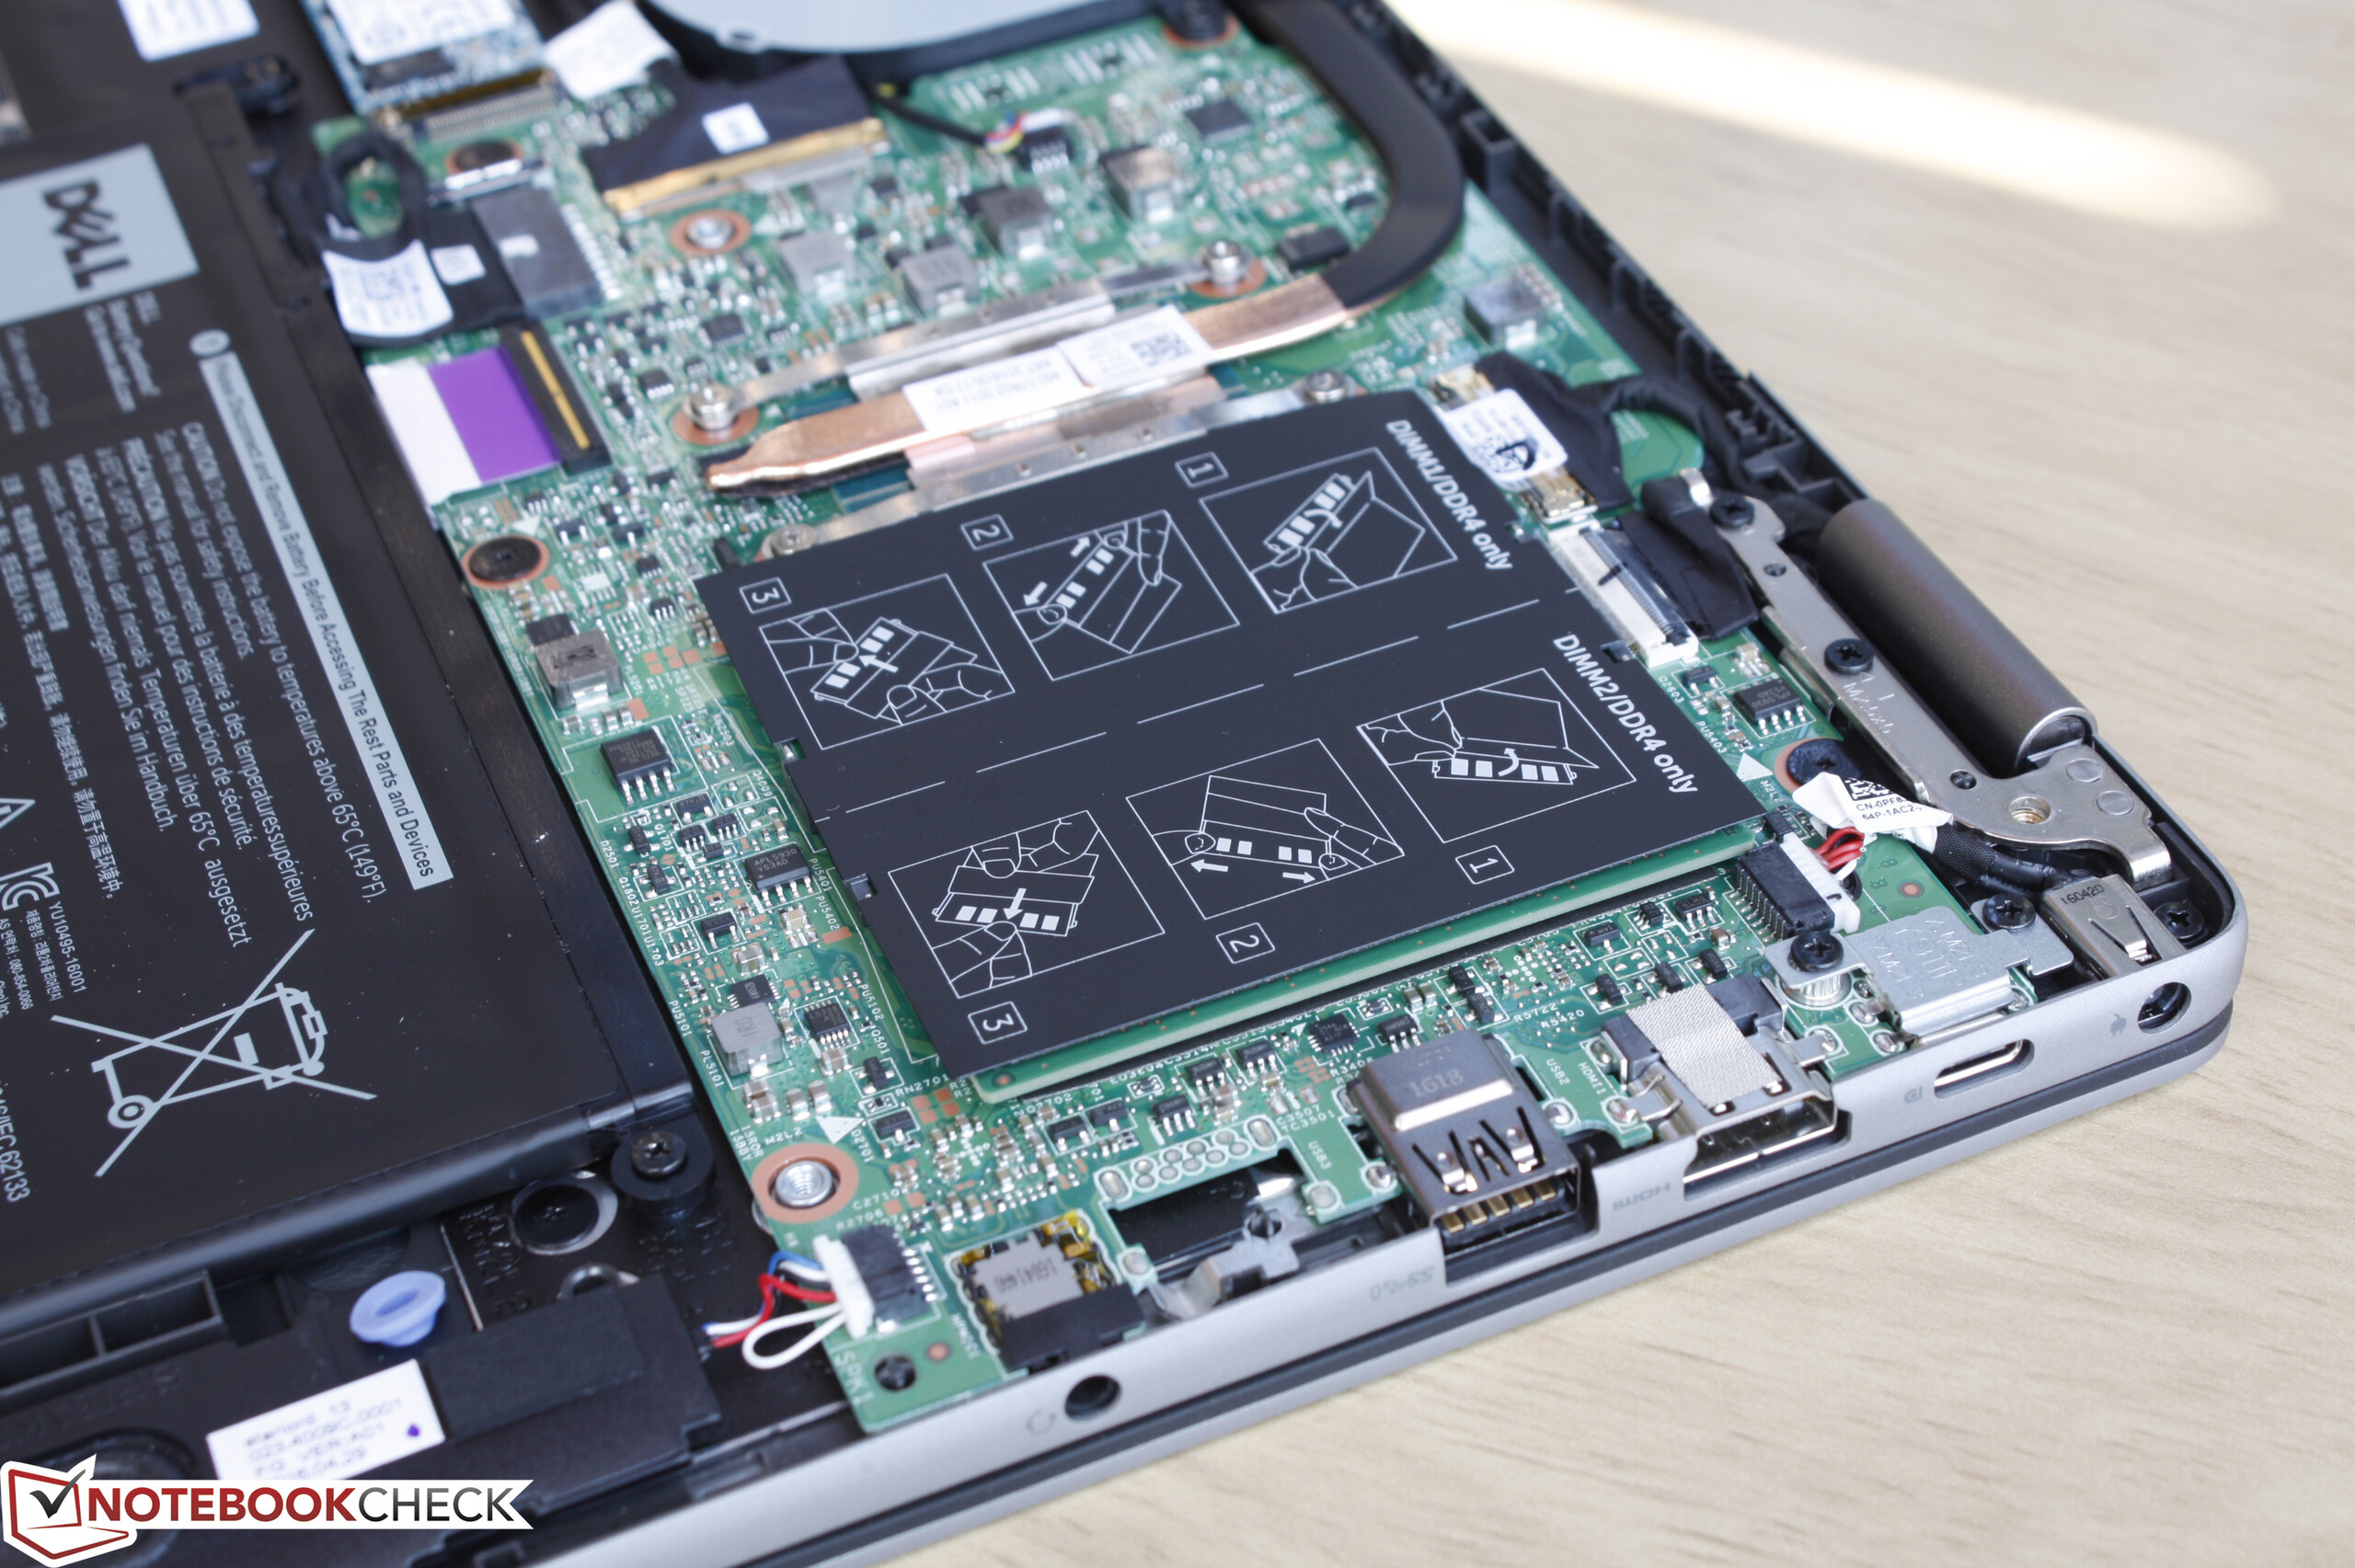
Nackdelarna till trots handlar det fortfarande om en hållbar och väldesignad 2-i-1 med enkla underhållsmöjligheter och bra högtalare. Den kan säkert ersätta en åldrande bärbar dator, men för användare som inte har något behov av surfplatte-läge är t.ex. XPS 13 ljusår bättre i flera avseenden. Är man å andra sidan inställd på en 13-tums 2-i-1 finna det konkurrerande modell som både är lättare och mindre.
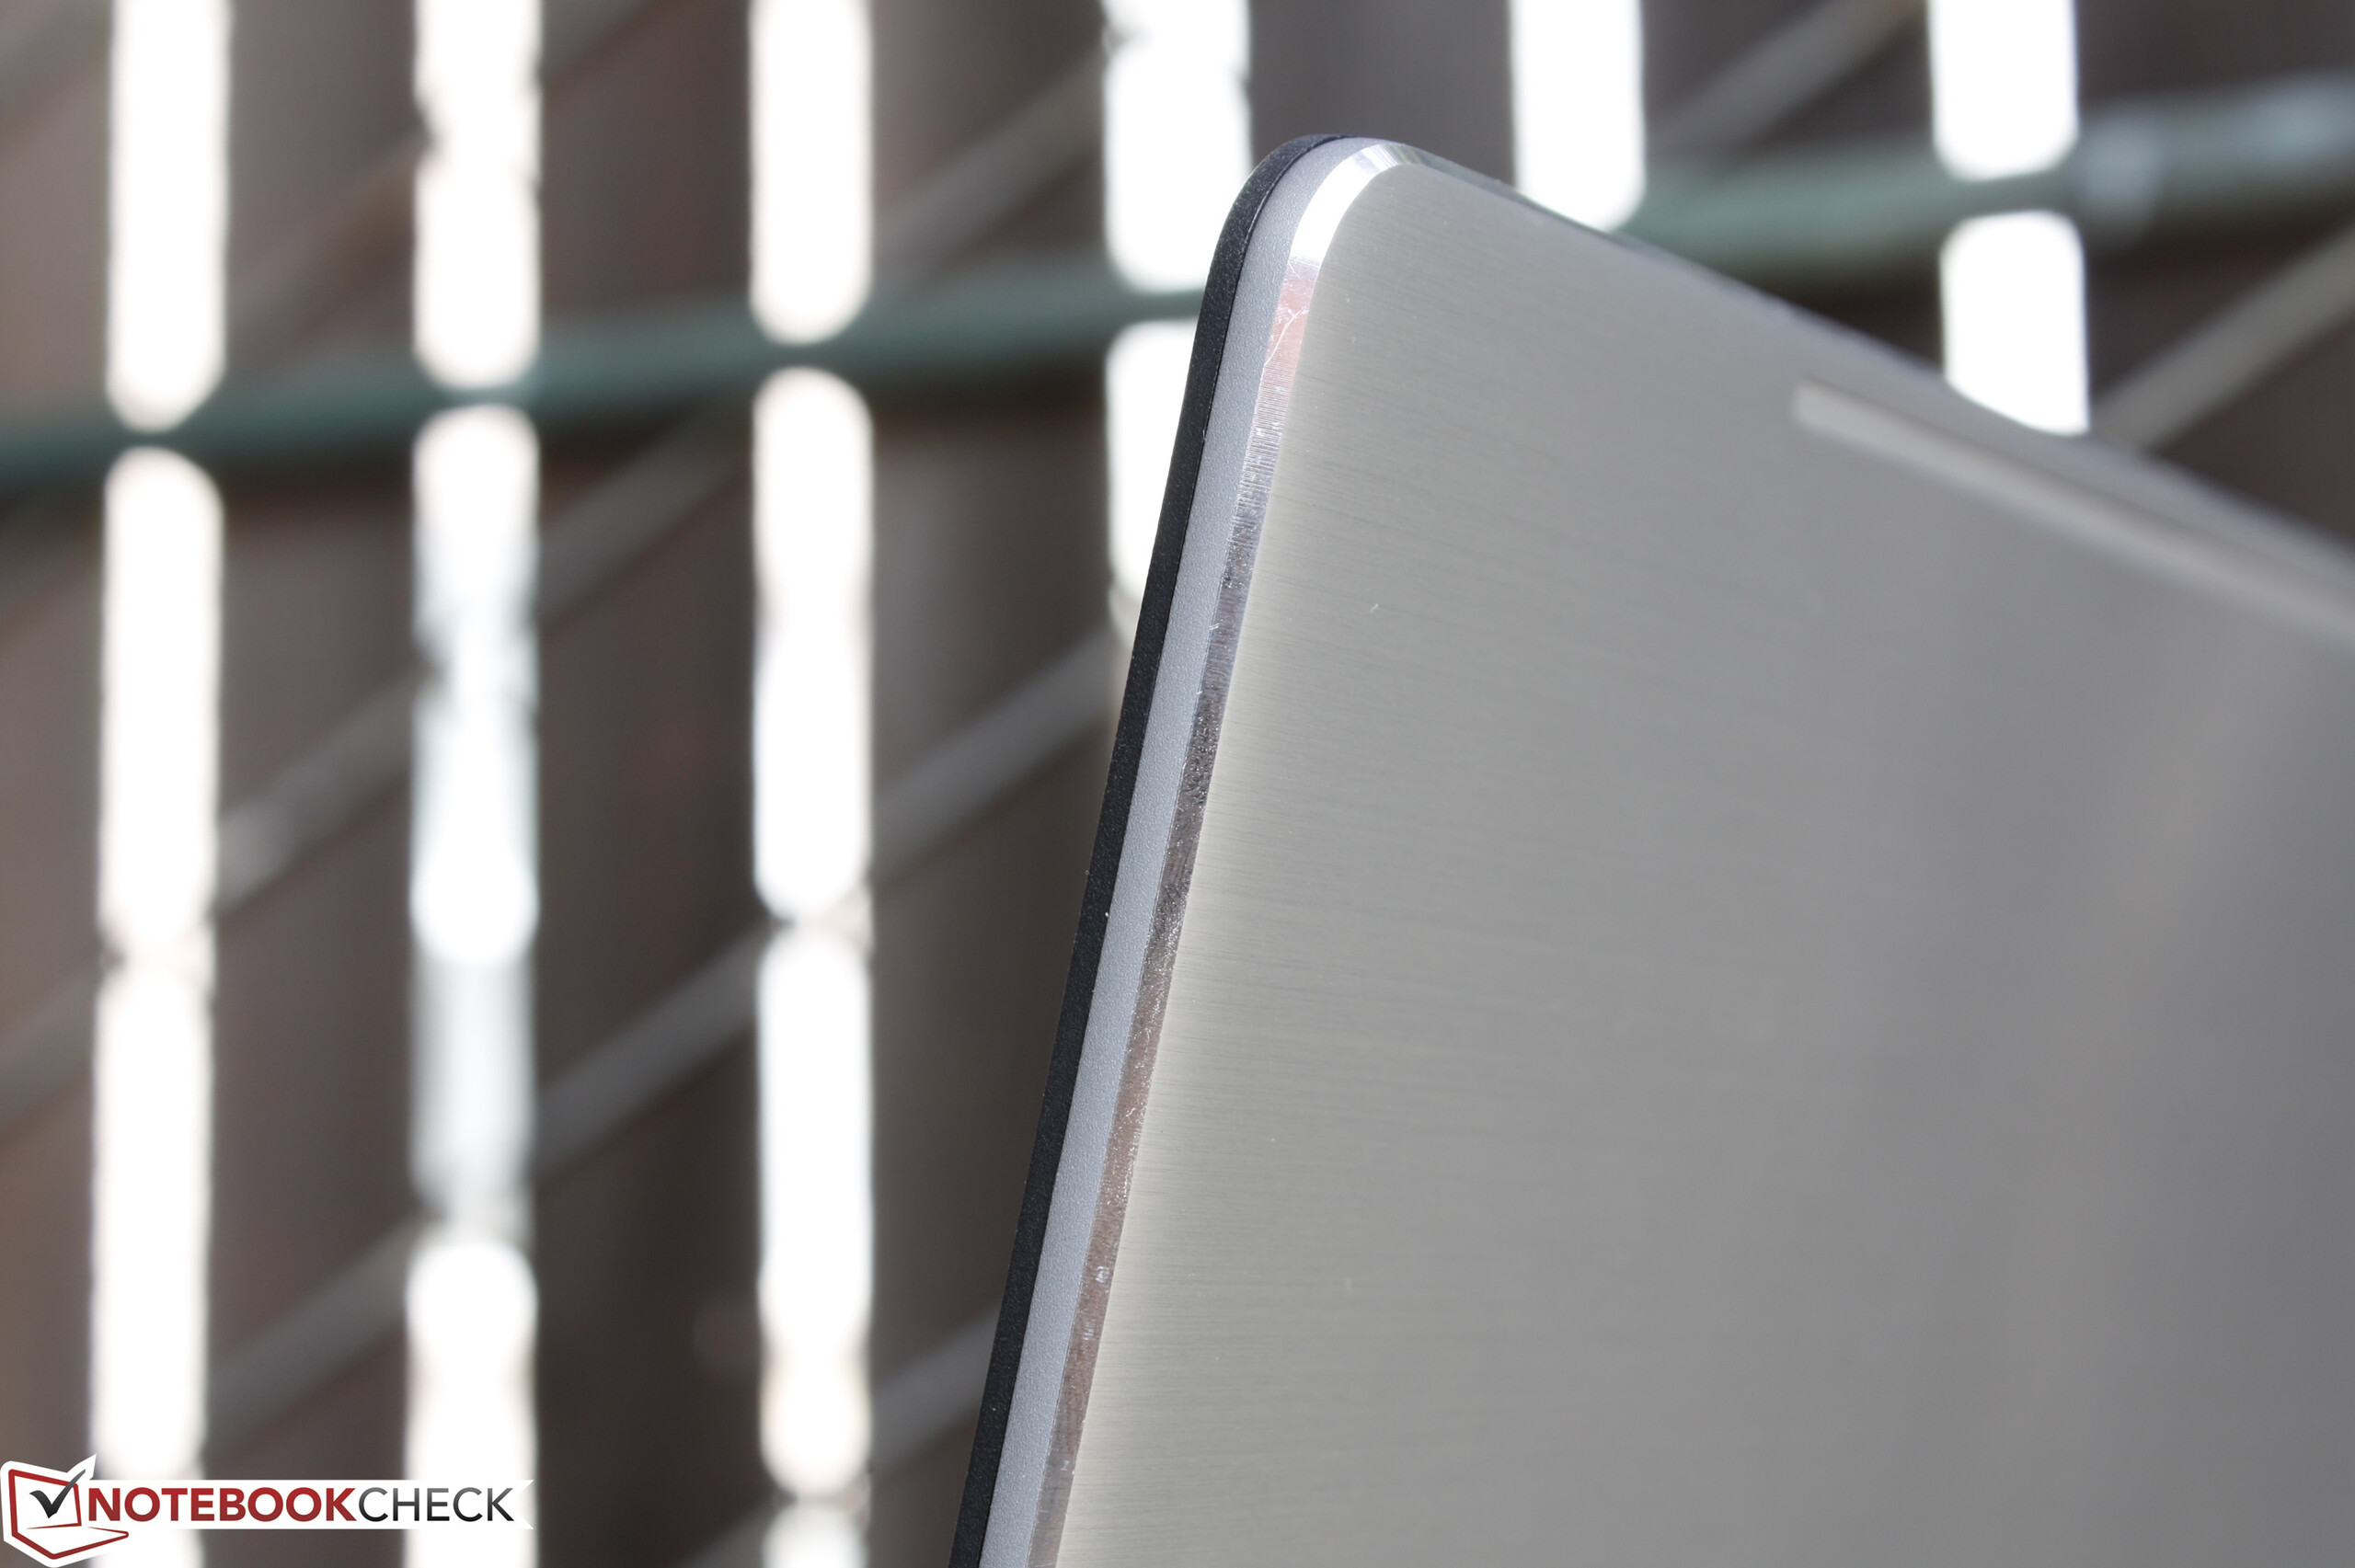
Inspiron 13 7368 är inte den stora uppdatering som vi hoppades på. Dess vikt och storlek gör den till en "inomhusplatta”, samtidigt som det finns mer portabla 13-tums Ultrabooks med samma prestanda och funktioner.
Dell Inspiron 13 7386
- 07/15/2016 v5.1 (old)
Allen Ngo
Price comparison
