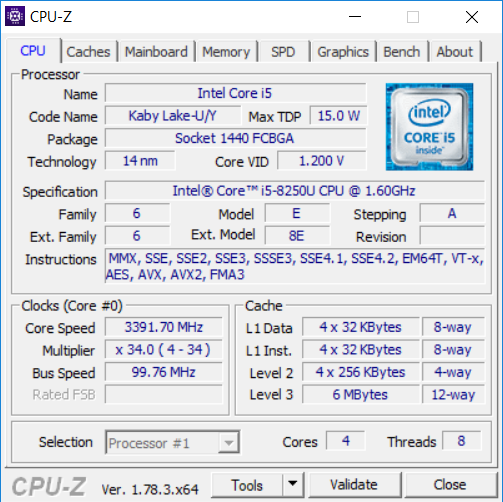
Test: Dell Inspiron 13 5379 (i5-8250U, UHD 620) Omvandlingsbar (Sammanfattning)
| SD Card Reader | |
| average JPG Copy Test (av. of 3 runs) | |
| Lenovo Miix 520-12IKB 81CG | |
| Dell Inspiron 13-5379-9573 (Toshiba Exceria Pro SDXC 64 GB UHS-II) | |
| Acer Spin 5 SP513-52N-54SF (Toshiba Exceria Pro SDXC 64 GB UHS-II) | |
| Dell Inspiron 13 5368 (Toshiba Exceria Pro SDXC 64 GB UHS-II) | |
| maximum AS SSD Seq Read Test (1GB) | |
| Lenovo Miix 520-12IKB 81CG | |
| Dell Inspiron 13-5379-9573 (Toshiba Exceria Pro SDXC 64 GB UHS-II) | |
| Acer Spin 5 SP513-52N-54SF (Toshiba Exceria Pro SDXC 64 GB UHS-II) | |
| Dell Inspiron 13 5368 (Toshiba Exceria Pro SDXC 64 GB UHS-II) | |
| Networking | |
| iperf3 transmit AX12 | |
| Lenovo Yoga 720-13IKB | |
| Dell Inspiron 13-5379-9573 | |
| Acer Spin 5 SP513-52N-54SF | |
| Lenovo Miix 520-12IKB 81CG | |
| iperf3 receive AX12 | |
| Dell Inspiron 13-5379-9573 | |
| Lenovo Yoga 720-13IKB | |
| Lenovo Miix 520-12IKB 81CG | |
| Acer Spin 5 SP513-52N-54SF | |
| |||||||||||||||||||||||||
Distribution av ljusstyrkan: 81 %
Mitt på batteriet: 276 cd/m²
Kontrast: 856:1 (Svärta: 0.32 cd/m²)
ΔE ColorChecker Calman: 5.57 | ∀{0.5-29.43 Ø4.71}
ΔE Greyscale Calman: 4.66 | ∀{0.09-98 Ø4.96}
61% sRGB (Argyll 1.6.3 3D)
39% AdobeRGB 1998 (Argyll 1.6.3 3D)
42.6% AdobeRGB 1998 (Argyll 3D)
61.7% sRGB (Argyll 3D)
41.2% Display P3 (Argyll 3D)
Gamma: 2.53
CCT: 7010 K
| Dell Inspiron 13-5379-9573 BOE BOE06A7, , 1920x1080, 13.3" | Lenovo Yoga 720-13IKB BOE CQ NV133FHM-N61, , 1920x1080, 13.3" | Acer Spin 5 SP513-52N-54SF LC133LF102, , 1920x1080, 13.3" | Lenovo Miix 520-12IKB 81CG Unknown, , 1920x1200, 12.2" | Dell Inspiron 13 5368 AUO B133HAB, , 1920x1080, 13.3" | |
|---|---|---|---|---|---|
| Display | 53% | 62% | 52% | -6% | |
| Display P3 Coverage (%) | 41.2 | 67.8 65% | 69.8 69% | 64.4 56% | 38.88 -6% |
| sRGB Coverage (%) | 61.7 | 88.2 43% | 94.6 53% | 90.8 47% | 57.7 -6% |
| AdobeRGB 1998 Coverage (%) | 42.6 | 64.4 51% | 69.3 63% | 65.4 54% | 40.17 -6% |
| Response Times | -7% | 5% | 18% | 4% | |
| Response Time Grey 50% / Grey 80% * (ms) | 45 ? | 48 ? -7% | 49 ? -9% | 35.6 ? 21% | 44 ? 2% |
| Response Time Black / White * (ms) | 33 ? | 35 ? -6% | 27 ? 18% | 28 ? 15% | 31 ? 6% |
| PWM Frequency (Hz) | 192 ? | 350 ? | 1000 ? | 198.4 ? | |
| Screen | 16% | 31% | -3% | 7% | |
| Brightness middle (cd/m²) | 274 | 297 8% | 295 8% | 348.8 27% | 240 -12% |
| Brightness (cd/m²) | 272 | 277 2% | 276 1% | 339 25% | 229 -16% |
| Brightness Distribution (%) | 81 | 87 7% | 88 9% | 87 7% | 92 14% |
| Black Level * (cd/m²) | 0.32 | 0.33 -3% | 0.27 16% | 0.4 -25% | 0.24 25% |
| Contrast (:1) | 856 | 900 5% | 1093 28% | 872 2% | 1000 17% |
| Colorchecker dE 2000 * | 5.57 | 4.93 11% | 2.97 47% | 7 -26% | 4.75 15% |
| Colorchecker dE 2000 max. * | 13.48 | 8.39 38% | 5.67 58% | 16.2 -20% | 9.09 33% |
| Greyscale dE 2000 * | 4.66 | 4.84 -4% | 3.12 33% | 10.1 -117% | 4.3 8% |
| Gamma | 2.53 87% | 2.5 88% | 2.45 90% | 2.22 99% | 2.5 88% |
| CCT | 7010 93% | 6894 94% | 6676 97% | 9065 72% | 5893 110% |
| Color Space (Percent of AdobeRGB 1998) (%) | 39 | 58 49% | 62 59% | 58.7 51% | 36.79 -6% |
| Color Space (Percent of sRGB) (%) | 61 | 88 44% | 94 54% | 90.9 49% | 57.39 -6% |
| Totalt genomsnitt (program/inställningar) | 21% /
20% | 33% /
34% | 22% /
11% | 2% /
4% |
* ... mindre är bättre
Visa svarstider
| ↔ Svarstid svart till vitt | ||
|---|---|---|
| 33 ms ... stiga ↗ och falla ↘ kombinerat | ↗ 20 ms stiga | 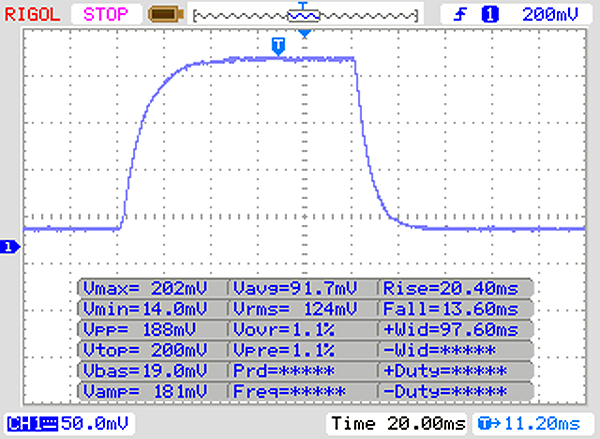 |
| ↘ 13 ms hösten | ||
| Skärmen visar långsamma svarsfrekvenser i våra tester och kommer att vara otillfredsställande för spelare. I jämförelse sträcker sig alla testade enheter från 0.1 (minst) till 240 (maximalt) ms. » 89 % av alla enheter är bättre. Detta innebär att den uppmätta svarstiden är sämre än genomsnittet av alla testade enheter (19.8 ms). | ||
| ↔ Svarstid 50 % grått till 80 % grått | ||
| 45 ms ... stiga ↗ och falla ↘ kombinerat | ↗ 24 ms stiga | 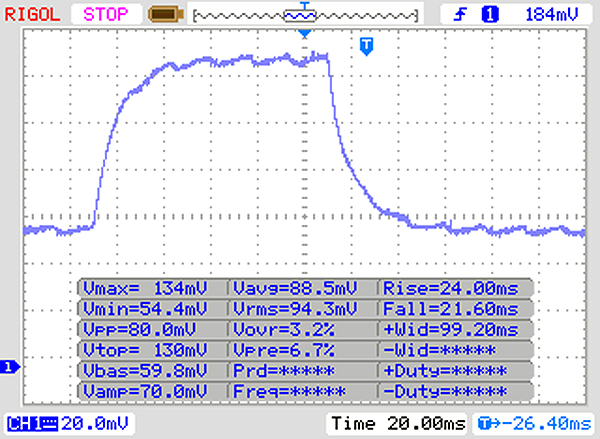 |
| ↘ 21 ms hösten | ||
| Skärmen visar långsamma svarsfrekvenser i våra tester och kommer att vara otillfredsställande för spelare. I jämförelse sträcker sig alla testade enheter från 0.165 (minst) till 636 (maximalt) ms. » 77 % av alla enheter är bättre. Detta innebär att den uppmätta svarstiden är sämre än genomsnittet av alla testade enheter (31 ms). | ||
Skärmflimmer / PWM (Puls-Width Modulation)
| Skärmflimmer / PWM upptäckt | 192 Hz | ≤ 90 % ljusstyrka inställning | 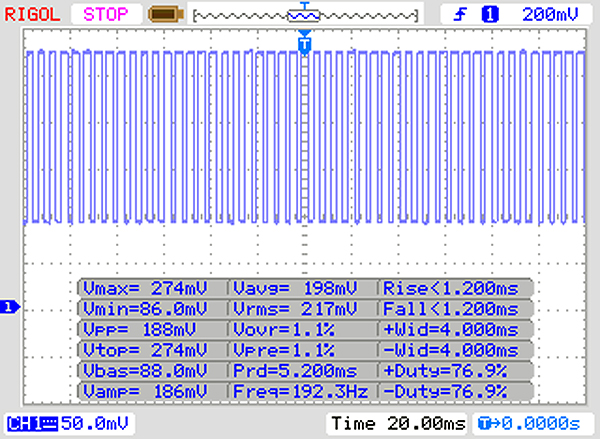 |
Displayens bakgrundsbelysning flimrar vid 192 Hz (i värsta fall, t.ex. med PWM) Flimrande upptäckt vid en ljusstyrkeinställning på 90 % och lägre. Det ska inte finnas något flimmer eller PWM över denna ljusstyrkeinställning. Frekvensen för 192 Hz är relativt låg, så känsliga användare kommer sannolikt att märka flimmer och uppleva ansträngda ögon vid den angivna ljusstyrkeinställningen och nedan. Som jämförelse: 52 % av alla testade enheter använder inte PWM för att dämpa skärmen. Om PWM upptäcktes mättes ett medelvärde av 7754 (minst: 5 - maximum: 343500) Hz. | |||
| Cinebench R15 | |
| CPU Single 64Bit | |
| Acer Spin 5 SP513-52N-54SF | |
| Lenovo Miix 520-12IKB 81CG | |
| Dell Inspiron 13-5379-9573 | |
| Dell Inspiron 13 5368 | |
| Lenovo Yoga 720-13IKB | |
| CPU Multi 64Bit | |
| Dell Inspiron 13-5379-9573 | |
| Lenovo Miix 520-12IKB 81CG | |
| Acer Spin 5 SP513-52N-54SF | |
| Lenovo Yoga 720-13IKB | |
| Dell Inspiron 13 5368 | |
| PCMark 8 | |
| Home Score Accelerated v2 | |
| Lenovo Yoga 720-13IKB | |
| Lenovo Miix 520-12IKB 81CG | |
| Dell Inspiron 13 5368 | |
| Dell Inspiron 13-5379-9573 | |
| Acer Spin 5 SP513-52N-54SF | |
| Work Score Accelerated v2 | |
| Lenovo Yoga 720-13IKB | |
| Dell Inspiron 13-5379-9573 | |
| Dell Inspiron 13 5368 | |
| Acer Spin 5 SP513-52N-54SF | |
| Lenovo Miix 520-12IKB 81CG | |
| PCMark 8 Home Score Accelerated v2 | 3592 poäng | |
| PCMark 8 Work Score Accelerated v2 | 4621 poäng | |
Hjälp | ||
| Dell Inspiron 13-5379-9573 Micron 1100 MTFDDAV256TBN | Lenovo Yoga 720-13IKB Toshiba XG4 NVMe (THNSN5512GPUK) | Acer Spin 5 SP513-52N-54SF Micron 1100 MTFDDAV256TBN | Dell Inspiron 13 5368 Toshiba THNSNK256GCS8 | |
|---|---|---|---|---|
| CrystalDiskMark 3.0 | 167% | 58% | 43% | |
| Read Seq (MB/s) | 447.9 | 1345 200% | 462.7 3% | 479 7% |
| Write Seq (MB/s) | 304.8 | 569 87% | 439.9 44% | 270.1 -11% |
| Read 512 (MB/s) | 293.7 | 1041 254% | 325.2 11% | 428.3 46% |
| Write 512 (MB/s) | 157 | 547 248% | 361.9 131% | 267.9 71% |
| Read 4k (MB/s) | 14.03 | 38.42 174% | 27.52 96% | 23.77 69% |
| Write 4k (MB/s) | 63.3 | 127.1 101% | 91.6 45% | 81.4 29% |
| Read 4k QD32 (MB/s) | 165.9 | 416.4 151% | 247.3 49% | 333.6 101% |
| Write 4k QD32 (MB/s) | 155.1 | 337.5 118% | 292 88% | 200.9 30% |

| 3DMark 11 - 1280x720 Performance GPU | |
| Lenovo Yoga 720-13IKB | |
| Lenovo Miix 520-12IKB 81CG | |
| Acer Spin 5 SP513-52N-54SF | |
| Dell Inspiron 13-5379-9573 | |
| Dell Inspiron 13 5368 | |
| 3DMark | |
| 1280x720 Cloud Gate Standard Graphics | |
| Lenovo Yoga 720-13IKB | |
| Acer Spin 5 SP513-52N-54SF | |
| Lenovo Miix 520-12IKB 81CG | |
| Dell Inspiron 13-5379-9573 | |
| Dell Inspiron 13 5368 | |
| 1920x1080 Fire Strike Graphics | |
| Lenovo Yoga 720-13IKB | |
| Acer Spin 5 SP513-52N-54SF | |
| Lenovo Miix 520-12IKB 81CG | |
| Dell Inspiron 13-5379-9573 | |
| 3DMark 11 Performance | 1643 poäng | |
| 3DMark Cloud Gate Standard Score | 7244 poäng | |
| 3DMark Fire Strike Score | 876 poäng | |
Hjälp | ||
| BioShock Infinite | |
| 1920x1080 Ultra Preset, DX11 (DDOF) | |
| Lenovo Yoga 720-13IKB | |
| Acer Spin 5 SP513-52N-54SF | |
| Dell Inspiron 13-5379-9573 | |
| Lenovo Miix 520-12IKB 81CG | |
| 1366x768 High Preset | |
| Dell Inspiron 13 5368 | |
| Lenovo Yoga 720-13IKB | |
| Acer Spin 5 SP513-52N-54SF | |
| Lenovo Miix 520-12IKB 81CG | |
| Dell Inspiron 13-5379-9573 | |
| 1366x768 Medium Preset | |
| Dell Inspiron 13 5368 | |
| Lenovo Yoga 720-13IKB | |
| Acer Spin 5 SP513-52N-54SF | |
| Lenovo Miix 520-12IKB 81CG | |
| Dell Inspiron 13-5379-9573 | |
| 1280x720 Very Low Preset | |
| Lenovo Yoga 720-13IKB | |
| Dell Inspiron 13 5368 | |
| Acer Spin 5 SP513-52N-54SF | |
| Lenovo Miix 520-12IKB 81CG | |
| Dell Inspiron 13-5379-9573 | |
| Thief | |
| 1366x768 High Preset AA:FXAA & Low SS AF:4x | |
| Dell Inspiron 13 5368 | |
| 1366x768 Normal Preset AA:FX | |
| Dell Inspiron 13 5368 | |
| Dell Inspiron 13-5379-9573 | |
| 1024x768 Very Low Preset | |
| Dell Inspiron 13 5368 | |
| Dell Inspiron 13-5379-9573 | |
| Rise of the Tomb Raider | |
| 1366x768 Medium Preset AF:2x | |
| Dell Inspiron 13-5379-9573 | |
| Dell Inspiron 13 5368 | |
| Lenovo Miix 520-12IKB 81CG | |
| 1024x768 Lowest Preset | |
| Lenovo Miix 520-12IKB 81CG | |
| Dell Inspiron 13-5379-9573 | |
| Dell Inspiron 13 5368 | |
| låg | med. | hög | ultra | |
|---|---|---|---|---|
| BioShock Infinite (2013) | 49.4 | 27.1 | 21.8 | 7.6 |
| Thief (2014) | 22.8 | 11.5 | ||
| Rise of the Tomb Raider (2016) | 20.8 | 11.7 |
Ljudnivå
| Låg belastning |
| 30.1 / 30.1 / 30.1 dB(A) |
| Hög belastning |
| 33 / 35 dB(A) |
 | ||
30 dB tyst 40 dB(A) hörbar 50 dB(A) högt ljud |
||
min: | ||
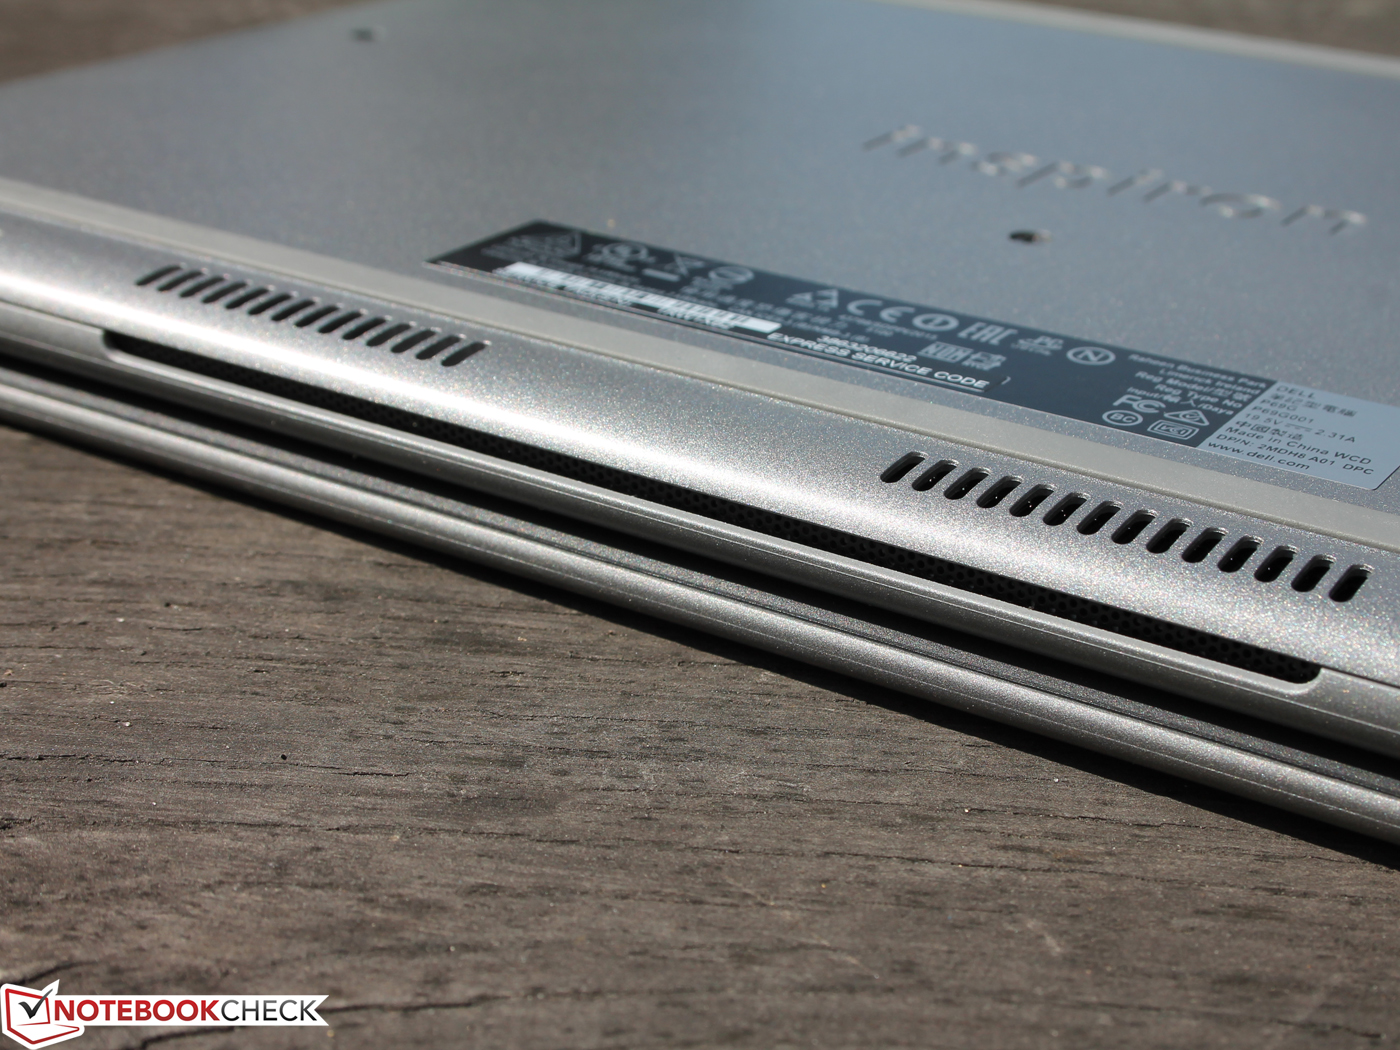
(±) Den maximala temperaturen på ovansidan är 43.2 °C / 110 F, jämfört med genomsnittet av 35.4 °C / 96 F , allt från 19.6 till 60 °C för klassen Convertible.
(-) Botten värms upp till maximalt 57.8 °C / 136 F, jämfört med genomsnittet av 36.9 °C / 98 F
(+) Vid tomgångsbruk är medeltemperaturen för ovansidan 29.9 °C / 86 F, jämfört med enhetsgenomsnittet på 30.3 °C / ### class_avg_f### F.
(+) Handledsstöden och pekplattan är kallare än hudtemperaturen med maximalt 28.7 °C / 83.7 F och är därför svala att ta på.
(±) Medeltemperaturen för handledsstödsområdet på liknande enheter var 28 °C / 82.4 F (-0.7 °C / -1.3 F).
Dell Inspiron 13-5379-9573 ljudanalys
(-) | inte särskilt höga högtalare (64.1 dB)
Bas 100 - 315 Hz
(±) | reducerad bas - i genomsnitt 10.2% lägre än medianen
(±) | linjäriteten för basen är genomsnittlig (7.6% delta till föregående frekvens)
Mellan 400 - 2000 Hz
(±) | högre mellan - i genomsnitt 5.3% högre än median
(±) | linjäriteten för mids är genomsnittlig (7.7% delta till föregående frekvens)
Högsta 2 - 16 kHz
(±) | högre toppar - i genomsnitt 5.1% högre än medianen
(+) | toppar är linjära (6% delta till föregående frekvens)
Totalt 100 - 16 000 Hz
(±) | linjäriteten för det totala ljudet är genomsnittlig (21.3% skillnad mot median)
Jämfört med samma klass
» 57% av alla testade enheter i den här klassen var bättre, 12% liknande, 32% sämre
» Den bästa hade ett delta på 6%, genomsnittet var 20%, sämst var 57%
Jämfört med alla testade enheter
» 59% av alla testade enheter var bättre, 7% liknande, 33% sämre
» Den bästa hade ett delta på 4%, genomsnittet var 23%, sämst var 134%
Apple MacBook 12 (Early 2016) 1.1 GHz ljudanalys
(+) | högtalare kan spela relativt högt (83.6 dB)
Bas 100 - 315 Hz
(±) | reducerad bas - i genomsnitt 11.3% lägre än medianen
(±) | linjäriteten för basen är genomsnittlig (14.2% delta till föregående frekvens)
Mellan 400 - 2000 Hz
(+) | balanserad mellan - endast 2.4% från medianen
(+) | mids är linjära (5.5% delta till föregående frekvens)
Högsta 2 - 16 kHz
(+) | balanserade toppar - endast 2% från medianen
(+) | toppar är linjära (4.5% delta till föregående frekvens)
Totalt 100 - 16 000 Hz
(+) | det totala ljudet är linjärt (10.2% skillnad mot median)
Jämfört med samma klass
» 7% av alla testade enheter i den här klassen var bättre, 2% liknande, 90% sämre
» Den bästa hade ett delta på 5%, genomsnittet var 18%, sämst var 53%
Jämfört med alla testade enheter
» 5% av alla testade enheter var bättre, 1% liknande, 94% sämre
» Den bästa hade ett delta på 4%, genomsnittet var 23%, sämst var 134%
| Av/Standby | |
| Låg belastning | |
| Hög belastning |
|
Förklaring:
min: | |
| Dell Inspiron 13-5379-9573 i5-8250U, UHD Graphics 620, Micron 1100 MTFDDAV256TBN, IPS, 1920x1080, 13.3" | Lenovo Yoga 720-13IKB i5-8550U, UHD Graphics 620, Toshiba XG4 NVMe (THNSN5512GPUK), IPS, 1920x1080, 13.3" | Acer Spin 5 SP513-52N-54SF i5-8250U, UHD Graphics 620, Micron 1100 MTFDDAV256TBN, IPS, 1920x1080, 13.3" | Lenovo Miix 520-12IKB 81CG i5-8250U, UHD Graphics 620, Samsung PM961 MZVLW256HEHP, IPS, 1920x1200, 12.2" | Dell Inspiron 13 5368 6500U, HD Graphics 520, Toshiba THNSNK256GCS8, IPS, 1920x1080, 13.3" | |
|---|---|---|---|---|---|
| Power Consumption | -14% | -5% | -31% | 3% | |
| Idle Minimum * (Watt) | 3.2 | 3.8 -19% | 3.9 -22% | 5.5 -72% | 4.4 -38% |
| Idle Average * (Watt) | 5.9 | 8.4 -42% | 8.2 -39% | 8.3 -41% | 6.1 -3% |
| Idle Maximum * (Watt) | 8.8 | 9.7 -10% | 8.8 -0% | 11.5 -31% | 6.8 23% |
| Load Average * (Watt) | 31.2 | 36 -15% | 28.5 9% | 38.3 -23% | 29 7% |
| Load Maximum * (Watt) | 42.2 | 36 15% | 30.7 27% | 37.7 11% | 31.9 24% |
* ... mindre är bättre
| Dell Inspiron 13-5379-9573 i5-8250U, UHD Graphics 620, 42 Wh | Lenovo Yoga 720-13IKB i5-8550U, UHD Graphics 620, 48 Wh | Acer Spin 5 SP513-52N-54SF i5-8250U, UHD Graphics 620, 53.9 Wh | Lenovo Miix 520-12IKB 81CG i5-8250U, UHD Graphics 620, 38 Wh | Dell Inspiron 13 5368 6500U, HD Graphics 520, 42 Wh | |
|---|---|---|---|---|---|
| Batteridrifttid | 44% | 54% | -16% | -22% | |
| Reader / Idle (h) | 15.3 | 12.3 -20% | 11.2 -27% | ||
| WiFi v1.3 (h) | 5.4 | 7.8 44% | 8.3 54% | 5.6 4% | 4 -26% |
| Load (h) | 1.6 | 1.1 -31% | 1.4 -13% |
För
Emot
Läs den fullständiga versionen av den här recensionen på engelska här.
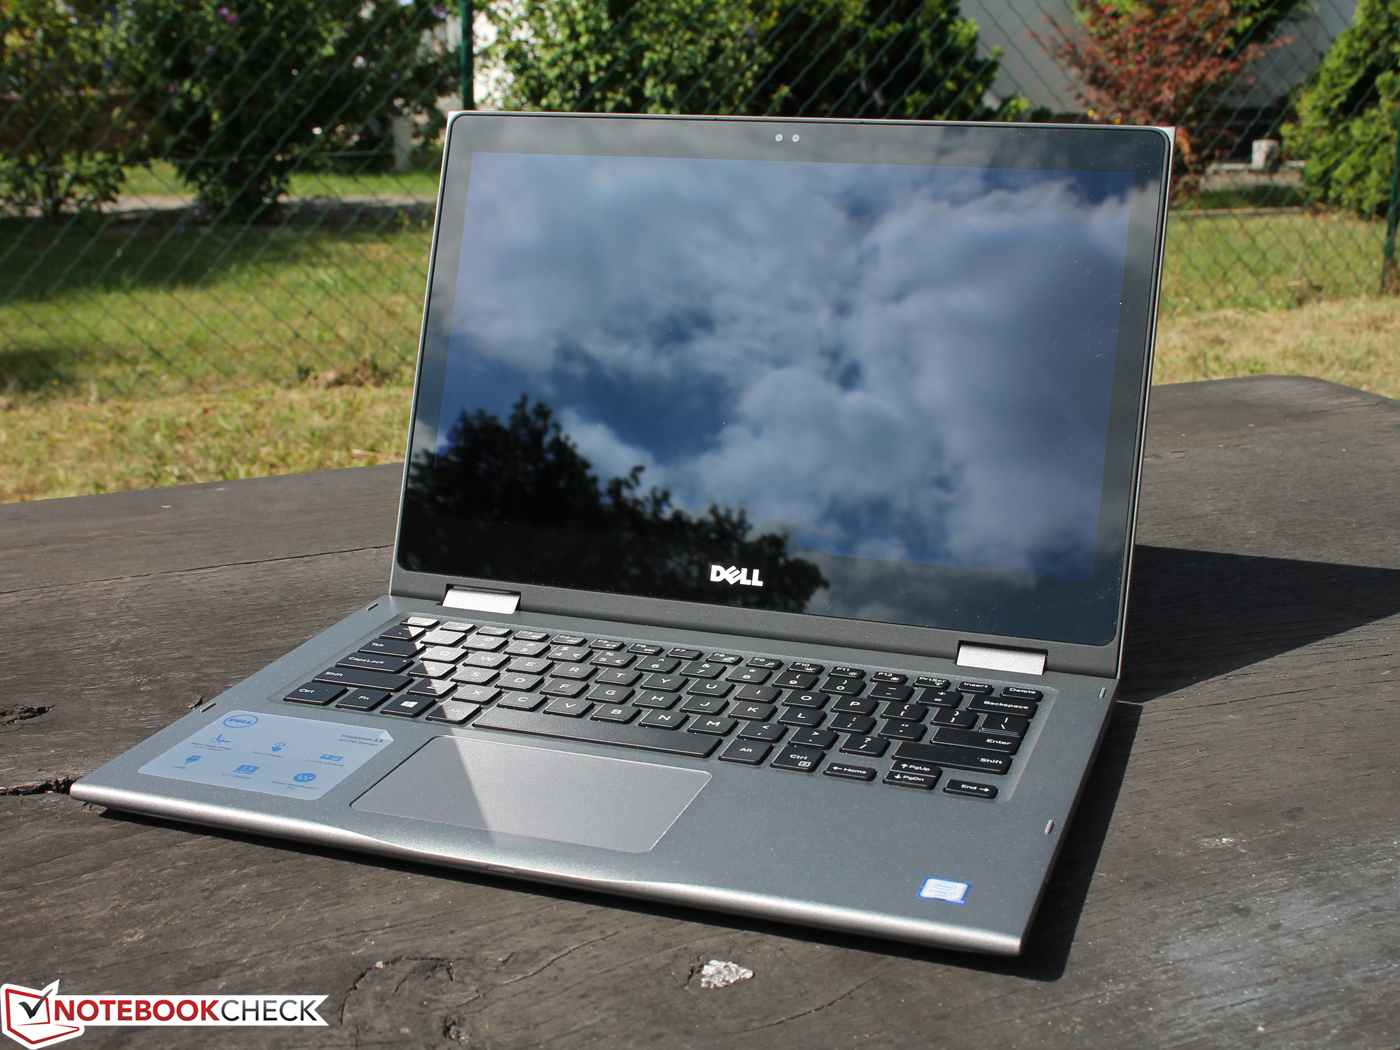
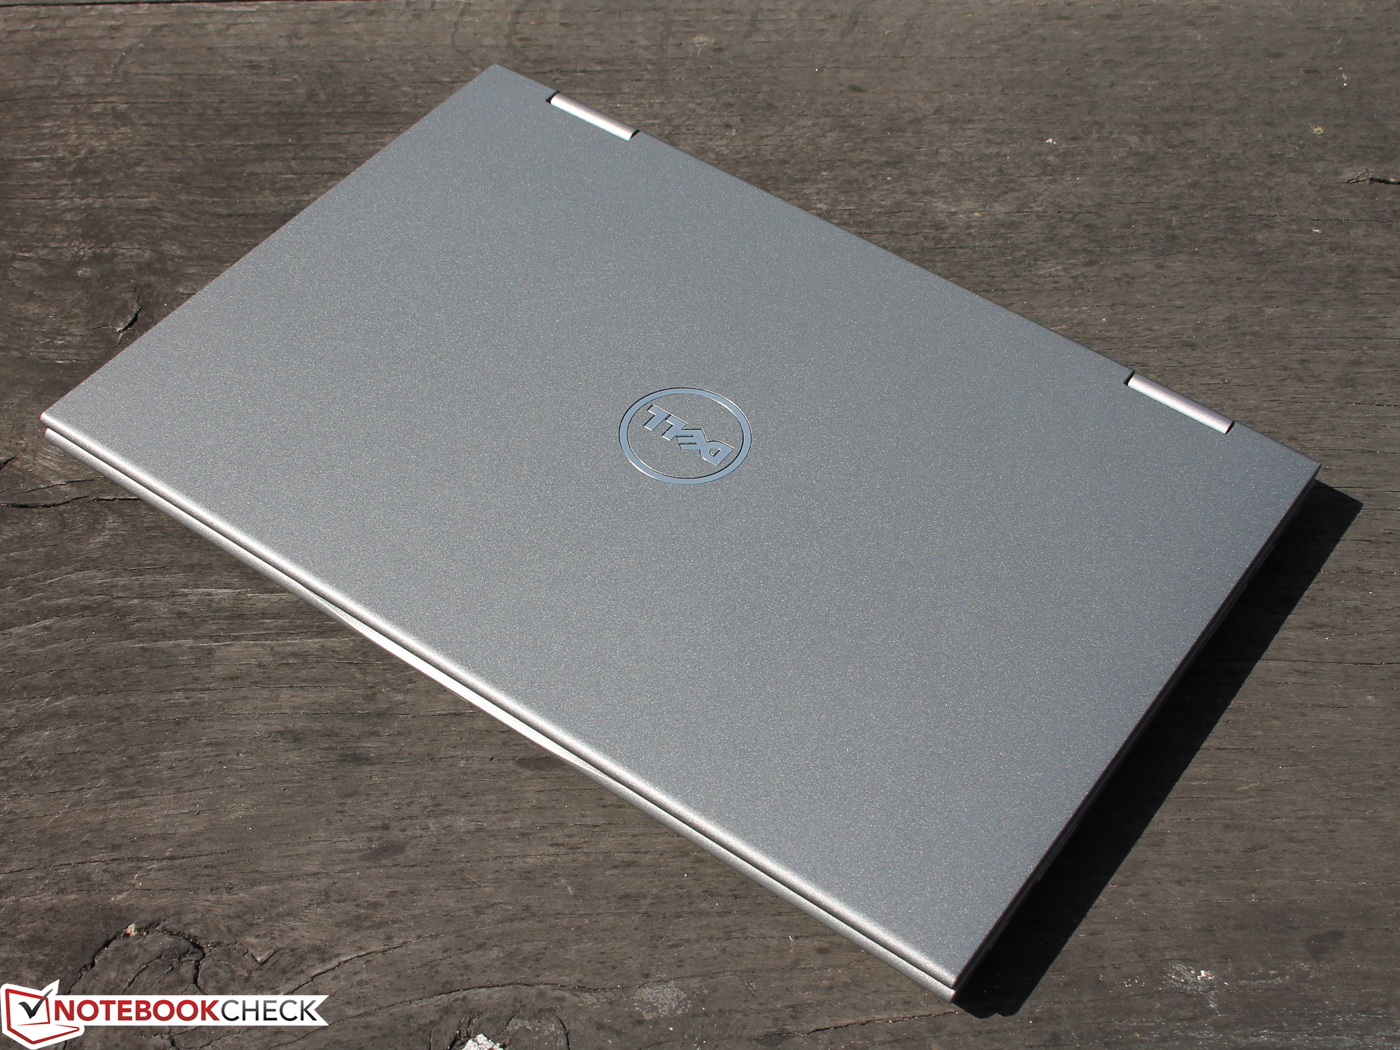
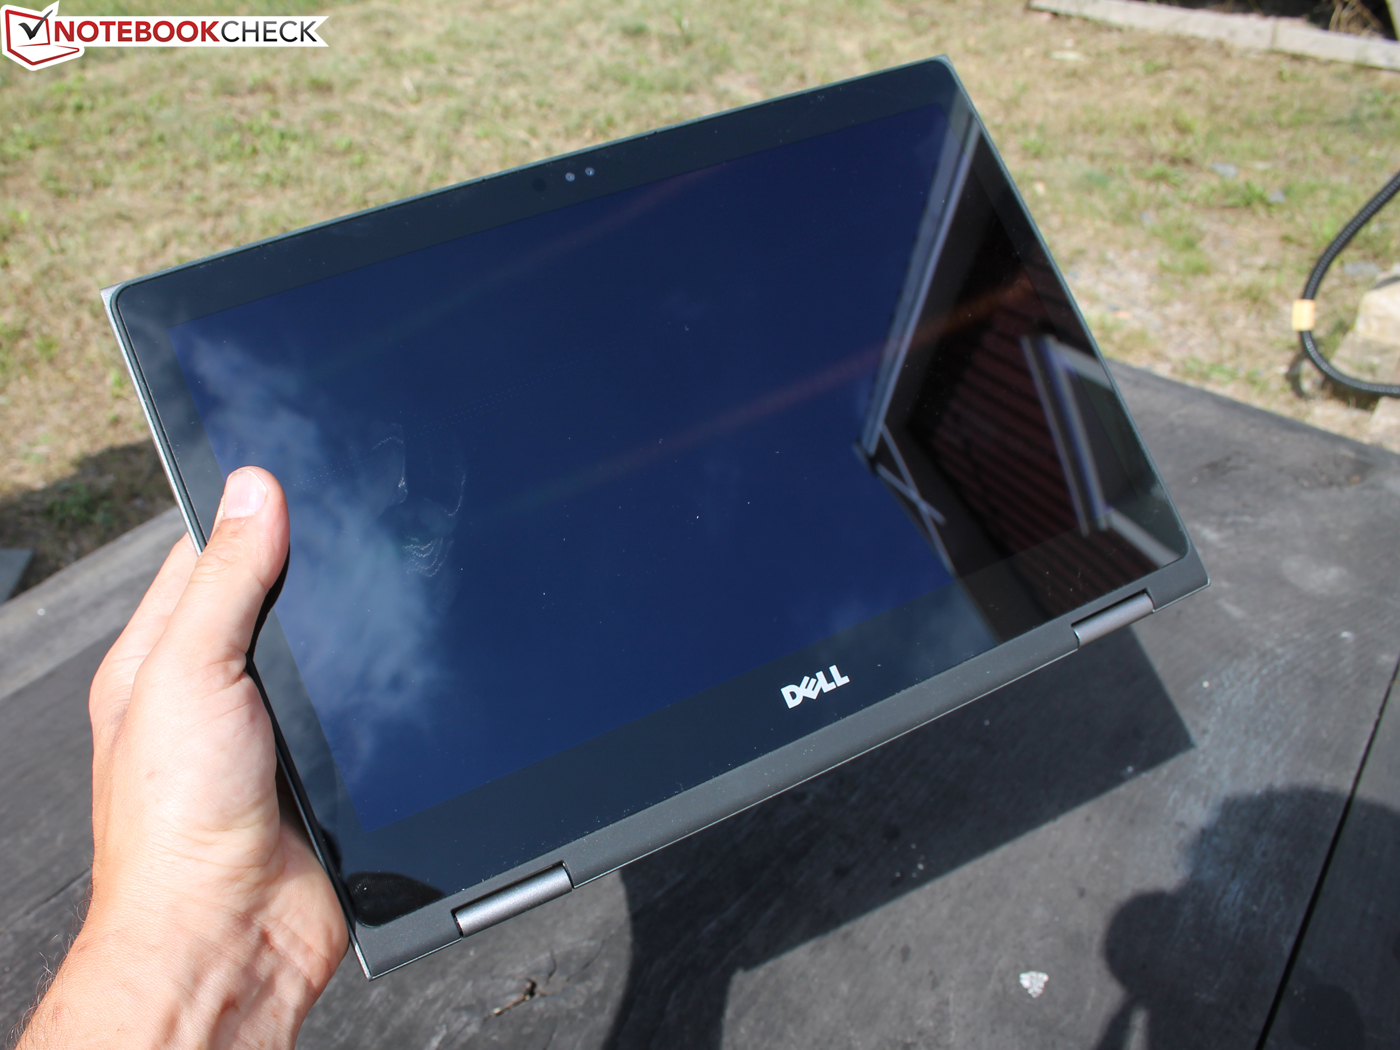
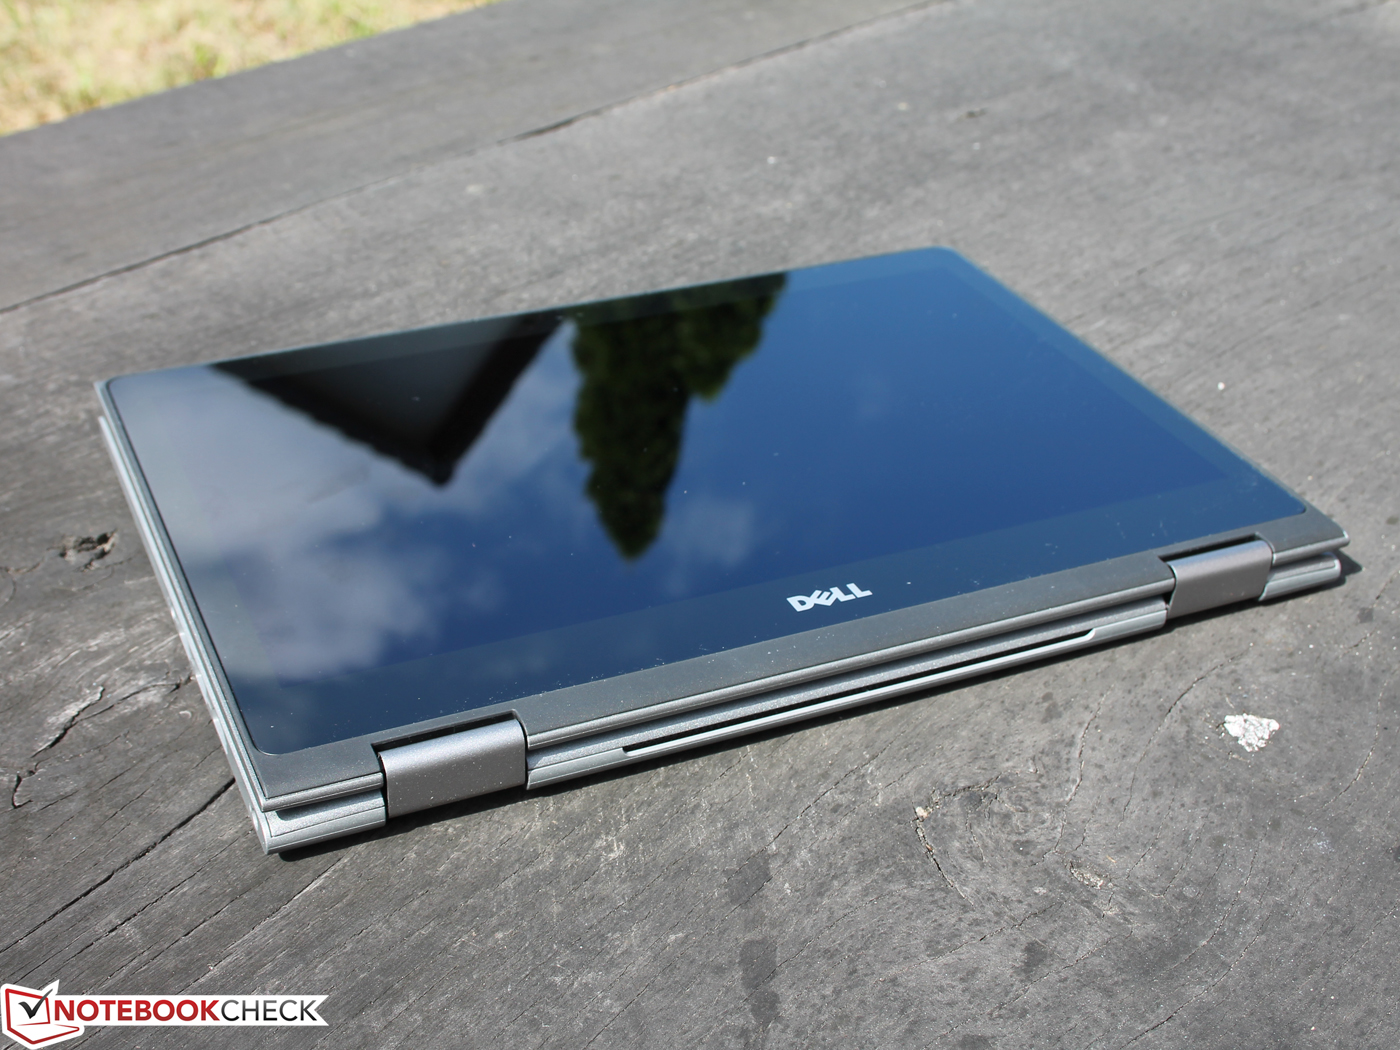
Inspiron 13 5379 är i större utsträckning en laptop än den är en surfplatta. Inspirons mått bidrar till den uppfattningen. Att böja skärmen 360° skapar en extremt tjock surfplatta vars användning ofta störs av mellanrummet mellan skärmen och basen. Även om vårt recensionsex ser utdaterad ut så är allt på insidan modernt.
"Om du bara använder surfplatteläget ibland eller vill ha en laptop som understöds av en tryckkänslig skärm så är Inspiron 13 5379 ett bra val. Sammantaget en kraftfull omvandlingsbar som är lätt att underhålla och som har en 8:e generationens Intel Kaby Lake-processor."
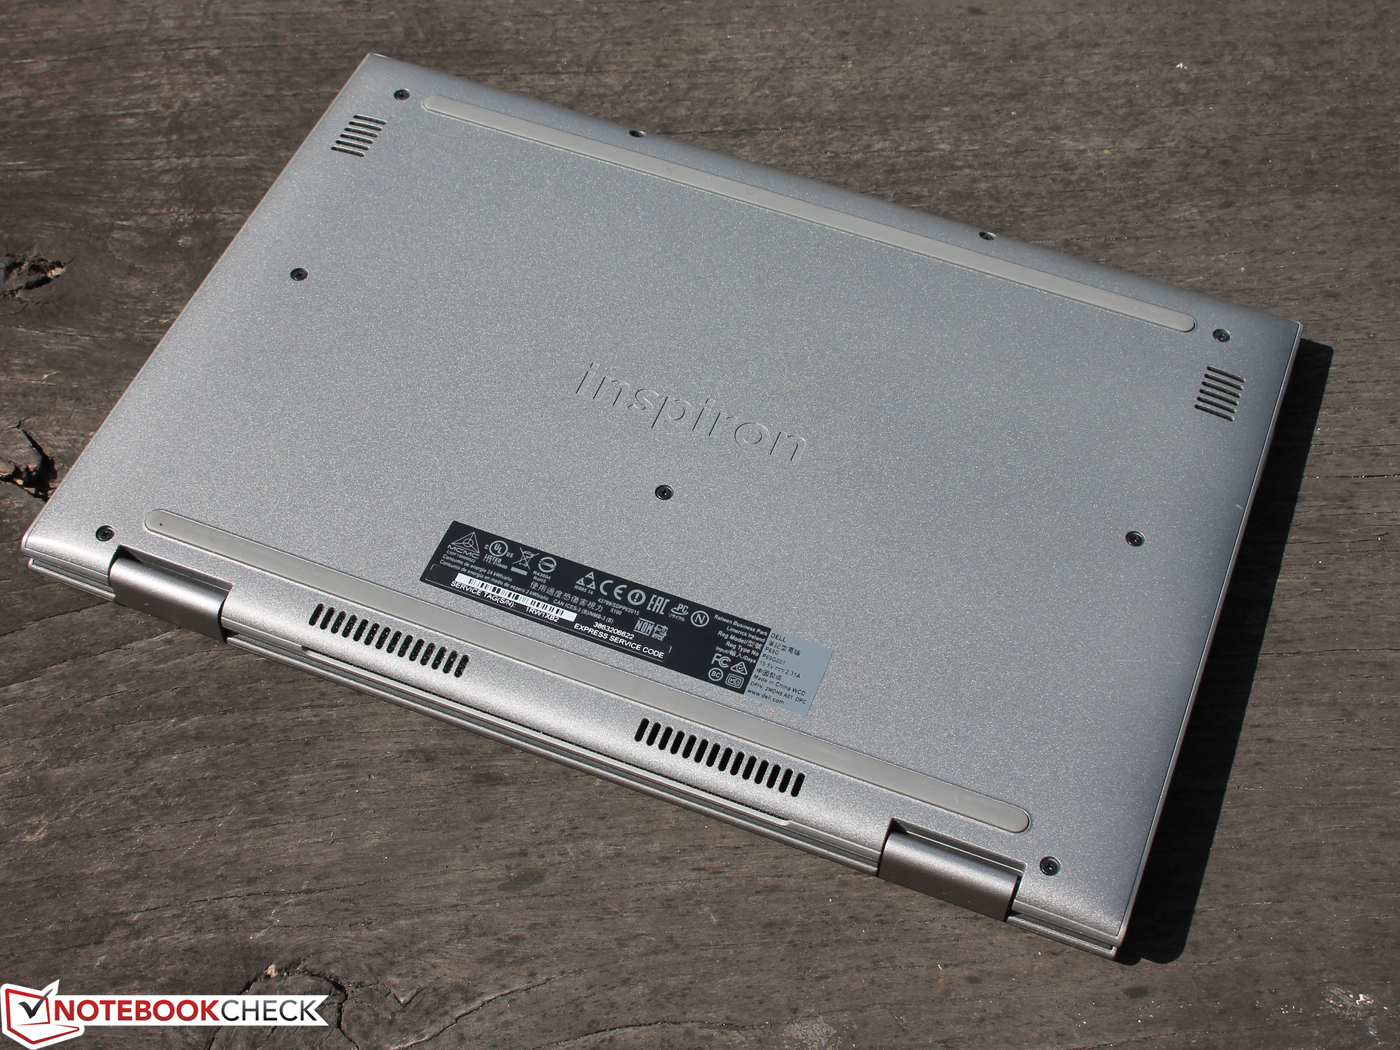
Inspiron 13 5370 är en kapabel enhet som smidigt utför allt kontorsarbete. Den är också lämpad för sporadiskt spelande, men bara för spel som är äldre eller kommer från Windows Store. Att enheten så lätt kan servas eller repareras säkrar bra systemprestanda även i ett långtidsperspektiv.
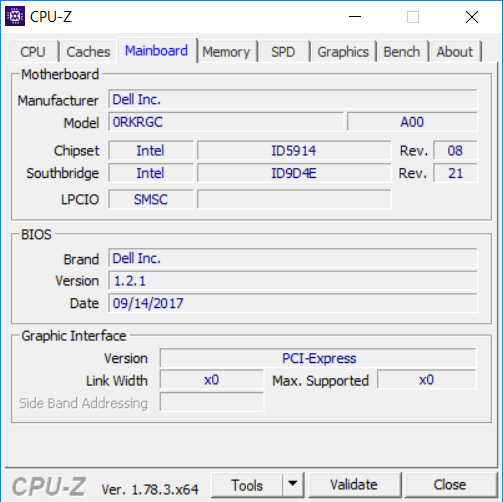
Dell Inspiron 13-5379-9573
- 02/12/2018 v6 (old)
Mike Wobker
Price comparison
