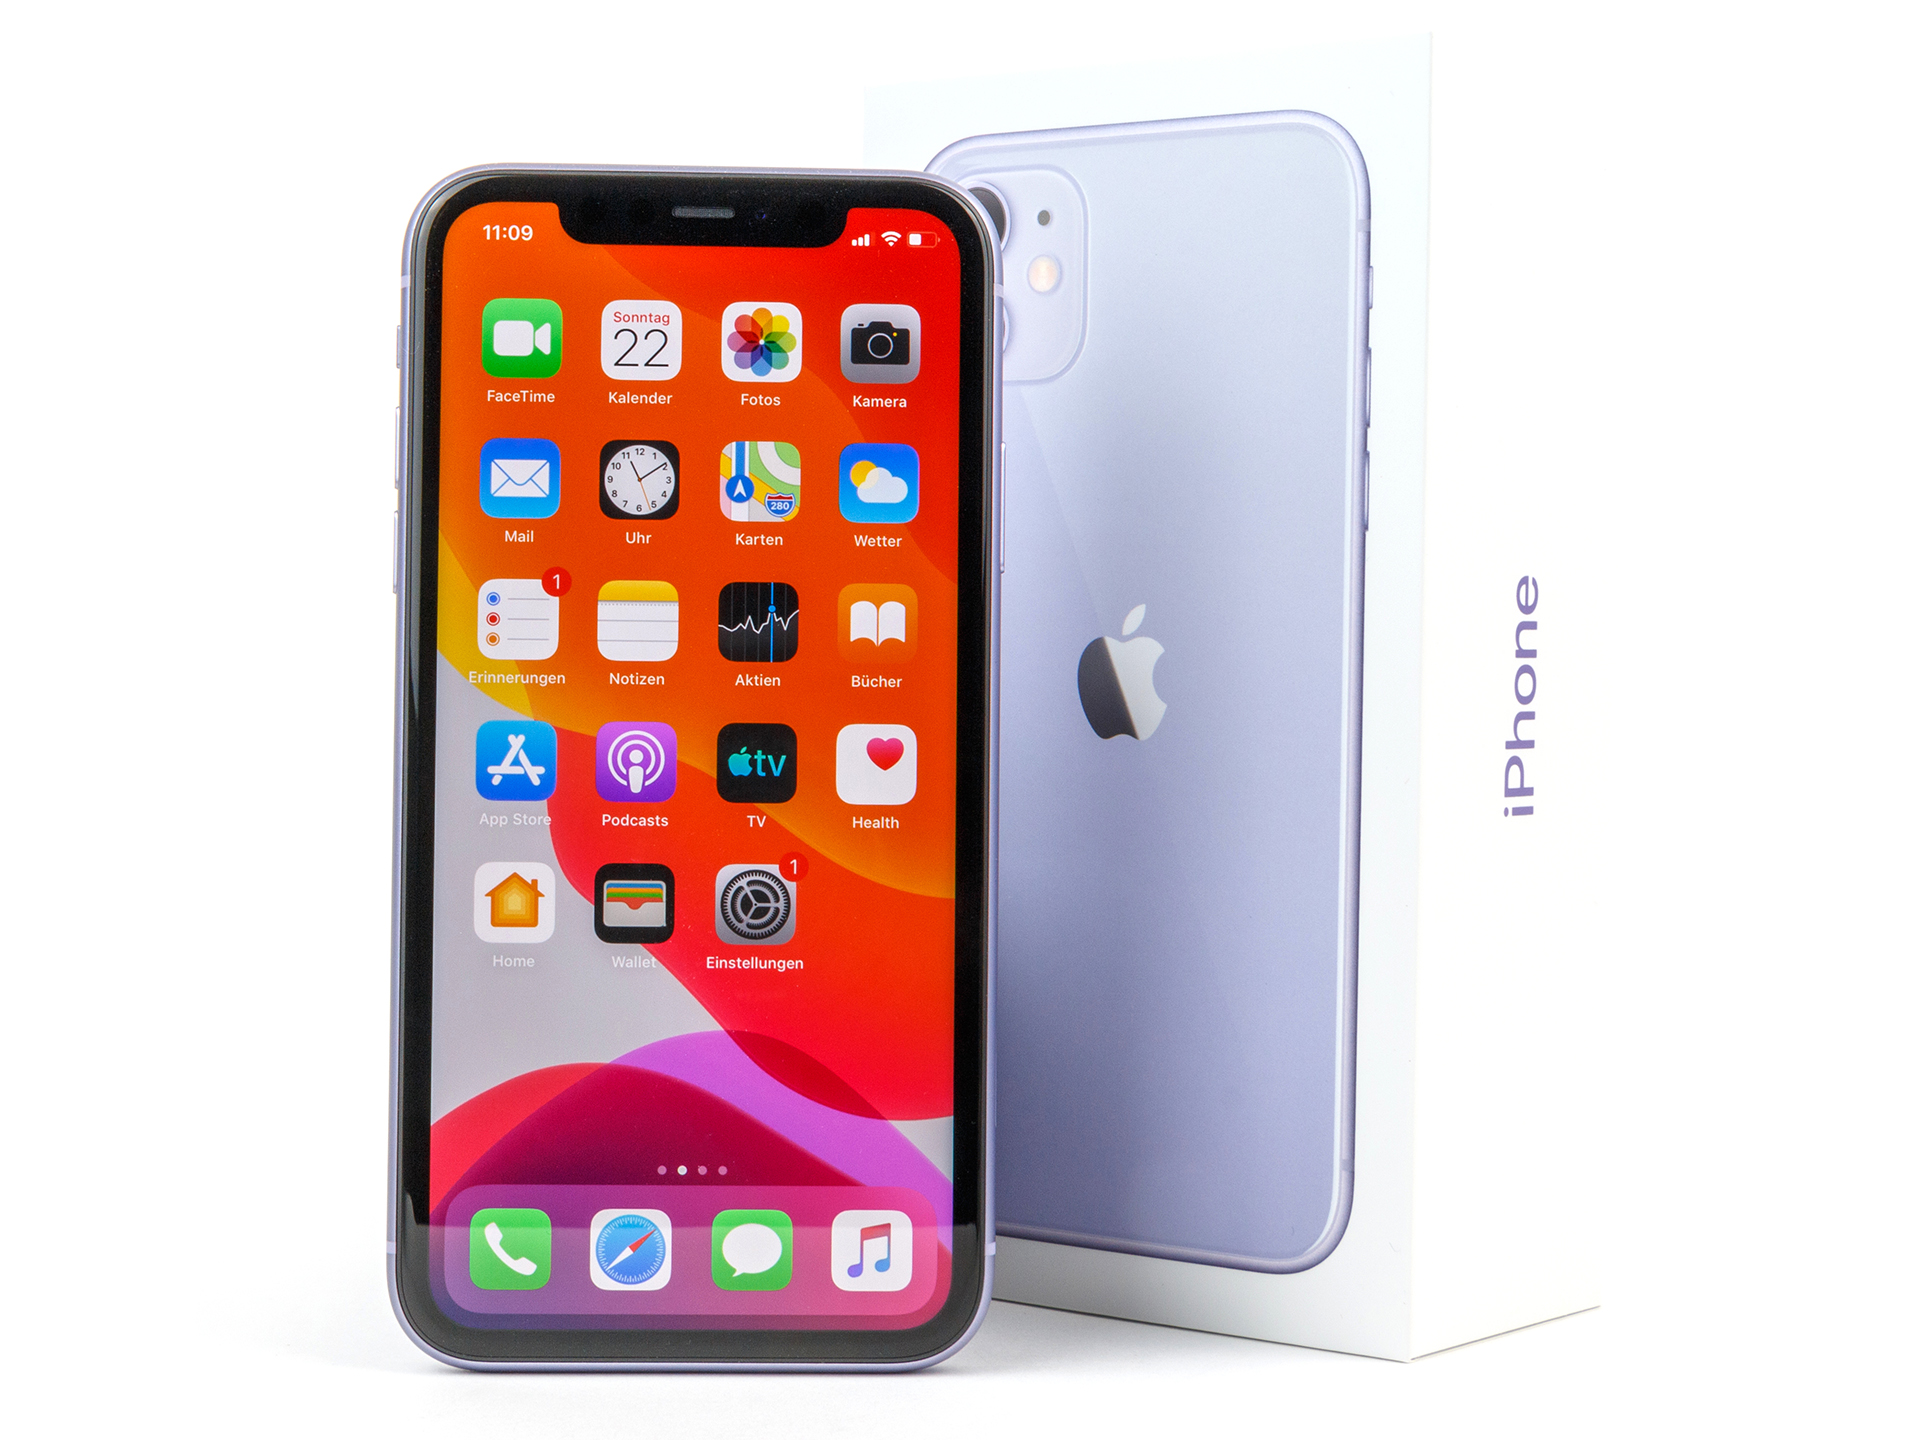
Test: Apple iPhone 11 - Mer än bara en billigare Apple-telefon (Sammanfattning)
| Networking | |
| iperf3 transmit AX12 | |
| Huawei P30 | |
| Apple iPhone XR | |
| Xiaomi Mi 9 | |
| Apple iPhone 11 | |
| LG G8s ThinQ | |
| Samsung Galaxy S10e | |
| iperf3 receive AX12 | |
| Xiaomi Mi 9 | |
| LG G8s ThinQ | |
| Apple iPhone 11 | |
| Huawei P30 | |
| Samsung Galaxy S10e | |
| Apple iPhone XR | |


| |||||||||||||||||||||||||
Distribution av ljusstyrkan: 93 %
Mitt på batteriet: 679 cd/m²
Kontrast: 999:1 (Svärta: 0.68 cd/m²)
ΔE ColorChecker Calman: 0.8 | ∀{0.5-29.43 Ø4.72}
ΔE Greyscale Calman: 1.1 | ∀{0.09-98 Ø4.97}
99.8% sRGB (Calman 2D)
Gamma: 2.24
CCT: 6610 K
| Apple iPhone 11 IPS, 1792x828, 6.1" | Apple iPhone XR IPS, 1792x828, 6.1" | Samsung Galaxy S10e AMOLED, 2280x1080, 5.8" | Huawei P30 OLED, 2340x1080, 6.1" | Xiaomi Mi 9 AMOLED, 2340x1080, 6.4" | LG G8s ThinQ P-OLED, 2248x1080, 6.2" | |
|---|---|---|---|---|---|---|
| Screen | -5% | -57% | -31% | -10% | -118% | |
| Brightness middle (cd/m²) | 679 | 672 -1% | 426 -37% | 561 -17% | 593 -13% | 539 -21% |
| Brightness (cd/m²) | 671 | 641 -4% | 427 -36% | 560 -17% | 587 -13% | 556 -17% |
| Brightness Distribution (%) | 93 | 92 -1% | 96 3% | 95 2% | 94 1% | 88 -5% |
| Black Level * (cd/m²) | 0.68 | 0.35 49% | ||||
| Contrast (:1) | 999 | 1920 92% | ||||
| Colorchecker dE 2000 * | 0.8 | 1.3 -63% | 2.14 -168% | 1.5 -88% | 0.9 -13% | 3.78 -372% |
| Colorchecker dE 2000 max. * | 2.4 | 2.7 -13% | 3.29 -37% | 2.5 -4% | 2 17% | 6.95 -190% |
| Greyscale dE 2000 * | 1.1 | 2.2 -100% | 1.8 -64% | 1.8 -64% | 1.5 -36% | 2.2 -100% |
| Gamma | 2.24 98% | 2.3 96% | 2.111 104% | 2.2 100% | 2.27 97% | 2.274 97% |
| CCT | 6610 98% | 6868 95% | 6329 103% | 6512 100% | 6548 99% | 6013 108% |
* ... mindre är bättre
Skärmflimmer / PWM (Puls-Width Modulation)
| Skärmflimmer / PWM upptäcktes inte | 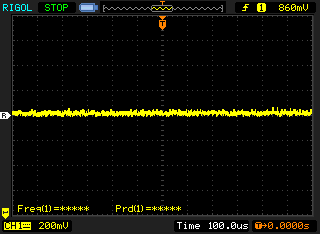 | ||
Som jämförelse: 52 % av alla testade enheter använder inte PWM för att dämpa skärmen. Om PWM upptäcktes mättes ett medelvärde av 7769 (minst: 5 - maximum: 343500) Hz. | |||
Visa svarstider
| ↔ Svarstid svart till vitt | ||
|---|---|---|
| 20.4 ms ... stiga ↗ och falla ↘ kombinerat | ↗ 7.2 ms stiga | 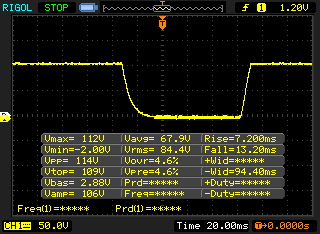 |
| ↘ 13.2 ms hösten | ||
| Skärmen visar bra svarsfrekvens i våra tester, men kan vara för långsam för konkurrenskraftiga spelare. I jämförelse sträcker sig alla testade enheter från 0.1 (minst) till 240 (maximalt) ms. » 46 % av alla enheter är bättre. Det betyder att den uppmätta svarstiden liknar genomsnittet av alla testade enheter (19.8 ms). | ||
| ↔ Svarstid 50 % grått till 80 % grått | ||
| 29.2 ms ... stiga ↗ och falla ↘ kombinerat | ↗ 13.2 ms stiga | 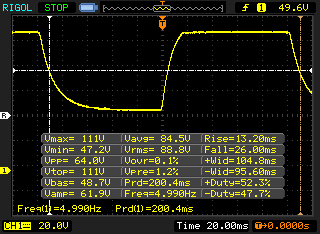 |
| ↘ 26 ms hösten | ||
| Skärmen visar relativt långsamma svarsfrekvenser i våra tester och kan vara för långsam för spelare. I jämförelse sträcker sig alla testade enheter från 0.165 (minst) till 636 (maximalt) ms. » 39 % av alla enheter är bättre. Det betyder att den uppmätta svarstiden liknar genomsnittet av alla testade enheter (31 ms). | ||
| AnTuTu v7 - Total Score (sortera efter värde) | |
| Apple iPhone 11 | |
| Samsung Galaxy S10e | |
| Huawei P30 | |
| LG G8s ThinQ | |
| Xiaomi Mi 9 | |
| Apple iPad Pro 11 2018 | |
| Genomsnitt Apple A13 Bionic (456891 - 462516, n=3) | |
| Jetstream 2 - 2.0 Total | |
| Genomsnitt av klass Smartphone (60.2 - 423, n=126, senaste 2 åren) | |
| Genomsnitt Apple A13 Bionic (128.5 - 142.2, n=5) | |
| Apple iPhone 11 (Safari Mobile 13.0) | |
| Xiaomi Mi 9 (Chrome 73) | |
| LG G8s ThinQ (Chrome 75) | |
| Huawei P30 (Chrome 73) | |
| JetStream 1.1 - 1.1 Total | |
| Apple iPhone 11 (Safari Mobile 13.0) | |
| Genomsnitt Apple A13 Bionic (279 - 302, n=5) | |
| Apple iPad Pro 11 2018 (Safari 13) | |
| Apple iPhone XR (Safari Mobile 12.0) | |
| Xiaomi Mi 9 (Chrome 73.0.3683.75) | |
| Huawei P30 (Chrome 73) | |
| LG G8s ThinQ (Chrome 75) | |
| Speedometer 2.0 - Result 2.0 | |
| Genomsnitt av klass Smartphone (49.3 - 733, n=89, senaste 2 åren) | |
| Genomsnitt Apple A13 Bionic (153 - 171, n=5) | |
| Apple iPhone 11 (Safari Mobile 13.0) | |
| Apple iPad Pro 11 2018 (IOS 12.1.1) | |
| Xiaomi Mi 9 (Chrome 73.0.3683.75) | |
| LG G8s ThinQ (Chome 75) | |
| Huawei P30 (Chrome 73) | |
| WebXPRT 3 - Overall | |
| Apple iPhone 11 (Safari Mobile 13.0) | |
| Genomsnitt Apple A13 Bionic (146 - 202, n=5) | |
| Genomsnitt av klass Smartphone (104 - 380, n=12, senaste 2 åren) | |
| Apple iPad Pro 11 2018 (Safari 13) | |
| Apple iPhone XR (Safari Mobile 12.0) | |
| Xiaomi Mi 9 (Chrome 73.0.3683.75) | |
| LG G8s ThinQ (Chrome 75) | |
| Huawei P30 (Chrome 73) | |
| Octane V2 - Total Score | |
| Genomsnitt av klass Smartphone (2800 - 126661, n=157, senaste 2 åren) | |
| Apple iPhone 11 (Safari Mobile 13.0) | |
| Genomsnitt Apple A13 Bionic (47288 - 49388, n=5) | |
| Apple iPad Pro 11 2018 (Safari 13) | |
| Apple iPhone XR (Safari Mobile 12.0) | |
| Xiaomi Mi 9 (Chrome 73.0.3683.75) | |
| LG G8s ThinQ (Chrome 75) | |
| Huawei P30 (Chrome 73) | |
| Samsung Galaxy S10e (Chrome 73) | |
| Mozilla Kraken 1.1 - Total | |
| Samsung Galaxy S10e (Chrome 73) | |
| Huawei P30 (Chrome 73) | |
| LG G8s ThinQ (Chrome 75) | |
| Xiaomi Mi 9 (Chrome 73.0.3683.75) | |
| Genomsnitt av klass Smartphone (257 - 28190, n=135, senaste 2 åren) | |
| Apple iPhone XR (Safari Mobile 12.0) | |
| Apple iPad Pro 11 2018 (Safari 13) | |
| Apple iPhone 11 (Safari Mobile 13.0) | |
| Genomsnitt Apple A13 Bionic (545 - 573, n=5) | |
* ... mindre är bättre
PUBG Mobile
Asphalt 9
(±) Den maximala temperaturen på ovansidan är 41.7 °C / 107 F, jämfört med genomsnittet av 35.3 °C / 96 F , allt från 21.9 till 247 °C för klassen Smartphone.
(+) Botten värms upp till maximalt 39.1 °C / 102 F, jämfört med genomsnittet av 34 °C / 93 F
(±) Vid tomgångsbruk är medeltemperaturen för ovansidan 33.7 °C / 93 F, jämfört med enhetsgenomsnittet på 33 °C / ### class_avg_f### F.
Apple iPhone 11 ljudanalys
(+) | högtalare kan spela relativt högt (83.4 dB)
Bas 100 - 315 Hz
(±) | reducerad bas - i genomsnitt 13.5% lägre än medianen
(±) | linjäriteten för basen är genomsnittlig (13.6% delta till föregående frekvens)
Mellan 400 - 2000 Hz
(±) | högre mellan - i genomsnitt 5.3% högre än median
(+) | mids är linjära (5.4% delta till föregående frekvens)
Högsta 2 - 16 kHz
(±) | högre toppar - i genomsnitt 10.3% högre än medianen
(+) | toppar är linjära (4.6% delta till föregående frekvens)
Totalt 100 - 16 000 Hz
(±) | linjäriteten för det totala ljudet är genomsnittlig (21.4% skillnad mot median)
Jämfört med samma klass
» 42% av alla testade enheter i den här klassen var bättre, 8% liknande, 50% sämre
» Den bästa hade ett delta på 11%, genomsnittet var 34%, sämst var 134%
Jämfört med alla testade enheter
» 60% av alla testade enheter var bättre, 7% liknande, 33% sämre
» Den bästa hade ett delta på 4%, genomsnittet var 24%, sämst var 134%
Samsung Galaxy S10e ljudanalys
(+) | högtalare kan spela relativt högt (83 dB)
Bas 100 - 315 Hz
(-) | nästan ingen bas - i genomsnitt 69.2% lägre än medianen
(+) | basen är linjär (0% delta till föregående frekvens)
Mellan 400 - 2000 Hz
(-) | nästan inga mids - i genomsnitt 69.2% lägre än medianen
(+) | mids är linjära (0% delta till föregående frekvens)
Högsta 2 - 16 kHz
(-) | nästan inga toppar - i genomsnitt 69.2% lägre än medianen
(+) | toppar är linjära (0% delta till föregående frekvens)
Totalt 100 - 16 000 Hz
(-) | det totala ljudet är inte linjärt (121.7% skillnad mot median)
Jämfört med samma klass
» 91% av alla testade enheter i den här klassen var bättre, 7% liknande, 2% sämre
» Den bästa hade ett delta på 11%, genomsnittet var 34%, sämst var 134%
Jämfört med alla testade enheter
» 97% av alla testade enheter var bättre, 2% liknande, 1% sämre
» Den bästa hade ett delta på 4%, genomsnittet var 24%, sämst var 134%
| Av/Standby | |
| Låg belastning | |
| Hög belastning |
|
Förklaring:
min: | |
| Apple iPhone 11 3110 mAh | Apple iPhone XR 2942 mAh | Samsung Galaxy S10e 3100 mAh | Huawei P30 3650 mAh | LG G8s ThinQ 3550 mAh | Xiaomi Mi 9 3300 mAh | Genomsnitt Apple A13 Bionic | Genomsnitt av klass Smartphone | |
|---|---|---|---|---|---|---|---|---|
| Power Consumption | 1% | -2% | -2% | -28% | 7% | -19% | -26% | |
| Idle Minimum * (Watt) | 0.56 | 0.61 -9% | 0.6 -7% | 0.69 -23% | 1.2 -114% | 0.67 -20% | 0.76 ? -36% | 0.871 ? -56% |
| Idle Average * (Watt) | 2.99 | 2.67 11% | 1.2 60% | 2.41 19% | 1.6 46% | 1.26 58% | 3.39 ? -13% | 1.464 ? 51% |
| Idle Maximum * (Watt) | 3.02 | 2.69 11% | 1.5 50% | 2.51 17% | 2 34% | 1.29 57% | 3.44 ? -14% | 1.652 ? 45% |
| Load Average * (Watt) | 4.17 | 4.34 -4% | 5.2 -25% | 3.86 7% | 5 -20% | 3.71 11% | 4.66 ? -12% | 6.79 ? -63% |
| Load Maximum * (Watt) | 5.44 | 5.66 -4% | 10.2 -87% | 6.96 -28% | 10 -84% | 9.3 -71% | 6.42 ? -18% | 11.3 ? -108% |
* ... mindre är bättre
| Apple iPhone 11 3110 mAh | Apple iPhone XR 2942 mAh | Samsung Galaxy S10e 3100 mAh | Huawei P30 3650 mAh | LG G8s ThinQ 3550 mAh | Xiaomi Mi 9 3300 mAh | |
|---|---|---|---|---|---|---|
| Batteridrifttid | 0% | -45% | -20% | -29% | -30% | |
| Reader / Idle (h) | 46.1 | 49.5 7% | 19.8 -57% | 31.9 -31% | 28.2 -39% | 27.5 -40% |
| H.264 (h) | 19.1 | 16.9 -12% | 13.3 -30% | 17.5 -8% | 12.6 -34% | 16.8 -12% |
| WiFi v1.3 (h) | 14.4 | 15.2 6% | 6.9 -52% | 11.9 -17% | 11.6 -19% | 9.1 -37% |
| Load (h) | 4.5 | 4.5 0% | 2.7 -40% | 3.5 -22% | 3.4 -24% | 3.2 -29% |
För
Emot
Omdöme - En försiktig ansiktslyftning
Läs den fullständiga versionen av den här recensionen på engelska här.
Det som skiljer iPhone 11 från iPhone XR är en dubbel kamera på baksidan och ett lägre pris. Annars är det knappt något som ändrats mellan generationerna och A13 Bionic förbättrar egentligen bara vad som redan var en utmärkt SoC.
Med tanke på hur mycket iPhone 11 kostar tycker vi att Apple kunde ha utrustat den med en mer högkvalitativ skärm. LCD-panelen och den lägre upplösningen har sina fördelar, men att den har sämre svärta än föregångaren gjorde oss besvikna.
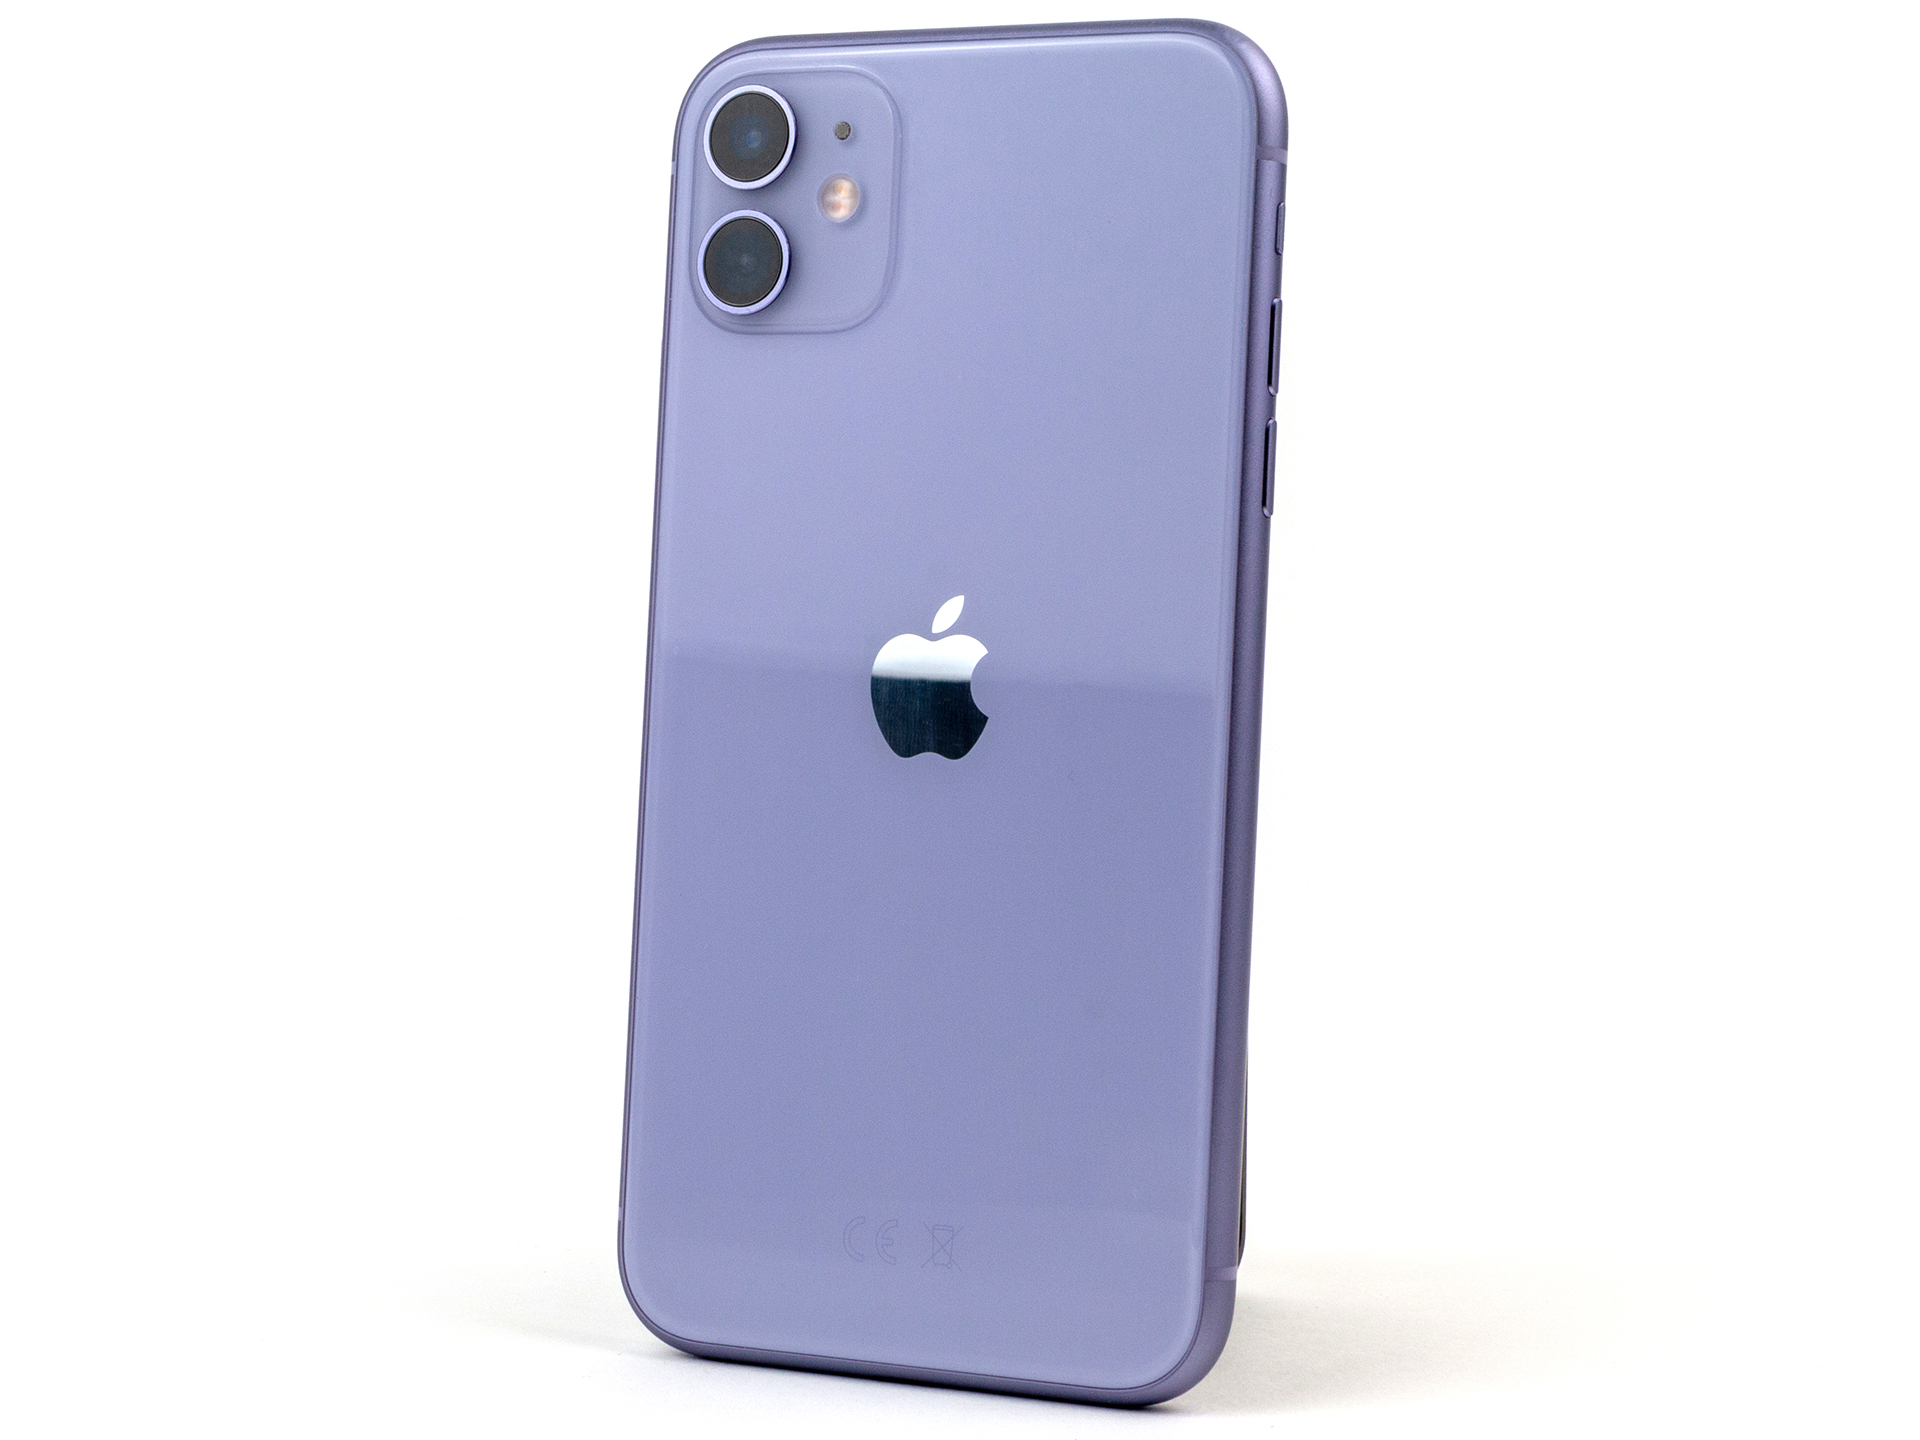
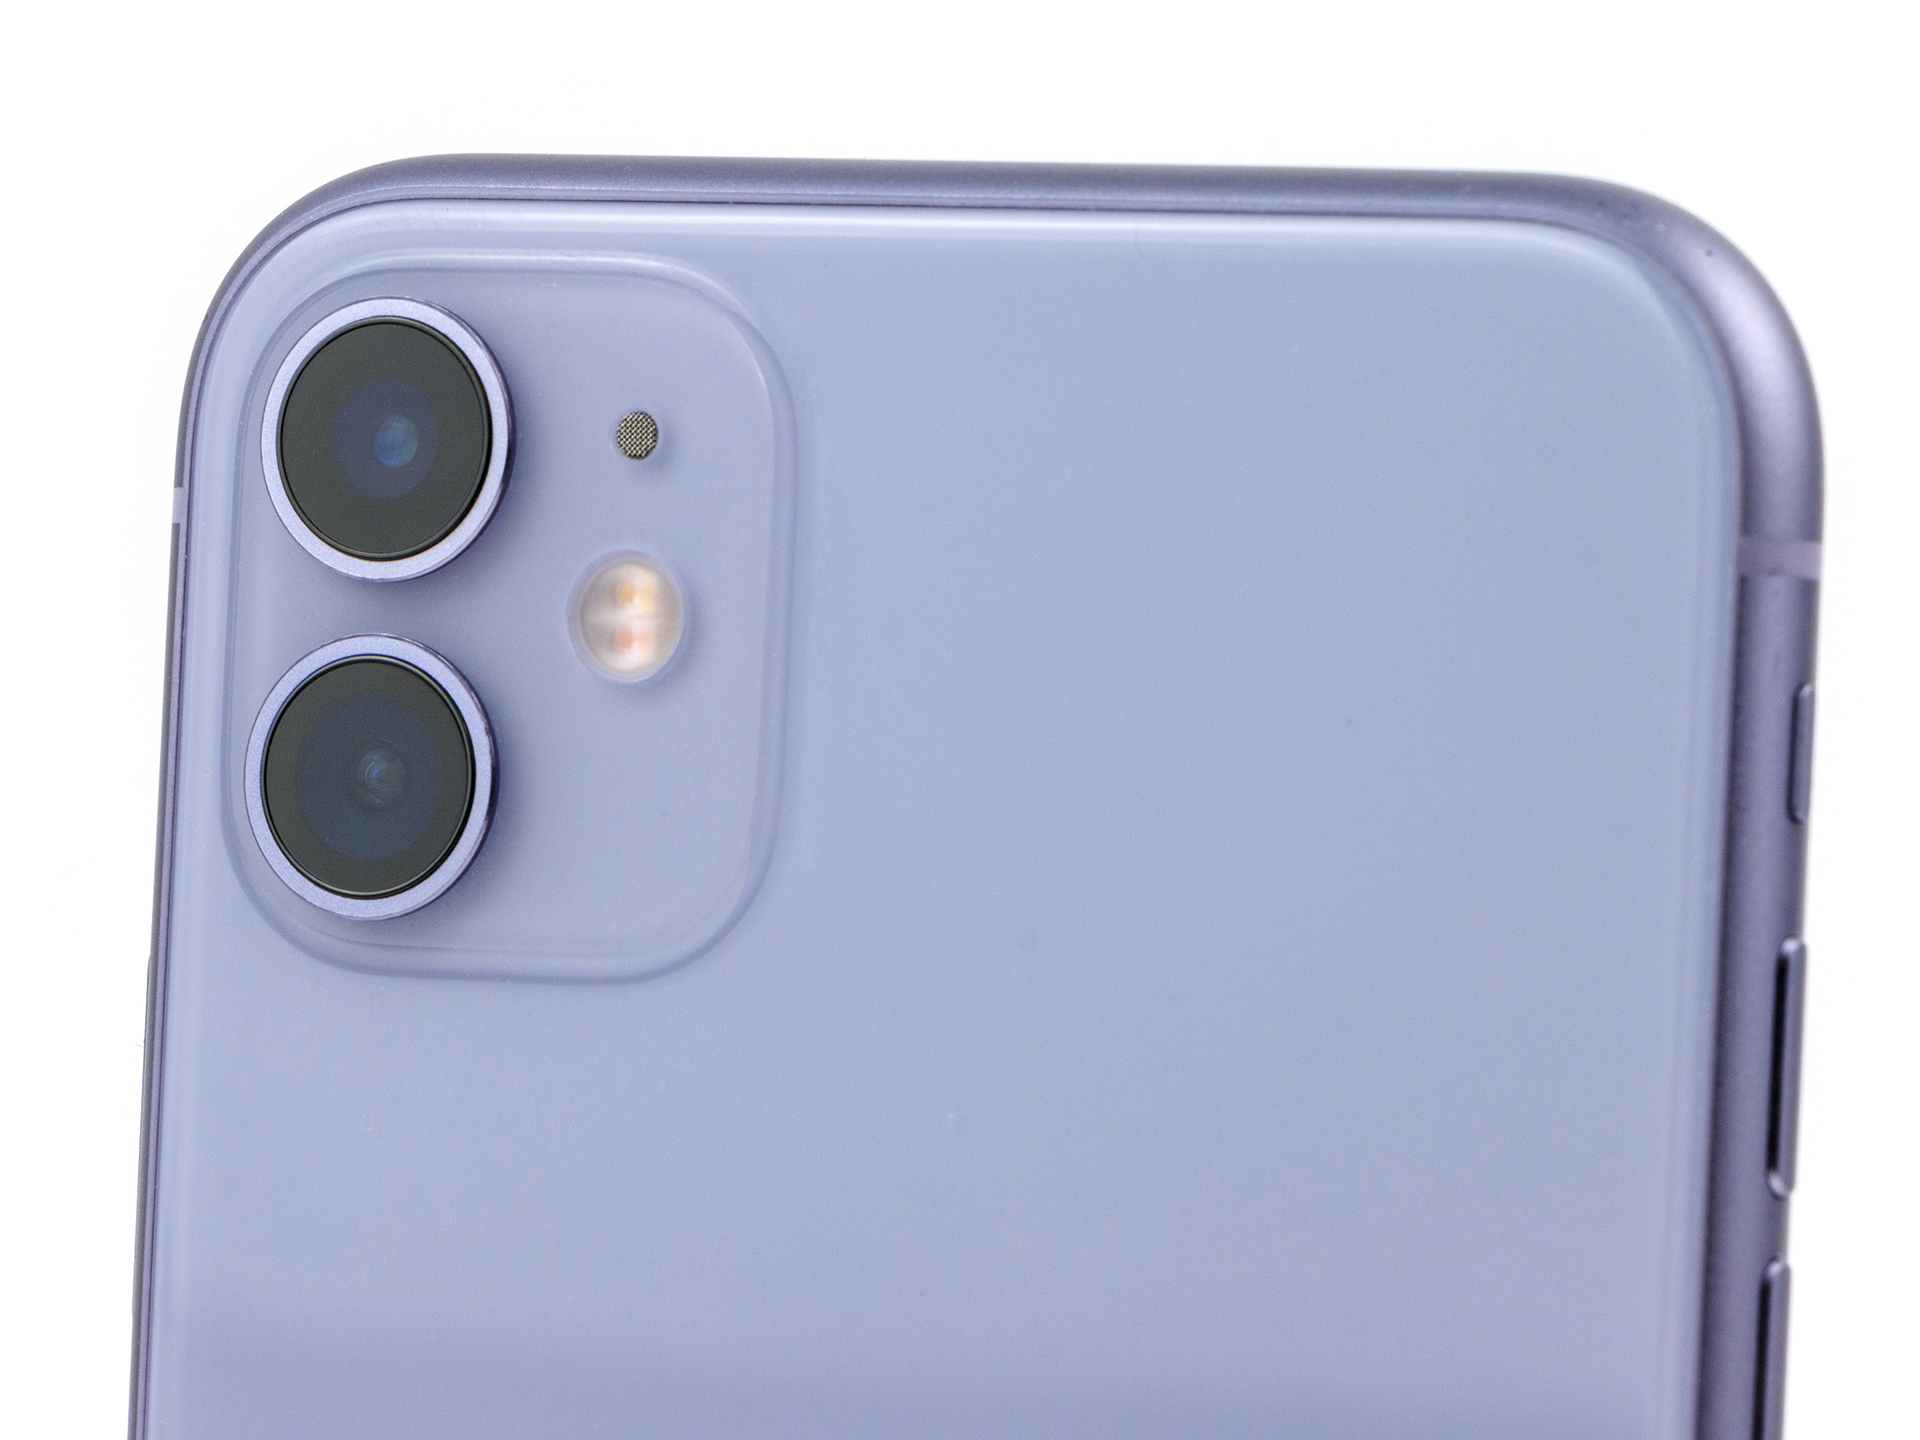
Apple har gjort en färgglad återkomst med iPhone 11. Den aningen bastanta telefonen har en skaplig uppsättning kameror på baksidan och fantastisk batteritid, men du får vara redo på att kompromissa på en del områden om du jämför den med iPhone 11 Pro och iPhone 11 Pro Max.
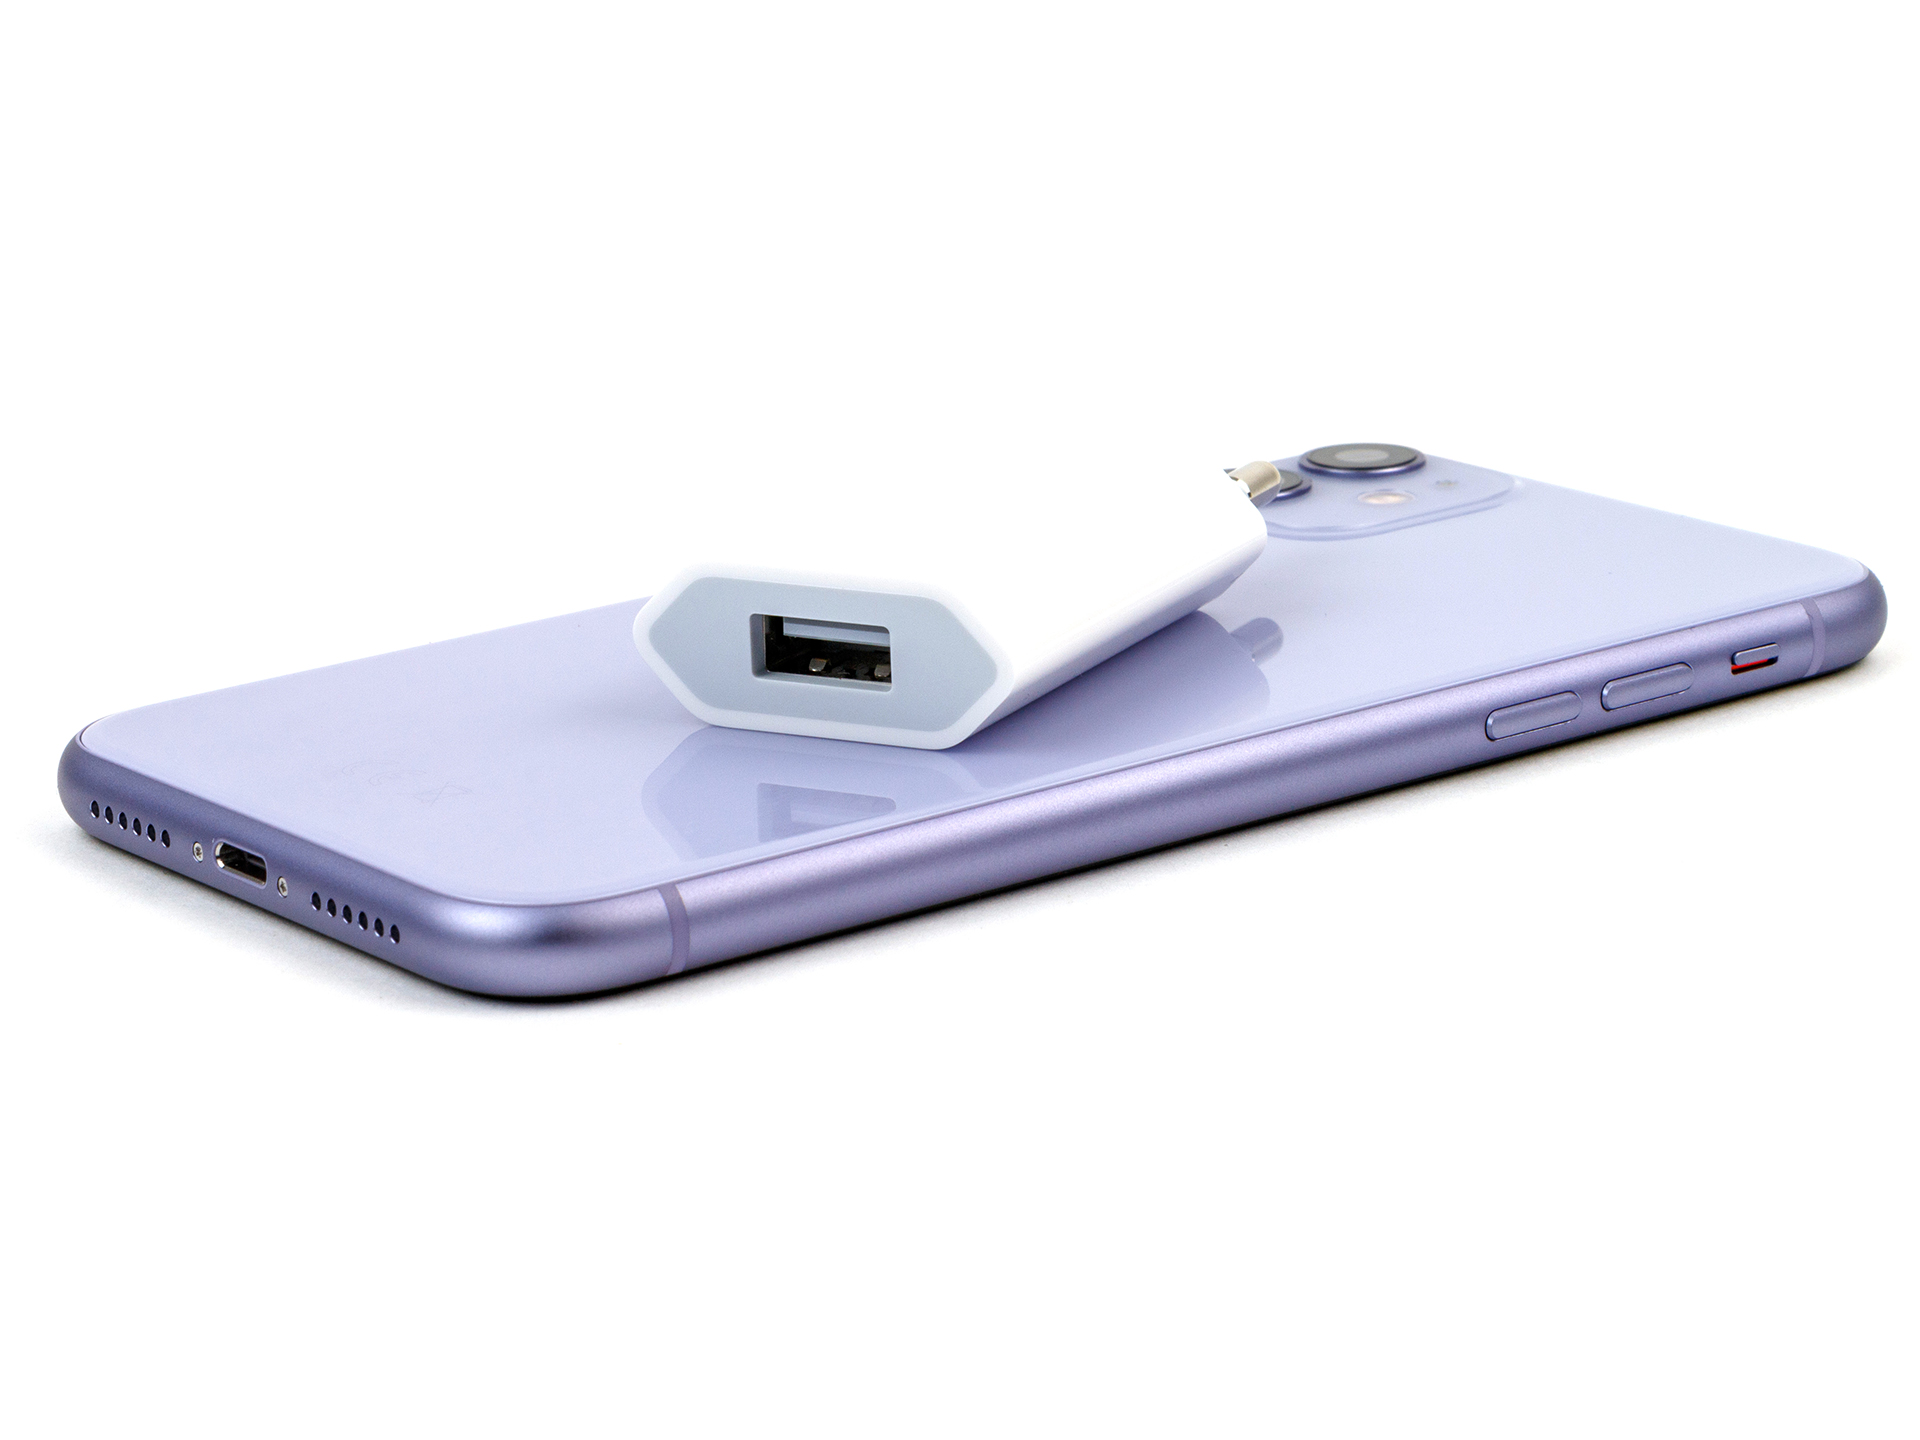
Vidare är laddaren som ingår sorgligt underdimensionerad - det var till och med så illa att vår recensionsenhet laddades ur om man använde den samtidigt som laddaren satt i. Dessutom har iPhone 11 förvånansvärt oprecis positionering och högtalarna kunde heller inte övertyga.
Totalt sett är iPhone 11 definitivt en bra smartphone och står för ett relativt billigt steg in i Apples ekosystem, men den är inte lika prisvärd som många andra jämförbara smartphones som finns där ute.
Apple iPhone 11
- 09/30/2019 v7 (old)
Daniel Schmidt
Price comparison
