Minisforum NUCXi7 desktop PC recension: Ultrasmal speldator med GeForce RTX 3070 och Core i7-11800H

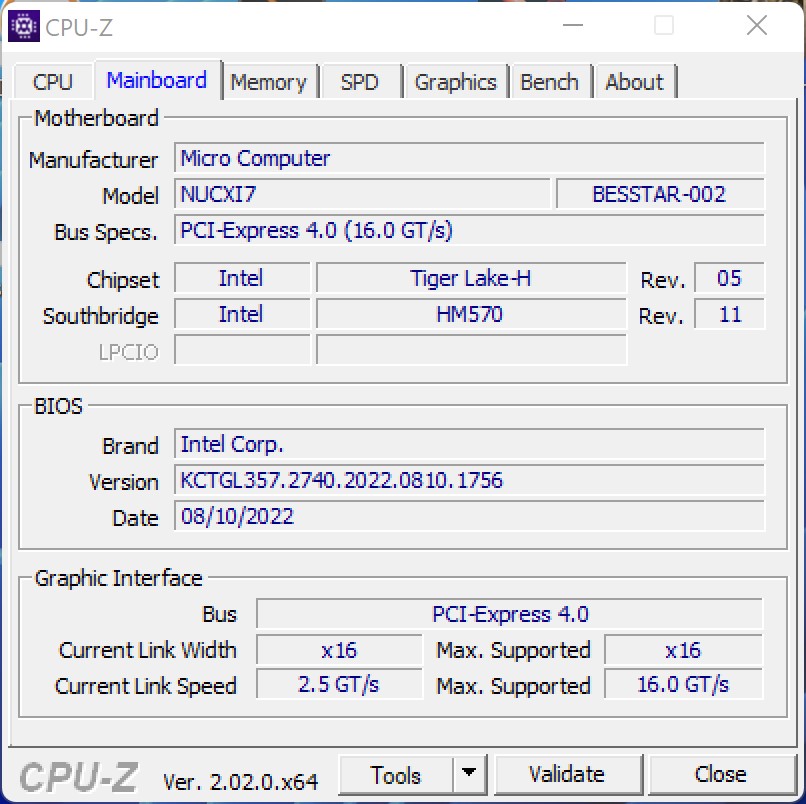
Minisforum är känt som en systemtillverkare för minidatorer i detta land (Tyskland). Med NUCX-serien siktar tillverkaren dock på en något annorlunda målgrupp och erbjuder en fullfjädrad speldator med den här modellen. Det här är inte en vanlig stationär dator, utan en ultrasmal dator med en hyfsad mängd kraft. Den är baserad på ett Intel NUC-XI5-moderkort för bärbara datorer, som också används i bärbara datorer.
NUCX finns för närvarande i två grundkonfigurationer som skiljer sig åt både i CPU:er och GPU:er. Å ena sidan finns Minisforum NUCXXi5, som är baserad på den Intel Core i5-11400Hi kombination med enNvidia GeForce RTX 3060 GPU för bärbar dator, och å andra sidan Minisforum NUCXi7 med enIntel Core i7-11800Hi kombination med en Nvidia GeForce RTX 3070 GPU för bärbar dator. När det gäller priset börjar modellerna som barebonesystem från 1 199 euro (~1 195 dollar) respektive 1 449 euro (~1 444 dollar). Vår testenhet, en NUCXi7 med 16 GB RAM och en 512 GB SSD, kostar 1 629 euro (~1 623 dollar) med Pro-versionen av Windows 11 redan förinstallerad.
I den här granskningen fungerar andra kompakta stationära datorer som jämförelseenheter. För att spegla den direkta prestandaförmånen för GPU-prestanda inkluderade vi även en liknande utrustad bärbar dator för spel i fältet av våra testkonkurrenter.
Potentiella konkurrenter i jämförelse
Gradering | Datum | Modell | Vikt | Höjd | Pris |
|---|---|---|---|---|---|
v7 (old) | 09/2022 | Minisforum NUCX i7 i7-11800H, GeForce RTX 3070 Laptop GPU | 2.4 kg | 393 mm | |
v (old) | 12/2021 | Intel Beast Canyon NUC i9-11900KB, GeForce RTX 3060 | 189 mm | ||
v (old) | Zotac Magnus One (ECM73070C) i7-10700, GeForce RTX 3070 | ||||
v (old) | 05/2022 | Zotac ZBOX Magnus EN173070C i7-11800H, GeForce RTX 3070 Laptop GPU | 1.8 kg | 62.2 mm | |
v (old) | 04/2022 | Intel Dragon Canyon NUC - RTX 3060 i9-12900, GeForce RTX 3060 | 189 mm | ||
v (old) | Zotac MEK Mini (RTX 2070 Super) i7-9700, GeForce RTX 2070 Super (Desktop) | ||||
| 83.2 % v7 (old) | 10/2021 | Gigabyte A7 X1 R9 5900HX, GeForce RTX 3070 Laptop GPU | 2.5 kg | 34 mm |
Minisforum NUCXi7 i detalj
Fall
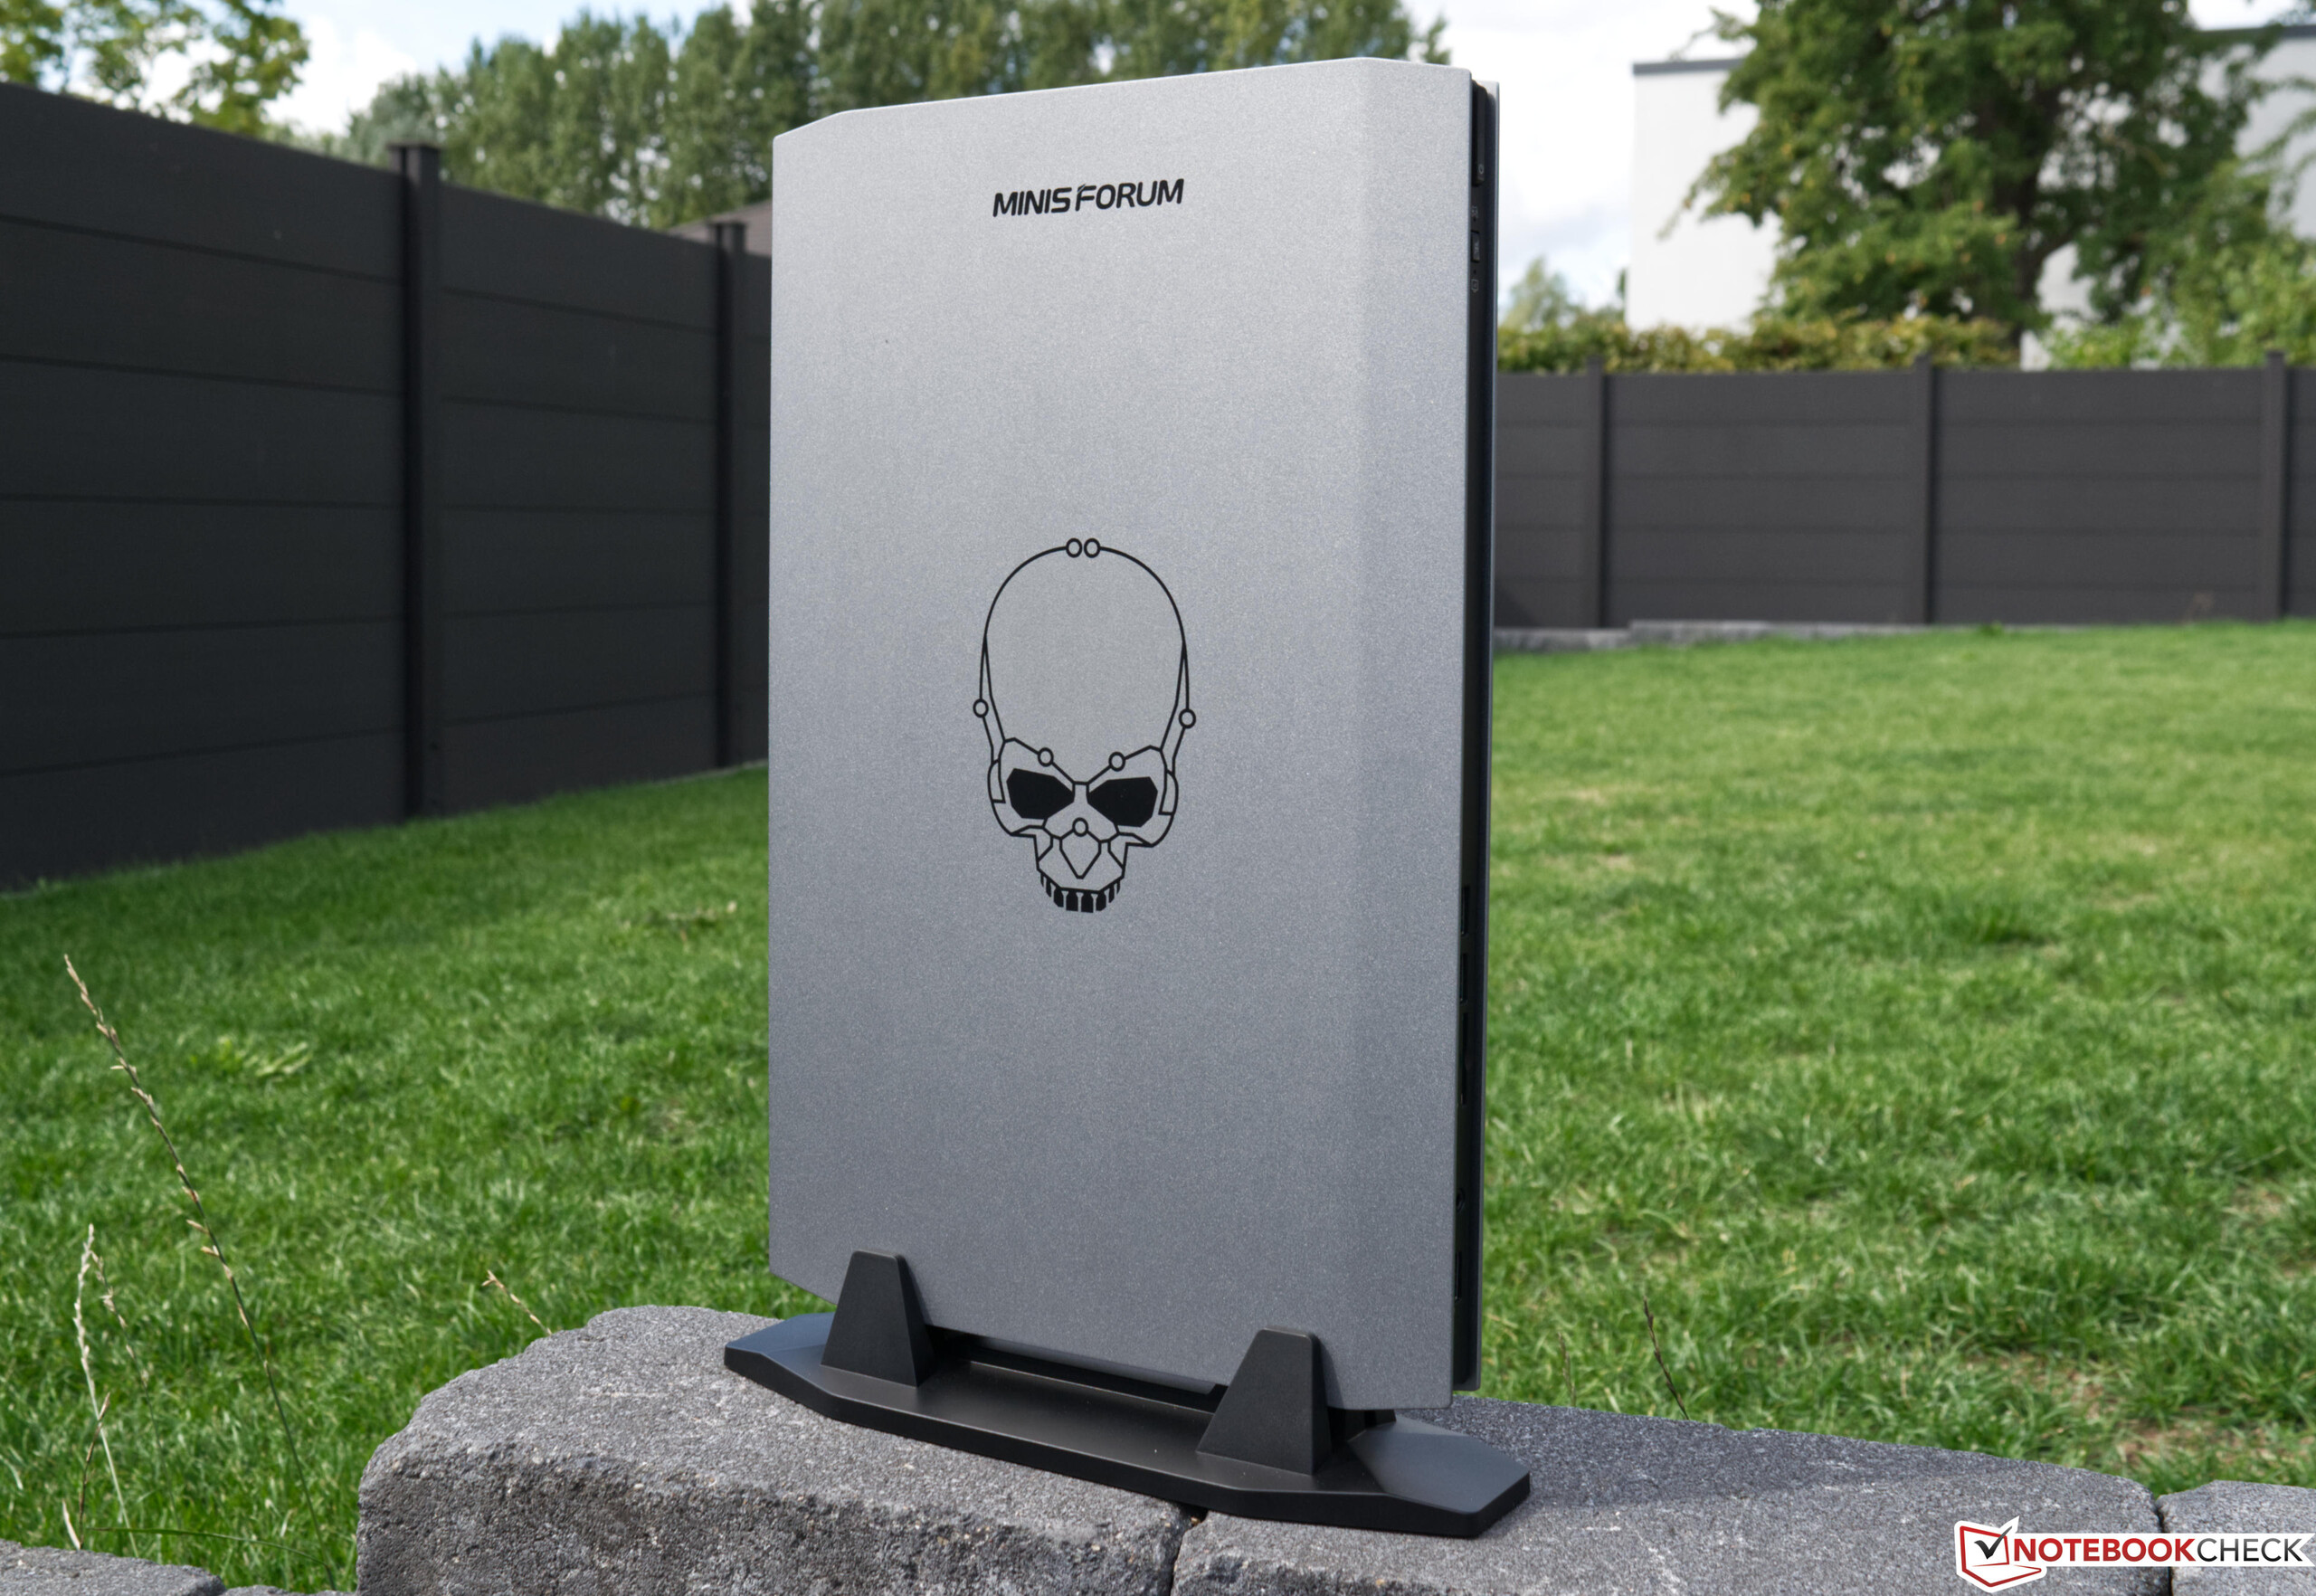
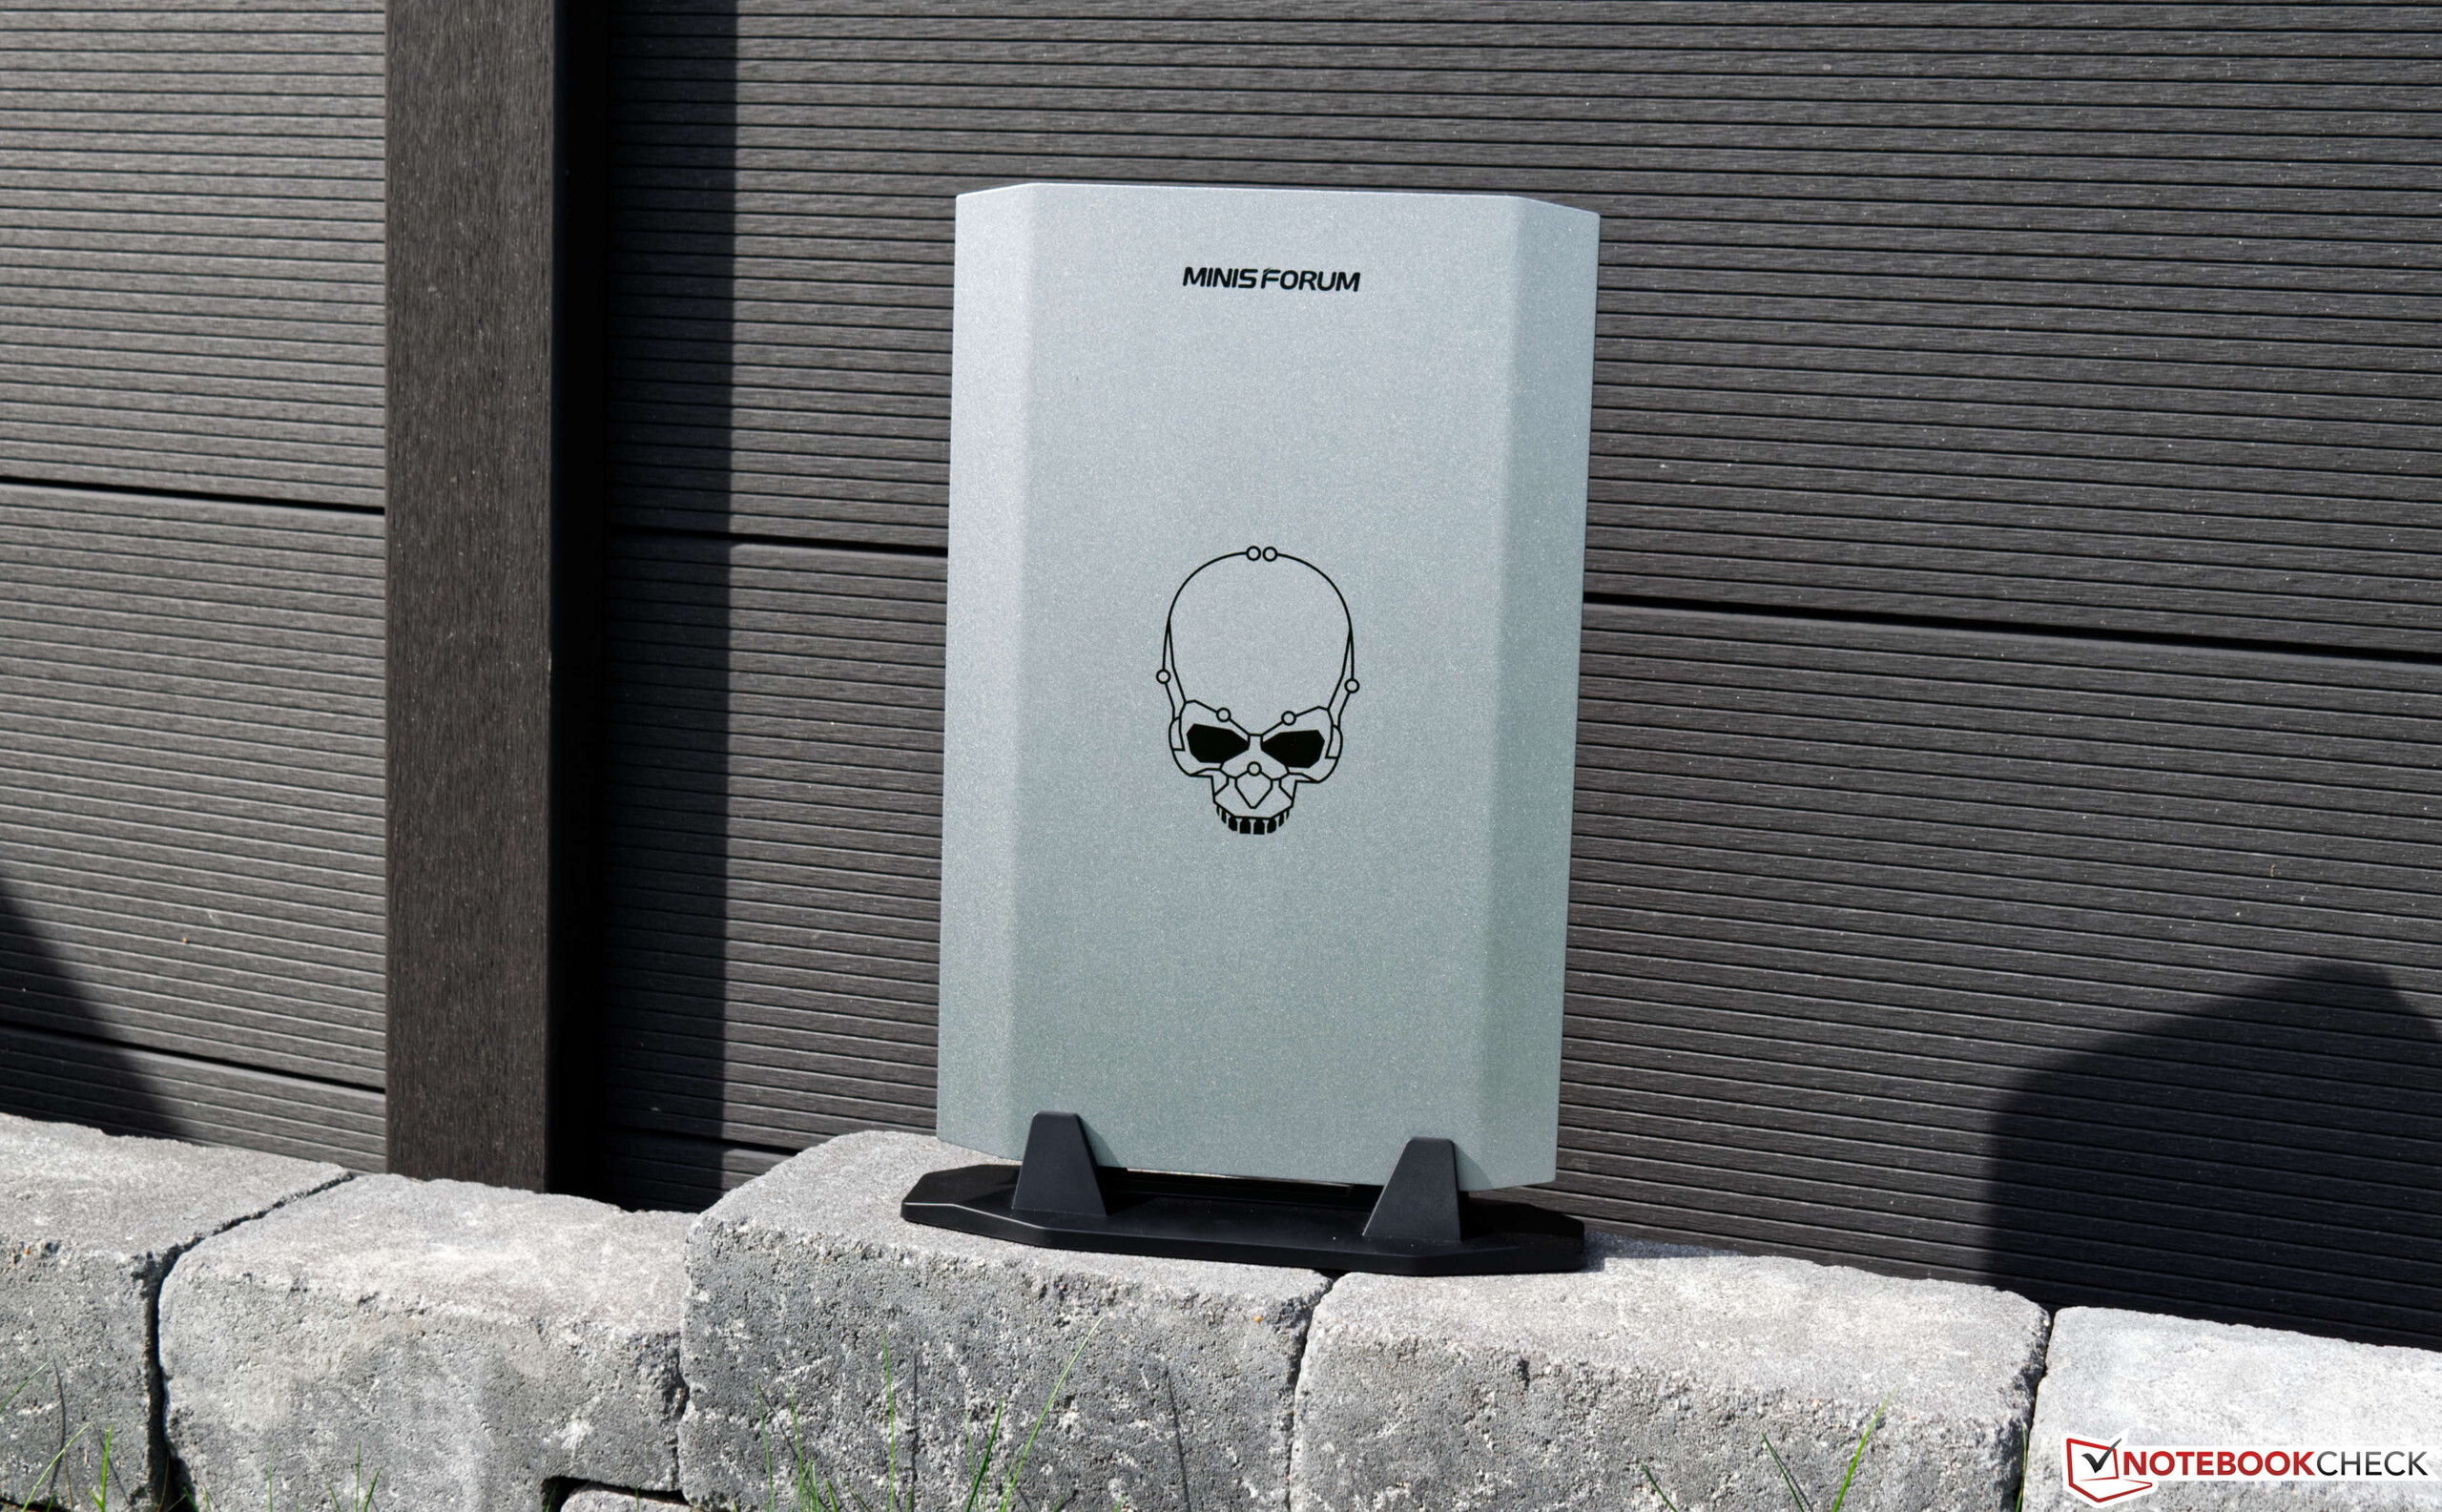
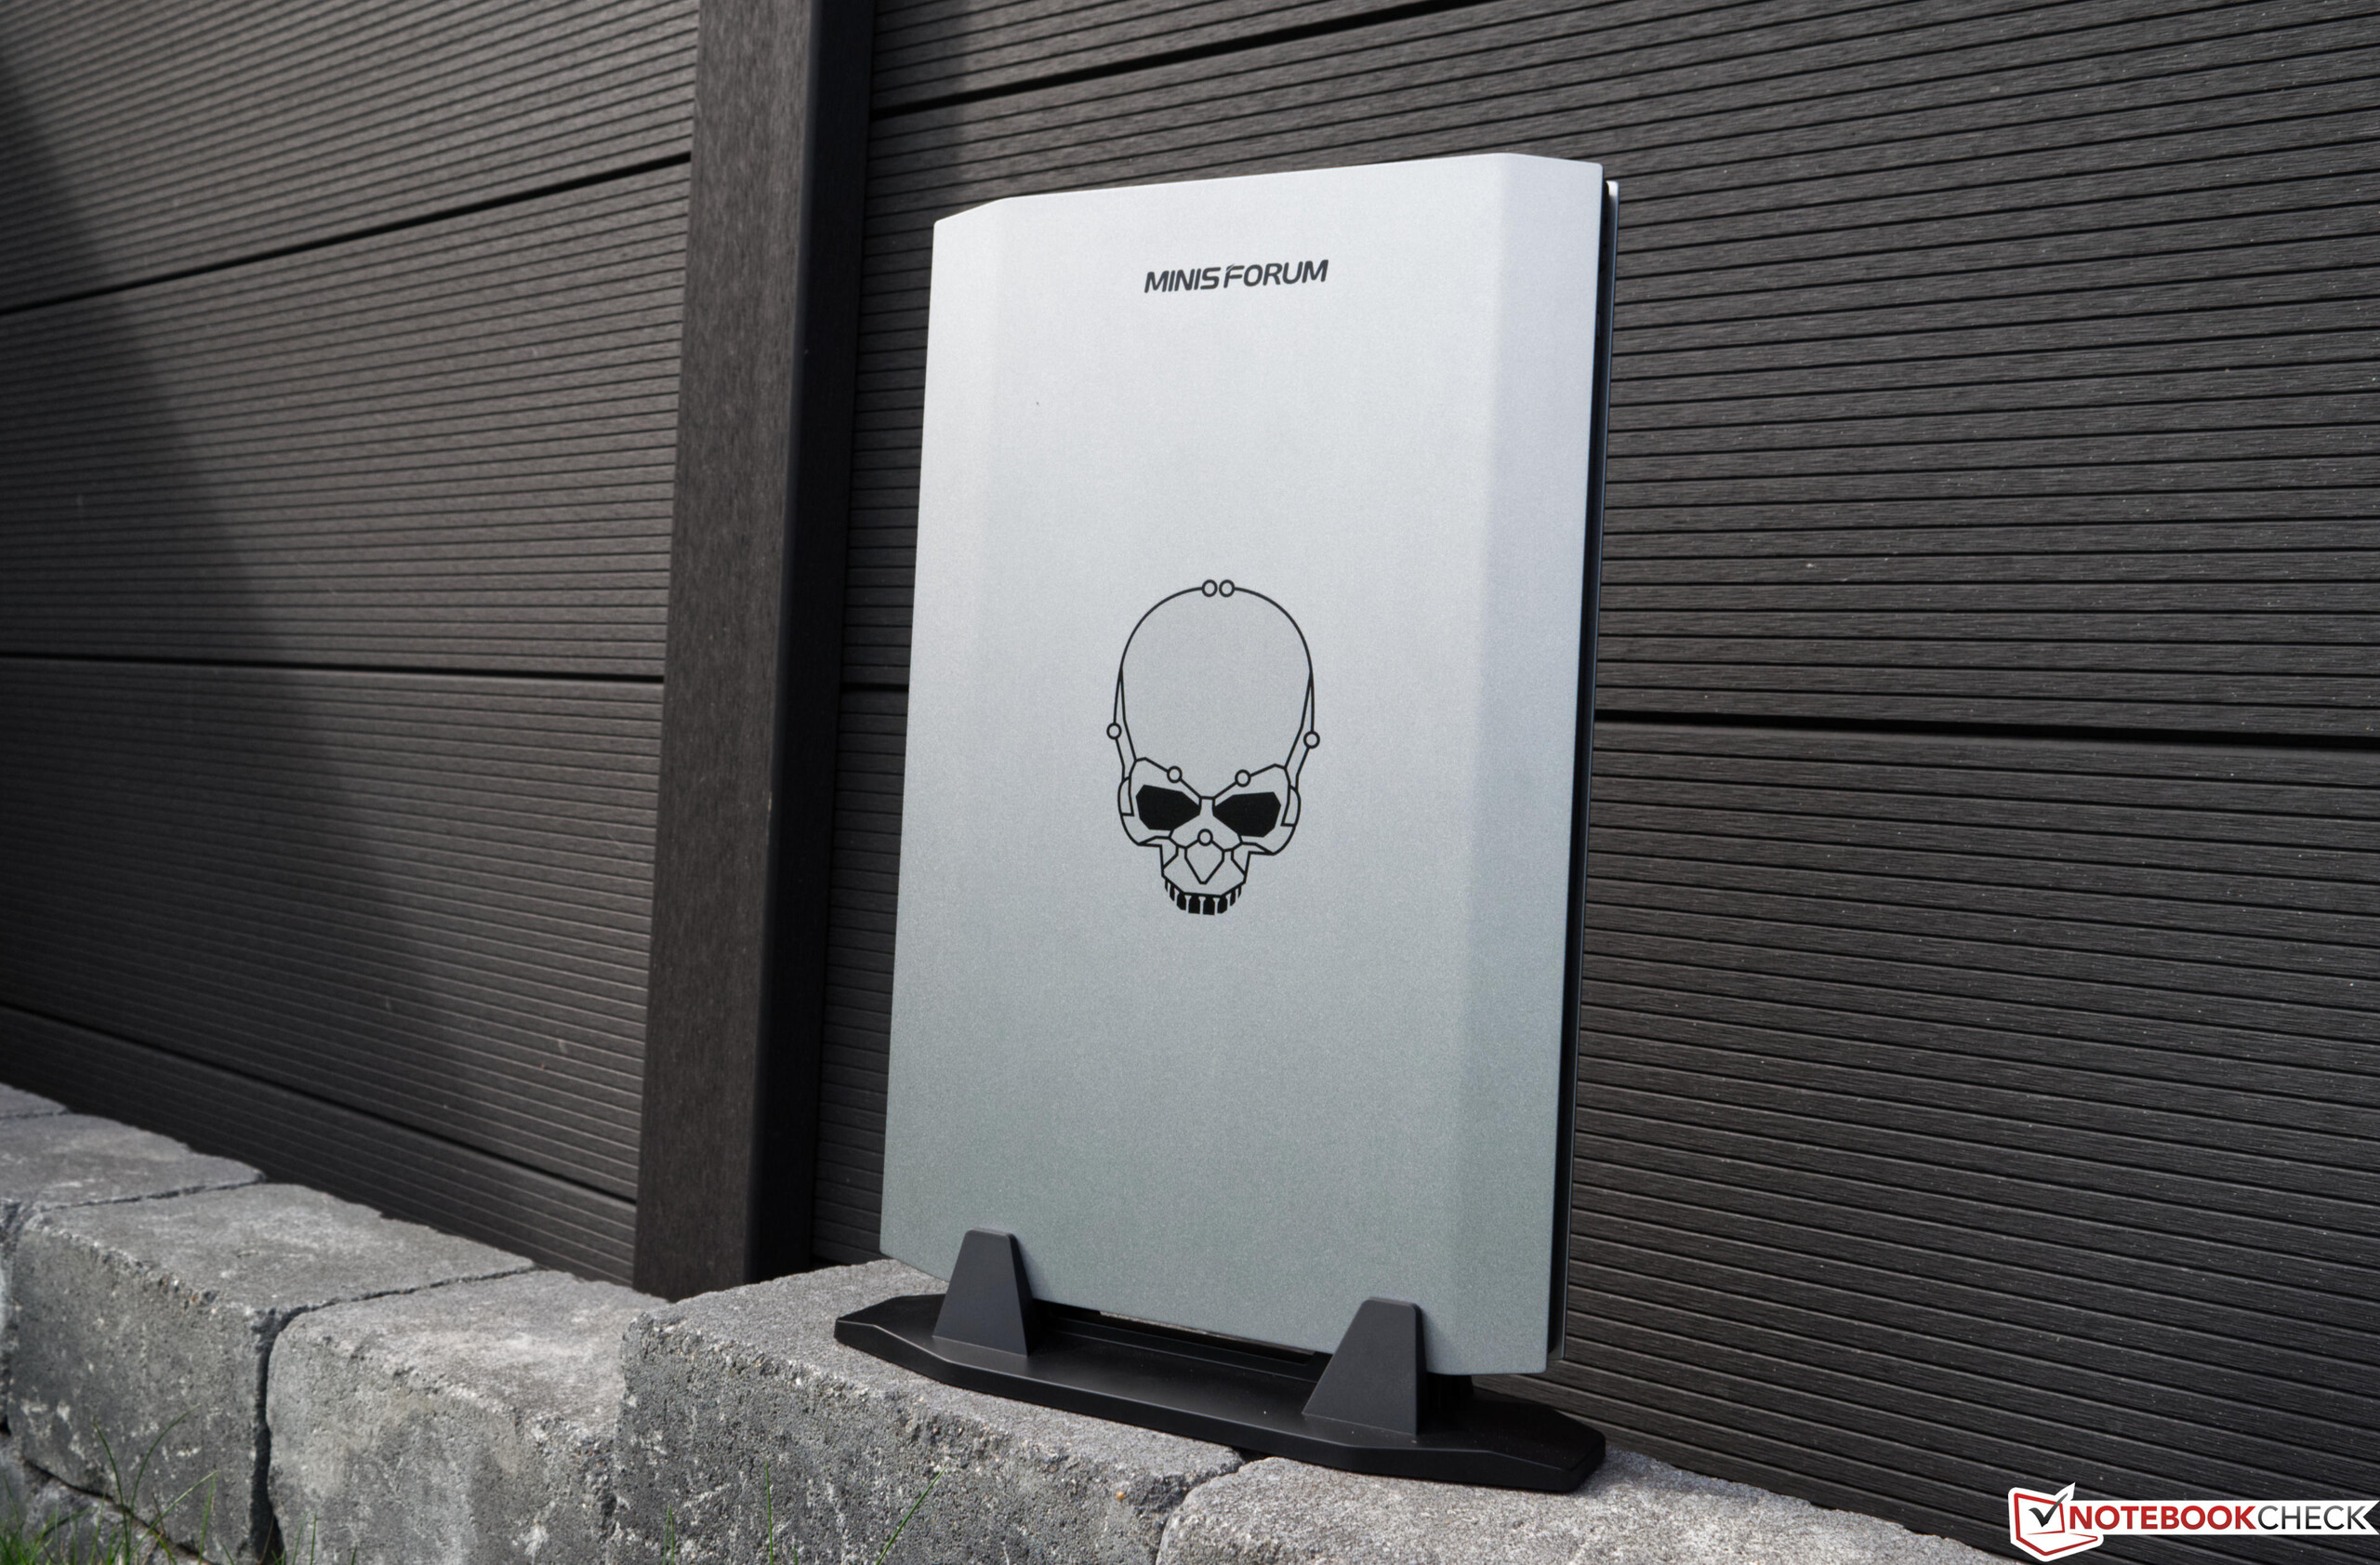
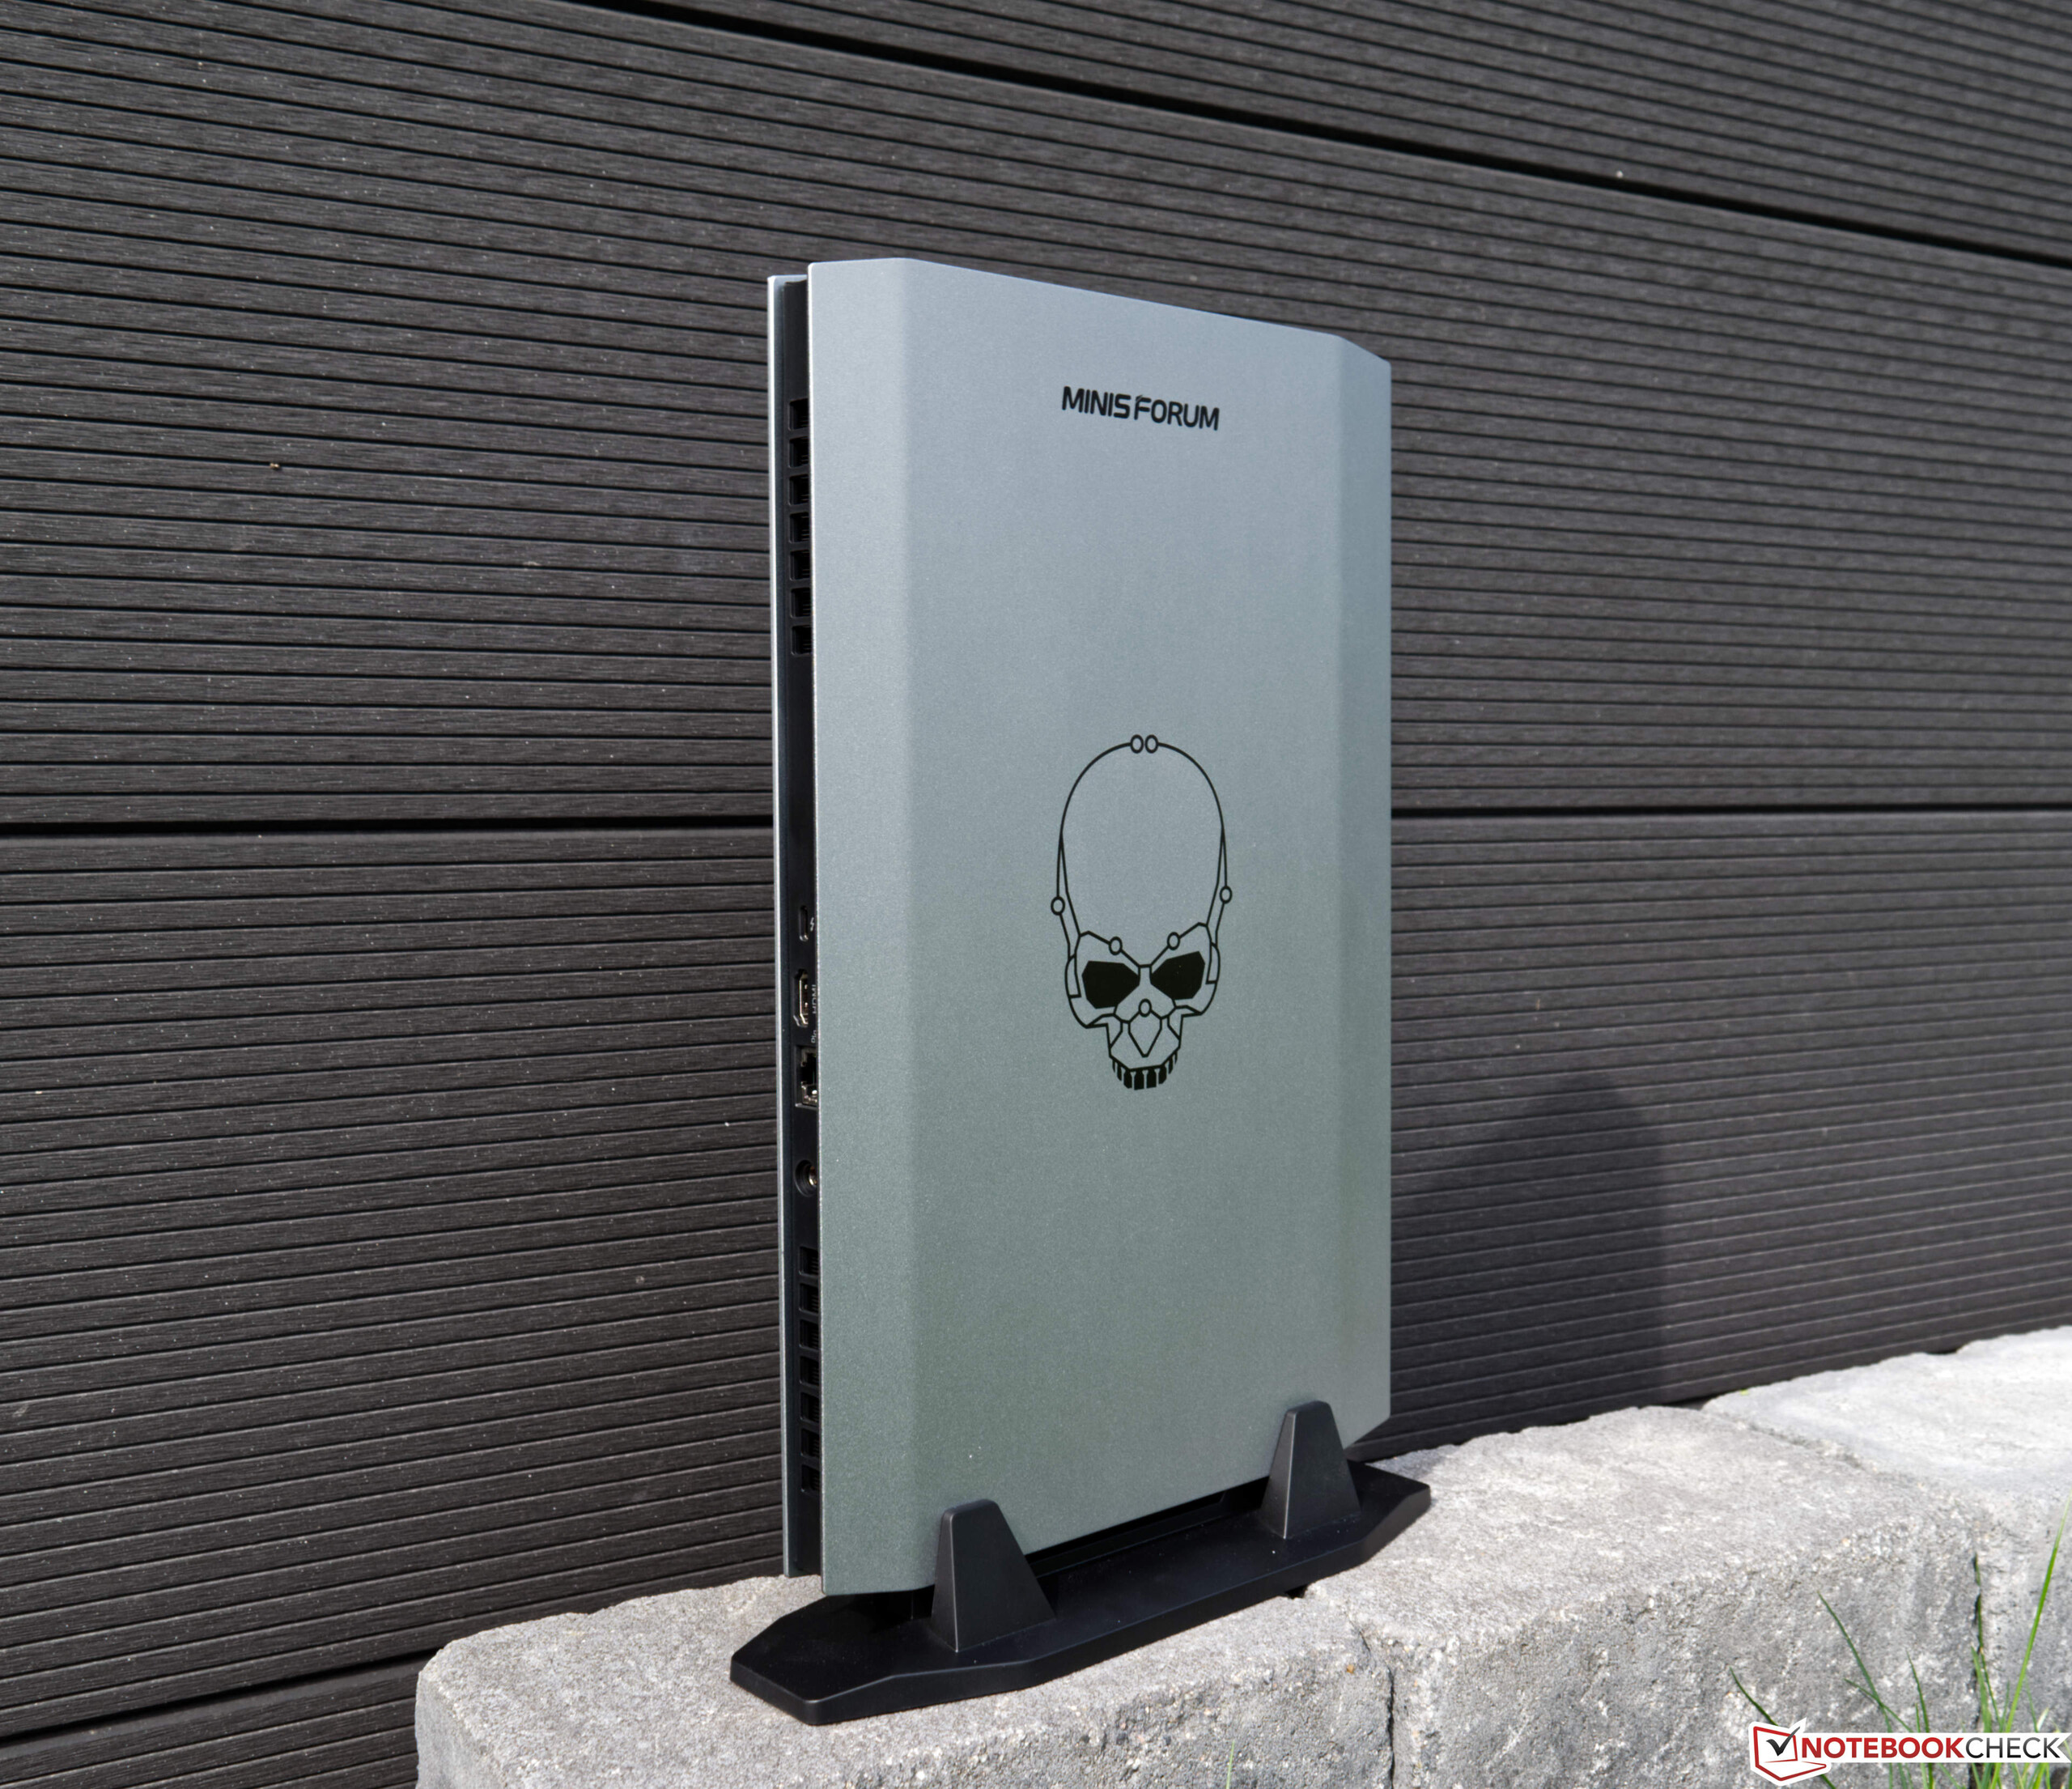
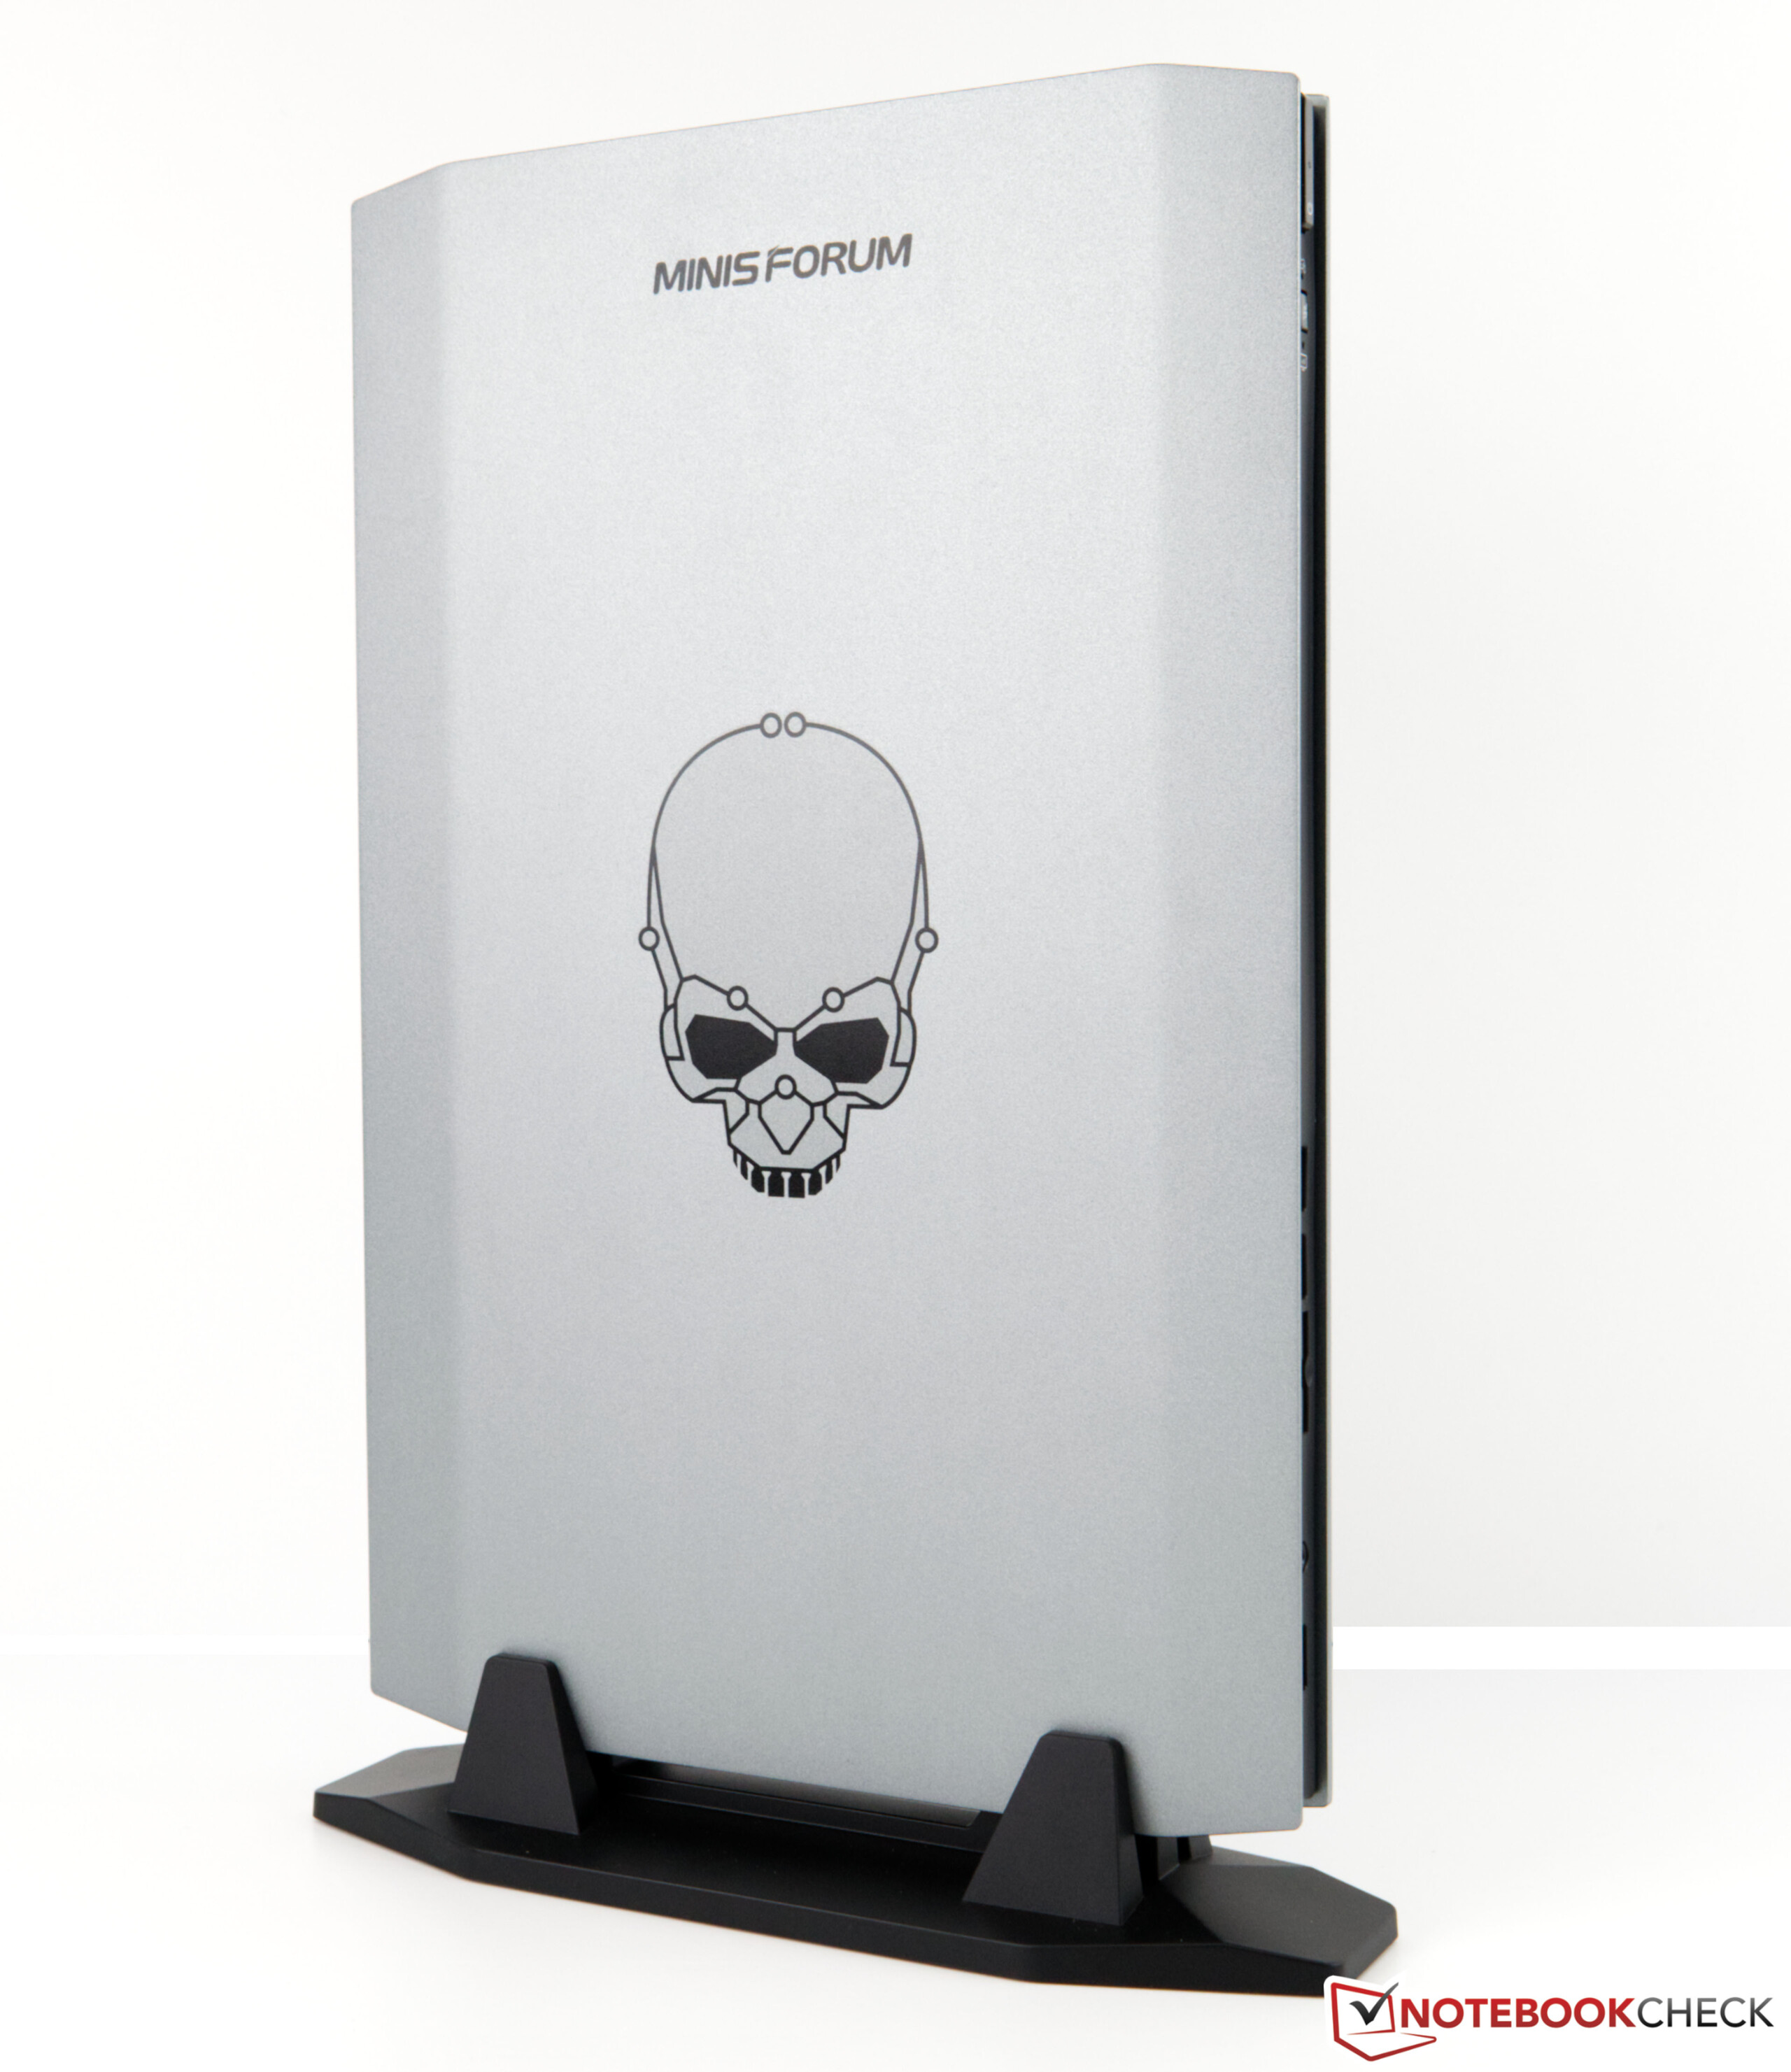
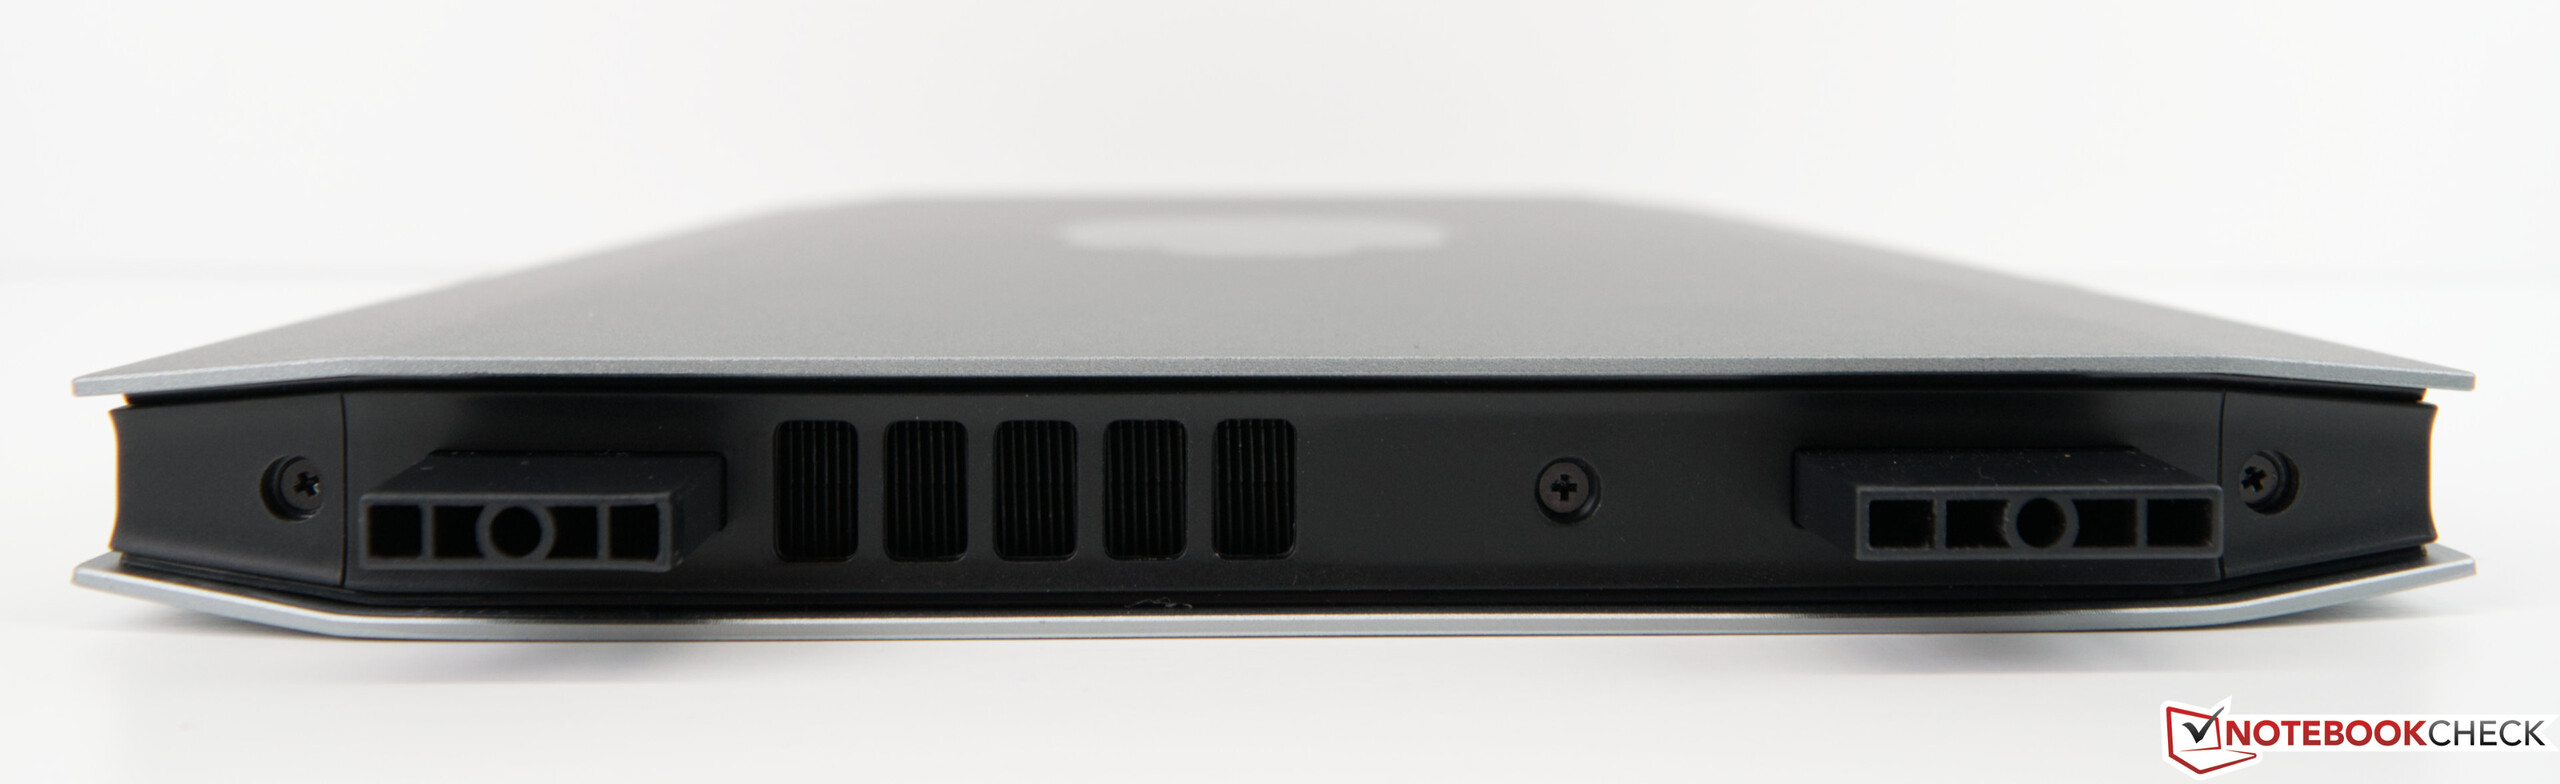
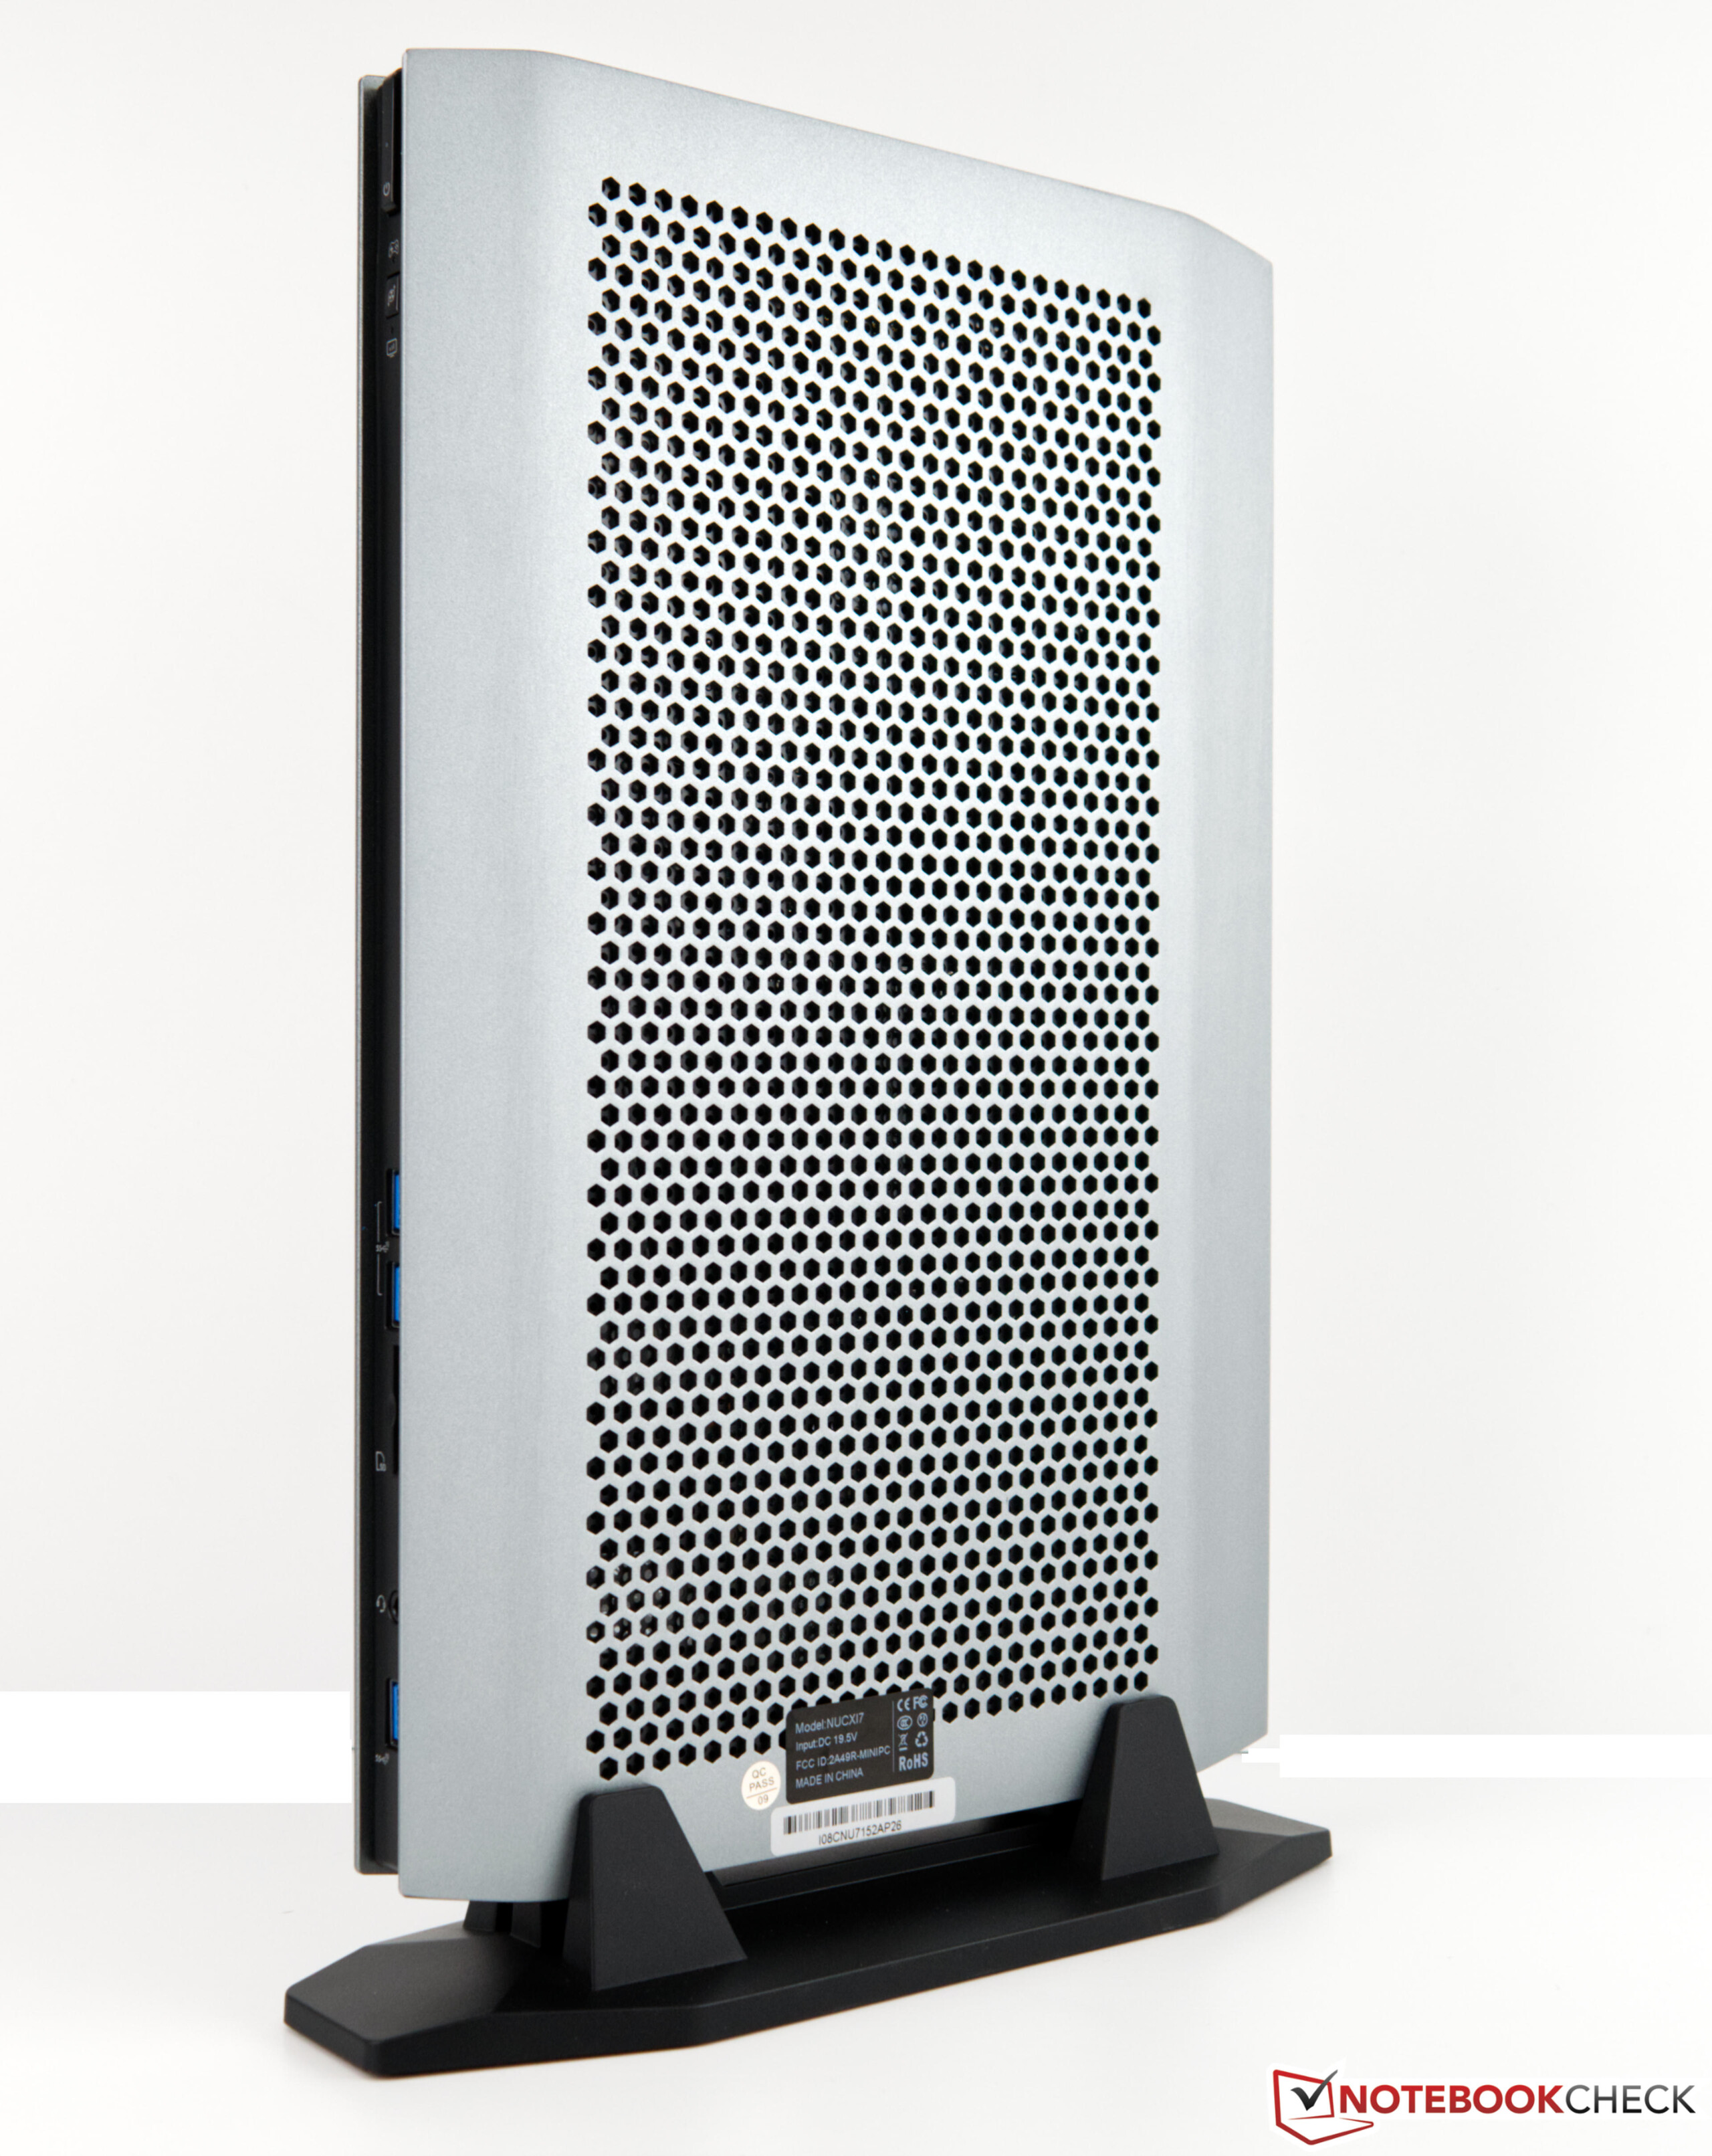
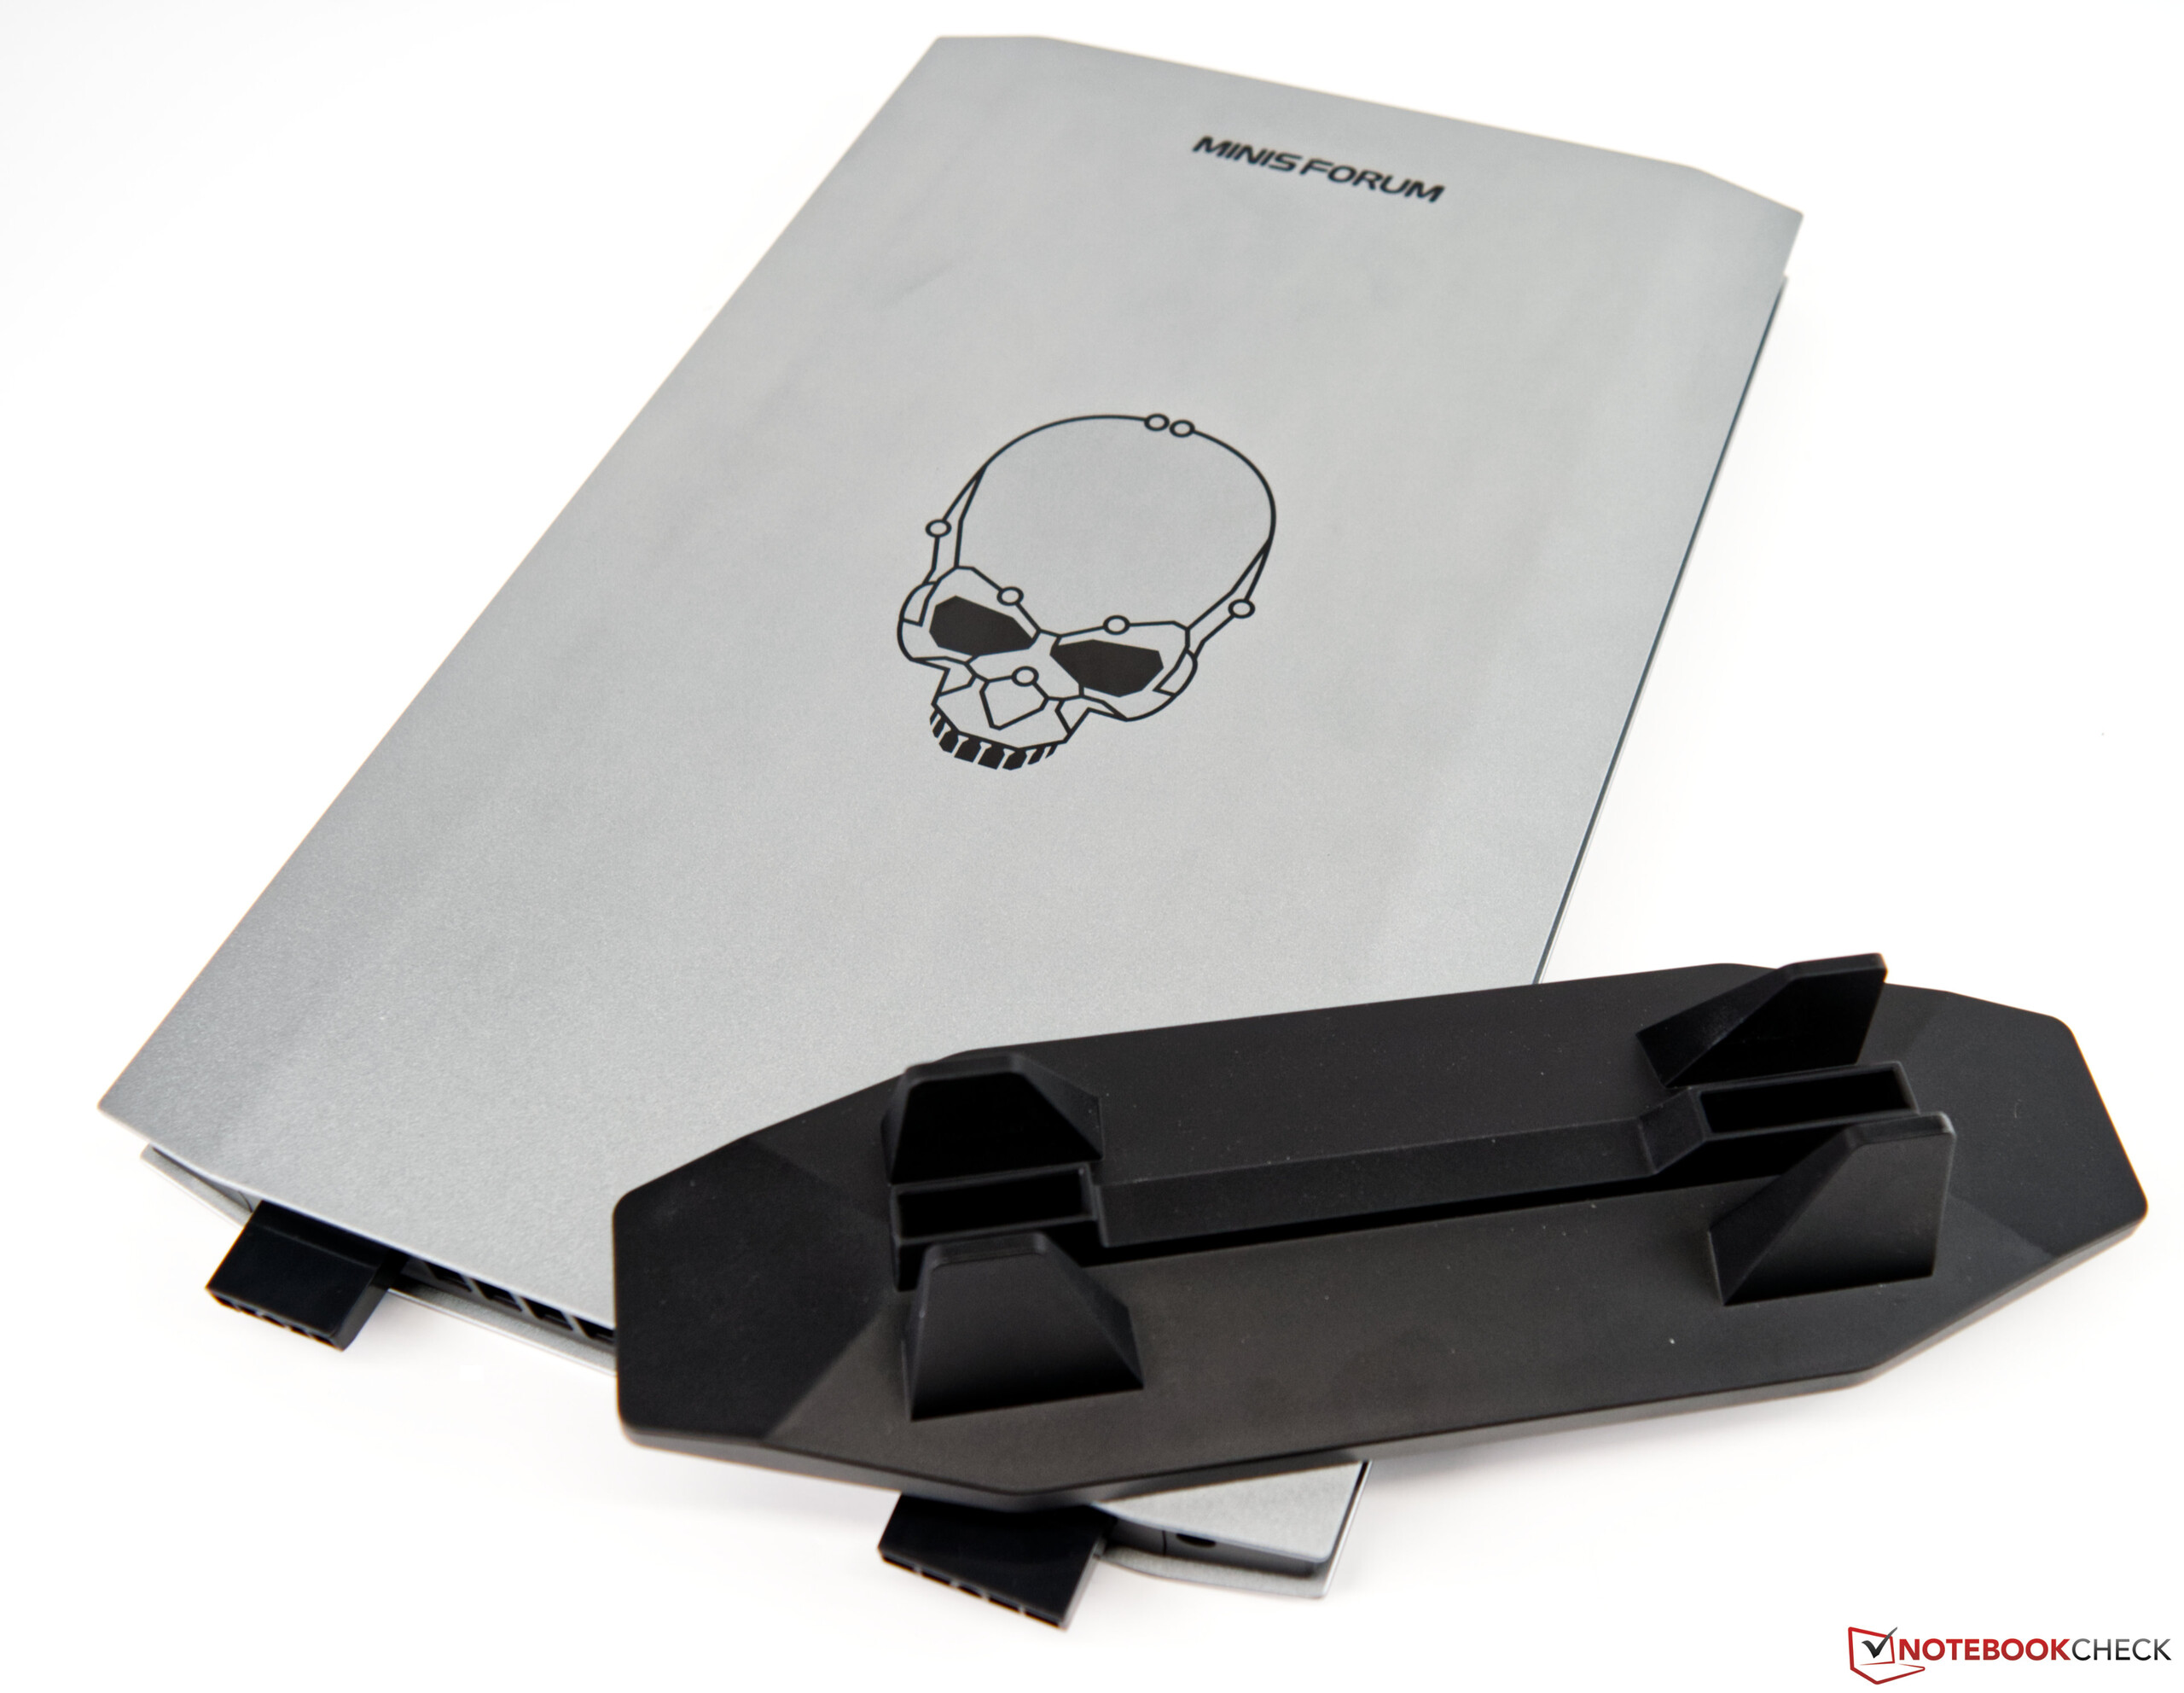
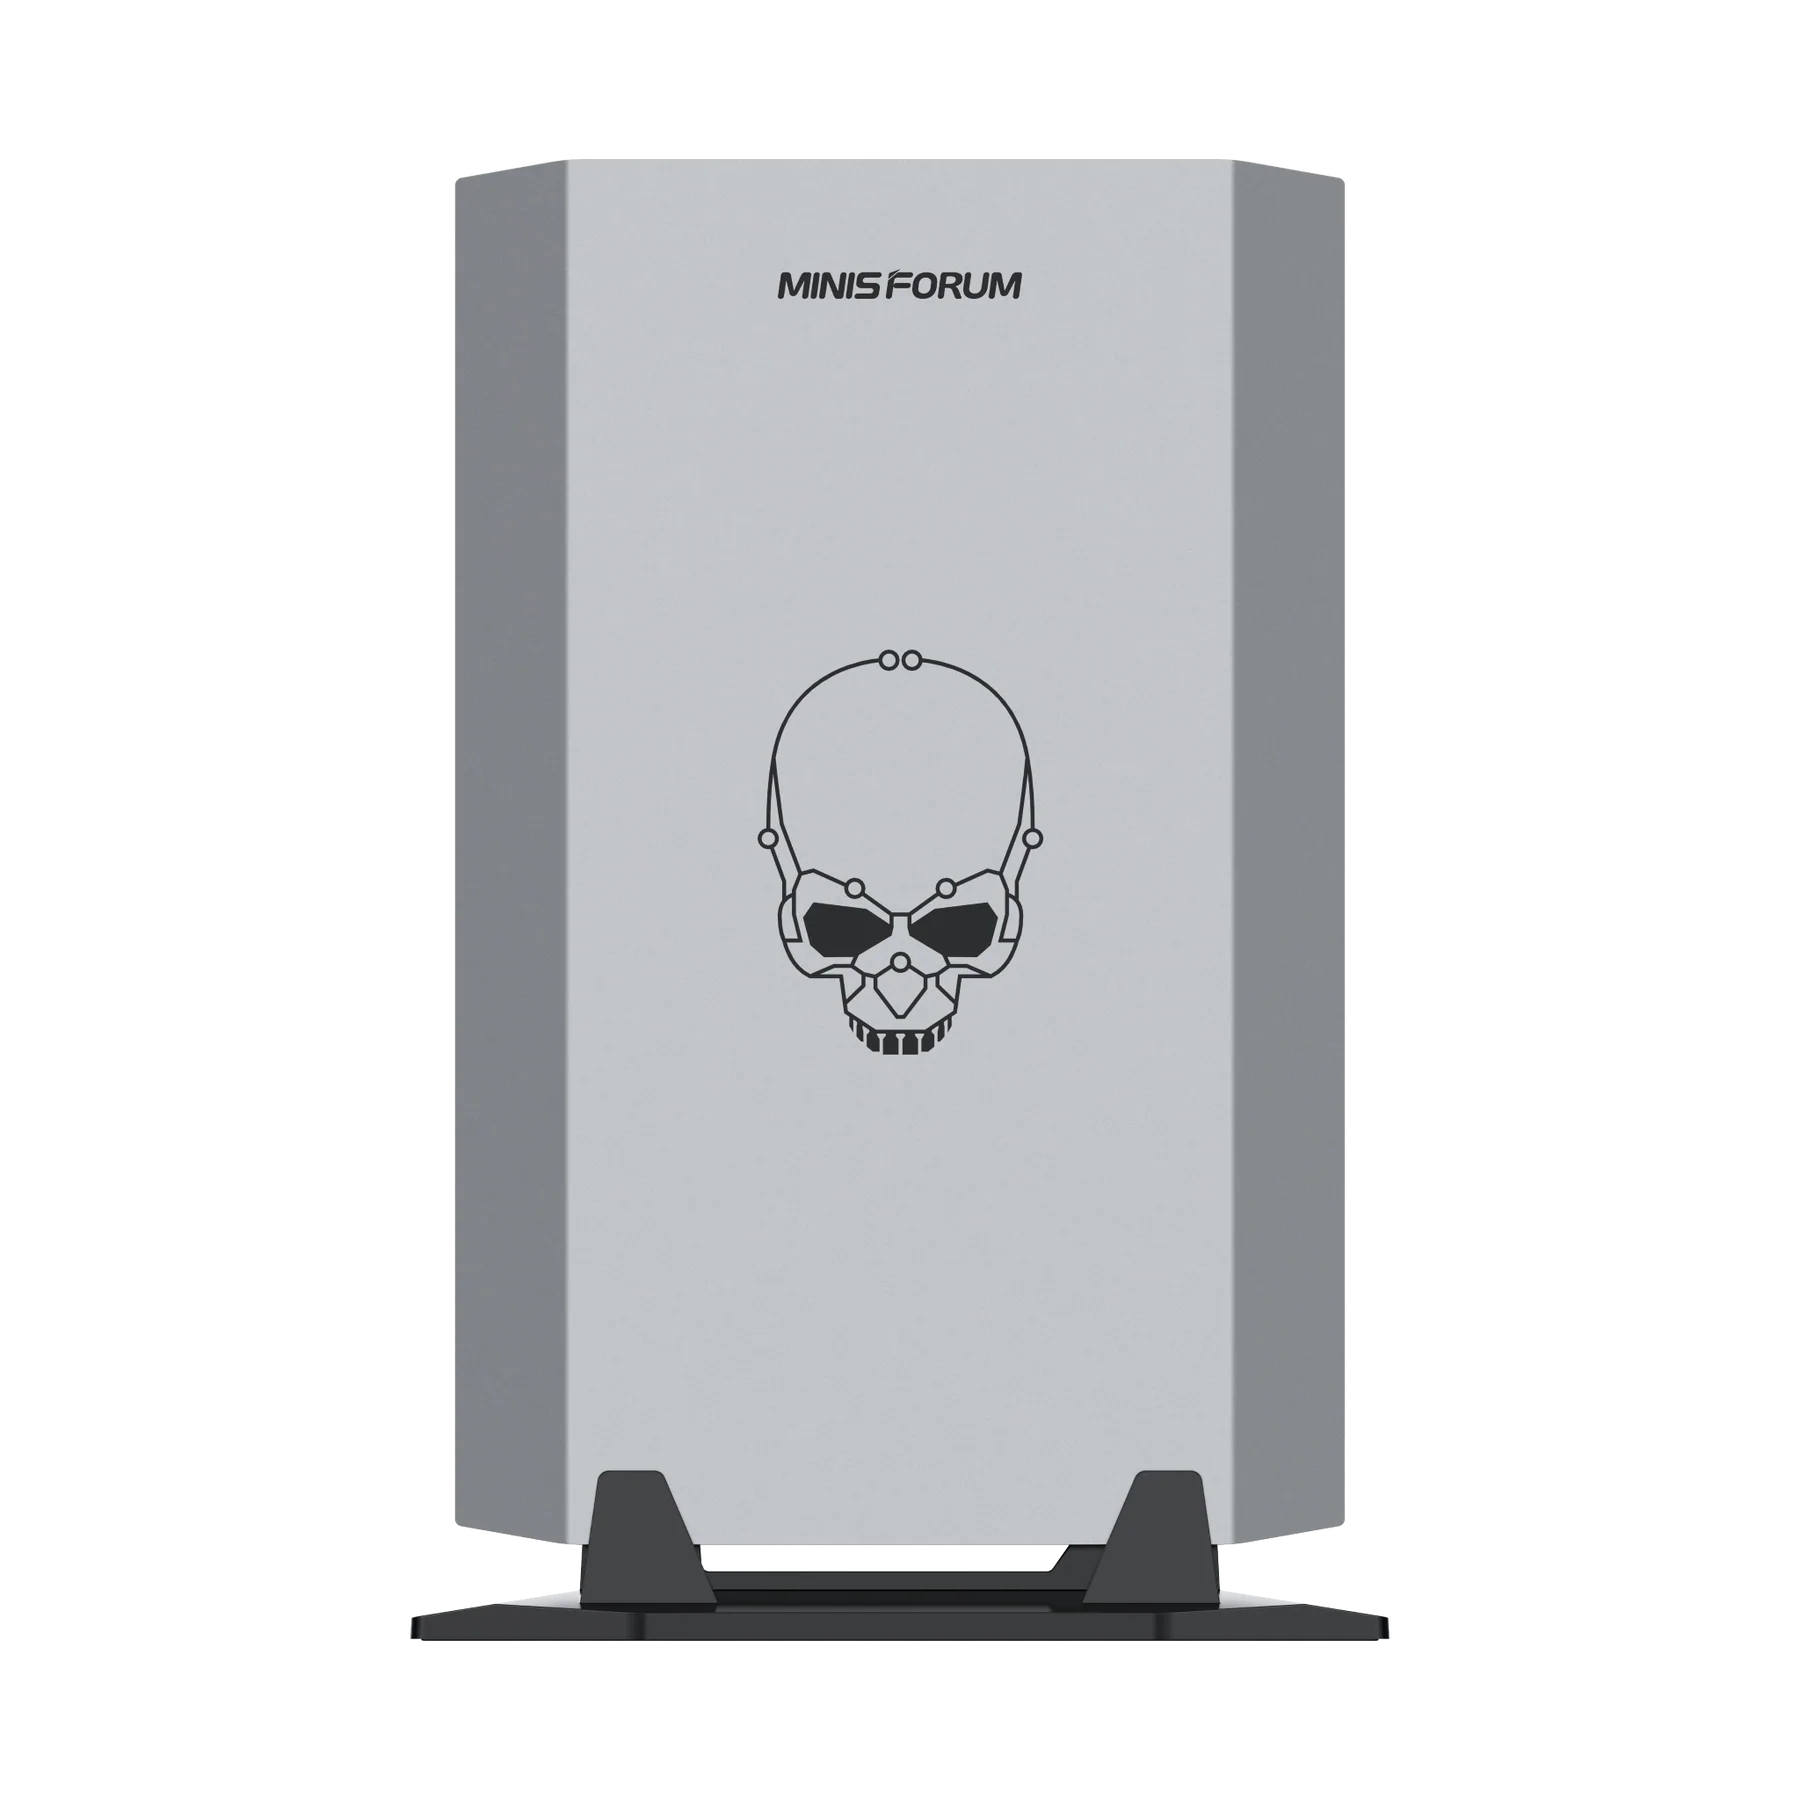
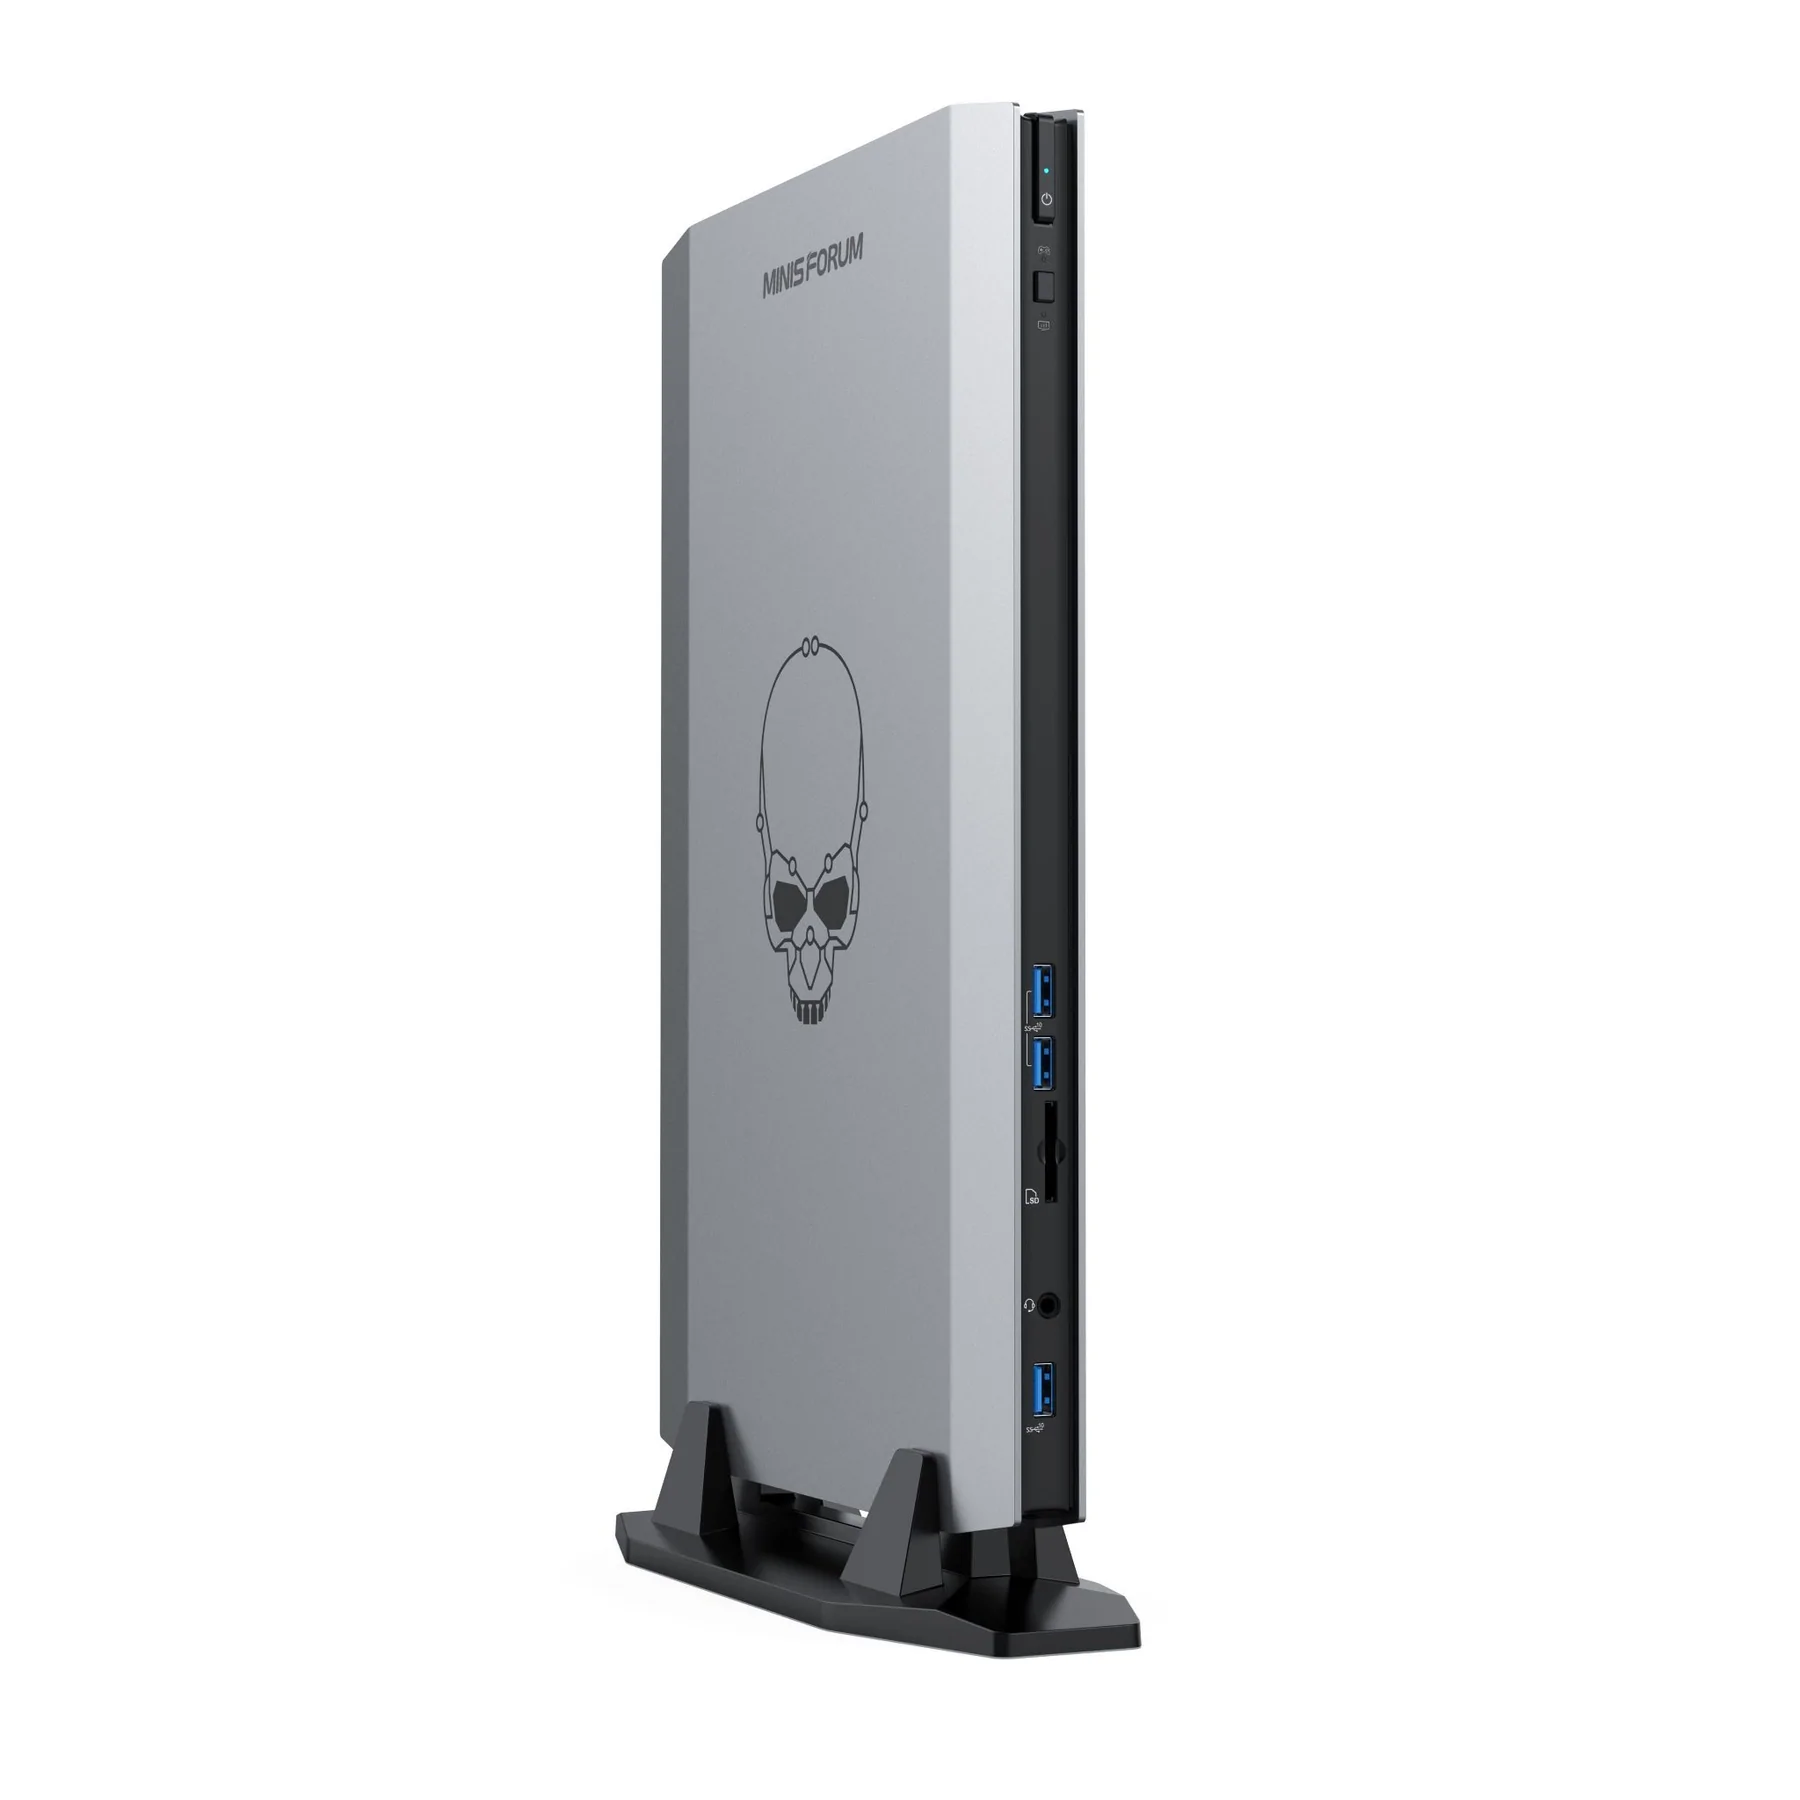
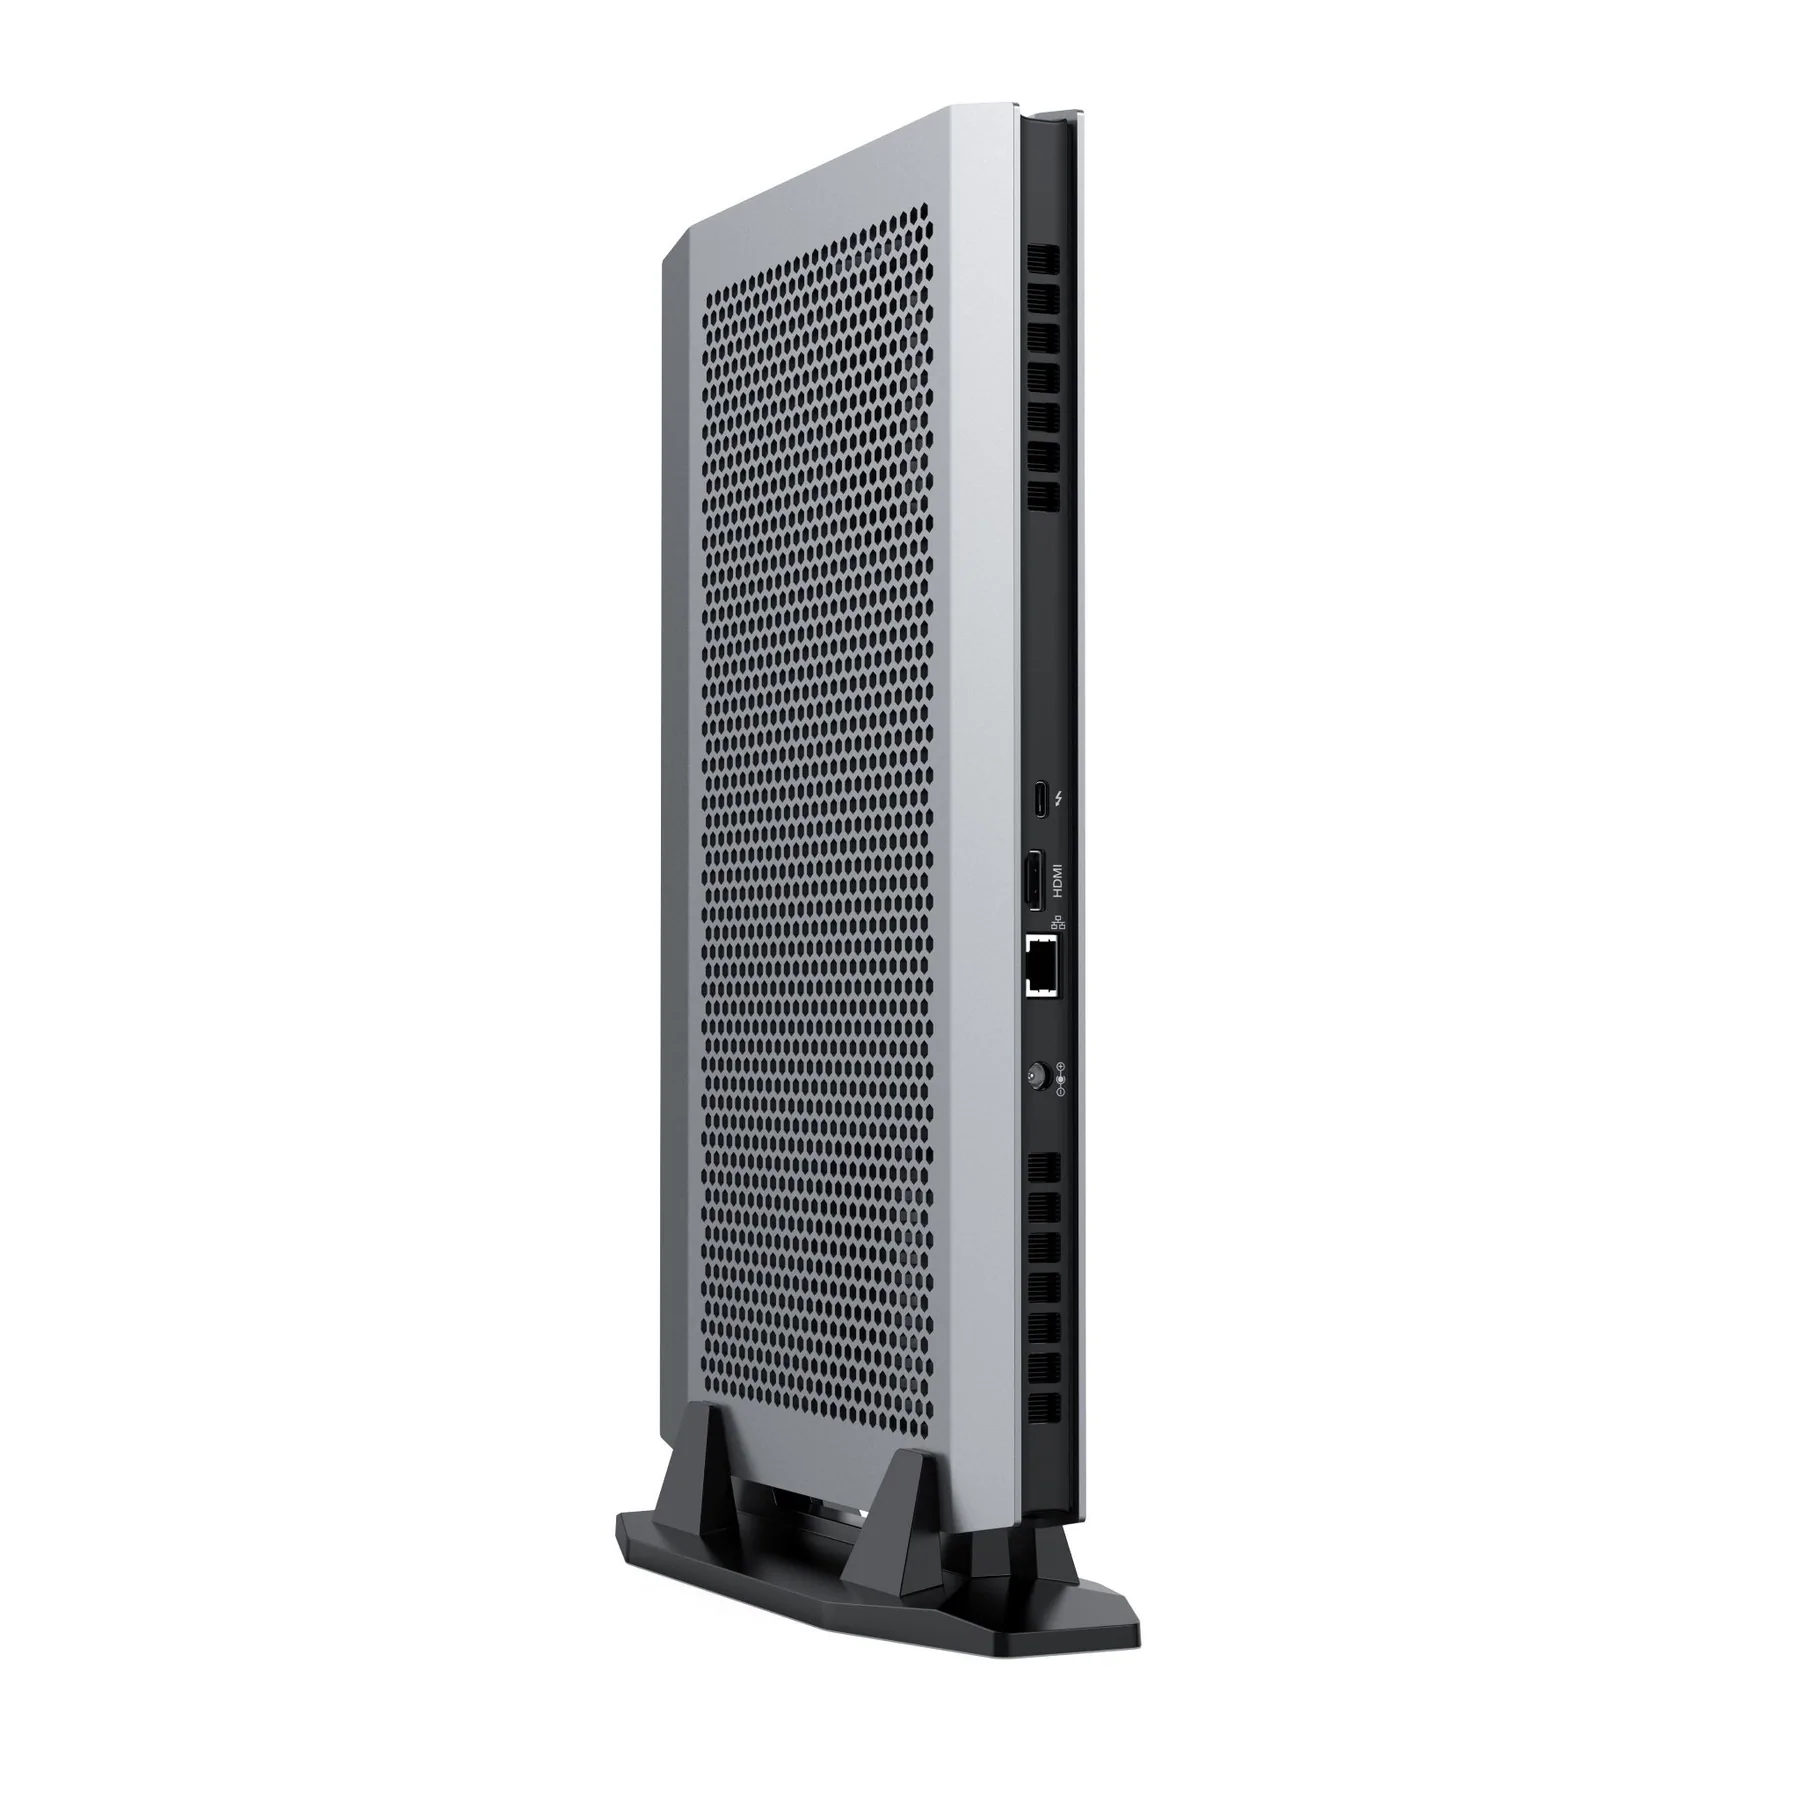
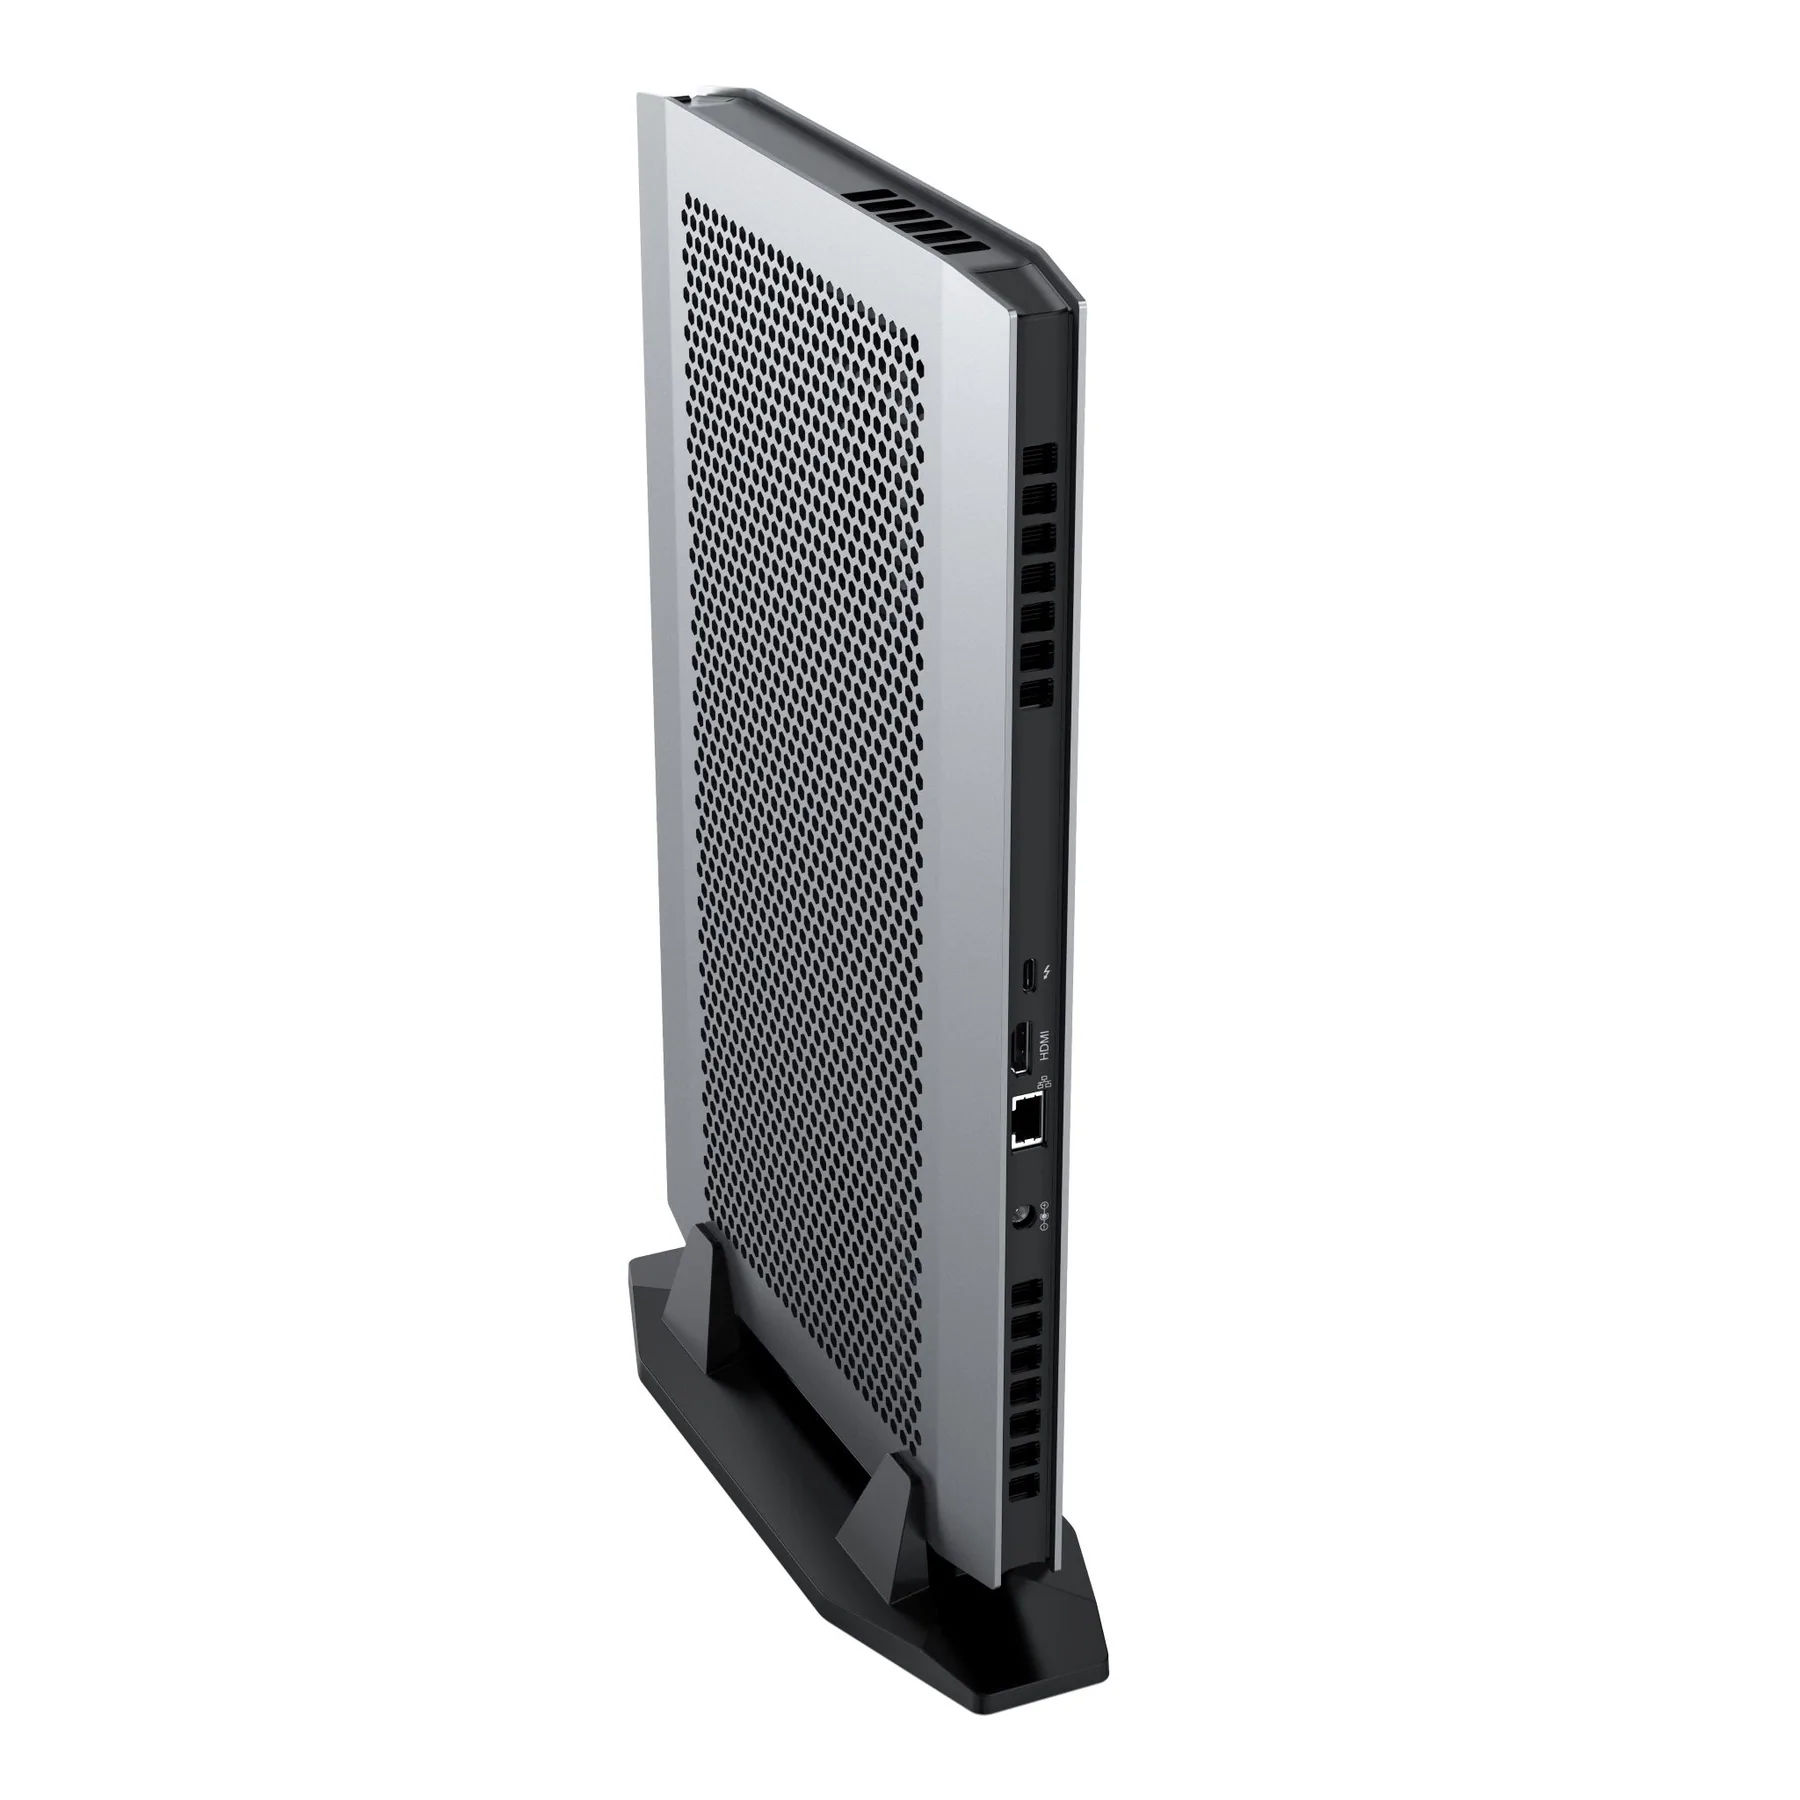
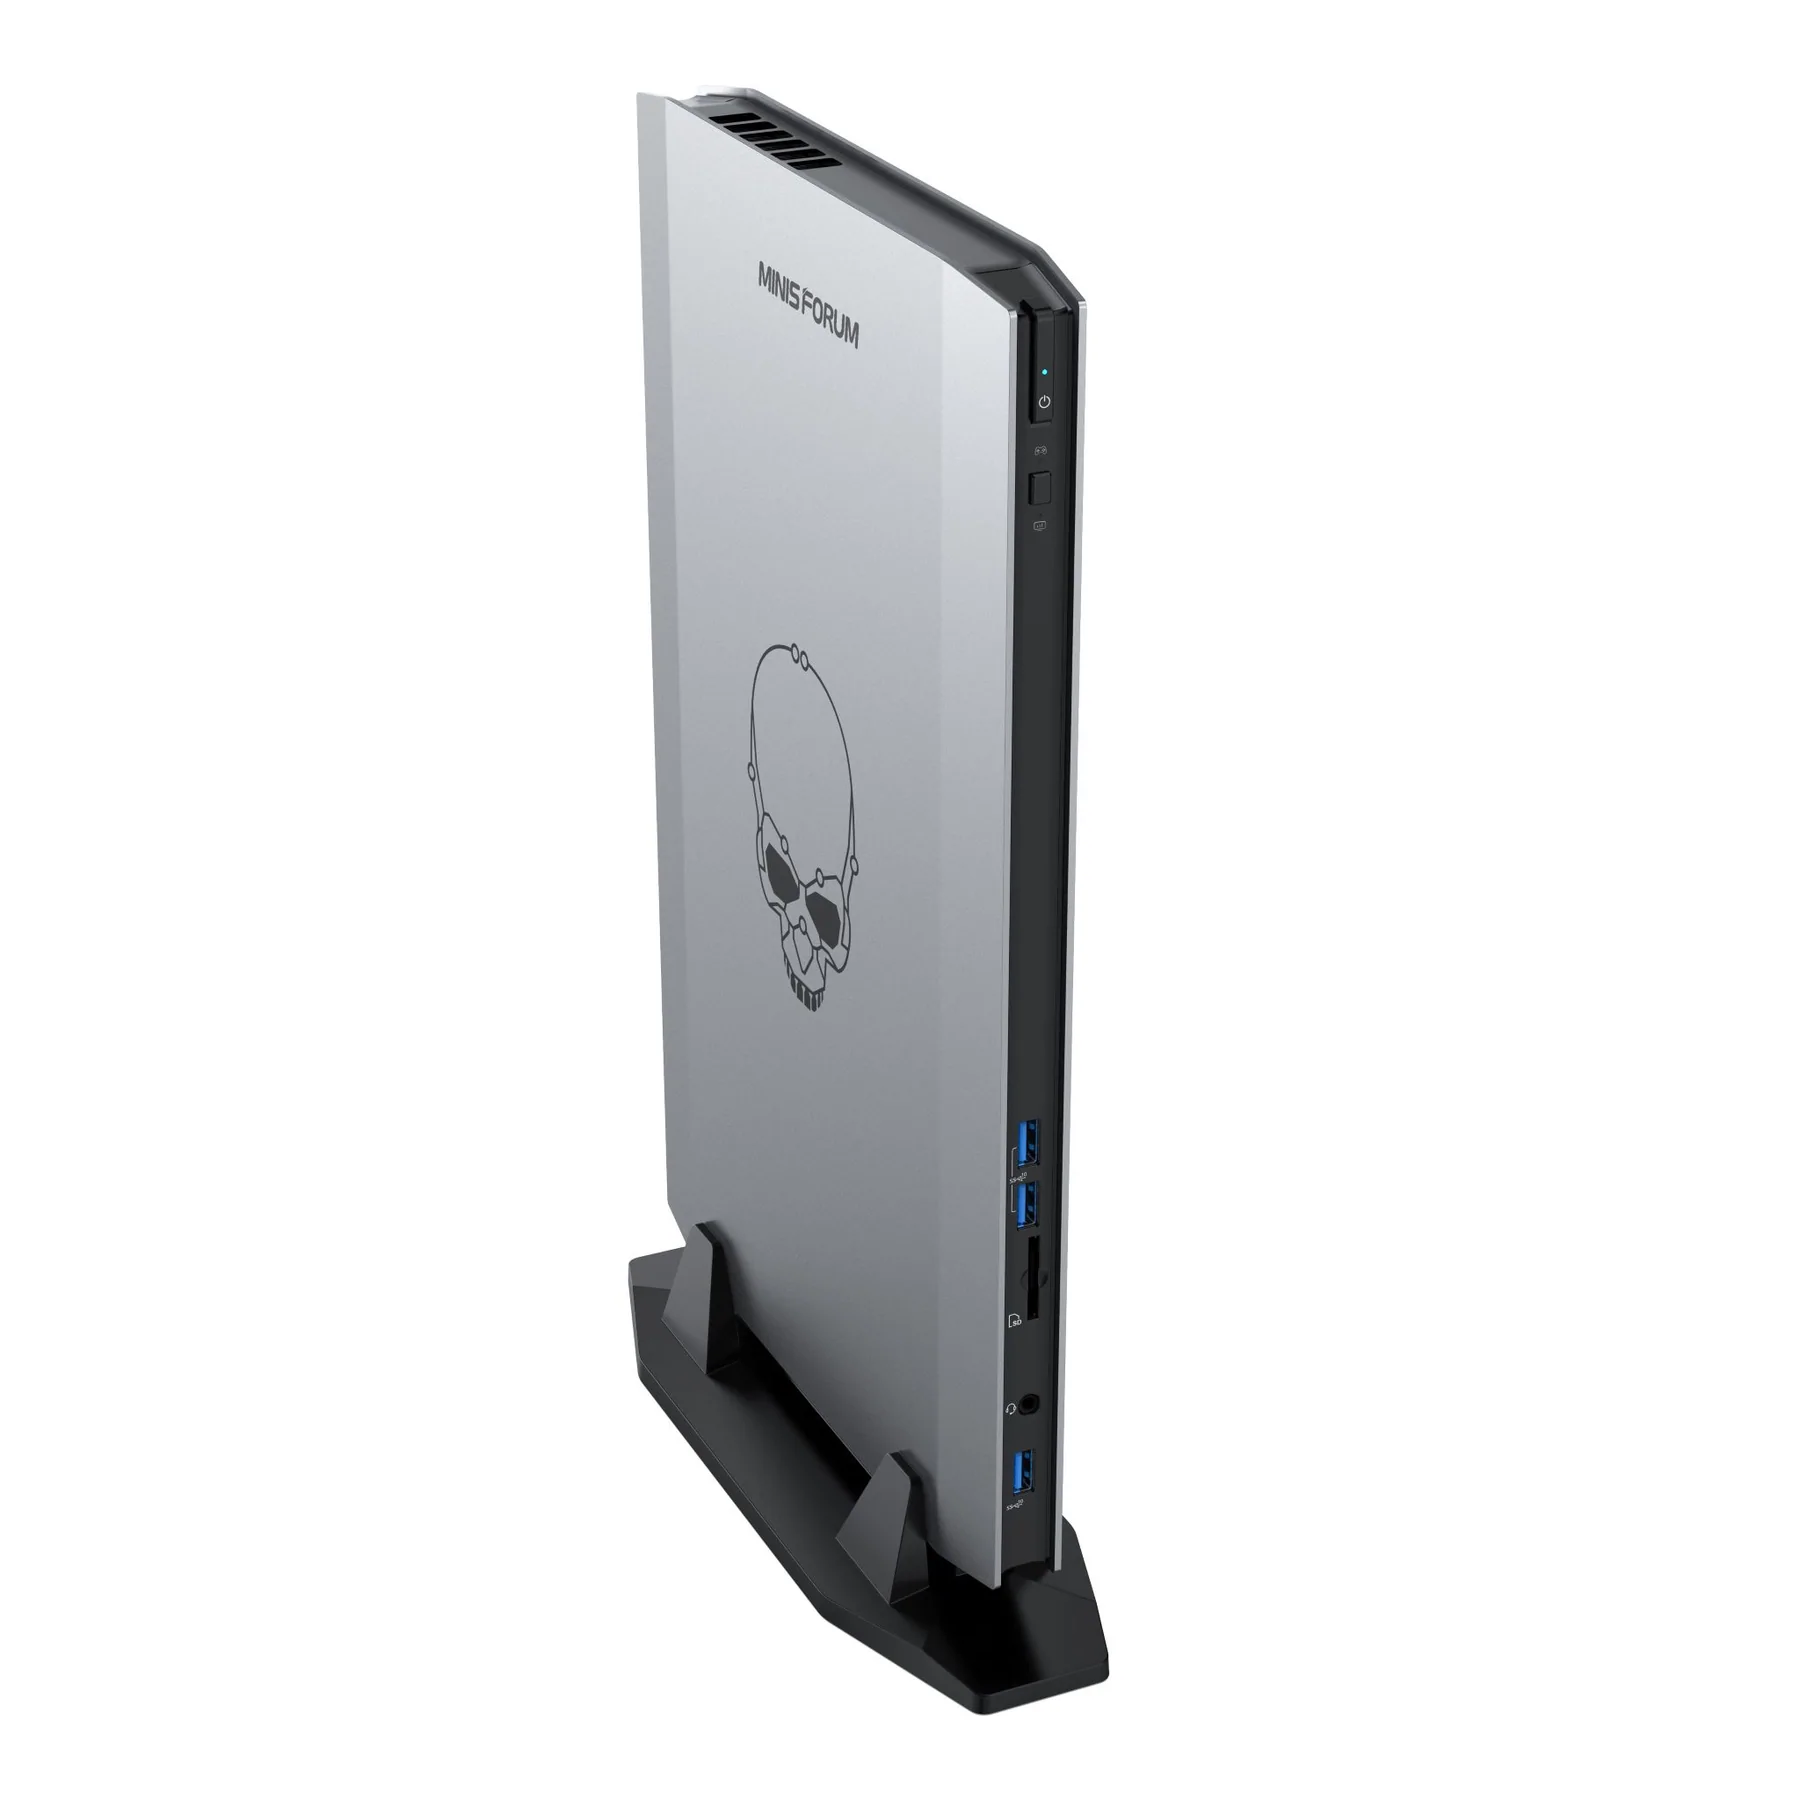
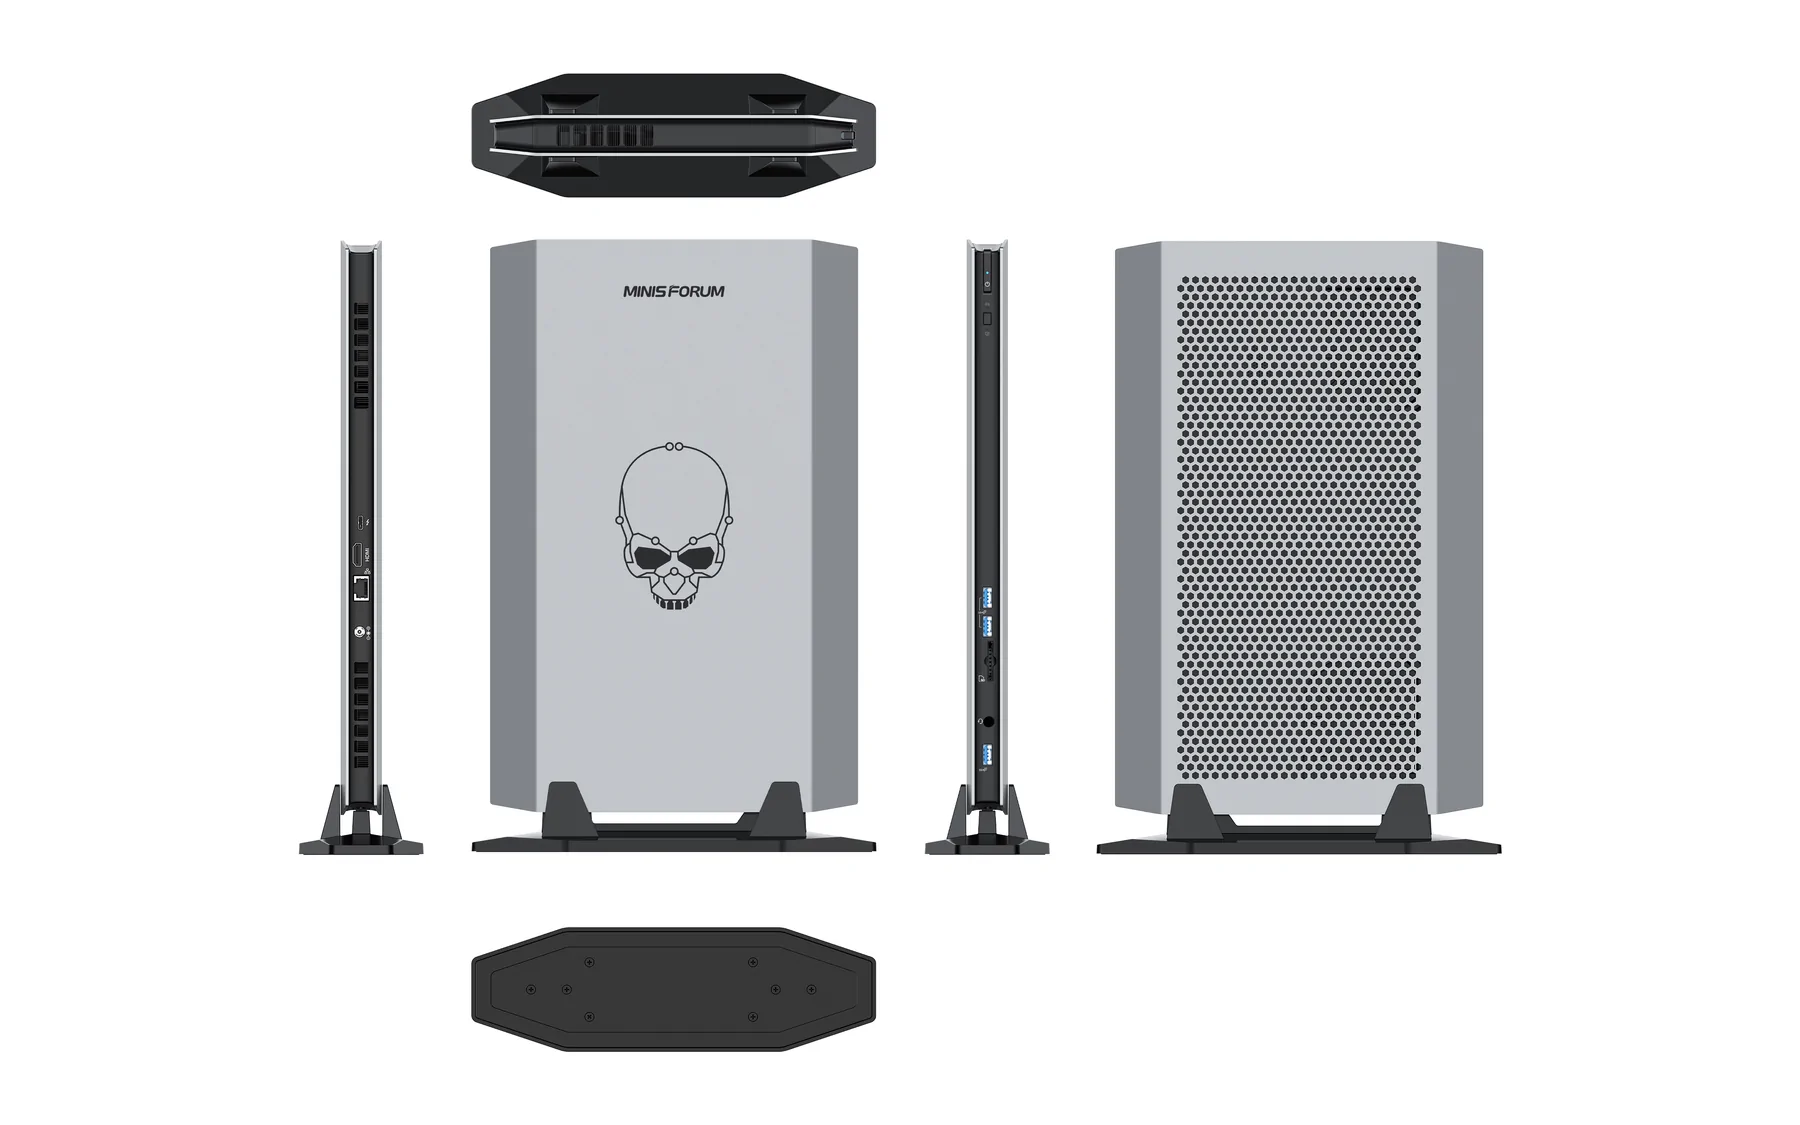
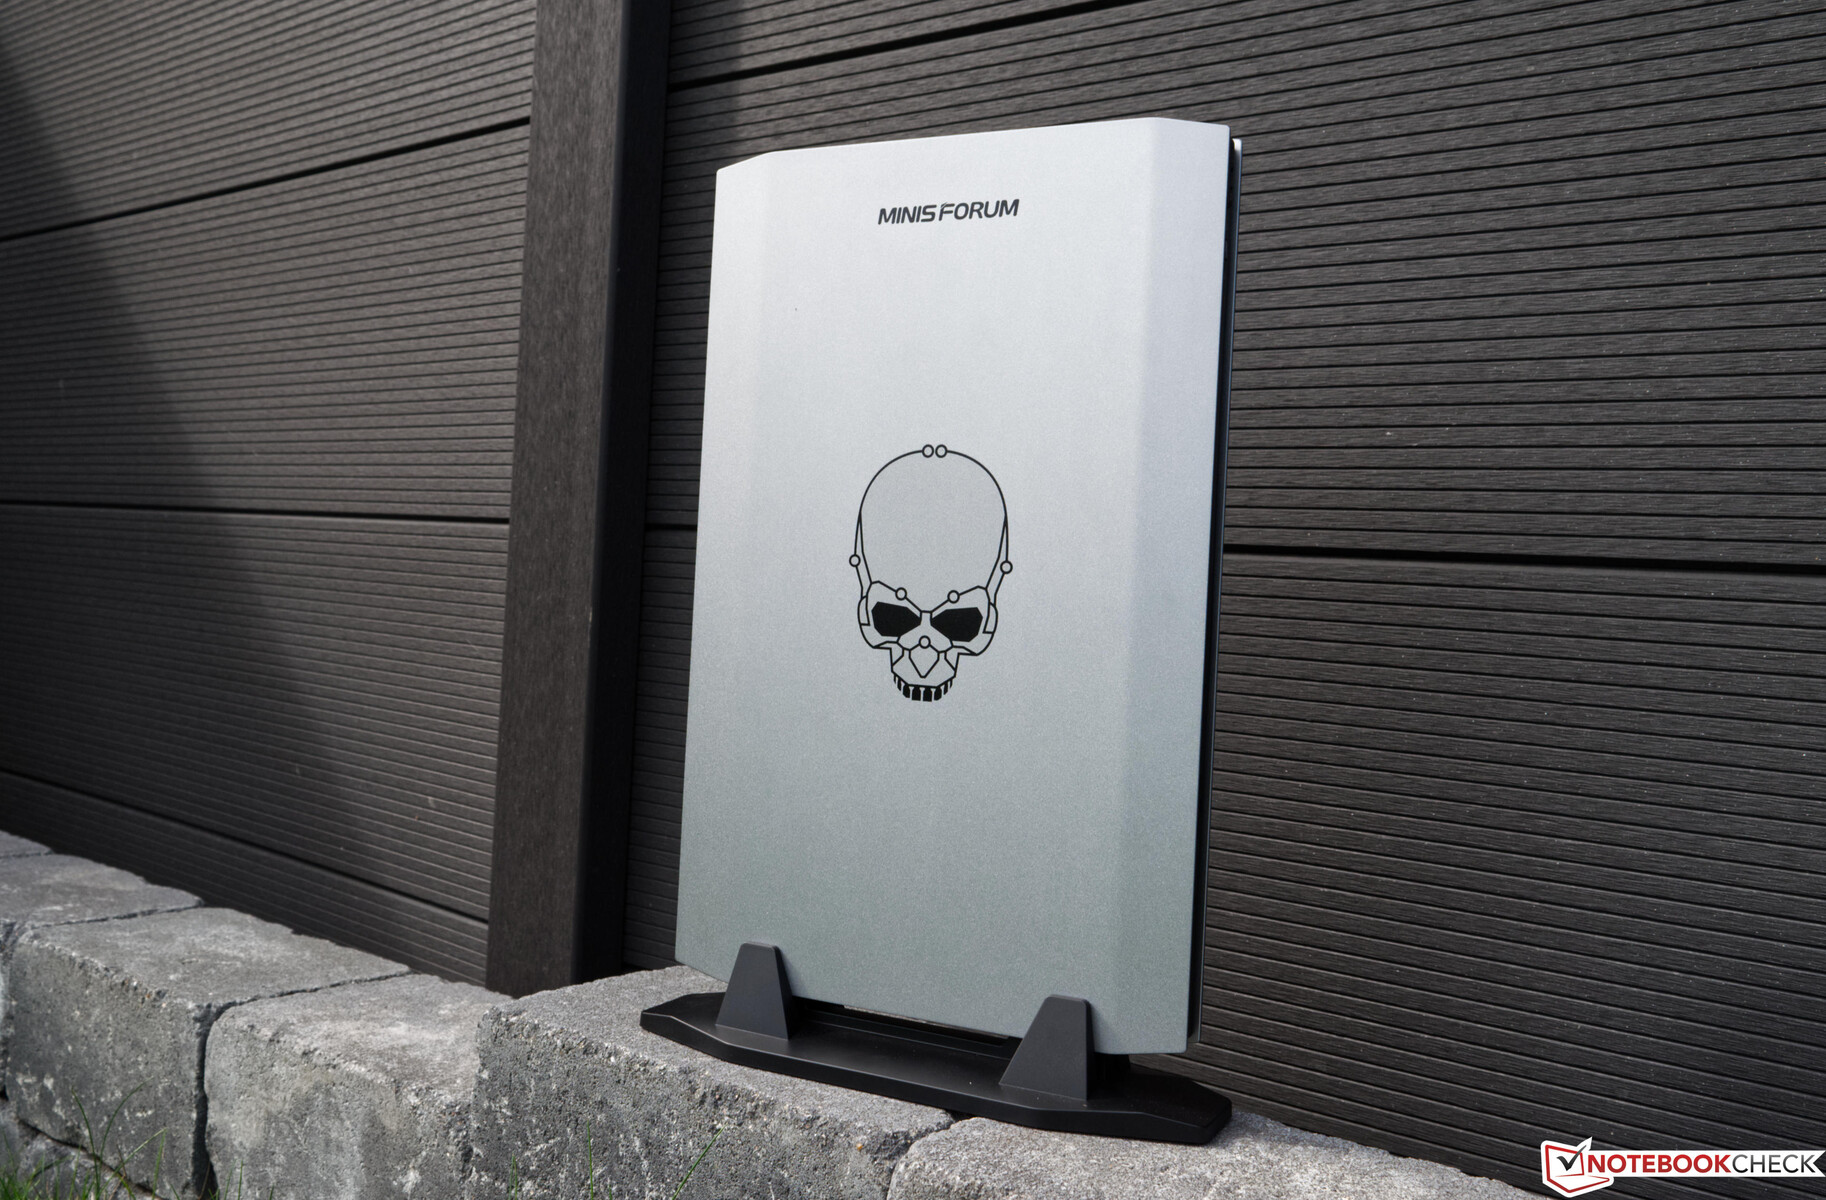
Minisforum NUCXi7 är inte liten och enligt oss inte en klassisk minidator. Enheten är dock fortfarande mycket smal och påminner om en bärbar dator utan skärm och inmatningsenheter. Större delen av höljet är tillverkat av plast, samtidigt som det ger ett haptiskt intryck av hög kvalitet. Även om en aluminiumbas förmodligen skulle vara tyngre, skulle enheten vinna betydligt i fråga om kvalitetsintrycket. Visuellt pryds den vänstra sidan av en dödskalle, vilket ger liv åt den annars slätstrukna silversidan. Baksidan är täckt av en stor honungskaveldesign för att säkerställa god kylning. Enheten är fastskruvad på ett stabilt stativ och kan endast köras i vertikalt läge. Minisforum NUCXi7 är inte konstruerad för horisontell drift, eftersom detta förmodligen också skulle vara till klar nackdel för kylningsegenskaperna.
Inklusive stativet tar Minisforum NUCXi7 med sig endast 2,4 kg till vågen, vilket är mycket lätt. Å andra sidan förhindrar stativets vikt att den lätt faller omkull. För det externa nätaggregatet måste du också lägga till ytterligare cirka 0,5 kg till vikten.
Utrustning
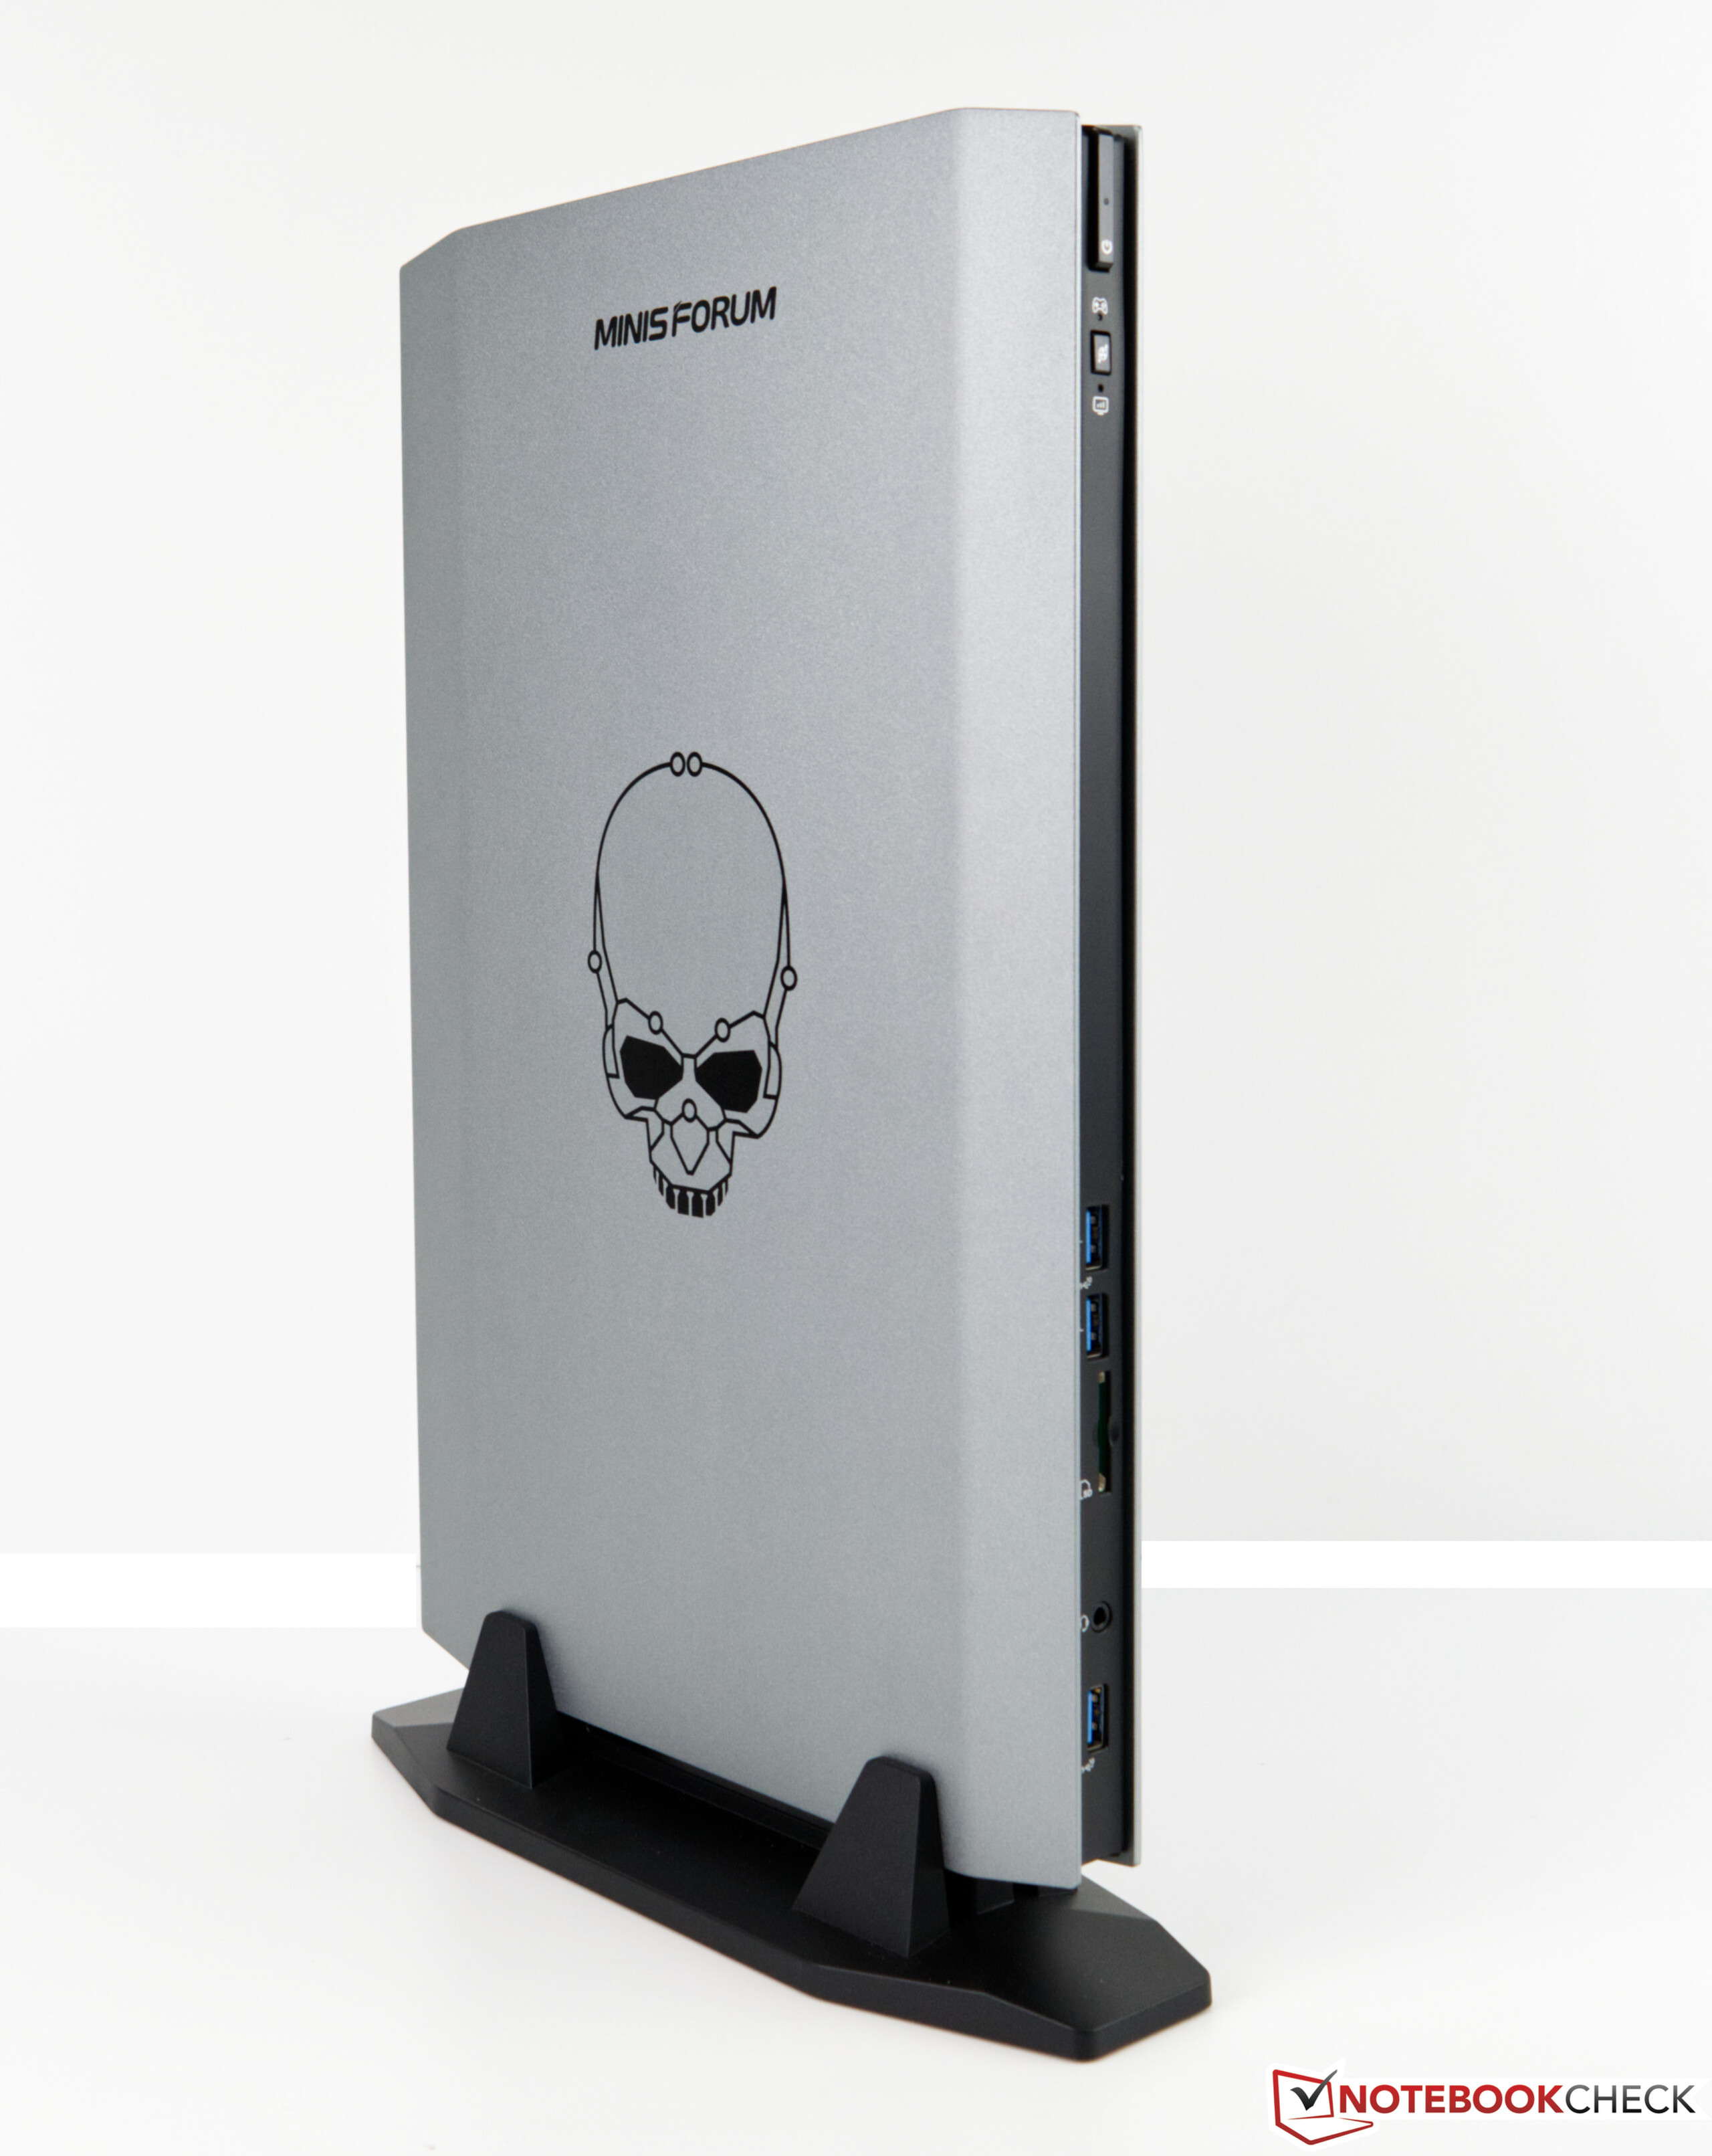
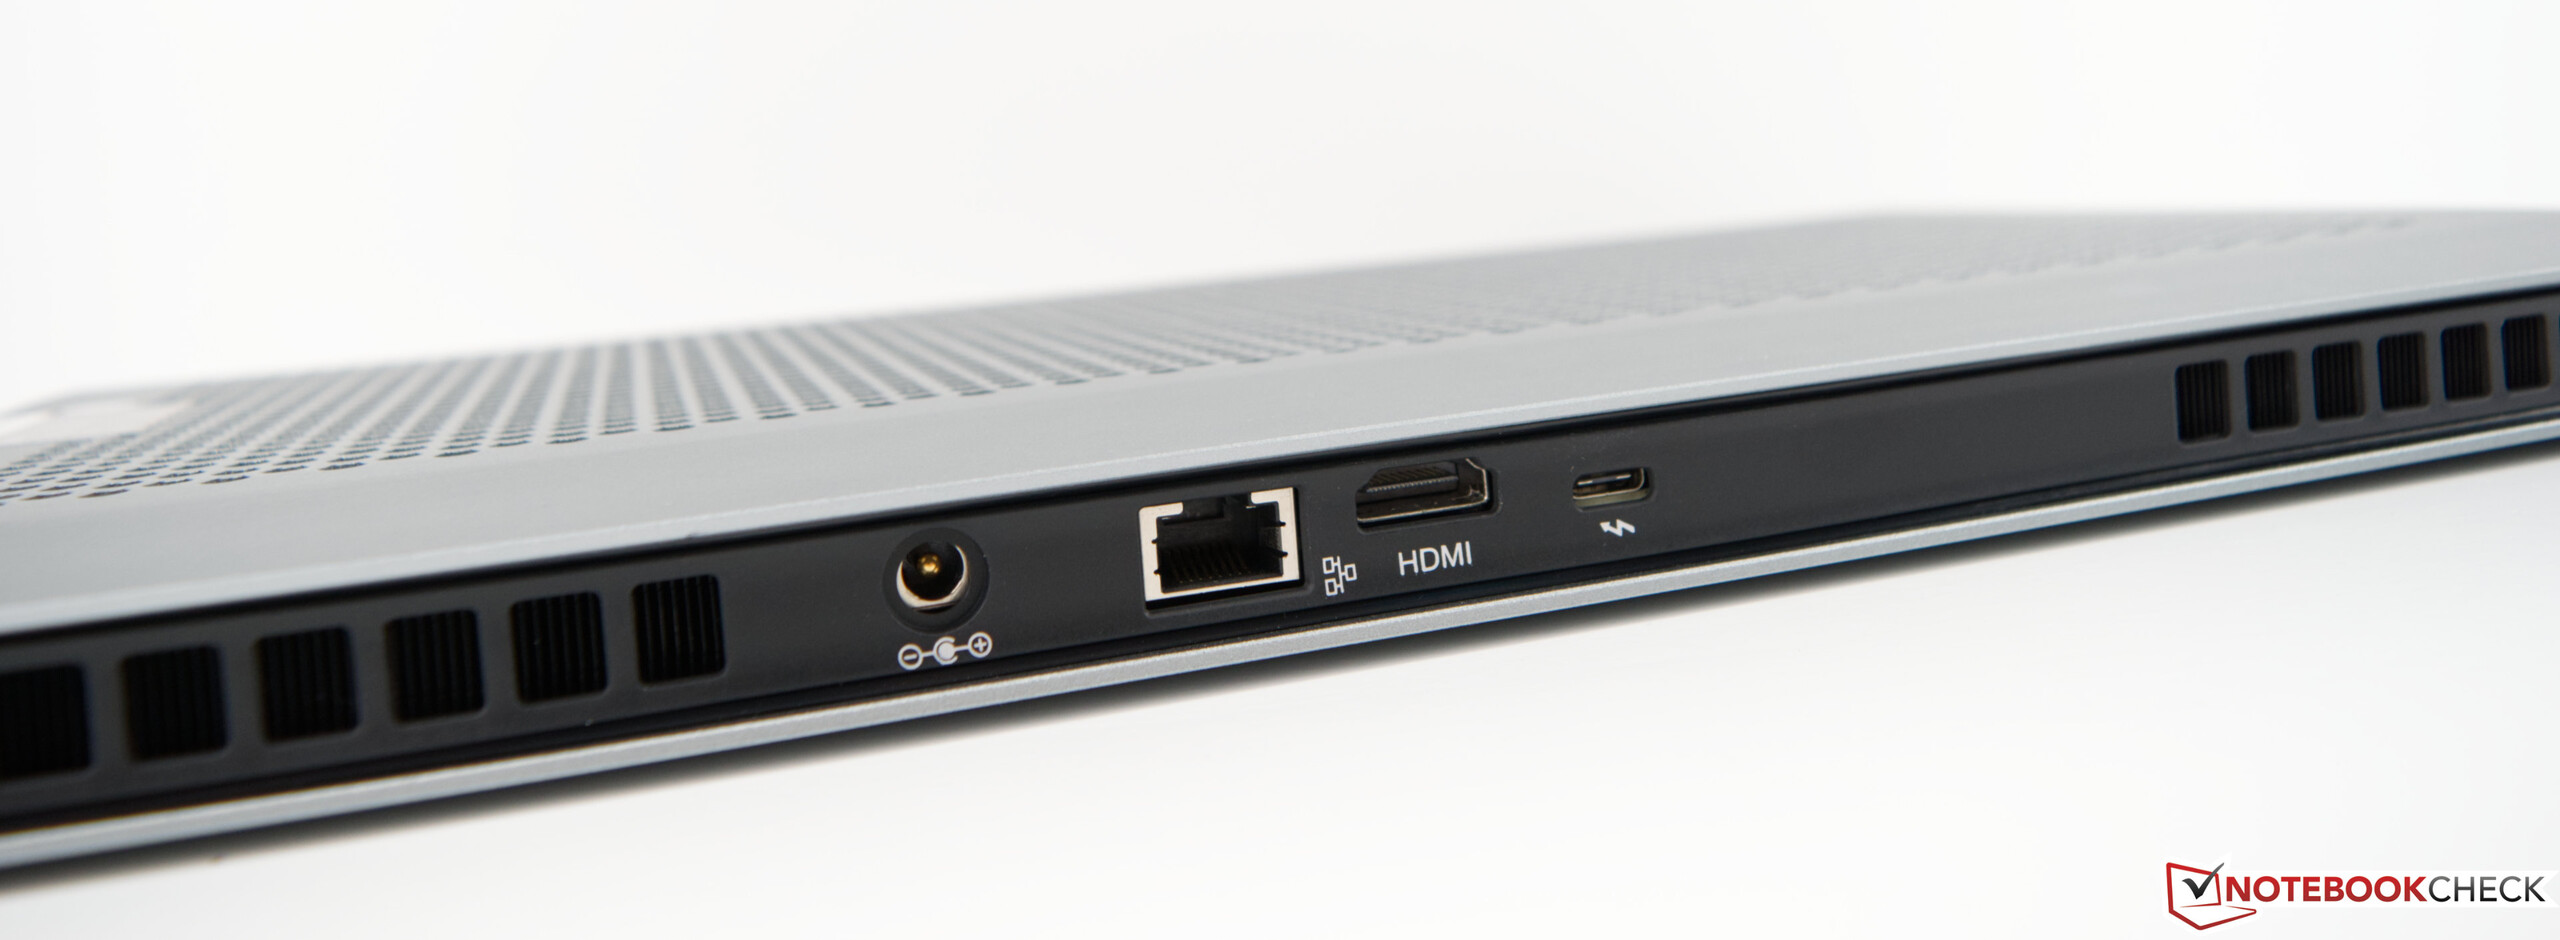
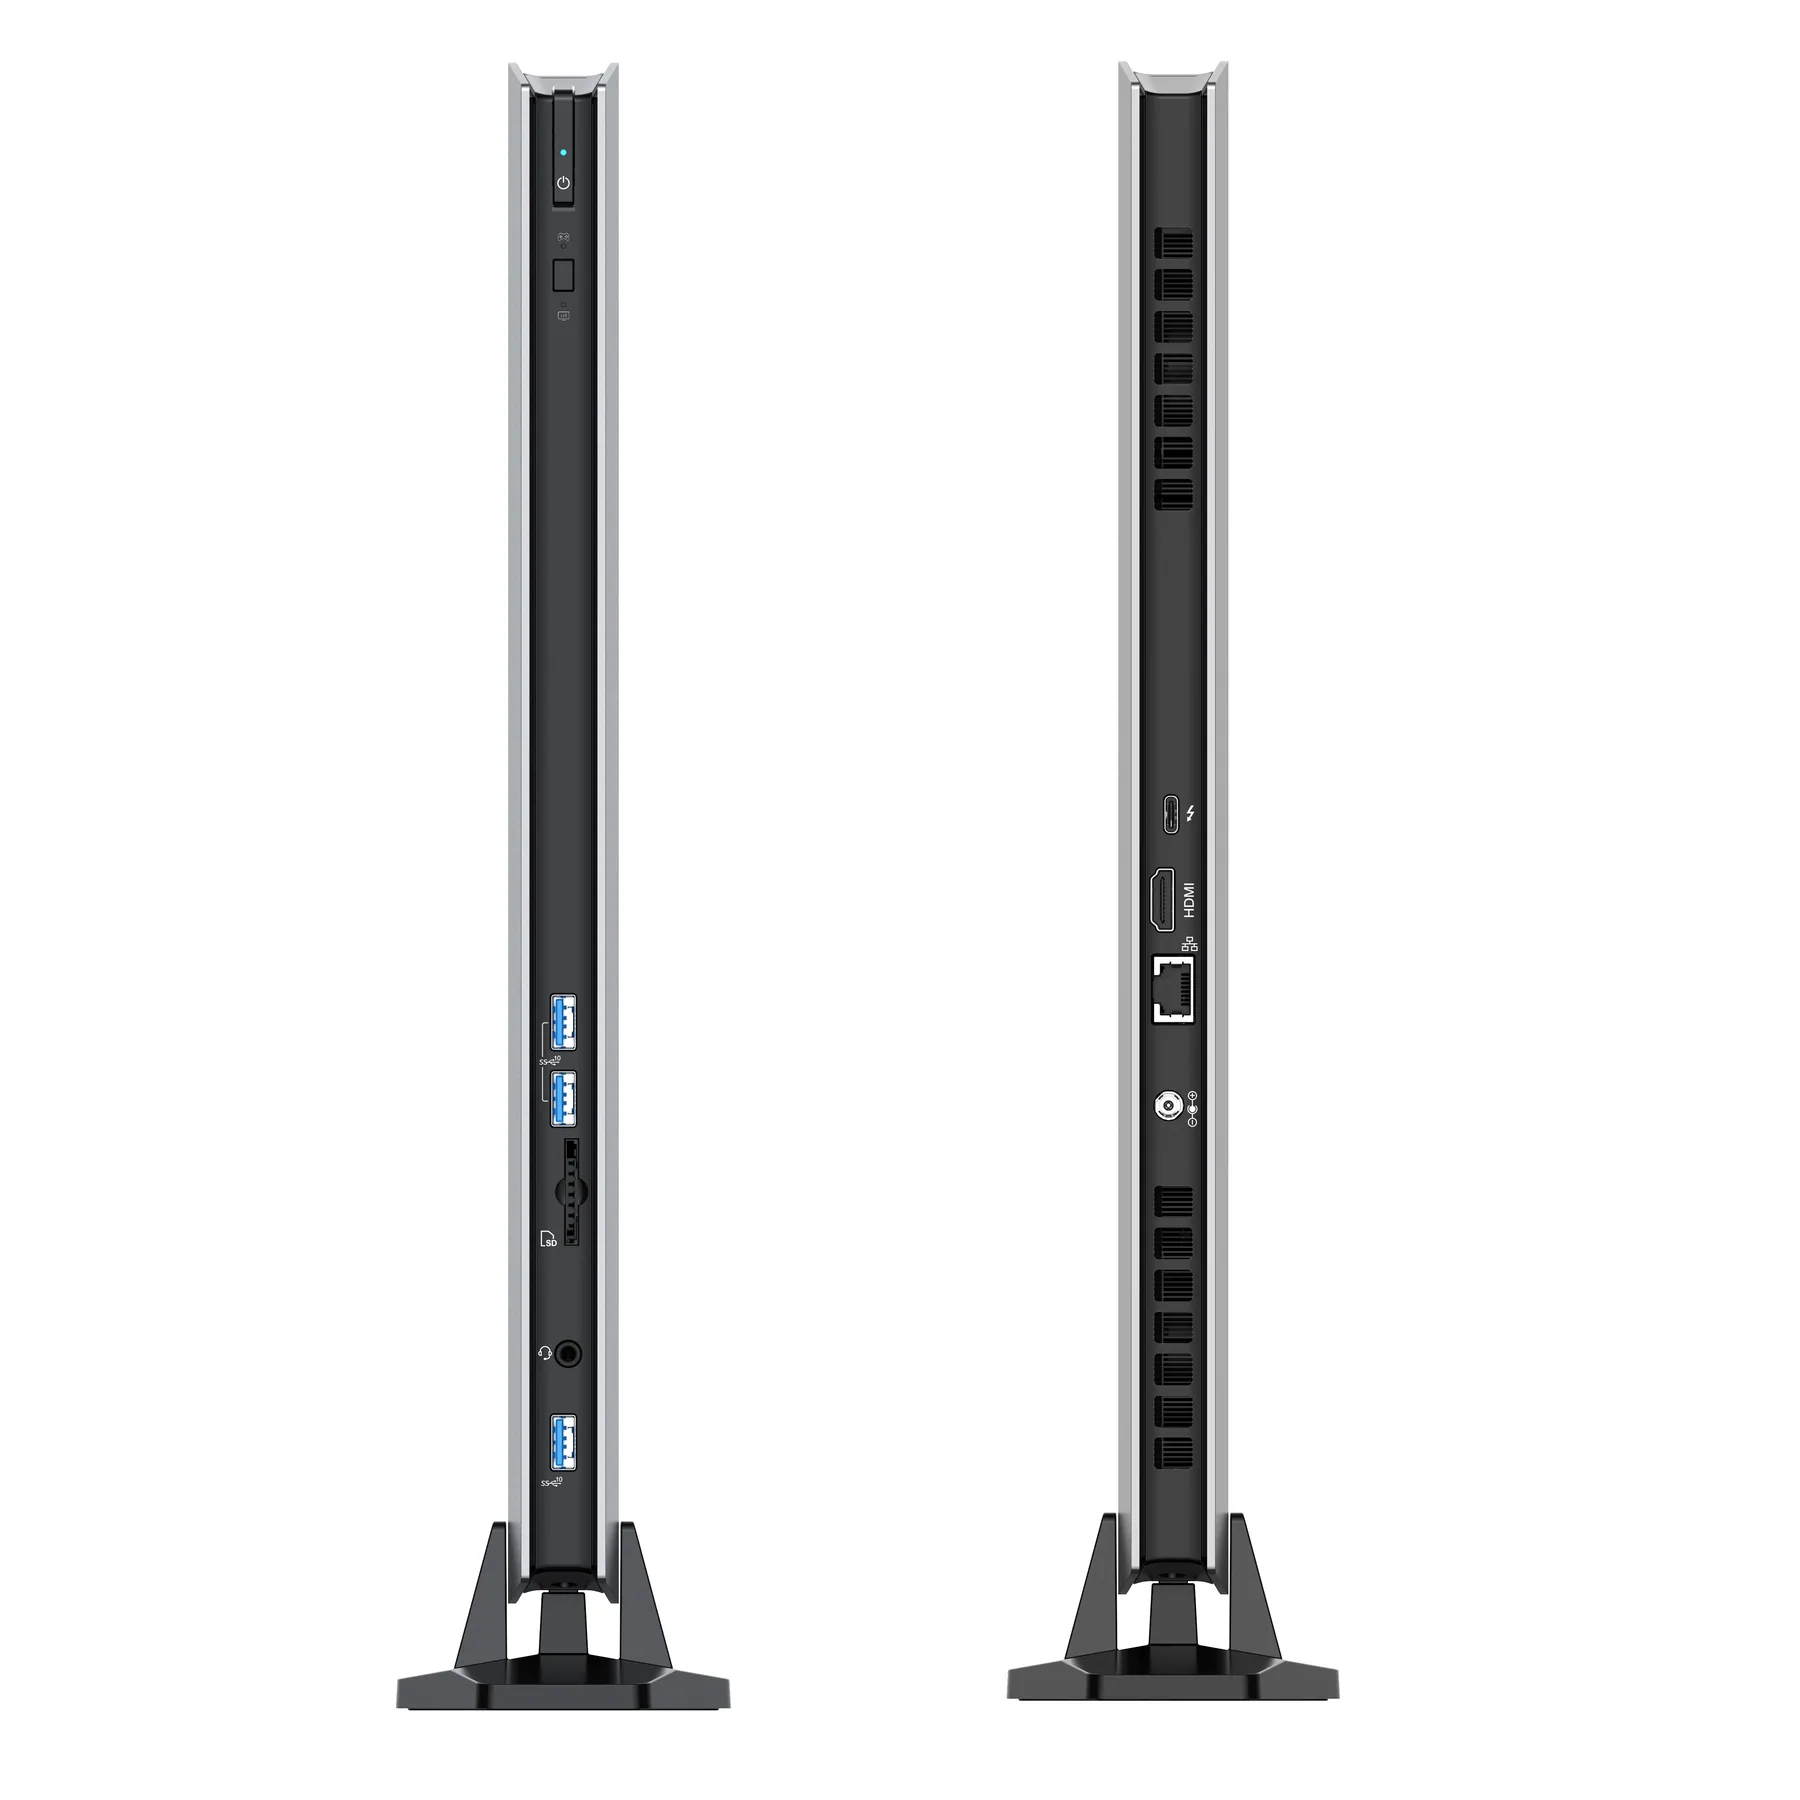
Vid en första anblick är alla viktiga anslutningar tillgängliga. Det finns till och med en modern Thunderbolt-port. Samtidigt kan man ha olika åsikter om antalet tillgängliga USB 3.2 Type-A-portar. Enheten erbjuder bara tre av dem, och de är alla placerade framtill. Vi hade kunnat önska oss åtminstone en USB-port till på baksidan. Men tyvärr är tillverkaren bunden till moderkortets layout, vilket skulle göra detta svårare. Du kan ansluta skärmar via HDMI eller Thunderbolt, och båda dessa alternativ fungerade utan problem i vårt test. Du behöver inte heller leva utan en SD-kortläsare här.
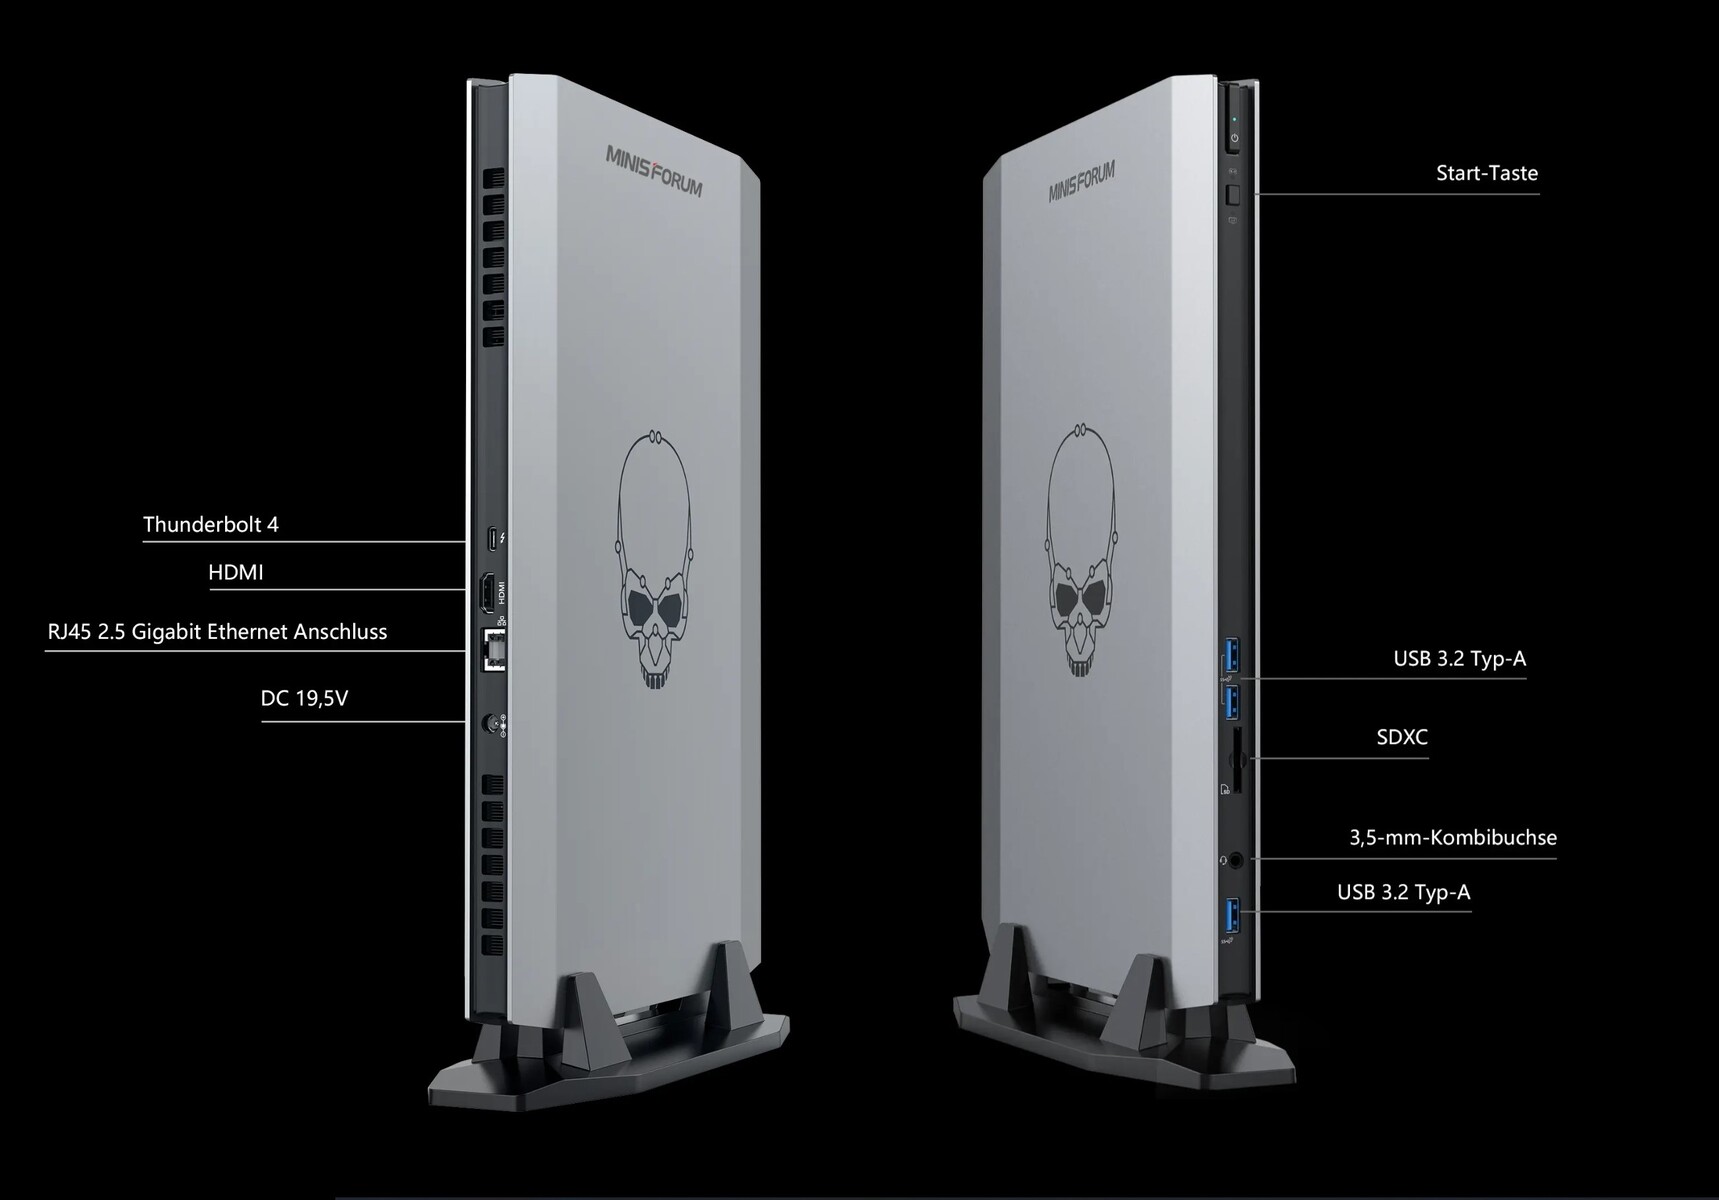
SD-kortläsare
Minisforum NUCXi7 är utrustad med en SD-kortläsare som fungerar med USB 3-hastigheter. De 76 MB/s som vi uppmätte i vårt test med vårt referenskort (Angelbird AV Pro V60) med UHS-II-anslutning bekräftar också USB 3-hastigheten. Den här prestandan är dock fortfarande sämre än genomsnittet i klassen.
| SD Card Reader - average JPG Copy Test (av. of 3 runs) | |
| Asus ROG Zephyrus Duo 16 GX650RX (AV PRO microSD 128 GB V60) | |
| Razer Blade 17 Early 2022 (AV PRO microSD 128 GB V60) | |
| Minisforum NUCX i7 (AV Pro SD microSD 128 GB V60) | |
| MSI Titan GT77 12UHS (AV PRO microSD 128 GB V60) | |
| Acer Predator Triton 500 SE PT516-52s-70KX (AV PRO microSD 128 GB V60) | |
| MSI Raider GE77 HX 12UHS (AV PRO microSD 128 GB V60) | |
Kommunikation
Minisforum använder en Intel Wi-Fi 6E-AX210-modul i NUCXi7. I vårt test med vår ASUS ROG Rapture GT-AXE11000-router kunde vi inte nå upp till jämförelsenheternas goda prestanda. Minisforum NUCXi7 placerar sig i slutet av jämförelsefältet, klart efterlämnad här. Den integrerade LAN-porten erbjuder ett bra alternativ till den trådlösa anslutningen och stöder upp till 2,5 Gbit/s.
Tillbehör
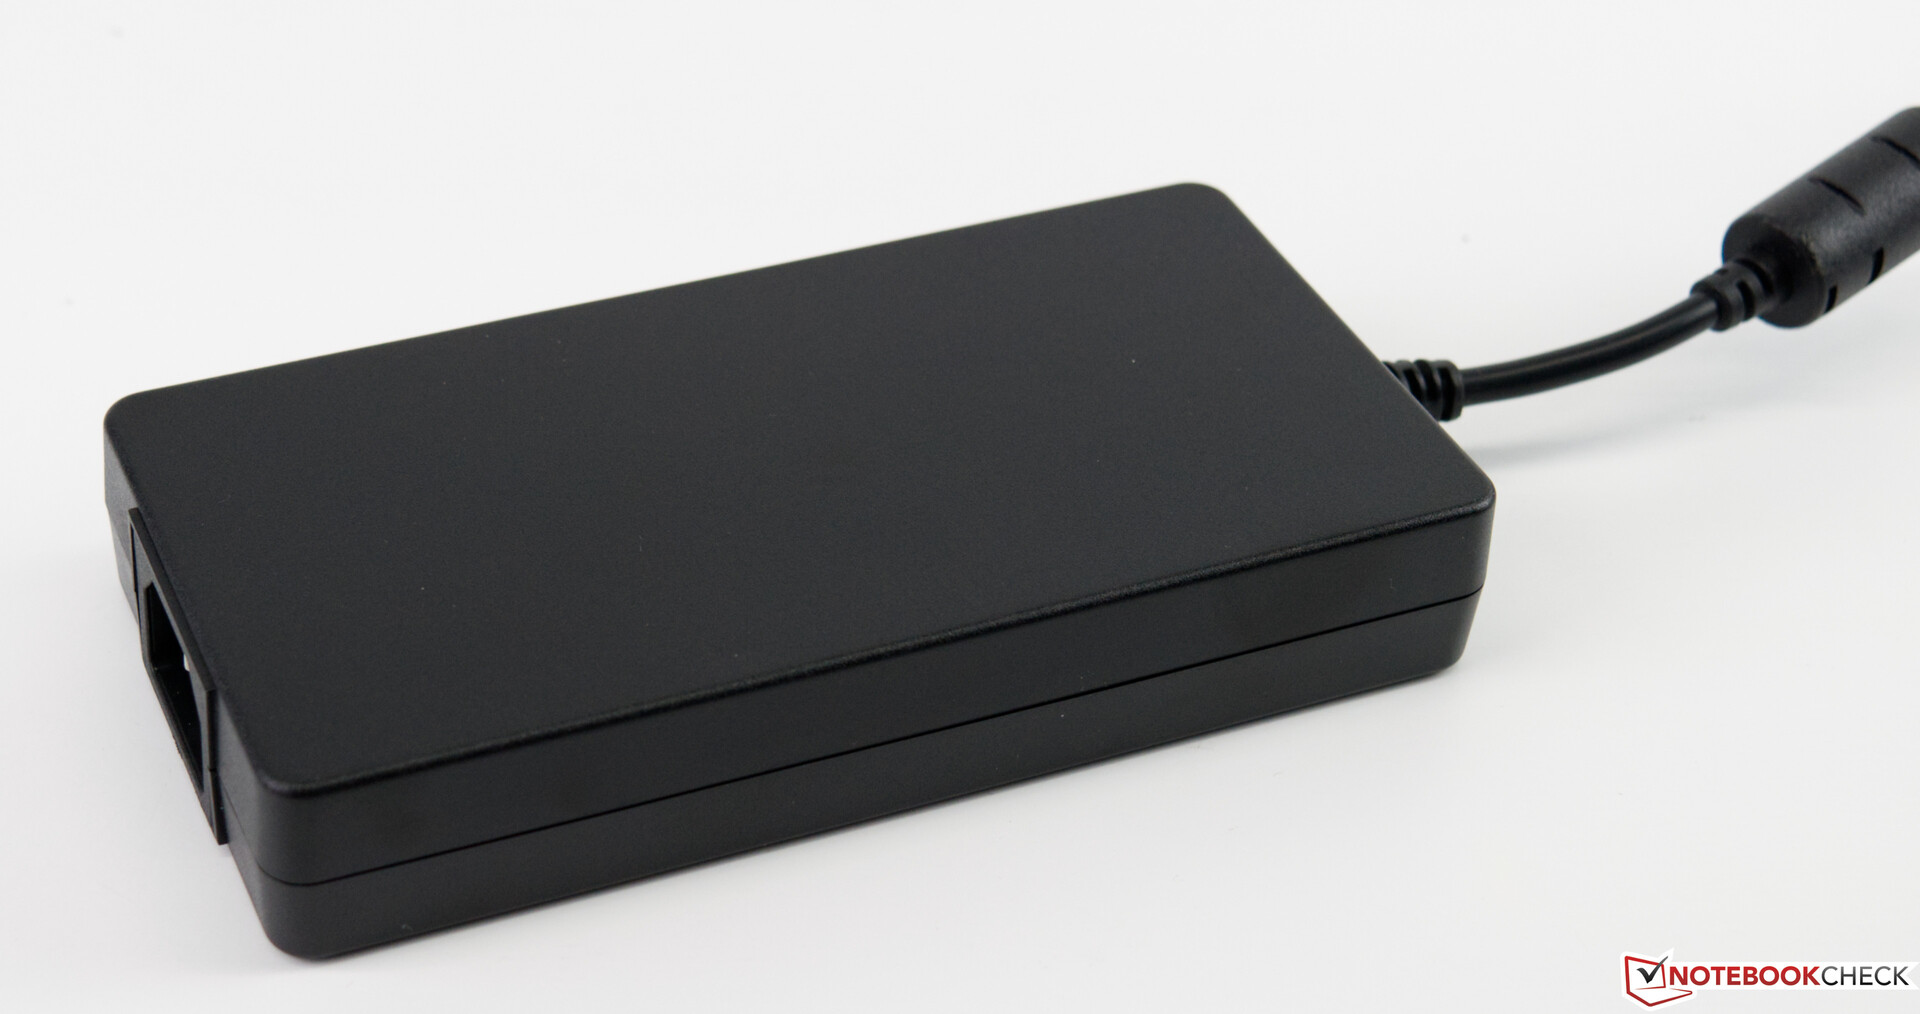
Förutom själva datorn innehåller lådan även ett 230-watts nätaggregat och ett stativ som gör att du kan placera enheten horisontellt.
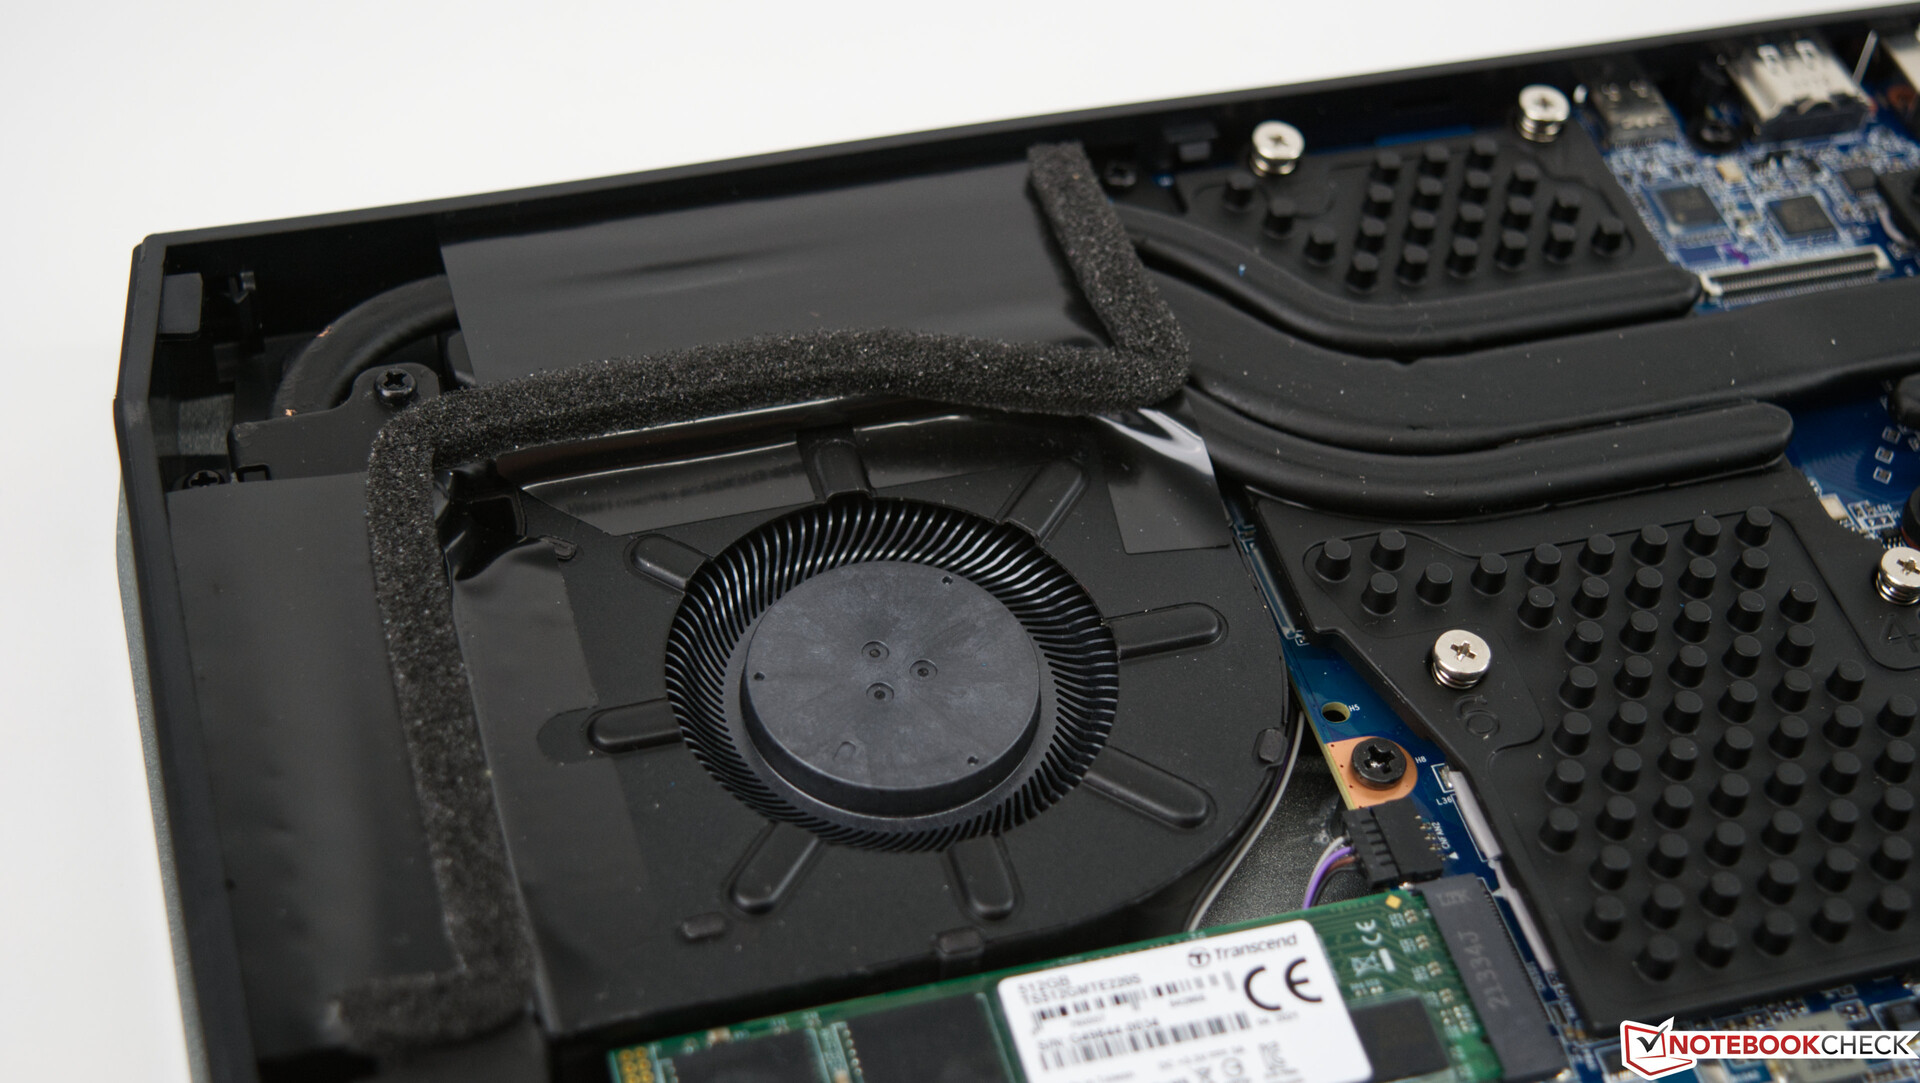
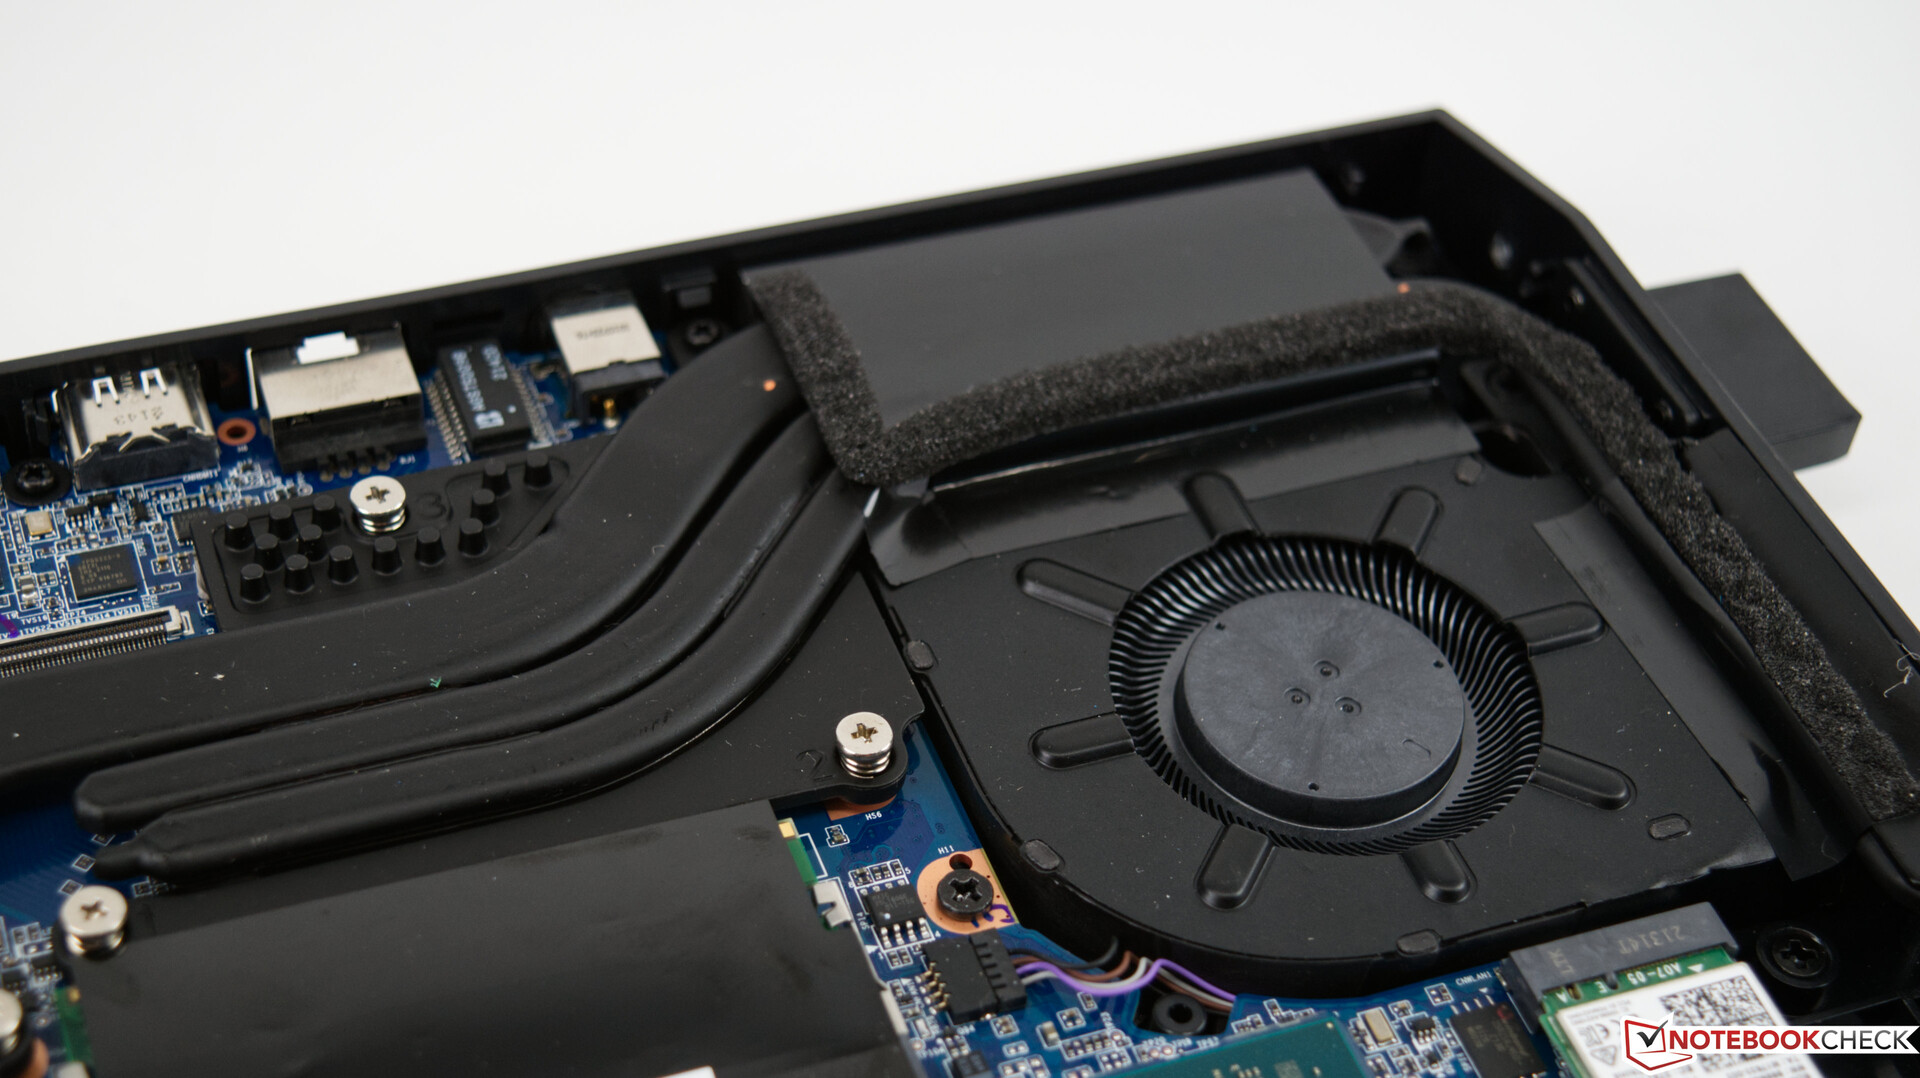
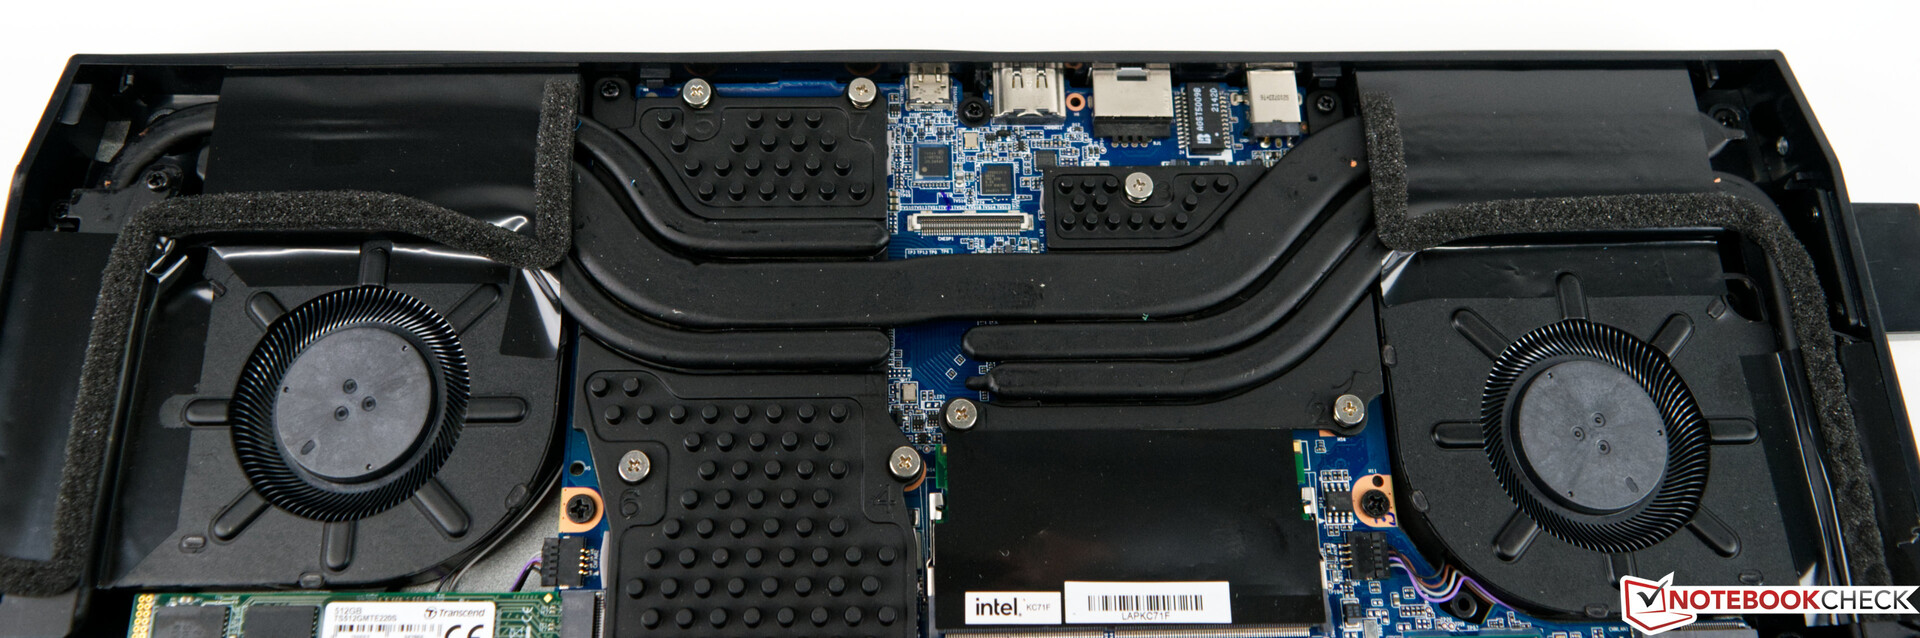
Underhåll
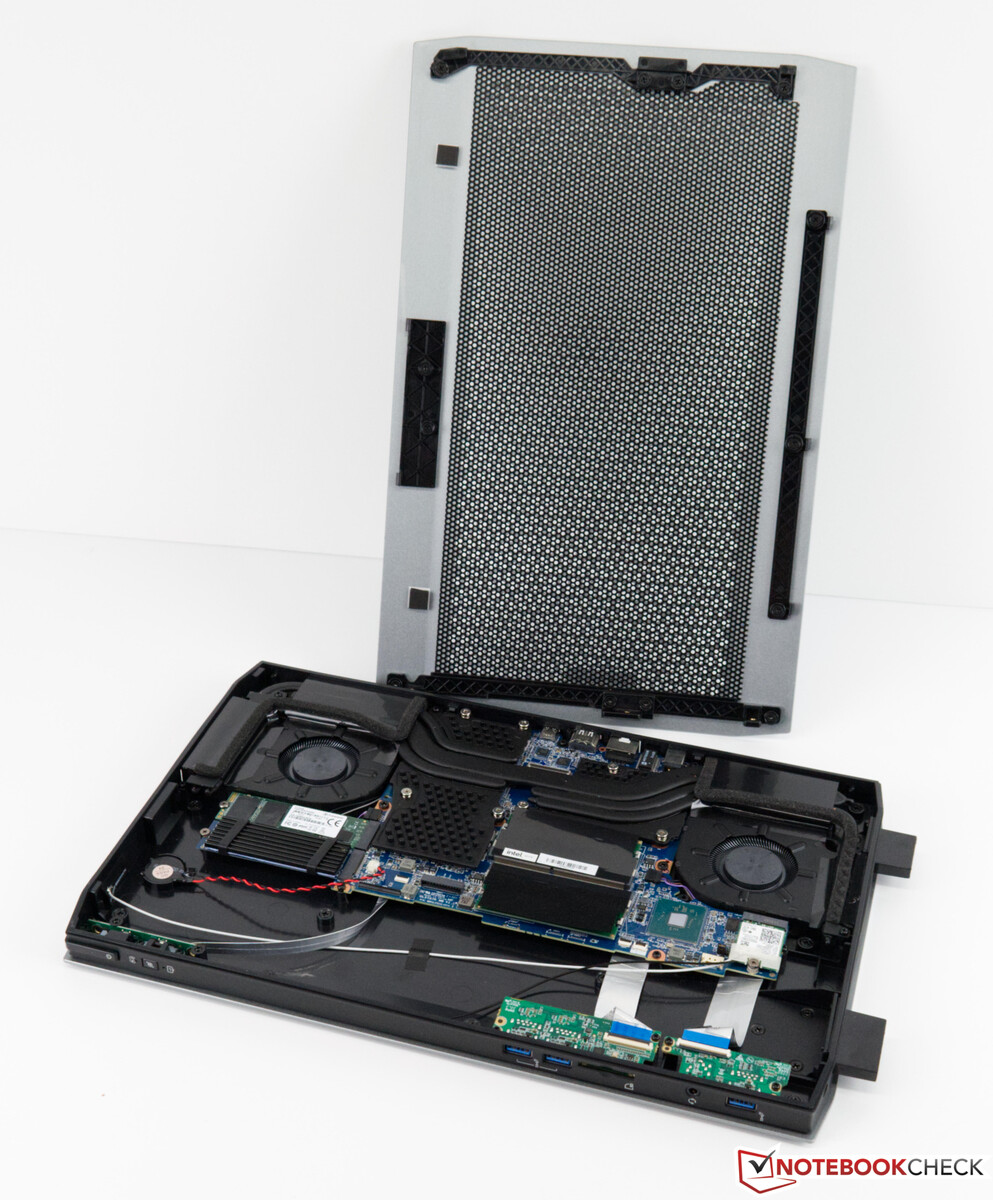
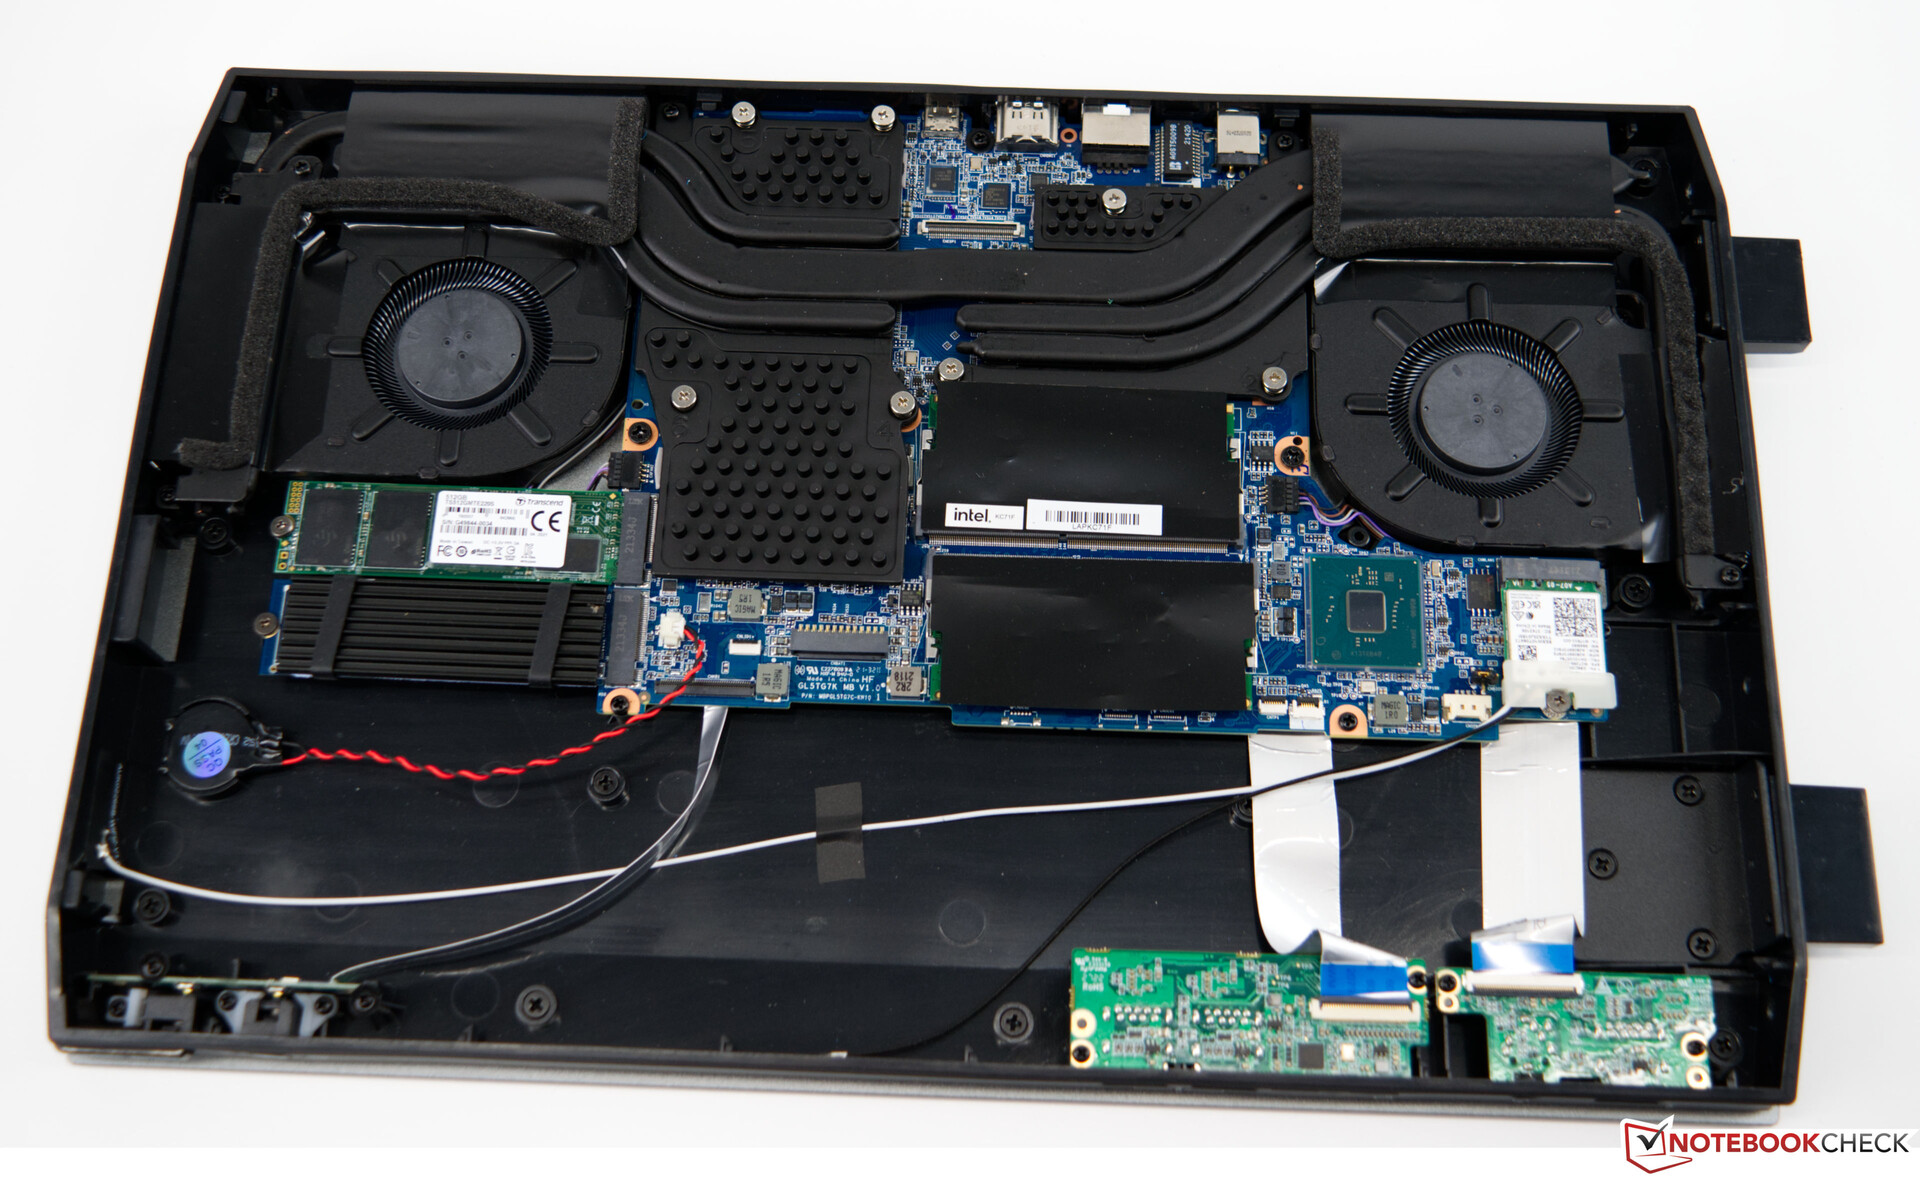
För expansion eller underhåll kan du ta bort enhetens sidokåpa. Den sitter fast i botten med tre skruvar, och efter att de har tagits bort kan du ta bort kåpan utan större problem. En medföljande broschyr förklarar också hur man gör detta. Efter att ha tagit bort locket kan du förledas att tro att du tittar på en bärbar dator. Men det finns fortfarande en hel del oanvänt utrymme, som vanligtvis skulle vara reserverat för ett batteri. Man kan också se varför man inte bara enkelt kunde lägga till några USB-portar på baksidan. Det enda utrymmet för några ytterligare anslutningar skulle vara framtill.
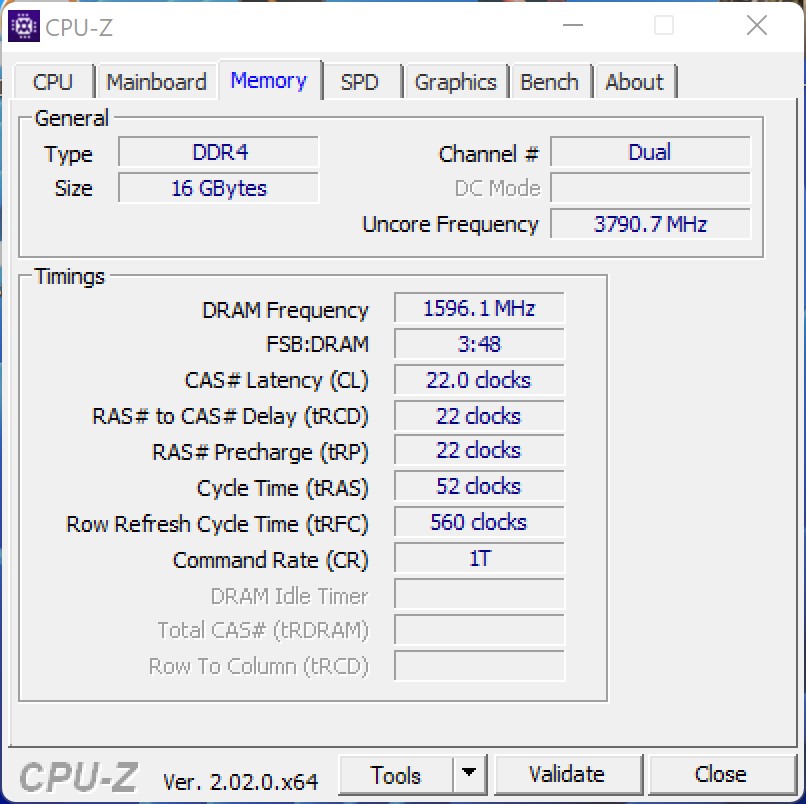
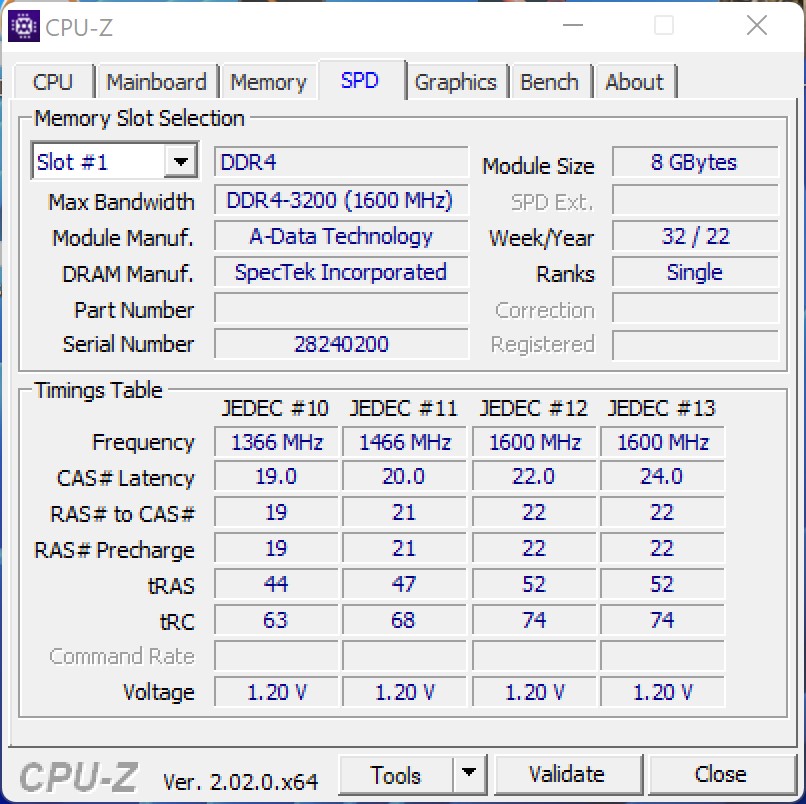
Du kan få plats med totalt två M.2 SSD-diskar i enheten, vilket vi också gjorde för det här testet. För att utöka arbetsminnet har du bara möjlighet att byta ut modulerna, eftersom båda SO-Dimm-platserna redan är upptagna med 8-GB-moduler.
Prestanda - En snabb Core i7-11800H
Med hjälp av Intel Core i7-11800Herbjuder vår testenhet en bra grund för att hantera krävande tillämpningar. I kombination med den Nvidia GeForce RTX 3070 GPU för bärbar datorser Minisforum NUCXi7 ut som en välutrustad bärbar dator för spel. De 16 GB RAM-minne räcker oftast till för alla aktuella spel, även om utrymmet kan bli lite trångt med SSD:ns 512 GB. Med den här utrustningen kan du också njuta av aktuella spel i 1 440p. De som endast vill spela spel i 1 080p bör titta närmare på Minisforum NUCXi5.
Testvillkor
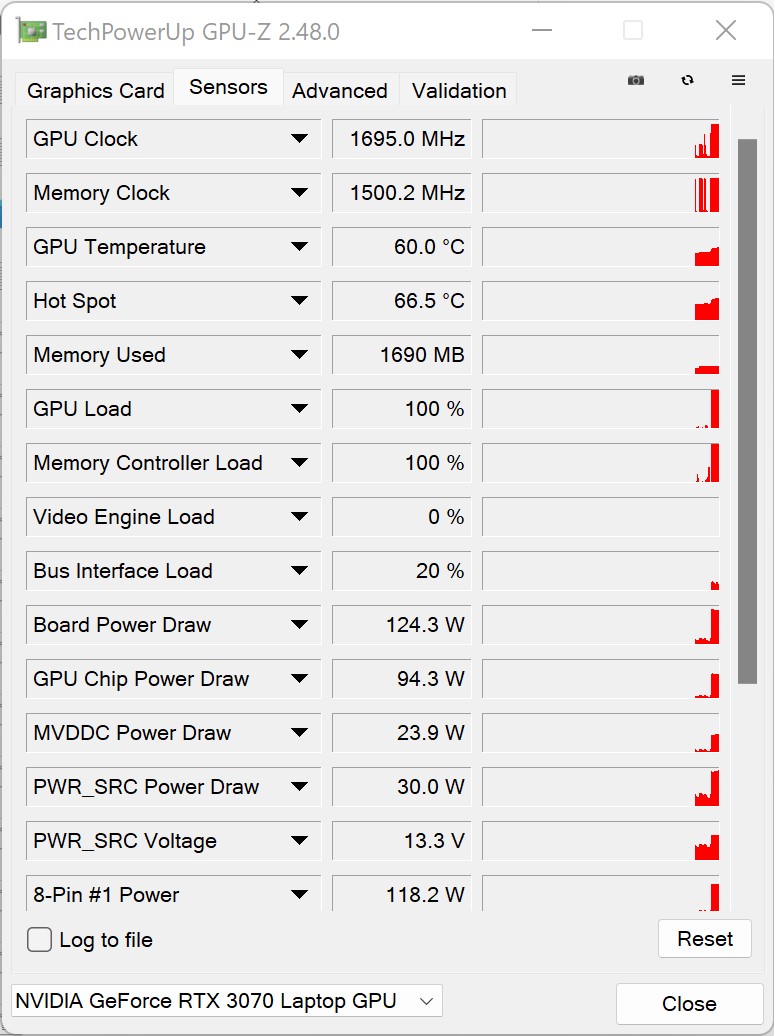
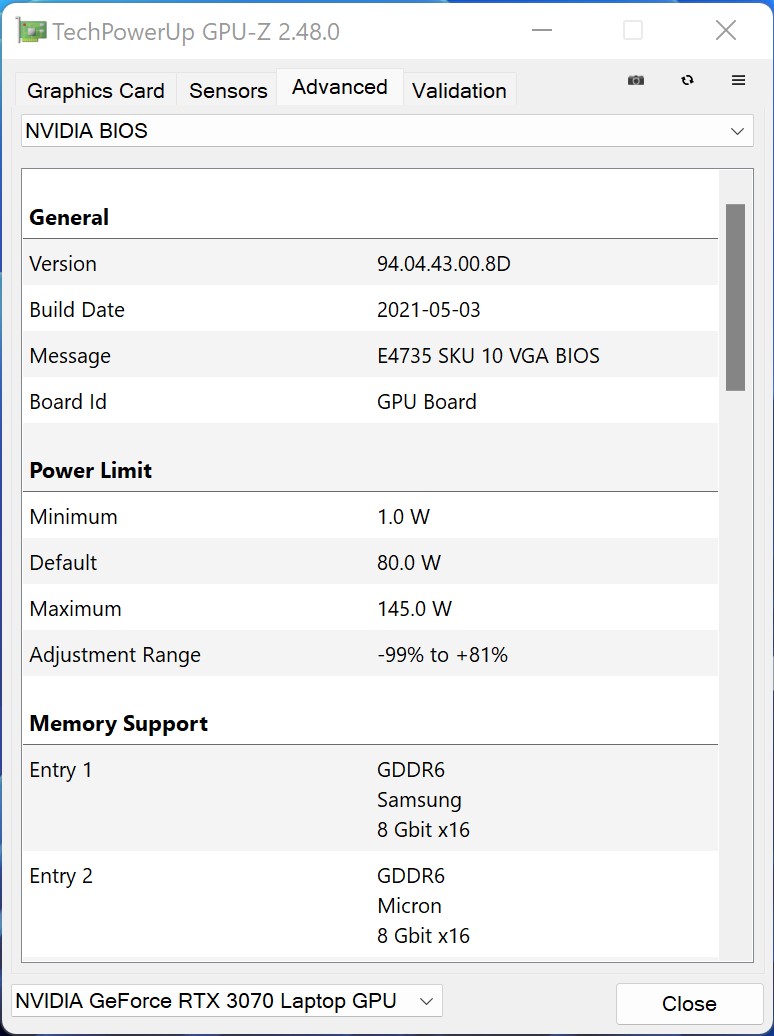
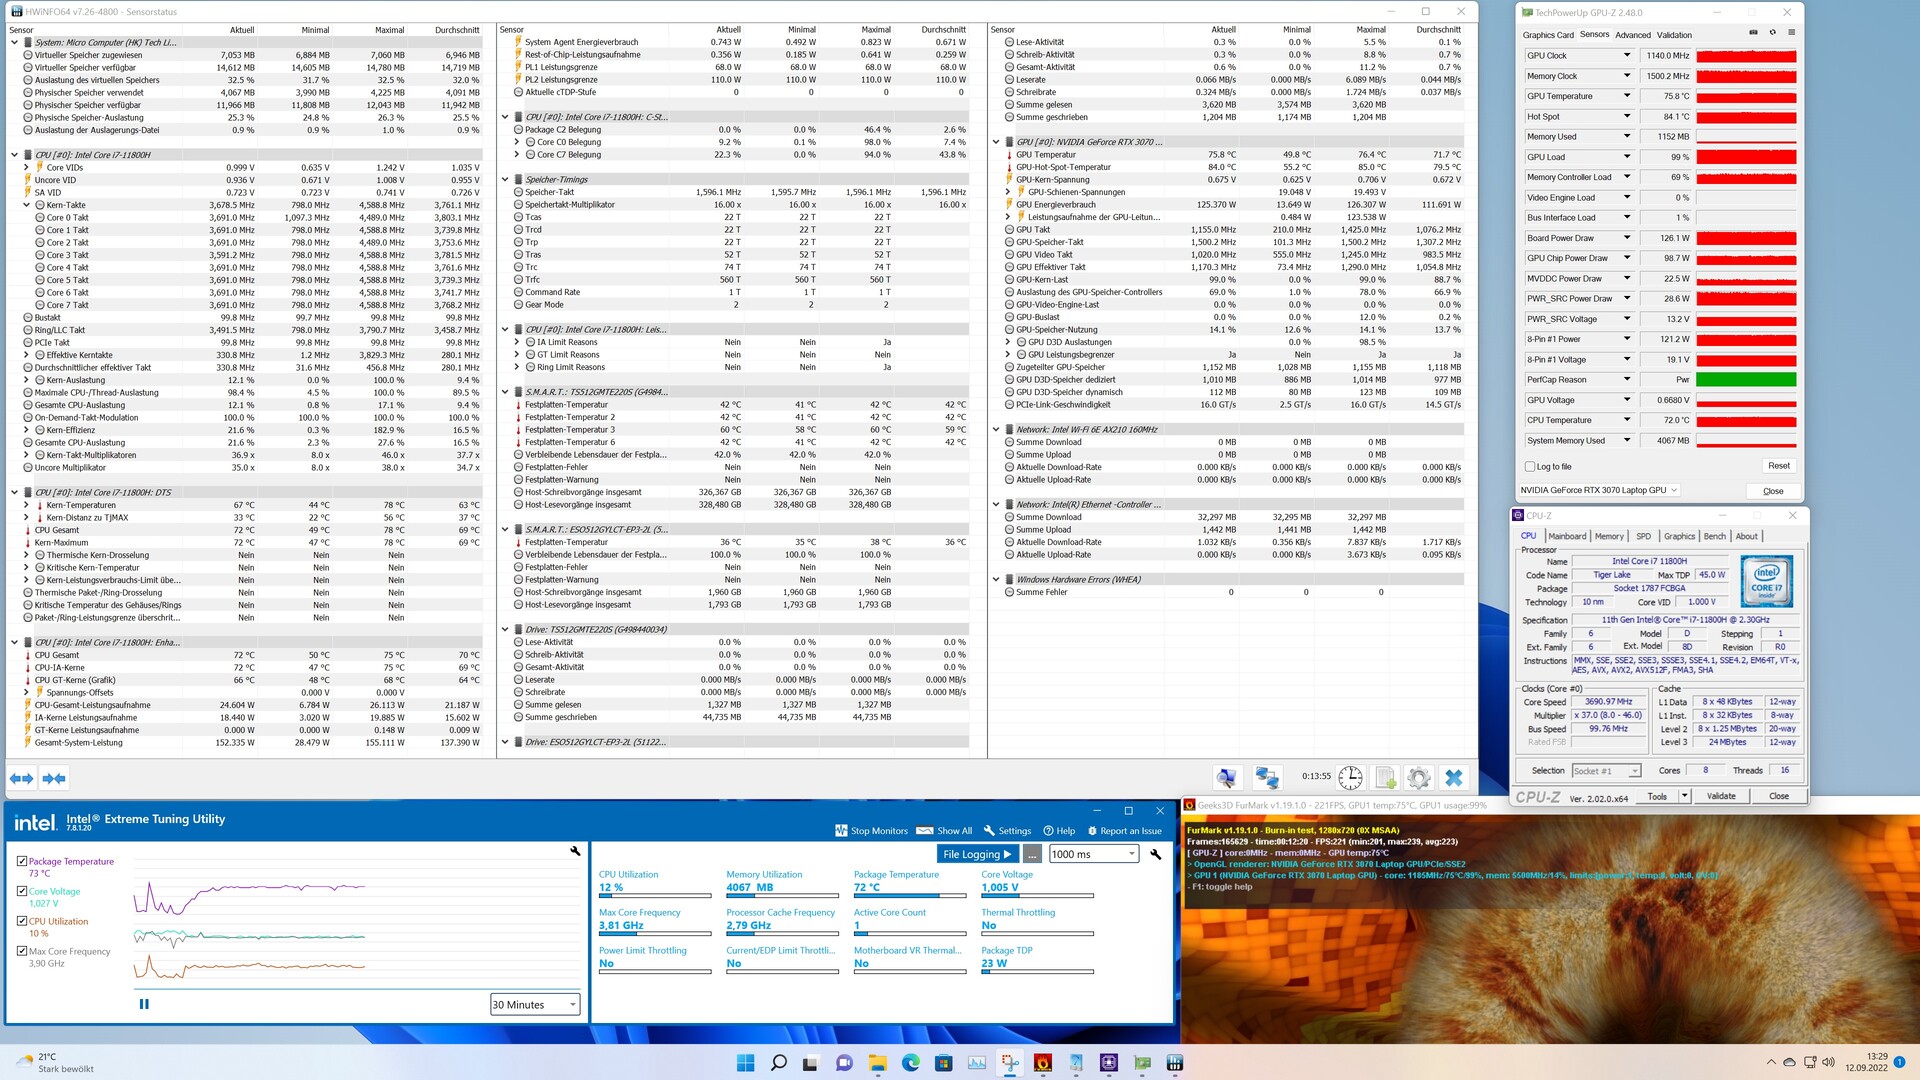
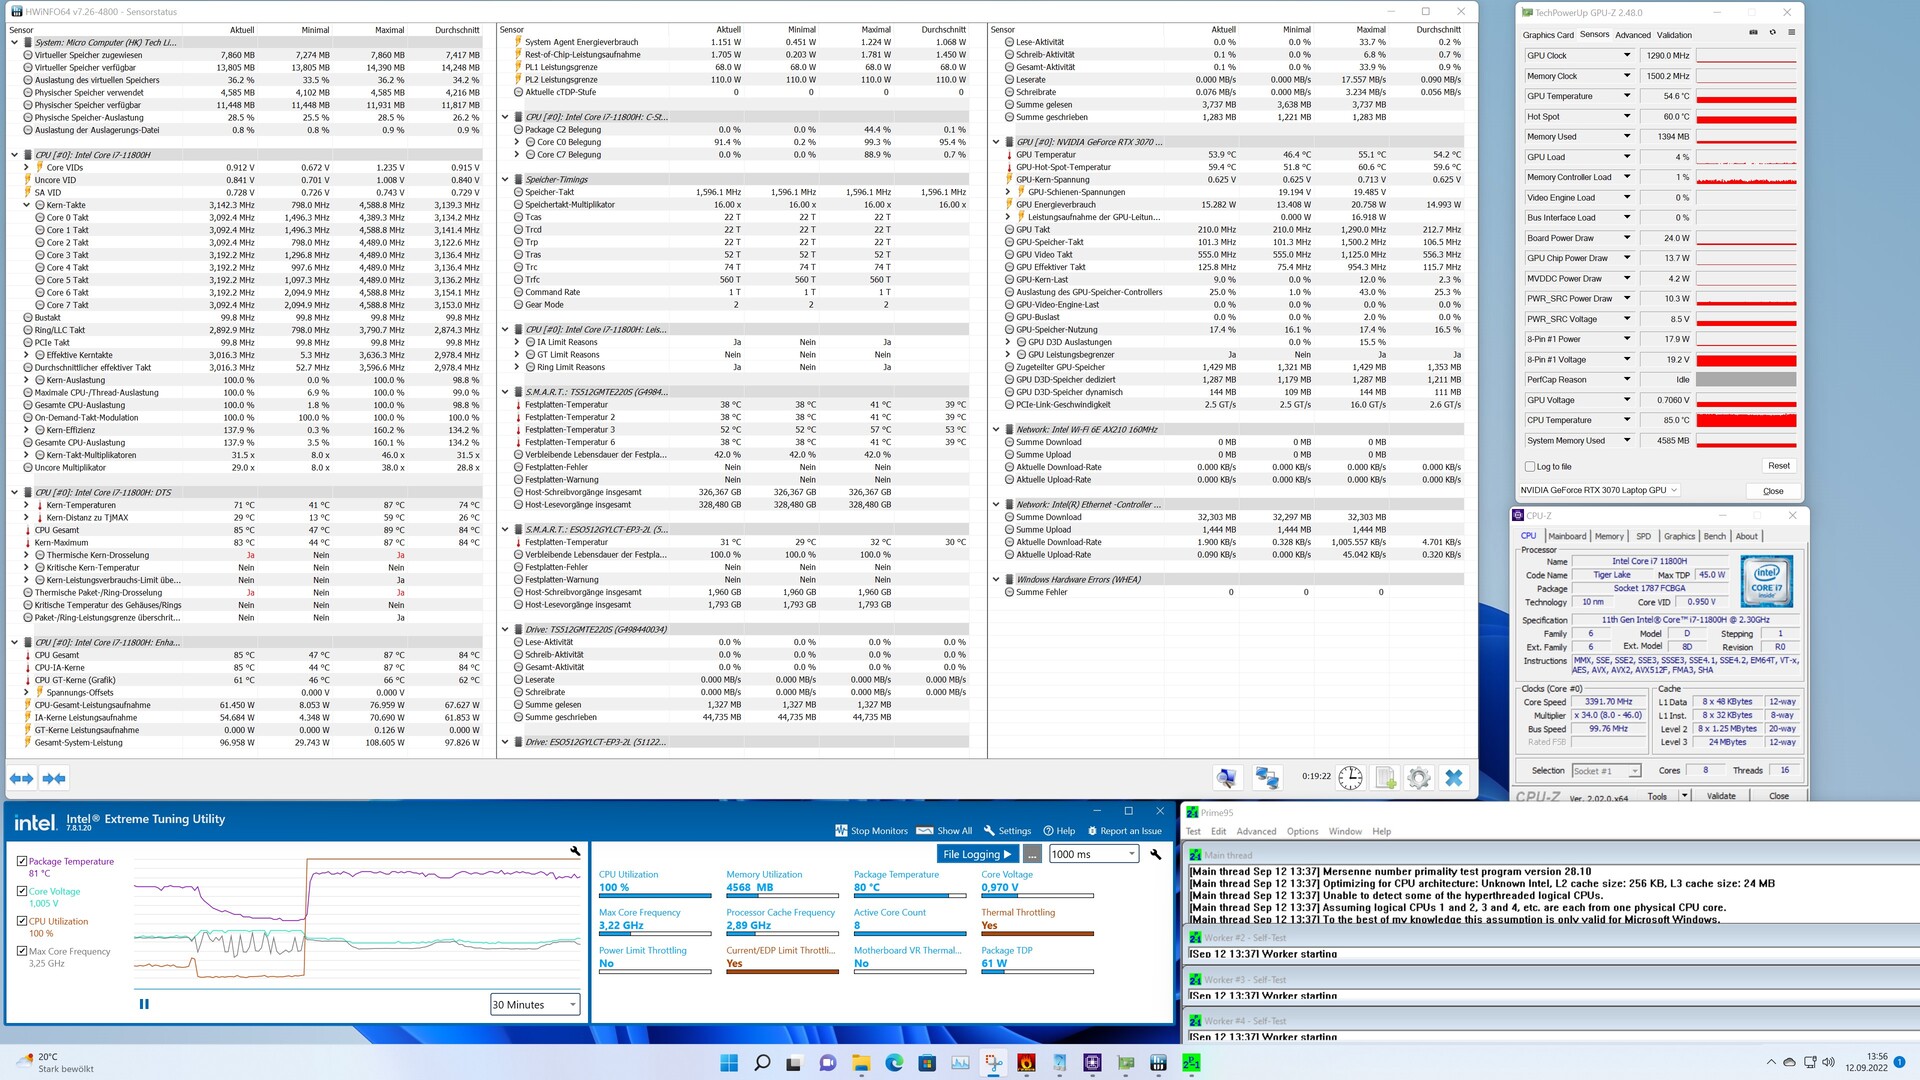
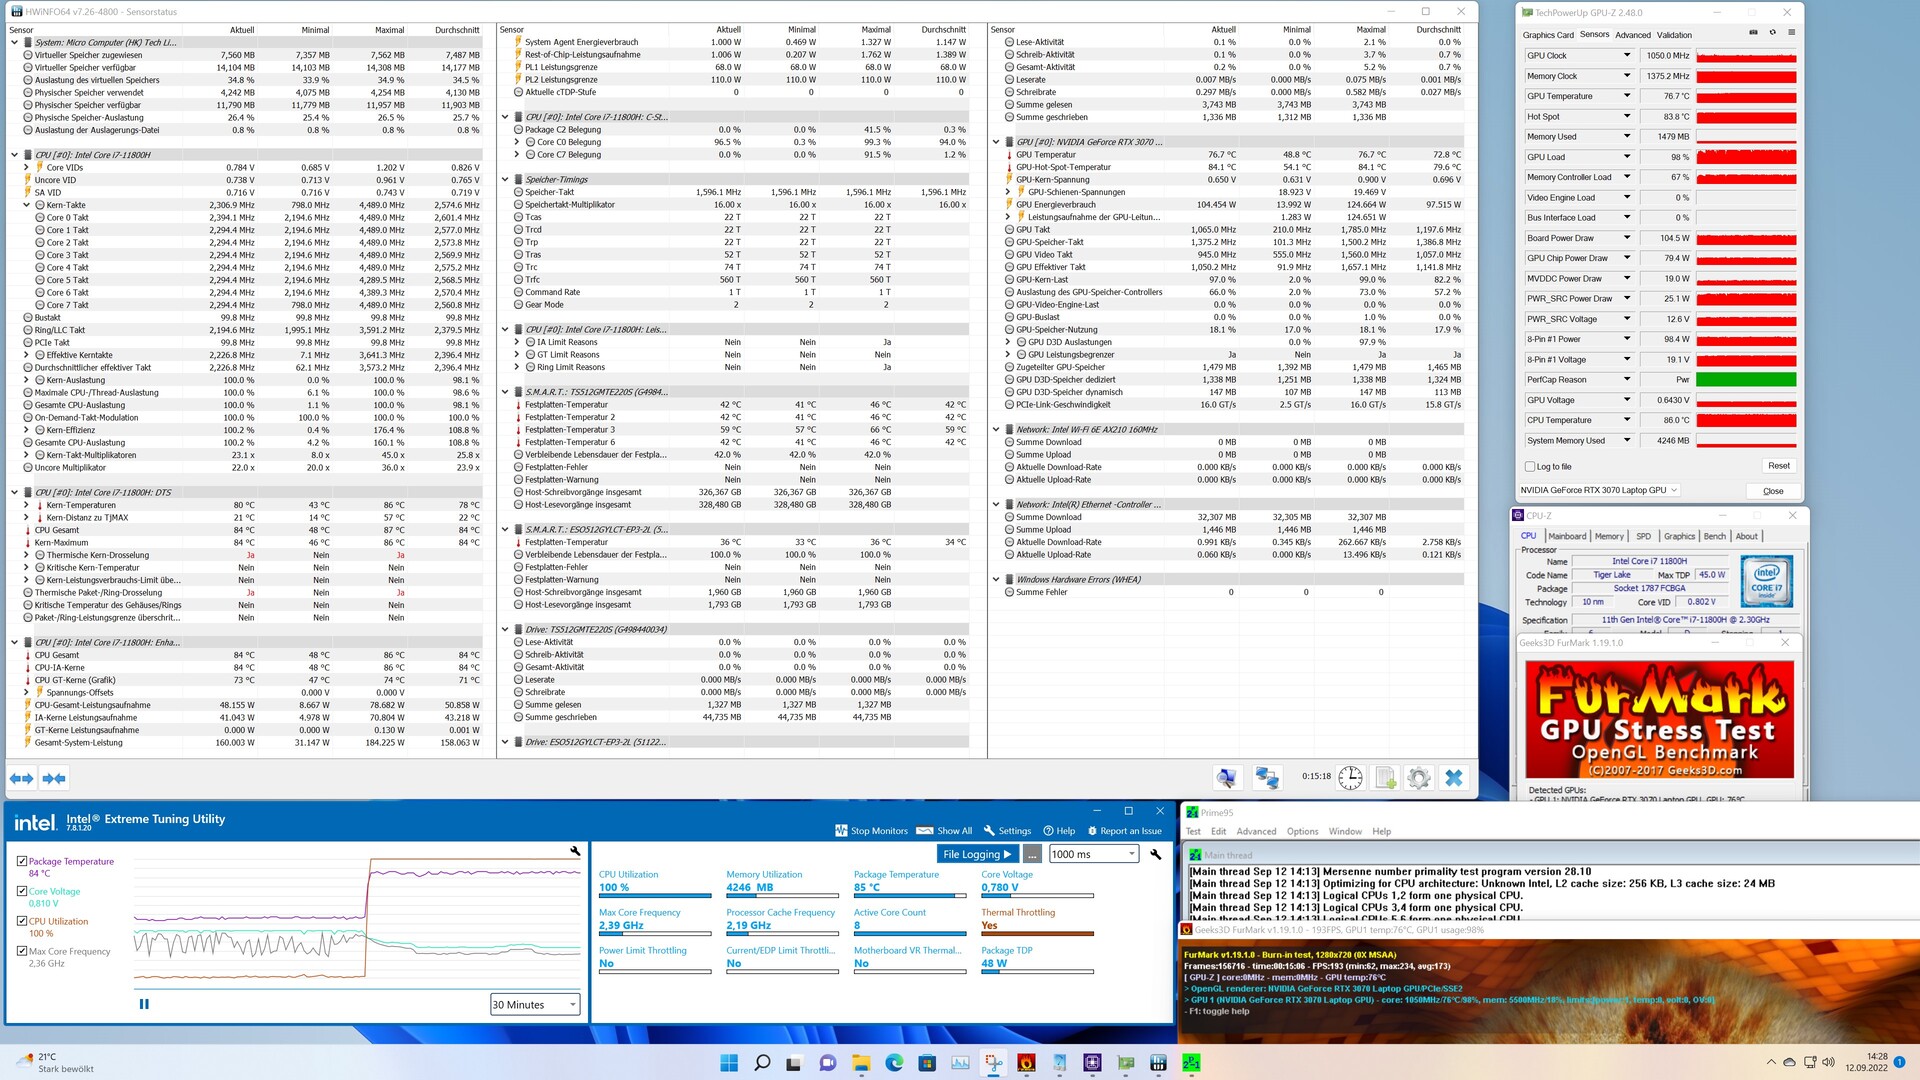
Vi körde alla prestandatester i spelläge. Detta kan aktiveras genom att trycka på en knapp på framsidan, vilket ger GPU:n en högre strömförbrukning under belastning. För att vara exakt motsvarar detta en ökning av GPU:s strömförbrukning till 125 watt.
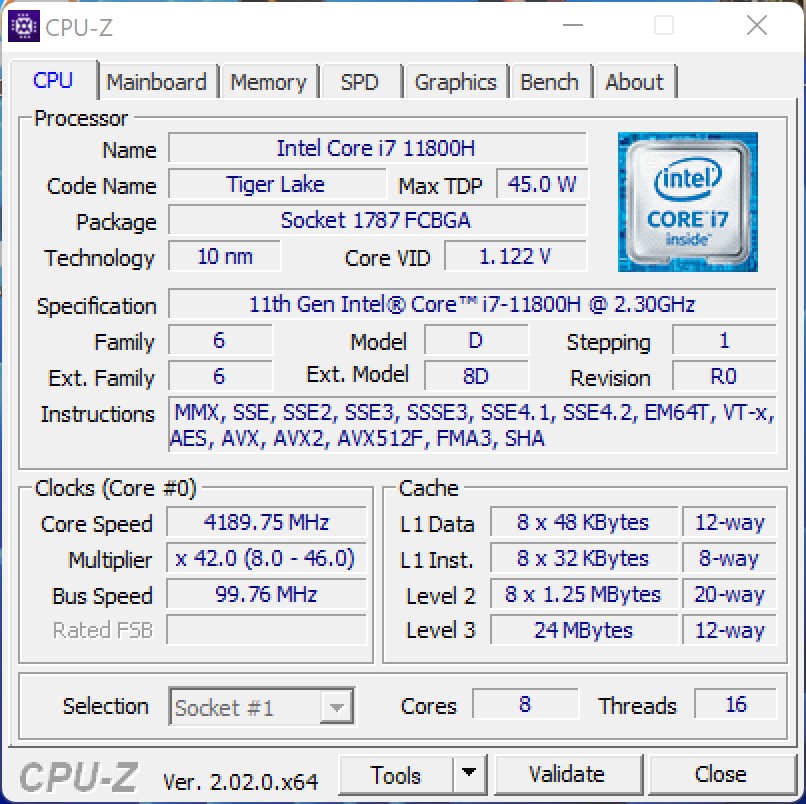
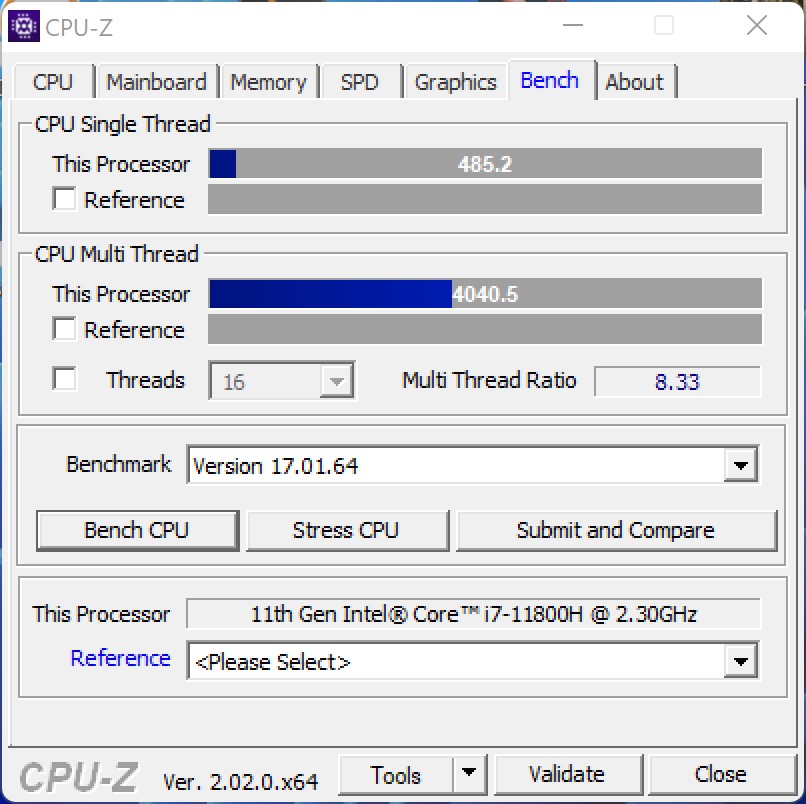
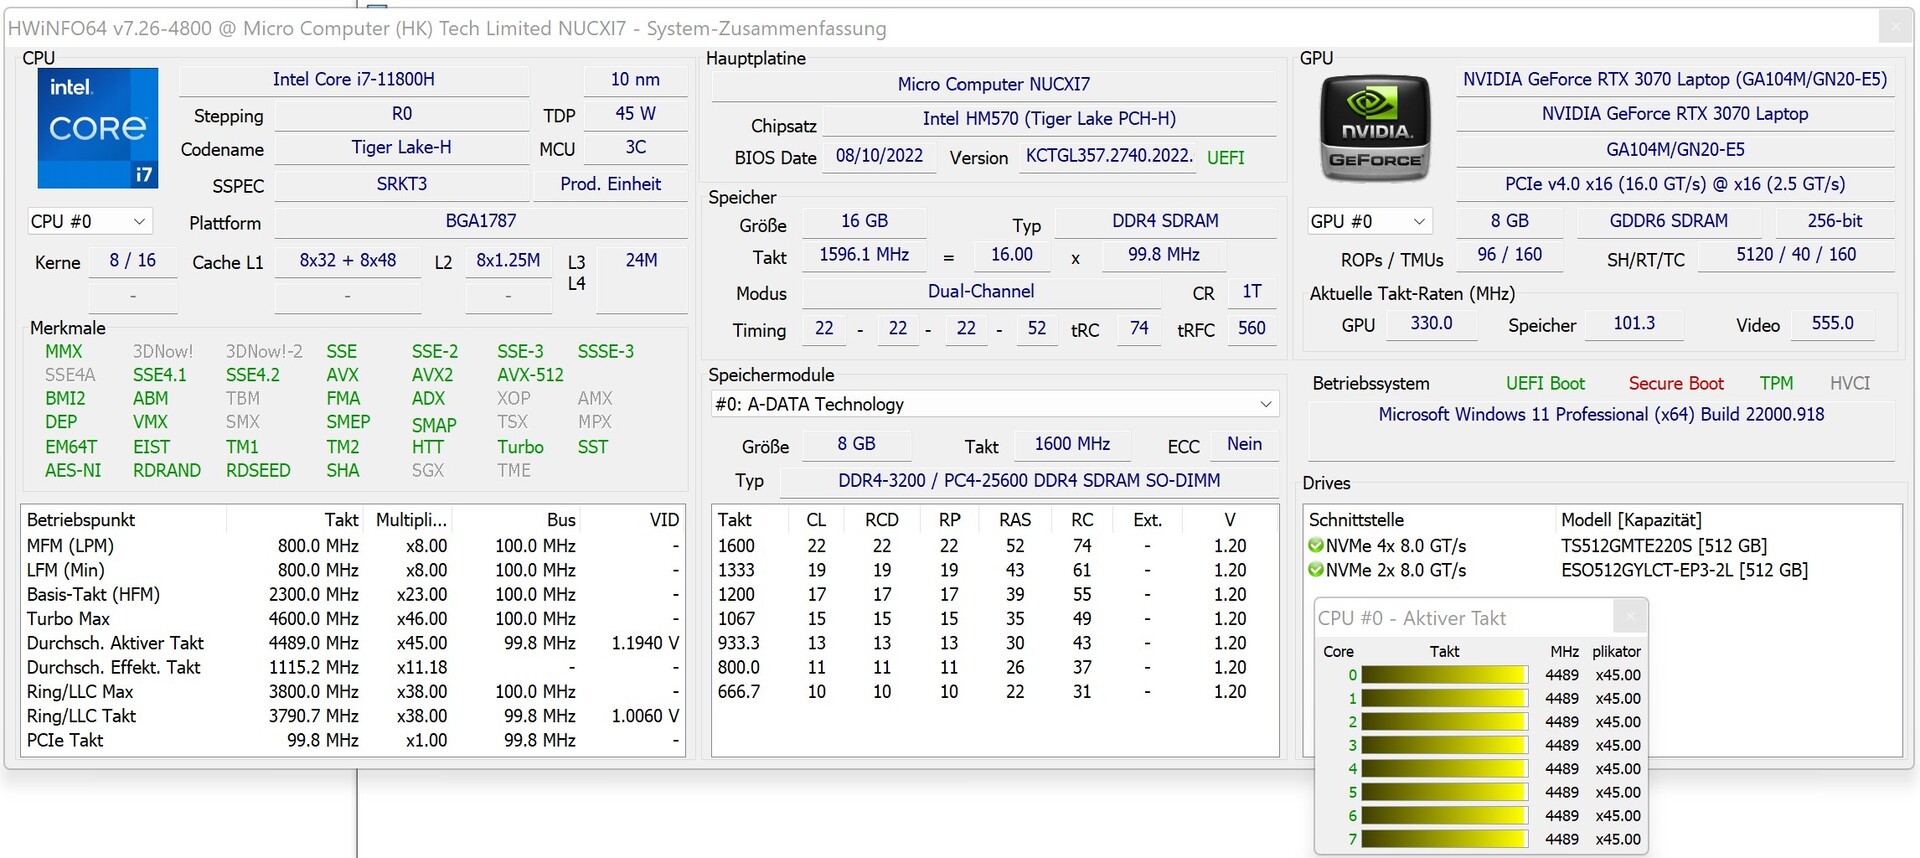
Processor
Intel Core i7-11800Hhar åtta kärnor och är baserad på Intels Tiger Lake -arkitektur. När det gäller strömförbrukningen ger Minisforum ett visst utrymme på upp till 110 watt (PL2), även om PL1 med 68 watt fortfarande är ett mycket bra värde för att uppnå en hög prestanda. Och detta är verkligen fallet, eftersom vår testenhet kan säkra en bra plats i mitten av fältet med den prestanda som uppnåtts i vårt test. Nackdelen bakom de snabbare jämförelseenheterna är liten och subjektivt sett inte märkbar.
Du kan hitta ytterligare riktmärken för processorerna här.
| Performance rating - Percent | |
| Intel Dragon Canyon NUC - RTX 3060 | |
| Gigabyte A7 X1 -17! | |
| Intel Beast Canyon NUC | |
| Minisforum NUCX i7 | |
| Genomsnitt Intel Core i7-11800H | |
| Zotac ZBOX Magnus EN173070C | |
| Zotac Magnus One (ECM73070C) -2! | |
| Zotac MEK Mini (RTX 2070 Super) | |
| Cinebench R15 | |
| CPU Single 64Bit | |
| Intel Dragon Canyon NUC - RTX 3060 | |
| Intel Beast Canyon NUC | |
| Gigabyte A7 X1 | |
| Minisforum NUCX i7 | |
| Genomsnitt Intel Core i7-11800H (201 - 231, n=46) | |
| Zotac ZBOX Magnus EN173070C | |
| Zotac MEK Mini (RTX 2070 Super) | |
| Zotac Magnus One (ECM73070C) | |
| CPU Multi 64Bit | |
| Intel Dragon Canyon NUC - RTX 3060 | |
| Gigabyte A7 X1 | |
| Minisforum NUCX i7 | |
| Intel Beast Canyon NUC | |
| Genomsnitt Intel Core i7-11800H (1342 - 2173, n=50) | |
| Zotac ZBOX Magnus EN173070C | |
| Zotac Magnus One (ECM73070C) | |
| Zotac MEK Mini (RTX 2070 Super) | |
| Cinebench R20 | |
| CPU (Single Core) | |
| Intel Dragon Canyon NUC - RTX 3060 | |
| Intel Beast Canyon NUC | |
| Gigabyte A7 X1 | |
| Minisforum NUCX i7 | |
| Genomsnitt Intel Core i7-11800H (520 - 586, n=47) | |
| Zotac ZBOX Magnus EN173070C | |
| Zotac MEK Mini (RTX 2070 Super) | |
| CPU (Multi Core) | |
| Intel Dragon Canyon NUC - RTX 3060 | |
| Gigabyte A7 X1 | |
| Minisforum NUCX i7 | |
| Intel Beast Canyon NUC | |
| Genomsnitt Intel Core i7-11800H (2498 - 5408, n=50) | |
| Zotac ZBOX Magnus EN173070C | |
| Zotac MEK Mini (RTX 2070 Super) | |
| Cinebench R11.5 | |
| CPU Single 64Bit | |
| Intel Dragon Canyon NUC - RTX 3060 | |
| Intel Beast Canyon NUC | |
| Minisforum NUCX i7 | |
| Zotac ZBOX Magnus EN173070C | |
| Genomsnitt Intel Core i7-11800H (2.45 - 2.62, n=4) | |
| Zotac Magnus One (ECM73070C) | |
| Zotac MEK Mini (RTX 2070 Super) | |
| CPU Multi 64Bit | |
| Intel Dragon Canyon NUC - RTX 3060 | |
| Intel Beast Canyon NUC | |
| Minisforum NUCX i7 | |
| Zotac ZBOX Magnus EN173070C | |
| Genomsnitt Intel Core i7-11800H (16 - 21.9, n=4) | |
| Zotac Magnus One (ECM73070C) | |
| Zotac MEK Mini (RTX 2070 Super) | |
| Cinebench R10 | |
| Rendering Single CPUs 64Bit | |
| Intel Dragon Canyon NUC - RTX 3060 | |
| Intel Beast Canyon NUC | |
| Minisforum NUCX i7 | |
| Zotac ZBOX Magnus EN173070C | |
| Genomsnitt Intel Core i7-11800H (10903 - 11957, n=4) | |
| Zotac Magnus One (ECM73070C) | |
| Zotac MEK Mini (RTX 2070 Super) | |
| Rendering Multiple CPUs 64Bit | |
| Intel Dragon Canyon NUC - RTX 3060 | |
| Minisforum NUCX i7 | |
| Intel Beast Canyon NUC | |
| Zotac ZBOX Magnus EN173070C | |
| Genomsnitt Intel Core i7-11800H (49232 - 67486, n=4) | |
| Zotac Magnus One (ECM73070C) | |
| Zotac MEK Mini (RTX 2070 Super) | |
| Blender - v2.79 BMW27 CPU | |
| Zotac MEK Mini (RTX 2070 Super) | |
| Zotac Magnus One (ECM73070C) | |
| Zotac ZBOX Magnus EN173070C | |
| Genomsnitt Intel Core i7-11800H (217 - 454, n=46) | |
| Intel Beast Canyon NUC | |
| Intel Dragon Canyon NUC - RTX 3060 | |
| Minisforum NUCX i7 | |
| Gigabyte A7 X1 | |
| wPrime 2.10 | |
| 32m | |
| Zotac MEK Mini (RTX 2070 Super) | |
| Zotac ZBOX Magnus EN173070C | |
| Genomsnitt Intel Core i7-11800H (3.41 - 4.19, n=3) | |
| Intel Beast Canyon NUC | |
| Minisforum NUCX i7 | |
| Zotac Magnus One (ECM73070C) | |
| Intel Dragon Canyon NUC - RTX 3060 | |
| 1024m | |
| Intel Dragon Canyon NUC - RTX 3060 | |
| Zotac MEK Mini (RTX 2070 Super) | |
| Zotac ZBOX Magnus EN173070C | |
| Zotac Magnus One (ECM73070C) | |
| Genomsnitt Intel Core i7-11800H (98.3 - 121.1, n=3) | |
| Intel Beast Canyon NUC | |
| Minisforum NUCX i7 | |
| X264 HD Benchmark 4.0 | |
| Pass 1 | |
| Intel Dragon Canyon NUC - RTX 3060 | |
| Intel Beast Canyon NUC | |
| Minisforum NUCX i7 | |
| Genomsnitt Intel Core i7-11800H (242 - 258, n=3) | |
| Zotac MEK Mini (RTX 2070 Super) | |
| Zotac ZBOX Magnus EN173070C | |
| Zotac Magnus One (ECM73070C) | |
| Pass 2 | |
| Intel Dragon Canyon NUC - RTX 3060 | |
| Minisforum NUCX i7 | |
| Intel Beast Canyon NUC | |
| Genomsnitt Intel Core i7-11800H (86.3 - 109.3, n=3) | |
| Zotac ZBOX Magnus EN173070C | |
| Zotac Magnus One (ECM73070C) | |
| Zotac MEK Mini (RTX 2070 Super) | |
| WinRAR - Result | |
| Intel Dragon Canyon NUC - RTX 3060 | |
| Intel Beast Canyon NUC | |
| Genomsnitt Intel Core i7-11800H (7925 - 8569, n=3) | |
| Minisforum NUCX i7 | |
| Zotac ZBOX Magnus EN173070C | |
| Zotac MEK Mini (RTX 2070 Super) | |
| Zotac Magnus One (ECM73070C) | |
| TrueCrypt | |
| AES Mean 100MB | |
| Intel Dragon Canyon NUC - RTX 3060 | |
| Intel Beast Canyon NUC | |
| Minisforum NUCX i7 | |
| Zotac Magnus One (ECM73070C) | |
| Zotac ZBOX Magnus EN173070C | |
| Genomsnitt Intel Core i7-11800H (6.5 - 11.6, n=4) | |
| Zotac MEK Mini (RTX 2070 Super) | |
| Twofish Mean 100MB | |
| Intel Dragon Canyon NUC - RTX 3060 | |
| Zotac Magnus One (ECM73070C) | |
| Intel Beast Canyon NUC | |
| Minisforum NUCX i7 | |
| Genomsnitt Intel Core i7-11800H (1.5 - 1.7, n=4) | |
| Zotac ZBOX Magnus EN173070C | |
| Zotac MEK Mini (RTX 2070 Super) | |
| Serpent Mean 100MB | |
| Intel Dragon Canyon NUC - RTX 3060 | |
| Zotac Magnus One (ECM73070C) | |
| Intel Beast Canyon NUC | |
| Minisforum NUCX i7 | |
| Genomsnitt Intel Core i7-11800H (0.9 - 1.1, n=4) | |
| Zotac ZBOX Magnus EN173070C | |
| Zotac MEK Mini (RTX 2070 Super) | |
| Geekbench 5.5 | |
| Multi-Core | |
| Minisforum NUCX i7 | |
| Intel Beast Canyon NUC | |
| Intel Dragon Canyon NUC - RTX 3060 | |
| Genomsnitt Intel Core i7-11800H (4655 - 9851, n=40) | |
| Zotac ZBOX Magnus EN173070C | |
| Zotac Magnus One (ECM73070C) | |
| Gigabyte A7 X1 | |
| Zotac MEK Mini (RTX 2070 Super) | |
| Single-Core | |
| Intel Beast Canyon NUC | |
| Intel Dragon Canyon NUC - RTX 3060 | |
| Zotac ZBOX Magnus EN173070C | |
| Minisforum NUCX i7 | |
| Genomsnitt Intel Core i7-11800H (1429 - 1625, n=40) | |
| Gigabyte A7 X1 | |
| Zotac MEK Mini (RTX 2070 Super) | |
| Zotac Magnus One (ECM73070C) | |
| Geekbench 5.0 | |
| 5.0 Multi-Core | |
| Minisforum NUCX i7 | |
| Intel Beast Canyon NUC | |
| Intel Dragon Canyon NUC - RTX 3060 | |
| Zotac Magnus One (ECM73070C) | |
| Zotac ZBOX Magnus EN173070C | |
| Genomsnitt Intel Core i7-11800H (6340 - 9103, n=8) | |
| Zotac MEK Mini (RTX 2070 Super) | |
| 5.0 Single-Core | |
| Intel Beast Canyon NUC | |
| Intel Dragon Canyon NUC - RTX 3060 | |
| Zotac ZBOX Magnus EN173070C | |
| Minisforum NUCX i7 | |
| Genomsnitt Intel Core i7-11800H (1436 - 1571, n=8) | |
| Zotac Magnus One (ECM73070C) | |
| Zotac MEK Mini (RTX 2070 Super) | |
| Geekbench 4.4 | |
| 64 Bit Single-Core Score | |
| Intel Beast Canyon NUC | |
| Intel Dragon Canyon NUC - RTX 3060 | |
| Zotac ZBOX Magnus EN173070C | |
| Minisforum NUCX i7 | |
| Genomsnitt Intel Core i7-11800H (6104 - 6747, n=7) | |
| Zotac MEK Mini (RTX 2070 Super) | |
| Zotac Magnus One (ECM73070C) | |
| 64 Bit Multi-Core Score | |
| Minisforum NUCX i7 | |
| Intel Beast Canyon NUC | |
| Intel Dragon Canyon NUC - RTX 3060 | |
| Genomsnitt Intel Core i7-11800H (27454 - 36706, n=7) | |
| Zotac ZBOX Magnus EN173070C | |
| Zotac Magnus One (ECM73070C) | |
| Zotac MEK Mini (RTX 2070 Super) | |
| 3DMark 11 - 1280x720 Performance Physics | |
| Intel Dragon Canyon NUC - RTX 3060 | |
| Intel Beast Canyon NUC | |
| Minisforum NUCX i7 | |
| Genomsnitt Intel Core i7-11800H (10590 - 19167, n=46) | |
| Zotac ZBOX Magnus EN173070C | |
| Zotac Magnus One (ECM73070C) | |
| Gigabyte A7 X1 | |
| Zotac MEK Mini (RTX 2070 Super) | |
| 7-Zip 18.03 | |
| 7z b 4 | |
| Gigabyte A7 X1 | |
| Minisforum NUCX i7 | |
| Intel Beast Canyon NUC | |
| Intel Dragon Canyon NUC - RTX 3060 | |
| Genomsnitt Intel Core i7-11800H (33718 - 56758, n=46) | |
| Zotac ZBOX Magnus EN173070C | |
| Zotac Magnus One (ECM73070C) | |
| Zotac MEK Mini (RTX 2070 Super) | |
| 7z b 4 -mmt1 | |
| Intel Beast Canyon NUC | |
| Intel Dragon Canyon NUC - RTX 3060 | |
| Gigabyte A7 X1 | |
| Zotac ZBOX Magnus EN173070C | |
| Genomsnitt Intel Core i7-11800H (5138 - 5732, n=46) | |
| Minisforum NUCX i7 | |
| Zotac Magnus One (ECM73070C) | |
| Zotac MEK Mini (RTX 2070 Super) | |
| HWBOT x265 Benchmark v2.2 - 4k Preset | |
| Gigabyte A7 X1 | |
| Minisforum NUCX i7 | |
| Intel Beast Canyon NUC | |
| Intel Dragon Canyon NUC - RTX 3060 | |
| Genomsnitt Intel Core i7-11800H (7.38 - 17.4, n=46) | |
| Zotac ZBOX Magnus EN173070C | |
| Zotac Magnus One (ECM73070C) | |
| Zotac MEK Mini (RTX 2070 Super) | |
| R Benchmark 2.5 - Overall mean | |
| Zotac MEK Mini (RTX 2070 Super) | |
| Zotac Magnus One (ECM73070C) | |
| Genomsnitt Intel Core i7-11800H (0.548 - 0.615, n=46) | |
| Minisforum NUCX i7 | |
| Zotac ZBOX Magnus EN173070C | |
| Intel Beast Canyon NUC | |
| Intel Dragon Canyon NUC - RTX 3060 | |
| Gigabyte A7 X1 | |
| LibreOffice - 20 Documents To PDF | |
| Zotac Magnus One (ECM73070C) | |
| Gigabyte A7 X1 | |
| Minisforum NUCX i7 | |
| Zotac MEK Mini (RTX 2070 Super) | |
| Zotac ZBOX Magnus EN173070C | |
| Genomsnitt Intel Core i7-11800H (38.6 - 59.9, n=45) | |
| Intel Beast Canyon NUC | |
| Intel Dragon Canyon NUC - RTX 3060 | |
| WebXPRT 3 - Overall | |
| Gigabyte A7 X1 | |
| Intel Beast Canyon NUC | |
| Intel Dragon Canyon NUC - RTX 3060 | |
| Zotac ZBOX Magnus EN173070C | |
| Genomsnitt Intel Core i7-11800H (251 - 280, n=40) | |
| Minisforum NUCX i7 | |
| Zotac Magnus One (ECM73070C) | |
| Zotac MEK Mini (RTX 2070 Super) | |
| Mozilla Kraken 1.1 - Total | |
| Zotac MEK Mini (RTX 2070 Super) | |
| Zotac Magnus One (ECM73070C) | |
| Genomsnitt Intel Core i7-11800H (600 - 690, n=45) | |
| Zotac ZBOX Magnus EN173070C | |
| Minisforum NUCX i7 | |
| Gigabyte A7 X1 | |
| Intel Beast Canyon NUC | |
| Intel Dragon Canyon NUC - RTX 3060 | |
| 3DMark | |
| 3840x2160 Fire Strike Ultra Physics | |
| Intel Dragon Canyon NUC - RTX 3060 | |
| Intel Beast Canyon NUC | |
| Genomsnitt Intel Core i7-11800H (21176 - 25203, n=16) | |
| Minisforum NUCX i7 | |
| Zotac ZBOX Magnus EN173070C | |
| Zotac Magnus One (ECM73070C) | |
| Zotac MEK Mini (RTX 2070 Super) | |
| 1920x1080 Fire Strike Physics | |
| Intel Dragon Canyon NUC - RTX 3060 | |
| Gigabyte A7 X1 | |
| Minisforum NUCX i7 | |
| Intel Beast Canyon NUC | |
| Zotac ZBOX Magnus EN173070C | |
| Genomsnitt Intel Core i7-11800H (12843 - 25145, n=47) | |
| Zotac Magnus One (ECM73070C) | |
| Zotac MEK Mini (RTX 2070 Super) | |
| 2560x1440 Time Spy CPU | |
| Intel Dragon Canyon NUC - RTX 3060 | |
| Minisforum NUCX i7 | |
| Intel Beast Canyon NUC | |
| Zotac ZBOX Magnus EN173070C | |
| Genomsnitt Intel Core i7-11800H (5086 - 11076, n=47) | |
| Gigabyte A7 X1 | |
| Zotac Magnus One (ECM73070C) | |
| Zotac MEK Mini (RTX 2070 Super) | |
* ... mindre är bättre
AIDA64: FP32 Ray-Trace | FPU Julia | CPU SHA3 | CPU Queen | FPU SinJulia | FPU Mandel | CPU AES | CPU ZLib | FP64 Ray-Trace | CPU PhotoWorxx
| Performance rating | |
| Genomsnitt av klass Desktop | |
| Gigabyte A7 X1 | |
| Intel Beast Canyon NUC | |
| Intel Dragon Canyon NUC - RTX 3060 | |
| Minisforum NUCX i7 | |
| Zotac ZBOX Magnus EN173070C | |
| Zotac MEK Mini (RTX 2070 Super) | |
| AIDA64 / FP32 Ray-Trace | |
| Genomsnitt av klass Desktop (12248 - 84577, n=21, senaste 2 åren) | |
| Gigabyte A7 X1 | |
| Intel Beast Canyon NUC | |
| Intel Dragon Canyon NUC - RTX 3060 | |
| Zotac ZBOX Magnus EN173070C | |
| Minisforum NUCX i7 | |
| Zotac MEK Mini (RTX 2070 Super) | |
| AIDA64 / FPU Julia | |
| Genomsnitt av klass Desktop (65152 - 246125, n=21, senaste 2 åren) | |
| Gigabyte A7 X1 | |
| Intel Beast Canyon NUC | |
| Intel Dragon Canyon NUC - RTX 3060 | |
| Zotac ZBOX Magnus EN173070C | |
| Minisforum NUCX i7 | |
| Zotac MEK Mini (RTX 2070 Super) | |
| AIDA64 / CPU SHA3 | |
| Genomsnitt av klass Desktop (2982 - 10804, n=21, senaste 2 åren) | |
| Intel Beast Canyon NUC | |
| Intel Dragon Canyon NUC - RTX 3060 | |
| Zotac ZBOX Magnus EN173070C | |
| Minisforum NUCX i7 | |
| Gigabyte A7 X1 | |
| Zotac MEK Mini (RTX 2070 Super) | |
| AIDA64 / CPU Queen | |
| Genomsnitt av klass Desktop (76512 - 187912, n=18, senaste 2 åren) | |
| Gigabyte A7 X1 | |
| Intel Beast Canyon NUC | |
| Intel Dragon Canyon NUC - RTX 3060 | |
| Minisforum NUCX i7 | |
| Zotac ZBOX Magnus EN173070C | |
| Zotac MEK Mini (RTX 2070 Super) | |
| AIDA64 / FPU SinJulia | |
| Genomsnitt av klass Desktop (6443 - 35251, n=21, senaste 2 åren) | |
| Gigabyte A7 X1 | |
| Intel Beast Canyon NUC | |
| Intel Dragon Canyon NUC - RTX 3060 | |
| Minisforum NUCX i7 | |
| Zotac ZBOX Magnus EN173070C | |
| Zotac MEK Mini (RTX 2070 Super) | |
| AIDA64 / FPU Mandel | |
| Genomsnitt av klass Desktop (31697 - 129745, n=21, senaste 2 åren) | |
| Gigabyte A7 X1 | |
| Intel Beast Canyon NUC | |
| Intel Dragon Canyon NUC - RTX 3060 | |
| Zotac ZBOX Magnus EN173070C | |
| Minisforum NUCX i7 | |
| Zotac MEK Mini (RTX 2070 Super) | |
| AIDA64 / CPU AES | |
| Genomsnitt av klass Desktop (57777 - 513073, n=21, senaste 2 åren) | |
| Intel Beast Canyon NUC | |
| Intel Dragon Canyon NUC - RTX 3060 | |
| Minisforum NUCX i7 | |
| Zotac ZBOX Magnus EN173070C | |
| Gigabyte A7 X1 | |
| Zotac MEK Mini (RTX 2070 Super) | |
| AIDA64 / CPU ZLib | |
| Genomsnitt av klass Desktop (887 - 2674, n=21, senaste 2 åren) | |
| Gigabyte A7 X1 | |
| Minisforum NUCX i7 | |
| Intel Beast Canyon NUC | |
| Intel Dragon Canyon NUC - RTX 3060 | |
| Zotac ZBOX Magnus EN173070C | |
| Zotac MEK Mini (RTX 2070 Super) | |
| AIDA64 / FP64 Ray-Trace | |
| Genomsnitt av klass Desktop (6471 - 44013, n=21, senaste 2 åren) | |
| Gigabyte A7 X1 | |
| Intel Beast Canyon NUC | |
| Intel Dragon Canyon NUC - RTX 3060 | |
| Zotac ZBOX Magnus EN173070C | |
| Minisforum NUCX i7 | |
| Zotac MEK Mini (RTX 2070 Super) | |
| AIDA64 / CPU PhotoWorxx | |
| Genomsnitt av klass Desktop (38071 - 63949, n=21, senaste 2 åren) | |
| Zotac ZBOX Magnus EN173070C | |
| Minisforum NUCX i7 | |
| Intel Beast Canyon NUC | |
| Intel Dragon Canyon NUC - RTX 3060 | |
| Zotac MEK Mini (RTX 2070 Super) | |
| Gigabyte A7 X1 | |
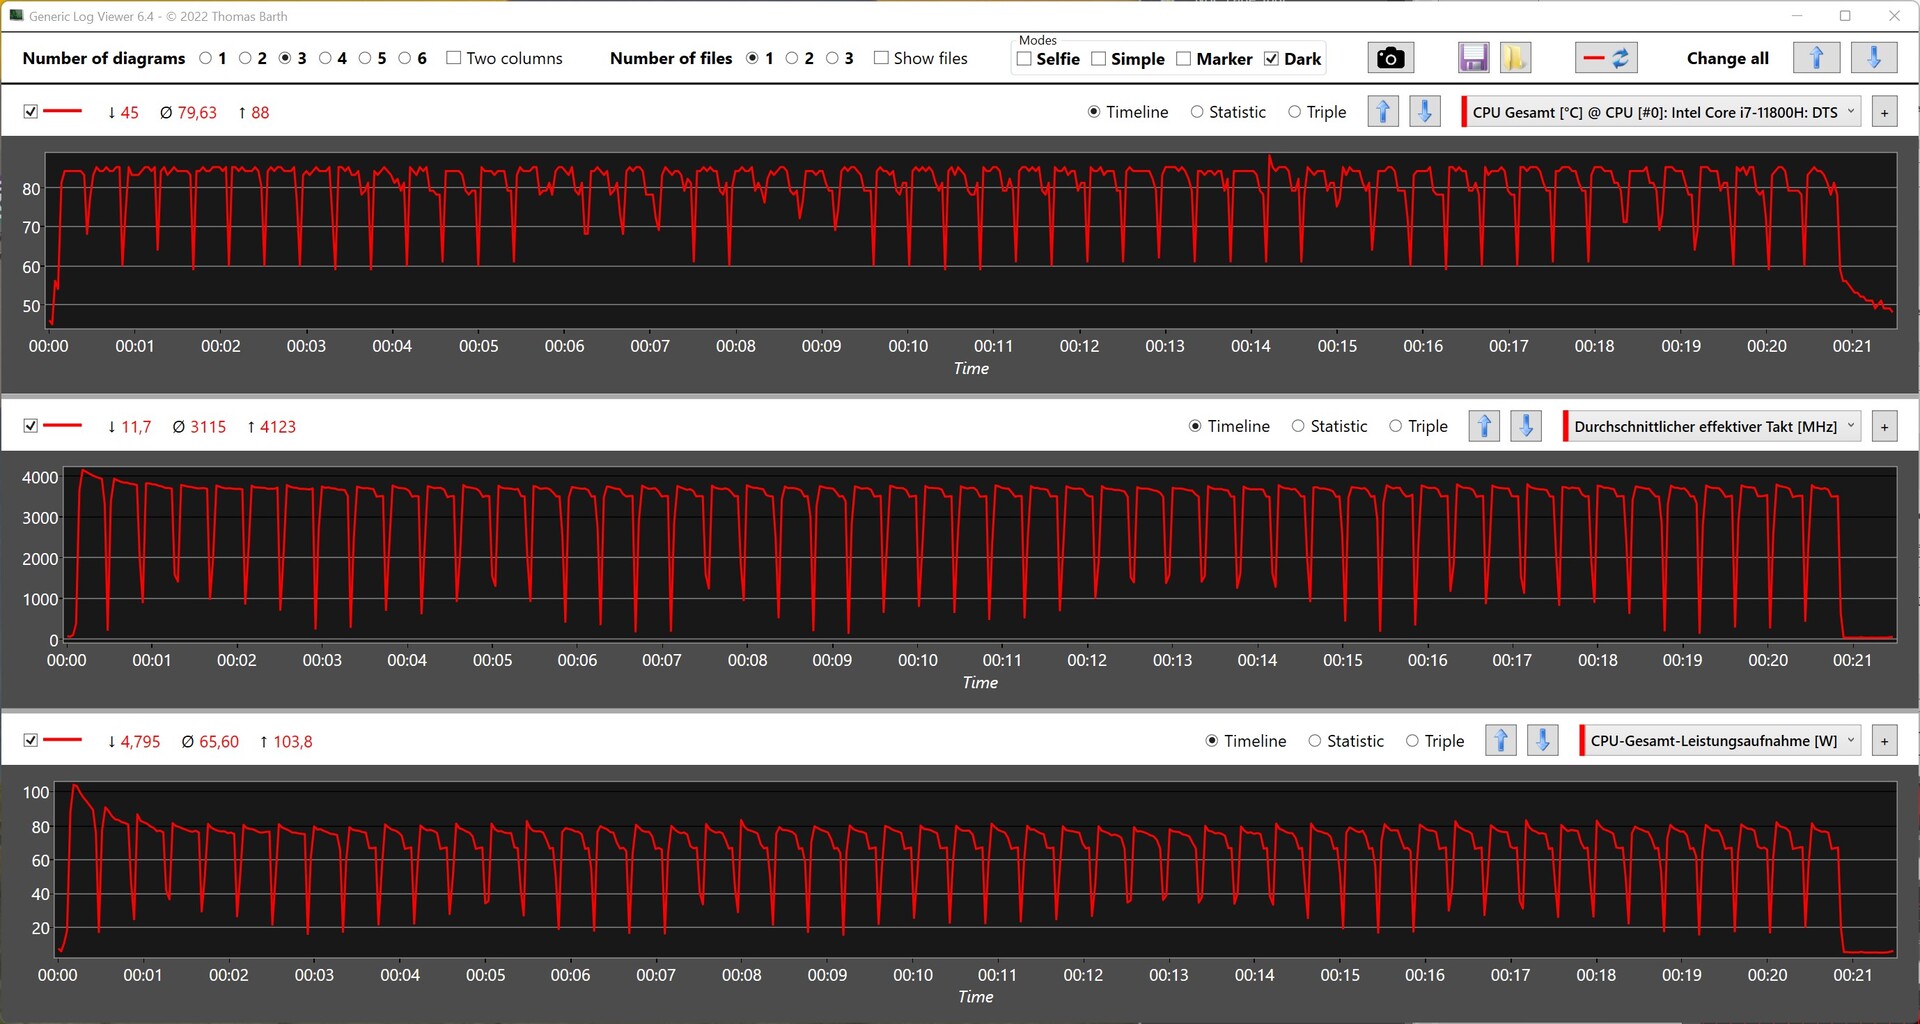
Minisforum NUCXi7 i Cinebench R15 Multi Loop
Slingan i Cinebench R15-testet med konstant belastning ger ett bra intryck av effektiviteten hos det inbyggda kylsystemet. Efter de första körningarna sjunker prestandan endast minimalt, innan den fortsätter att plana ut på ett genomsnitt på 1 828 poäng.
Systemets prestanda
Minisforum NUCXi7 lämnar ett gott intryck i systemjämförelserna. Nackdelen bakom Intel Dragon Canyon NUC med en Intel Core i9-12900 är 17 %. Samtidigt är Intel Core i7-11800Hsom vid det här laget redan är mer än ett år gammal, visar också att den inte kommer att tillhöra skrothögen på ett bra tag. Ändå kan Minisforum också få några betydande förbättringar med en uppgradering till Intels Alder Lake SoC:er. Men i den nuvarande utrustningskonfigurationen levererar Minisforum NUCXi7 en solid prestanda som också är övertygande i den dagliga driften.
| Performance rating - Percent | |
| Intel Dragon Canyon NUC - RTX 3060, Intel Core i9-12900 | |
| Intel Beast Canyon NUC, Intel Core i9-11900KB | |
| Gigabyte A7 X1, AMD Ryzen 9 5900HX | |
| Zotac ZBOX Magnus EN173070C, Intel Core i7-11800H | |
| Minisforum NUCX i7, Intel Core i7-11800H | |
| Zotac Magnus One (ECM73070C), Intel Core i7-10700 | |
| Zotac MEK Mini (RTX 2070 Super), Intel Core i7-9700 | |
| AIDA64 / Memory Copy | |
| Genomsnitt av klass Desktop (54743 - 98416, n=21, senaste 2 åren) | |
| Intel Beast Canyon NUC | |
| Intel Dragon Canyon NUC - RTX 3060 | |
| Minisforum NUCX i7 | |
| Zotac ZBOX Magnus EN173070C | |
| Genomsnitt Intel Core i7-11800H (24508 - 48144, n=21) | |
| Gigabyte A7 X1 | |
| Zotac MEK Mini (RTX 2070 Super) | |
| AIDA64 / Memory Read | |
| Genomsnitt av klass Desktop (58375 - 110448, n=21, senaste 2 åren) | |
| Zotac ZBOX Magnus EN173070C | |
| Intel Beast Canyon NUC | |
| Intel Dragon Canyon NUC - RTX 3060 | |
| Minisforum NUCX i7 | |
| Genomsnitt Intel Core i7-11800H (25882 - 50365, n=20) | |
| Gigabyte A7 X1 | |
| Zotac MEK Mini (RTX 2070 Super) | |
| AIDA64 / Memory Write | |
| Genomsnitt av klass Desktop (60635 - 93889, n=21, senaste 2 åren) | |
| Zotac ZBOX Magnus EN173070C | |
| Minisforum NUCX i7 | |
| Intel Beast Canyon NUC | |
| Intel Dragon Canyon NUC - RTX 3060 | |
| Genomsnitt Intel Core i7-11800H (22240 - 46214, n=20) | |
| Zotac MEK Mini (RTX 2070 Super) | |
| Gigabyte A7 X1 | |
| AIDA64 / Memory Latency | |
| Minisforum NUCX i7 | |
| Genomsnitt av klass Desktop (68.5 - 168, n=21, senaste 2 åren) | |
| Intel Beast Canyon NUC | |
| Intel Dragon Canyon NUC - RTX 3060 | |
| Zotac ZBOX Magnus EN173070C | |
| Gigabyte A7 X1 | |
| Zotac MEK Mini (RTX 2070 Super) | |
| Genomsnitt Intel Core i7-11800H (71.9 - 104.1, n=44) | |
* ... mindre är bättre
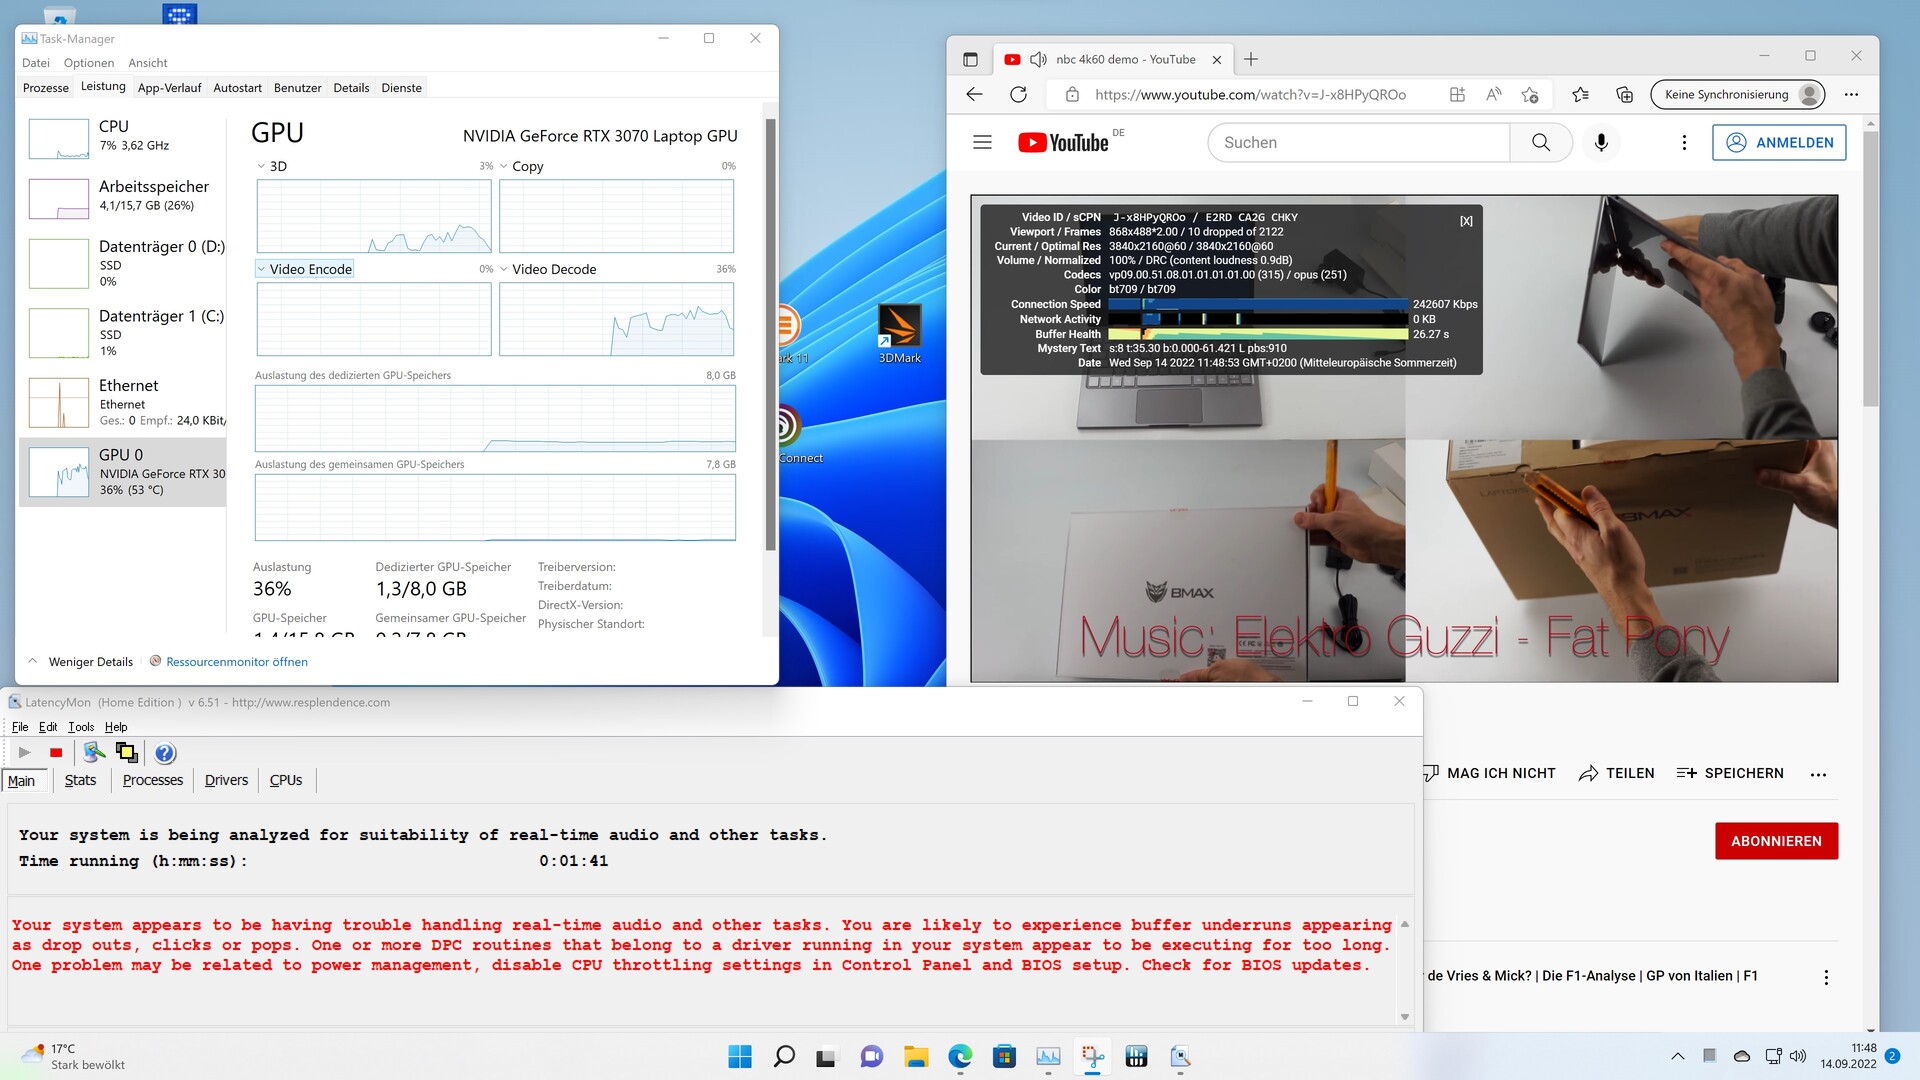
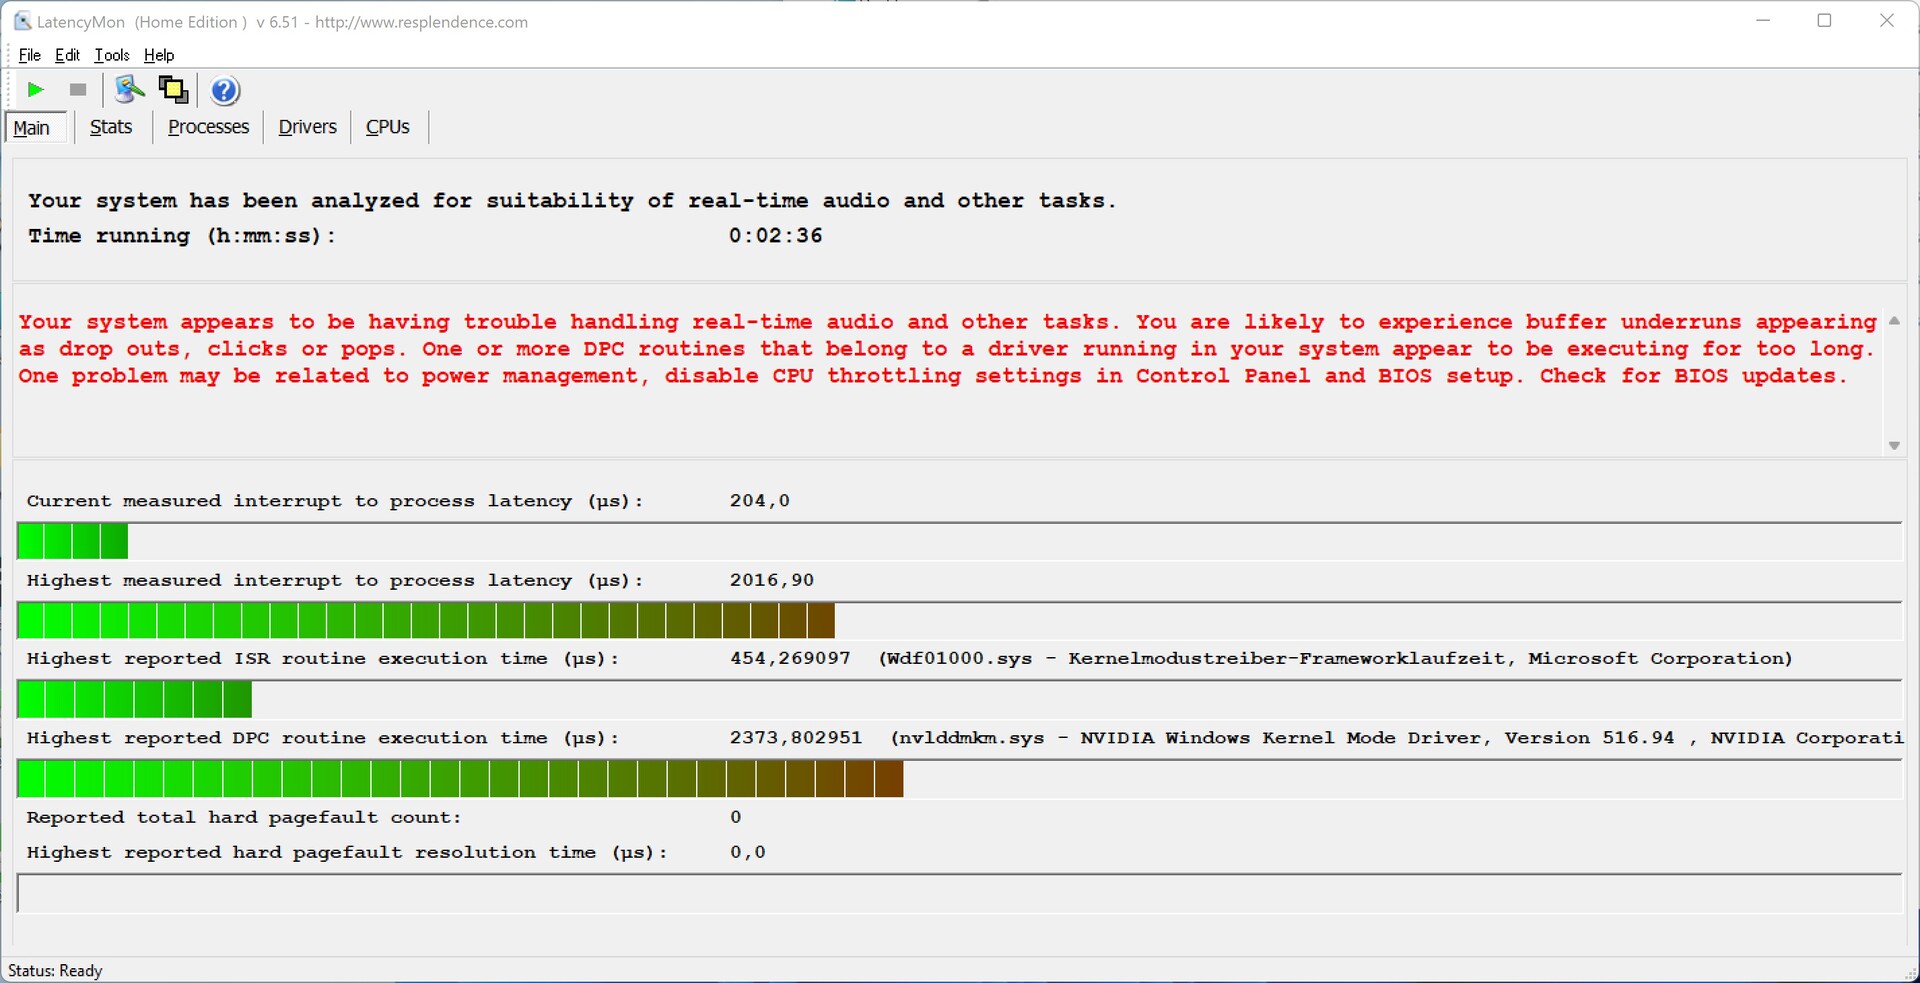
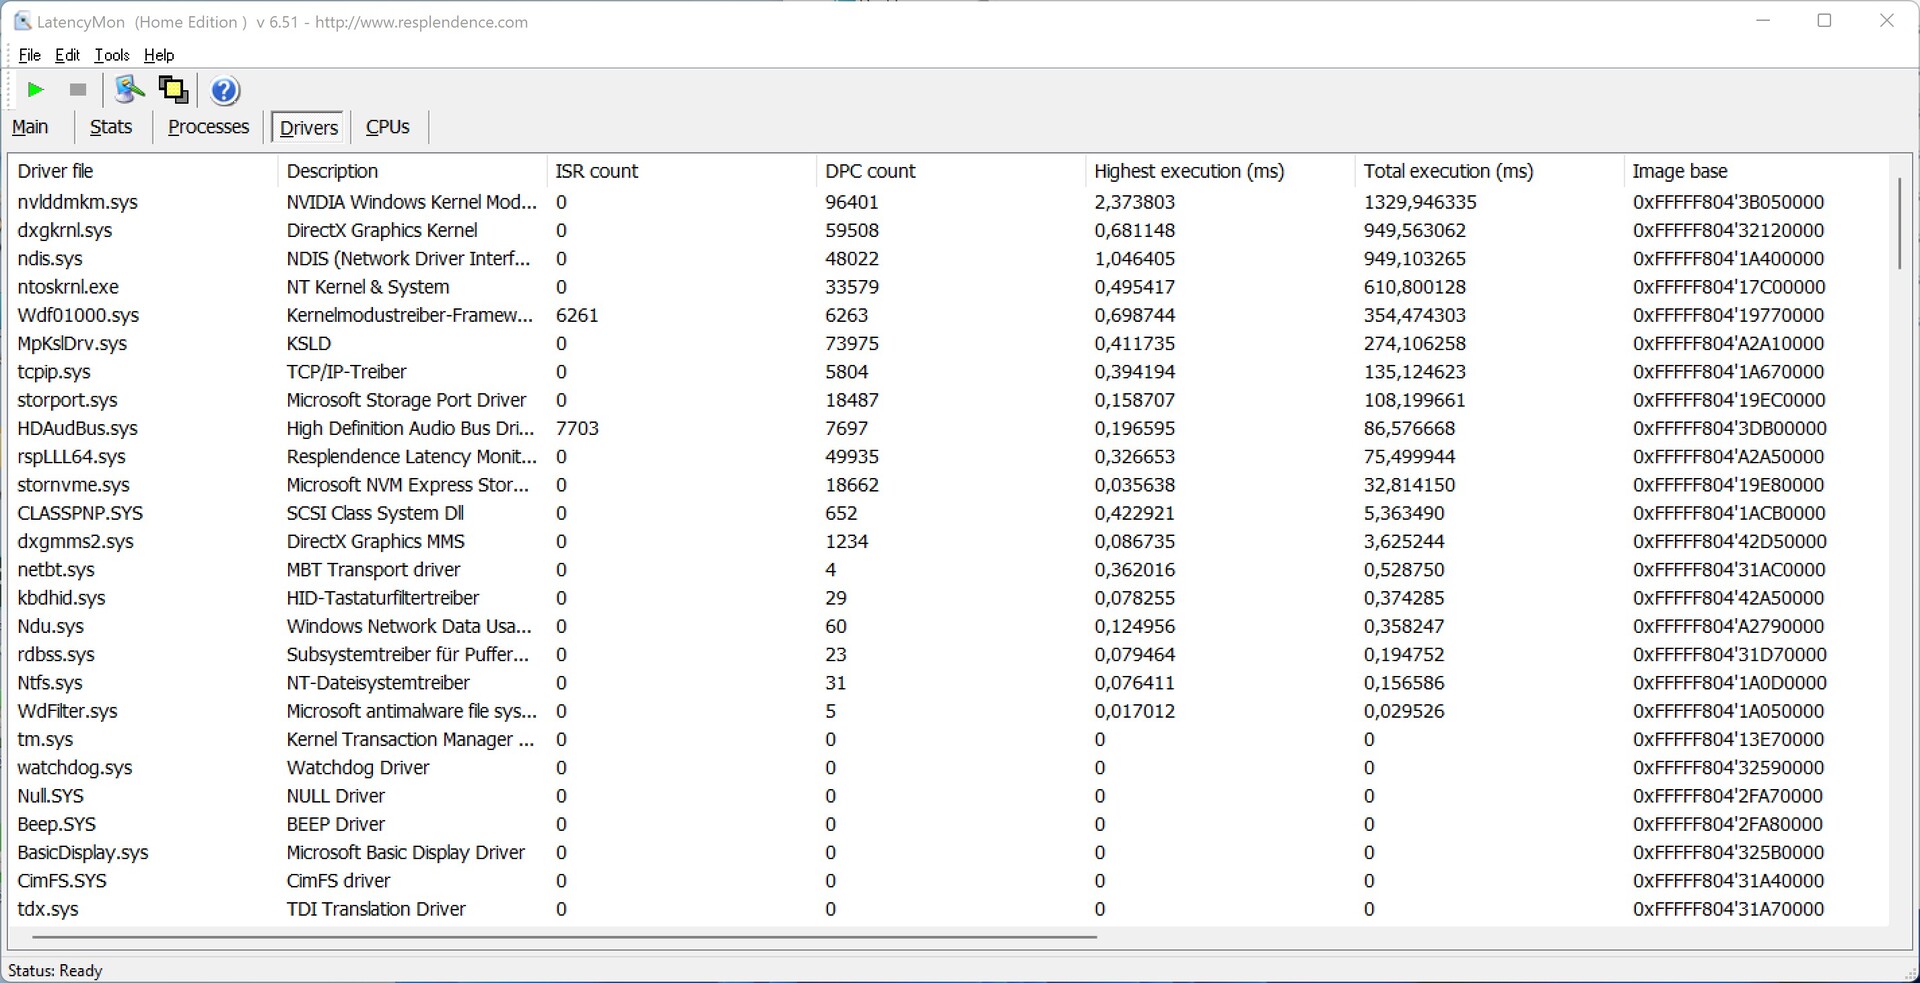
DPC-latenstider
Minisforum NUCXi7 kämpar med ökad latens redan när man öppnar flera flikar i webbläsaren Edge. Vid uppspelning av vår 4K-testvideo är Nvidia GeForce RTX 3070 GPU för bärbar datorbelastas till cirka 36 procent.
| DPC Latencies / LatencyMon - interrupt to process latency (max), Web, Youtube, Prime95 | |
| Minisforum NUCX i7, Intel Core i7-11800H | |
| Zotac ZBOX Magnus EN173070C, Intel Core i7-11800H | |
| Gigabyte A7 X1, AMD Ryzen 9 5900HX | |
* ... mindre är bättre
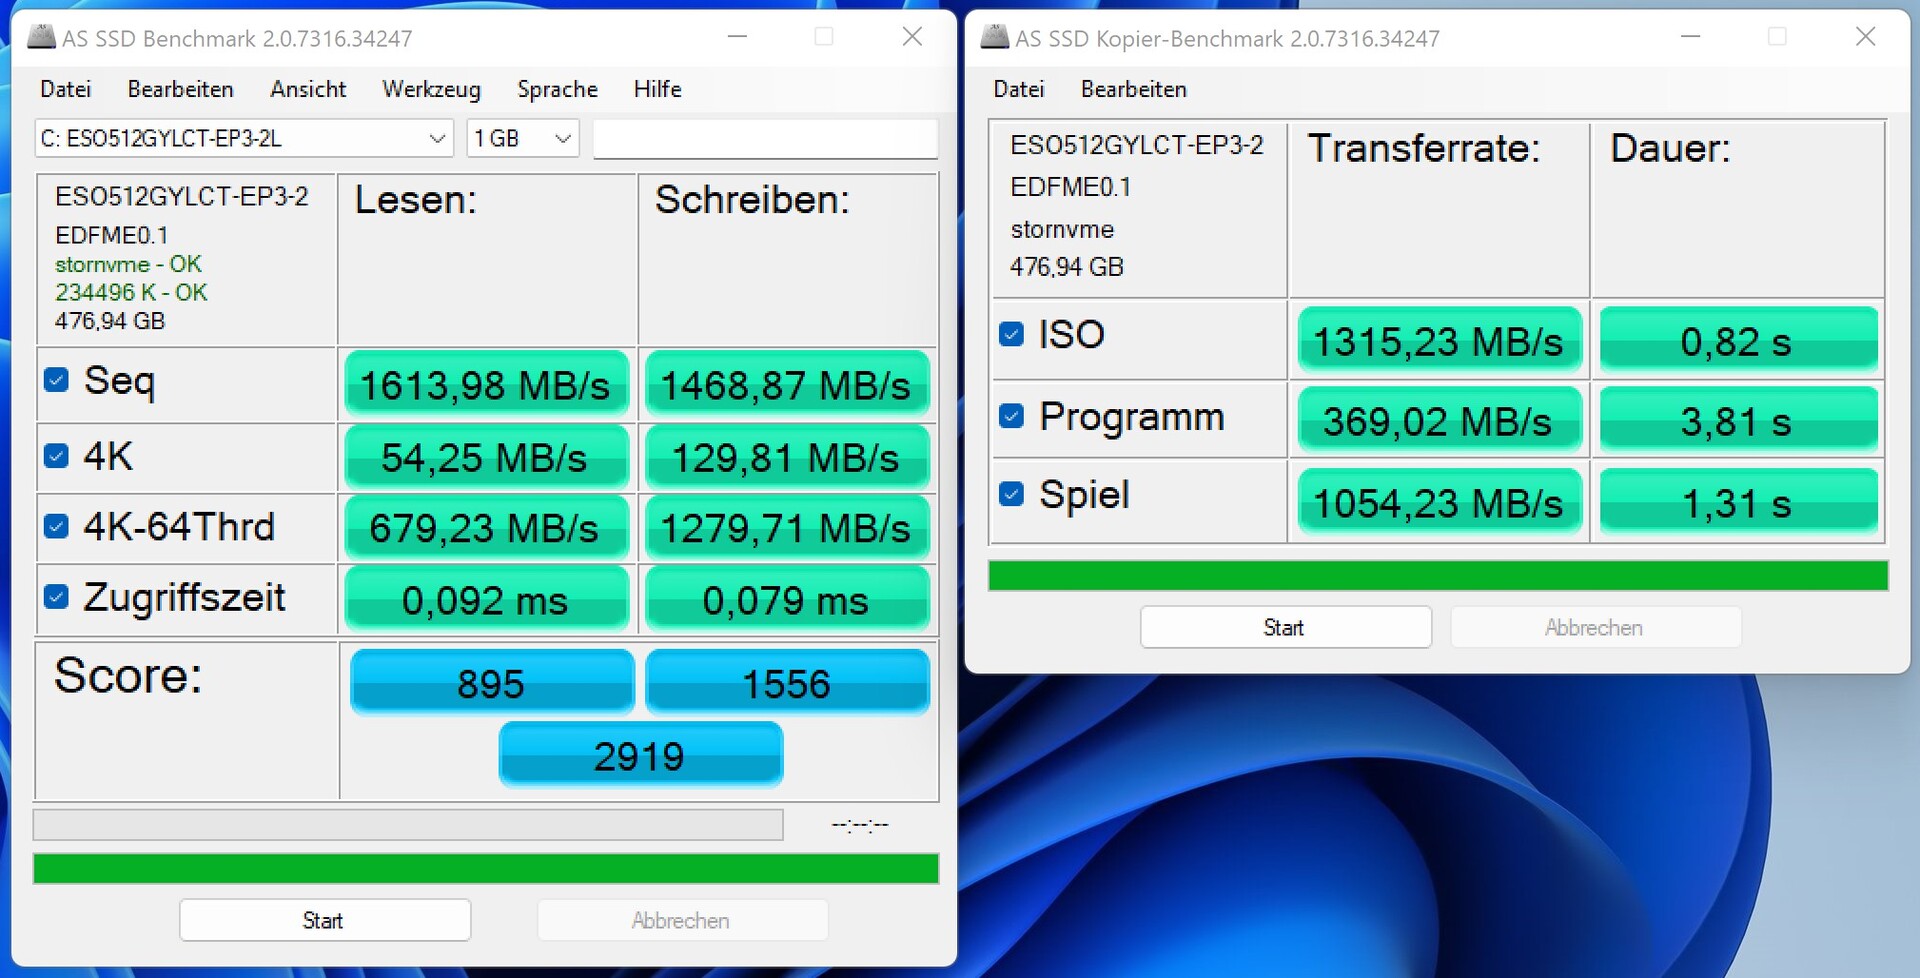
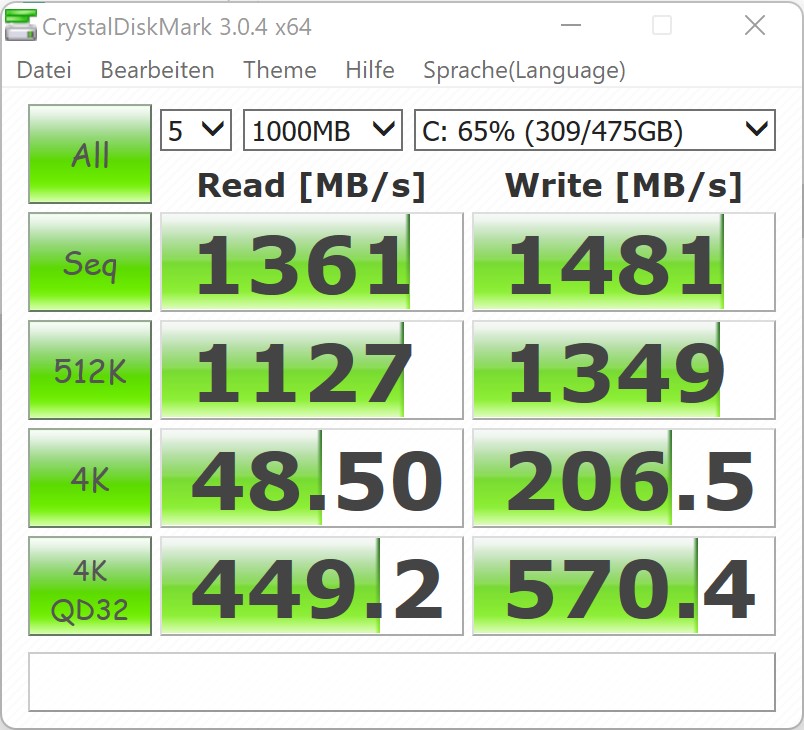
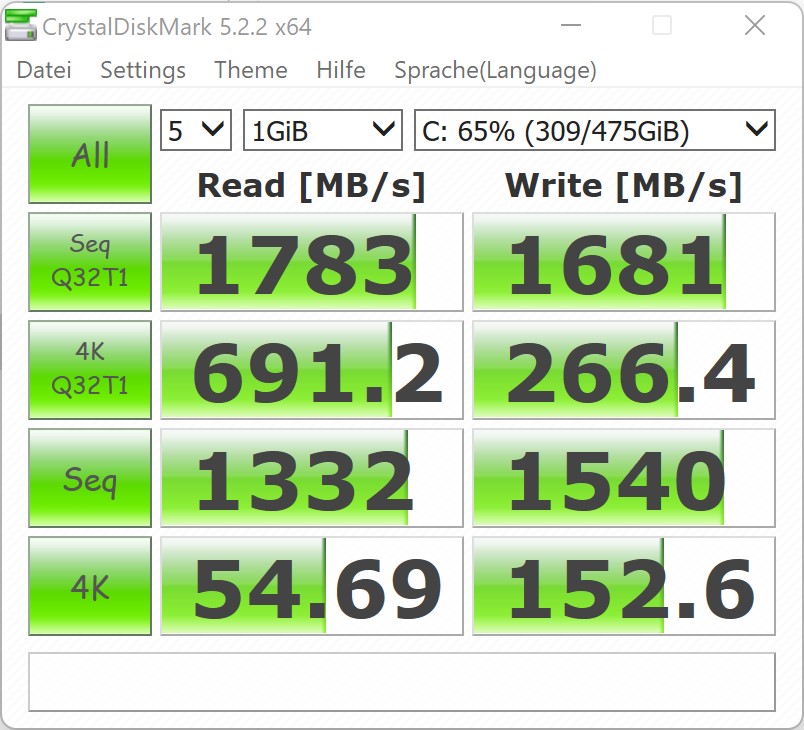
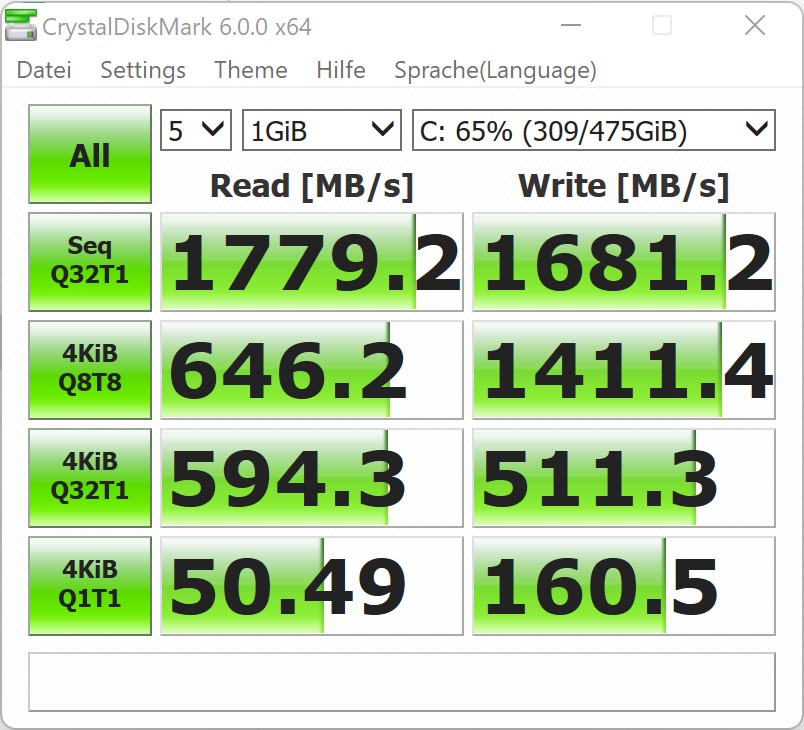
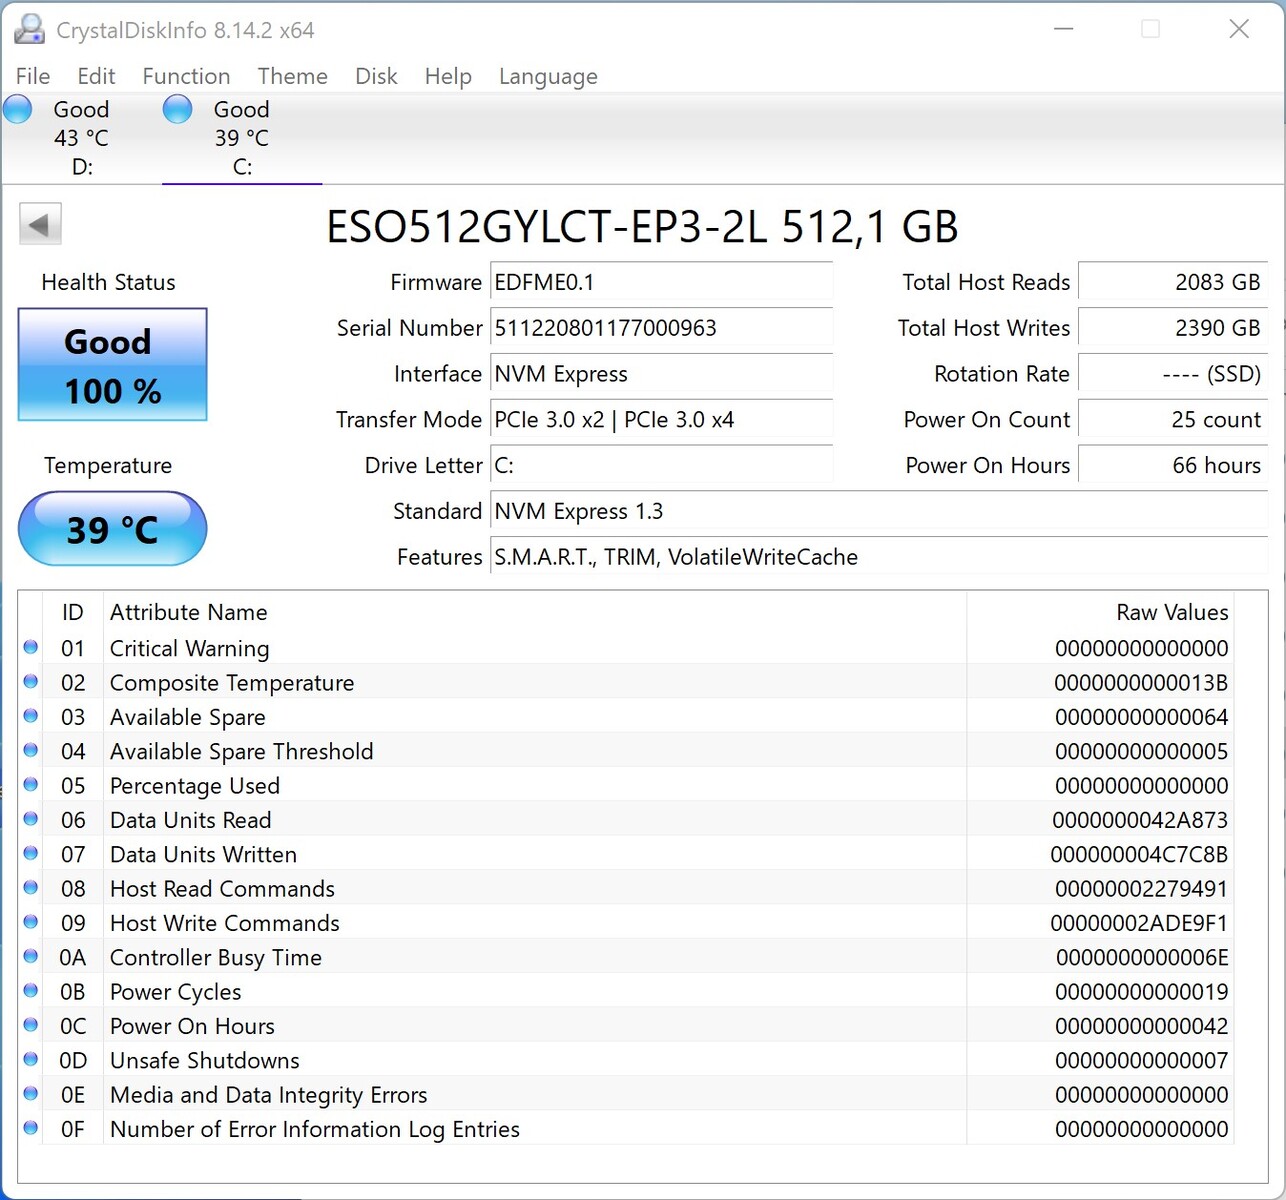
Lösning för lagring
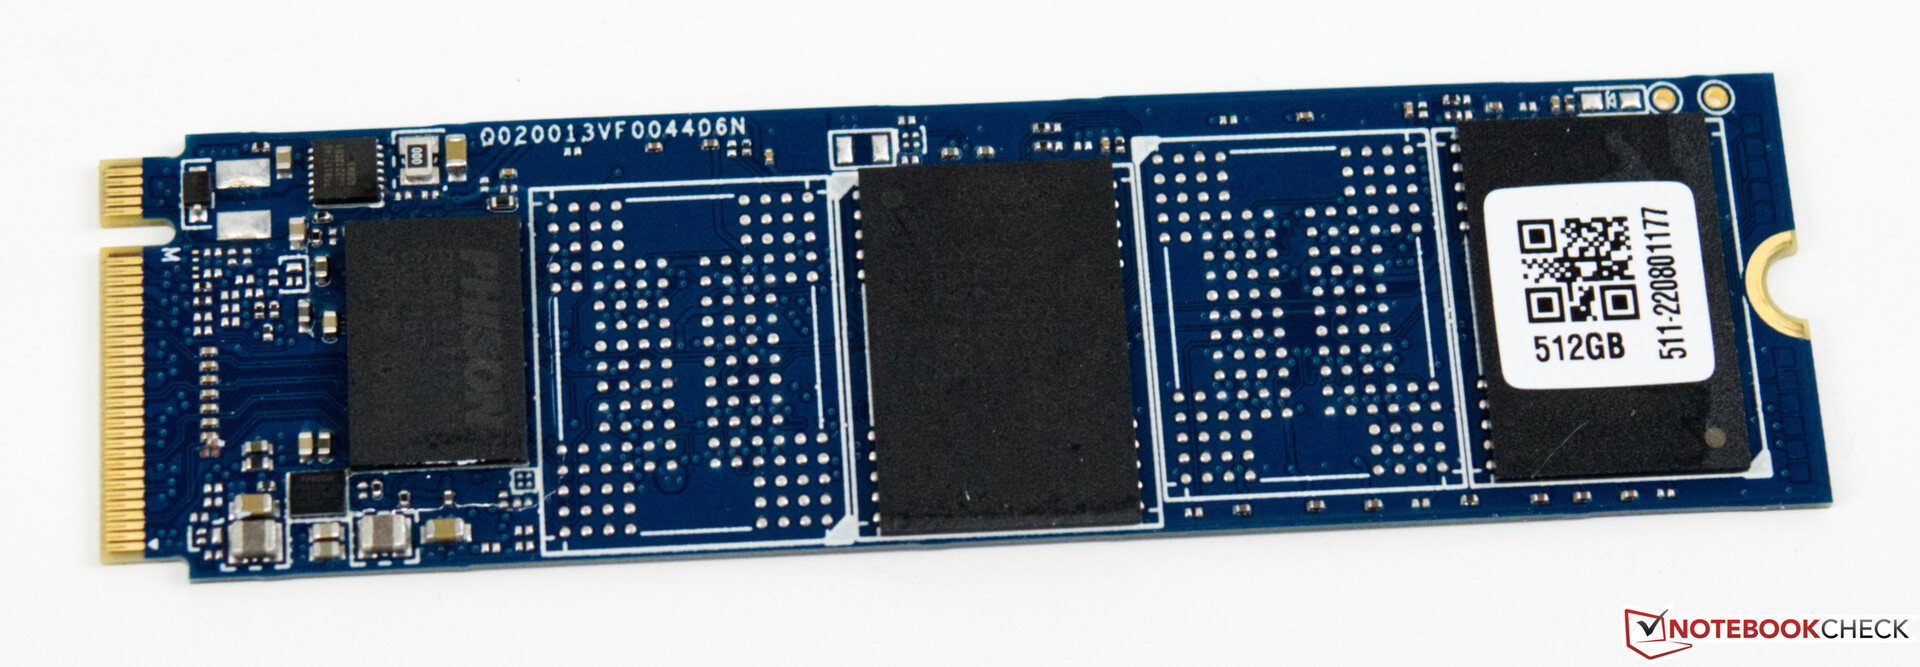
I vår konfiguration är lagringslösningen en NVMe SSD med 512 GB lagringsutrymme. Även om den använda modellen är snabb kan den inte riktigt hålla jämna steg med prestandan hos våra jämförelseenheter. Prestandan är dock fortfarande tillräcklig för alla vanliga program. Dessutom kunde vi inte se några onödiga latenser på grund av SSD-prestandan. Å andra sidan, med tanke på målanvändargruppen, visar sig lagringsutrymmet vara mycket lågt med endast 512 GB. För en spelenhet förväntar vi oss minst 1 TB lagringsutrymme. Samtidigt kan du också utöka lagringsutrymmet vid ett senare tillfälle med hjälp av den andra M.2-platsen.
Du kan hitta ytterligare jämförelser och benchmarks i vår jämförelsetabell.

| Drive Performance rating - Percent | |
| Genomsnitt av klass Desktop | |
| Intel Beast Canyon NUC | |
| Intel Dragon Canyon NUC - RTX 3060 -11! | |
| Gigabyte A7 X1 | |
| Zotac ZBOX Magnus EN173070C | |
| Zotac Magnus One (ECM73070C) | |
| Minisforum NUCX i7 | |
| Global Average -3 | |
| Zotac MEK Mini (RTX 2070 Super) | |
* ... mindre är bättre
Constant Performance Reading: DiskSpd Read Loop, Queue Depth 8
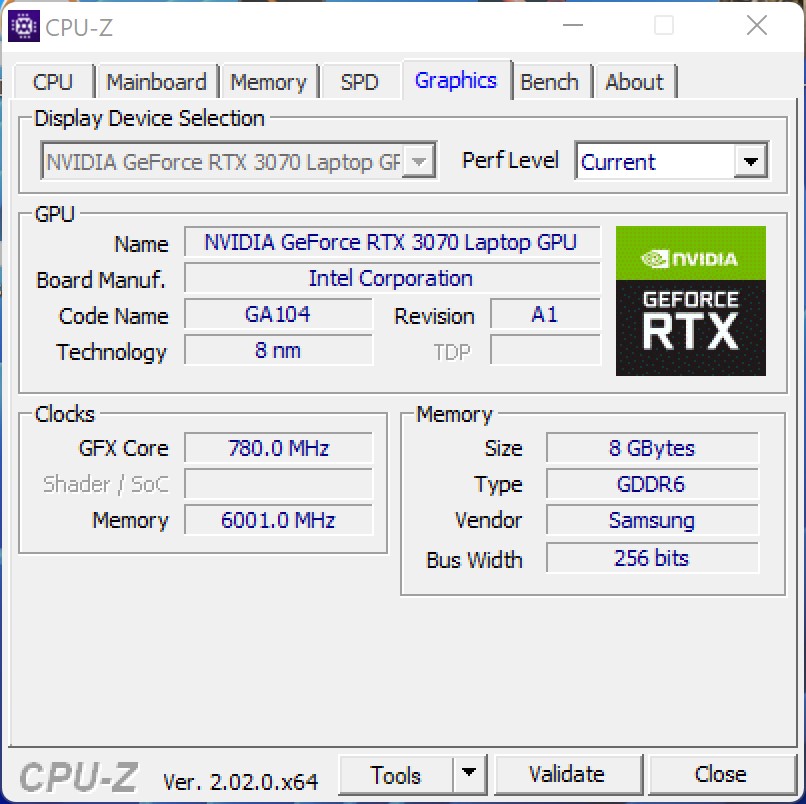
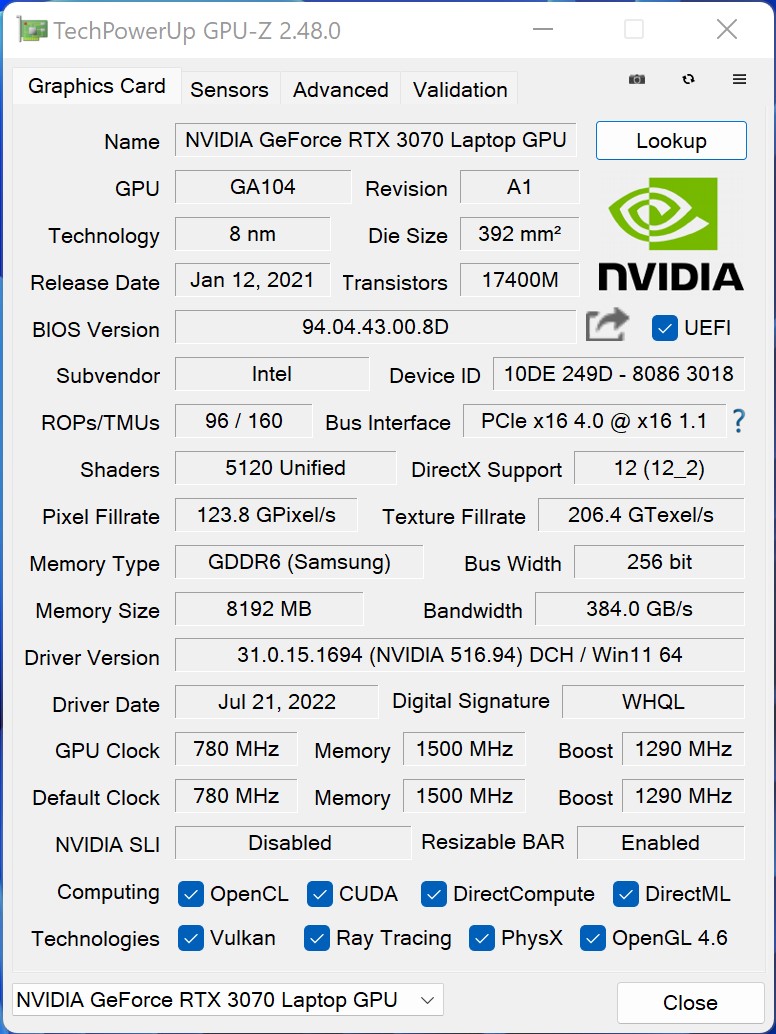
Grafikkort
Nvidia GeForce RTX 3070 GPU för bärbar datorsom körs i Minisforum NUCXi7 kan använda sin fulla prestanda på 125 watt i spelläget. Du måste dock fortfarande vara medveten om att detta är mobilversionen av GeForce RTX 3070 vars prestanda inte kommer i närheten av den för skrivbordsversionen. Nvidias GeForce RTX 3070 GPU för bärbara datorer är ungefär 25-30 % långsammare än denNvidia GeForce RTX 3070 Desktop GPU. Vår testenhet håller dock konkurrenterna som är baserade på en Nvidia GeForce RTX 3060 Desktop GPU lätt i schack. För att kunna bedöma den ungefärliga prestandan hos Minisforum NUCXi5 inkluderar vi även de genomsnittliga prestandavärdena för Nvidia GeForce RTX 3060 GPU för bärbar datori vårt diagram.
Du kan hitta ytterligare riktmärken för Nvidia GeForce RTX 3070 här.
| 3DMark Performance rating - Percent | |
| MSI GeForce RTX 3070 Ventus 3X | |
| Zotac Magnus One (ECM73070C) | |
| Zotac ZBOX Magnus EN173070C | |
| Minisforum NUCX i7 | |
| Genomsnitt NVIDIA GeForce RTX 3070 Laptop GPU | |
| Zotac MEK Mini (RTX 2070 Super) | |
| Intel Dragon Canyon NUC - RTX 3060 | |
| Intel Beast Canyon NUC | |
| Genomsnitt NVIDIA GeForce RTX 3060 Laptop GPU | |
| 3DMark 11 - 1280x720 Performance GPU | |
| MSI GeForce RTX 3070 Ventus 3X | |
| Zotac Magnus One (ECM73070C) | |
| Minisforum NUCX i7 | |
| Zotac ZBOX Magnus EN173070C | |
| Zotac MEK Mini (RTX 2070 Super) | |
| Genomsnitt NVIDIA GeForce RTX 3070 Laptop GPU (12535 - 38275, n=54) | |
| Intel Dragon Canyon NUC - RTX 3060 | |
| Intel Beast Canyon NUC | |
| Genomsnitt NVIDIA GeForce RTX 3060 Laptop GPU (13799 - 30772, n=43) | |
| Performance rating - Percent | |
| Zotac Magnus One (ECM73070C) | |
| Zotac ZBOX Magnus EN173070C | |
| Genomsnitt NVIDIA GeForce RTX 3070 Laptop GPU | |
| Minisforum NUCX i7 | |
| Intel Dragon Canyon NUC - RTX 3060 | |
| Intel Beast Canyon NUC | |
| Genomsnitt NVIDIA GeForce RTX 3060 Laptop GPU | |
| Unigine Heaven 4.0 | |
| Extreme Preset OpenGL | |
| Zotac Magnus One (ECM73070C) | |
| Zotac ZBOX Magnus EN173070C | |
| Genomsnitt NVIDIA GeForce RTX 3070 Laptop GPU (139.4 - 152.9, n=2) | |
| Minisforum NUCX i7 | |
| Intel Dragon Canyon NUC - RTX 3060 | |
| Intel Beast Canyon NUC | |
| Genomsnitt NVIDIA GeForce RTX 3060 Laptop GPU (n=1) | |
| Extreme Preset DX11 | |
| Zotac Magnus One (ECM73070C) | |
| Zotac ZBOX Magnus EN173070C | |
| Genomsnitt NVIDIA GeForce RTX 3070 Laptop GPU (152.9 - 165.1, n=2) | |
| Minisforum NUCX i7 | |
| Intel Dragon Canyon NUC - RTX 3060 | |
| Intel Beast Canyon NUC | |
| Genomsnitt NVIDIA GeForce RTX 3060 Laptop GPU (n=1) | |
| Unigine Valley 1.0 | |
| 1920x1080 Extreme HD DirectX AA:x8 | |
| Zotac Magnus One (ECM73070C) | |
| Zotac ZBOX Magnus EN173070C | |
| Genomsnitt NVIDIA GeForce RTX 3070 Laptop GPU (120.9 - 131.6, n=2) | |
| Minisforum NUCX i7 | |
| Intel Dragon Canyon NUC - RTX 3060 | |
| Intel Beast Canyon NUC | |
| Genomsnitt NVIDIA GeForce RTX 3060 Laptop GPU (n=1) | |
| 1920x1080 Extreme HD Preset OpenGL AA:x8 | |
| Zotac Magnus One (ECM73070C) | |
| Zotac ZBOX Magnus EN173070C | |
| Genomsnitt NVIDIA GeForce RTX 3070 Laptop GPU (104.8 - 115.3, n=2) | |
| Minisforum NUCX i7 | |
| Intel Dragon Canyon NUC - RTX 3060 | |
| Intel Beast Canyon NUC | |
| Genomsnitt NVIDIA GeForce RTX 3060 Laptop GPU (n=1) | |
| Unigine Superposition | |
| 1920x1080 1080p High | |
| Zotac Magnus One (ECM73070C) | |
| Zotac ZBOX Magnus EN173070C | |
| Genomsnitt NVIDIA GeForce RTX 3070 Laptop GPU (12667 - 13502, n=2) | |
| Minisforum NUCX i7 | |
| Genomsnitt NVIDIA GeForce RTX 3060 Laptop GPU (n=1) | |
| Intel Beast Canyon NUC | |
| Intel Dragon Canyon NUC - RTX 3060 | |
| 1920x1080 1080p Extreme | |
| Zotac Magnus One (ECM73070C) | |
| Zotac ZBOX Magnus EN173070C | |
| Genomsnitt NVIDIA GeForce RTX 3070 Laptop GPU (5847 - 6259, n=2) | |
| Minisforum NUCX i7 | |
| Intel Dragon Canyon NUC - RTX 3060 | |
| Intel Beast Canyon NUC | |
| Genomsnitt NVIDIA GeForce RTX 3060 Laptop GPU (n=1) | |
| 3840x2160 4k Optimized | |
| Zotac Magnus One (ECM73070C) | |
| Zotac ZBOX Magnus EN173070C | |
| Genomsnitt NVIDIA GeForce RTX 3070 Laptop GPU (7574 - 7997, n=2) | |
| Minisforum NUCX i7 | |
| Intel Beast Canyon NUC | |
| Genomsnitt NVIDIA GeForce RTX 3060 Laptop GPU (n=1) | |
| Intel Dragon Canyon NUC - RTX 3060 | |
| 3DMark 05 Standard | 46264 poäng | |
| 3DMark 06 Standard Score | 47138 poäng | |
| 3DMark Vantage P Result | 76594 poäng | |
| 3DMark 11 Performance | 27592 poäng | |
| 3DMark Ice Storm Standard Score | 218821 poäng | |
| 3DMark Cloud Gate Standard Score | 53894 poäng | |
| 3DMark Fire Strike Score | 21258 poäng | |
| 3DMark Fire Strike Extreme Score | 11291 poäng | |
| 3DMark Time Spy Score | 9337 poäng | |
| 3DMark Steel Nomad Score | 2368 poäng | |
| 3DMark Steel Nomad Light Score | 10548 poäng | |
Hjälp | ||
Spelprestanda
Minisforum NUCXi7 är förvånansvärt väl lämpad som speldator. Systemprestandan är tillräcklig för spel med 1 440p i de flesta fall. Från tid till annan kan du också få 2 160p från Nvidia GeForce RTX 3070 GPU för bärbar dator, så länge spelet inte ställer alltför höga krav på hårdvaran. Den dokumenterade spelprestandan här är dock häpnadsväckande i jämförelse. Ofta kan vår testenhet hålla jämna steg med jämförelseenheterna som baseras på de snabbare skrivbords-GPU:erna, eller till och med överträffa dem.
En översikt över prestandan i alla våra testade spel jämfört med andra modeller hittar du i vår Lista över GPU-spel.
| GTA V | |
| 1920x1080 Highest AA:4xMSAA + FX AF:16x | |
| Minisforum NUCX i7 | |
| Zotac ZBOX Magnus EN173070C | |
| Intel Beast Canyon NUC | |
| Intel Dragon Canyon NUC - RTX 3060 | |
| Zotac Magnus One (ECM73070C) | |
| Genomsnitt NVIDIA GeForce RTX 3070 Laptop GPU (21.7 - 125.8, n=50) | |
| Gigabyte A7 X1 | |
| 1920x1080 High/On (Advanced Graphics Off) AA:2xMSAA + FX AF:8x | |
| Intel Beast Canyon NUC | |
| Intel Dragon Canyon NUC - RTX 3060 | |
| Minisforum NUCX i7 | |
| Zotac ZBOX Magnus EN173070C | |
| Zotac Magnus One (ECM73070C) | |
| Genomsnitt NVIDIA GeForce RTX 3070 Laptop GPU (58.2 - 181.4, n=38) | |
| Gigabyte A7 X1 | |
| The Witcher 3 | |
| 1920x1080 High Graphics & Postprocessing (Nvidia HairWorks Off) | |
| Zotac Magnus One (ECM73070C) | |
| Minisforum NUCX i7 | |
| Zotac ZBOX Magnus EN173070C | |
| Intel Dragon Canyon NUC - RTX 3060 | |
| Zotac MEK Mini (RTX 2070 Super) | |
| Genomsnitt NVIDIA GeForce RTX 3070 Laptop GPU (122.1 - 207, n=34) | |
| 1920x1080 Ultra Graphics & Postprocessing (HBAO+) | |
| Zotac Magnus One (ECM73070C) | |
| Zotac ZBOX Magnus EN173070C | |
| Minisforum NUCX i7 | |
| Gigabyte A7 X1 | |
| Zotac MEK Mini (RTX 2070 Super) | |
| Genomsnitt NVIDIA GeForce RTX 3070 Laptop GPU (34.9 - 109, n=52) | |
| Intel Dragon Canyon NUC - RTX 3060 | |
| Far Cry 5 | |
| 1920x1080 Ultra Preset AA:T | |
| Intel Dragon Canyon NUC - RTX 3060 | |
| Intel Beast Canyon NUC | |
| Zotac ZBOX Magnus EN173070C | |
| Minisforum NUCX i7 | |
| Zotac Magnus One (ECM73070C) | |
| Zotac MEK Mini (RTX 2070 Super) | |
| Genomsnitt NVIDIA GeForce RTX 3070 Laptop GPU (89 - 140, n=36) | |
| 2560x1440 Ultra Preset AA:T | |
| Zotac Magnus One (ECM73070C) | |
| Zotac ZBOX Magnus EN173070C | |
| Minisforum NUCX i7 | |
| Intel Beast Canyon NUC | |
| Intel Dragon Canyon NUC - RTX 3060 | |
| Zotac MEK Mini (RTX 2070 Super) | |
| Genomsnitt NVIDIA GeForce RTX 3070 Laptop GPU (81 - 101, n=18) | |
| Far Cry New Dawn | |
| 2560x1440 Ultra Preset | |
| Zotac Magnus One (ECM73070C) | |
| Intel Dragon Canyon NUC - RTX 3060 | |
| Zotac ZBOX Magnus EN173070C | |
| Minisforum NUCX i7 | |
| Intel Beast Canyon NUC | |
| Genomsnitt NVIDIA GeForce RTX 3070 Laptop GPU (62 - 91, n=5) | |
| Zotac MEK Mini (RTX 2070 Super) | |
| 1920x1080 Ultra Preset | |
| Intel Dragon Canyon NUC - RTX 3060 | |
| Intel Beast Canyon NUC | |
| Zotac ZBOX Magnus EN173070C | |
| Minisforum NUCX i7 | |
| Zotac Magnus One (ECM73070C) | |
| Genomsnitt NVIDIA GeForce RTX 3070 Laptop GPU (70 - 101, n=6) | |
| Zotac MEK Mini (RTX 2070 Super) | |
| F1 2020 | |
| 2560x1440 Ultra High Preset AA:T AF:16x | |
| Minisforum NUCX i7 | |
| Zotac ZBOX Magnus EN173070C | |
| Intel Beast Canyon NUC | |
| Intel Dragon Canyon NUC - RTX 3060 | |
| Genomsnitt NVIDIA GeForce RTX 3070 Laptop GPU (74 - 123.7, n=4) | |
| 1920x1080 Ultra High Preset AA:T AF:16x | |
| Minisforum NUCX i7 | |
| Zotac ZBOX Magnus EN173070C | |
| Intel Beast Canyon NUC | |
| Intel Dragon Canyon NUC - RTX 3060 | |
| Genomsnitt NVIDIA GeForce RTX 3070 Laptop GPU (97 - 173, n=7) | |
| Strange Brigade | |
| 2560x1440 ultra AA:ultra AF:16 | |
| Zotac Magnus One (ECM73070C) | |
| Zotac ZBOX Magnus EN173070C | |
| Minisforum NUCX i7 | |
| Genomsnitt NVIDIA GeForce RTX 3070 Laptop GPU (82.3 - 140.5, n=18) | |
| Intel Beast Canyon NUC | |
| Intel Dragon Canyon NUC - RTX 3060 | |
| 1920x1080 ultra AA:ultra AF:16 | |
| Zotac Magnus One (ECM73070C) | |
| Zotac ZBOX Magnus EN173070C | |
| Gigabyte A7 X1 | |
| Minisforum NUCX i7 | |
| Genomsnitt NVIDIA GeForce RTX 3070 Laptop GPU (36.2 - 194, n=46) | |
| Intel Beast Canyon NUC | |
| Intel Dragon Canyon NUC - RTX 3060 | |
| Borderlands 3 | |
| 2560x1440 Badass Overall Quality (DX11) | |
| Zotac Magnus One (ECM73070C) | |
| Intel Beast Canyon NUC | |
| Minisforum NUCX i7 | |
| Zotac ZBOX Magnus EN173070C | |
| Intel Dragon Canyon NUC - RTX 3060 | |
| Genomsnitt NVIDIA GeForce RTX 3070 Laptop GPU (47.2 - 64.3, n=4) | |
| Zotac MEK Mini (RTX 2070 Super) | |
| 1920x1080 Badass Overall Quality (DX11) | |
| Intel Beast Canyon NUC | |
| Zotac Magnus One (ECM73070C) | |
| Intel Dragon Canyon NUC - RTX 3060 | |
| Minisforum NUCX i7 | |
| Zotac ZBOX Magnus EN173070C | |
| Genomsnitt NVIDIA GeForce RTX 3070 Laptop GPU (65.4 - 88.3, n=4) | |
| Zotac MEK Mini (RTX 2070 Super) | |
| Metro Exodus | |
| 1920x1080 Ultra Quality AF:16x | |
| Zotac Magnus One (ECM73070C) | |
| Zotac ZBOX Magnus EN173070C | |
| Minisforum NUCX i7 | |
| Genomsnitt NVIDIA GeForce RTX 3070 Laptop GPU (57.1 - 77.2, n=4) | |
| Zotac MEK Mini (RTX 2070 Super) | |
| Intel Dragon Canyon NUC - RTX 3060 | |
| Intel Beast Canyon NUC | |
| 2560x1440 Ultra Quality AF:16x | |
| Zotac Magnus One (ECM73070C) | |
| Minisforum NUCX i7 | |
| Zotac ZBOX Magnus EN173070C | |
| Genomsnitt NVIDIA GeForce RTX 3070 Laptop GPU (45.3 - 61.6, n=4) | |
| Zotac MEK Mini (RTX 2070 Super) | |
| Intel Dragon Canyon NUC - RTX 3060 | |
| Intel Beast Canyon NUC | |
| låg | med. | hög | ultra | QHD DLSS | QHD | 4K DLSS | 4K FSR | 4K | |
|---|---|---|---|---|---|---|---|---|---|
| GTA V (2015) | 184.7 | 179.4 | 171.5 | 106 | 90.6 | 85.6 | |||
| The Witcher 3 (2015) | 417 | 315 | 204 | 104.1 | 71.6 | ||||
| Dota 2 Reborn (2015) | 169.9 | 151.2 | 145.8 | 135.6 | 124.3 | ||||
| Rise of the Tomb Raider (2016) | 293 | 206 | 138.7 | 122 | 56.9 | ||||
| Final Fantasy XV Benchmark (2018) | 187.3 | 135.9 | 103.3 | 76.7 | 45.6 | ||||
| X-Plane 11.11 (2018) | 143.2 | 125.9 | 94.8 | 81.5 | |||||
| Far Cry 5 (2018) | 157 | 134 | 127 | 119 | 99 | 55 | |||
| Strange Brigade (2018) | 501 | 265 | 213 | 184.7 | 137.3 | 78.6 | |||
| Shadow of the Tomb Raider (2018) | 167.7 | 143.5 | 134.3 | 123.1 | 88.6 | 48 | |||
| Forza Horizon 4 (2018) | 211 | 189 | 188 | 167 | 140 | 93 | |||
| Far Cry New Dawn (2019) | 133 | 115 | 112 | 100 | 91 | 58 | |||
| Metro Exodus (2019) | 185 | 120.8 | 93.1 | 74.6 | 59.9 | 37.6 | |||
| Anno 1800 (2019) | 143.6 | 132.6 | 109.8 | 56.7 | 48.2 | 32.1 | |||
| Control (2019) | 240 | 131.7 | 96.1 | 61 | 30.3 | ||||
| Borderlands 3 (2019) | 141.9 | 124.9 | 101 | 84.7 | 62.6 | 34.8 | |||
| F1 2020 (2020) | 333 | 273 | 230 | 166.2 | 123.7 | 69.7 | |||
| Watch Dogs Legion (2020) | 114 | 106 | 96 | 73 | 64 | 27 | |||
| Dirt 5 (2020) | 210 | 147 | 114 | 91 | 73 | 49 | |||
| F1 2021 (2021) | 381 | 303 | 244 | 123.1 | 90.2 | 51.1 | |||
| New World (2021) | 115.7 | 95.2 | 89.1 | 84.2 | 67.5 | 35.7 | |||
| Far Cry 6 (2021) | 139.1 | 120 | 106.5 | 102.3 | 78.6 | ||||
| Forza Horizon 5 (2021) | 206 | 145 | 132 | 81 | 70 | 50 | |||
| God of War (2022) | 128.1 | 111 | 91.5 | 67.7 | 57.4 | 37 | |||
| GRID Legends (2022) | 147 | 163 | 153 | 122 | 81 | 56 | |||
| Cyberpunk 2077 1.6 (2022) | 145.6 | 129.2 | 113.9 | 72.3 | 47.3 | 22.3 | |||
| Tiny Tina's Wonderlands (2022) | 194.1 | 158.8 | 111.6 | 88.3 | 62.1 | 33.6 | |||
| F1 22 (2022) | 239 | 208 | 172.1 | 61.9 | 39.7 | 19.1 | |||
| A Plague Tale Requiem (2022) | 107.9 | 84.8 | 66.2 | 50.1 | 36.3 | 20.4 | |||
| Uncharted Legacy of Thieves Collection (2022) | 83.4 | 80.6 | 76.8 | 73.7 | 56.4 | 21.9 | |||
| Call of Duty Modern Warfare 2 2022 (2022) | 129 | 117 | 90 | 87 | 62 | 58 | 37 | ||
| Spider-Man Miles Morales (2022) | 124.8 | 114.7 | 111.3 | 100.4 | 66.6 | 44.6 | |||
| The Callisto Protocol (2022) | 124.9 | 105.2 | 100.2 | 72.5 | 53.2 | 30.8 | |||
| Need for Speed Unbound (2022) | 116.8 | 108.2 | 92.7 | 89.7 | 78.1 | 44.8 | |||
| High On Life (2023) | 216 | 157 | 124.3 | 103 | 65.5 | 27.6 | |||
| The Witcher 3 v4 (2023) | 161.1 | 151.2 | 128.4 | 112.6 | 81.9 | 46.5 | |||
| Dead Space Remake (2023) | 87.7 | 83.9 | 73.3 | 73.6 | 53.8 | 27.5 | |||
| Hogwarts Legacy (2023) | 97.1 | 88.4 | 72.4 | 59.1 | 47 | 26.7 | |||
| Returnal (2023) | 104 | 101 | 93 | 79 | 59 | 34 | |||
| Atomic Heart (2023) | 186.7 | 143.9 | 88.5 | 69.8 | 53.8 | 32.5 | |||
| Company of Heroes 3 (2023) | 193.5 | 167.4 | 134.3 | 133.9 | 100.8 | 58.4 | |||
| Sons of the Forest (2023) | 80.4 | 75.8 | 72.8 | 72.5 | 57.7 | 37.8 | |||
| Resident Evil 4 Remake (2023) | 140 | 103.1 | 96.7 | 67.6 | 52.6 | 30.5 | |||
| The Last of Us (2023) | 96.6 | 82.2 | 71.6 | 56.9 | 36.6 | 31 | 16.5 | ||
| Dead Island 2 (2023) | 209 | 205 | 164.3 | 126.1 | 89.9 | 45.1 | |||
| Star Wars Jedi Survivor (2023) | 81.1 | 72.3 | 67.4 | 64.2 | 40.5 | 19.8 | |||
| Diablo 4 (2023) | 250 | 197.9 | 164.1 | 155.6 | 111.2 | 57.3 | |||
| Ratchet & Clank Rift Apart (2023) | 87.6 | 75.7 | 66.8 | 63.5 | 61.7 | 51.3 | |||
| Atlas Fallen (2023) | 144.5 | 135 | 127 | 106.8 | 42.6 | 75.9 | |||
| Immortals of Aveum (2023) | 62.4 | 51.2 | 41.7 | 28.2 | 15.9 | ||||
| Armored Core 6 (2023) | 104.3 | 102.4 | 101.1 | 96.3 | 76.6 | 44.6 | |||
| Starfield (2023) | 73.5 | 64 | 51.6 | 47.1 | 32.5 | 23.1 | |||
| Lies of P (2023) | 160.7 | 152 | 130.2 | 117.1 | 80.2 | 65 | 41.6 | ||
| Baldur's Gate 3 (2023) | 163.1 | 121.6 | 102 | 86.7 | 84.7 | 30.3 | |||
| Cyberpunk 2077 (2023) | 122.9 | 99.3 | 84.8 | 75 | 46.9 | 20.9 | |||
| Counter-Strike 2 (2023) | 241 | 230 | 193.8 | 149.5 | 105.9 | 63.3 | |||
| EA Sports FC 24 (2023) | 249 | 199.3 | 161.7 | 151.4 | 129 | 79.5 | |||
| Assassin's Creed Mirage (2023) | 114 | 106 | 101 | 79 | 64 | 52 | 41 | ||
| Total War Pharaoh (2023) | 329.3 | 205.4 | 127.1 | 99.1 | 78.3 | 42.5 | |||
| Lords of the Fallen (2023) | 68 | 68.1 | 65.2 | 53.9 | 54.6 | 26.1 | 34 | ||
| Alan Wake 2 (2023) | 67 | 61.2 | 53.2 | 33.6 | 14.1 | ||||
| EA Sports WRC (2023) | 130.8 | 98.1 | 90.7 | 83.4 | 63.2 | 52.5 | 35.5 | ||
| Call of Duty Modern Warfare 3 2023 (2023) | 146 | 129 | 101 | 83 | 67 | 46 | 43 | ||
| Avatar Frontiers of Pandora (2023) | 76 | 72 | 61 | 46 | 31 | 28 | 16 | ||
| The Finals (2023) | 222 | 181.7 | 160.6 | 127.2 | 80.2 | 37.6 | |||
| Ready or Not (2023) | 210 | 189.1 | 174.8 | 131.3 | 82 | 75.1 | 37.2 | ||
| Prince of Persia The Lost Crown (2024) | 356 | 356 | 356 | 340 | 178 | ||||
| Palworld (2024) | 116.7 | 106.1 | 103 | 102.1 | 72.9 | 54.9 | 38.7 | ||
| Enshrouded (2024) | 80.3 | 68.8 | 58.8 | 49.2 | 38 | 34 | 32.8 | 22.8 | |
| Helldivers 2 (2024) | 130 | 101 | 91.3 | 89.5 | 65.6 | 35.3 | |||
| Skull & Bones (2024) | 112 | 103 | 84 | 63 | 50 | 46 | 43 | 31 | |
| Last Epoch (2024) | 192.2 | 184.2 | 167.2 | 127.3 | 83.6 | 40.7 | |||
| Alone in the Dark (2024) | 172.9 | 156.8 | 149.9 | 102.4 | 51.5 | 36.7 | 53.1 | 16.1 | |
| Dragon's Dogma 2 (2024) | 54.2 | 52.7 | 49.3 | 38.7 | 37.5 | 33.9 | |||
| Horizon Forbidden West (2024) | 104.2 | 96.2 | 62.7 | 60.5 | 47 | 42.2 | 38.8 | 29.3 | |
| Ghost of Tsushima (2024) | 88.6 | 80.7 | 74.5 | 60.3 | 63 | 48.3 | 8.5 | 4.8 | |
| Senua's Saga Hellblade 2 (2024) | 60.9 | 52.5 | 38.4 | 39.2 | 26.1 | 24.8 | 9.4 | ||
| F1 24 (2024) | 248 | 234 | 181.7 | 60 | 61.7 | 38.1 | 33 | 18.3 | |
| The First Descendant (2024) | 151.7 | 96.9 | 78.4 | 66.1 | 43.6 | 23.3 | 23.8 | ||
| Once Human (2024) | 184.4 | 126.1 | 108.6 | 99 | 68.2 | 35.6 | |||
| Black Myth: Wukong (2024) | 80 | 60 | 46 | 24 | 27 | 18 | 19 | 10 | |
| Star Wars Outlaws (2024) | 50.2 | 44.9 | 38.1 | 30.9 | 30.8 | 22.2 | |||
| Space Marine 2 (2024) | 77.3 | 71 | 68 | 62 | 61.8 | 46.4 | 38.8 | 24.2 | |
| Final Fantasy XVI (2024) | 69.4 | 66.7 | 56.5 | 49.6 | 40.8 | 36.2 | 17.9 | ||
| God of War Ragnarök (2024) | 127.7 | 107 | 91.4 | 83.1 | 90.6 | 63.2 | 35.6 | ||
| Until Dawn (2024) | 65.3 | 51.5 | 39.1 | 28.1 | 16.1 | ||||
| Call of Duty Black Ops 6 (2024) | 111 | 99 | 72 | 69 | 50 | 31 | |||
| Stalker 2 (2024) | 77.7 | 66.7 | 53.3 | 43.9 | 36.1 | ||||
| Indiana Jones and the Great Circle (2024) | 93.5 | 63 | |||||||
| Kingdom Come Deliverance 2 (2025) | 109 | 84.3 | 69.2 | 50.2 | 49.1 | 35.9 | 23 | 20.1 | |
| Monster Hunter Wilds (2025) | 60.2 | 51.1 | 30.5 | 31.1 | 24.6 | ||||
| Civilization 7 (2025) | 292 | 174.7 | 122.3 | 79.9 | 34.9 | ||||
| Assassin's Creed Shadows (2025) | 54 | 45 | 39 | 24 | 23 | ||||
| The Elder Scrolls IV Oblivion Remastered (2025) | 80.4 | 70.4 | 47.9 | 23.7 | 25.8 | 14.2 | |||
| Doom: The Dark Ages (2025) | 68 | 60.2 | 54.7 | 52.6 | 49.9 | 33.1 | |||
| F1 25 (2025) | 185.3 | 167.5 | 138.1 | 14.9 | 15.2 | 8.48 | 6.36 | 3.44 | |
| Borderlands 4 (2025) | 56.4 | 49.4 | 40 | 26.9 | 31.1 | 18.5 | |||
| Battlefield 6 (2025) | 104.7 | 94.3 | 80.5 | 60.2 | 38.4 | 39.1 | 23 | 17.7 | |
| The Outer Worlds 2 (2025) | 86.3 | 80.4 | 64.6 | 36.5 | 31 | 23 | |||
| ARC Raiders (2025) | 181.7 | 114.9 | 92.4 | 57.5 | 58.1 | 40.2 | 36.4 | 22.7 | |
| Anno 117: Pax Romana (2025) | 95.6 | 73.5 | 55.9 | 30 | 30.6 | 21.5 | |||
| Resident Evil Requiem (2026) | 112.5 | 85.2 | 79.5 | 42.2 | 13.3 | ||||
| Death Stranding 2 (2026) | 71.4 | 61.8 | 56.8 | 44.4 | 47.9 | 33.3 | 29.6 | 20.6 | |
| Crimson Desert (2026) | 90.9 | 57.4 | 53.9 | 46.2 | 37.6 | 35.9 | 22.2 | 20.5 | |
| Pragmata (2026) | 114.4 | 86.2 | 69.2 | 67.4 | 50.6 | 42.7 | 27.7 | ||
| Forza Horizon 6 (2026) | 142 | 90 | 48 | 21 | 18 | 17 | |||
| 007 First Light (2026) | 63.7 | 52.9 | 57.8 | 49.3 | 6.93 |
Utsläpp - Bra kylning och tyst under belastning
Bullerutsläpp
Minisforum NUCXi7:s kylsystem består av fem värmerör och två fläktar, som knappt hörs eller till och med är helt tysta vid tomgångsdrift. Men även under belastning blir enheten aldrig riktigt högljudd, och vi mäter en maximal ljudnivå på 40,8 dB(A).
Ljudnivå
| Låg belastning |
| 29.5 / 29.5 / 29.5 dB(A) |
| Hög belastning |
| 32.8 / 40.8 dB(A) |
 | ||
30 dB tyst 40 dB(A) hörbar 50 dB(A) högt ljud |
||
min: | ||
| Minisforum NUCX i7 i7-11800H, GeForce RTX 3070 Laptop GPU | Zotac Magnus One (ECM73070C) i7-10700, GeForce RTX 3070 | Zotac ZBOX Magnus EN173070C i7-11800H, GeForce RTX 3070 Laptop GPU | Intel Dragon Canyon NUC - RTX 3060 i9-12900, GeForce RTX 3060 | |
|---|---|---|---|---|
| Noise | -18% | -13% | -4% | |
| av / miljö * (dB) | 29.5 | 30 -2% | 30.7 -4% | 30.2 -2% |
| Idle Minimum * (dB) | 29.5 | 33.58 -14% | 32.7 -11% | 30.2 -2% |
| Idle Average * (dB) | 29.5 | 32.8 -11% | 30.4 -3% | |
| Idle Maximum * (dB) | 29.5 | 32.8 -11% | 30.8 -4% | |
| Load Average * (dB) | 32.8 | 44.25 -35% | 41.7 -27% | |
| Load Maximum * (dB) | 40.8 | 48.72 -19% | 45.4 -11% | 45.1 -11% |
* ... mindre är bättre
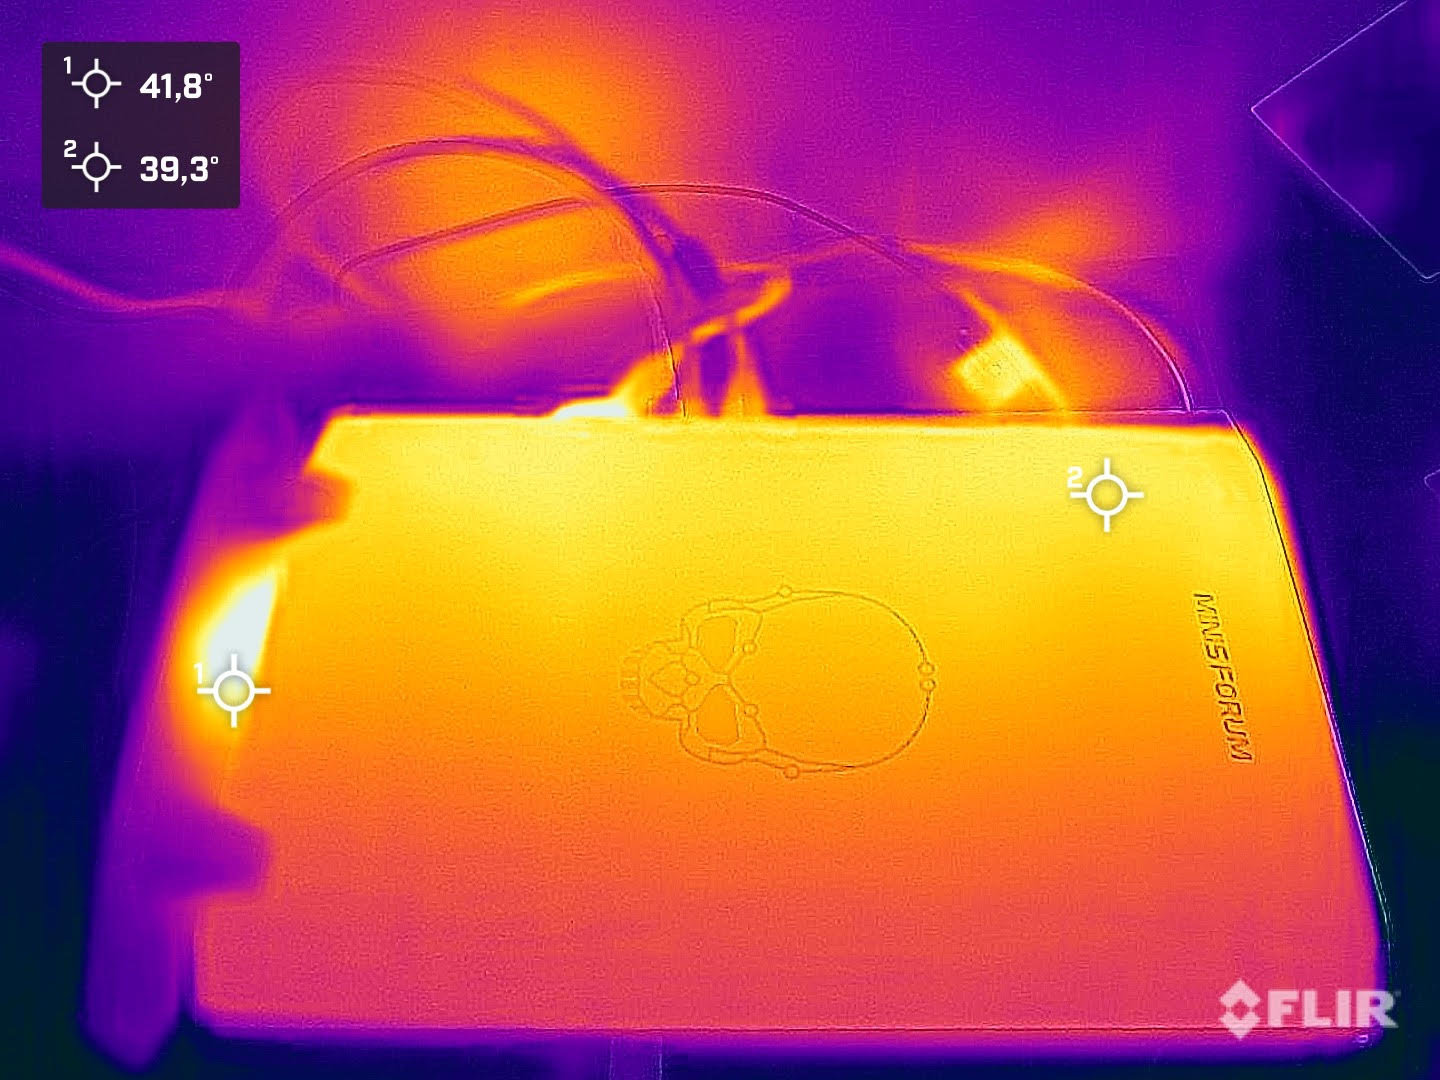
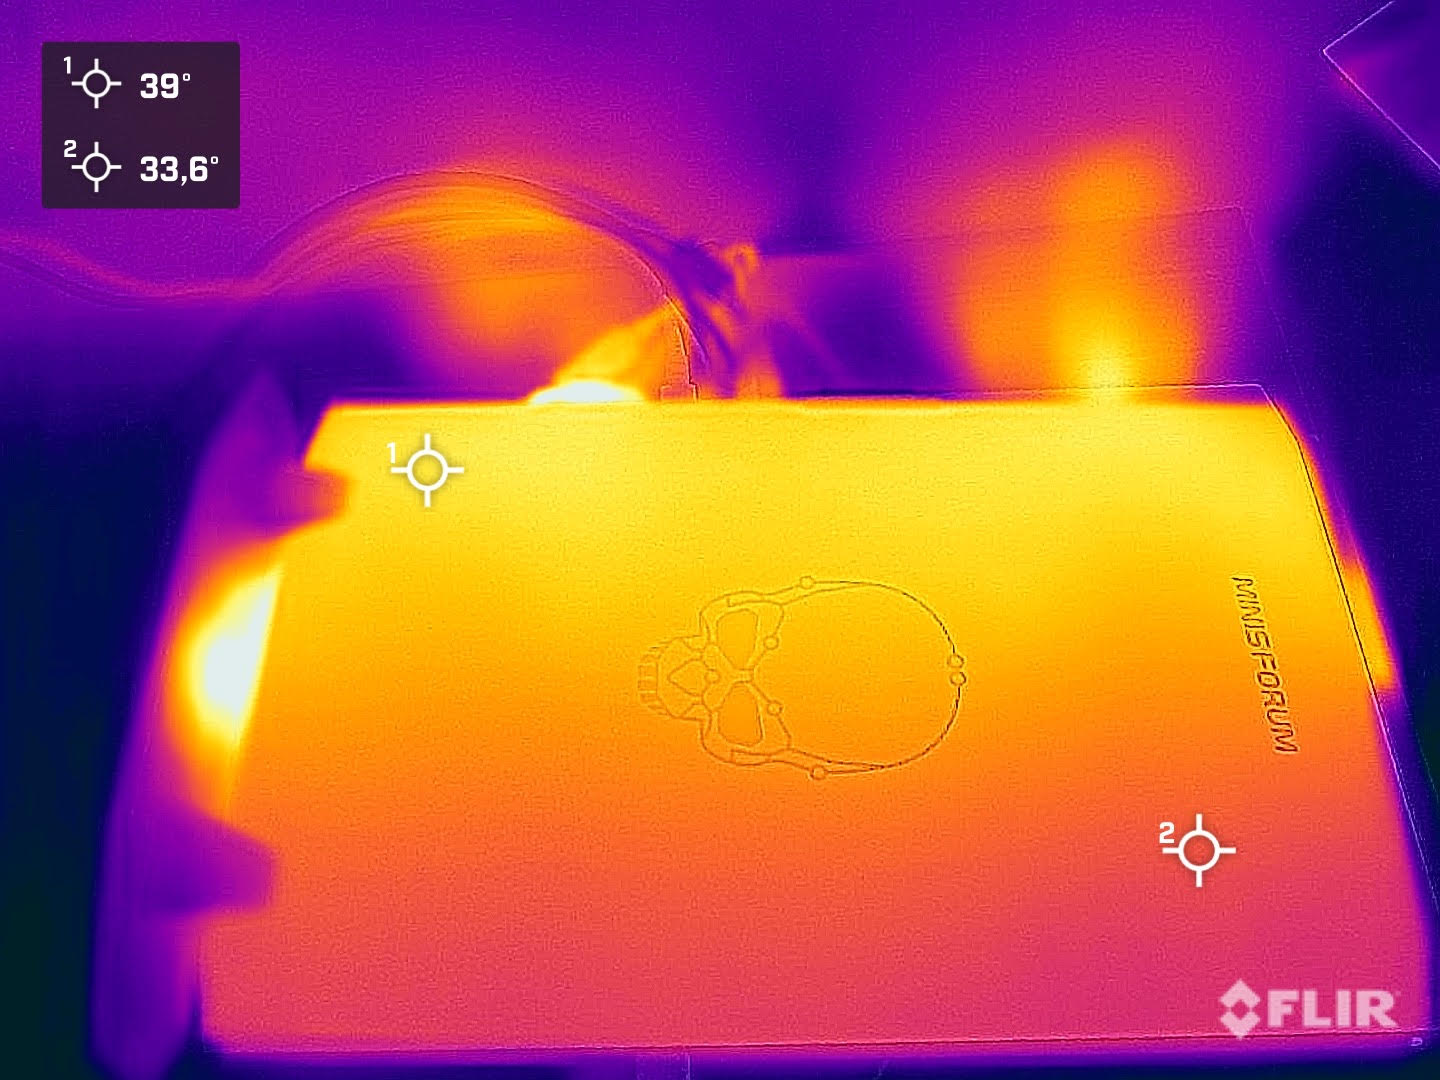
Temperaturer
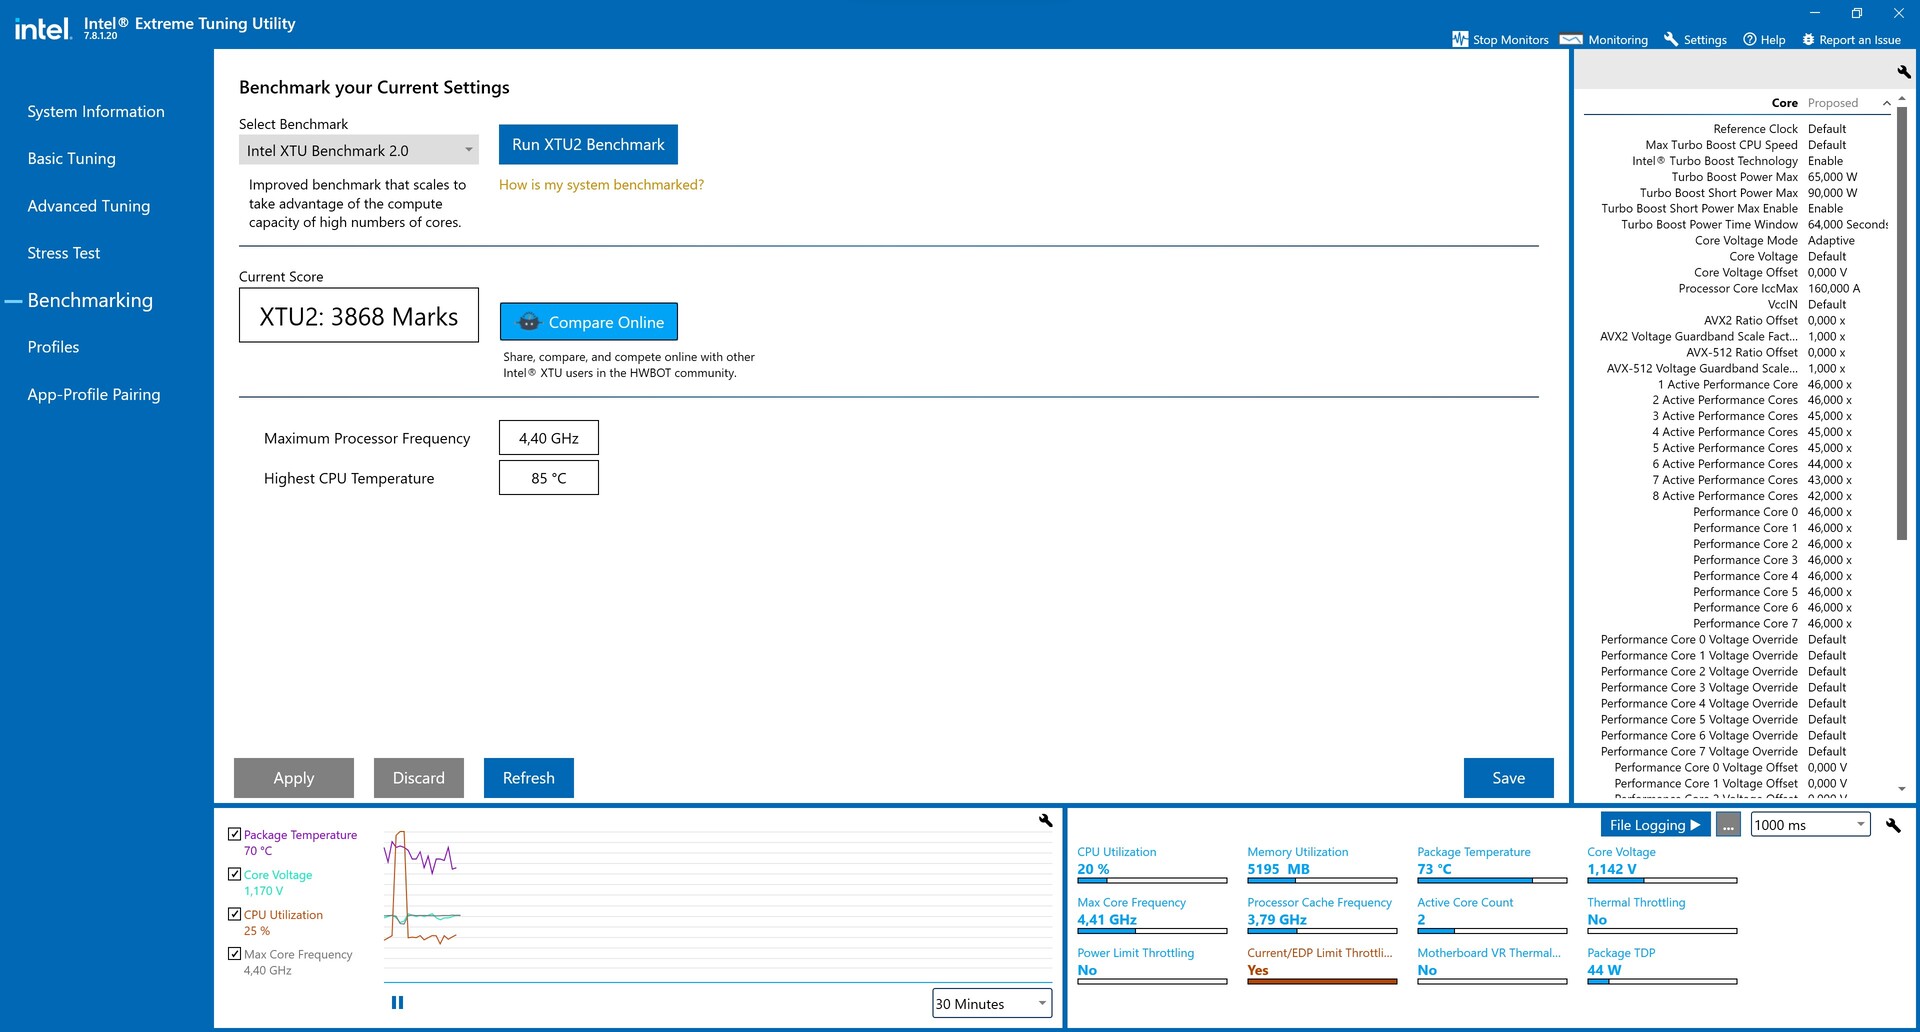
På grund av konstruktionen är temperaturen i höljet mycket lik den för en bärbar dator för spel. Under stresstestet mäter vi 45,9 °C (114,6 °F) på den varmaste platsen på den synliga sidan som också visar logotypen och etiketten. De temperaturer i höljet som vi mätte under spelandet är något lägre.
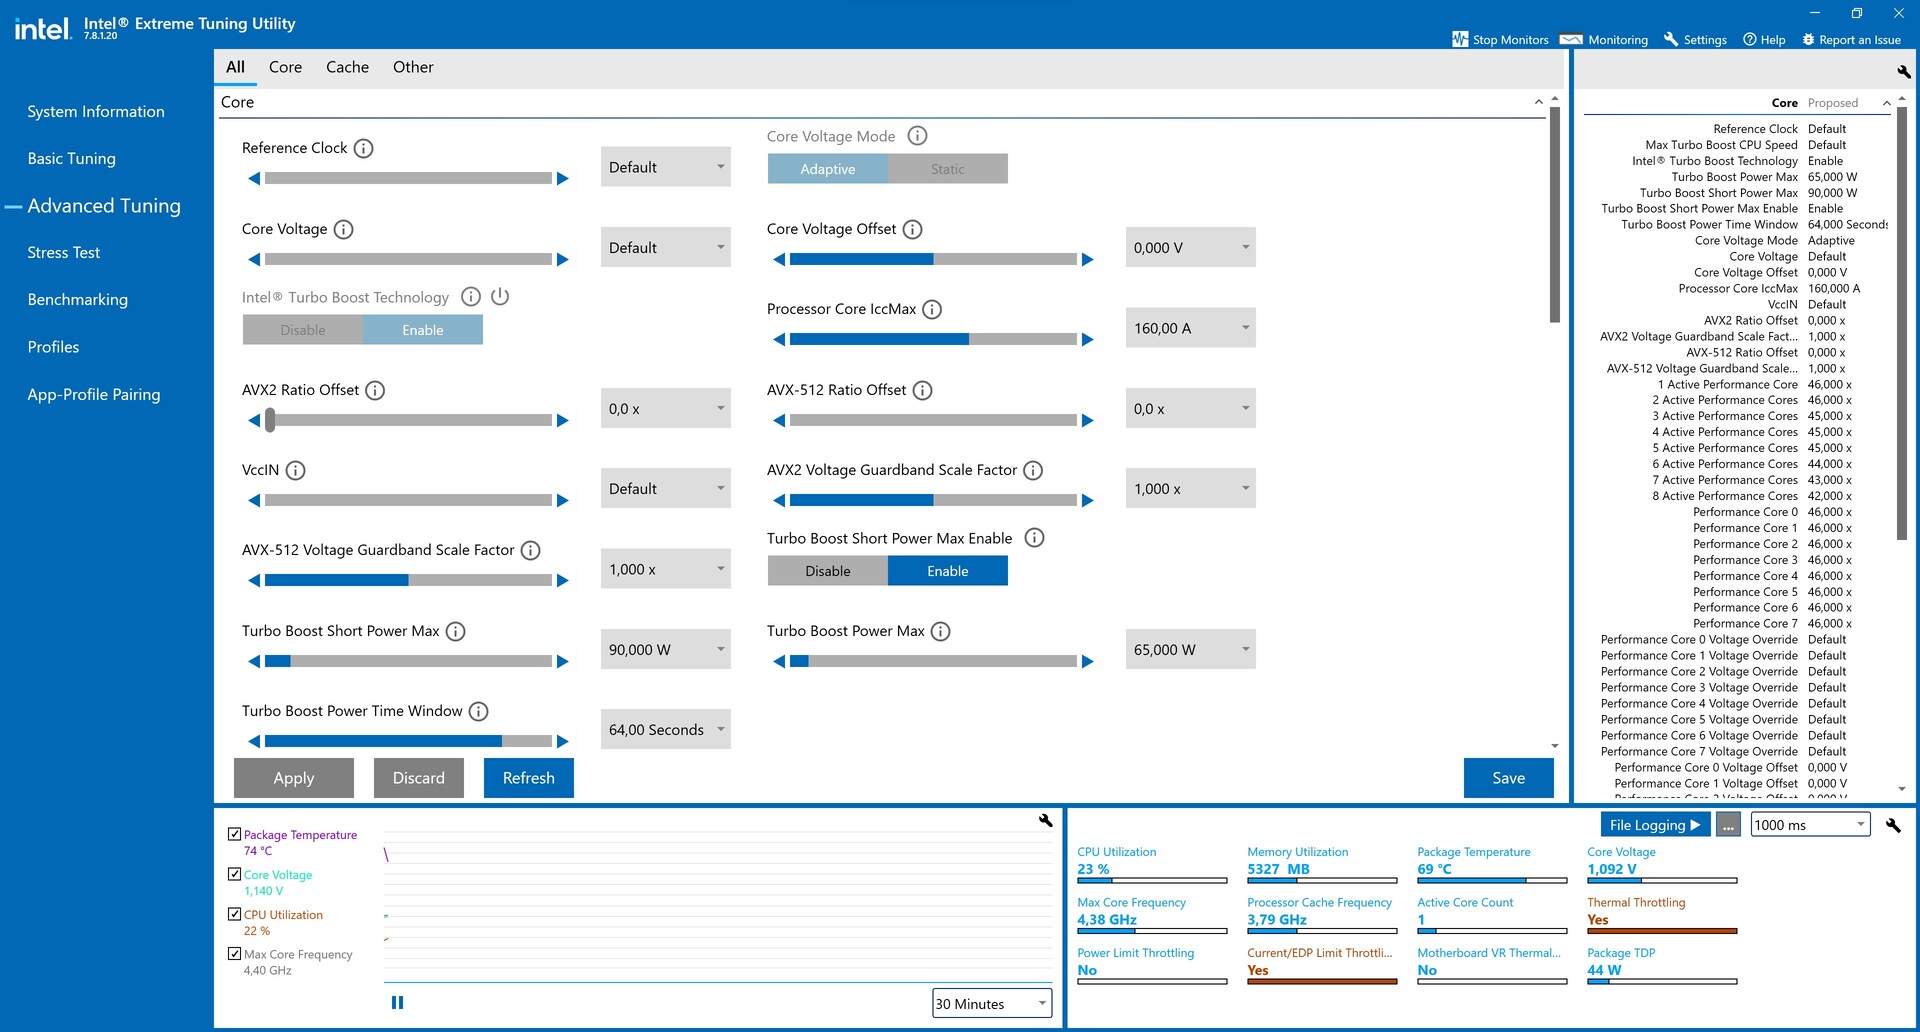
Det ser lika bra ut med komponenterna: Intel Core i7-11800H når 86 °C (187 °F) under belastning, även om Nvidia GeForce RTX 3070 Laptop GPU förblir något svalare under stresstestet på 77 °C (°F). Intel XTU och HWiNFO rapporterar om termisk strypning under belastning, vilket bekräftar att tillverkaren har definierat en termisk gräns på 85 °C (185 °F) för processorn. Du kan öka denna gräns för processorn till 94 °C (201 °F) i BIOS. Å andra sidan förblir gränsen 87 °C (189 °F) alltid fast för grafikkortet.
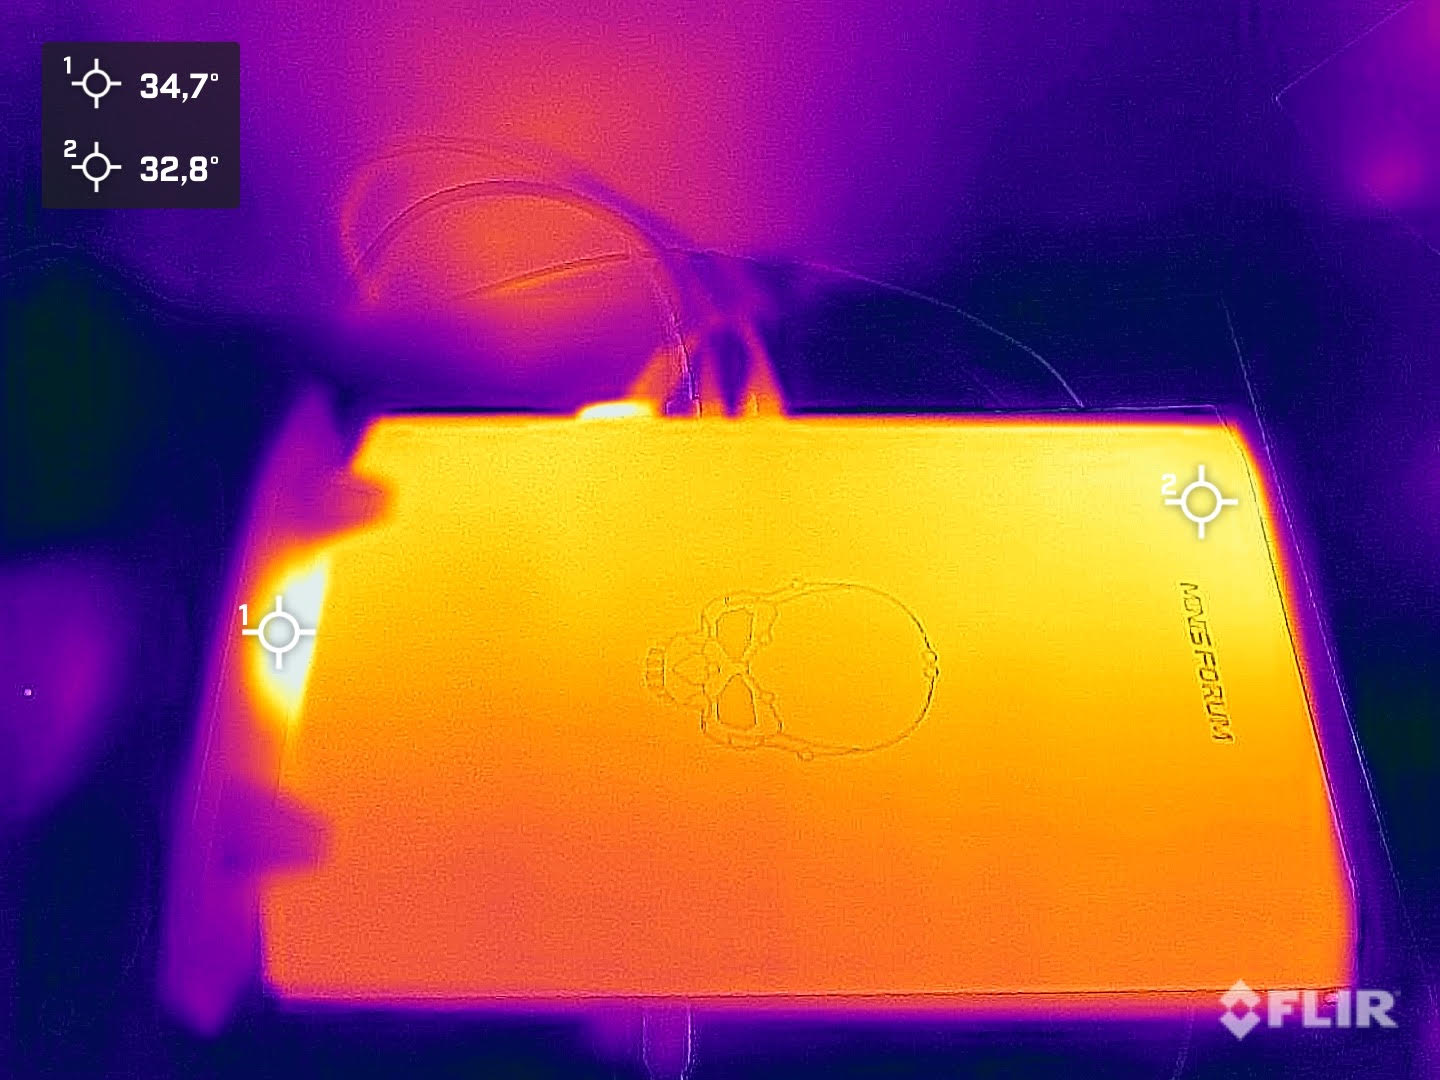
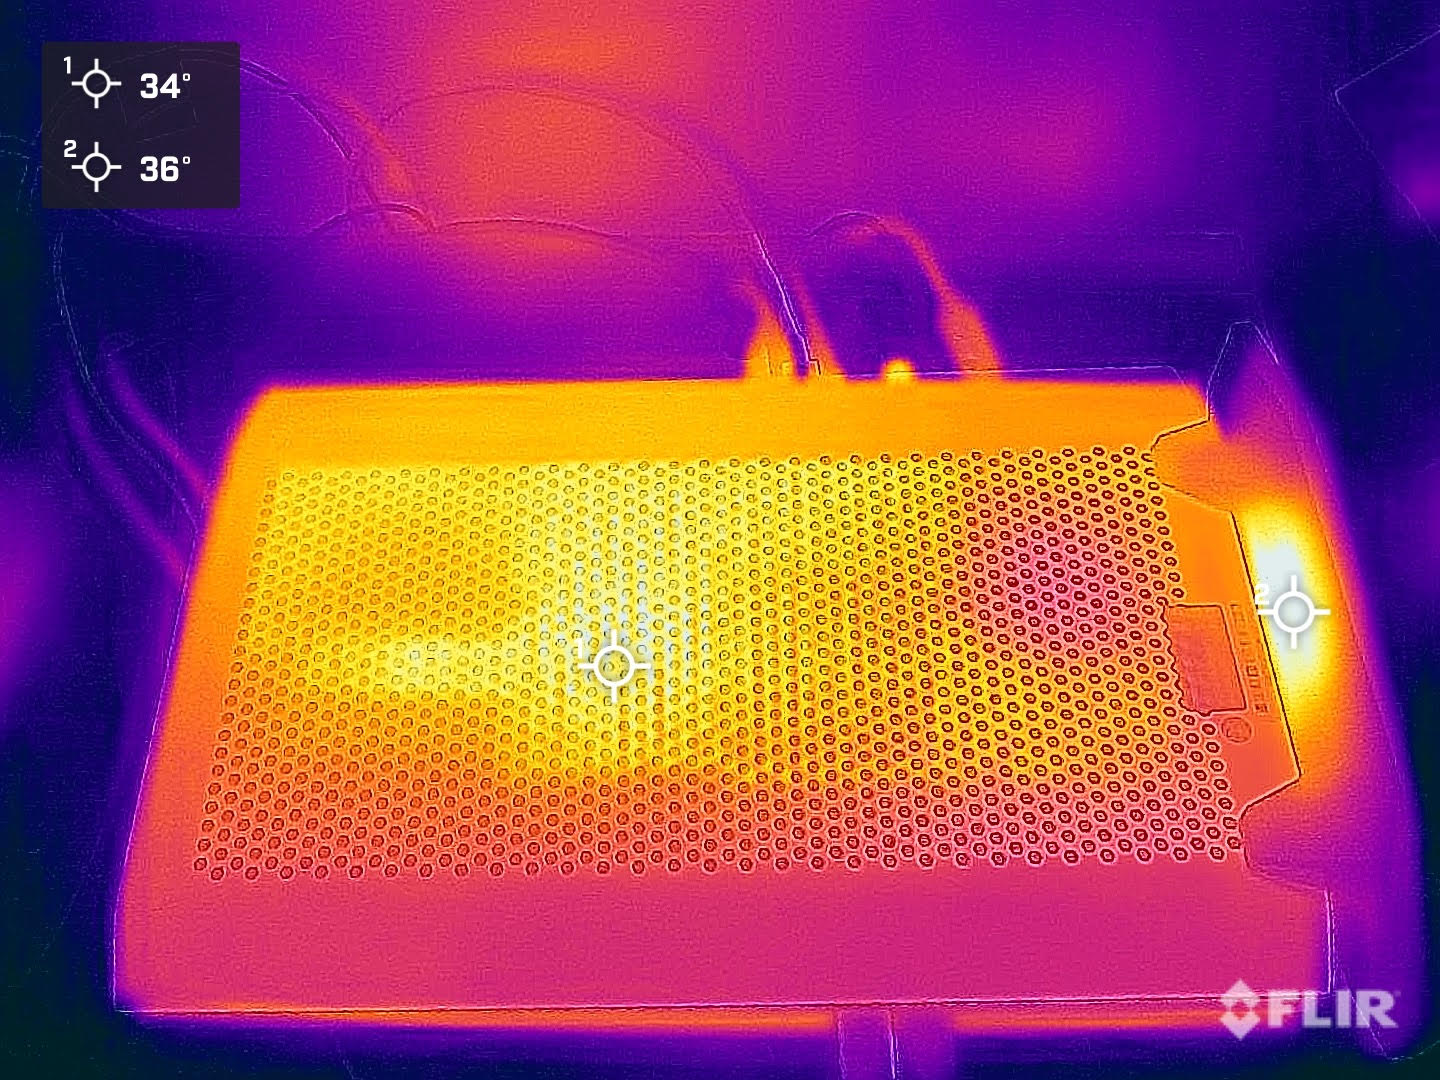
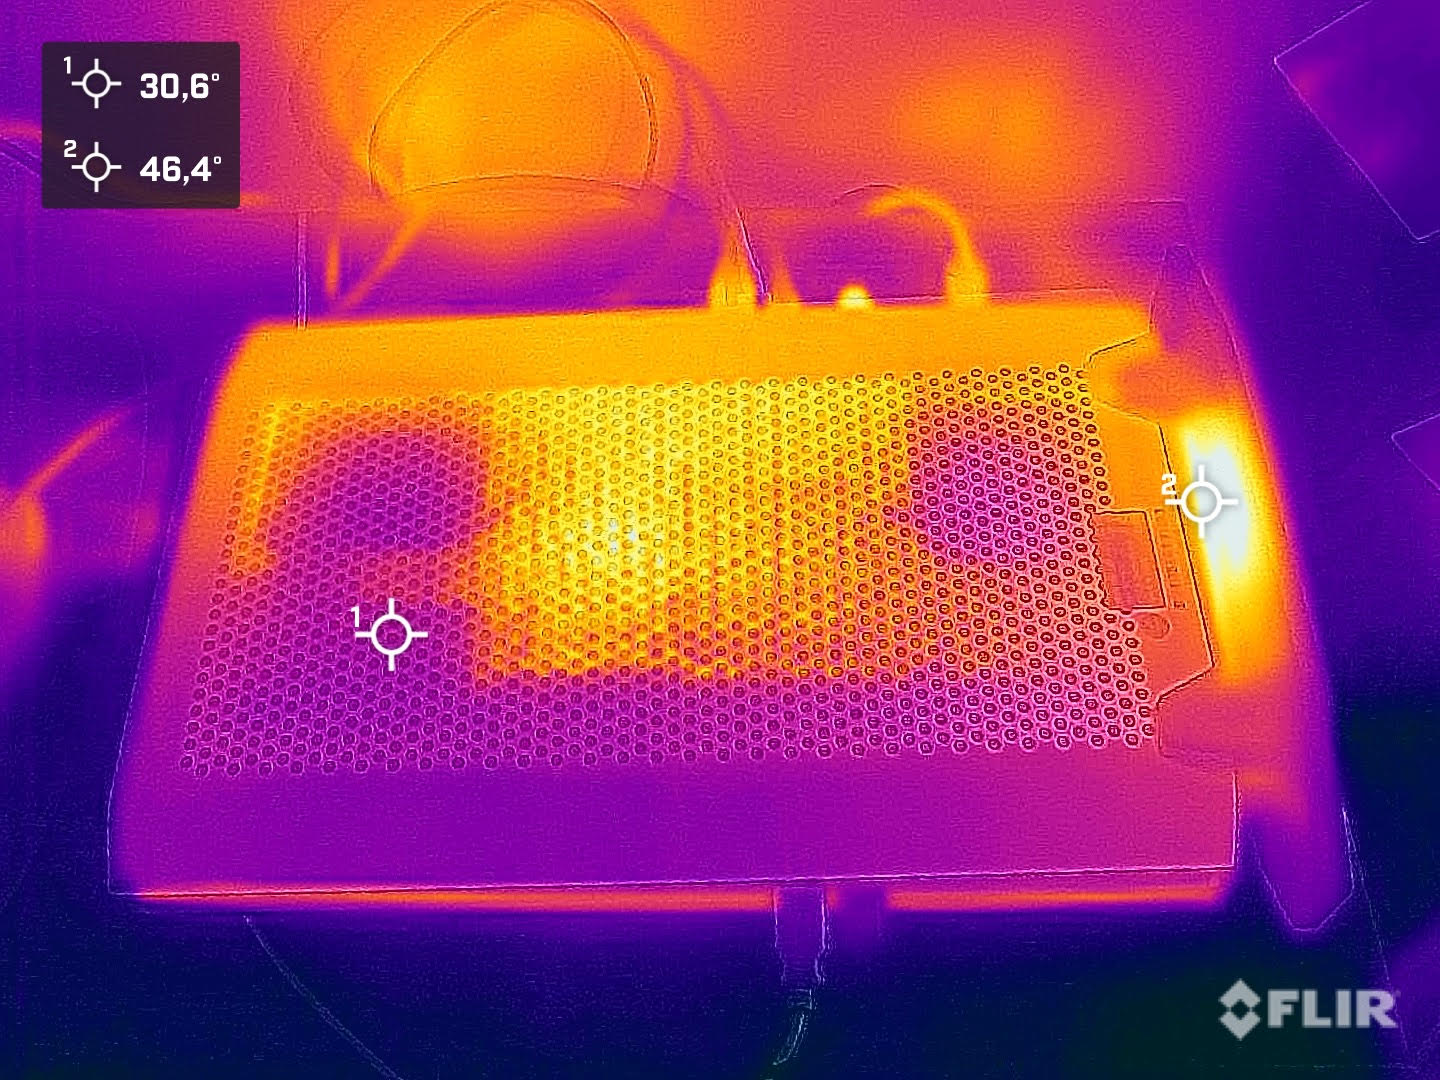
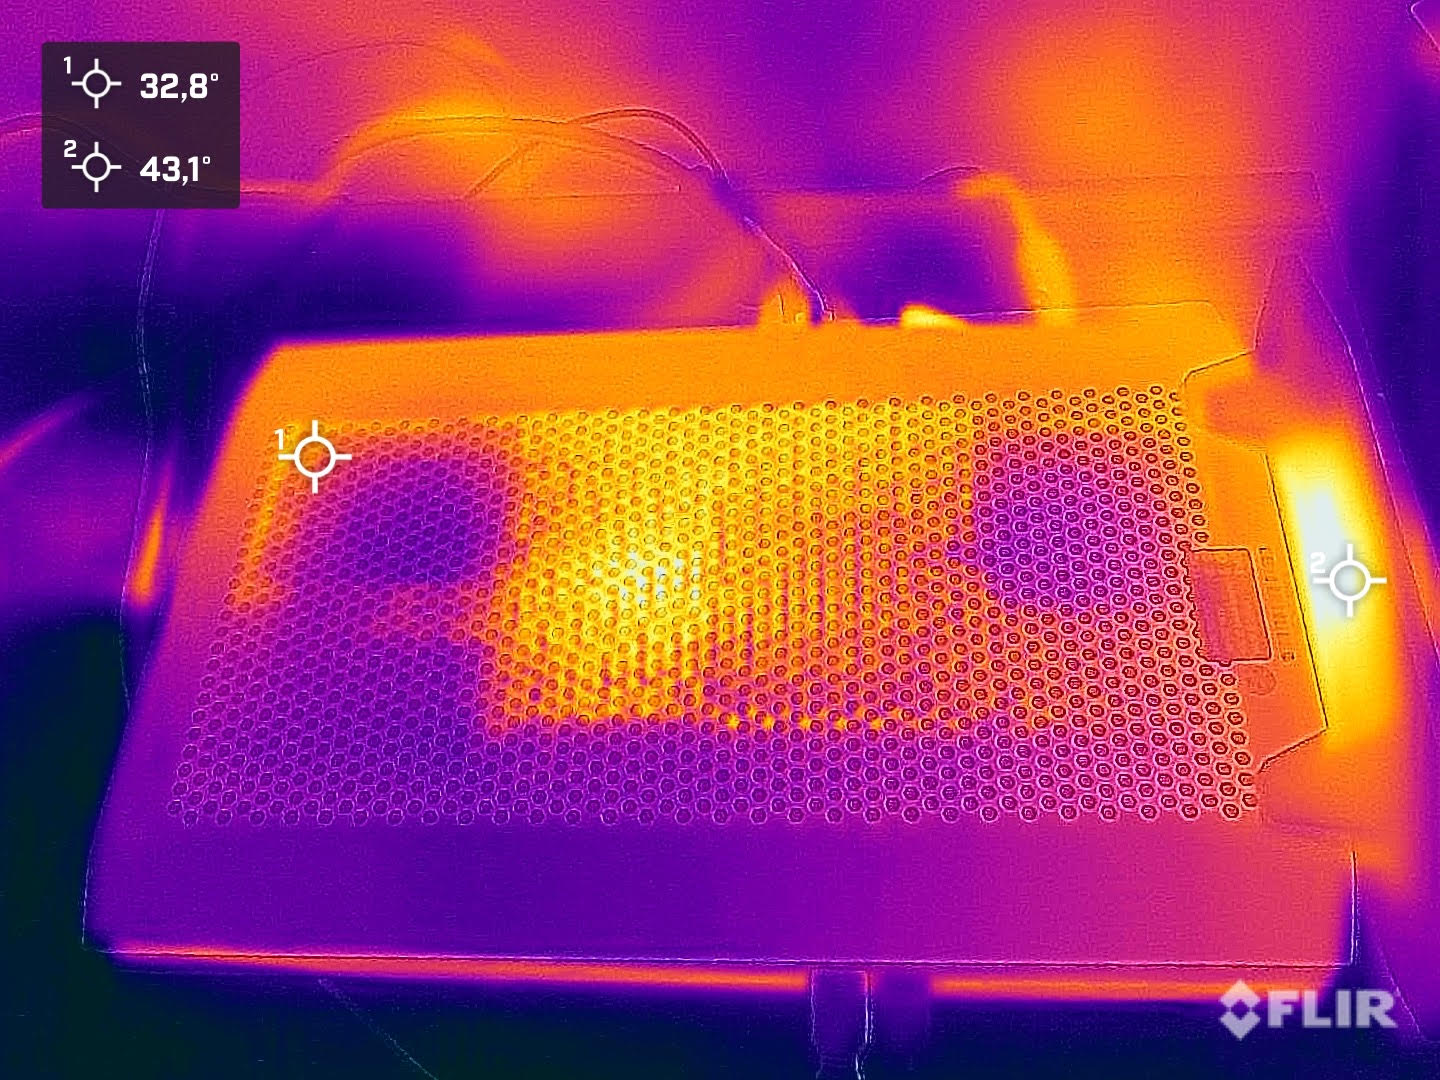
(-) Den maximala temperaturen på ovansidan är 45.9 °C / 115 F, jämfört med genomsnittet av 33.9 °C / 93 F , allt från 25 till 47 °C för klassen Desktop.
(+) Botten värms upp till maximalt 39.3 °C / 103 F, jämfört med genomsnittet av 33.6 °C / 92 F
(±) Vid tomgångsbruk är medeltemperaturen för ovansidan 35.7 °C / 96 F, jämfört med enhetsgenomsnittet på 29.5 °C / ### class_avg_f### F.
(-) När du spelar The Witcher 3 är medeltemperaturen för ovansidan 40.2 °C / 104 F, jämfört med enhetsgenomsnittet på 29.5 °C / ## #class_avg_f### F.
Effektförbrukning
Jämfört med en vanlig stationär dator har Minisforum NUCXi7 en klar fördel tack vare sina effektiva komponenter. Till och med jämfört med Zotac ZBOX Magnus EN1730Cligger vår testenhet klart före, eftersom den är betydligt effektivare trots nästan identisk hårdvara, utan att förlora något av prestandan. Med 28 till 36 watt är strömförbrukningen låg utan belastning men fortfarande betydligt högre jämfört med Gigabyte A7 X1. Under belastning förbrukar Minisforum NUCXi7 sedan i genomsnitt 83 watt, även om vi mäter 167 watt när vi spelar. Vi noterar också korta toppar på upp till 215 watt, vilket inte når gränserna för det 230-watts nätaggregatet.
| Av/Standby | |
| Låg belastning | |
| Hög belastning |
|
Förklaring:
min: | |
| Minisforum NUCX i7 i7-11800H, GeForce RTX 3070 Laptop GPU | Zotac ZBOX Magnus EN173070C i7-11800H, GeForce RTX 3070 Laptop GPU | Gigabyte A7 X1 R9 5900HX, GeForce RTX 3070 Laptop GPU | Genomsnitt NVIDIA GeForce RTX 3070 Laptop GPU | Genomsnitt av klass Desktop | |
|---|---|---|---|---|---|
| Power Consumption | -37% | 15% | 13% | 3% | |
| Idle Minimum * (Watt) | 28.2 | 31.3 -11% | 12 57% | 15.6 ? 45% | 17.9 ? 37% |
| Idle Average * (Watt) | 29.9 | 35.1 -17% | 14 53% | 20.1 ? 33% | 37.2 ? -24% |
| Idle Maximum * (Watt) | 36.2 | 41.6 -15% | 19 48% | 29.4 ? 19% | 41.3 ? -14% |
| Load Average * (Watt) | 83.2 | 214 -157% | 118 -42% | 110.8 ? -33% | 96.7 ? -16% |
| Witcher 3 ultra * (Watt) | 167 | 193.5 -16% | 205 -23% | ||
| Cyberpunk 2077 ultra external monitor * (Watt) | 177 | ||||
| Load Maximum * (Watt) | 215.7 | 231 -7% | 229 -6% | 214 ? 1% | 141.6 ? 34% |
* ... mindre är bättre
Power Consumption With External Monitor
För
Emot
Bedömning - En ultrasmal speldator
Med Minisforum NUCXi7 erbjuder tillverkaren en mycket spännande speldator med beprövad teknik för bärbara datorer. Kombinationen av Intel Core i7-11800Hoch Nvidia GeForce RTX 3070 GPU för bärbar datorfungerar mycket bra och garanterar ett snabbt fungerande system. Det mycket smala höljet ser ut att vara av hög kvalitet och modernt på samma gång. På grund av kylningen bör Minisforum NUCXi7 endast köras i vertikalt läge. Detta är något du måste acceptera när du bestämmer dig för enheten. Du måste också leva med några små kompromisser när det gäller utbudet av anslutningar, eftersom USB-A-portarna som vanligtvis används för mus och tangentbord är placerade på framsidan av enheten. Med den 512 GB stora SSD-enheten är du ganska väl rustad för början. Med tanke på de målinriktade användarna kan dock spelare snabbt stöta på dess gränser, och vi rekommenderar minst 1 TB som standard.
Minisforum NUCXi7 är en tyst speldator i ett ultrasmalt hölje som är utformad för spel med 1 440p.
Vi gillade verkligen Minisforum NUCXXi7:s låga utsläppsvärden: enheten är inte bara tyst utan också effektiv och håller alltid temperaturen under kontroll. Samtidigt behöver du inte leva med en minskad prestanda för CPU och GPU. Dessutom begick vårt testprov inte några dåliga misstag vid något tillfälle. Systemprestandan är bra när du arbetar eller spelar. I vissa delar kan Minisforum NUCXi7 till och med hålla jämna steg med vanliga stationära datorer.
Som ett möjligt alternativ till Minisforum NUCXi7 kan du också titta på en bärbar dator för spel. Det finns definitivt ett mervärde, även om det också finns en liten extra premie med liknande utrustning: Gigabyte A7 X1 kostar cirka 1 800 euro.
Pris och tillgänglighet
Minisforum NUCXi7är listad i Minisforums butik med beställningar som ska levereras i mitten av oktober. Det finns för närvarande fortfarande några attraktiva rabatter för förhandsförsäljning. Till exempel kostar vår testenhet för närvarande 1 169 dollar. Det ordinarie priset skulle vara 1 339 dollar utan rabatten. Den mer prisvärda NUCXi5 som för närvarande finns på kostar 979 dollar med samma RAM- och SSD-utrustning (normalt 1 129 dollar).
Minisforum NUCX i7
- 09/14/2022 v7 (old)
Sebastian Bade

