Test: Intel NUC 9 Extreme med Core i9 och RTX 2070 (Sammanfattning)

| Cinebench R15 | |
| CPU Single 64Bit | |
| Intel Core i9-10900K, NVIDIA Titan RTX | |
| Intel Core i9-9980HK, NVIDIA GeForce RTX 2070 (Desktop) | |
| AMD Ryzen 9 3950X, NVIDIA Titan RTX | |
| Intel Core i5-10600K, NVIDIA Titan RTX | |
| Genomsnitt Intel Core i9-9980HK (181 - 215, n=13) | |
| Genomsnitt Intel Core i7-9750H (170 - 194, n=82) | |
| Genomsnitt Intel Core i5-9300H (169 - 176, n=11) | |
| CPU Multi 64Bit | |
| AMD Ryzen 9 3950X, NVIDIA Titan RTX | |
| Intel Core i9-10900K, NVIDIA Titan RTX | |
| Genomsnitt Intel Core i9-9980HK (1327 - 1930, n=14) | |
| Intel Core i9-9980HK, NVIDIA GeForce RTX 2070 (Desktop) | |
| Intel Core i5-10600K, NVIDIA Titan RTX | |
| Genomsnitt Intel Core i7-9750H (952 - 1306, n=85) | |
| Genomsnitt Intel Core i5-9300H (717 - 850, n=11) | |
| Cinebench R20 | |
| CPU (Single Core) | |
| Intel Core i9-10900K, NVIDIA Titan RTX | |
| AMD Ryzen 9 3950X, NVIDIA Titan RTX | |
| Intel Core i9-9980HK, NVIDIA GeForce RTX 2070 (Desktop) | |
| Genomsnitt Intel Core i9-9980HK (431 - 505, n=10) | |
| Intel Core i5-10600K, NVIDIA Titan RTX | |
| Genomsnitt Intel Core i7-9750H (416 - 486, n=55) | |
| Genomsnitt Intel Core i5-9300H (398 - 427, n=9) | |
| CPU (Multi Core) | |
| AMD Ryzen 9 3950X, NVIDIA Titan RTX | |
| Intel Core i9-10900K, NVIDIA Titan RTX | |
| Genomsnitt Intel Core i9-9980HK (2974 - 4150, n=10) | |
| Intel Core i5-10600K, NVIDIA Titan RTX | |
| Intel Core i9-9980HK, NVIDIA GeForce RTX 2070 (Desktop) | |
| Genomsnitt Intel Core i7-9750H (2017 - 3133, n=55) | |
| Genomsnitt Intel Core i5-9300H (1530 - 1877, n=9) | |
| Cinebench R11.5 | |
| CPU Single 64Bit | |
| Intel Core i9-10900K, NVIDIA Titan RTX | |
| Intel Core i9-9980HK, NVIDIA GeForce RTX 2070 (Desktop) | |
| AMD Ryzen 9 3950X, NVIDIA Titan RTX | |
| Genomsnitt Intel Core i9-9980HK (2.25 - 2.4, n=3) | |
| Intel Core i5-10600K, NVIDIA Titan RTX | |
| Genomsnitt Intel Core i7-9750H (1.96 - 2.19, n=10) | |
| CPU Multi 64Bit | |
| AMD Ryzen 9 3950X, NVIDIA Titan RTX | |
| Intel Core i9-10900K, NVIDIA Titan RTX | |
| Intel Core i9-9980HK, NVIDIA GeForce RTX 2070 (Desktop) | |
| Genomsnitt Intel Core i9-9980HK (14.8 - 18, n=3) | |
| Intel Core i5-10600K, NVIDIA Titan RTX | |
| Genomsnitt Intel Core i7-9750H (11.3 - 14.1, n=10) | |
| Cinebench R10 | |
| Rendering Single CPUs 64Bit | |
| Intel Core i9-10900K, NVIDIA Titan RTX | |
| AMD Ryzen 9 3950X, NVIDIA Titan RTX | |
| Intel Core i9-9980HK, NVIDIA GeForce RTX 2070 (Desktop) | |
| Genomsnitt Intel Core i9-9980HK (n=1) | |
| Intel Core i5-10600K, NVIDIA Titan RTX | |
| Genomsnitt Intel Core i7-9750H (9069 - 9346, n=3) | |
| Rendering Multiple CPUs 64Bit | |
| AMD Ryzen 9 3950X, NVIDIA Titan RTX | |
| Intel Core i9-10900K, NVIDIA Titan RTX | |
| Intel Core i9-9980HK, NVIDIA GeForce RTX 2070 (Desktop) | |
| Genomsnitt Intel Core i9-9980HK (n=1) | |
| Intel Core i5-10600K, NVIDIA Titan RTX | |
| Genomsnitt Intel Core i7-9750H (37188 - 44238, n=3) | |
| Blender - v2.79 BMW27 CPU | |
| Genomsnitt Intel Core i5-9300H (588 - 643, n=3) | |
| Genomsnitt Intel Core i7-9750H (342 - 495, n=21) | |
| Genomsnitt Intel Core i9-9980HK (317 - 527, n=3) | |
| Intel Core i9-9980HK, NVIDIA GeForce RTX 2070 (Desktop) | |
| Intel Core i5-10600K, NVIDIA Titan RTX | |
| Intel Core i9-10900K, NVIDIA Titan RTX | |
| AMD Ryzen 9 3950X, NVIDIA Titan RTX | |
| wPrime 2.10 | |
| 32m | |
| Genomsnitt Intel Core i7-9750H (n=1) | |
| Intel Core i5-10600K, NVIDIA Titan RTX | |
| Genomsnitt Intel Core i9-9980HK (3.79 - 4.94, n=2) | |
| AMD Ryzen 9 3950X, NVIDIA Titan RTX | |
| Intel Core i9-9980HK, NVIDIA GeForce RTX 2070 (Desktop) | |
| Intel Core i9-10900K, NVIDIA Titan RTX | |
| 1024m | |
| Genomsnitt Intel Core i7-9750H (n=1) | |
| Intel Core i9-9980HK, NVIDIA GeForce RTX 2070 (Desktop) | |
| Genomsnitt Intel Core i9-9980HK (110.4 - 120.2, n=2) | |
| Intel Core i5-10600K, NVIDIA Titan RTX | |
| Intel Core i9-10900K, NVIDIA Titan RTX | |
| AMD Ryzen 9 3950X, NVIDIA Titan RTX | |
| X264 HD Benchmark 4.0 | |
| Pass 1 | |
| Intel Core i9-10900K, NVIDIA Titan RTX | |
| AMD Ryzen 9 3950X, NVIDIA Titan RTX | |
| Intel Core i5-10600K, NVIDIA Titan RTX | |
| Genomsnitt Intel Core i9-9980HK (238 - 239, n=2) | |
| Intel Core i9-9980HK, NVIDIA GeForce RTX 2070 (Desktop) | |
| Genomsnitt Intel Core i7-9750H (211 - 219, n=2) | |
| Genomsnitt Intel Core i5-9300H (n=1) | |
| Pass 2 | |
| AMD Ryzen 9 3950X, NVIDIA Titan RTX | |
| Intel Core i9-10900K, NVIDIA Titan RTX | |
| Genomsnitt Intel Core i9-9980HK (92.8 - 94.8, n=2) | |
| Intel Core i9-9980HK, NVIDIA GeForce RTX 2070 (Desktop) | |
| Intel Core i5-10600K, NVIDIA Titan RTX | |
| Genomsnitt Intel Core i7-9750H (69.6 - 70.9, n=2) | |
| Genomsnitt Intel Core i5-9300H (n=1) | |
| WinRAR - Result | |
| Intel Core i9-10900K, NVIDIA Titan RTX | |
| AMD Ryzen 9 3950X, NVIDIA Titan RTX | |
| Genomsnitt Intel Core i9-9980HK (7266 - 7436, n=2) | |
| Intel Core i9-9980HK, NVIDIA GeForce RTX 2070 (Desktop) | |
| Intel Core i5-10600K, NVIDIA Titan RTX | |
| Genomsnitt Intel Core i7-9750H (6160 - 6631, n=2) | |
| Genomsnitt Intel Core i5-9300H (n=1) | |
| TrueCrypt | |
| AES Mean 100MB | |
| Intel Core i9-10900K, NVIDIA Titan RTX | |
| AMD Ryzen 9 3950X, NVIDIA Titan RTX | |
| Genomsnitt Intel Core i9-9980HK (10.1 - 10.3, n=2) | |
| Intel Core i9-9980HK, NVIDIA GeForce RTX 2070 (Desktop) | |
| Intel Core i5-10600K, NVIDIA Titan RTX | |
| Genomsnitt Intel Core i7-9750H (7.3 - 7.4, n=2) | |
| Genomsnitt Intel Core i5-9300H (n=1) | |
| Twofish Mean 100MB | |
| AMD Ryzen 9 3950X, NVIDIA Titan RTX | |
| Intel Core i9-10900K, NVIDIA Titan RTX | |
| Intel Core i9-9980HK, NVIDIA GeForce RTX 2070 (Desktop) | |
| Genomsnitt Intel Core i9-9980HK (1.7 - 1.7, n=2) | |
| Intel Core i5-10600K, NVIDIA Titan RTX | |
| Genomsnitt Intel Core i7-9750H (1.2 - 1.3, n=2) | |
| Genomsnitt Intel Core i5-9300H (n=1) | |
| Serpent Mean 100MB | |
| AMD Ryzen 9 3950X, NVIDIA Titan RTX | |
| Intel Core i9-10900K, NVIDIA Titan RTX | |
| Intel Core i9-9980HK, NVIDIA GeForce RTX 2070 (Desktop) | |
| Genomsnitt Intel Core i9-9980HK (1 - 1, n=2) | |
| Intel Core i5-10600K, NVIDIA Titan RTX | |
| Genomsnitt Intel Core i7-9750H (0.7 - 0.75, n=2) | |
| Genomsnitt Intel Core i5-9300H (n=1) | |
| Geekbench 5.5 | |
| Multi-Core | |
| AMD Ryzen 9 3950X, NVIDIA Titan RTX | |
| Intel Core i9-10900K, NVIDIA Titan RTX | |
| Intel Core i9-9980HK, NVIDIA GeForce RTX 2070 (Desktop) | |
| Genomsnitt Intel Core i9-9980HK (6945 - 7703, n=3) | |
| Intel Core i5-10600K, NVIDIA Titan RTX | |
| Genomsnitt Intel Core i7-9750H (4859 - 6262, n=13) | |
| Single-Core | |
| Intel Core i9-10900K, NVIDIA Titan RTX | |
| Intel Core i9-9980HK, NVIDIA GeForce RTX 2070 (Desktop) | |
| Genomsnitt Intel Core i9-9980HK (1314 - 1378, n=2) | |
| AMD Ryzen 9 3950X, NVIDIA Titan RTX | |
| Intel Core i5-10600K, NVIDIA Titan RTX | |
| Genomsnitt Intel Core i7-9750H (1117 - 1251, n=13) | |
| Geekbench 5.0 | |
| 5.0 Multi-Core | |
| AMD Ryzen 9 3950X, NVIDIA Titan RTX | |
| Intel Core i9-10900K, NVIDIA Titan RTX | |
| Intel Core i9-9980HK, NVIDIA GeForce RTX 2070 (Desktop) | |
| Genomsnitt Intel Core i9-9980HK (7072 - 7805, n=4) | |
| Intel Core i5-10600K, NVIDIA Titan RTX | |
| Genomsnitt Intel Core i7-9750H (4812 - 6230, n=15) | |
| Genomsnitt Intel Core i5-9300H (3697 - 4200, n=3) | |
| 5.0 Single-Core | |
| Intel Core i9-10900K, NVIDIA Titan RTX | |
| Intel Core i9-9980HK, NVIDIA GeForce RTX 2070 (Desktop) | |
| AMD Ryzen 9 3950X, NVIDIA Titan RTX | |
| Intel Core i5-10600K, NVIDIA Titan RTX | |
| Genomsnitt Intel Core i9-9980HK (1171 - 1355, n=4) | |
| Genomsnitt Intel Core i7-9750H (1105 - 1248, n=15) | |
| Genomsnitt Intel Core i5-9300H (1095 - 1137, n=3) | |
| Geekbench 4.4 | |
| 64 Bit Single-Core Score | |
| Intel Core i9-10900K, NVIDIA Titan RTX | |
| Intel Core i9-9980HK, NVIDIA GeForce RTX 2070 (Desktop) | |
| Genomsnitt Intel Core i9-9980HK (5617 - 5972, n=3) | |
| Intel Core i5-10600K, NVIDIA Titan RTX | |
| AMD Ryzen 9 3950X, NVIDIA Titan RTX | |
| Genomsnitt Intel Core i7-9750H (4440 - 5511, n=27) | |
| Genomsnitt Intel Core i5-9300H (4704 - 5089, n=7) | |
| 64 Bit Multi-Core Score | |
| AMD Ryzen 9 3950X, NVIDIA Titan RTX | |
| Intel Core i9-10900K, NVIDIA Titan RTX | |
| Genomsnitt Intel Core i9-9980HK (28625 - 30849, n=3) | |
| Intel Core i9-9980HK, NVIDIA GeForce RTX 2070 (Desktop) | |
| Intel Core i5-10600K, NVIDIA Titan RTX | |
| Genomsnitt Intel Core i7-9750H (17054 - 25043, n=27) | |
| Genomsnitt Intel Core i5-9300H (14853 - 17684, n=7) | |
| 3DMark 11 - 1280x720 Performance Physics | |
| Intel Core i9-10900K, NVIDIA Titan RTX | |
| AMD Ryzen 9 3950X, NVIDIA Titan RTX | |
| Intel Core i9-9980HK, NVIDIA GeForce RTX 2070 (Desktop) | |
| Intel Core i5-10600K, NVIDIA Titan RTX | |
| Genomsnitt Intel Core i9-9980HK (9056 - 18260, n=12) | |
| Genomsnitt Intel Core i7-9750H (9704 - 14337, n=80) | |
| Intel Core i9-9980HK, Intel UHD Graphics 630 | |
| Genomsnitt Intel Core i5-9300H (7499 - 10557, n=12) | |
| 7-Zip 18.03 | |
| 7z b 4 | |
| AMD Ryzen 9 3950X, NVIDIA Titan RTX | |
| Intel Core i9-10900K, NVIDIA Titan RTX | |
| Intel Core i9-9980HK, NVIDIA GeForce RTX 2070 (Desktop) | |
| Genomsnitt Intel Core i9-9980HK (39566 - 44081, n=4) | |
| Intel Core i5-10600K, NVIDIA Titan RTX | |
| Genomsnitt Intel Core i7-9750H (28512 - 35174, n=21) | |
| Genomsnitt Intel Core i5-9300H (20736 - 23155, n=3) | |
| 7z b 4 -mmt1 | |
| Intel Core i9-10900K, NVIDIA Titan RTX | |
| Intel Core i9-9980HK, NVIDIA GeForce RTX 2070 (Desktop) | |
| Genomsnitt Intel Core i9-9980HK (5283 - 5642, n=4) | |
| AMD Ryzen 9 3950X, NVIDIA Titan RTX | |
| Intel Core i5-10600K, NVIDIA Titan RTX | |
| Genomsnitt Intel Core i7-9750H (4580 - 5090, n=21) | |
| Genomsnitt Intel Core i5-9300H (4542 - 4626, n=3) | |
| HWBOT x265 Benchmark v2.2 - 4k Preset | |
| Intel Core i9-10900K, NVIDIA Titan RTX | |
| AMD Ryzen 9 3950X, NVIDIA Titan RTX | |
| Intel Core i5-10600K, NVIDIA Titan RTX | |
| Genomsnitt Intel Core i9-9980HK (10.8 - 12.4, n=3) | |
| Intel Core i9-9980HK, NVIDIA GeForce RTX 2070 (Desktop) | |
| Genomsnitt Intel Core i7-9750H (7.1 - 10.7, n=21) | |
| Genomsnitt Intel Core i5-9300H (5.7 - 6.5, n=3) | |
| R Benchmark 2.5 - Overall mean | |
| Genomsnitt Intel Core i7-9750H (0.608 - 0.695, n=14) | |
| Intel Core i5-10600K, NVIDIA Titan RTX | |
| Intel Core i9-9980HK, NVIDIA GeForce RTX 2070 (Desktop) | |
| Genomsnitt Intel Core i9-9980HK (n=1) | |
| Intel Core i9-10900K, NVIDIA Titan RTX | |
| AMD Ryzen 9 3950X, NVIDIA Titan RTX | |
| LibreOffice - 20 Documents To PDF | |
| Intel Core i9-10900K, NVIDIA Titan RTX | |
| Genomsnitt Intel Core i7-9750H (54.5 - 64.7, n=9) | |
| AMD Ryzen 9 3950X, NVIDIA Titan RTX | |
| Genomsnitt Intel Core i9-9980HK (45.2 - 57.5, n=2) | |
| Intel Core i5-10600K, NVIDIA Titan RTX | |
| Intel Core i9-9980HK, NVIDIA GeForce RTX 2070 (Desktop) | |
| WebXPRT 3 - Overall | |
| Intel Core i9-10900K, NVIDIA Titan RTX | |
| AMD Ryzen 9 3950X, NVIDIA Titan RTX | |
| Intel Core i5-10600K, NVIDIA Titan RTX | |
| Intel Core i9-9980HK, NVIDIA GeForce RTX 2070 (Desktop) | |
| Genomsnitt Intel Core i9-9980HK (n=1) | |
| Genomsnitt Intel Core i5-9300H (n=1) | |
| Genomsnitt Intel Core i7-9750H (199 - 231, n=10) | |
| Mozilla Kraken 1.1 - Total | |
| Genomsnitt Intel Core i5-9300H (1079 - 1349, n=8) | |
| Genomsnitt Intel Core i7-9750H (845 - 1713, n=54) | |
| Genomsnitt Intel Core i9-9980HK (705 - 999, n=9) | |
| Intel Core i5-10600K, NVIDIA Titan RTX | |
| Intel Core i9-9980HK, NVIDIA GeForce RTX 2070 (Desktop) | |
| Intel Core i9-10900K, NVIDIA Titan RTX | |
| AMD Ryzen 9 3950X, NVIDIA Titan RTX | |
* ... mindre är bättre
| PCMark 10 - Score | |
| AMD Ryzen 9 3950X, AMD Ryzen 9 3950X | |
| Intel Core i9-10900K, Intel Core i9-10900K | |
| Corsair One i160, Intel Core i9-9900K | |
| Intel Core i5-10600K, Intel Core i5-10600K | |
| Intel Ghost Canyon NUC (RTX 2070), Intel Core i9-9980HK | |
| Intel Ghost Canyon NUC, Intel Core i9-9980HK | |
| PCMark 8 | |
| Work Score Accelerated v2 | |
| AMD Ryzen 9 3950X, AMD Ryzen 9 3950X | |
| Corsair One i160, Intel Core i9-9900K | |
| Intel Core i5-10600K, Intel Core i5-10600K | |
| Intel Core i9-10900K, Intel Core i9-10900K | |
| Intel Ghost Canyon NUC (RTX 2070), Intel Core i9-9980HK | |
| Intel Ghost Canyon NUC, Intel Core i9-9980HK | |
| Creative Score Accelerated v2 | |
| Corsair One i160, Intel Core i9-9900K | |
| AMD Ryzen 9 3950X, AMD Ryzen 9 3950X | |
| Intel Core i5-10600K, Intel Core i5-10600K | |
| Intel Core i9-10900K, Intel Core i9-10900K | |
| Intel Ghost Canyon NUC (RTX 2070), Intel Core i9-9980HK | |
| Intel Ghost Canyon NUC, Intel Core i9-9980HK | |
| Home Score Accelerated v2 | |
| Corsair One i160, Intel Core i9-9900K | |
| AMD Ryzen 9 3950X, AMD Ryzen 9 3950X | |
| Intel Ghost Canyon NUC (RTX 2070), Intel Core i9-9980HK | |
| Intel Core i5-10600K, Intel Core i5-10600K | |
| Intel Core i9-10900K, Intel Core i9-10900K | |
| Intel Ghost Canyon NUC, Intel Core i9-9980HK | |
| Borderlands 3 | |
| 1280x720 Very Low Overall Quality (DX11) | |
| Intel Ghost Canyon NUC (RTX 2070) | |
| Genomsnitt NVIDIA GeForce RTX 2070 (Desktop) (138 - 152, n=2) | |
| Genomsnitt NVIDIA GeForce RTX 2070 Mobile (94 - 125, n=2) | |
| Genomsnitt Intel UHD Graphics 630 (n=1) | |
| 1920x1080 Badass Overall Quality (DX11) | |
| Genomsnitt NVIDIA GeForce RTX 2070 (Desktop) (70.9 - 74.4, n=2) | |
| Intel Ghost Canyon NUC (RTX 2070) | |
| Genomsnitt NVIDIA GeForce RTX 2070 Mobile (61 - 64.5, n=3) | |
| Metro Exodus | |
| 1280x720 Low Quality AF:4x | |
| Intel Ghost Canyon NUC (RTX 2070) | |
| Genomsnitt NVIDIA GeForce RTX 2070 (Desktop) (82.7 - 181, n=4) | |
| Genomsnitt NVIDIA GeForce RTX 2070 Mobile (91.1 - 98, n=2) | |
| Genomsnitt Intel UHD Graphics 630 (n=1) | |
| 1920x1080 Ultra Quality AF:16x | |
| Intel Ghost Canyon NUC (RTX 2070) | |
| Genomsnitt NVIDIA GeForce RTX 2070 (Desktop) (33.4 - 62.8, n=4) | |
| Genomsnitt NVIDIA GeForce RTX 2070 Mobile (53.3 - 54.6, n=5) | |
| Far Cry New Dawn | |
| 1280x720 Low Preset | |
| Intel Ghost Canyon NUC (RTX 2070) | |
| Genomsnitt NVIDIA GeForce RTX 2070 (Desktop) (117 - 128, n=3) | |
| Genomsnitt Intel UHD Graphics 630 (n=1) | |
| 1920x1080 Ultra Preset | |
| Genomsnitt NVIDIA GeForce RTX 2070 (Desktop) (79 - 94, n=3) | |
| Genomsnitt NVIDIA GeForce RTX 2070 Mobile (82 - 83, n=2) | |
| Intel Ghost Canyon NUC (RTX 2070) | |
| Forza Horizon 4 | |
| 1280x720 Very Low Preset | |
| Intel Ghost Canyon NUC (RTX 2070) | |
| Genomsnitt NVIDIA GeForce RTX 2070 (Desktop) (169 - 198, n=4) | |
| Genomsnitt NVIDIA GeForce RTX 2070 Mobile (n=1) | |
| 1920x1080 Ultra Preset AA:2xMS | |
| Genomsnitt NVIDIA GeForce RTX 2070 (Desktop) (106 - 118, n=4) | |
| Intel Ghost Canyon NUC (RTX 2070) | |
| Genomsnitt NVIDIA GeForce RTX 2070 Mobile (n=1) | |
| The Witcher 3 | |
| 1024x768 Low Graphics & Postprocessing | |
| Genomsnitt NVIDIA GeForce RTX 2070 Mobile (193.9 - 357, n=12) | |
| Intel Ghost Canyon NUC (RTX 2070) | |
| Genomsnitt NVIDIA GeForce RTX 2070 (Desktop) (151.4 - 315, n=5) | |
| Genomsnitt Intel UHD Graphics 630 (15.2 - 17.3, n=3) | |
| 1920x1080 Ultra Graphics & Postprocessing (HBAO+) | |
| Intel Ghost Canyon NUC (RTX 2070) | |
| Genomsnitt NVIDIA GeForce RTX 2070 (Desktop) (40.9 - 95, n=5) | |
| Genomsnitt NVIDIA GeForce RTX 2070 Mobile (64 - 82.1, n=21) | |
| låg | med. | hög | ultra | QHD DLSS | QHD | 4K | |
|---|---|---|---|---|---|---|---|
| The Witcher 3 (2015) | 286 | 216 | 142 | 83.1 | 55.9 | ||
| Dota 2 Reborn (2015) | 155.6 | 141.8 | 137.6 | 130.3 | 116.1 | ||
| Final Fantasy XV Benchmark (2018) | 193 | 122 | 90.6 | 37.1 | |||
| X-Plane 11.11 (2018) | 127 | 115 | 92.7 | 82.2 | |||
| Far Cry 5 (2018) | 147 | 106 | 82 | 86 | 71 | 46 | |
| Strange Brigade (2018) | 431 | 233 | 184.1 | 158.6 | 114.8 | 65.1 | |
| Forza Horizon 4 (2018) | 198 | 141 | 132 | 106 | 88 | 61 | |
| Far Cry New Dawn (2019) | 128 | 92 | 87 | 79 | 63 | 49 | |
| Metro Exodus (2019) | 181 | 104 | 77 | 60.9 | 48.4 | 30.5 | |
| Borderlands 3 (2019) | 152 | 126 | 91.7 | 70.9 | 49.8 | 26.7 | |
| Baldur's Gate 3 (2023) | 80.4 | 81.6 | 52.3 | 29.8 | |||
| Cyberpunk 2077 (2023) | 109.3 | 87.5 | 75.6 | 66.5 | 40.6 | ||
| Space Marine 2 (2024) | 58 | ||||||
| Stalker 2 (2024) | 35.5 | 29.5 | |||||
| Indiana Jones and the Great Circle (2024) | 75.4 | 49.4 | |||||
| Kingdom Come Deliverance 2 (2025) | 101.4 | 78.1 | 63.4 | 45.6 | |||
| Civilization 7 (2025) | 106.2 | 71.5 | 37.3 | ||||
| The Elder Scrolls IV Oblivion Remastered (2025) | 62.1 | 42.7 | 35 | 23.9 | 11.8 | ||
| Doom: The Dark Ages (2025) | 52.7 | 44.6 | 40.5 | 38.7 | |||
| F1 25 (2025) | 175.9 | 156.8 | 120.8 | ||||
| Borderlands 4 (2025) | 33.6 | 30.1 | 22.8 | 14.8 | |||
| ARC Raiders (2025) | 138.7 | 83.4 | 68.2 | 33.3 |
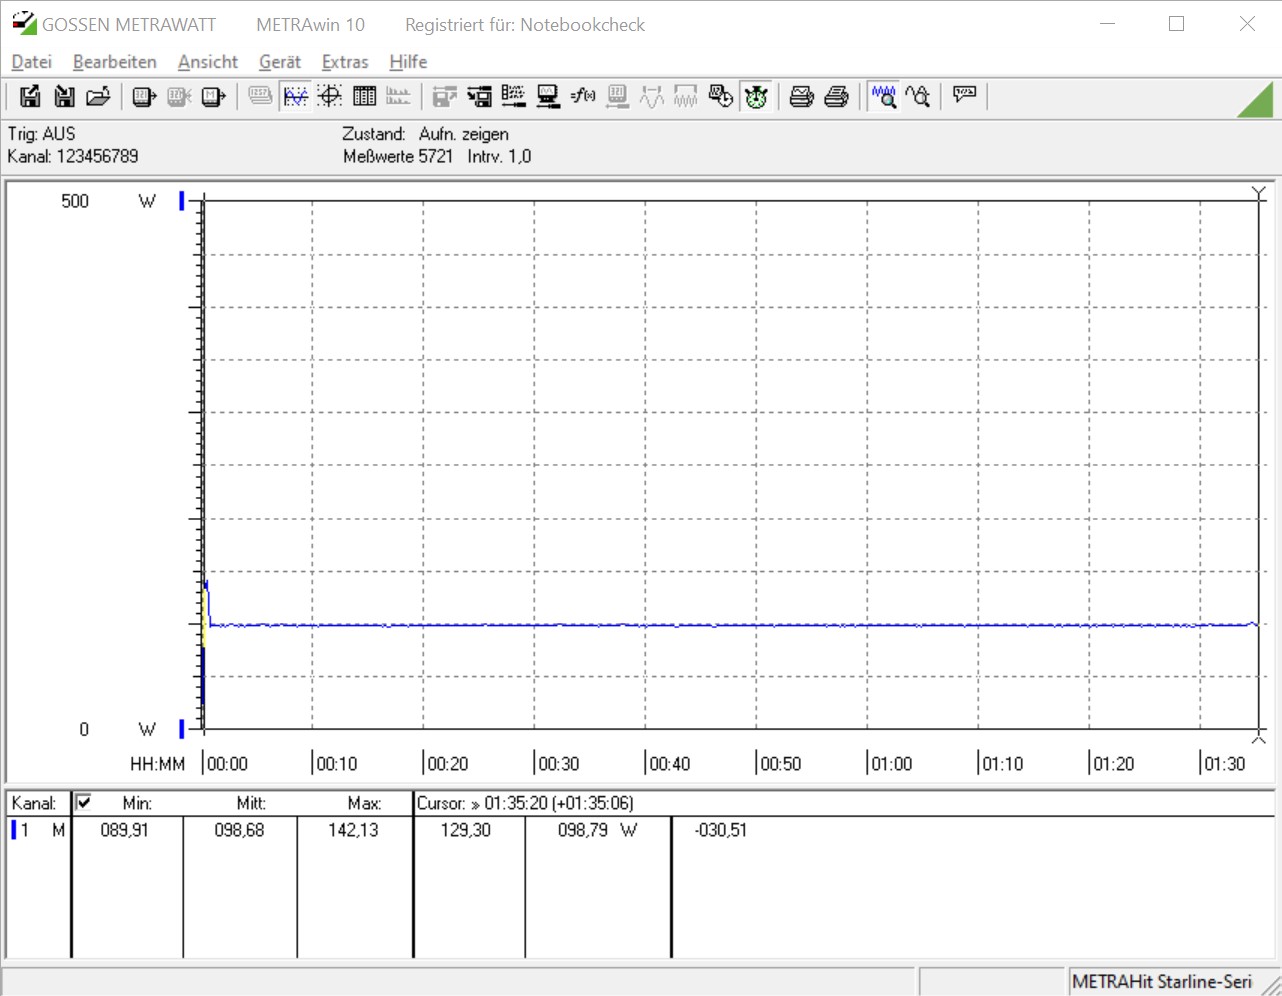
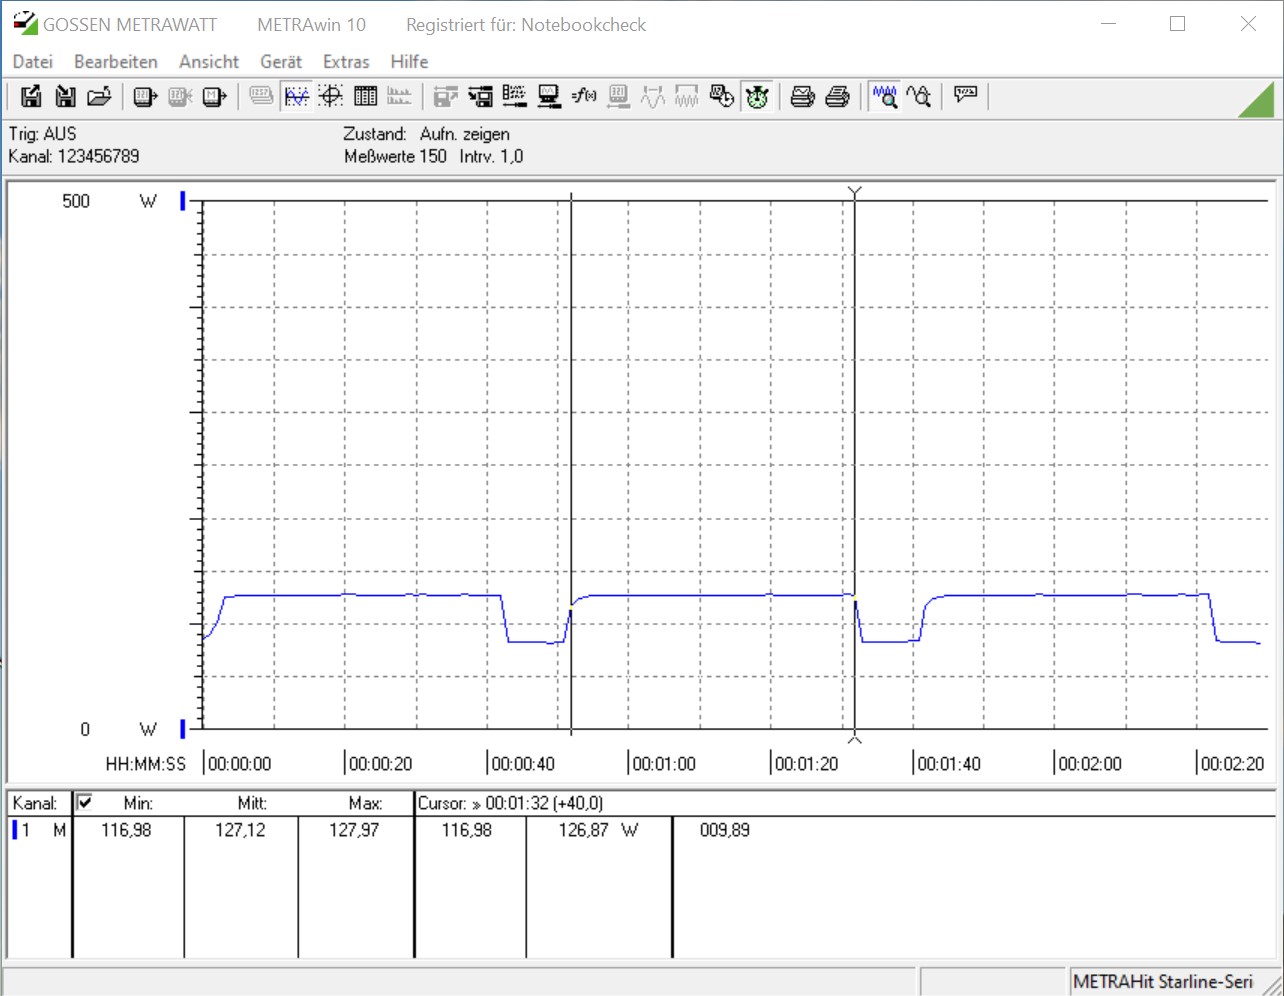
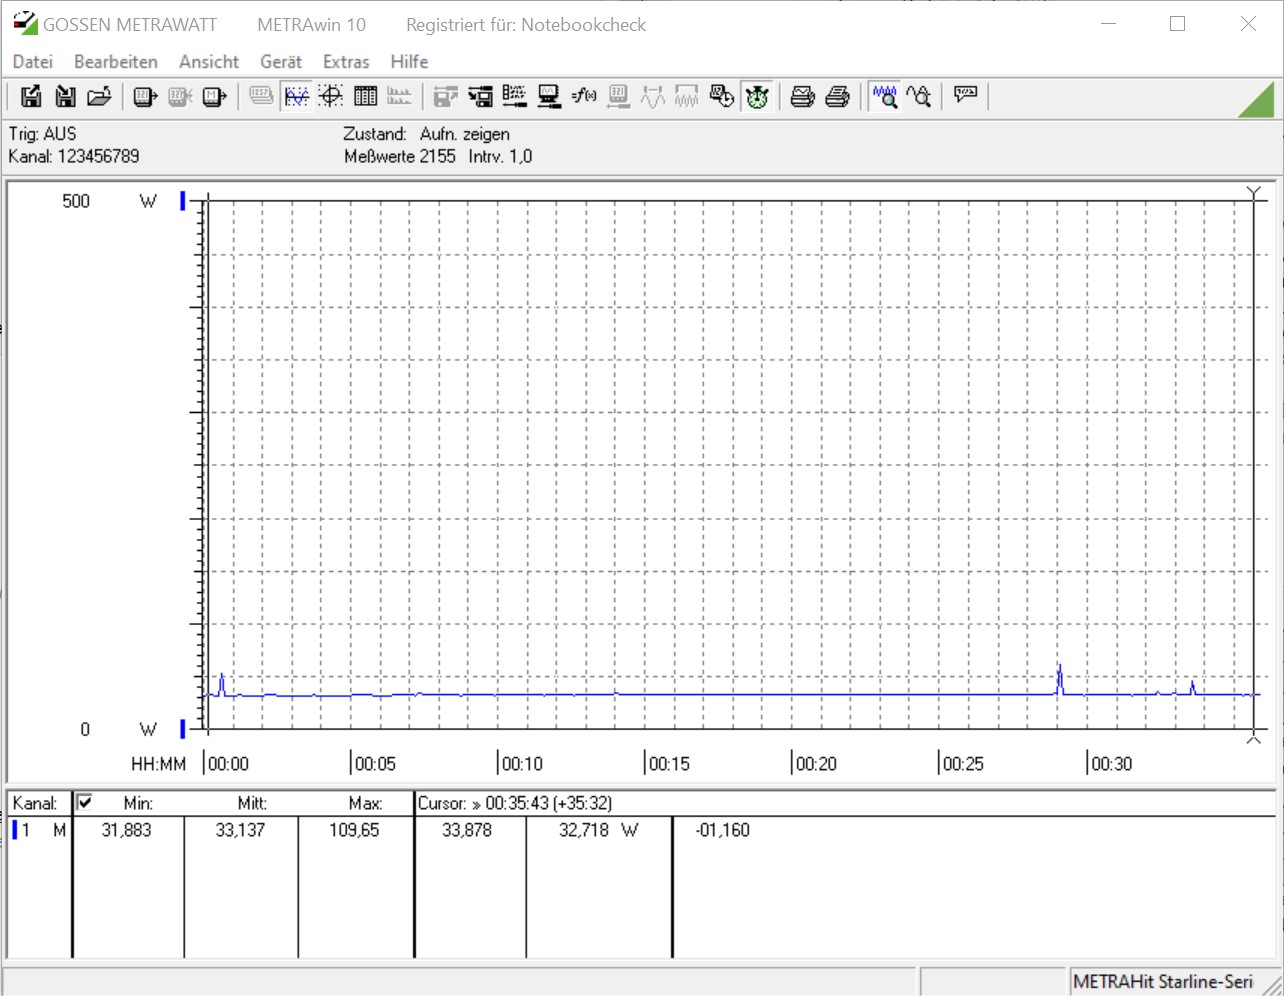
| Power Consumption | |
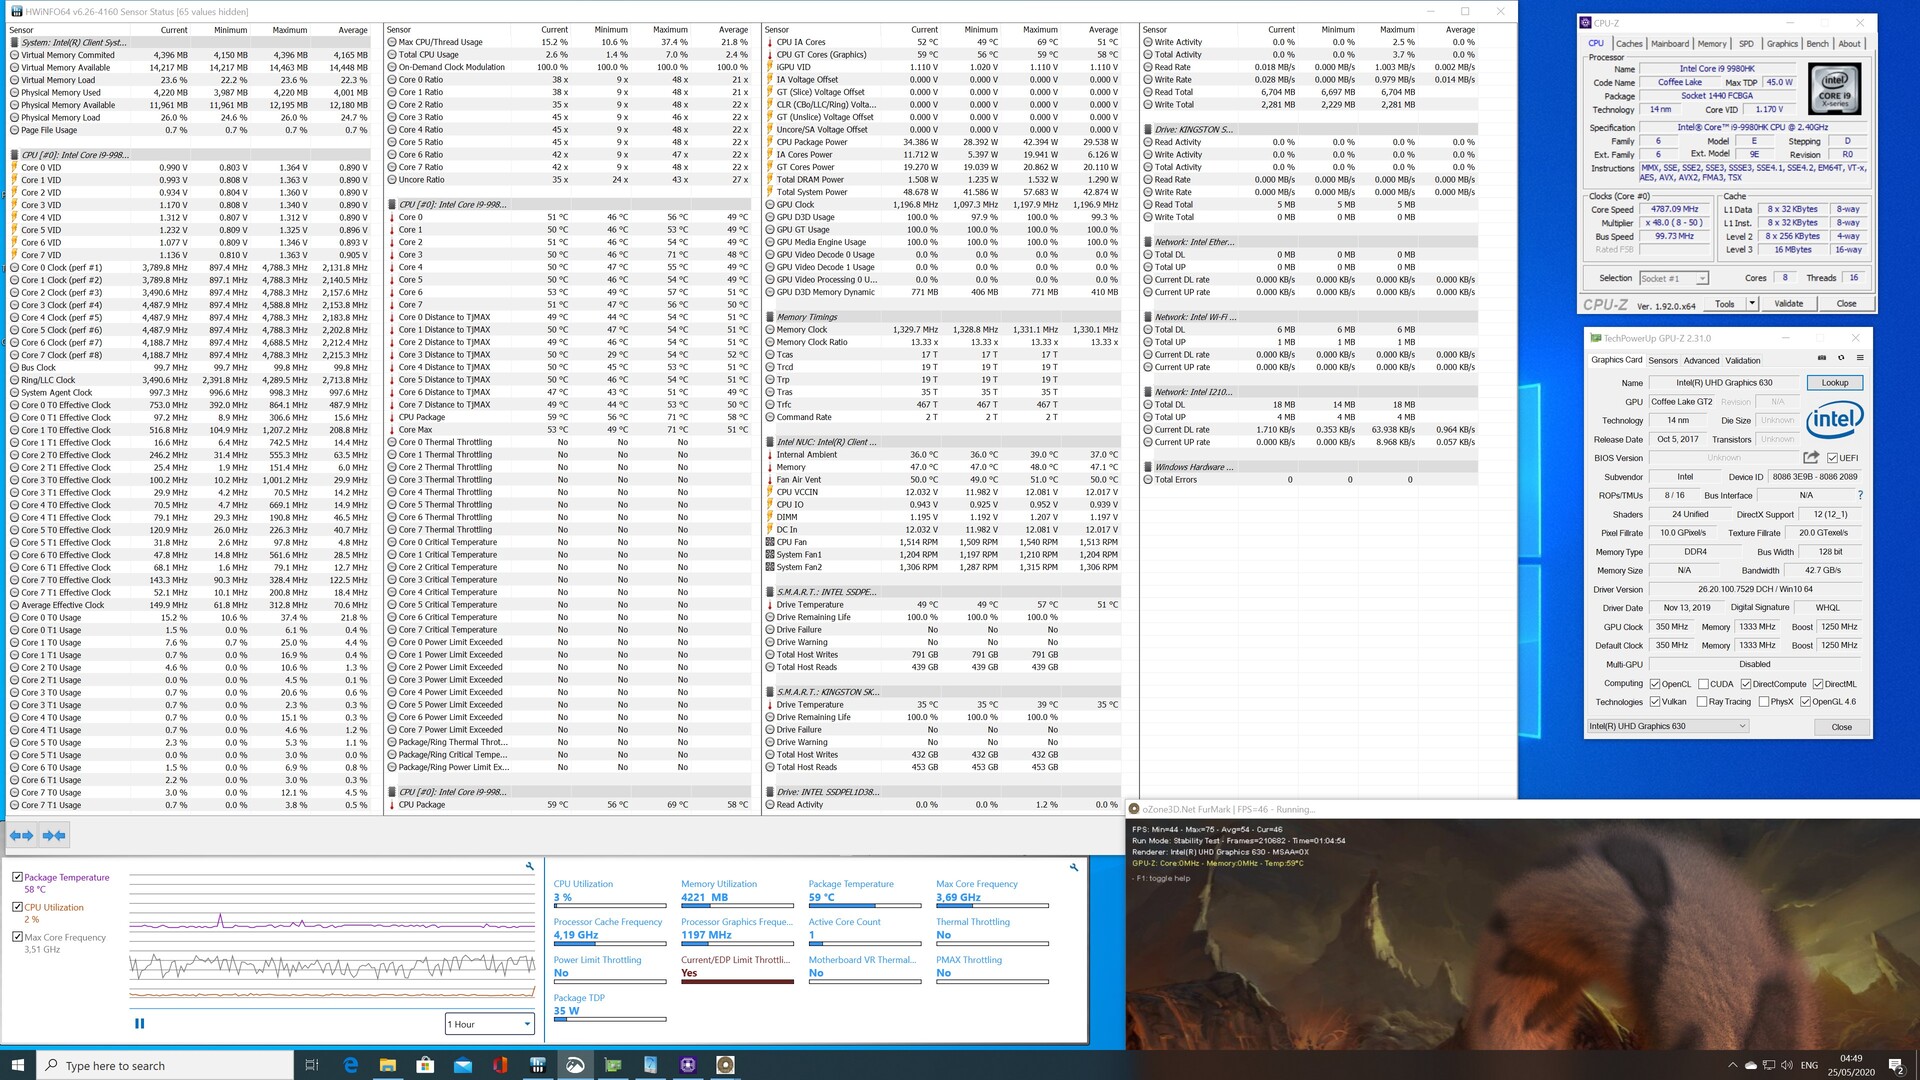
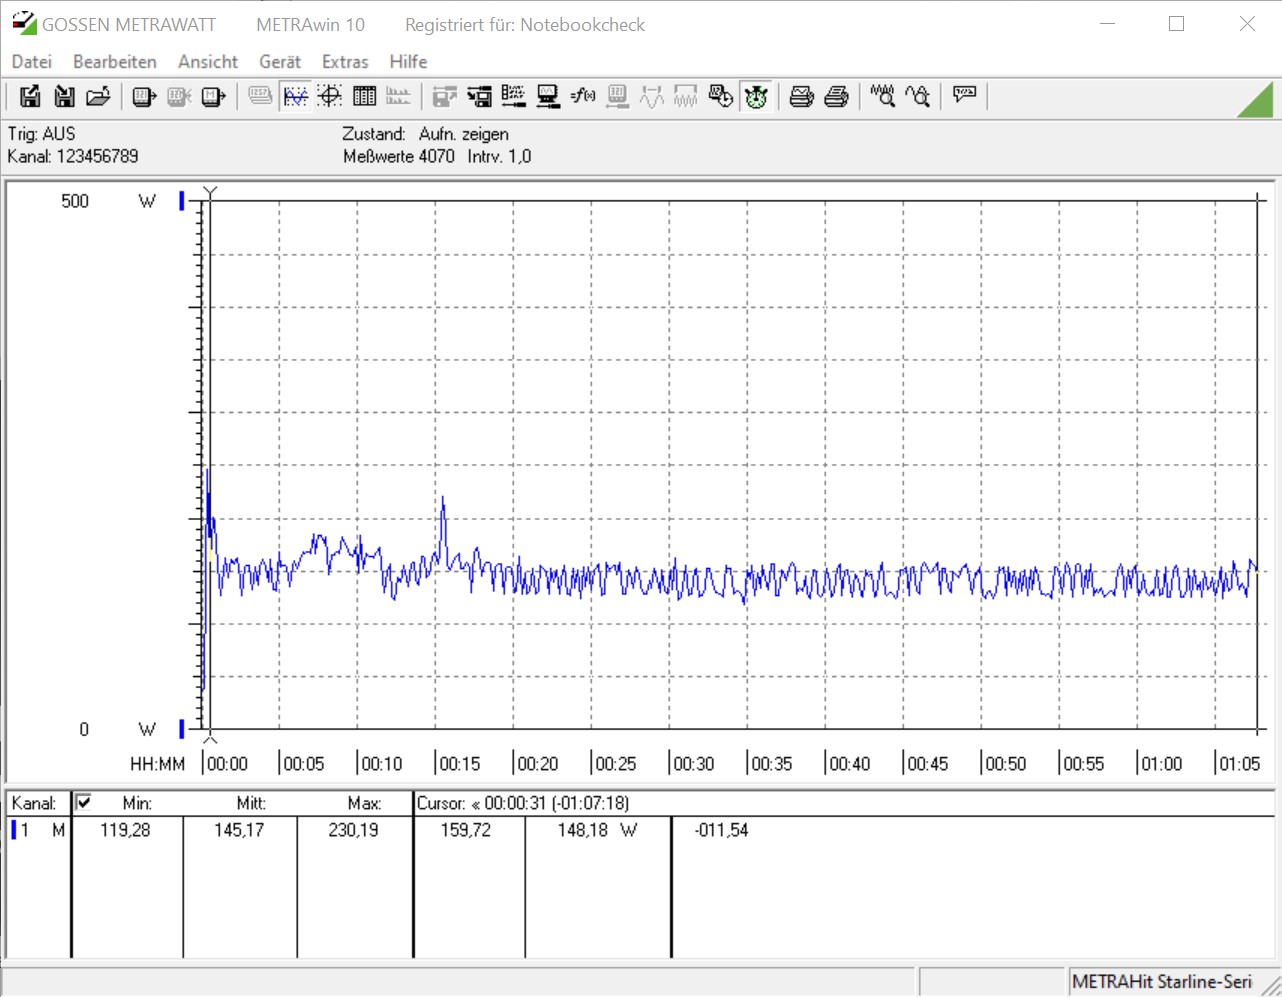
| 1920x1080 The Witcher 3 ultra (external Monitor) | |
| AMD Ryzen 9 3950X (Idle: 95 W) | |
| Intel Core i9-10900K (Idle: 52.3 W) | |
| Intel Core i5-10600K (Idle: 52.2 W) | |
| Intel Ghost Canyon NUC (RTX 2070) (Idle: 33.1 W) | |
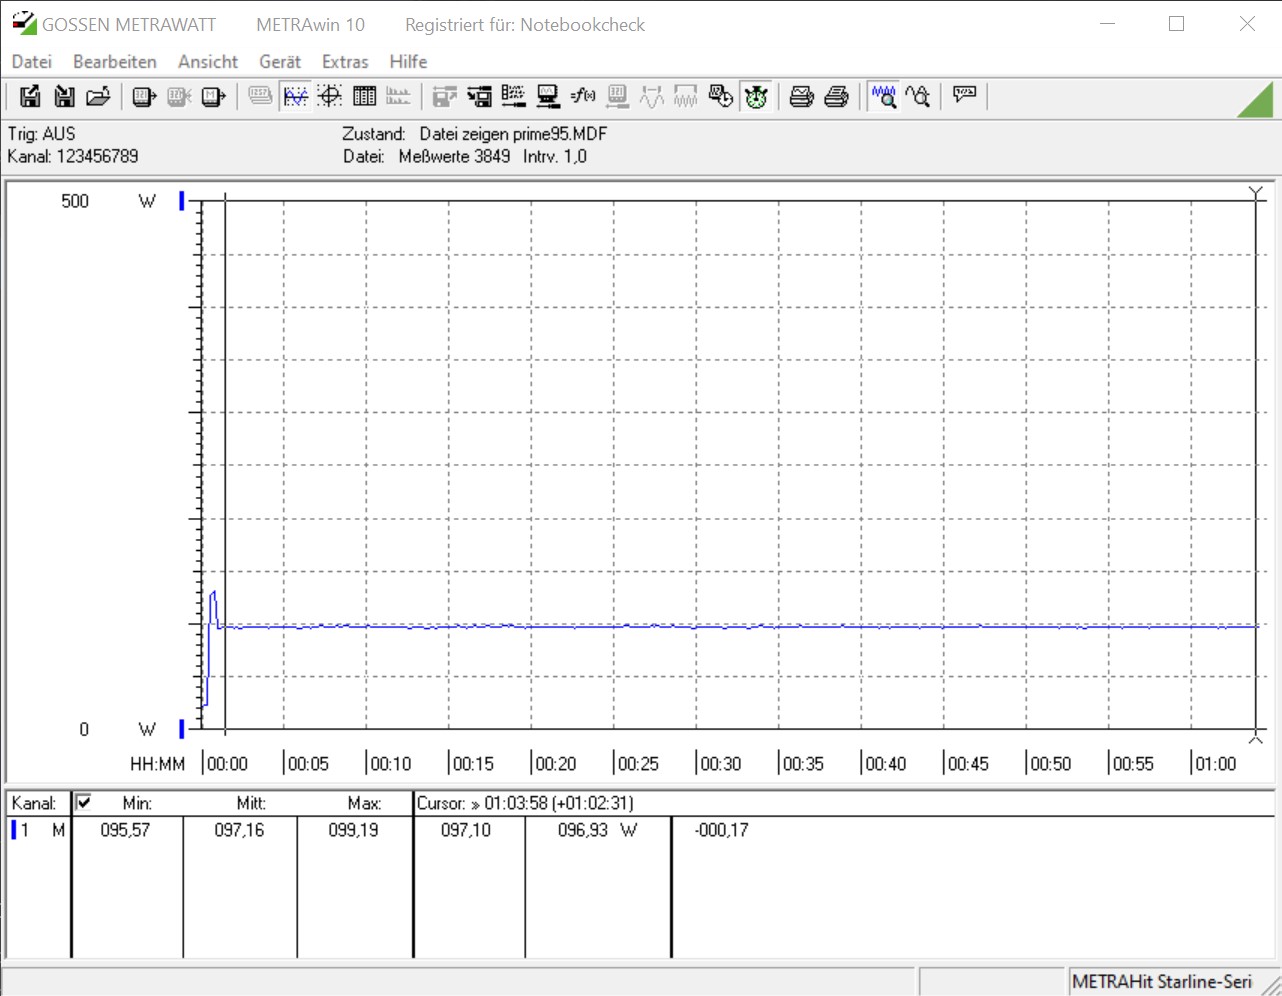
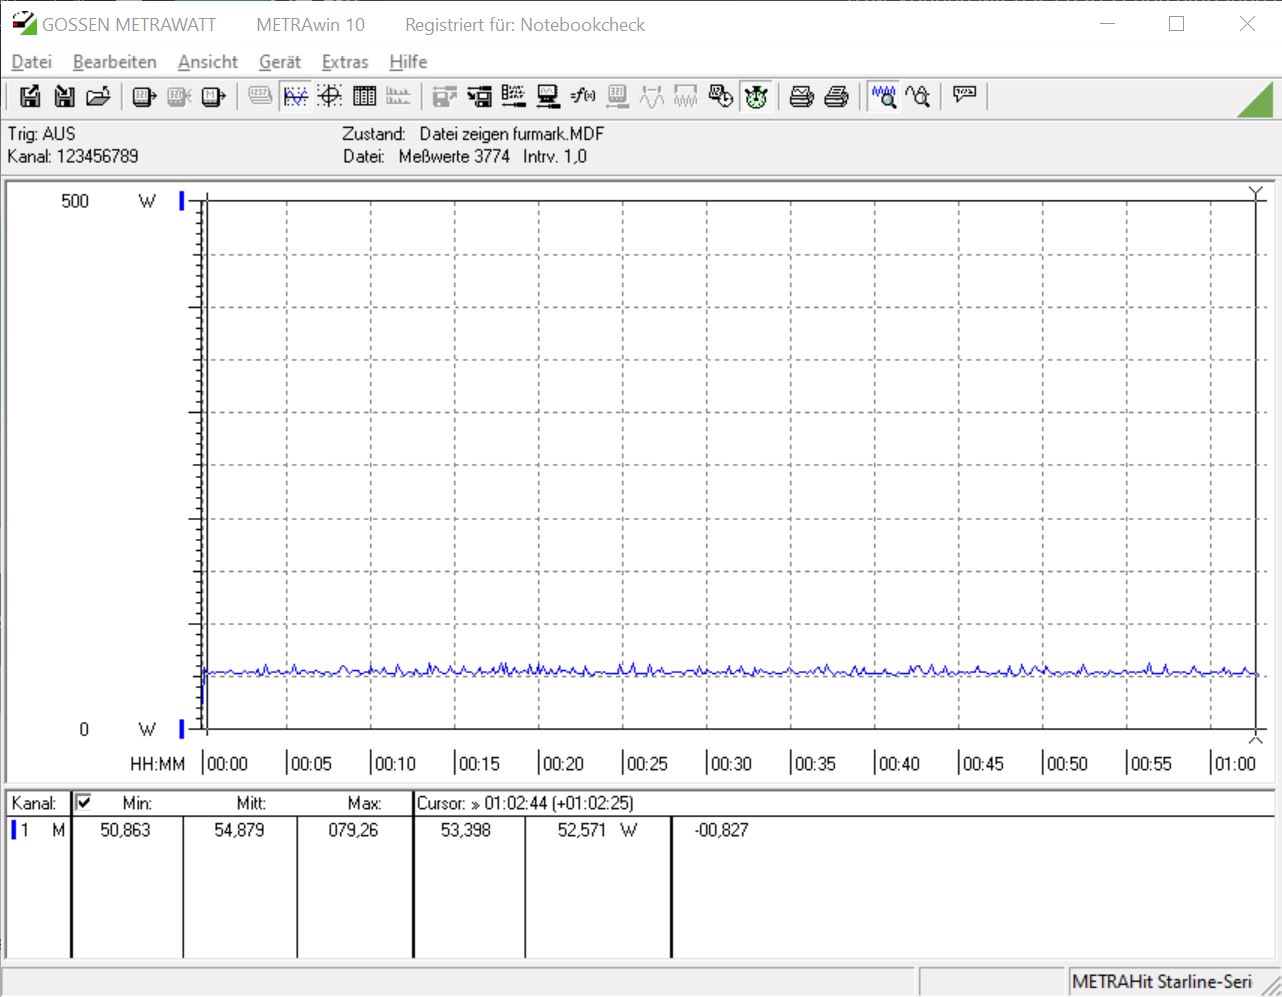
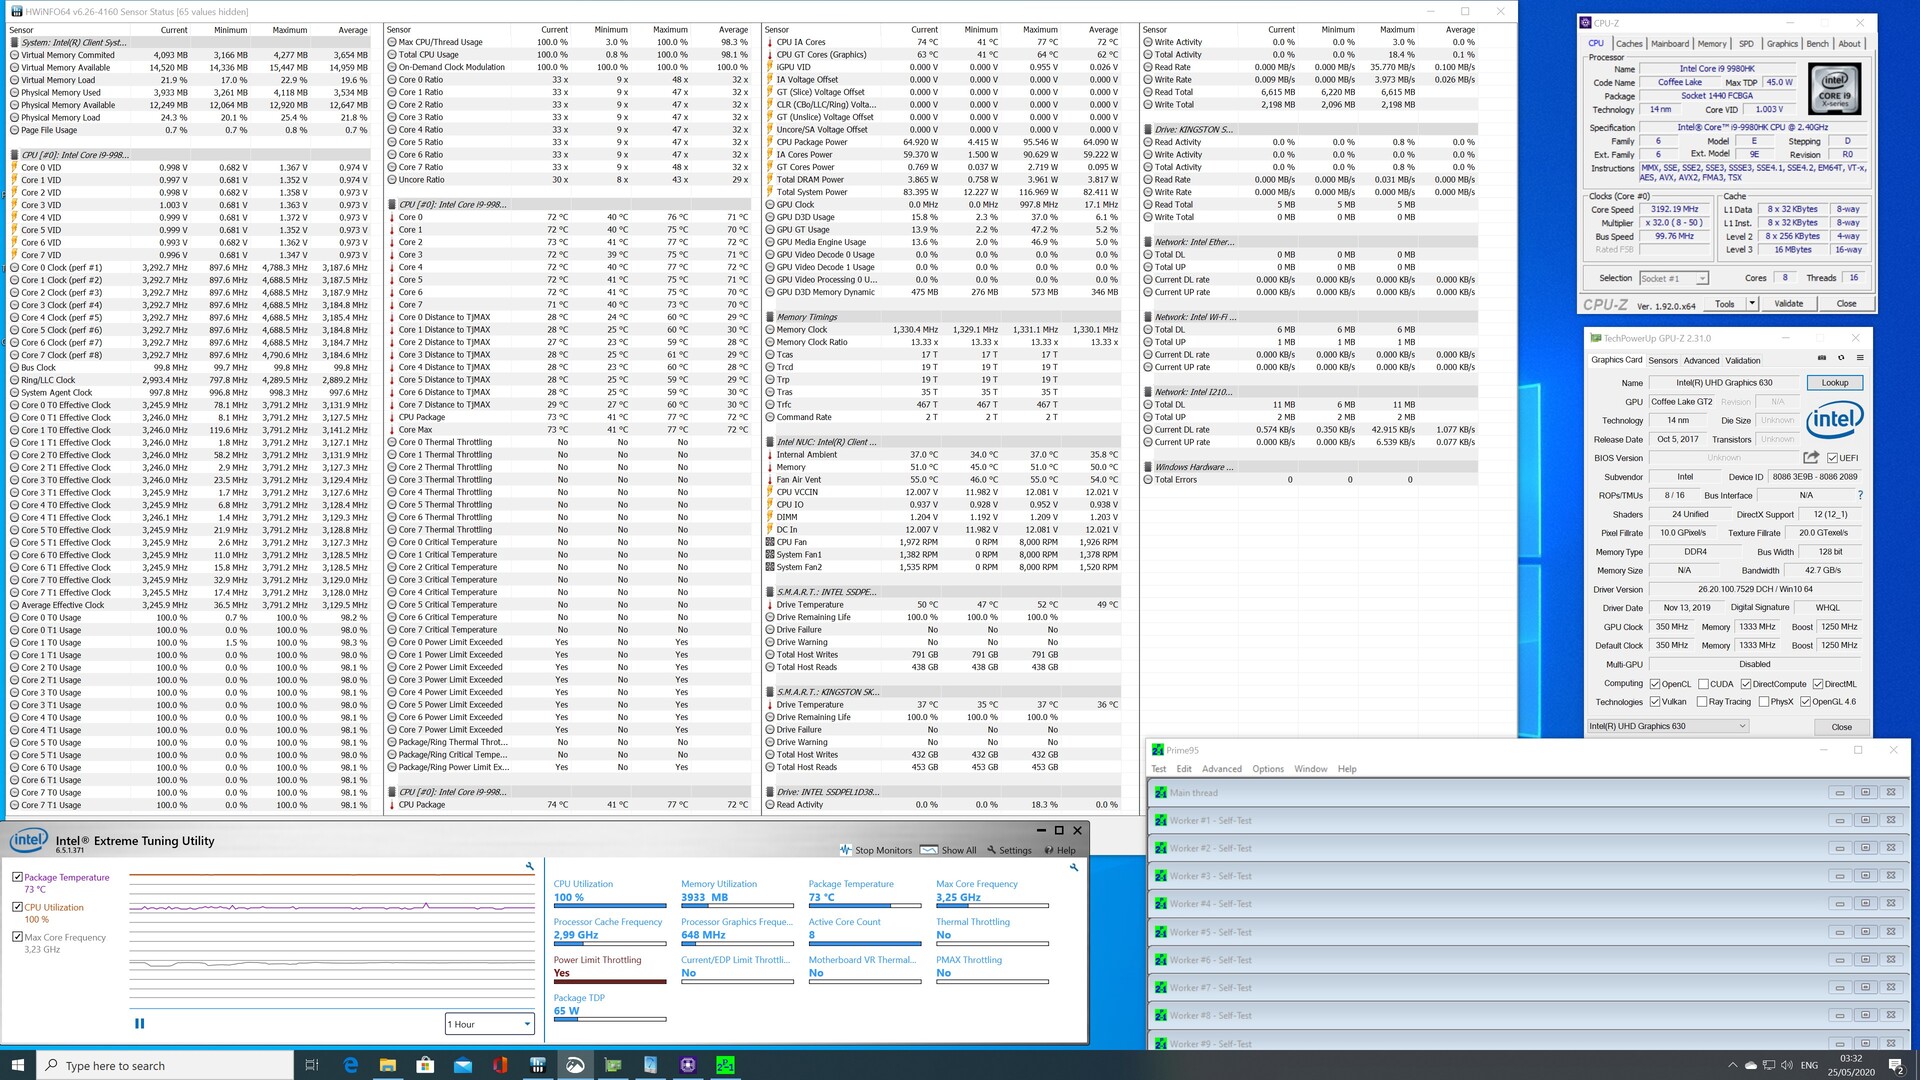
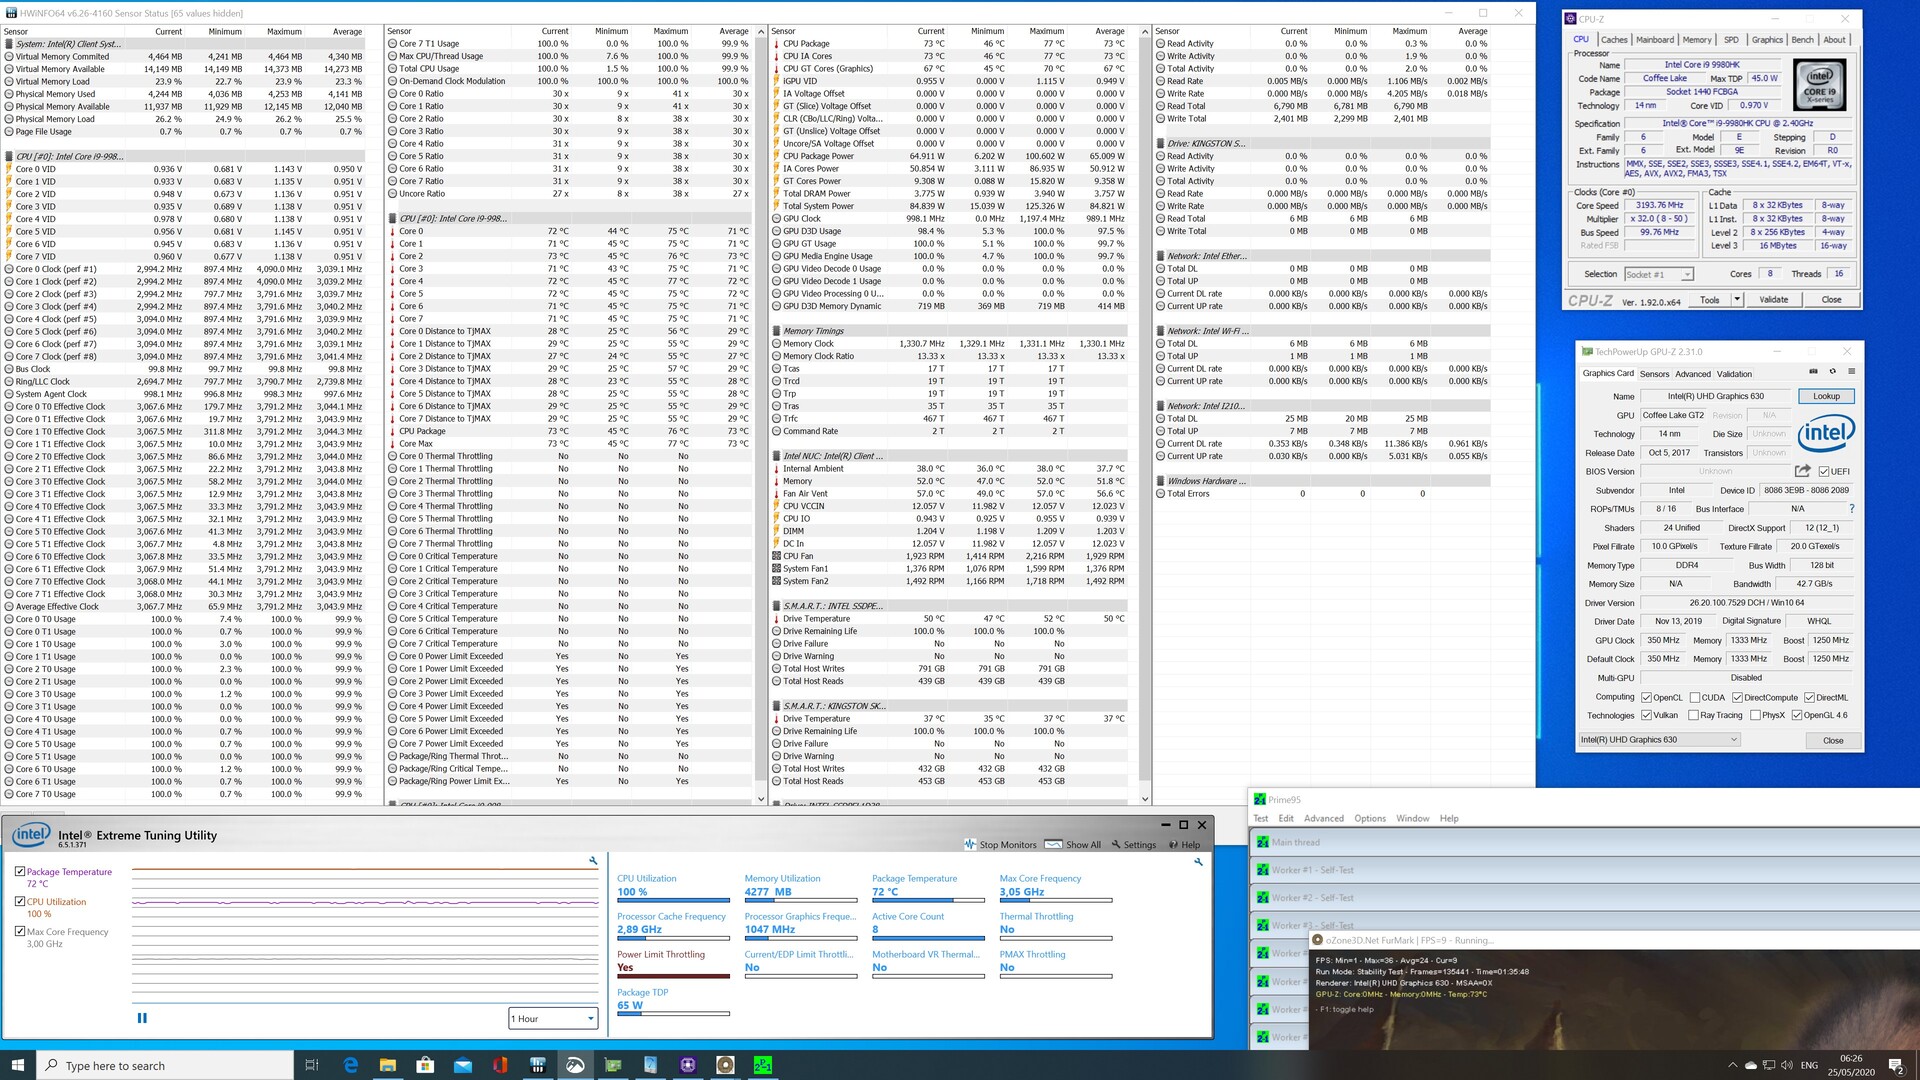
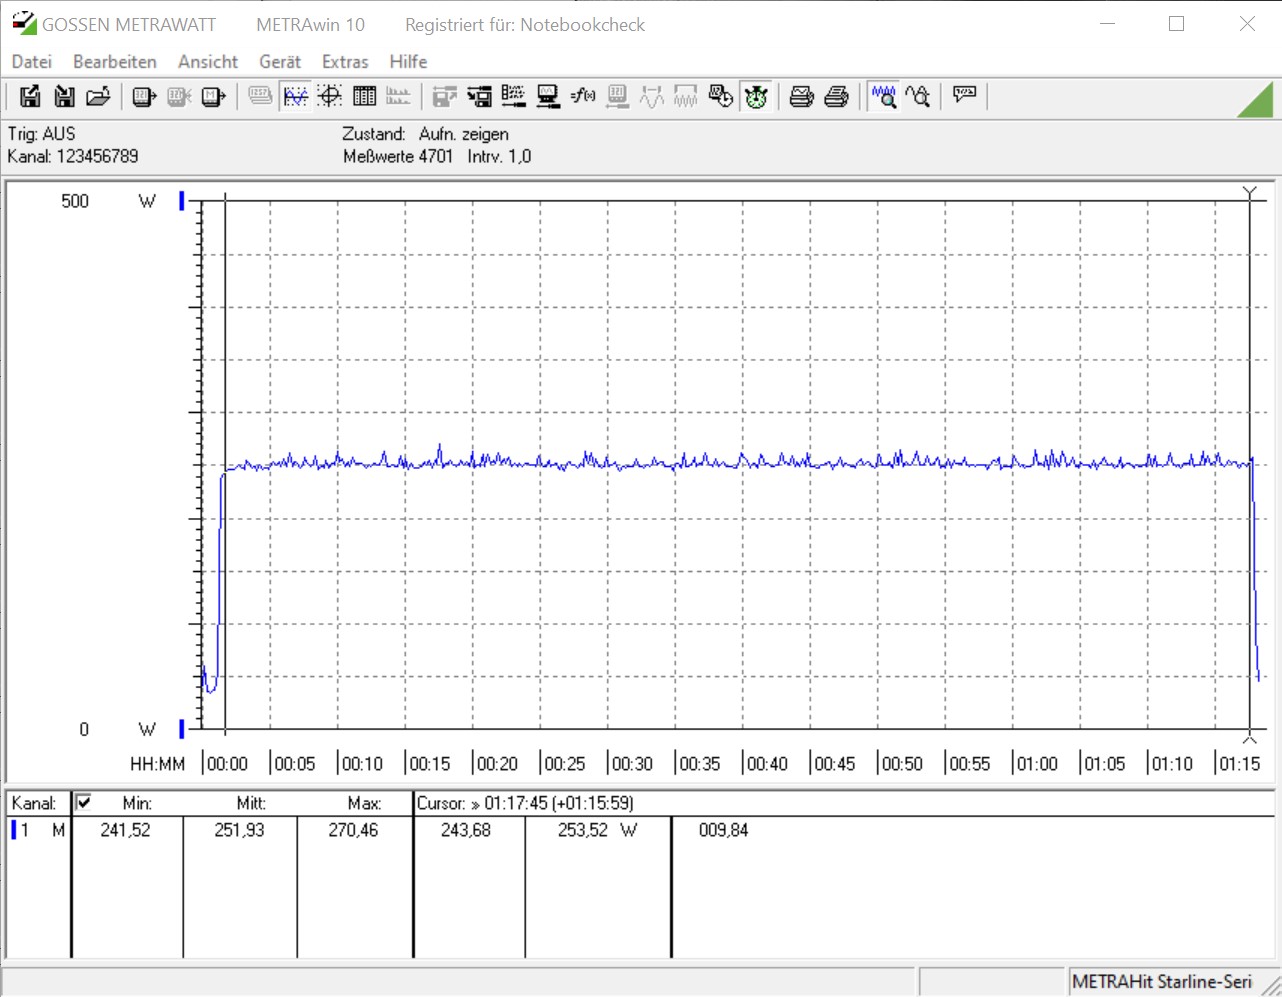
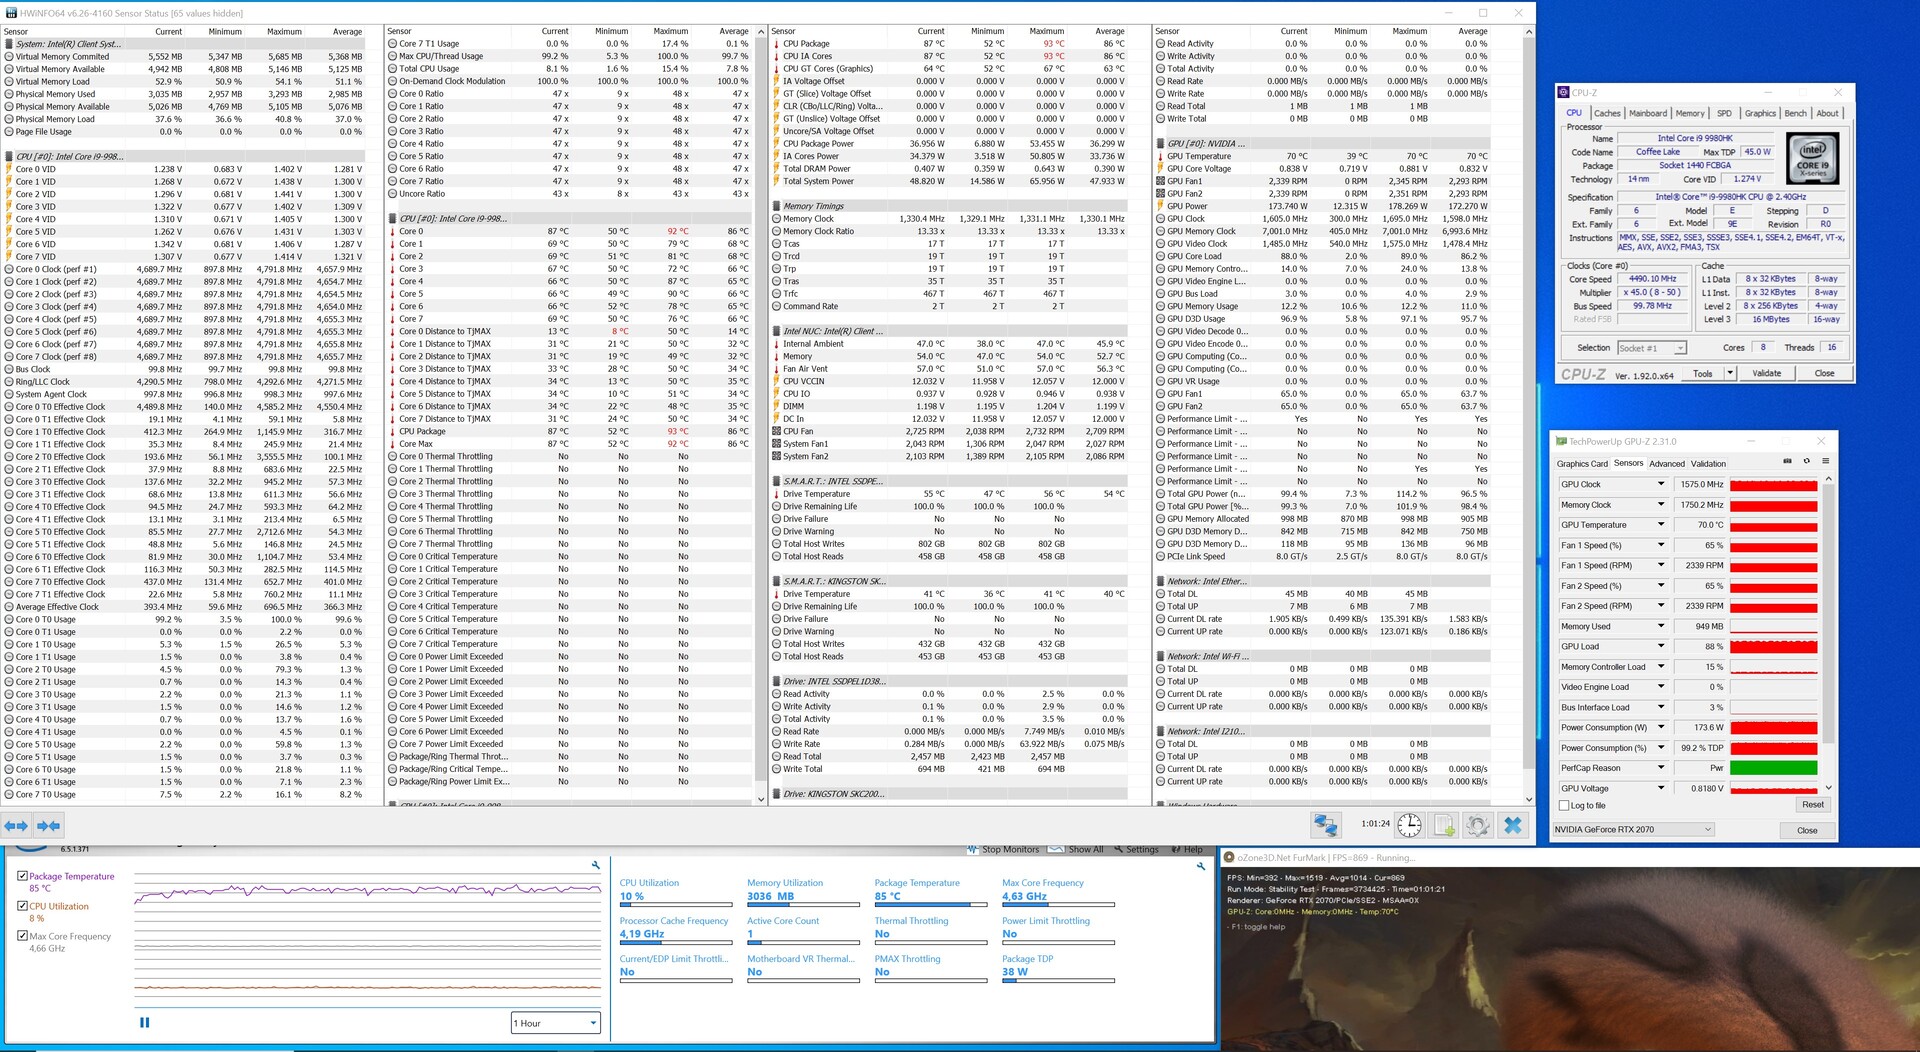
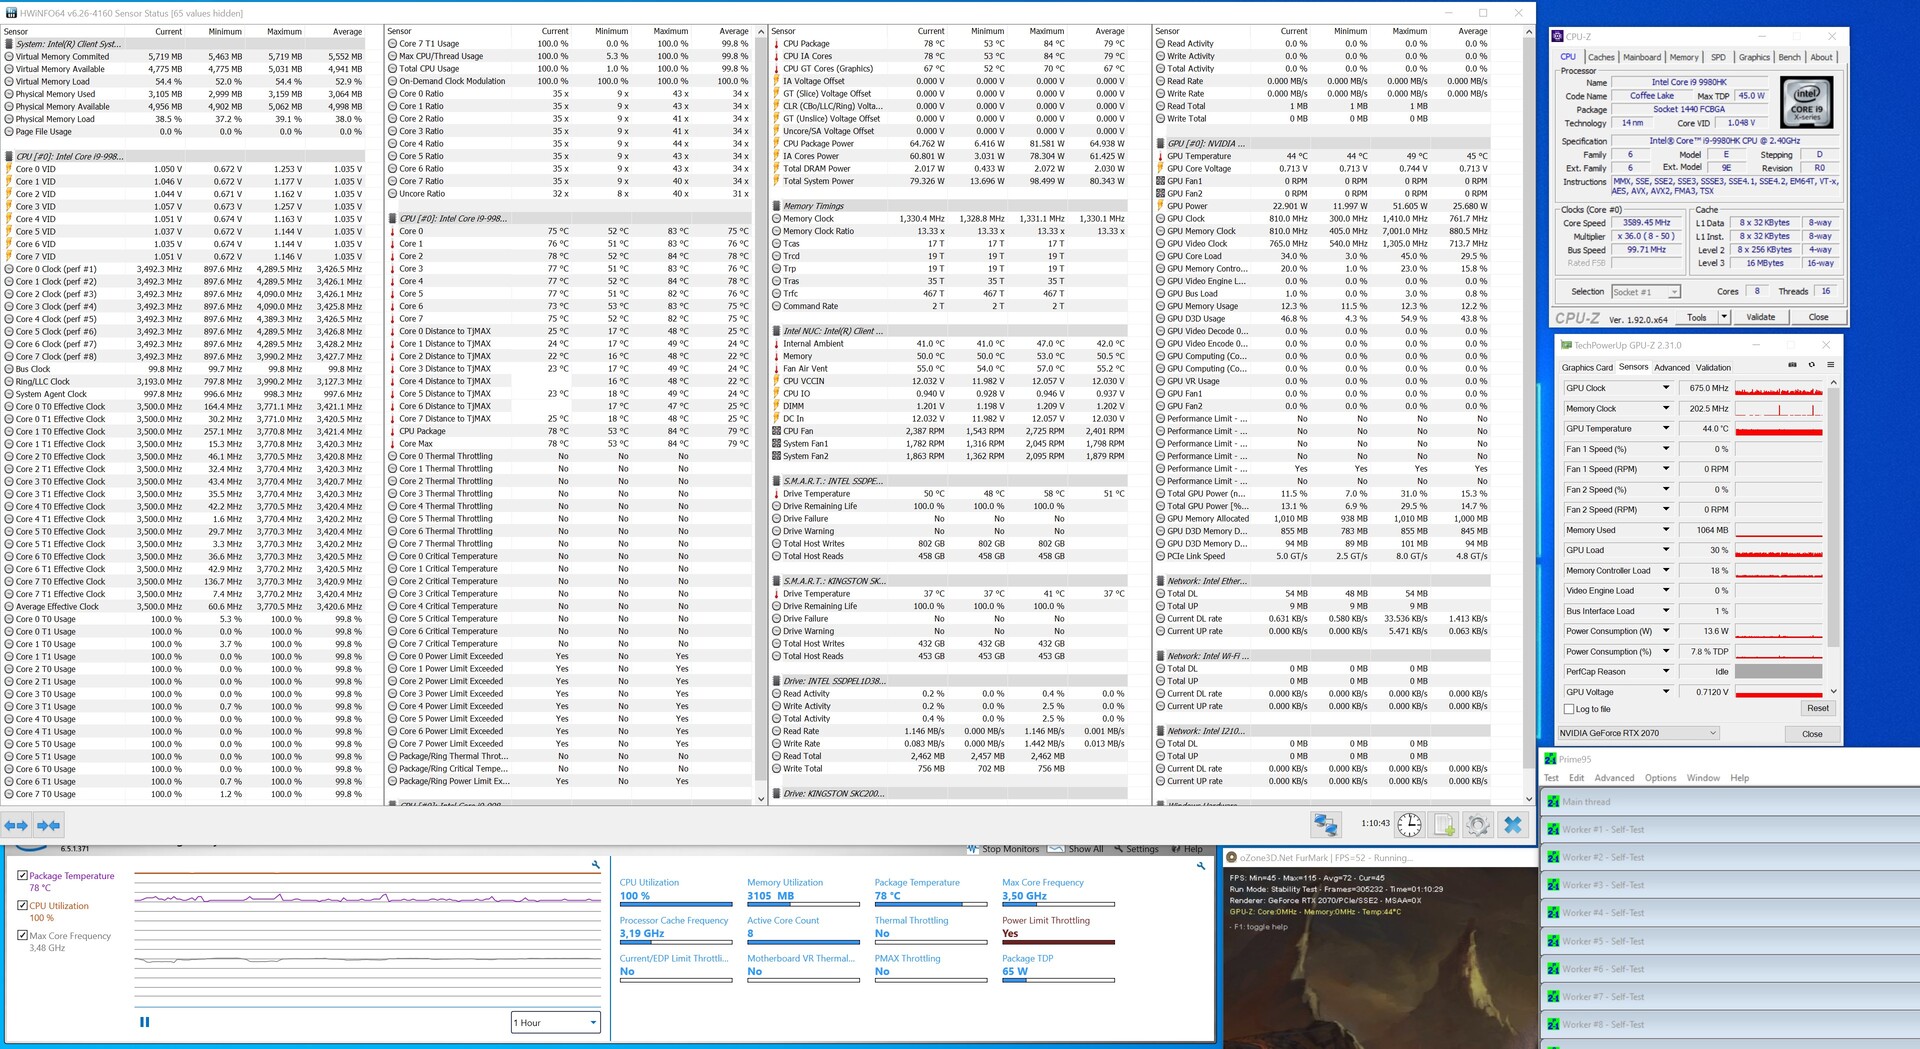
| Prime95 V2810 Stress (external Monitor) | |
| Intel Core i9-10900K (Idle: 52.3 W) | |
| Intel Core i5-10600K (Idle: 52.2 W) | |
| AMD Ryzen 9 3950X (Idle: 95 W) | |
| Intel Ghost Canyon NUC (RTX 2070) (Idle: 33.1 W) | |
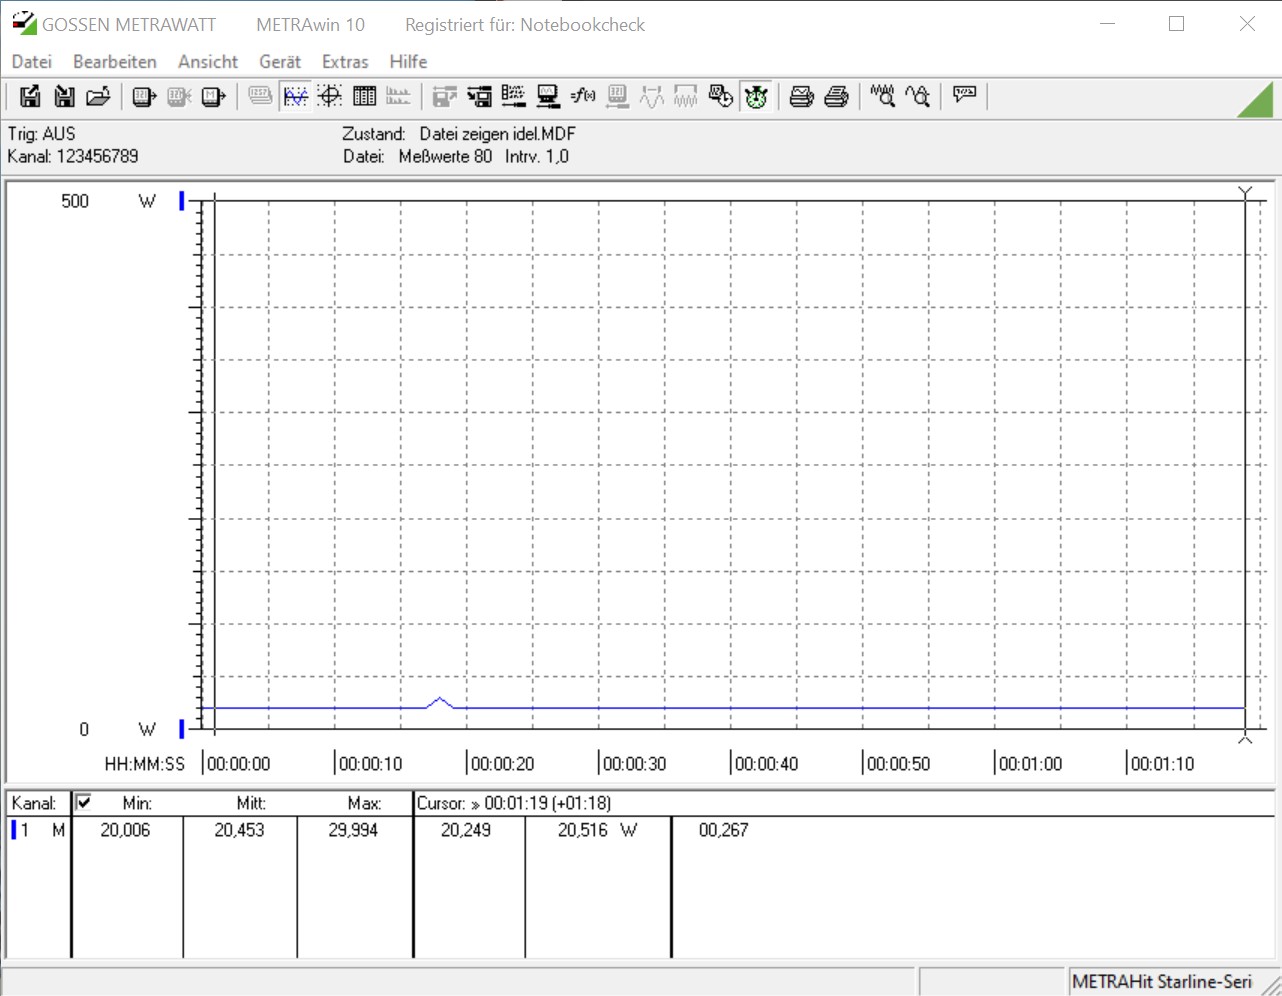
| Intel Ghost Canyon NUC (Idle: 20.45 W) | |
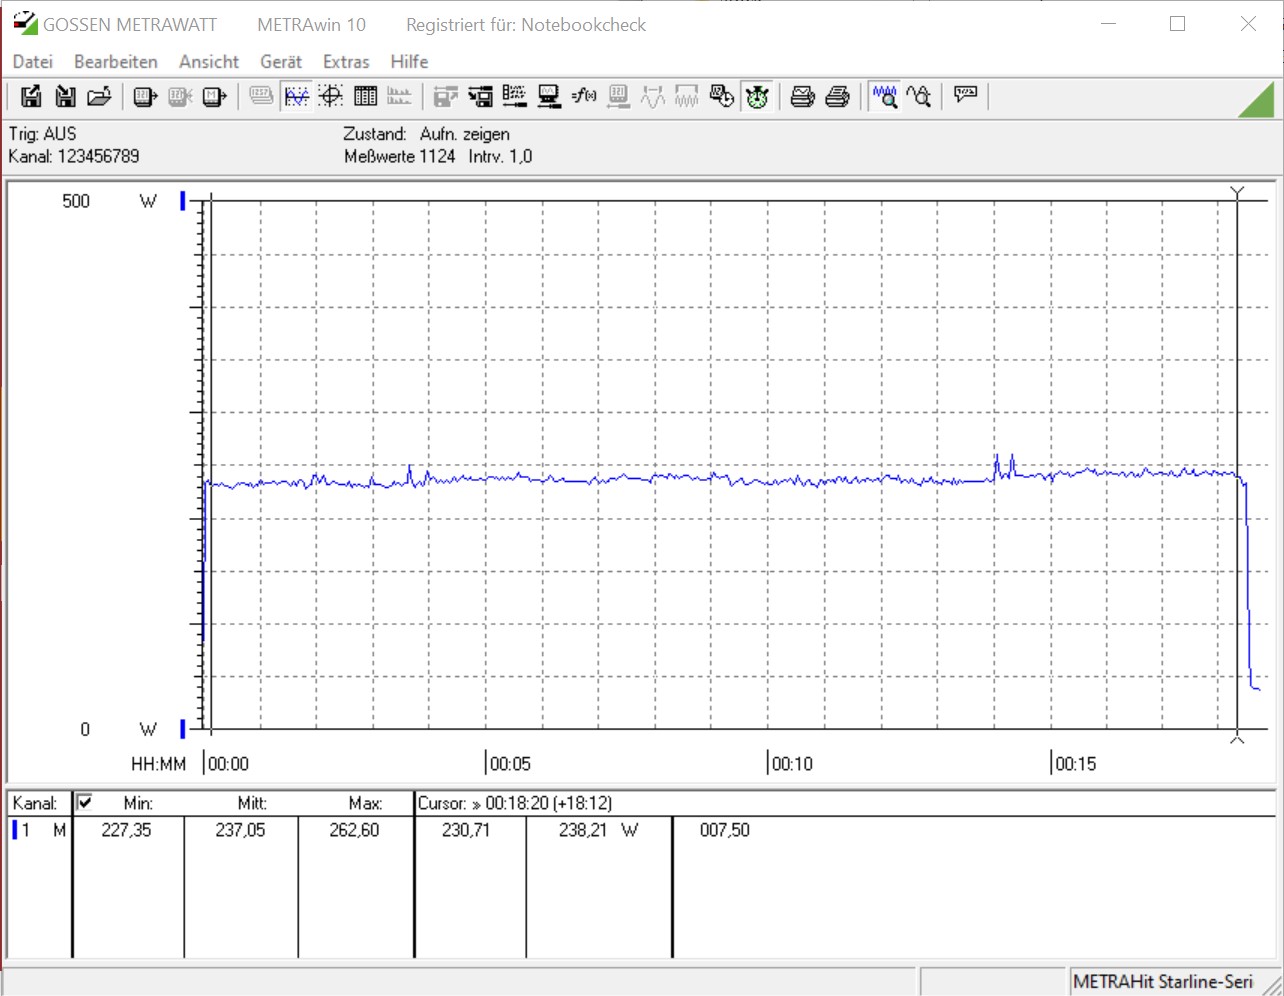
| Cinebench R15 Multi (external Monitor) | |
| Intel Core i9-10900K (Idle: 52.3 W) | |
| AMD Ryzen 9 3950X (Idle: 95 W) | |
| Intel Core i5-10600K (Idle: 52.2 W) | |
| Intel Ghost Canyon NUC (Idle: 20.45 W) | |
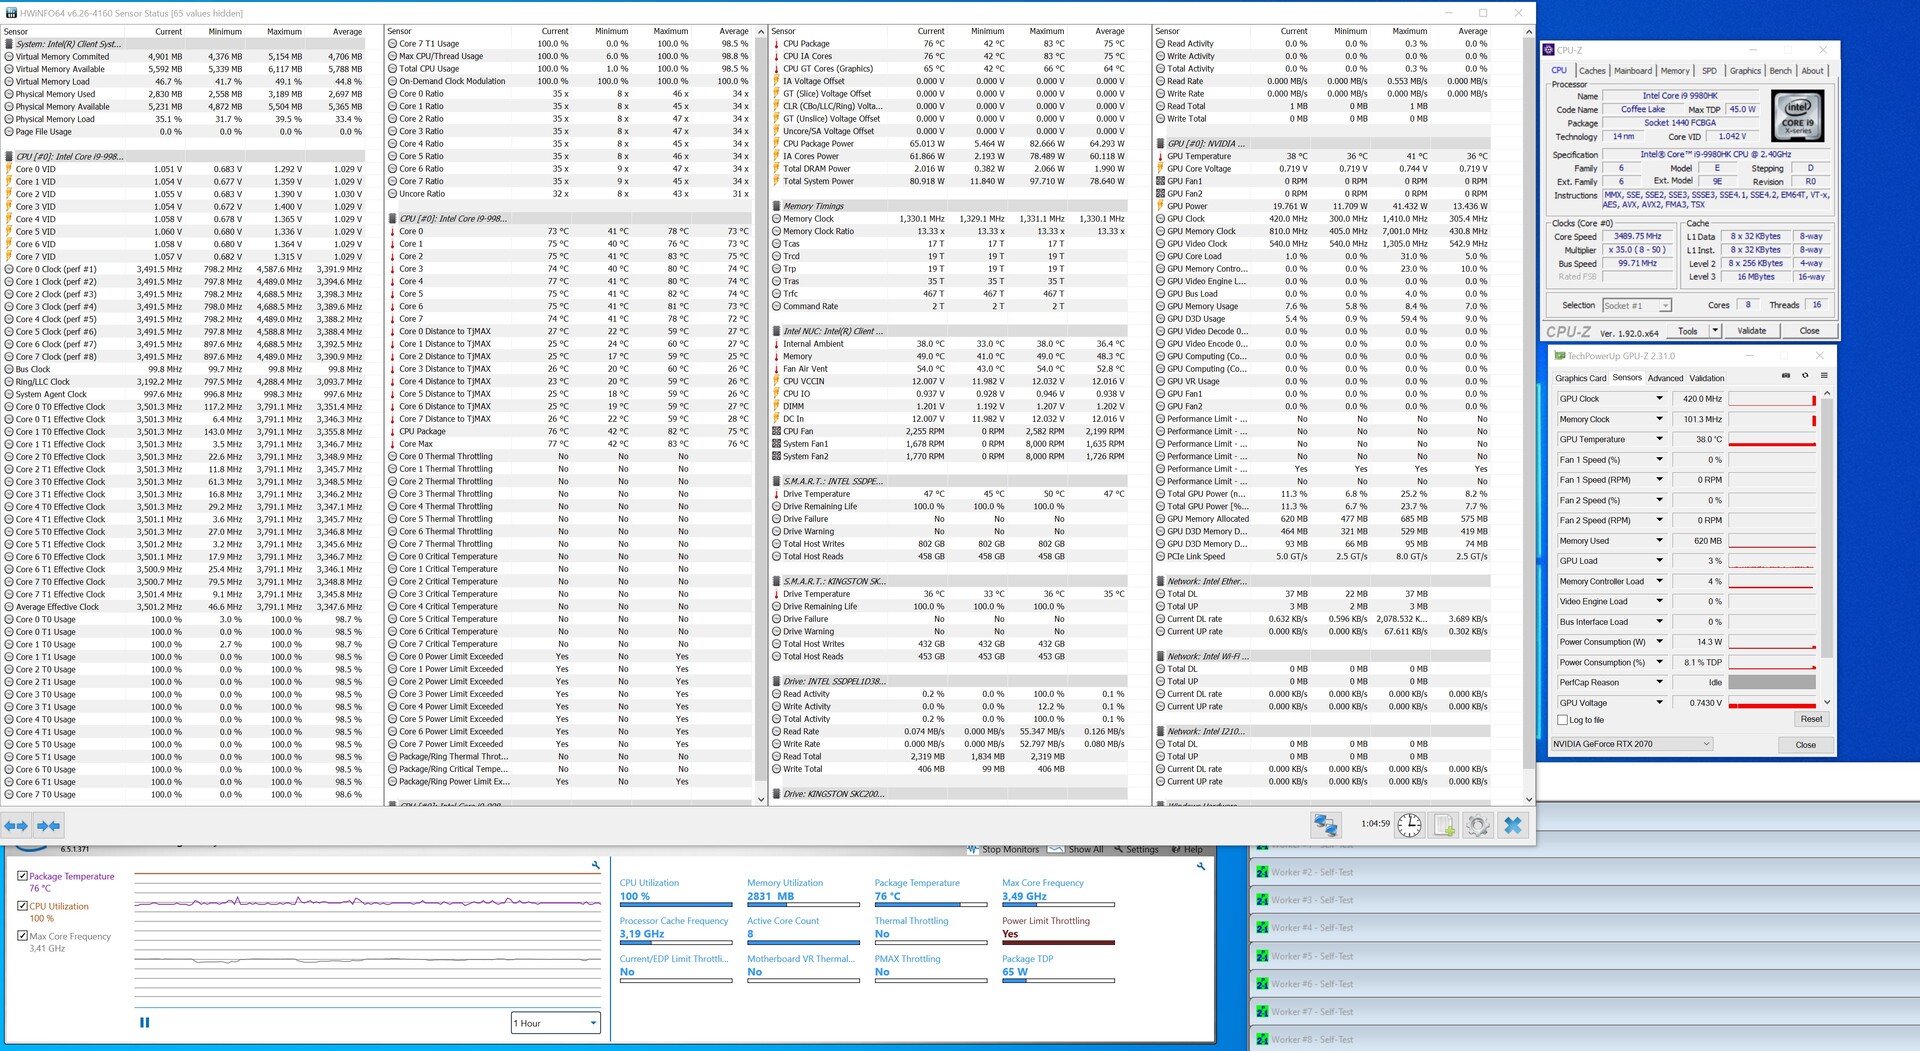
| Temperatures - CPU Temperature Prime95 | |
| Intel Core i9-10900K | |
| AMD Ryzen 9 3950X | |
| Intel Ghost Canyon NUC | |
| Intel Core i5-10600K | |
* ... mindre är bättre
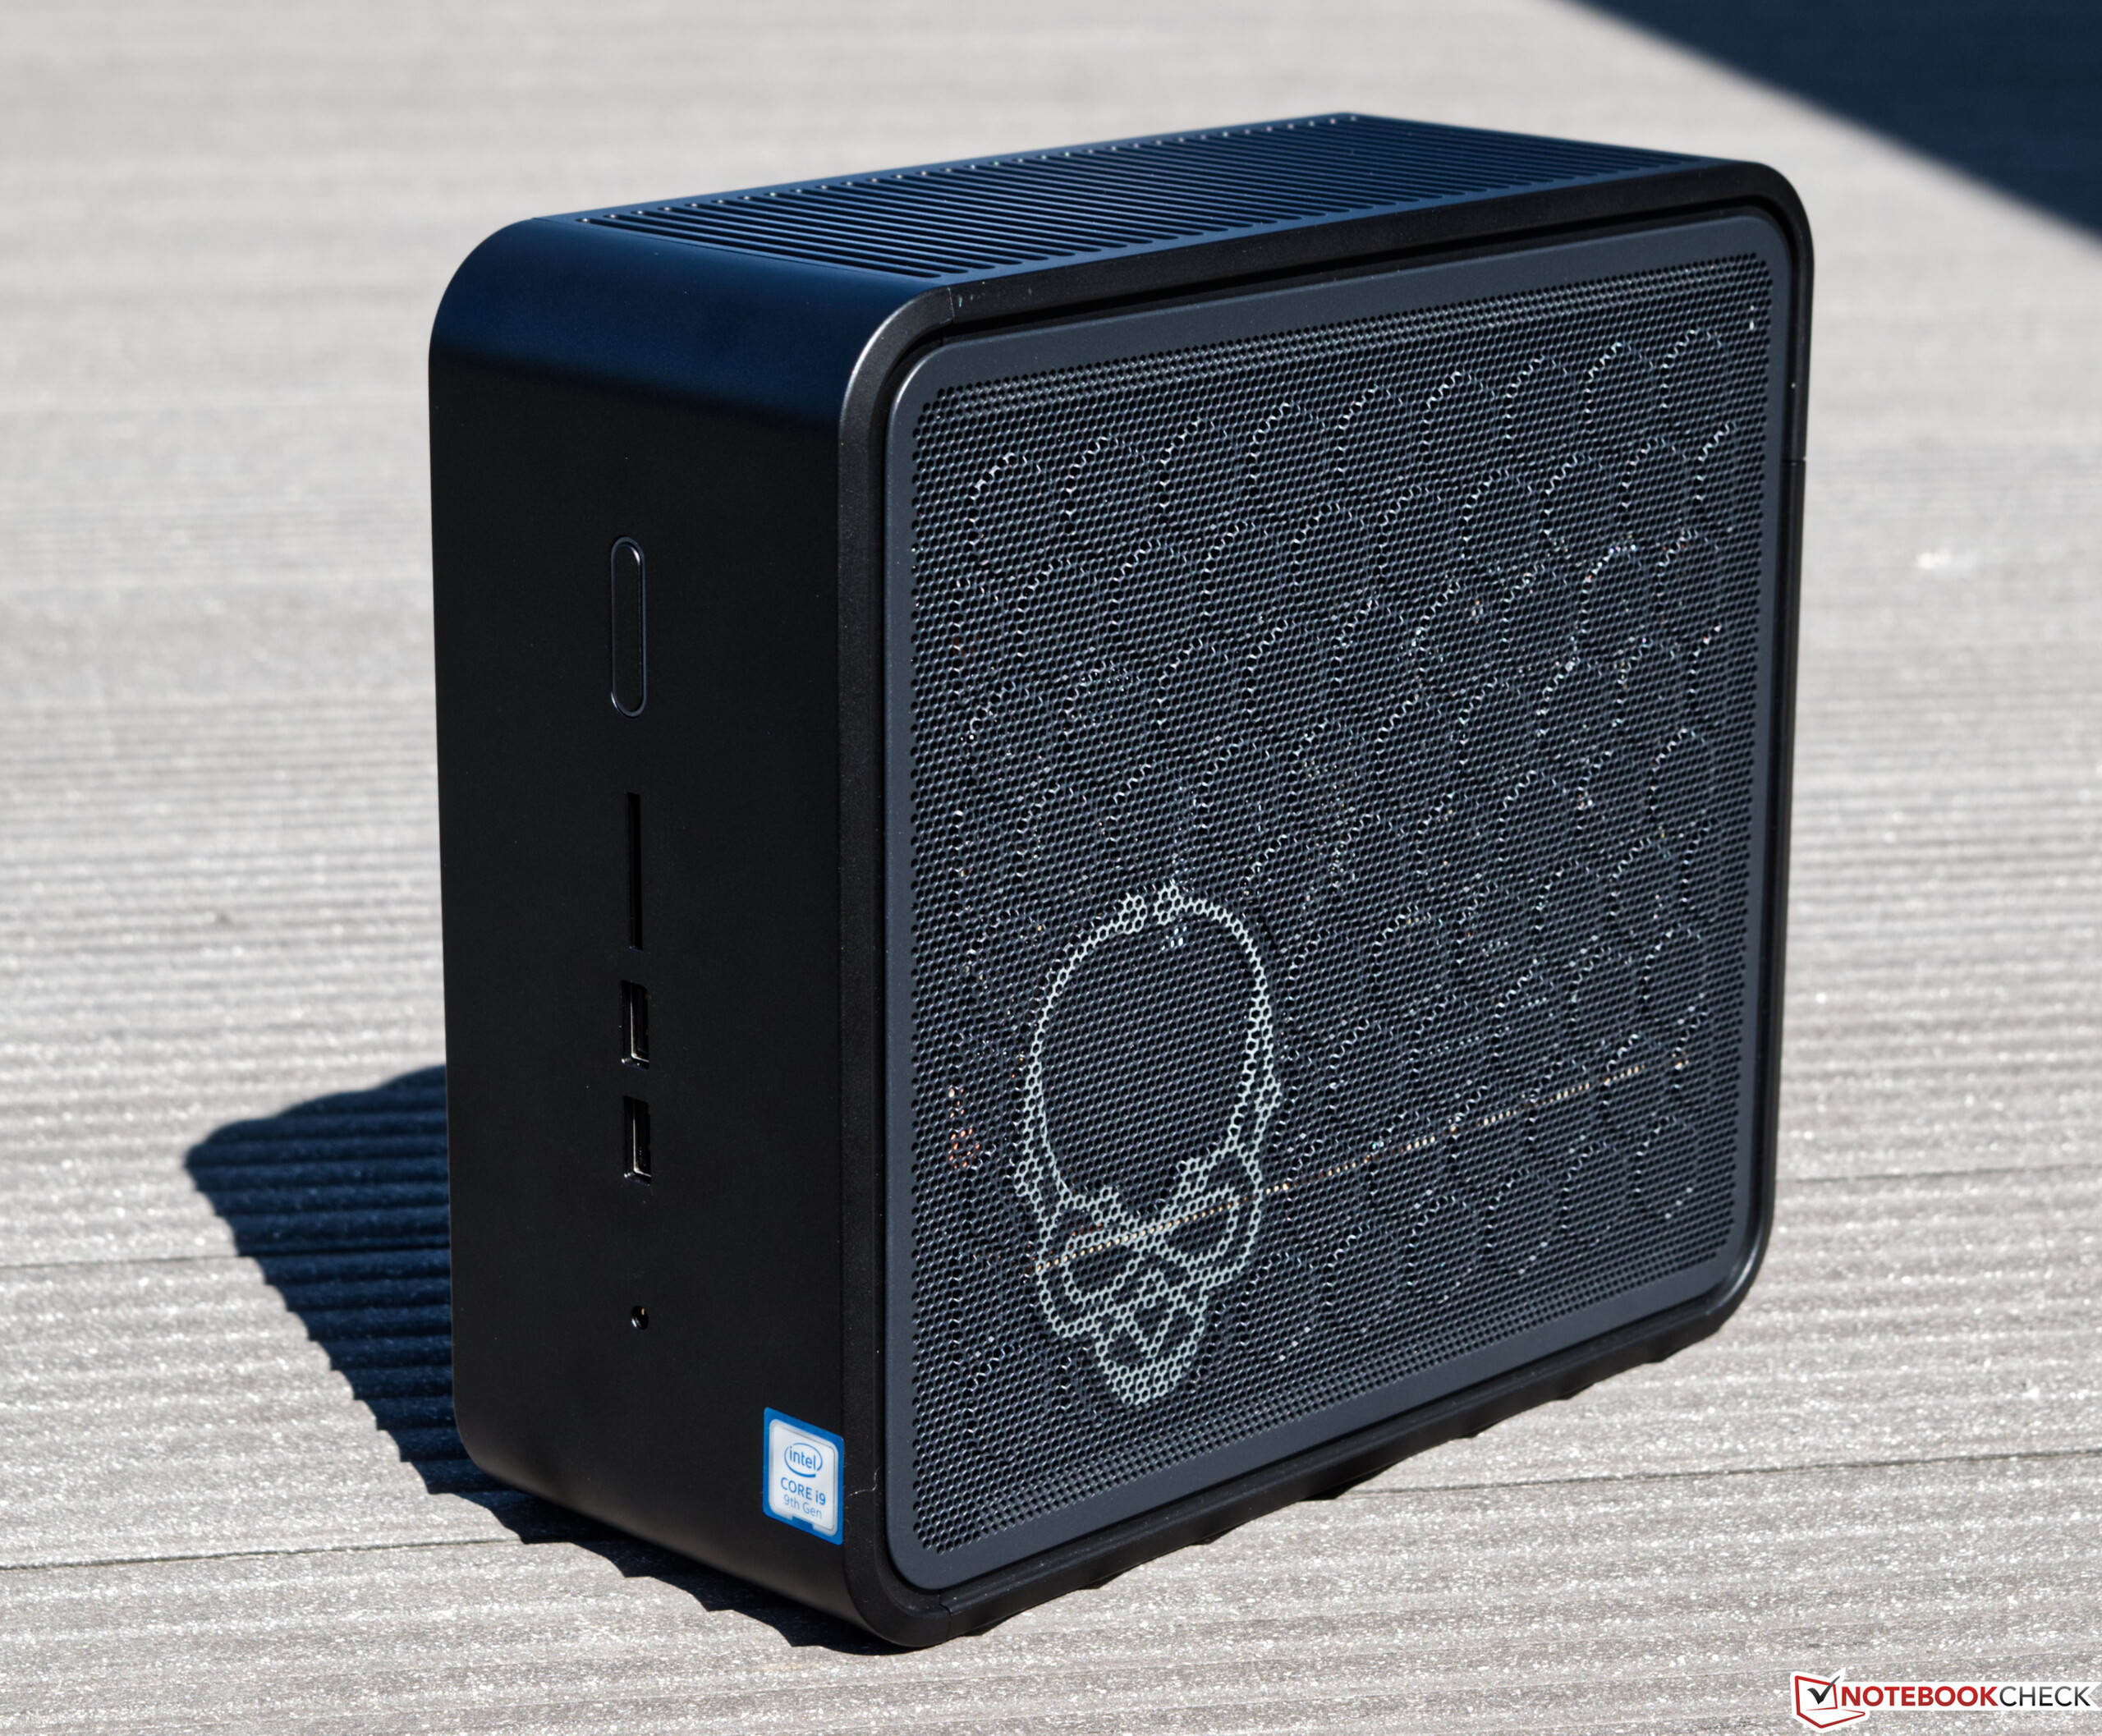
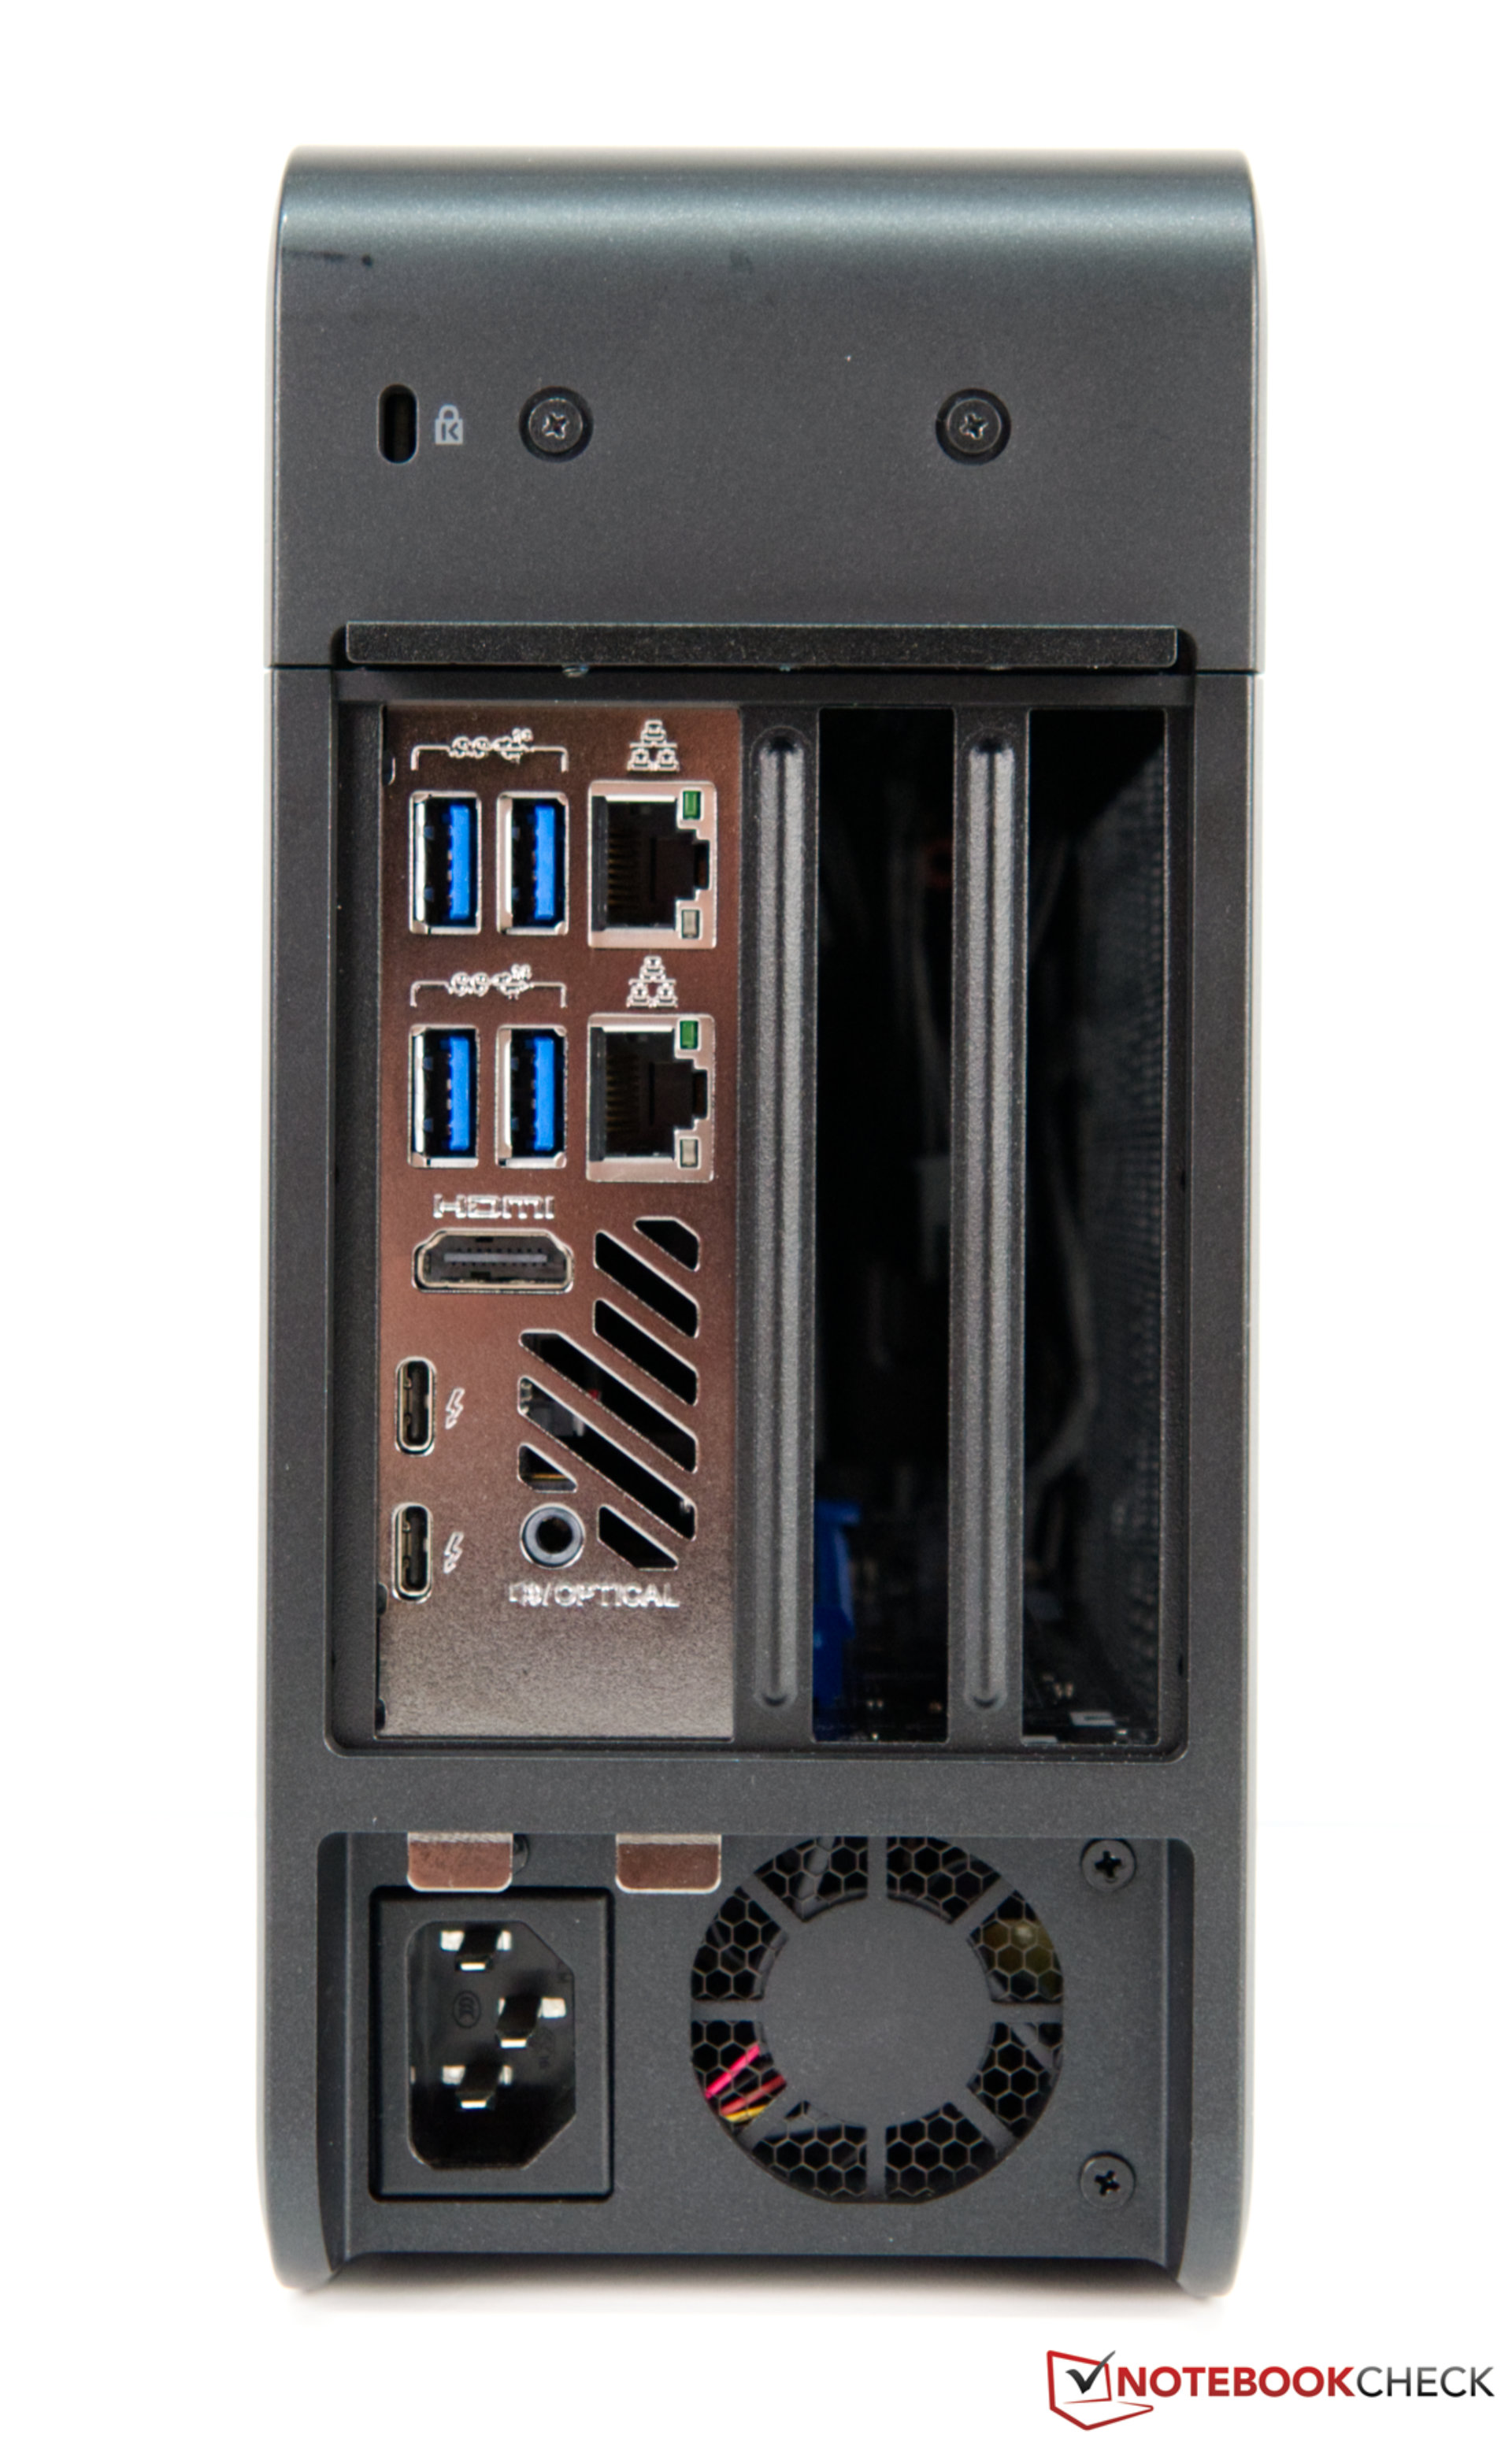
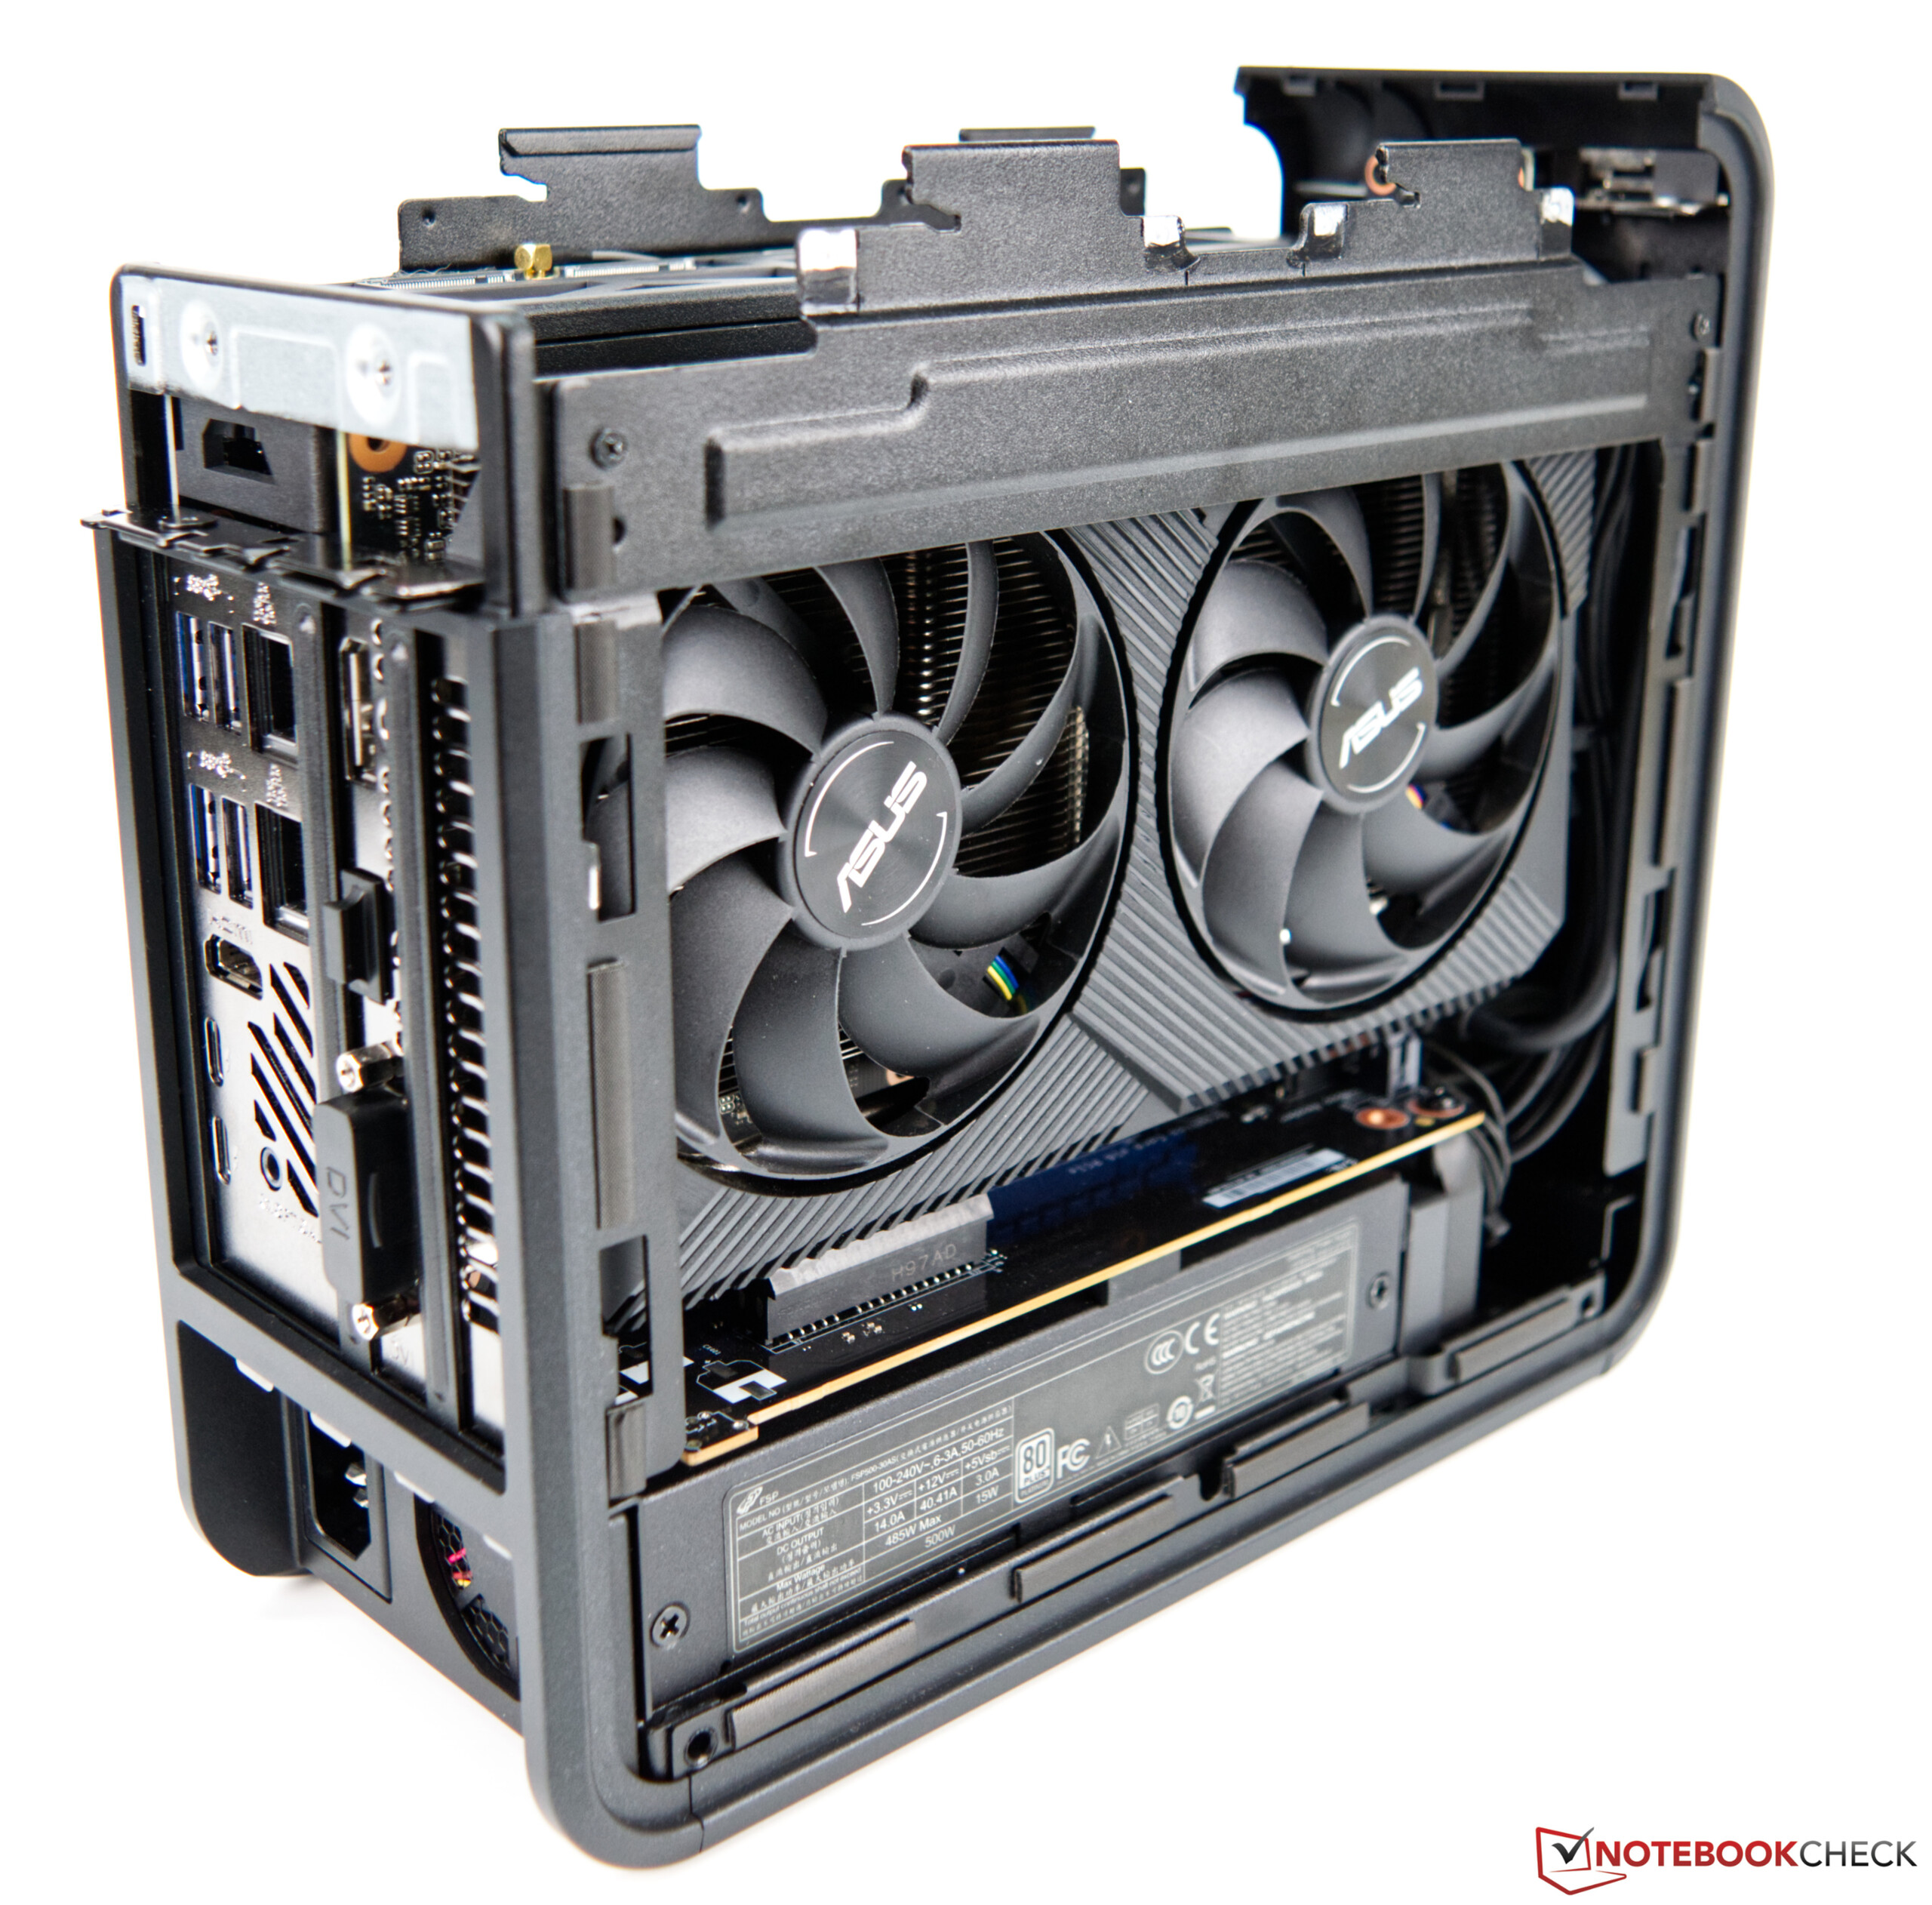
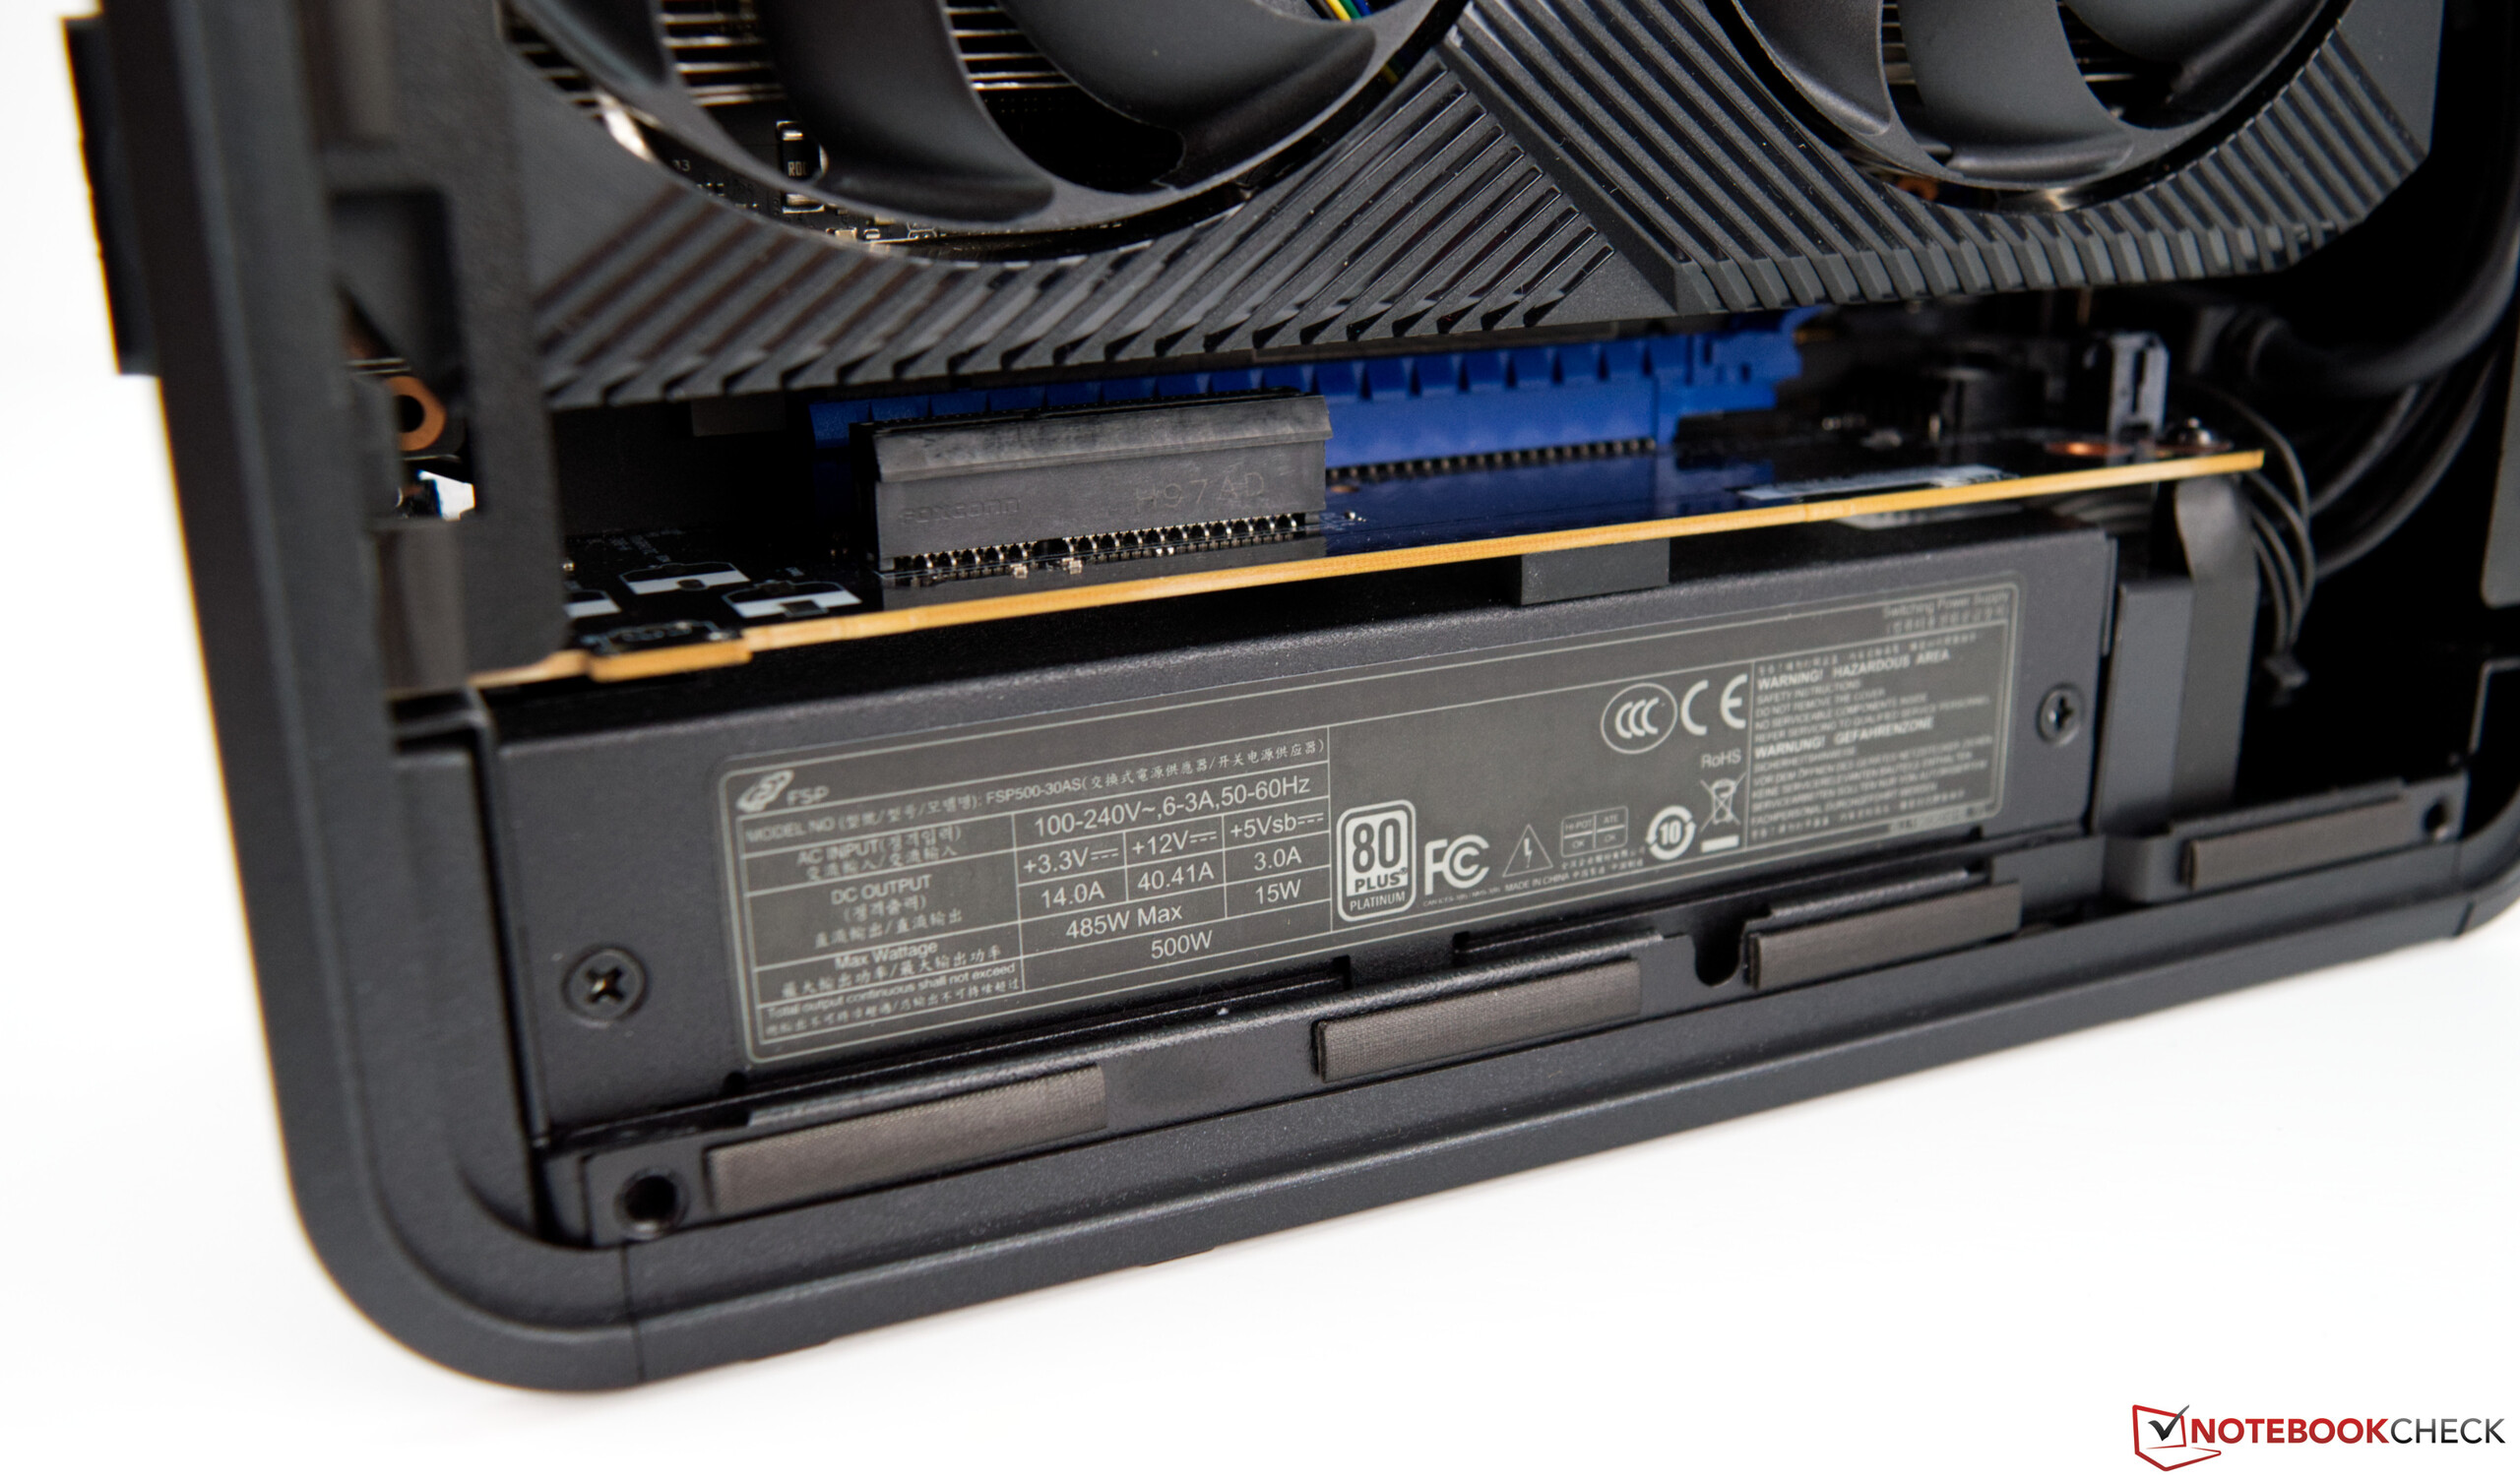
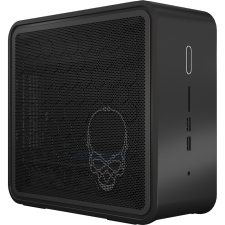
Intel NUC 9 Extreme Kit utan RTX 2070
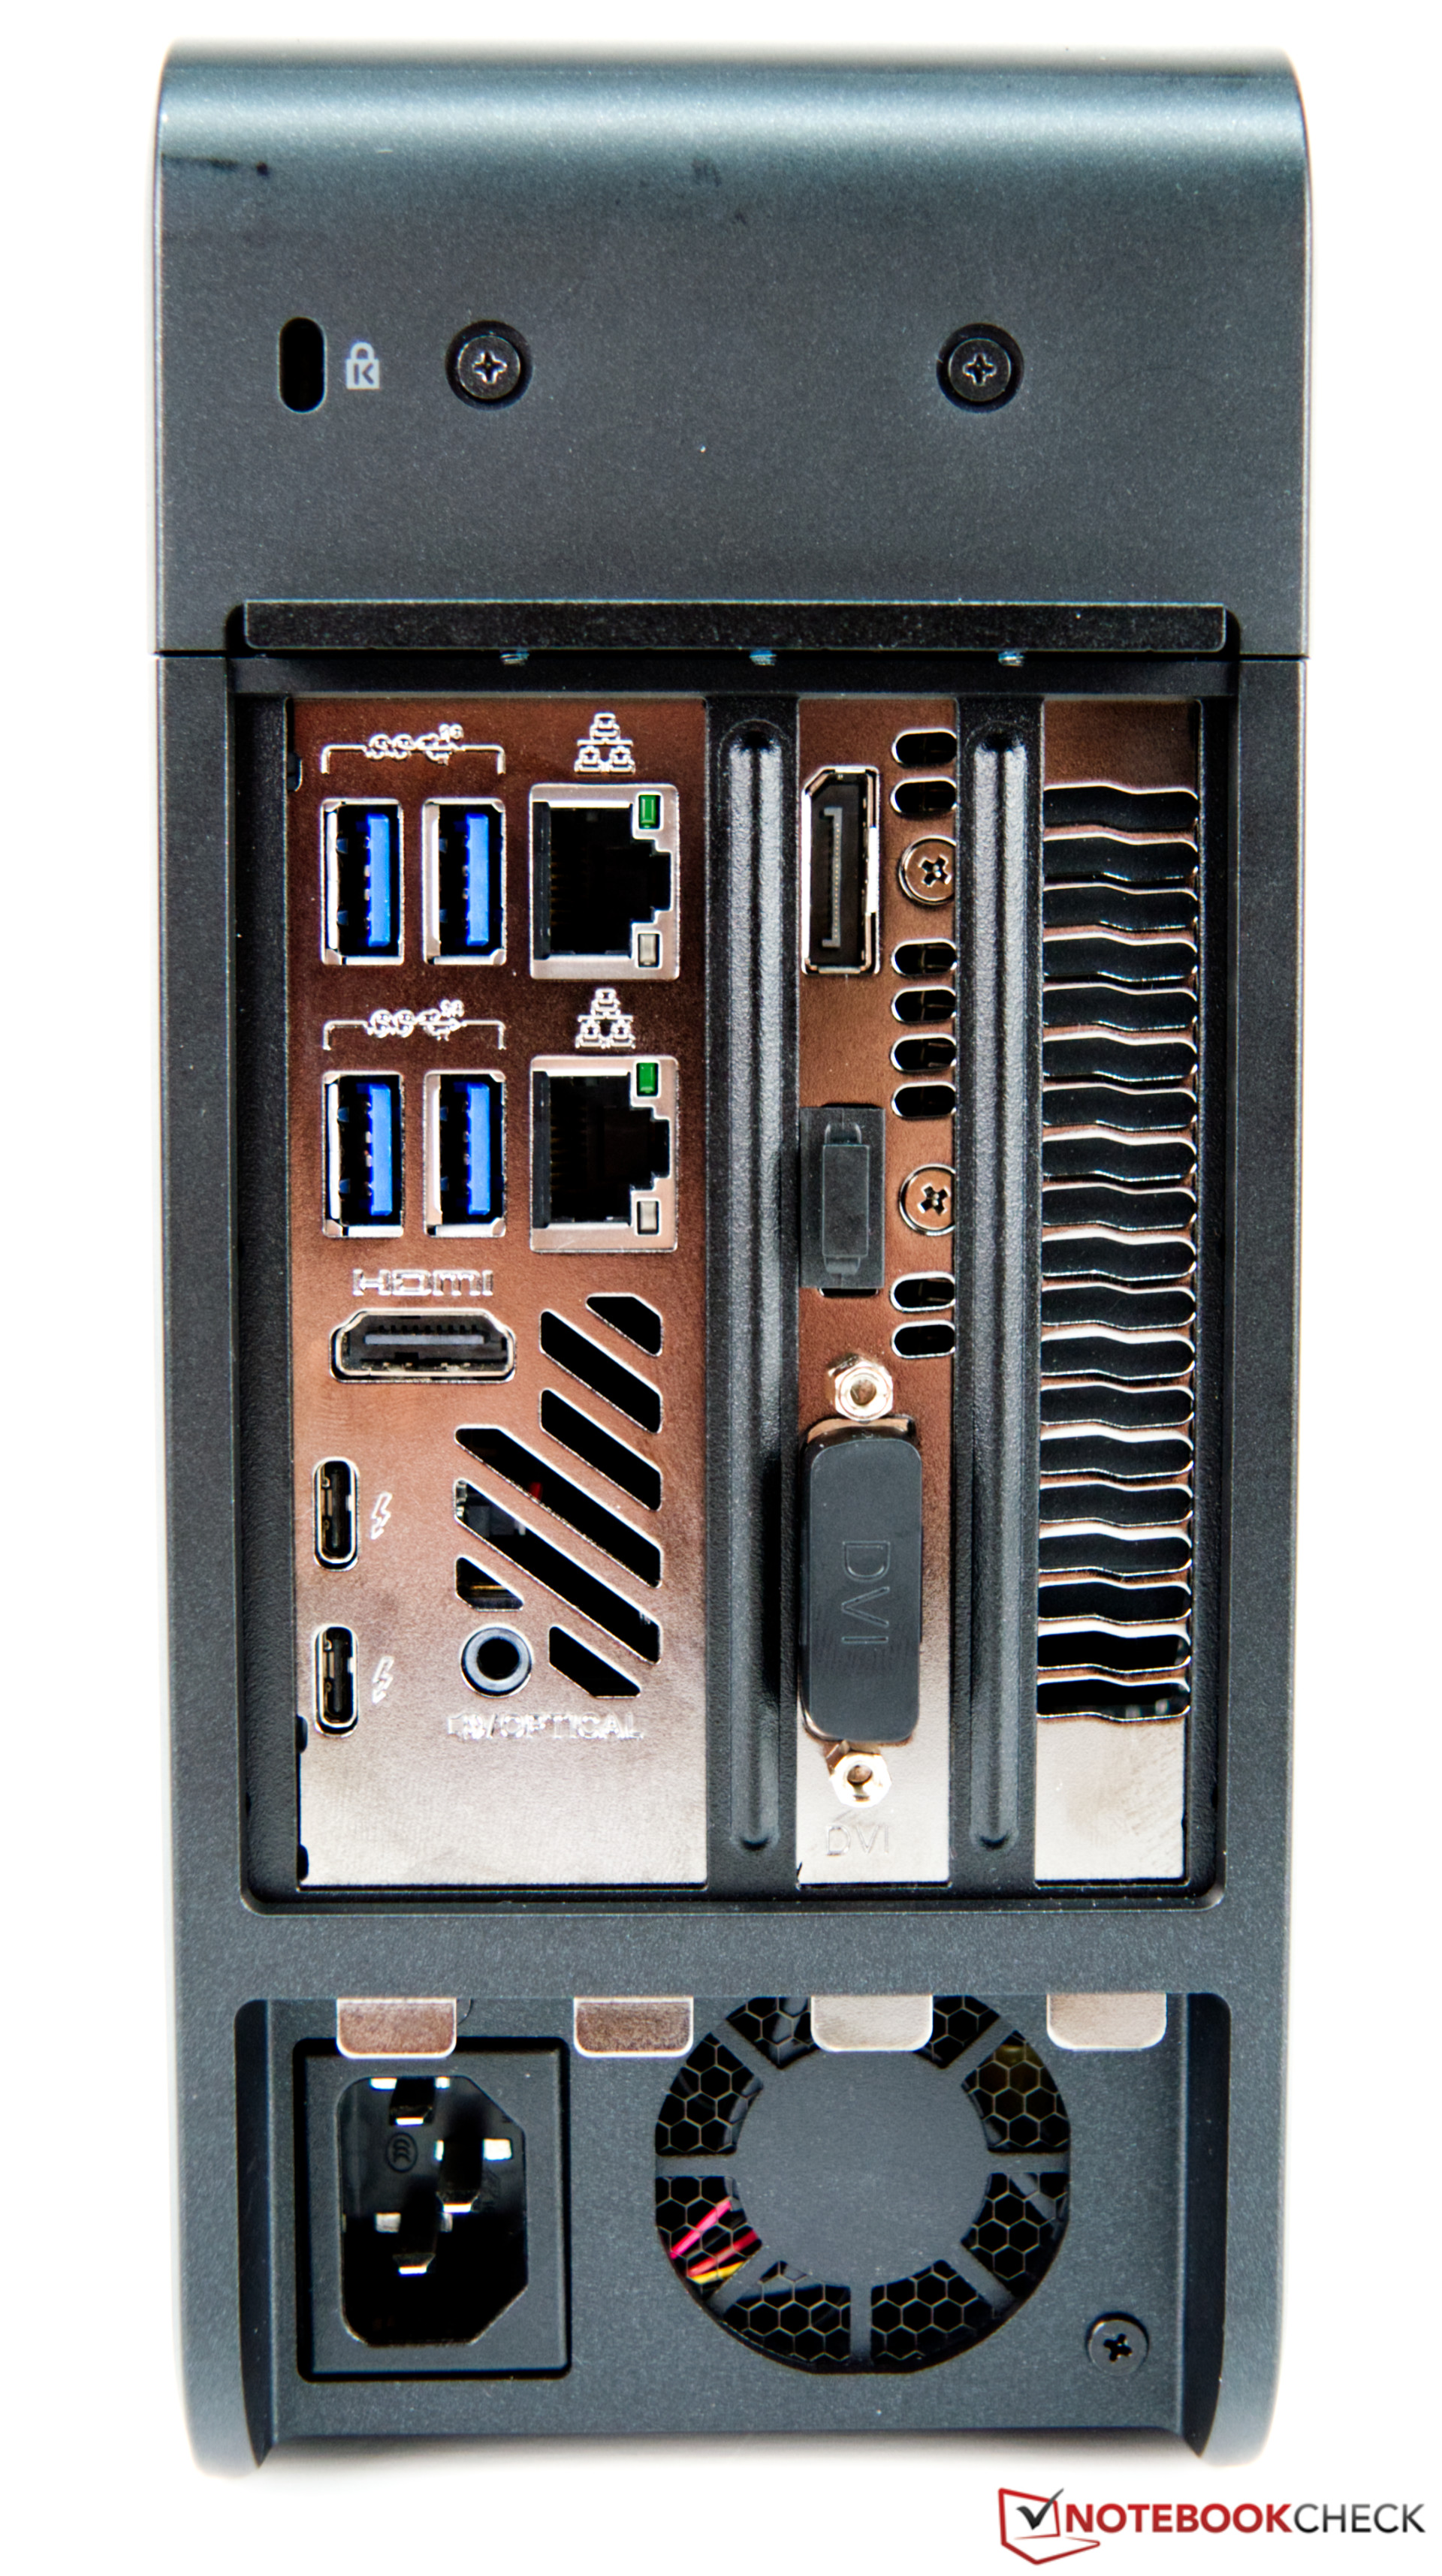
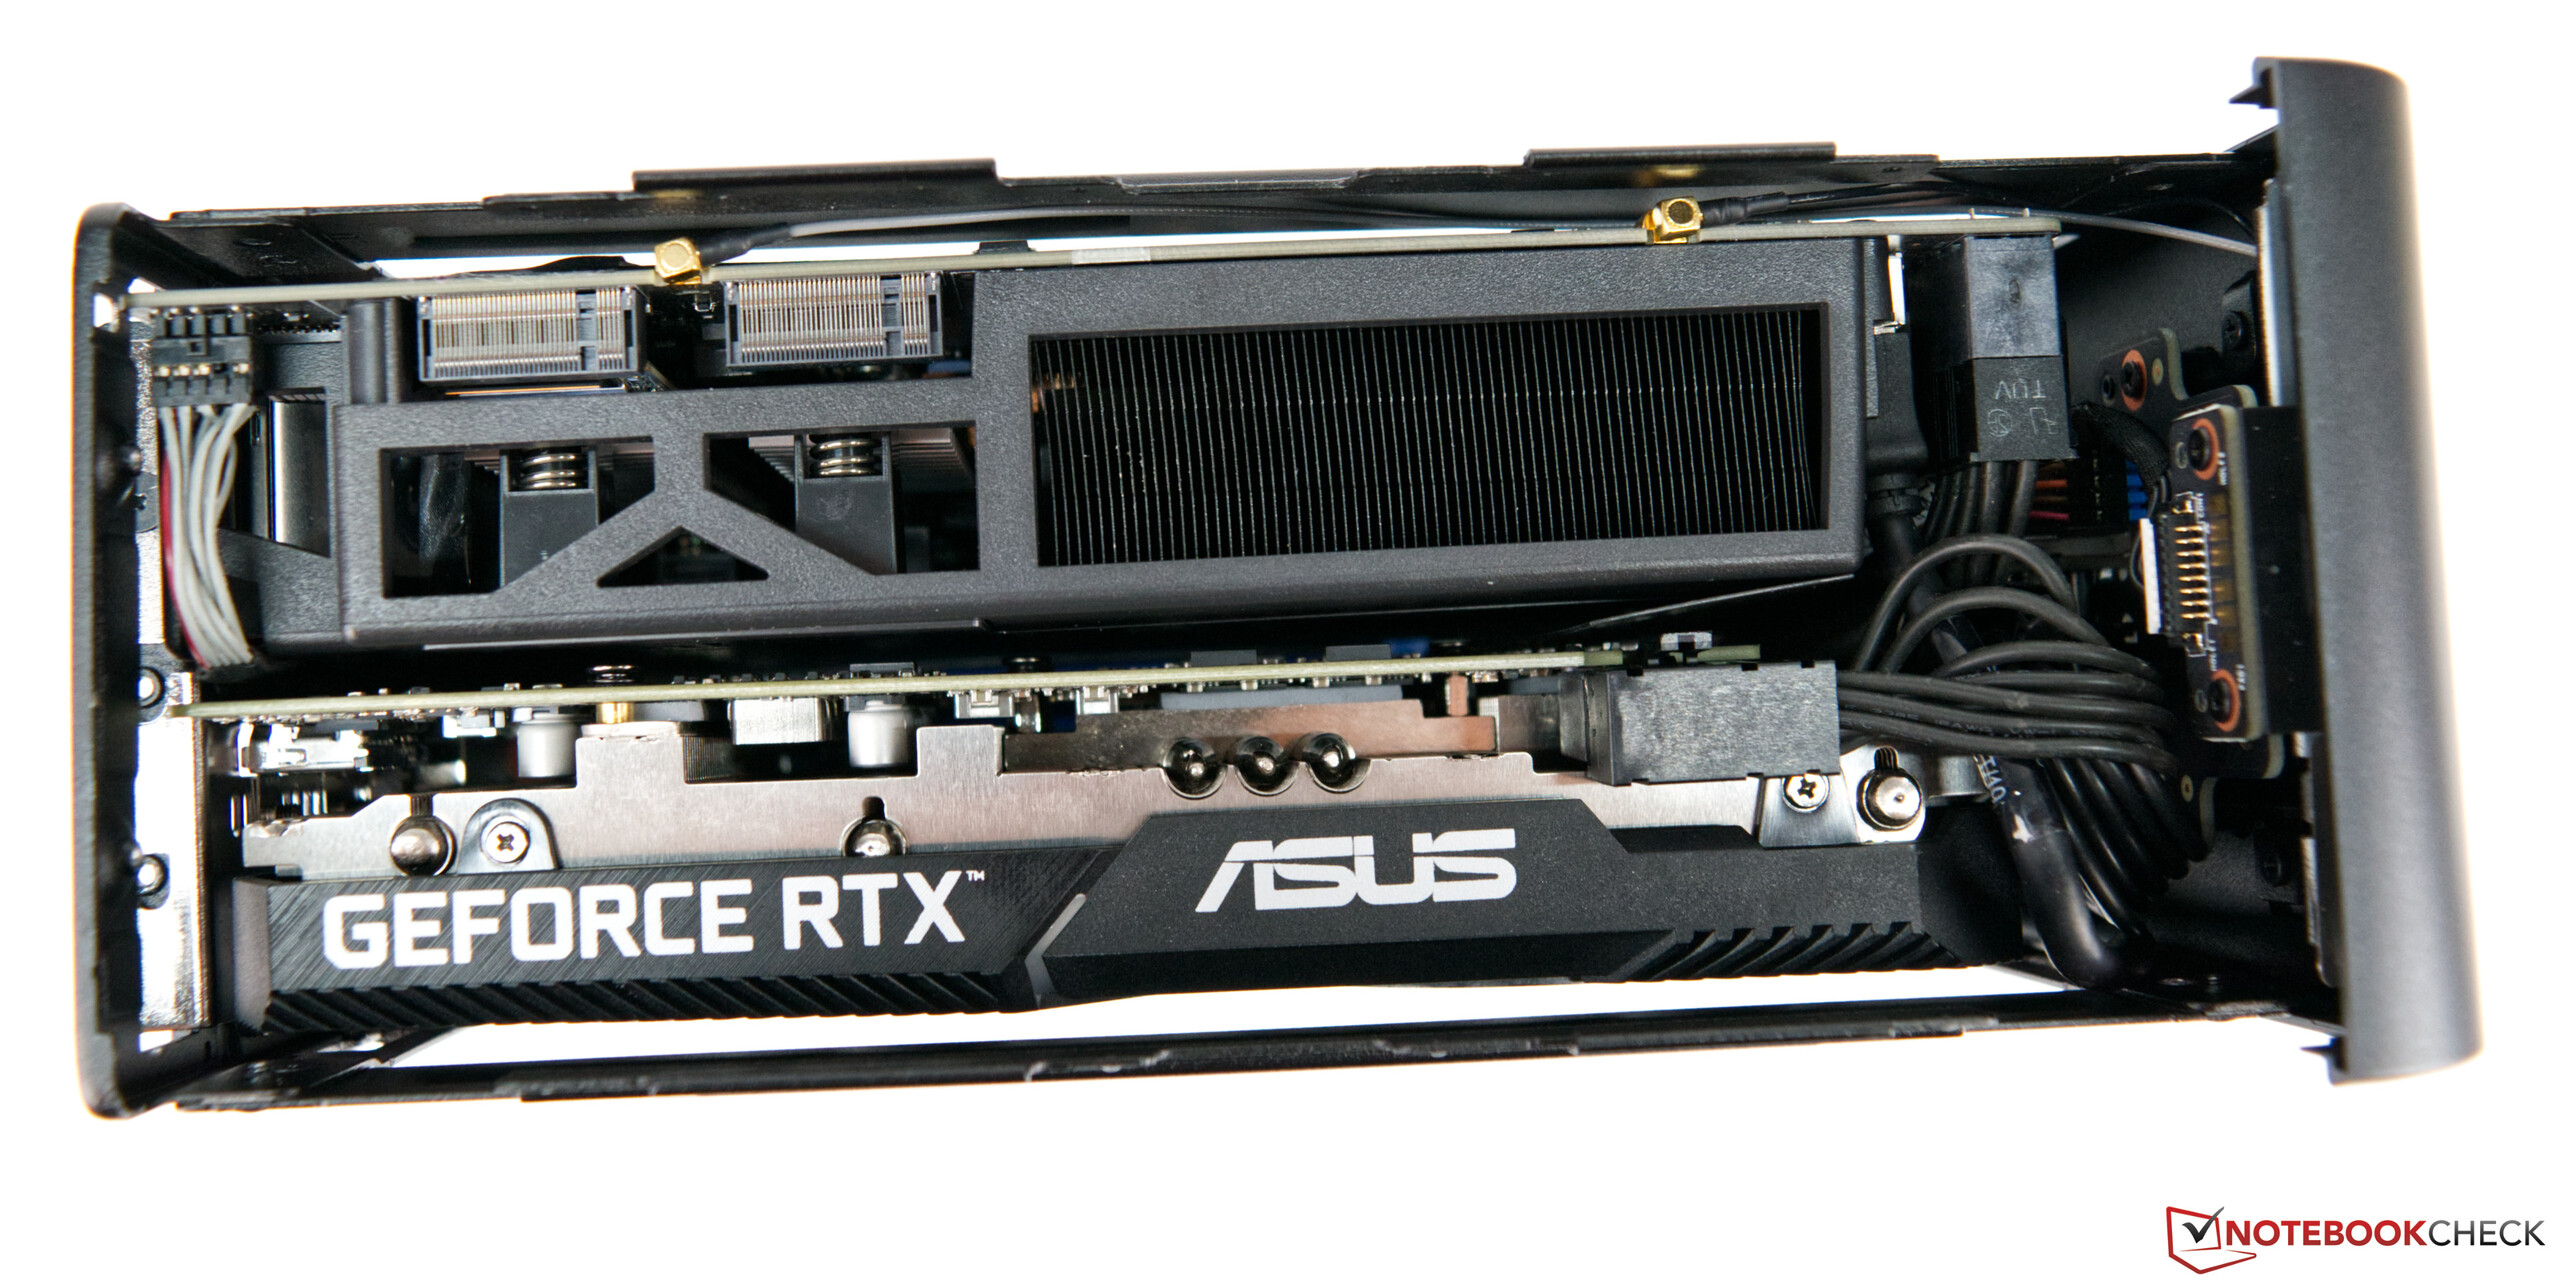
Intel NUC 9 Extreme Kit med RTX 2070

För
Emot
Läs den fullständiga versionen av den här recensionen på engelska här.
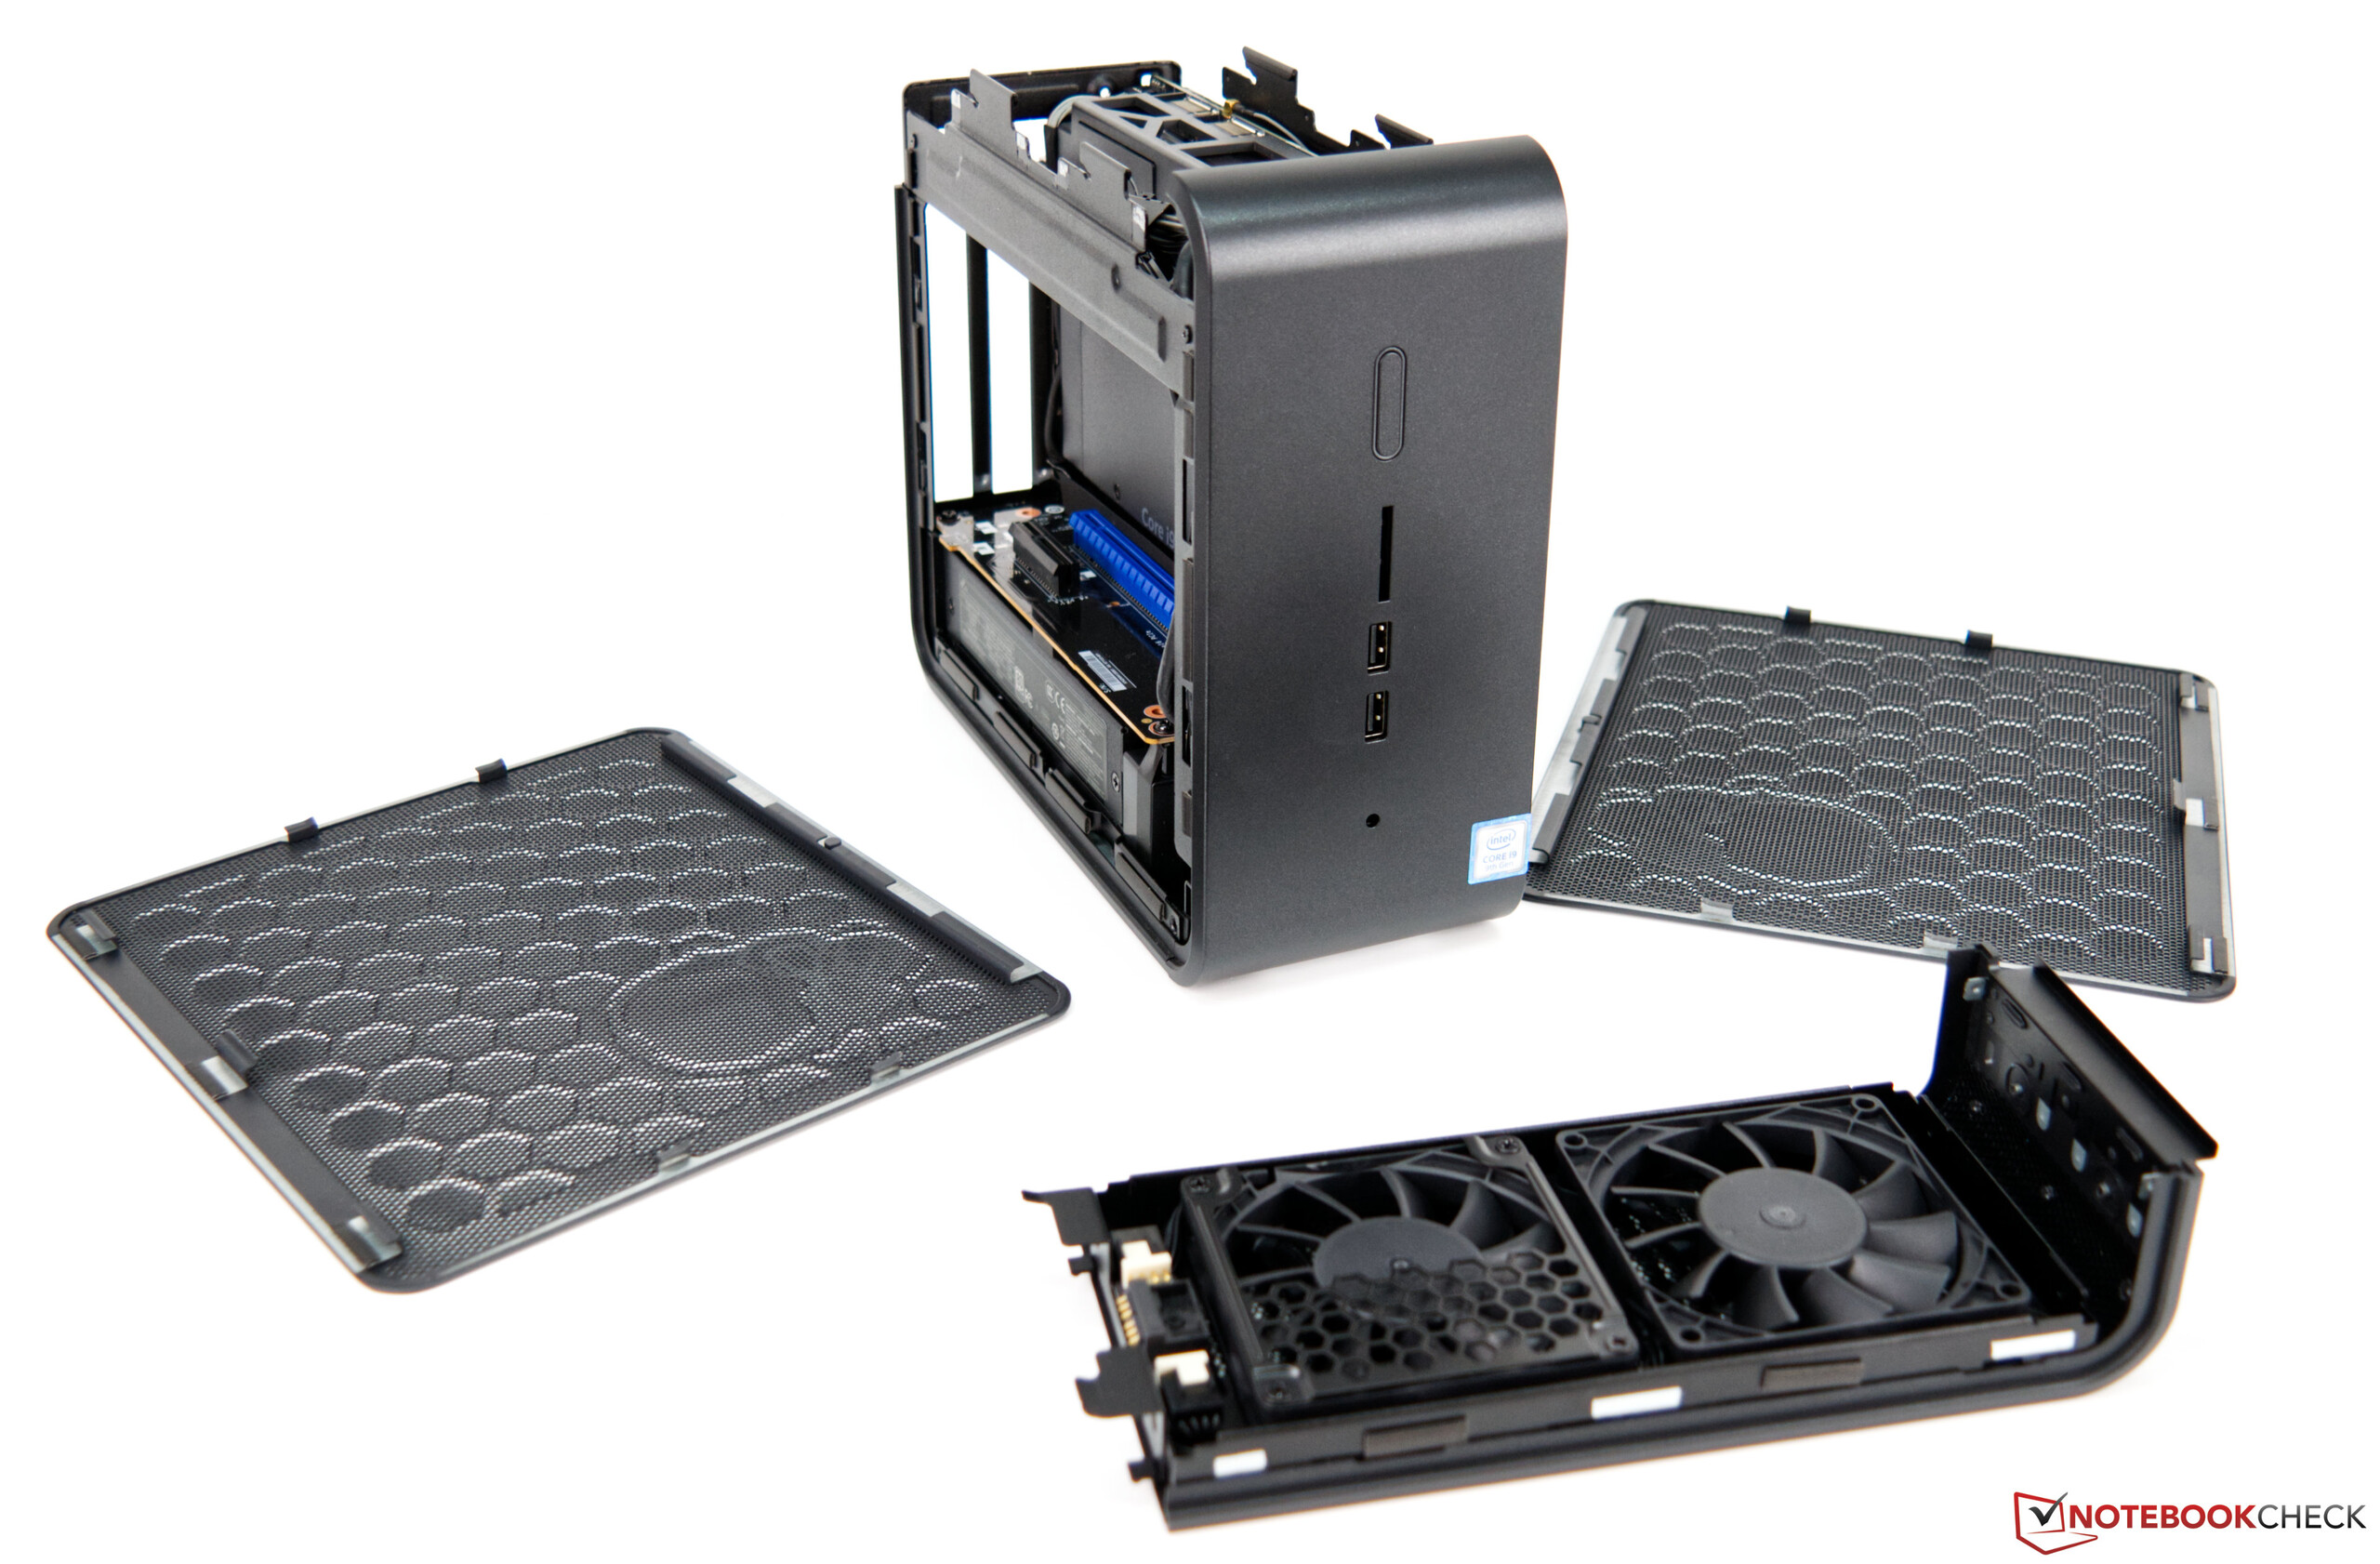
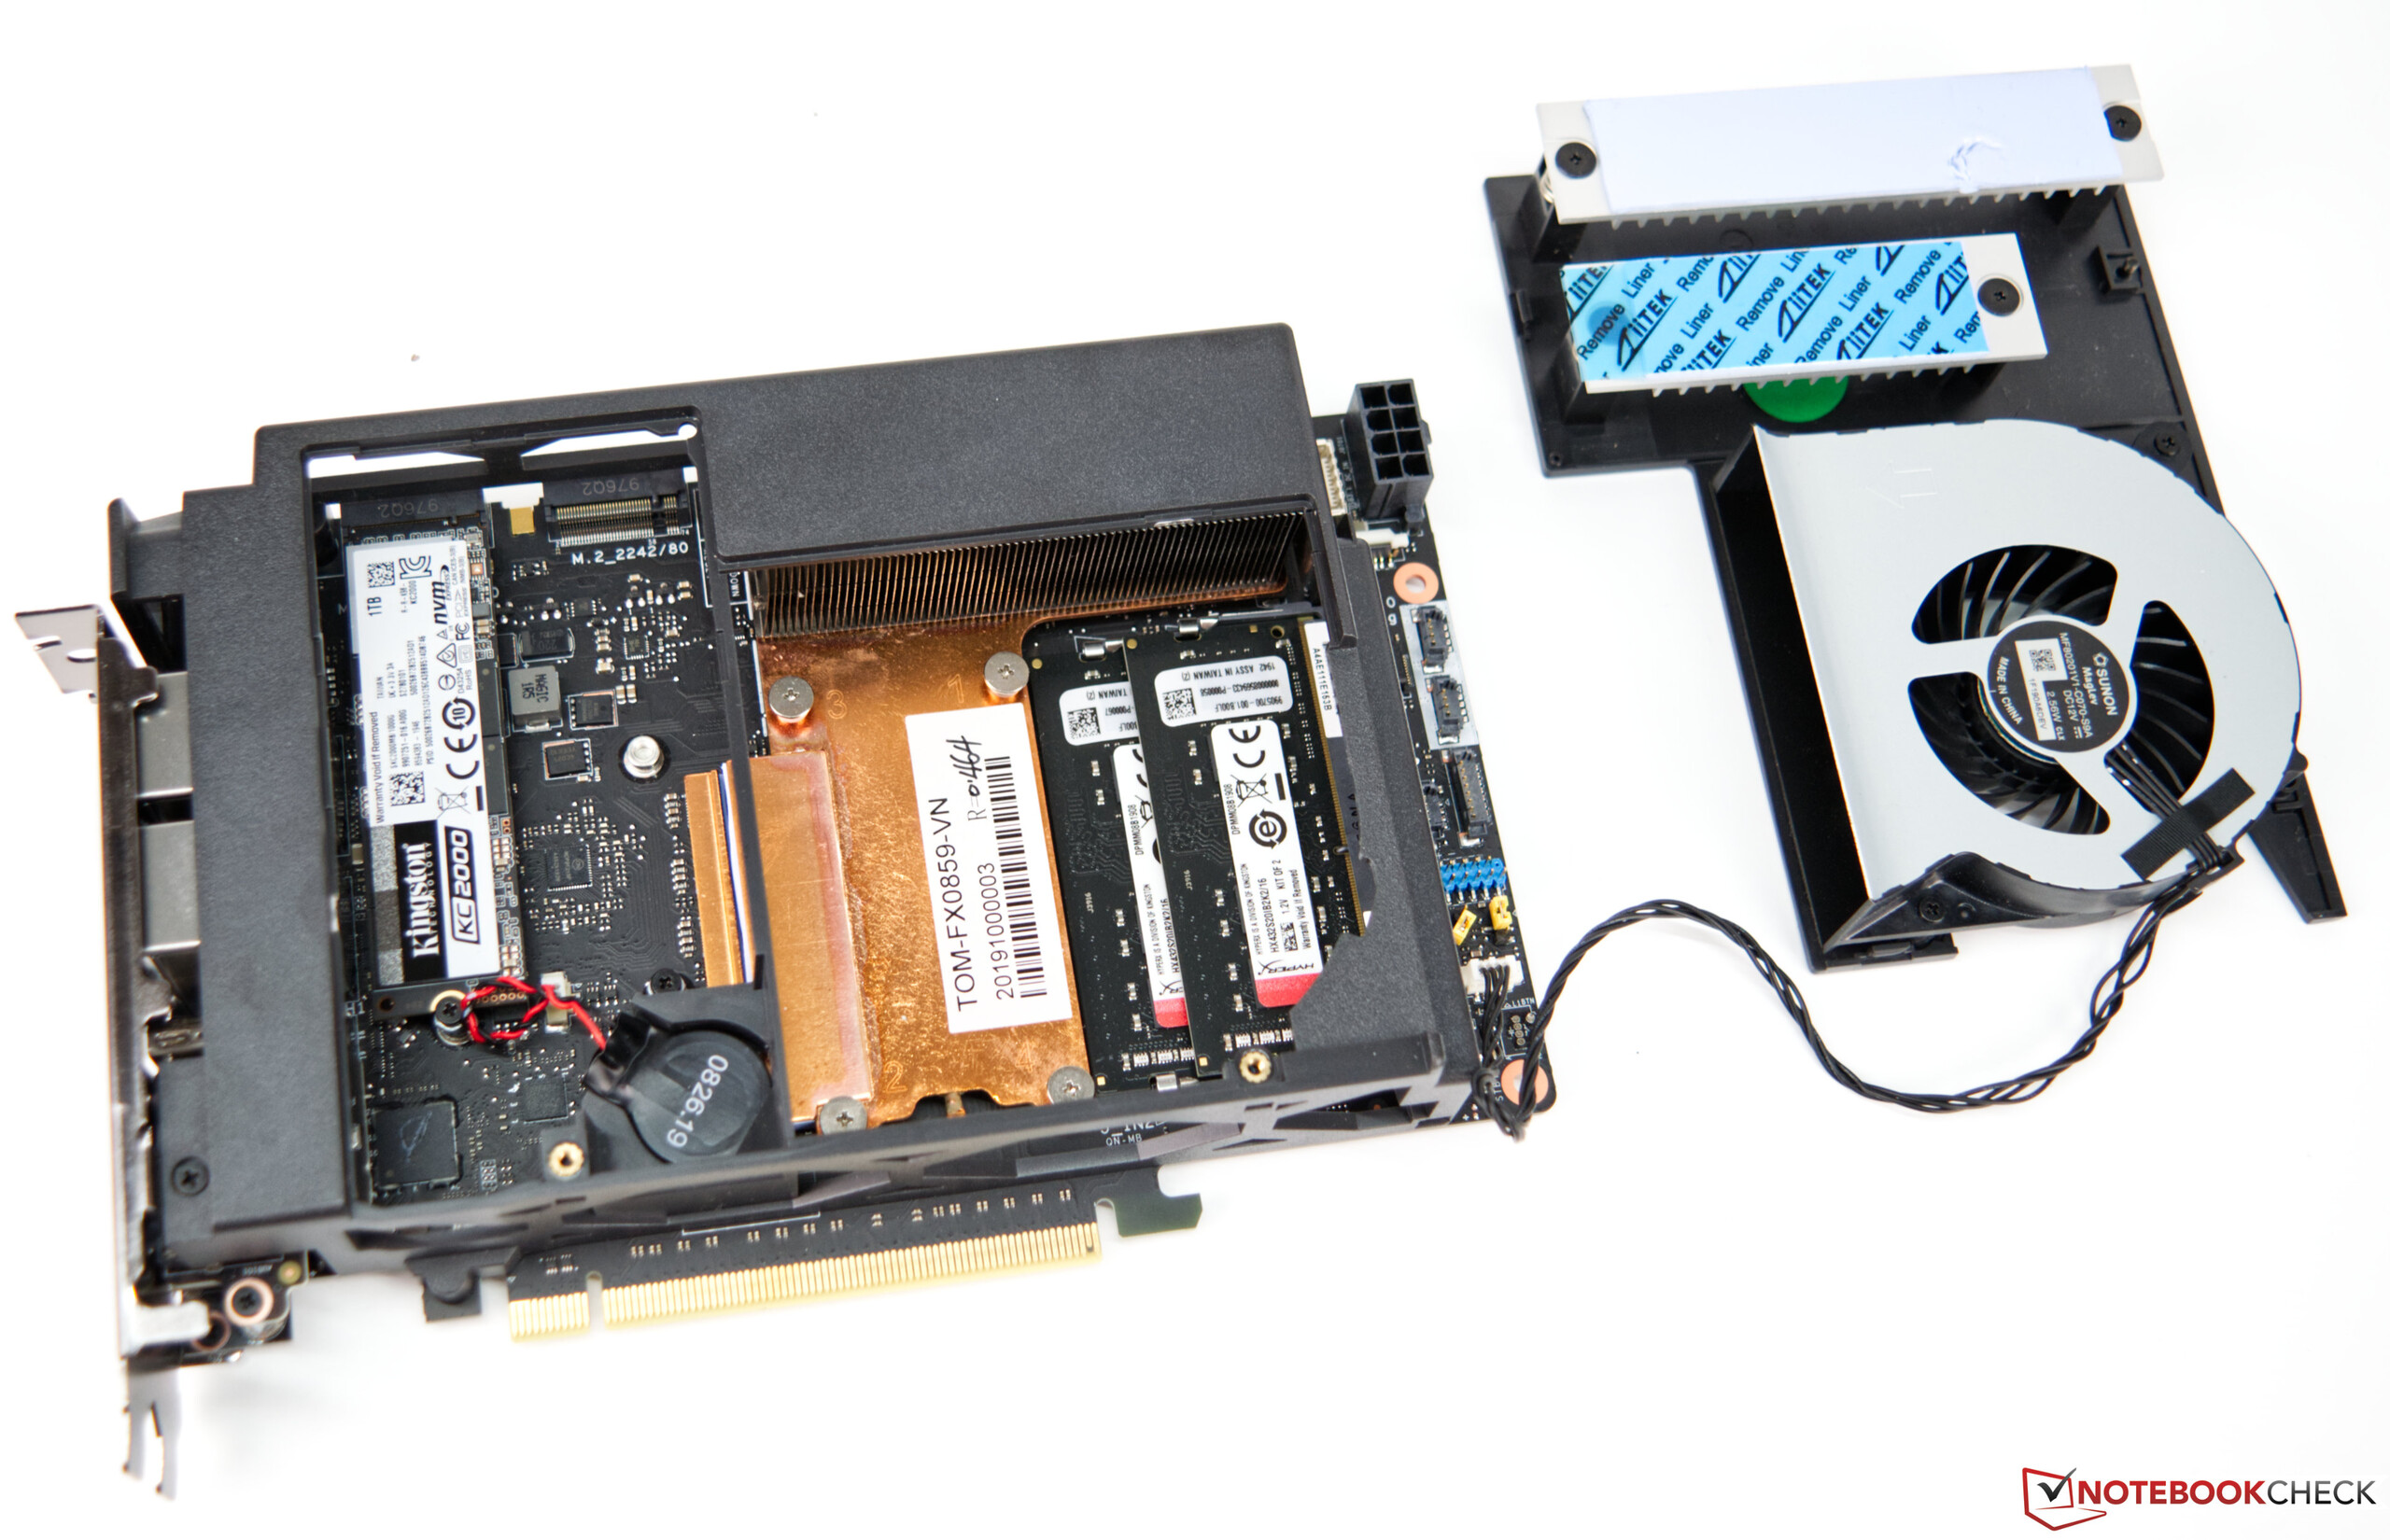
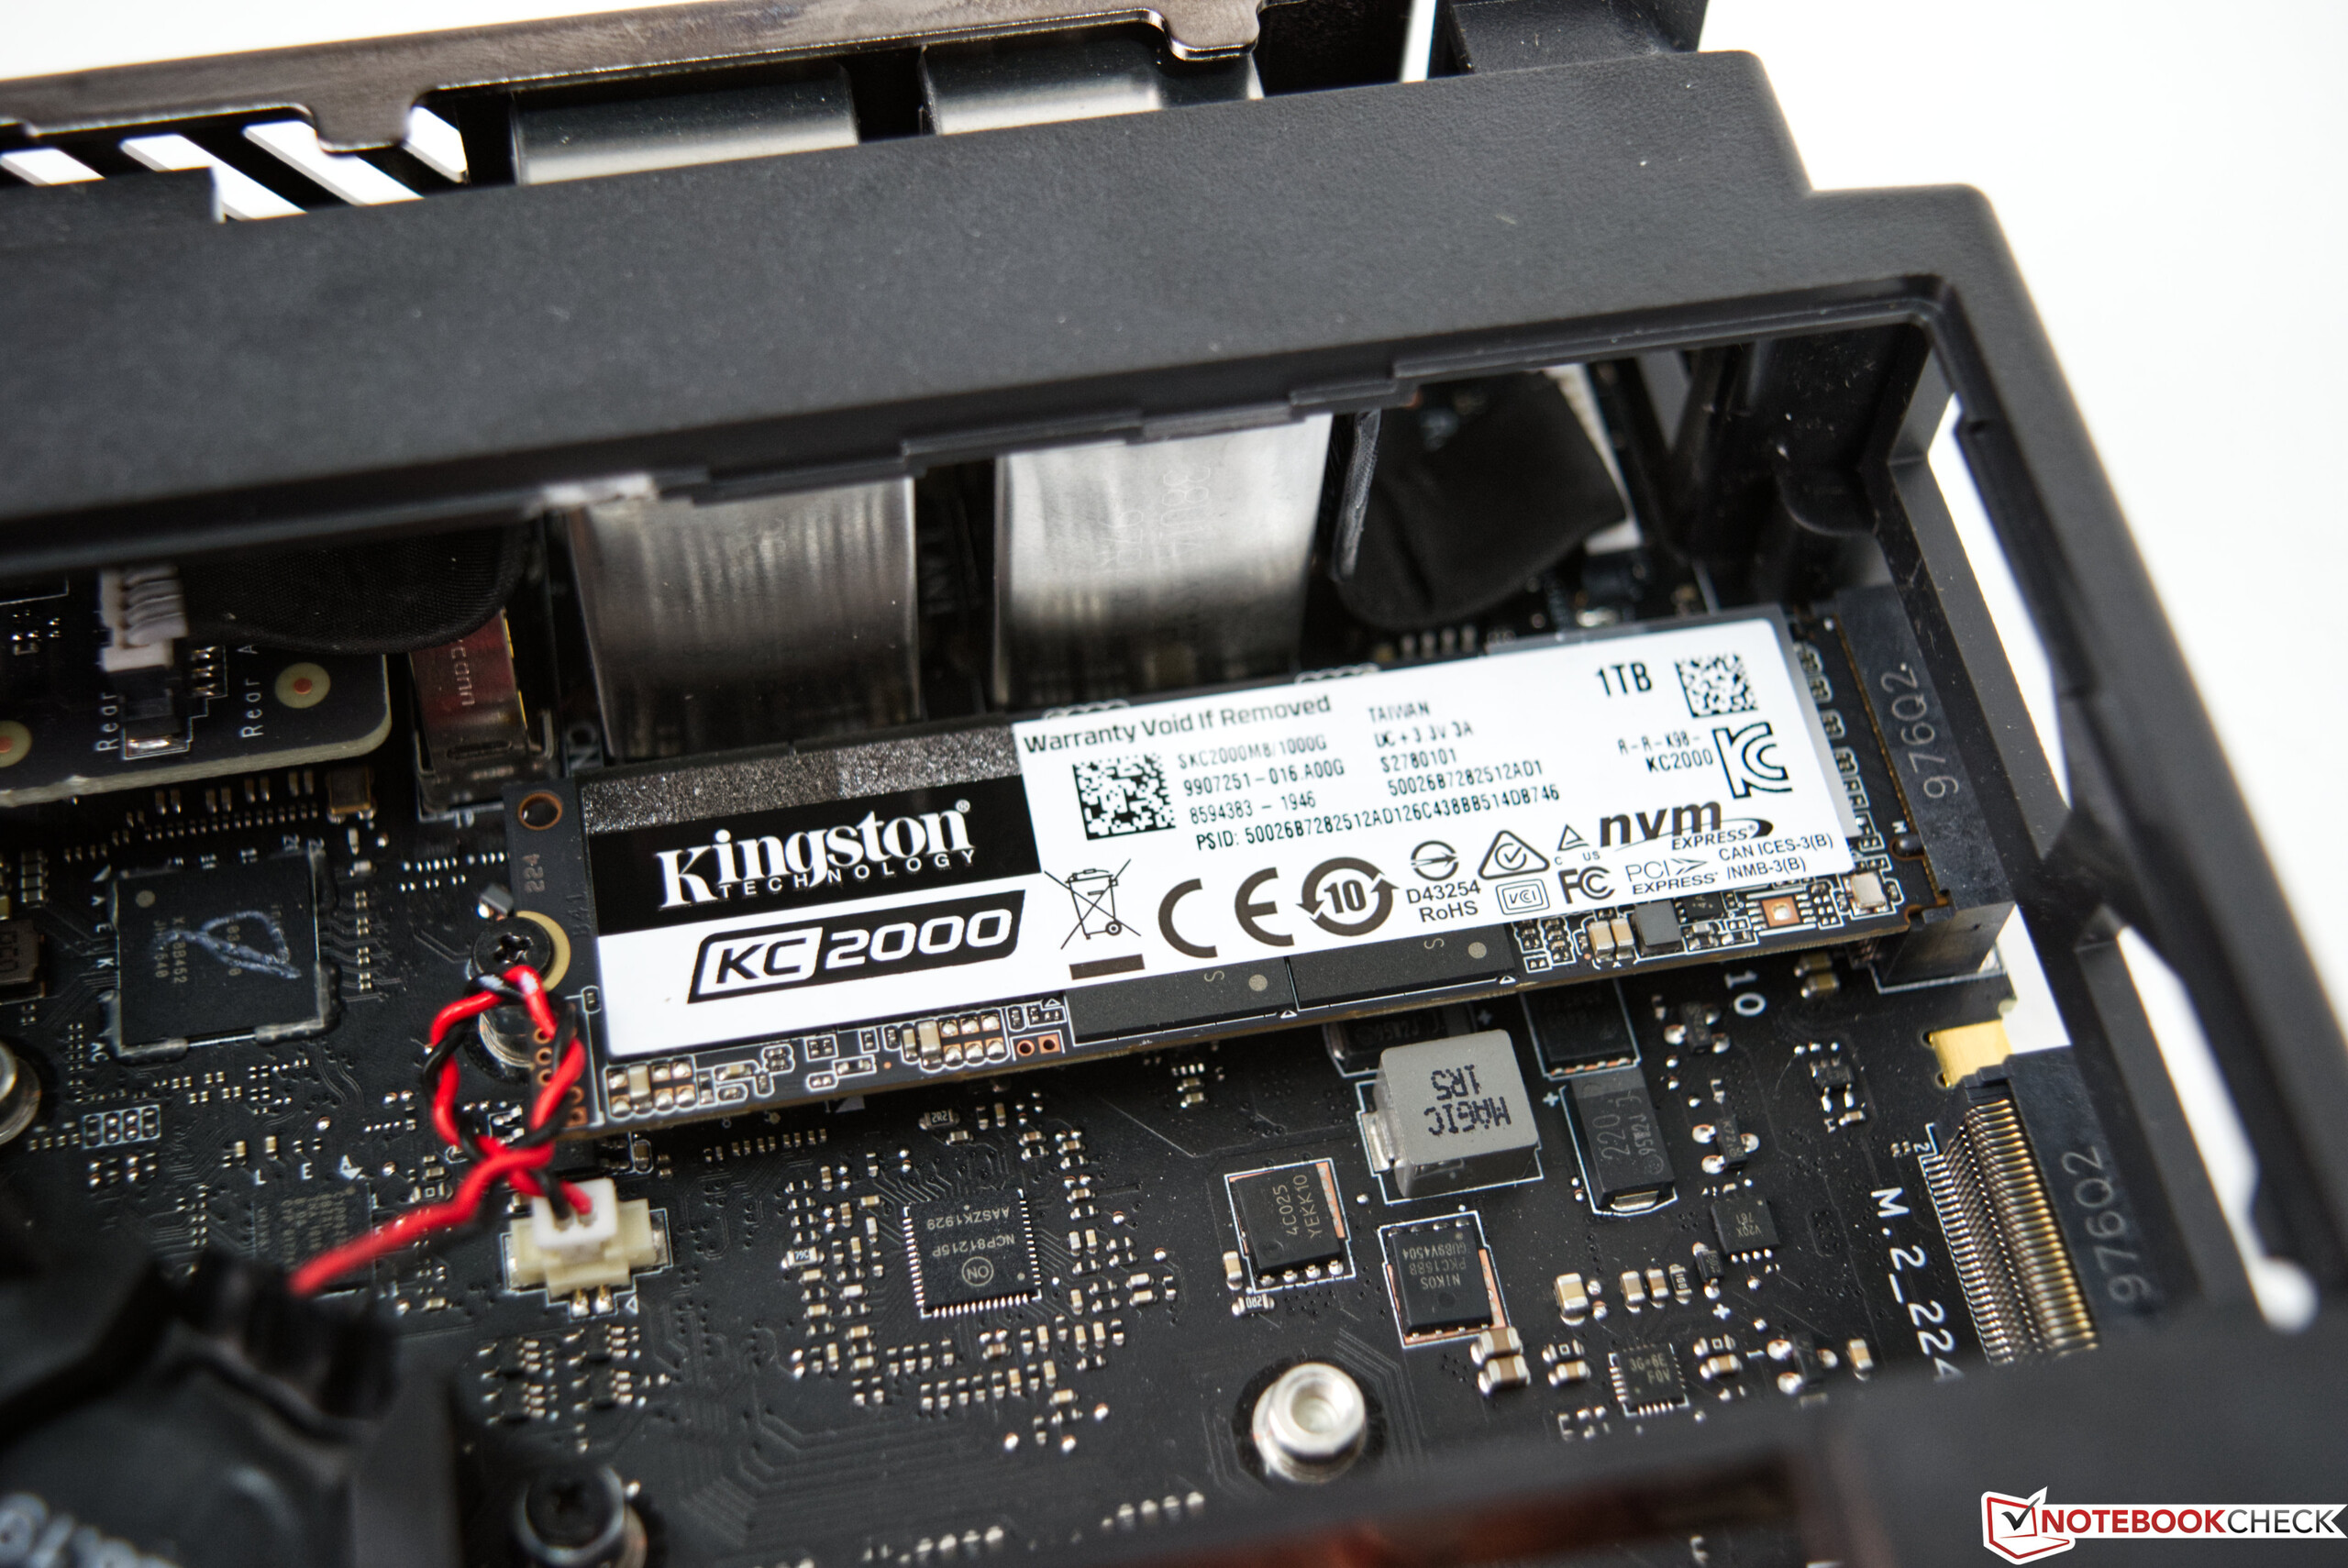
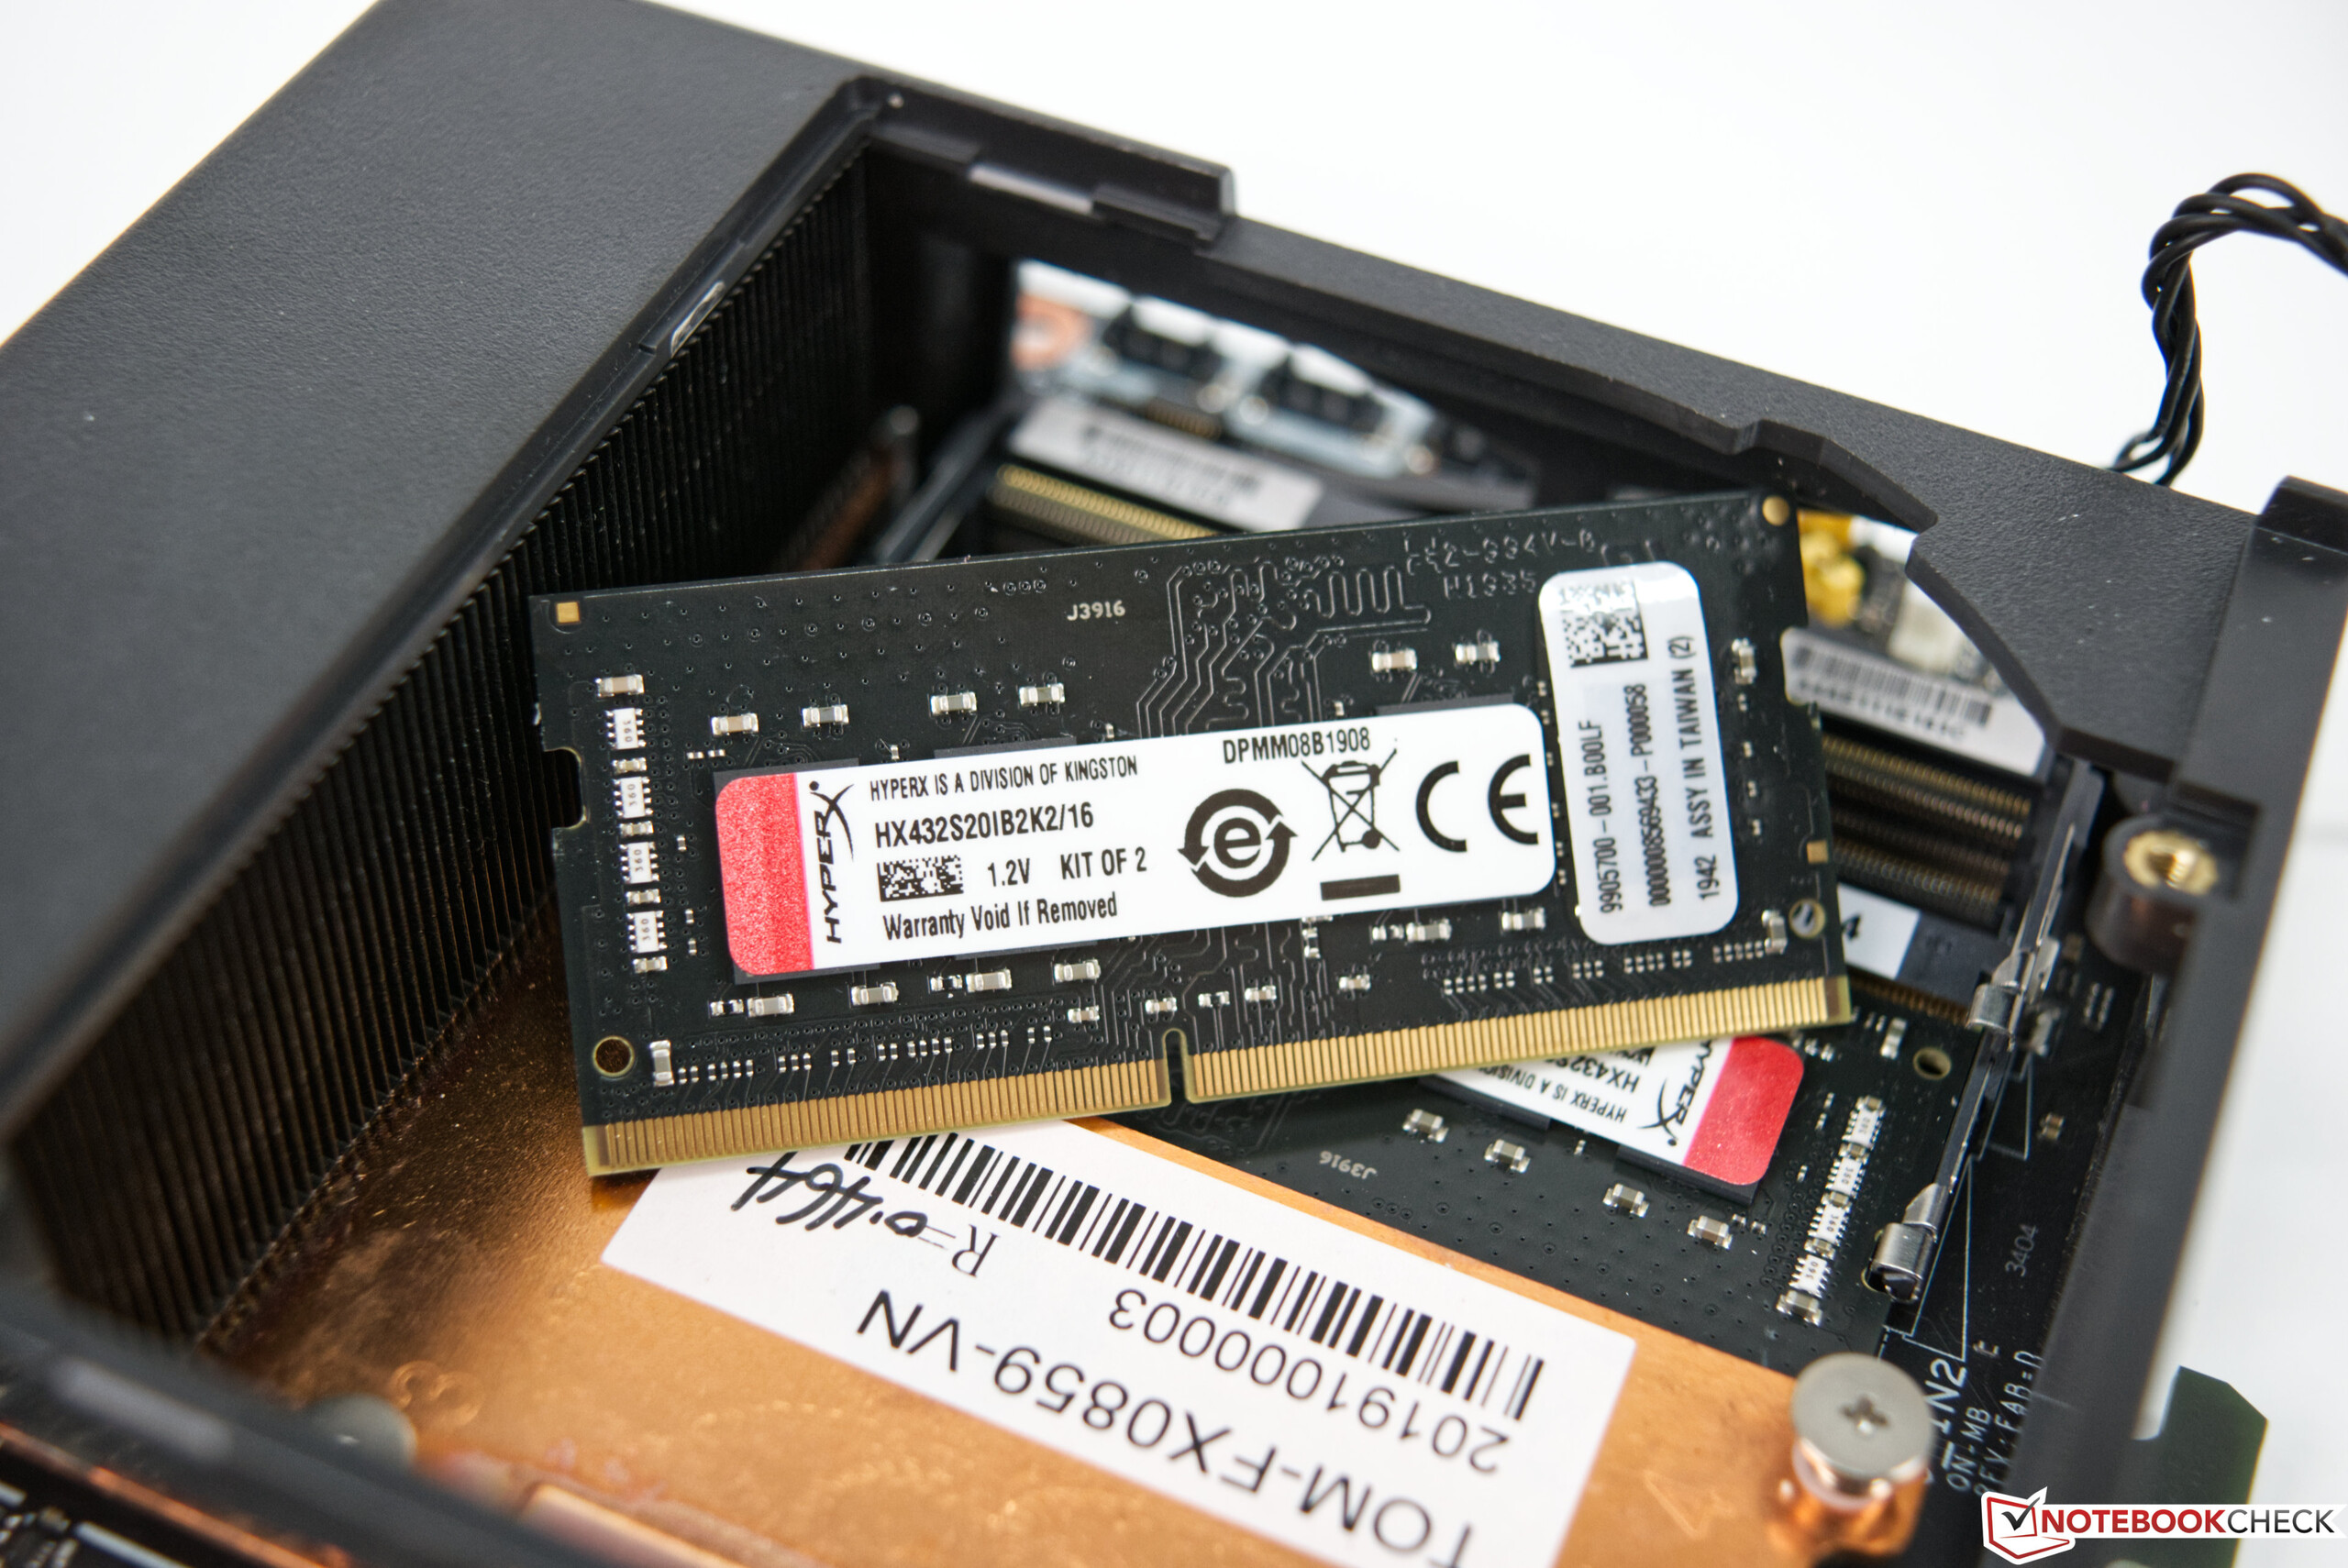
Intels NUC 9 Extreme är ett litet men ändå väldigt kraftfullt system. För det nuvarande priset på 17.000 kronor är det inte direkt ett kap, och du får inte glömma att du själv behöver leverera RAM, lagring och, om du så önskar, en dedikerad GPU. Gör du det får du dock en riktigt välutrustad och modern enhet. Med en högpresterande GPU förvandlas denna miniatyr-PC till en fullfjädrad gaming-PC som till och med kan köra de senaste och häftigaste spelen smidigt.
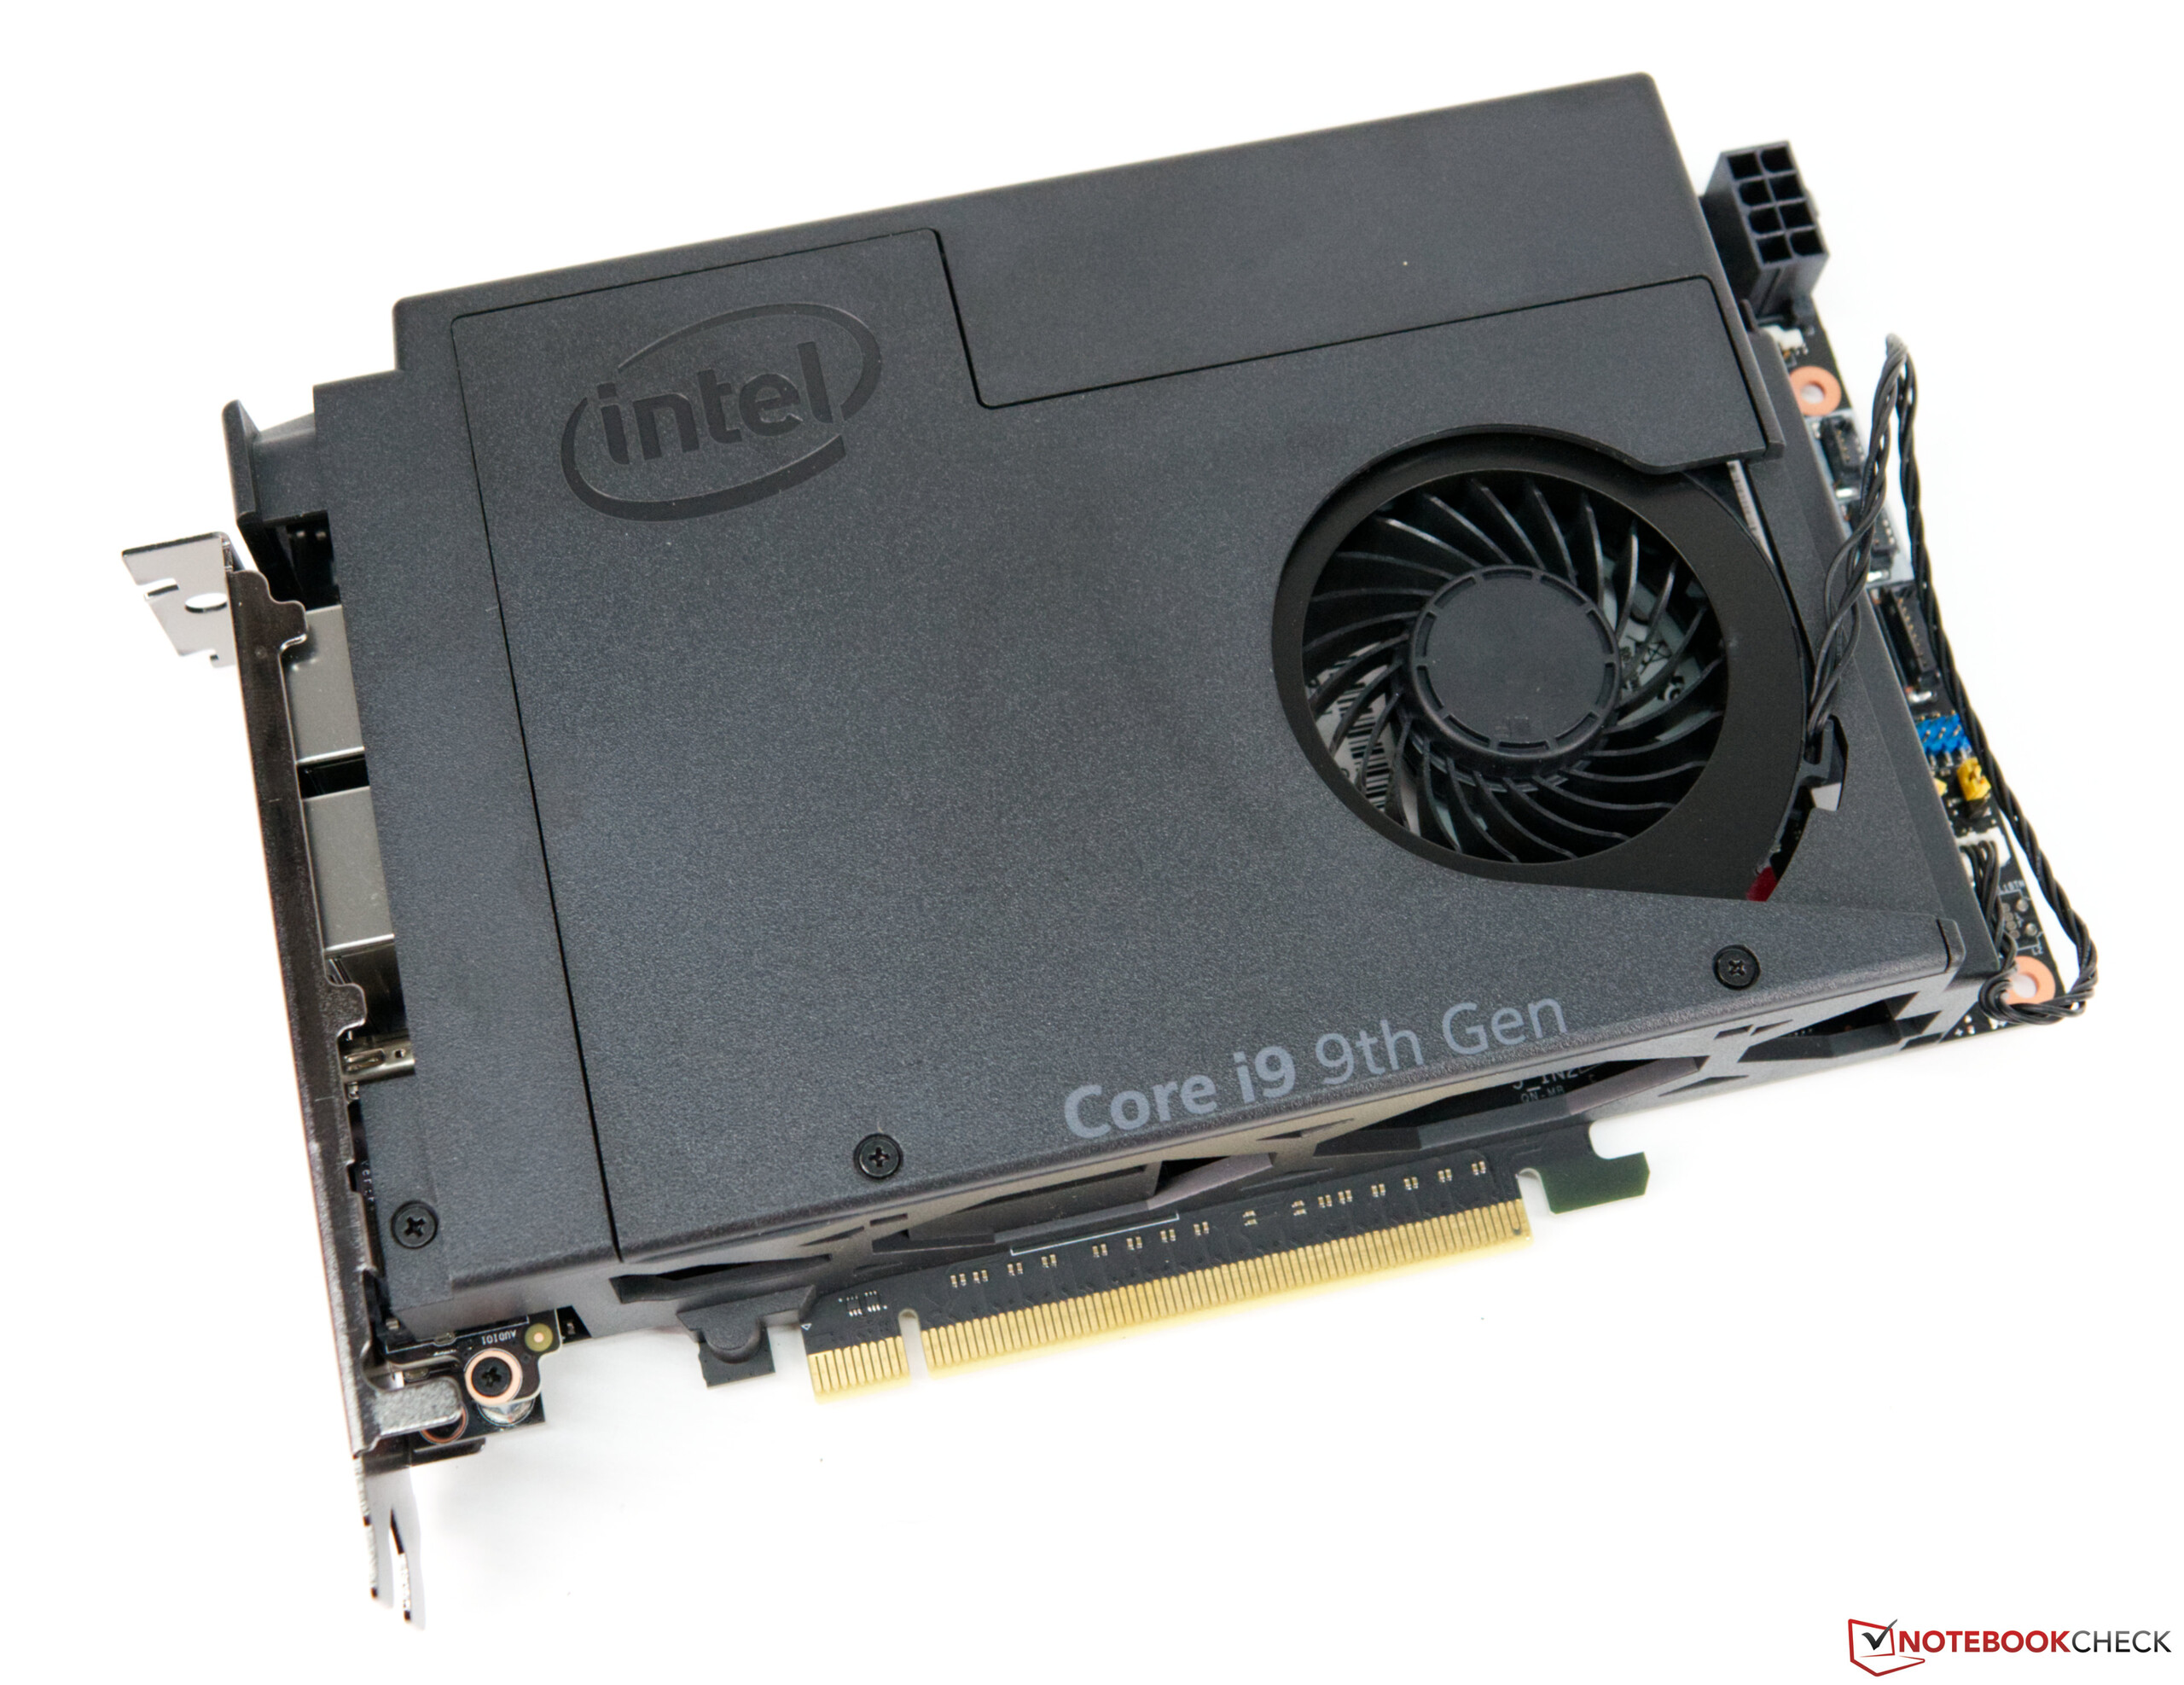
Om du inte behöver den 8-kärniga prestandan från Intels Core Core i9-9980HK kan du också köpa en SKU med långsammare i7-9750H- eller i5-9300H-processorer. Båda är vanliga i bärbara speldatorer och har visat upp gedigen och tillräcklig prestanda tidigare. Core i9-9980HK förblir dock kungen av den här NUC-enheten.
Trots utmärkt prestanda gör det höga priset att detta lilla kraftpaket nog får det svårt att hamna i en gamers kundkorg.
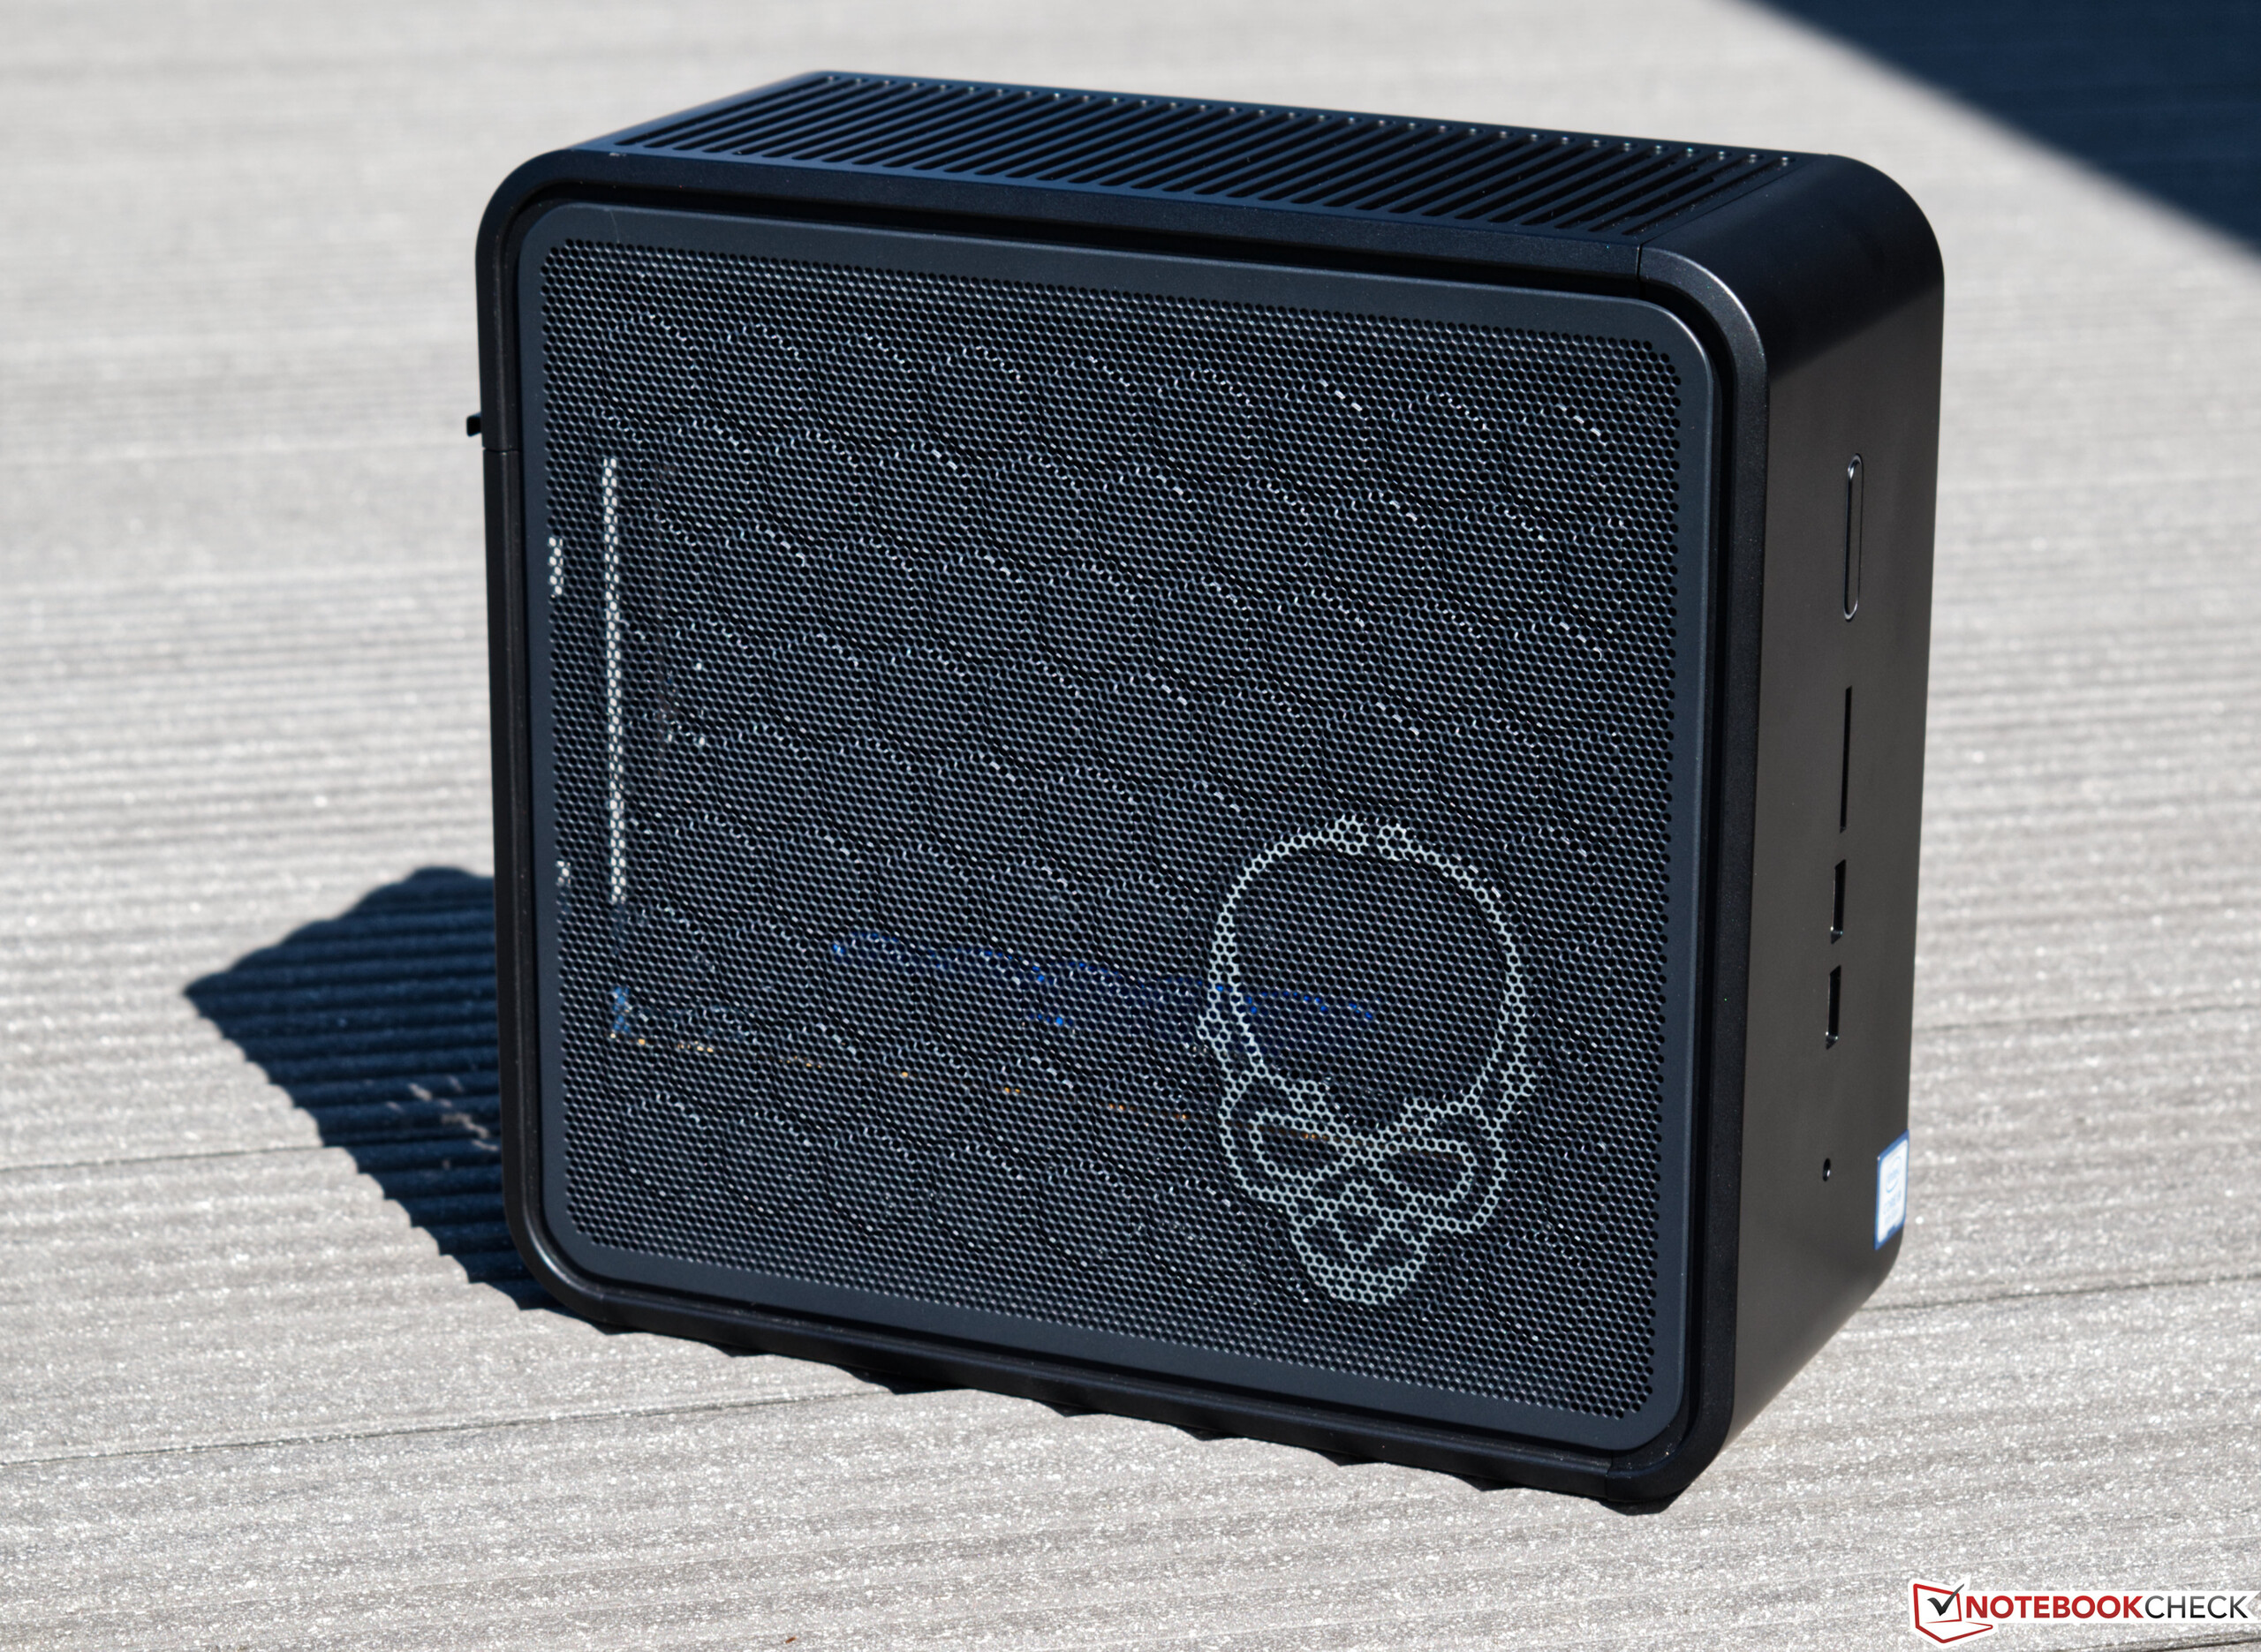
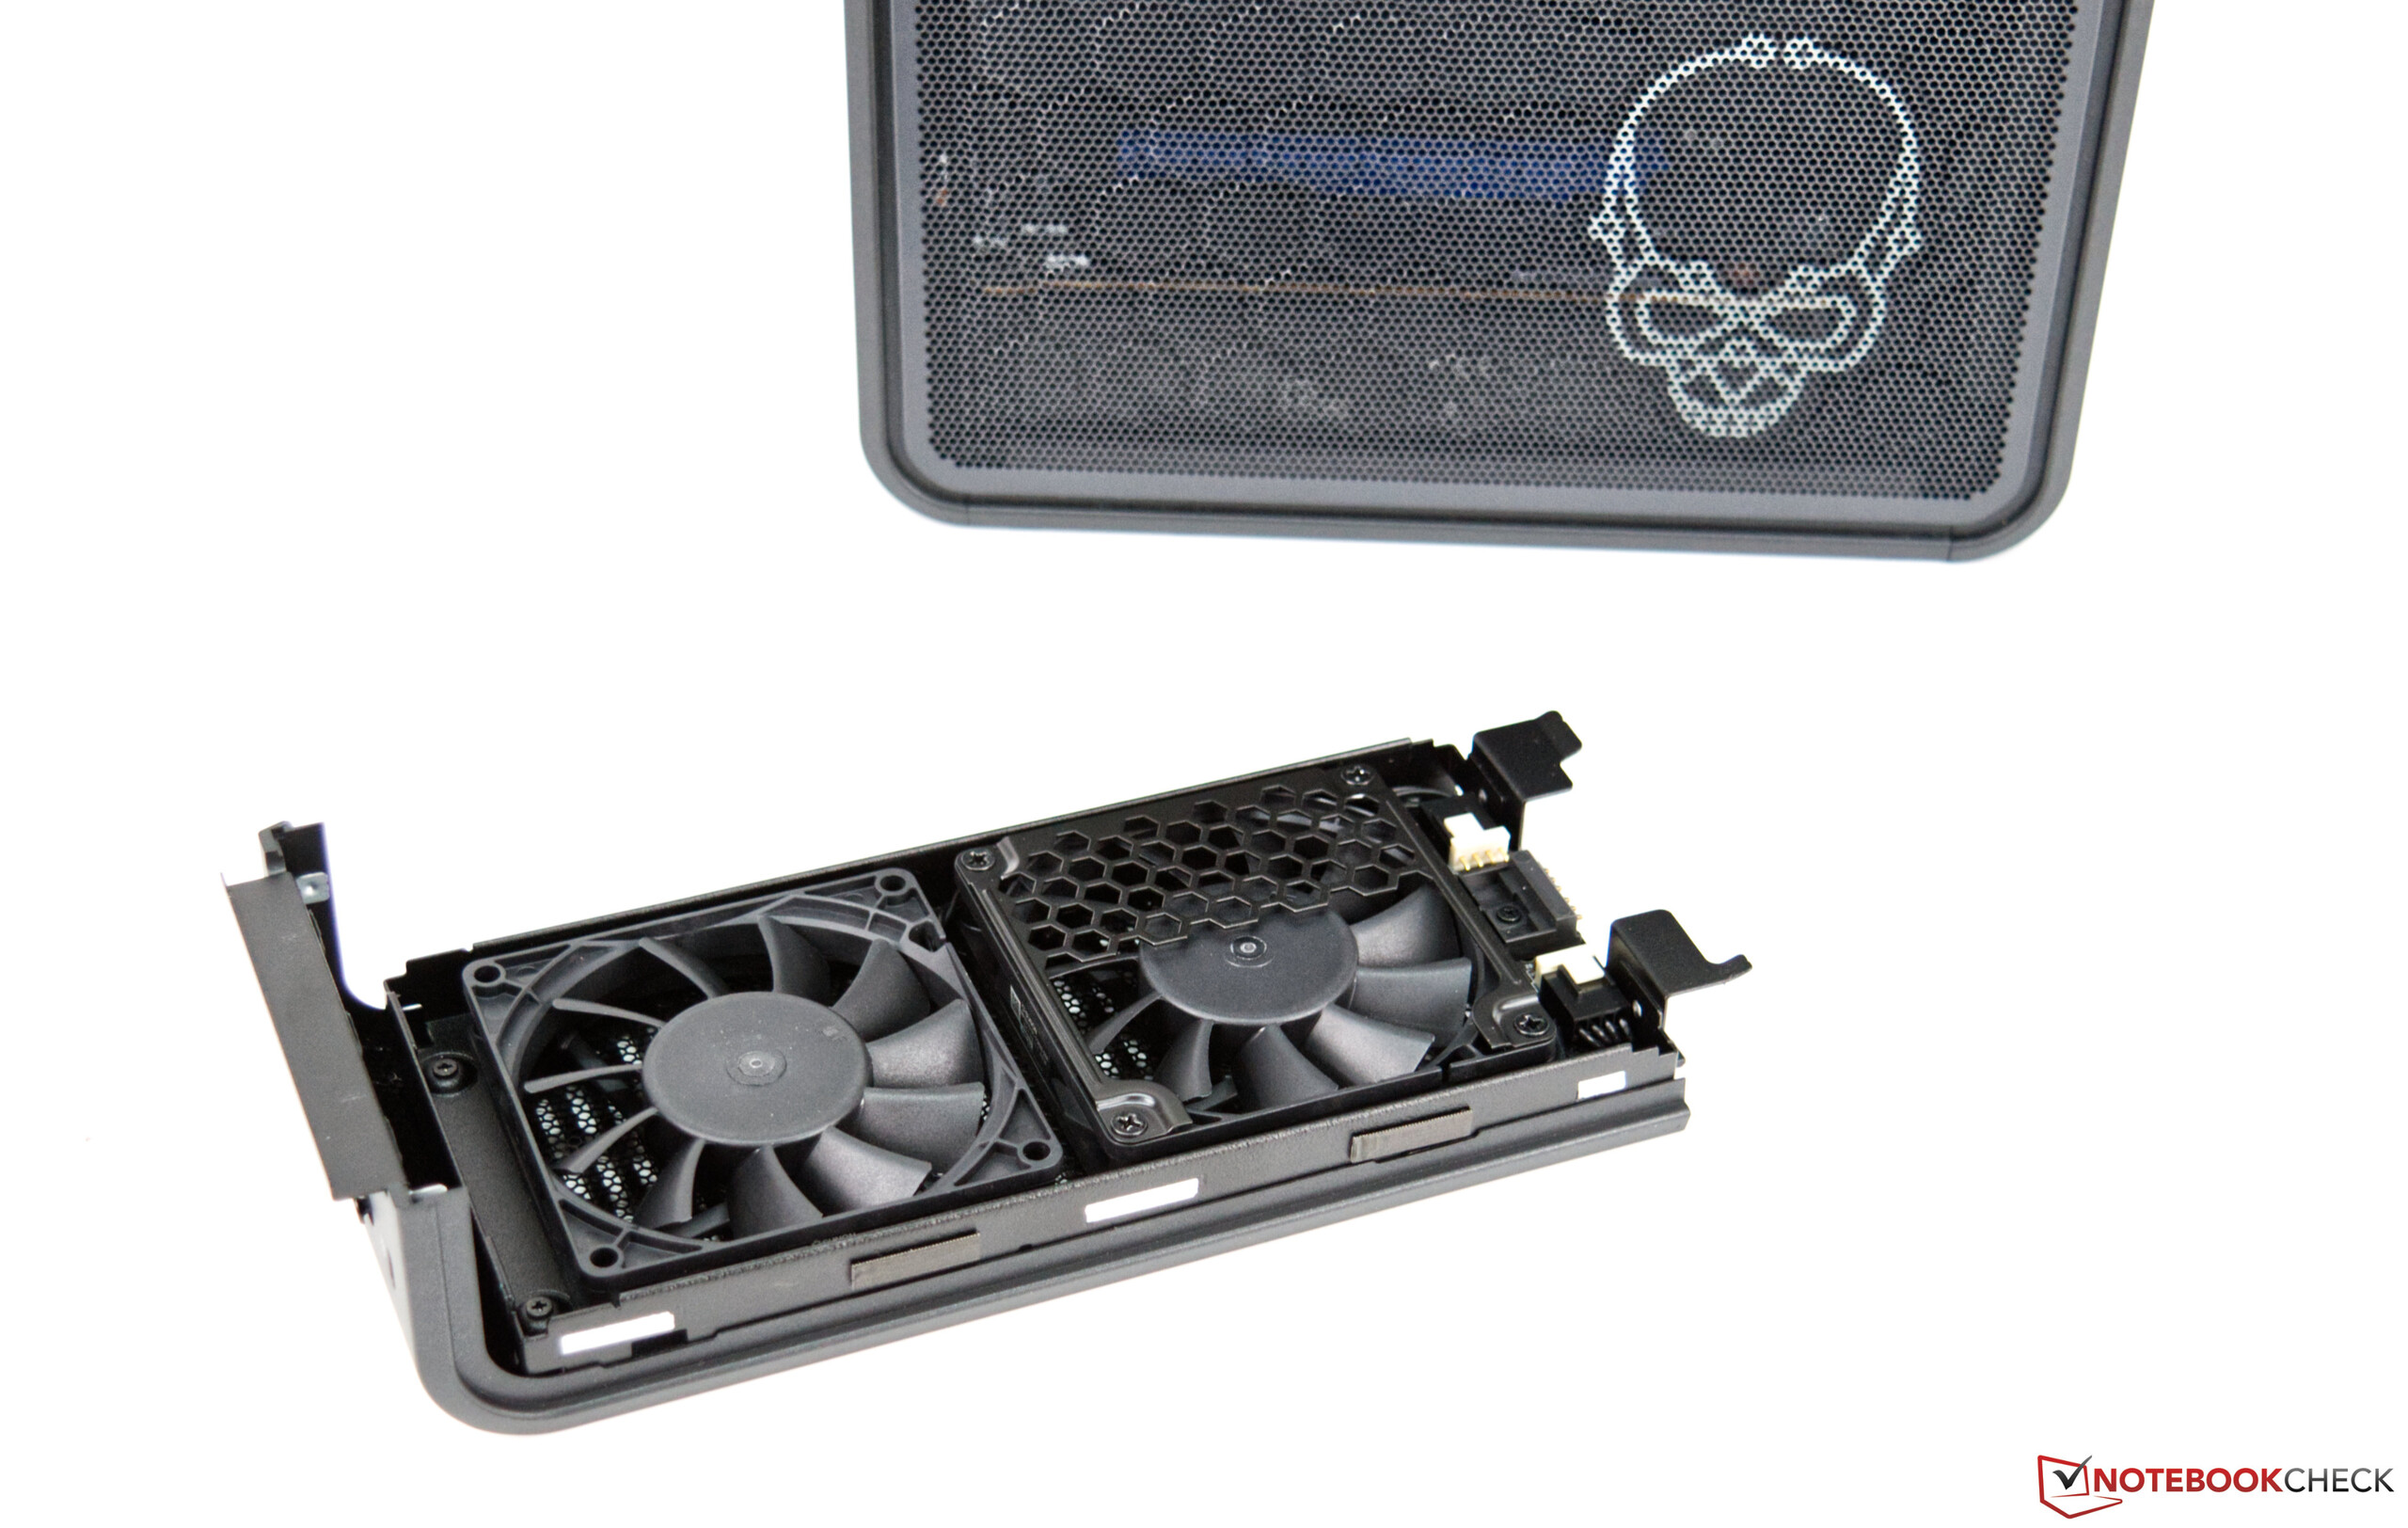
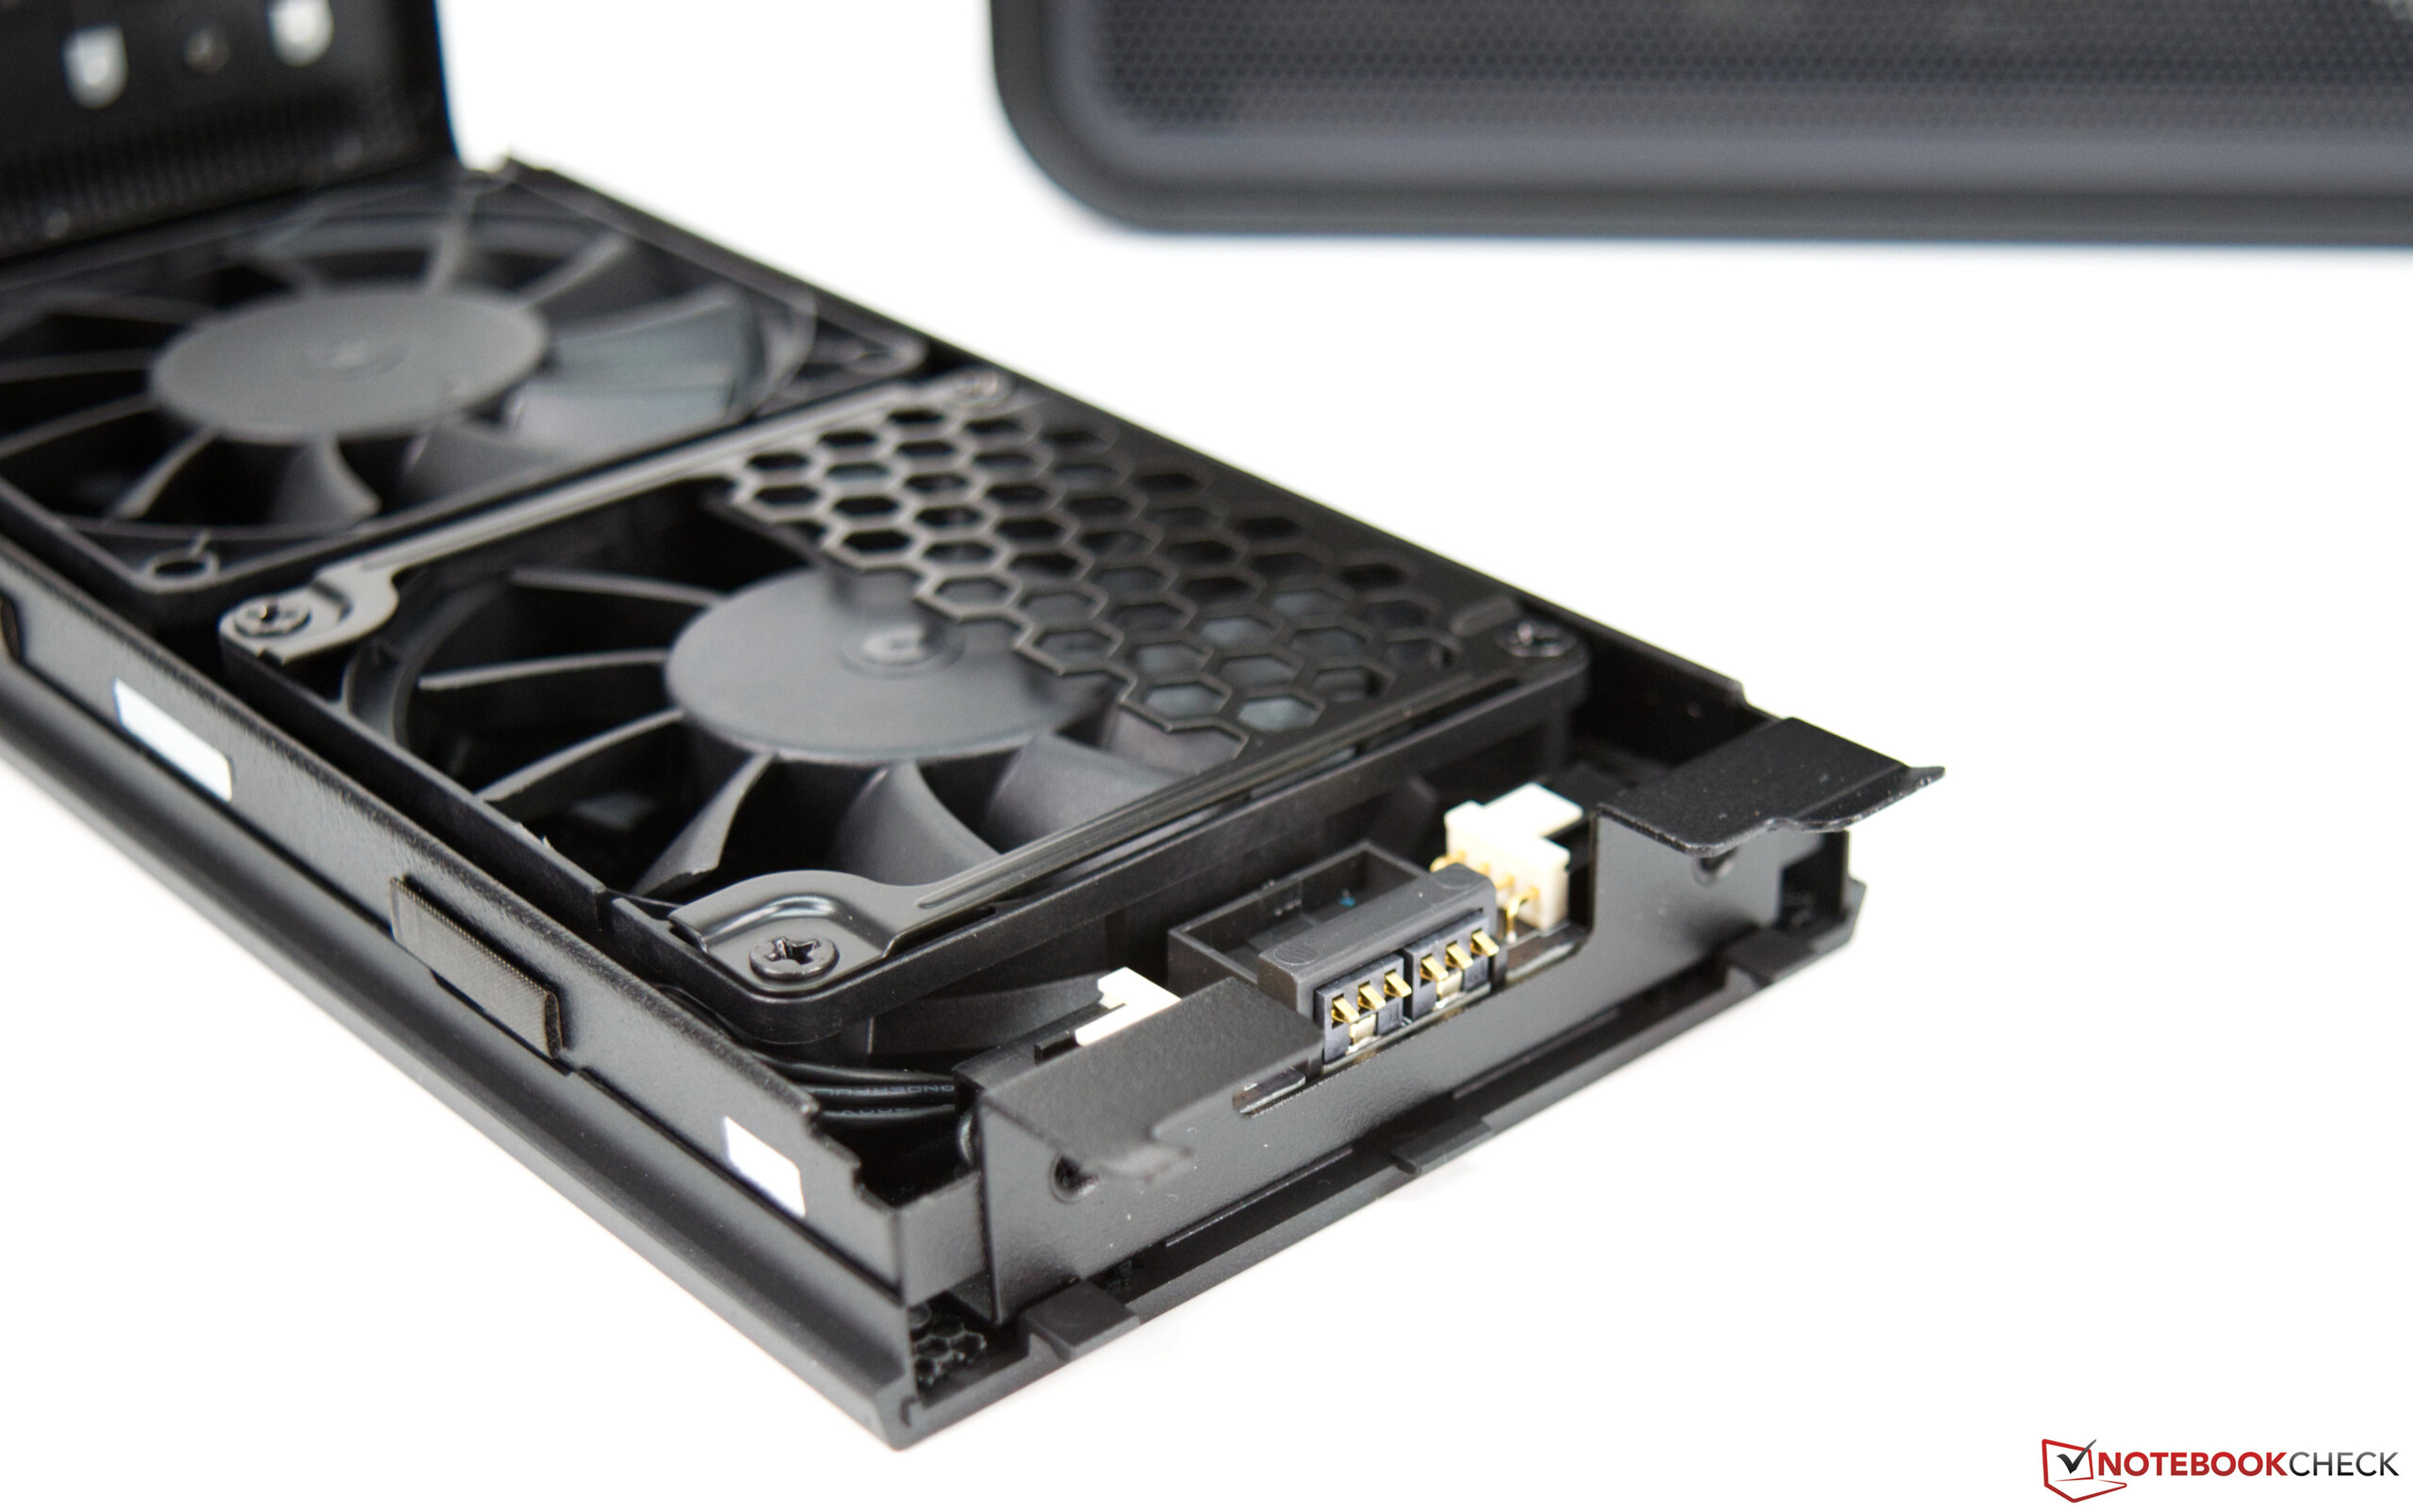
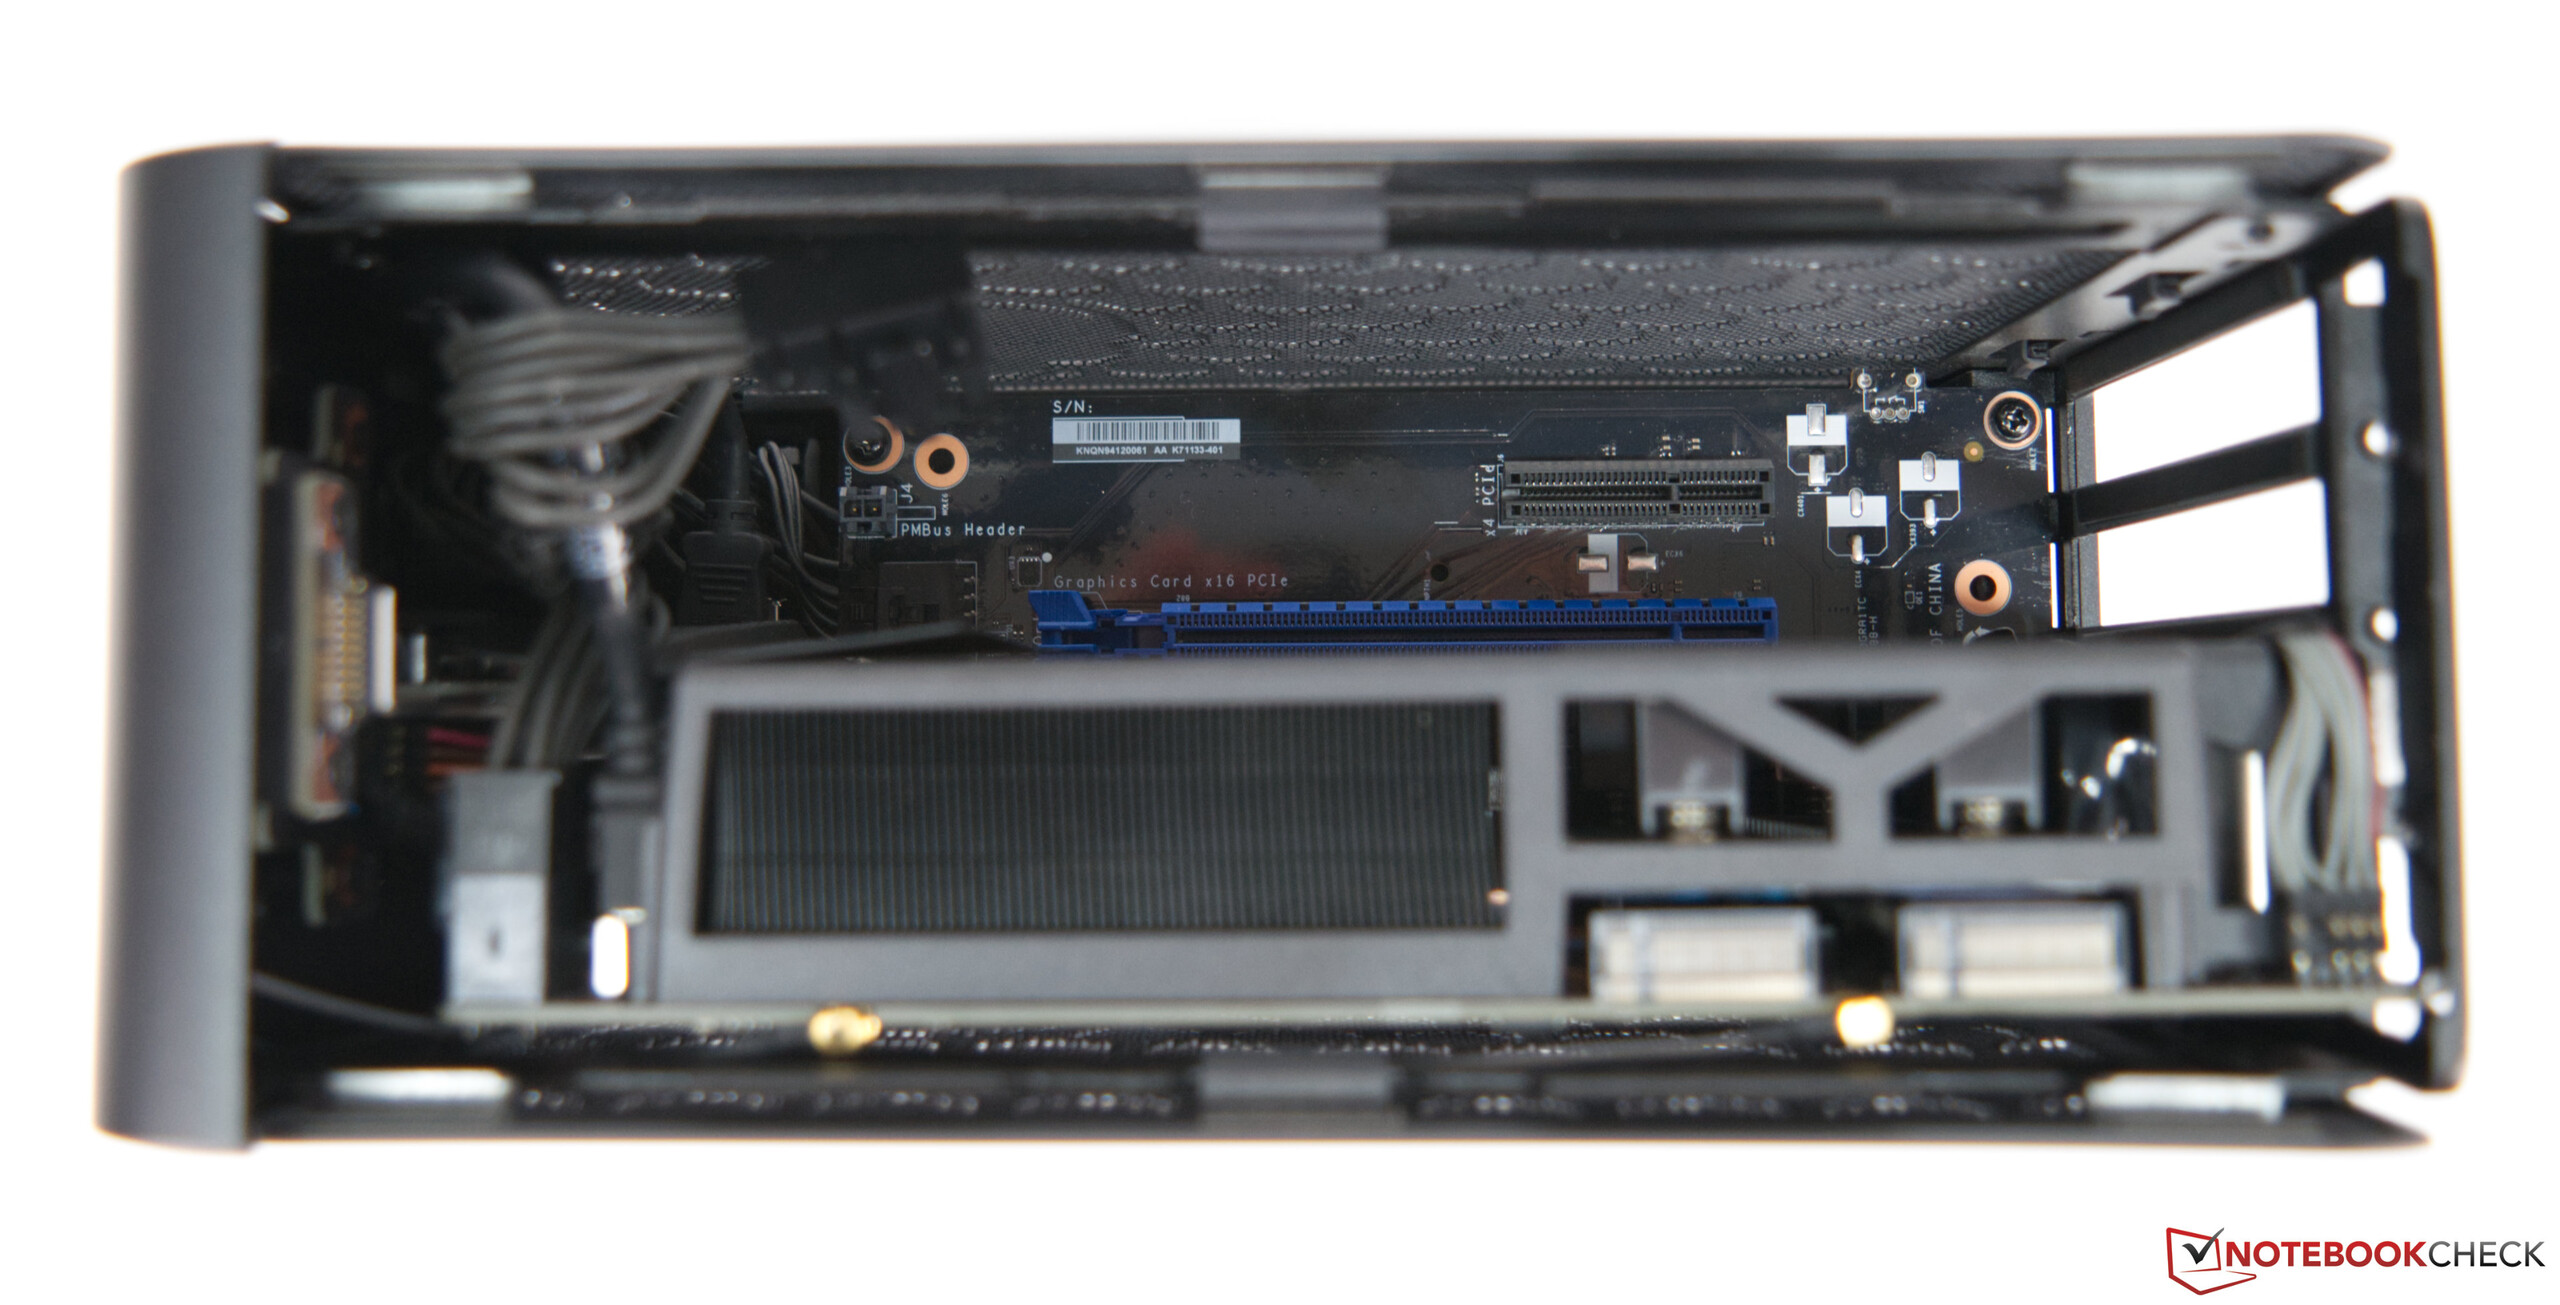
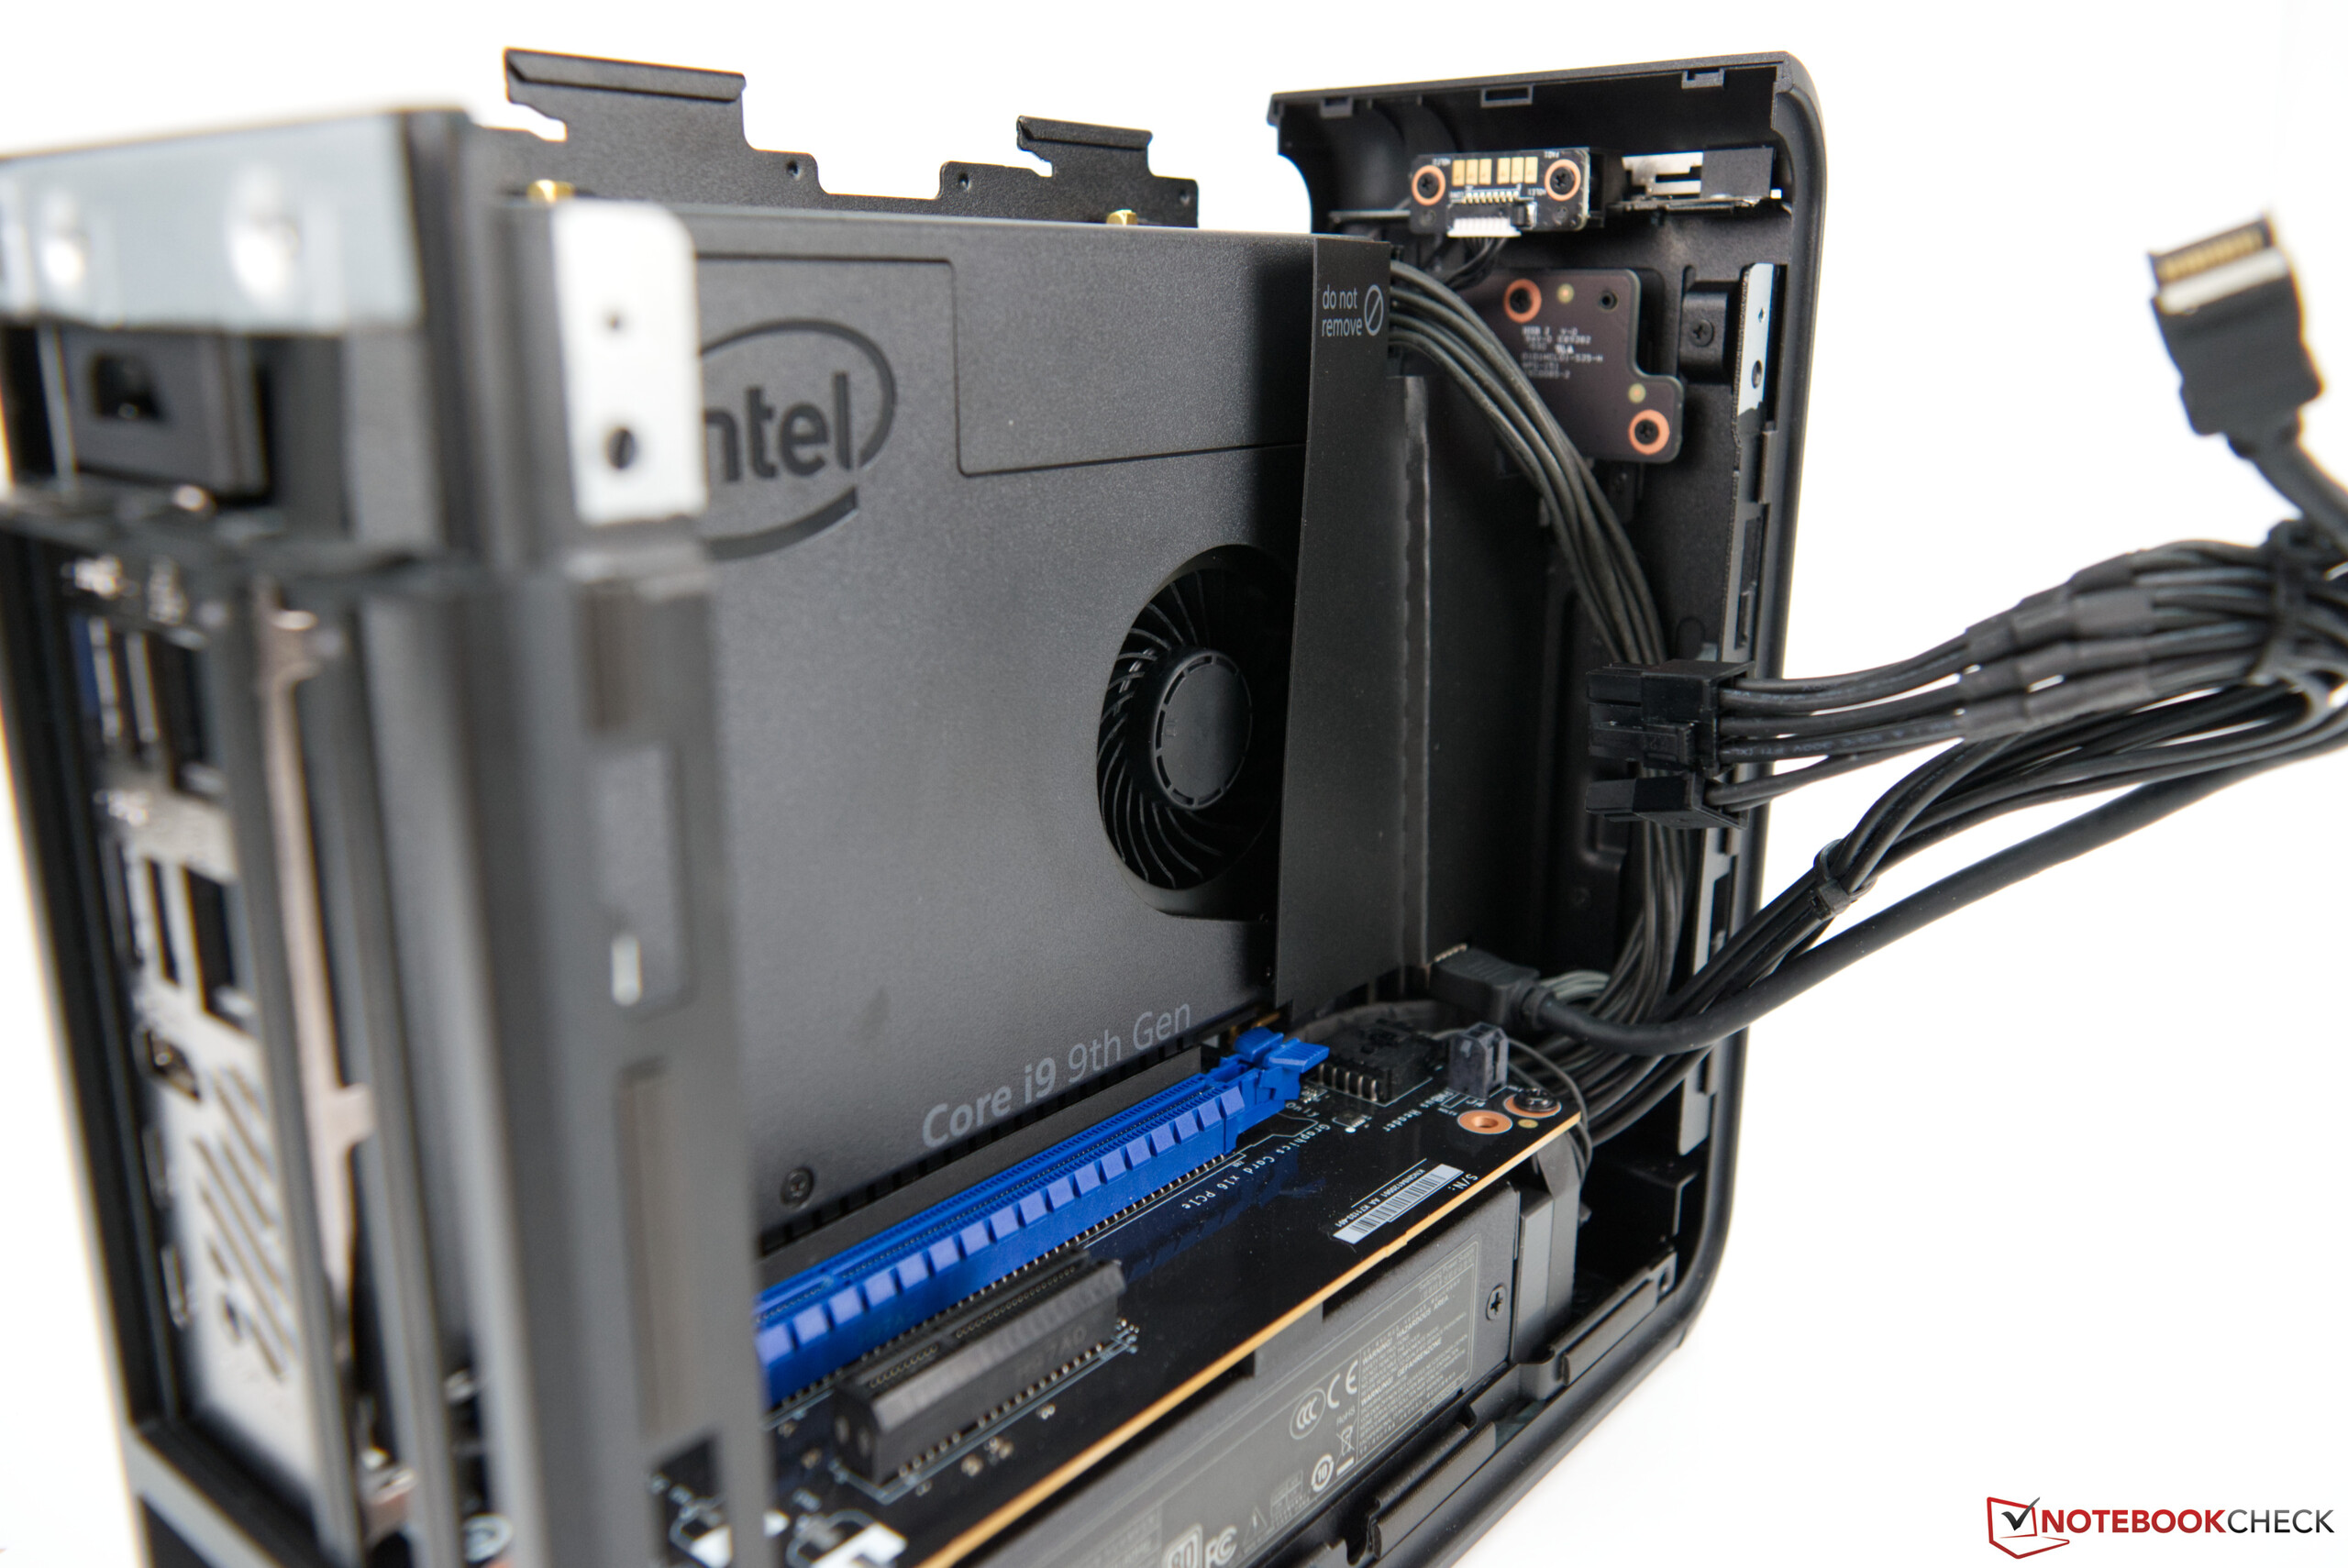
Det finns också en del problem med Intels Ghost Canyon NUC, som i synnerhet rör ljudnivåerna när ett dedikerat grafikkort är installerat. På grund av den kompakta konstruktionen är fläkten i det här höljet nästan helt täckt och luften som blåser på processorns värmerör är redan varm tack vare fläktens närhet till grafikkortet. Detta ökar i sin tur ljudnivån dramatiskt. En lite annorlunda design med fläkten på höljets utsida hade troligen varit ett bättre alternativ.
Allt som allt är Intels NUC 9 Extreme den minsta PC:n under 5 liter som klarar av ett GeForce RTX 2070. Både komponenter och konstruktion håller hög kvalitet. Corsair har tagit en liknande approach med sin likvärdigt prissatta (jämfört med en fullt utrustad Intel Ghost Canyon NUC 9 Extreme) One-serie, som vi recenserat tidigare (se One i160). Zotacs MEK Mini är ytterligare en miniatyr-PC som går att utrusta med ett RTX 2070.
