Utlåtande - faller lite kort mot Dell
HP ZBook Fury G1i 18 har några anmärkningsvärda fördelar jämfört med Dell Pro Max 18 Plus. Den går svalare, är något tunnare och lättare, inkluderar RGB-belysning per tangent och faktiska musknappar, och den levereras med en snabbare 165 Hz-skärm med mindre märkbar spökbild. Samtidigt är hårdvaran byggd lika robust, om inte mer mångsidig, med bredare gångjärn och en "verktygslös" bottenpanel för enklare service.
Tyvärr finns det flera nackdelar som hindrar HP från att vara den ultimata 18-tums mobila arbetsstationen. Kanske mest anmärkningsvärt är att dess CPU och GPU körs något men genomgående långsammare än på Dell när båda är konfigurerade med identiska processorer. Dell Pro Max 18 Plus går varmare samtidigt som den riktar in sig på en högre TGP på 175 W för mer prestanda. Batteritiden och fläktljudet för HP är inte nödvändigtvis längre respektive tystare, trots prestandaskillnader mellan de två modellerna. Dell-maskinen är också mer optimerad för AI-arbetsbelastningar med sitt CAMM2-RAM med högre kapacitet och flyttbara DGFF som kan bytas ut mot en diskret Qualcomm inference NPU. Prestandajägare kan därför hitta mer värde i Dell-maskinen.
För
Emot
Pris och tillgänglighet
HP levererar nu ZBook Fury G1i 18 från $5660 för baskonfigurationen upp till över $10000 om den konfigureras med Core Ultra 9 285HX och Nvidia RTX Pro 5000 Blackwell.
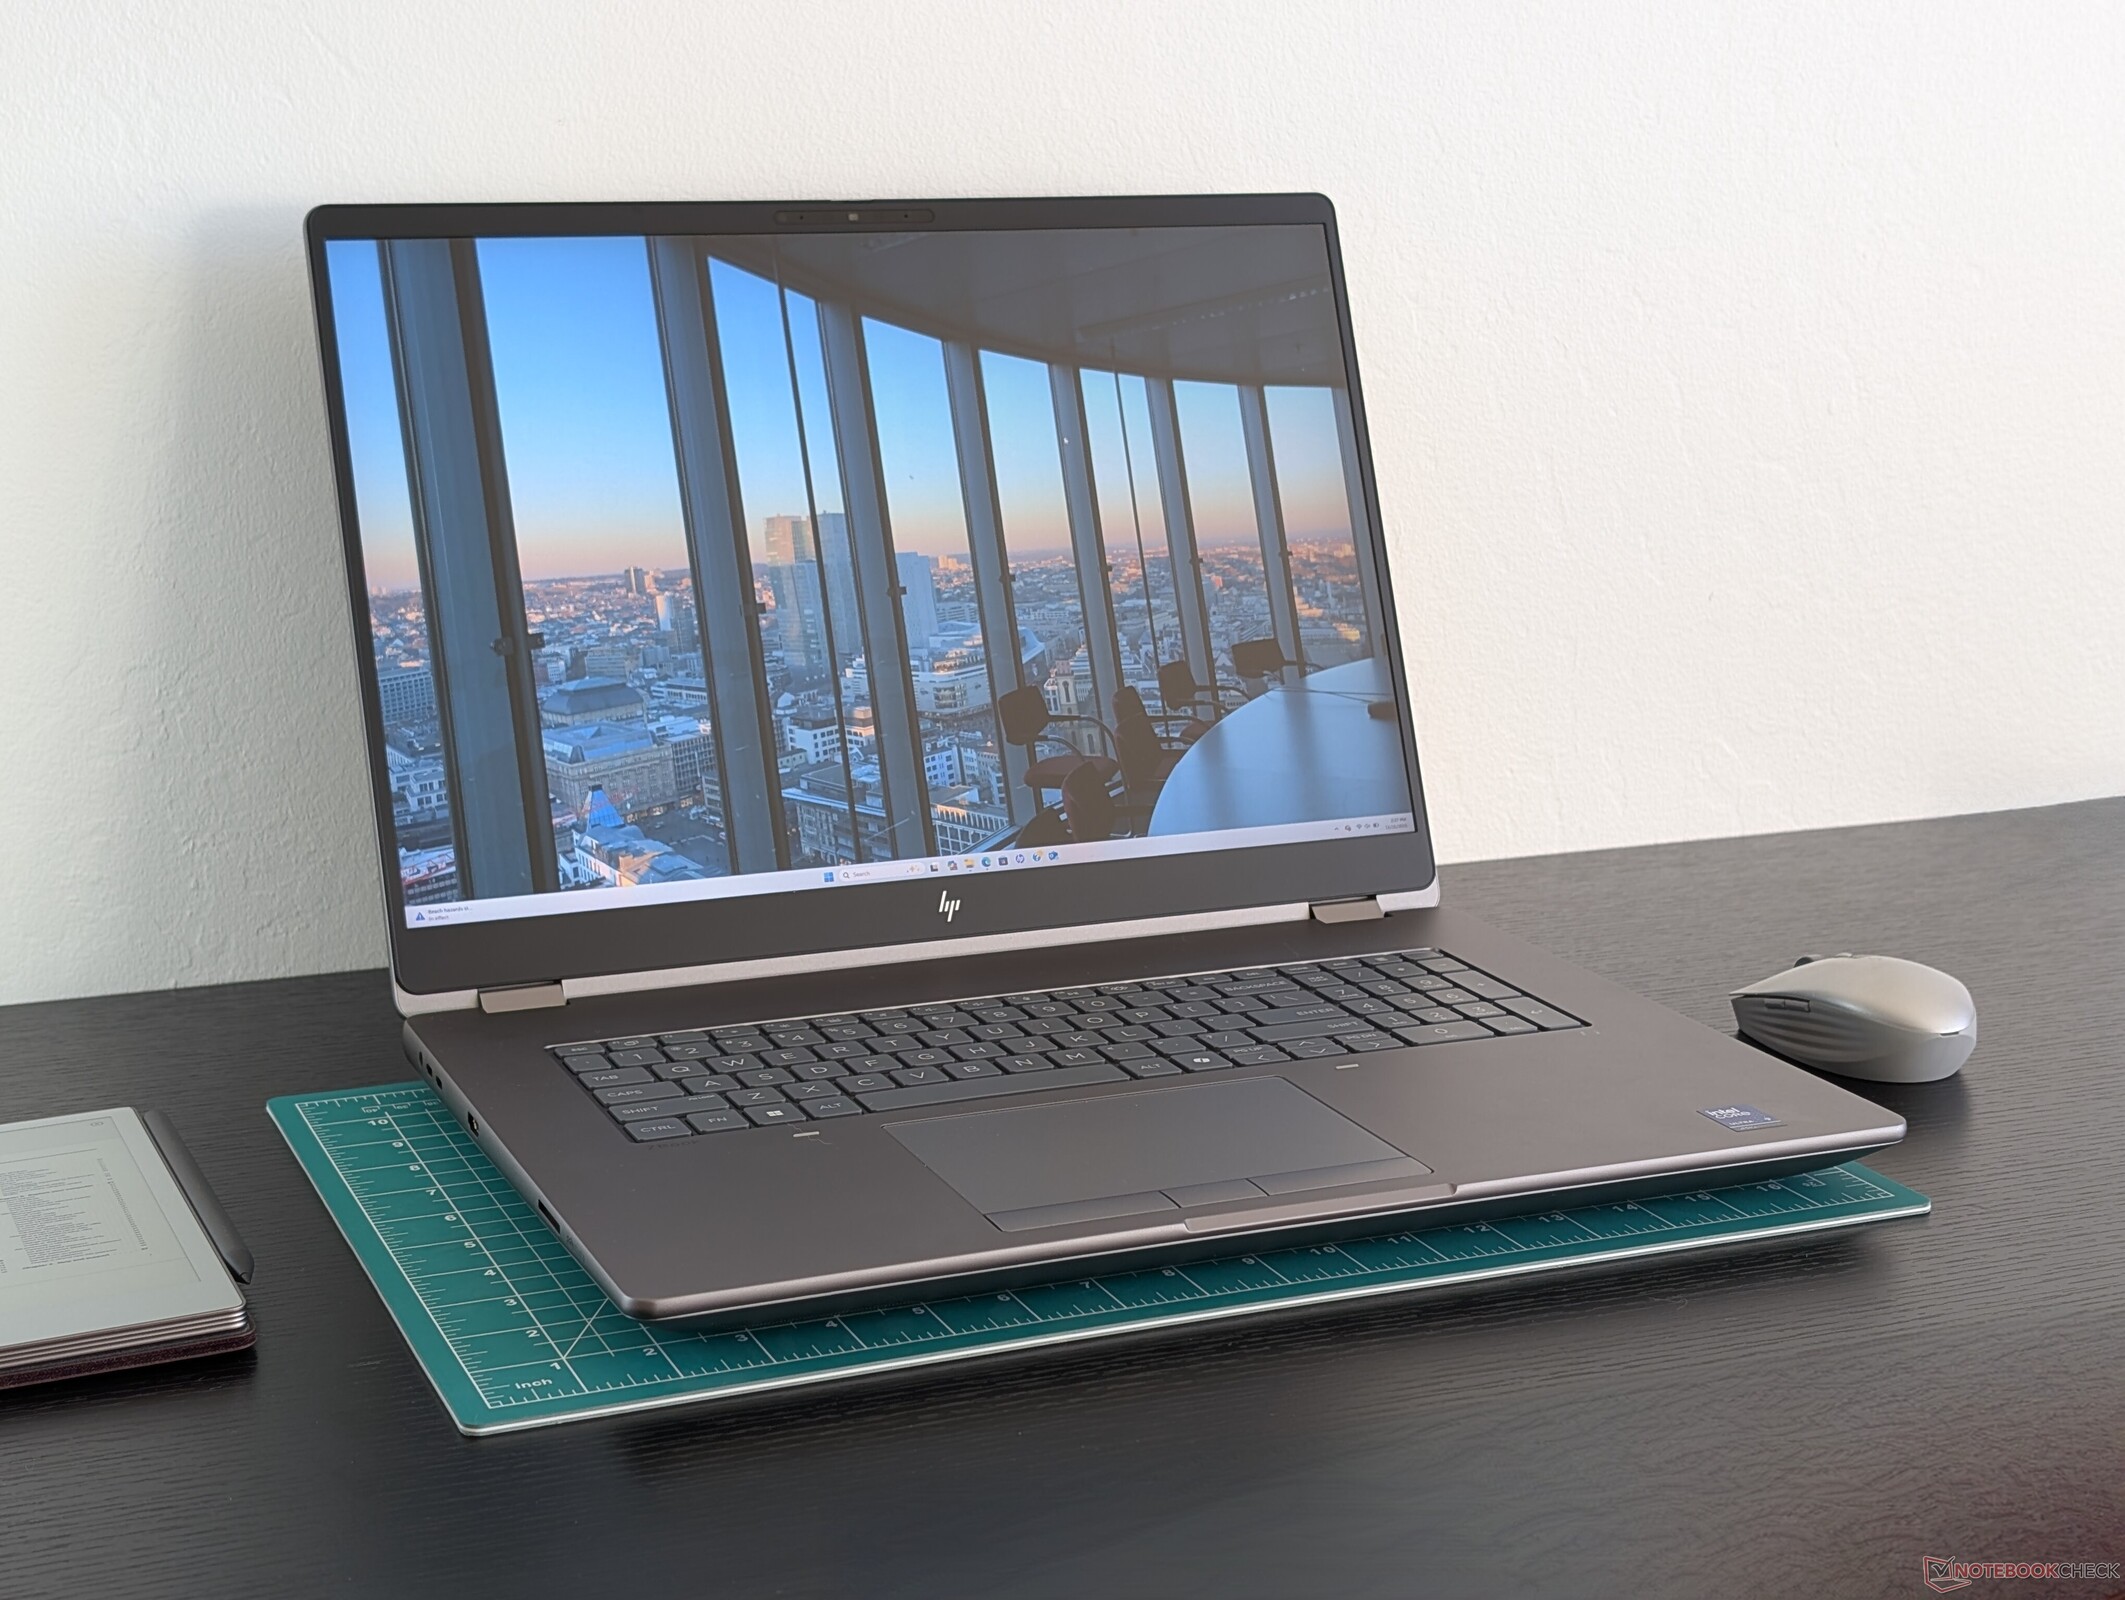
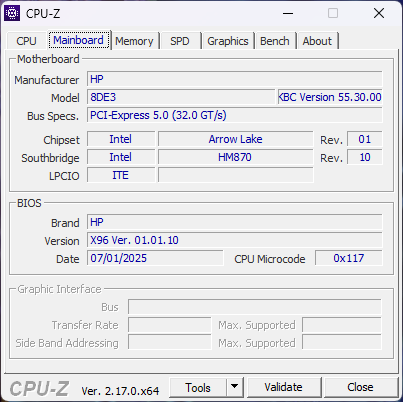
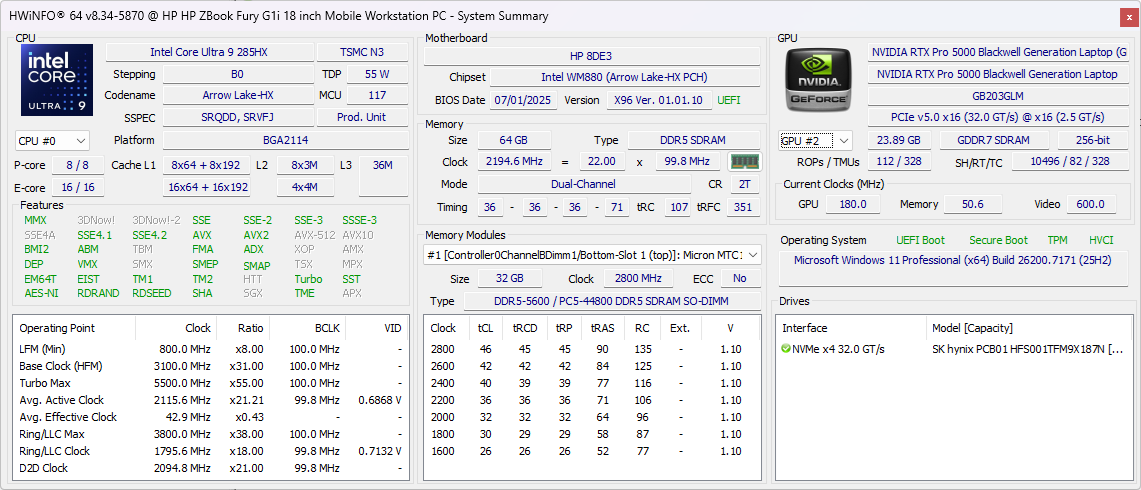
ZBook Fury G1i 18 är den första 18-tumsmodellen i Fury-familjen av högpresterande mobila arbetsstationer. Den levereras med de senaste Intel Arrow Lake-HX-processorerna och Nvidia Pro Blackwell GPU:er för att vara en av de mest kraftfulla i kategorin.
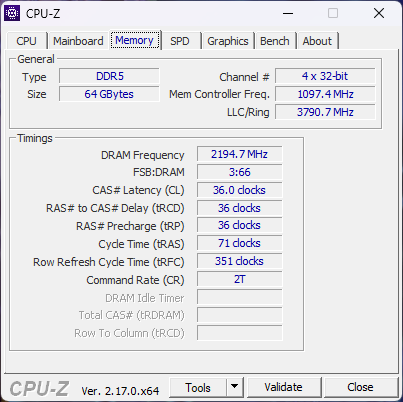
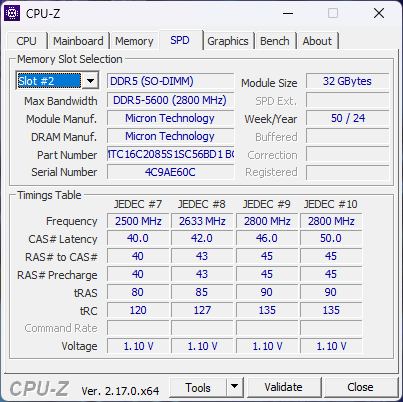
Vår specifika testenhet har konfigurerats till brädden med Core Ultra 9 285HX CPU, 150 W Nvidia RTX Pro 5000 Blackwell GPU och 64 GB DDR5-5600 RAM för cirka $9000+ i detaljhandeln. Alla SKU:er levereras för närvarande med samma 2560 x 1600p 165 Hz IPS-skärm.
Konkurrerande 18-tums arbetsstationer är långt och få mellan med Dell Pro Max 18 Plus är den enda direkta konkurrenten i skrivande stund. Lenovo, till exempel, erbjuder ännu inte en 18-tums ThinkPad med professionella Nvidia GPU-alternativ.
Fler HP-recensioner:
Specifikationer
Fallet
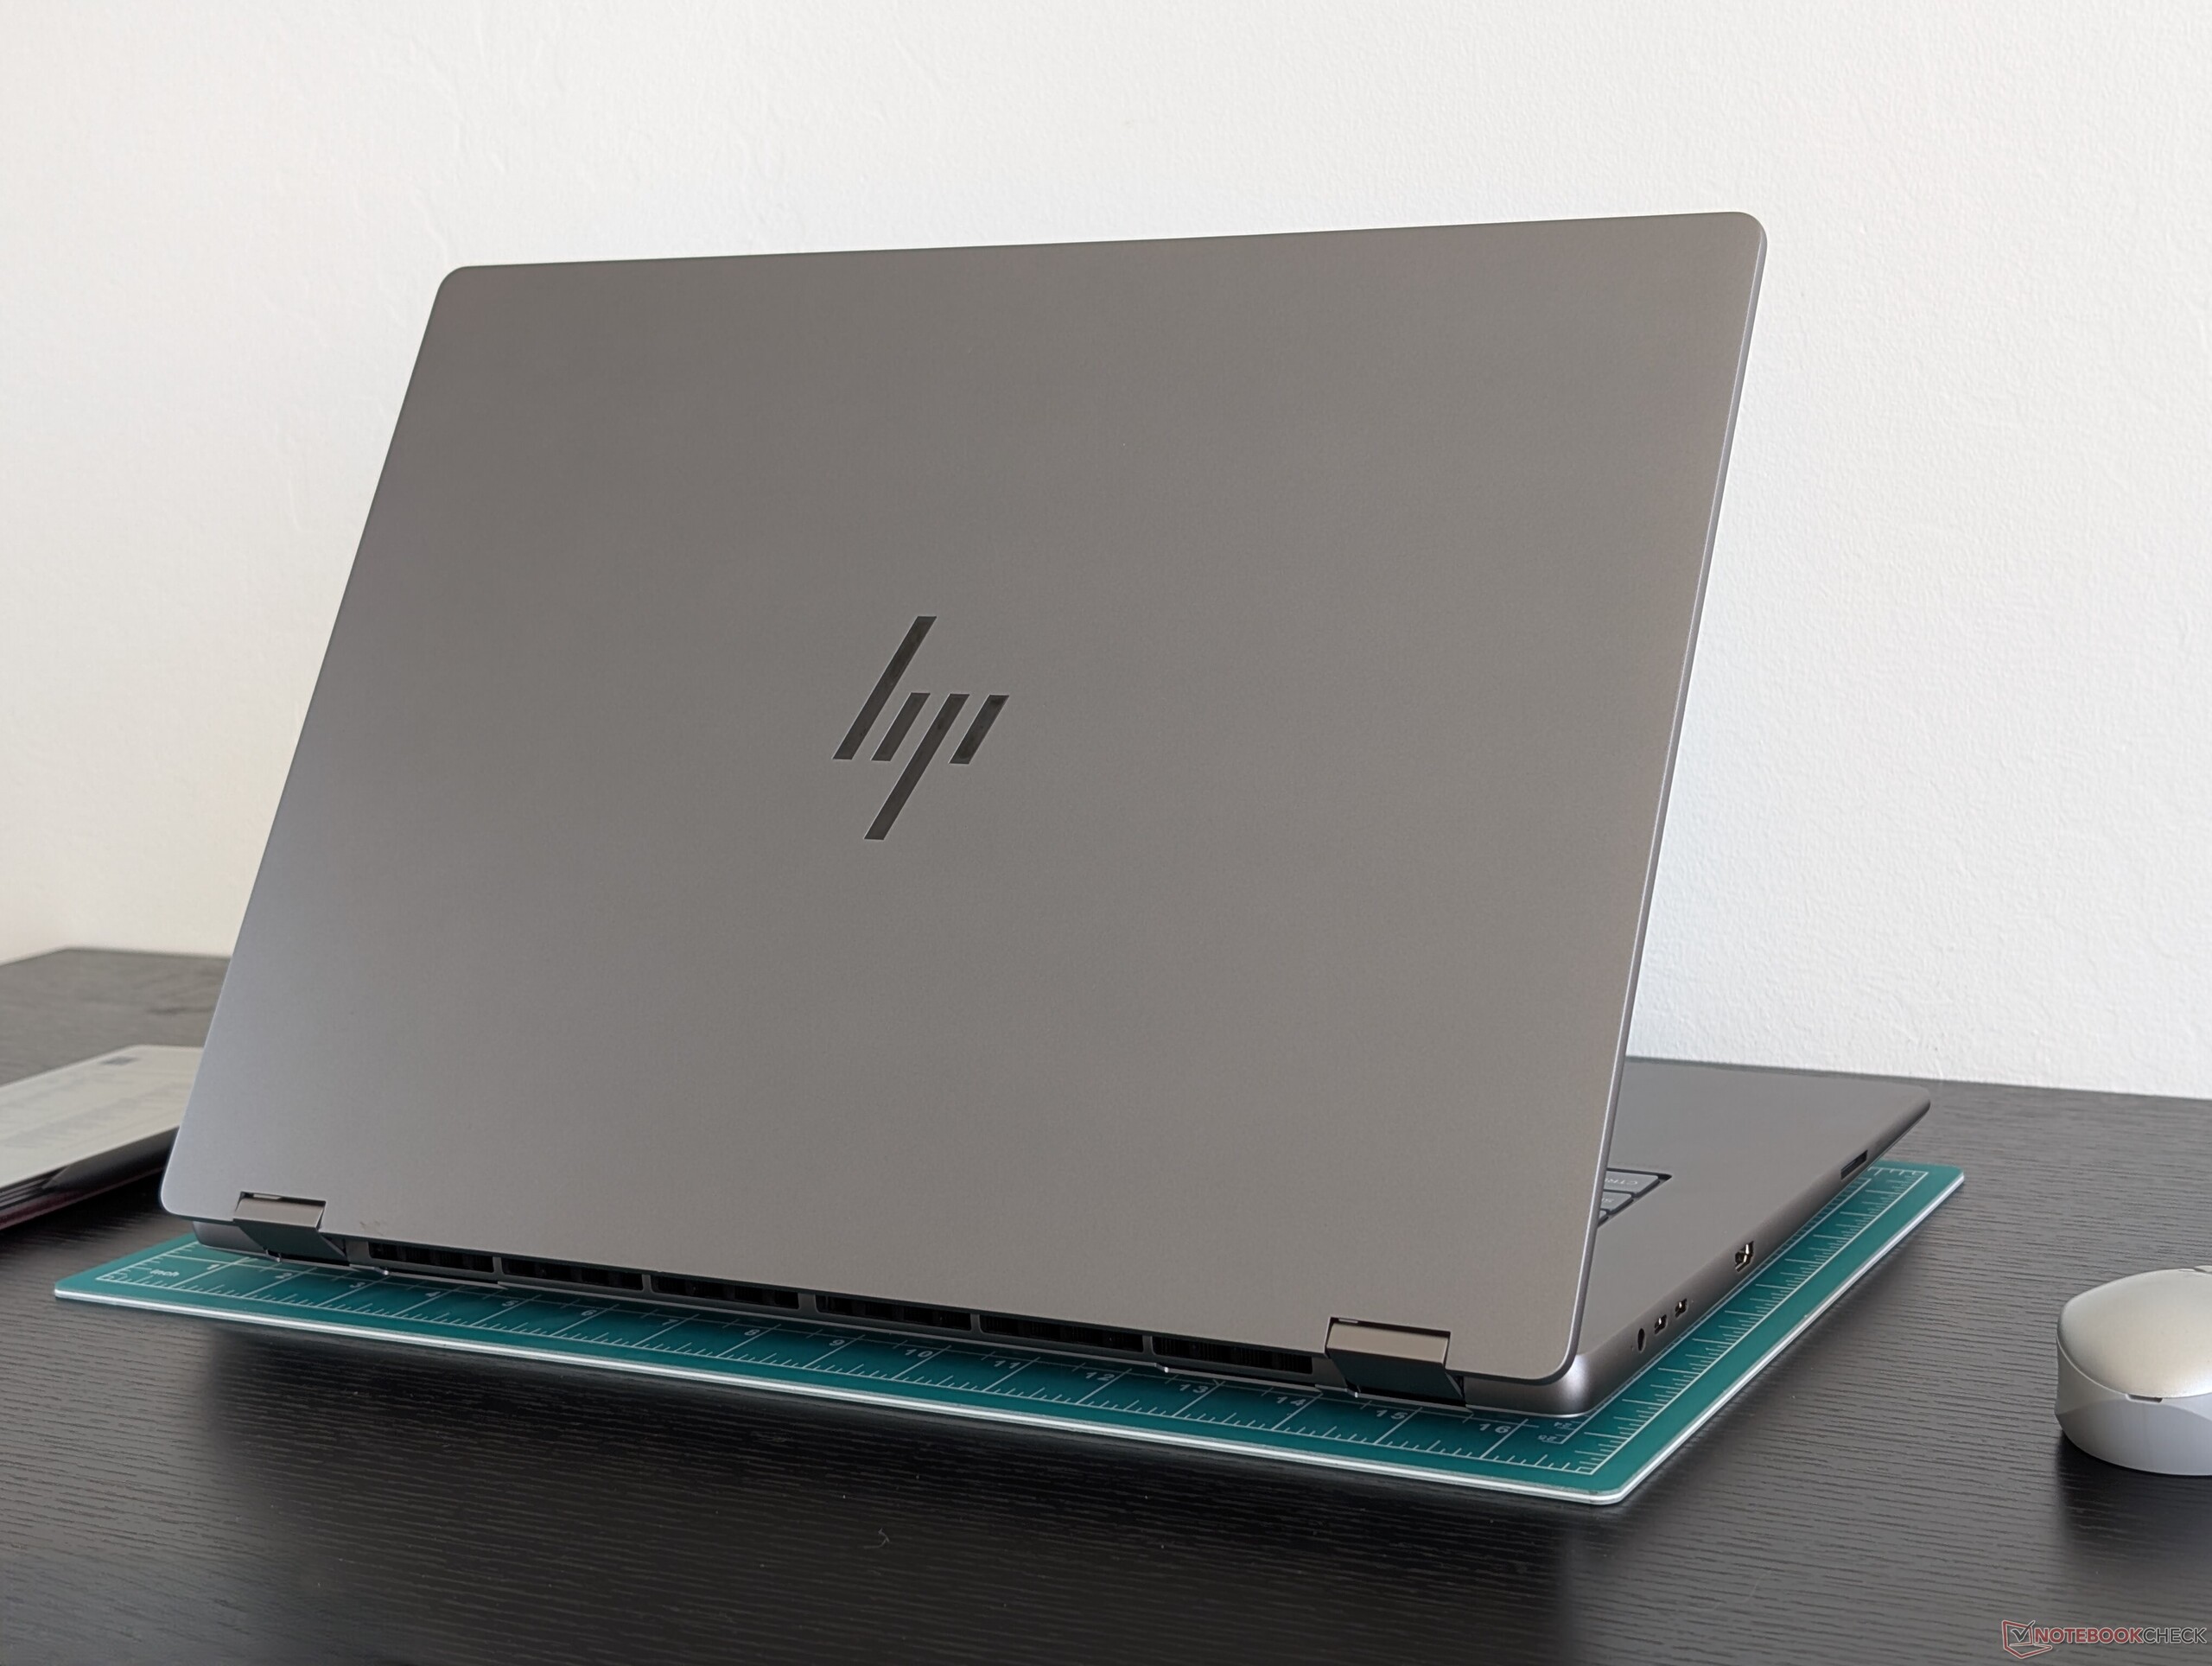
Även om chassit i aluminiumlegering inte är märkbart svagare eller starkare än på Dell Pro Max 18 Plus, är det något tunnare och lättare än Dell samtidigt som det är större i längd och bredd. En anmärkningsvärd fördel för HP är dock att dess skärm kan öppnas hela 180 grader för lite mer mångsidighet.
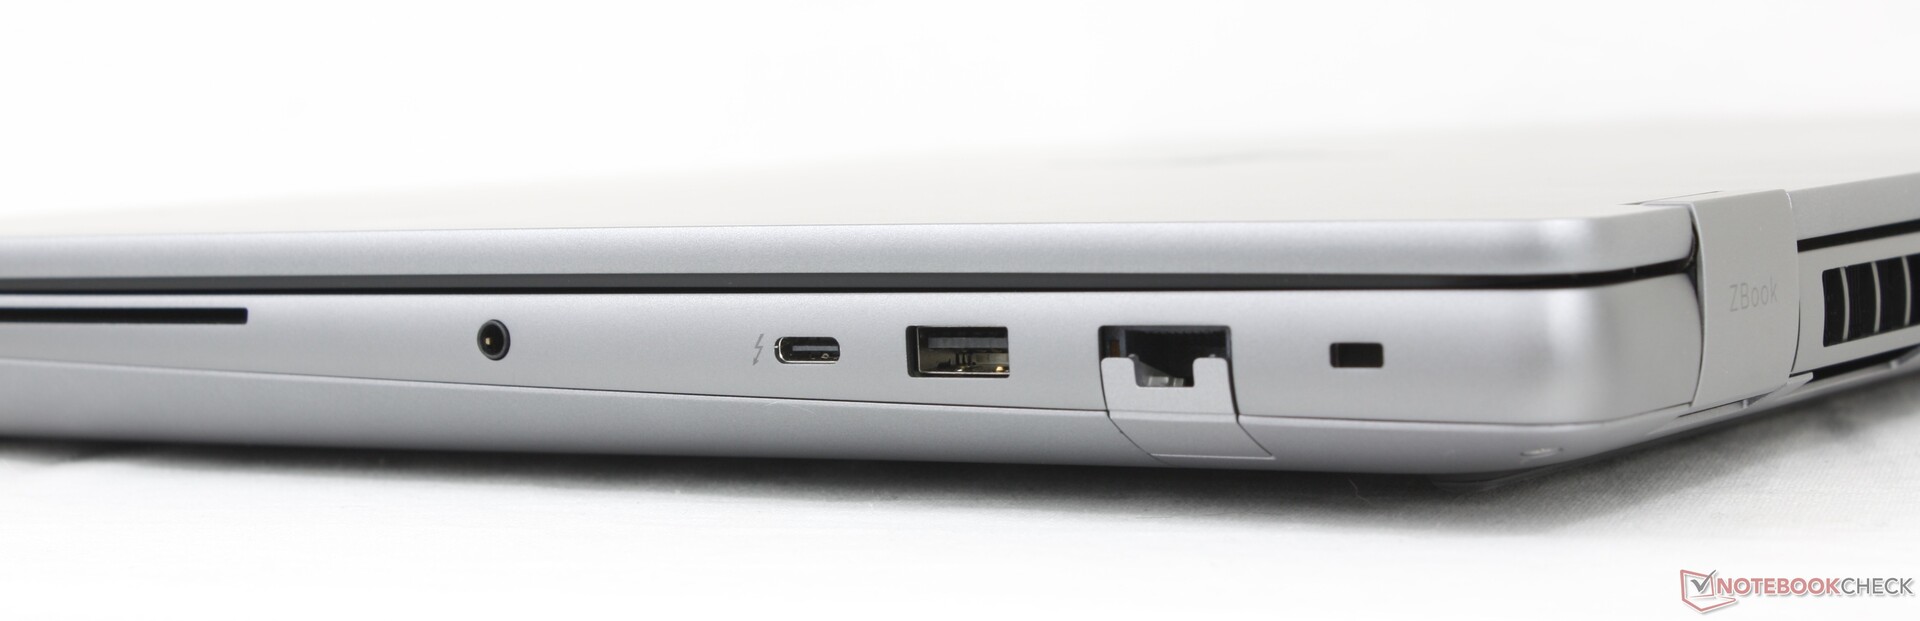
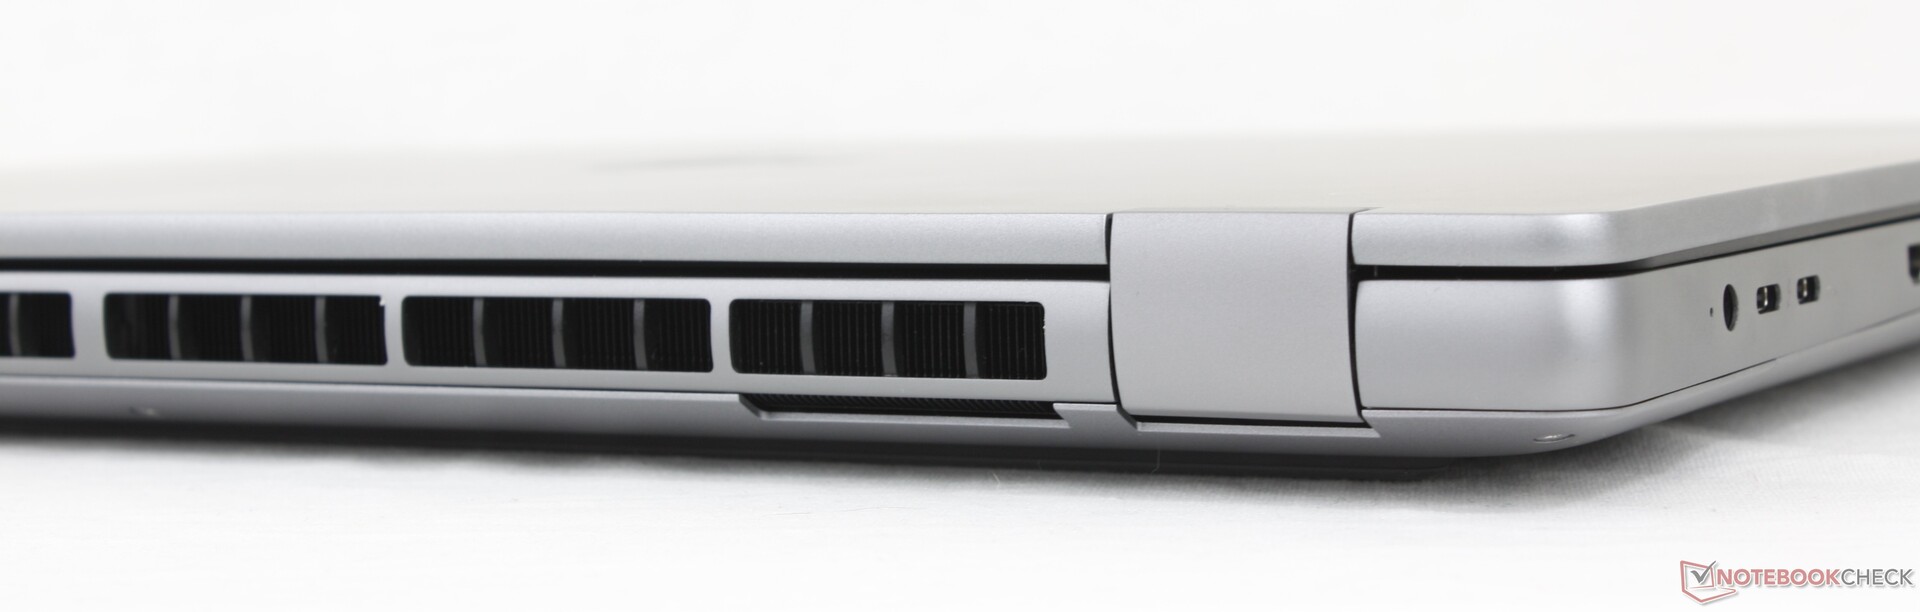
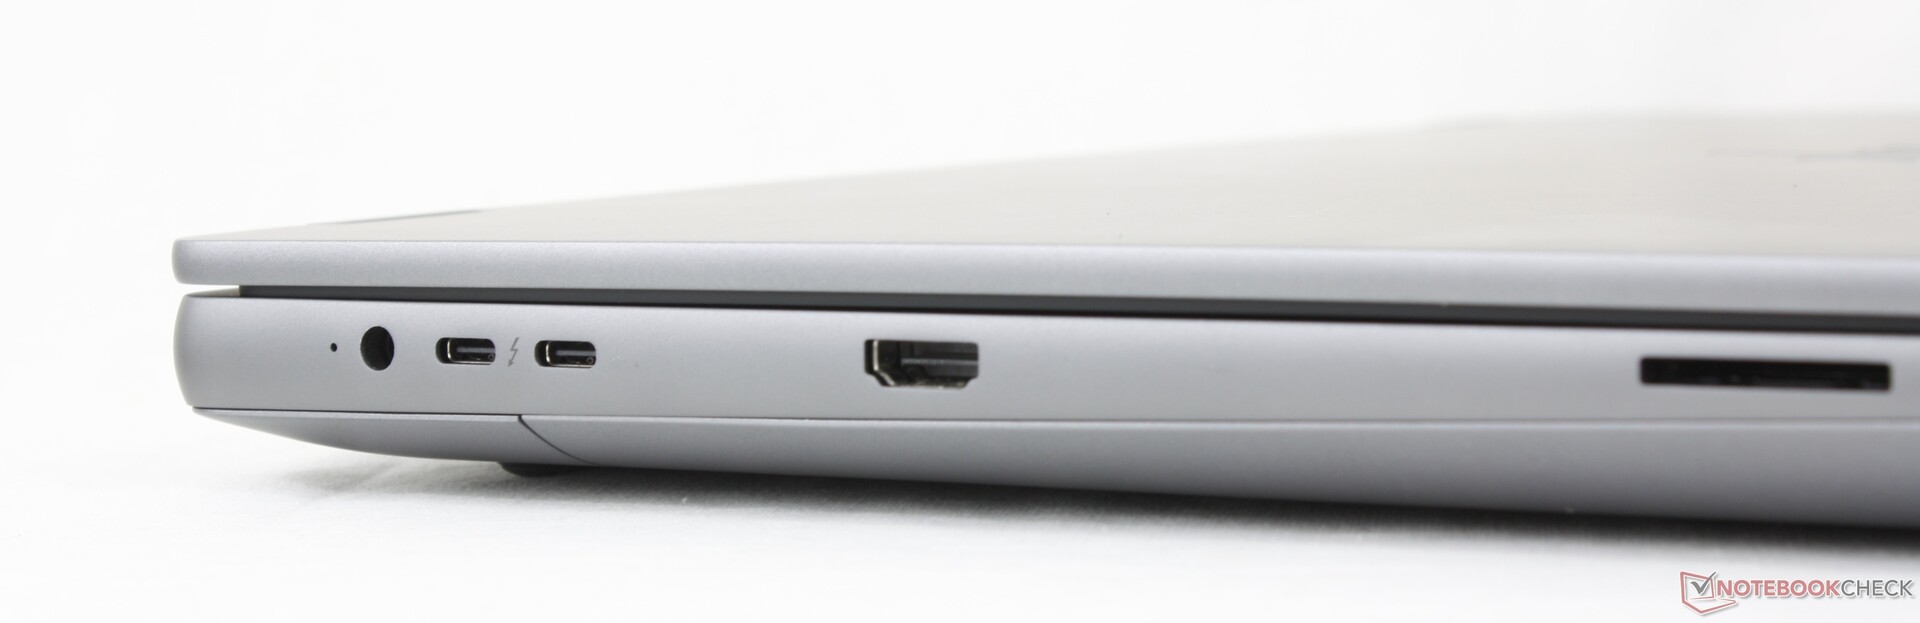
Anslutningsmöjligheter
Modellen har alla portar som finns på Dell Pro Max 18 Plus, om än med en USB-A-port mindre. Vårt främsta klagomål är att de två USB-C-portarna längs den vänstra kanten är för nära AC-adapterporten. Att ansluta flera kablar kan bli trångt som ett resultat.
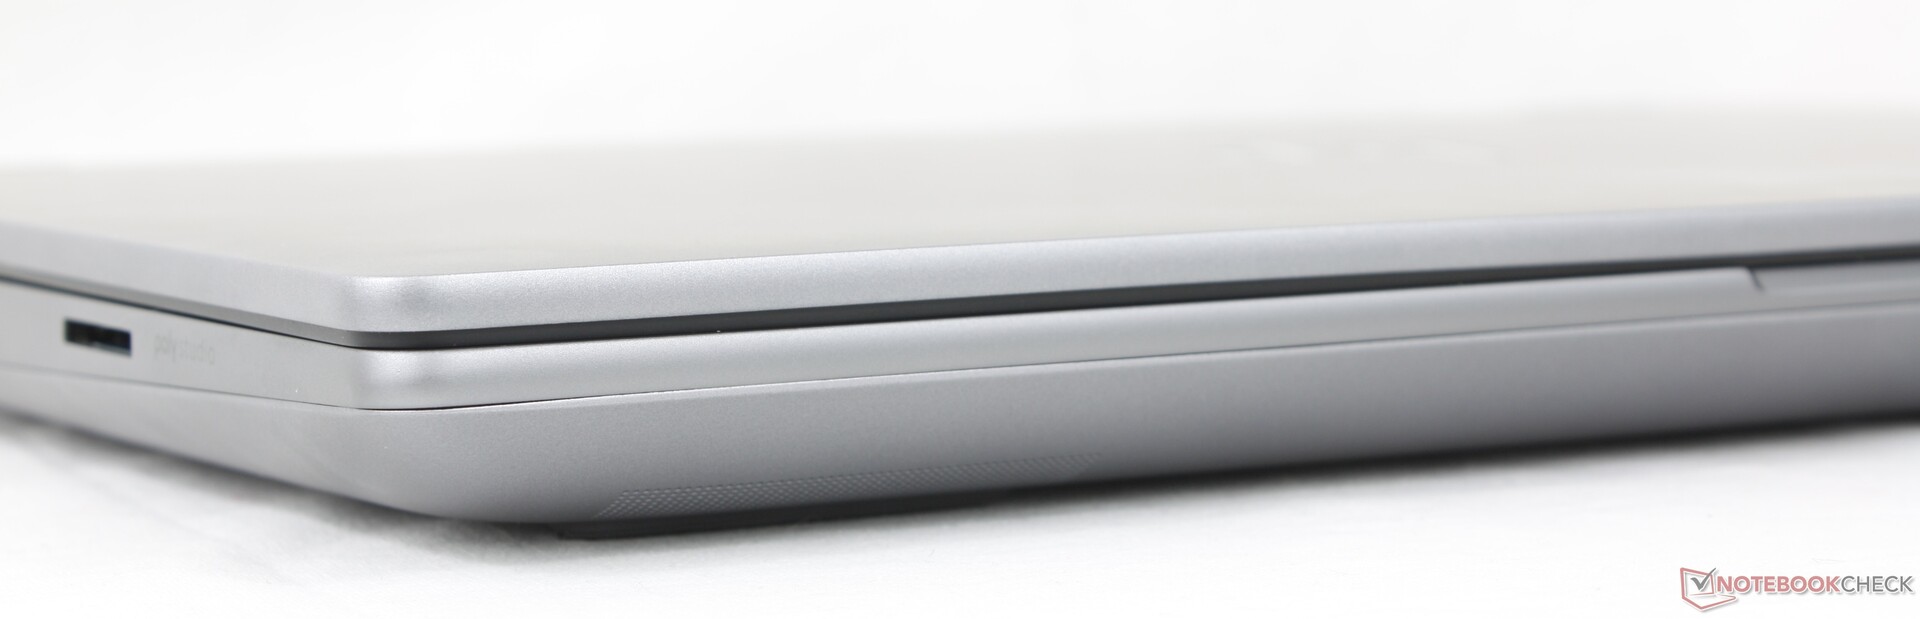
SD-kortläsare
| SD Card Reader | |
| average JPG Copy Test (av. of 3 runs) | |
| HP ZBook X G1i 16 (Toshiba Exceria Pro SDXC 64 GB UHS-II) | |
| Dell Pro Max 18 Plus MB18250 (Toshiba Exceria Pro SDXC 64 GB UHS-II) | |
| HP ZBook Fury G1i 18 (Toshiba Exceria Pro SDXC 64 GB UHS-II) | |
| Lenovo ThinkPad P16 Gen 2 (Toshiba Exceria Pro SDXC 64 GB UHS-II) | |
| Schenker Key 18 Pro M25 RTX 5090 (Angelbird AV Pro V60) | |
| maximum AS SSD Seq Read Test (1GB) | |
| HP ZBook X G1i 16 (Toshiba Exceria Pro SDXC 64 GB UHS-II) | |
| Dell Pro Max 18 Plus MB18250 (Toshiba Exceria Pro SDXC 64 GB UHS-II) | |
| HP ZBook Fury G1i 18 (Toshiba Exceria Pro SDXC 64 GB UHS-II) | |
| Schenker Key 18 Pro M25 RTX 5090 (Angelbird AV Pro V60) | |
| Lenovo ThinkPad P16 Gen 2 (Toshiba Exceria Pro SDXC 64 GB UHS-II) | |
Kommunikation
Webbkamera
En 5 MP-kamera ingår som standard tillsammans med IR och en fysisk slutare. Programvaran Poly Camera Pro, som också ingår i de flesta andra bärbara datorer från HP, är förinstallerad på ZBook Fury för ytterligare funktioner för videokonferenser.


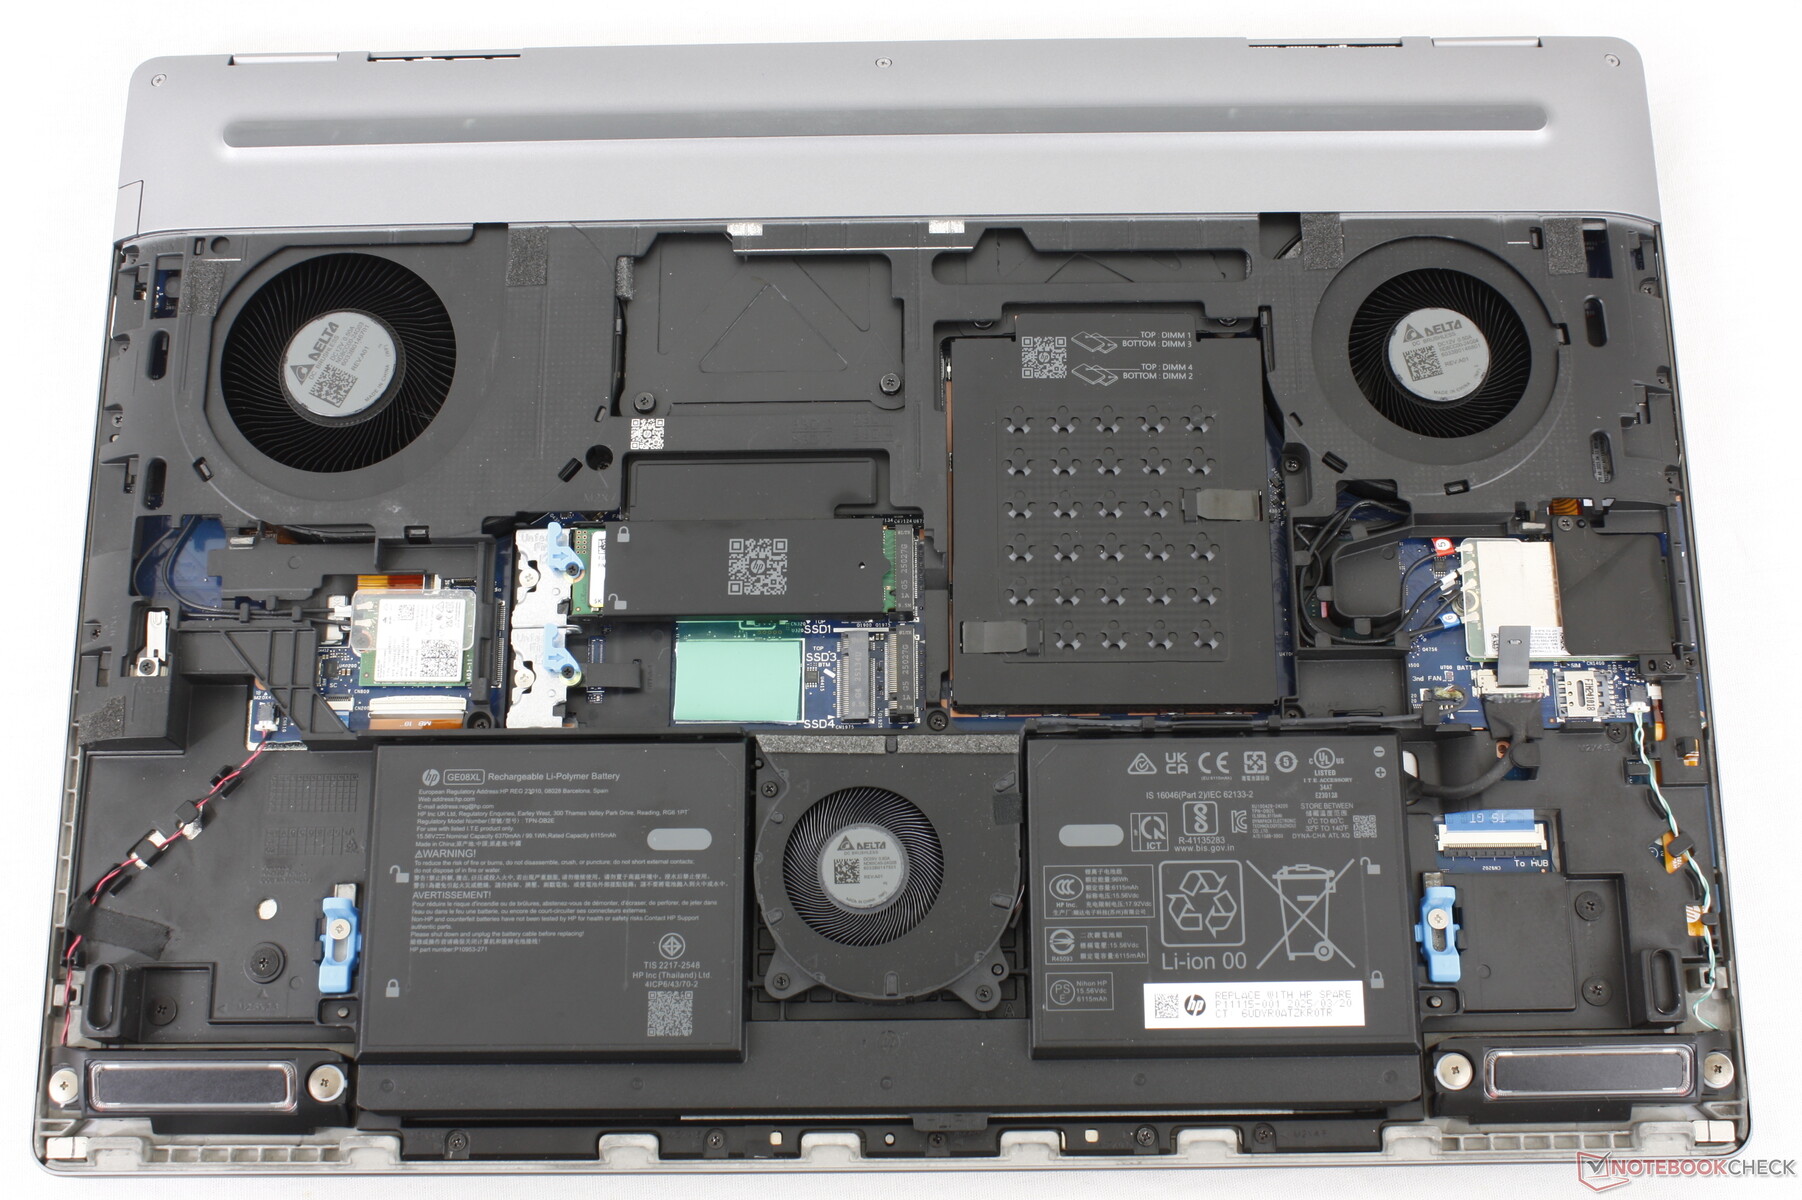
Underhåll
Bottenpanelen är "verktygslös" och kan tas bort utan skruvmejslar. Trots detta är de flesta komponenterna fastskruvade på moderkortet och därför krävs det fortfarande en skruvmejsel för service.
Hållbarhet
40 procent av plasten runt chassit kommer från återvinning efter konsumentanvändning medan förpackningen mestadels består av pappersmassa med lite plastomslag för nätadaptern.
Tillbehör och garanti
Det finns inga extra tillbehör i lådan förutom nätadapter och papper. En besvikelse är att systemet endast levereras med ett års begränsad tillverkargaranti vid beställning från HPs officiella webbplats, istället för de tre år som är brukligt för avancerade arbetsstationer.
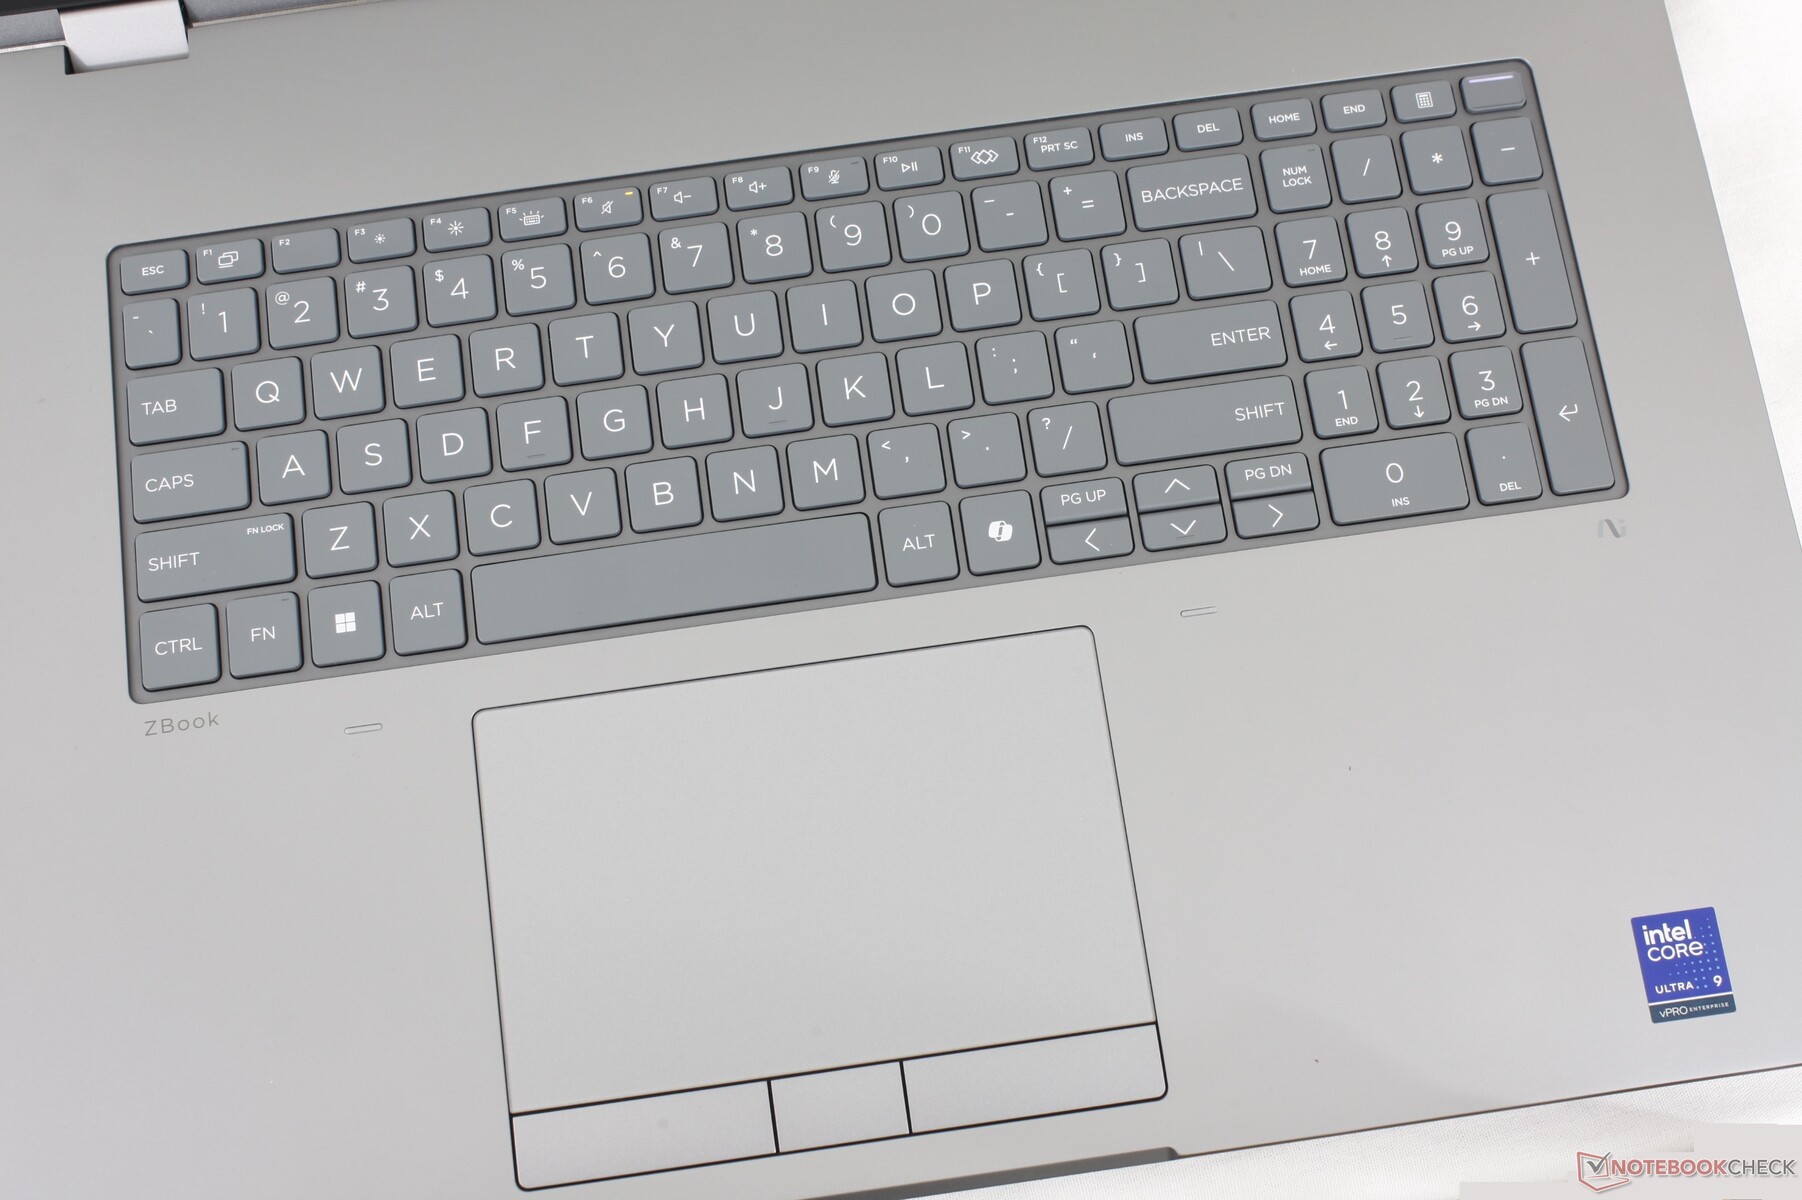
Inmatningsenheter
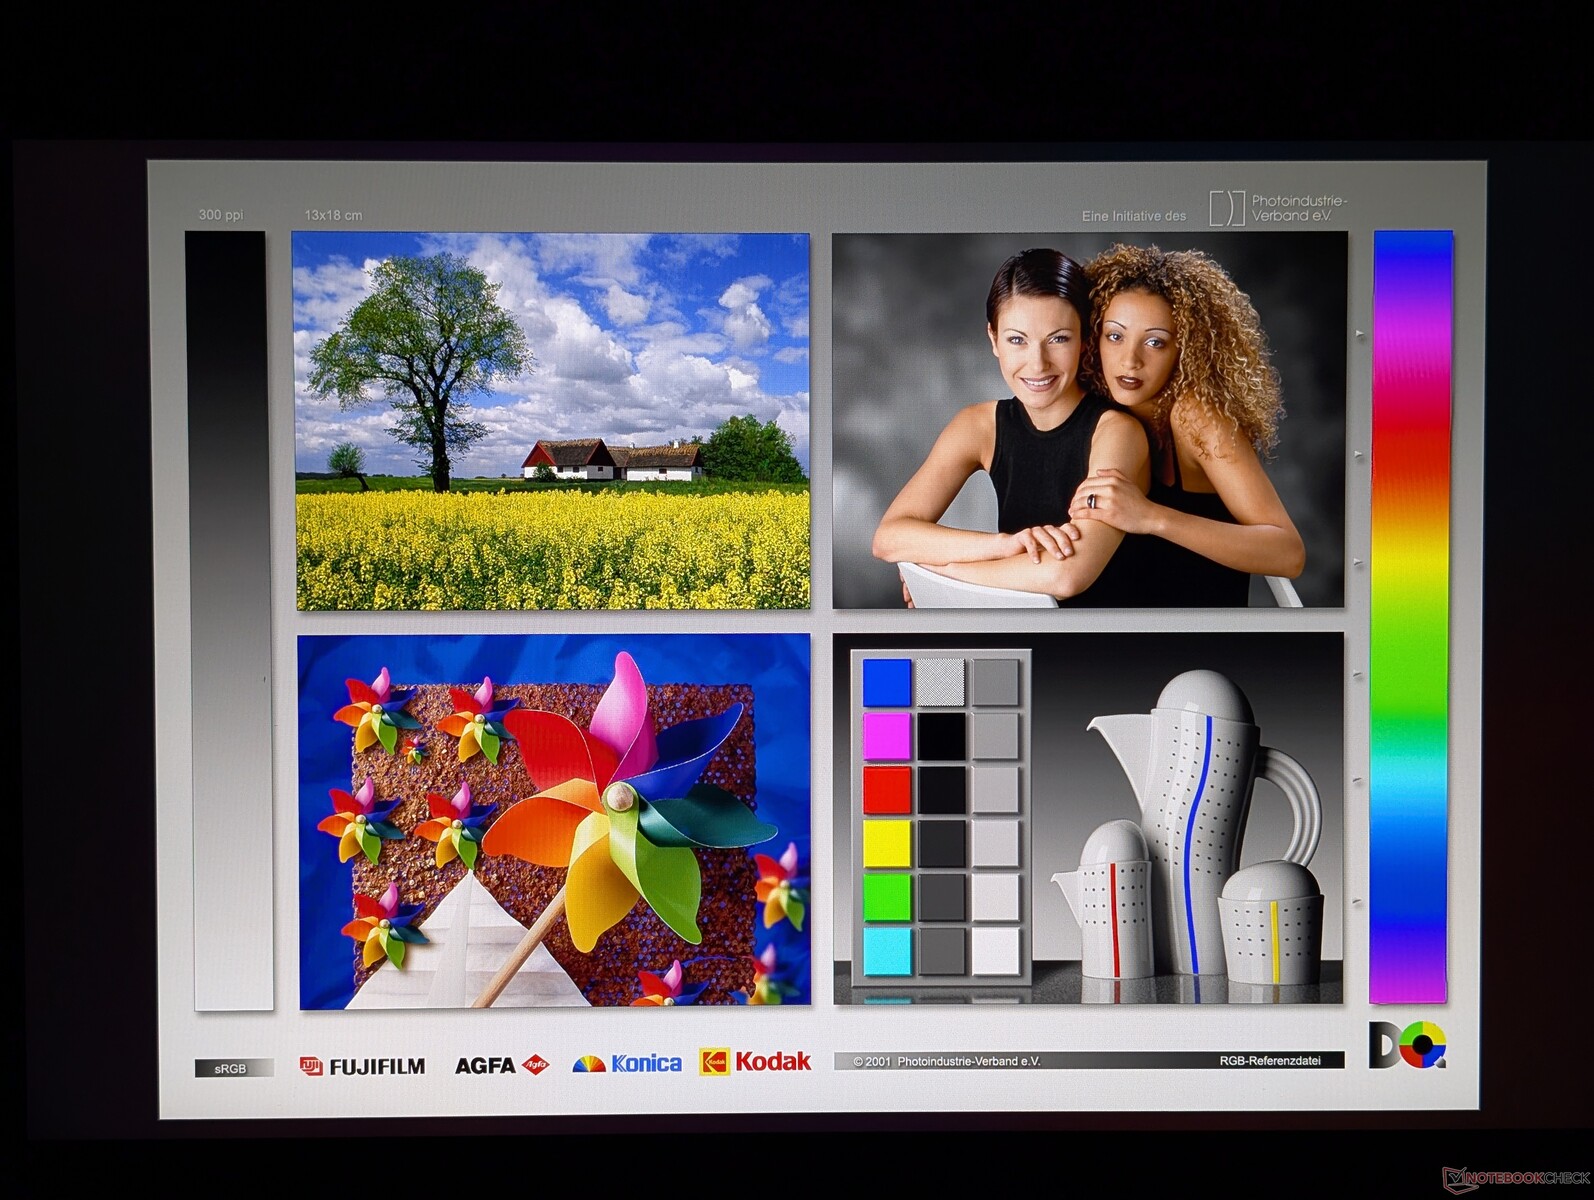
Display - ingen 4K eller OLED för tillfället
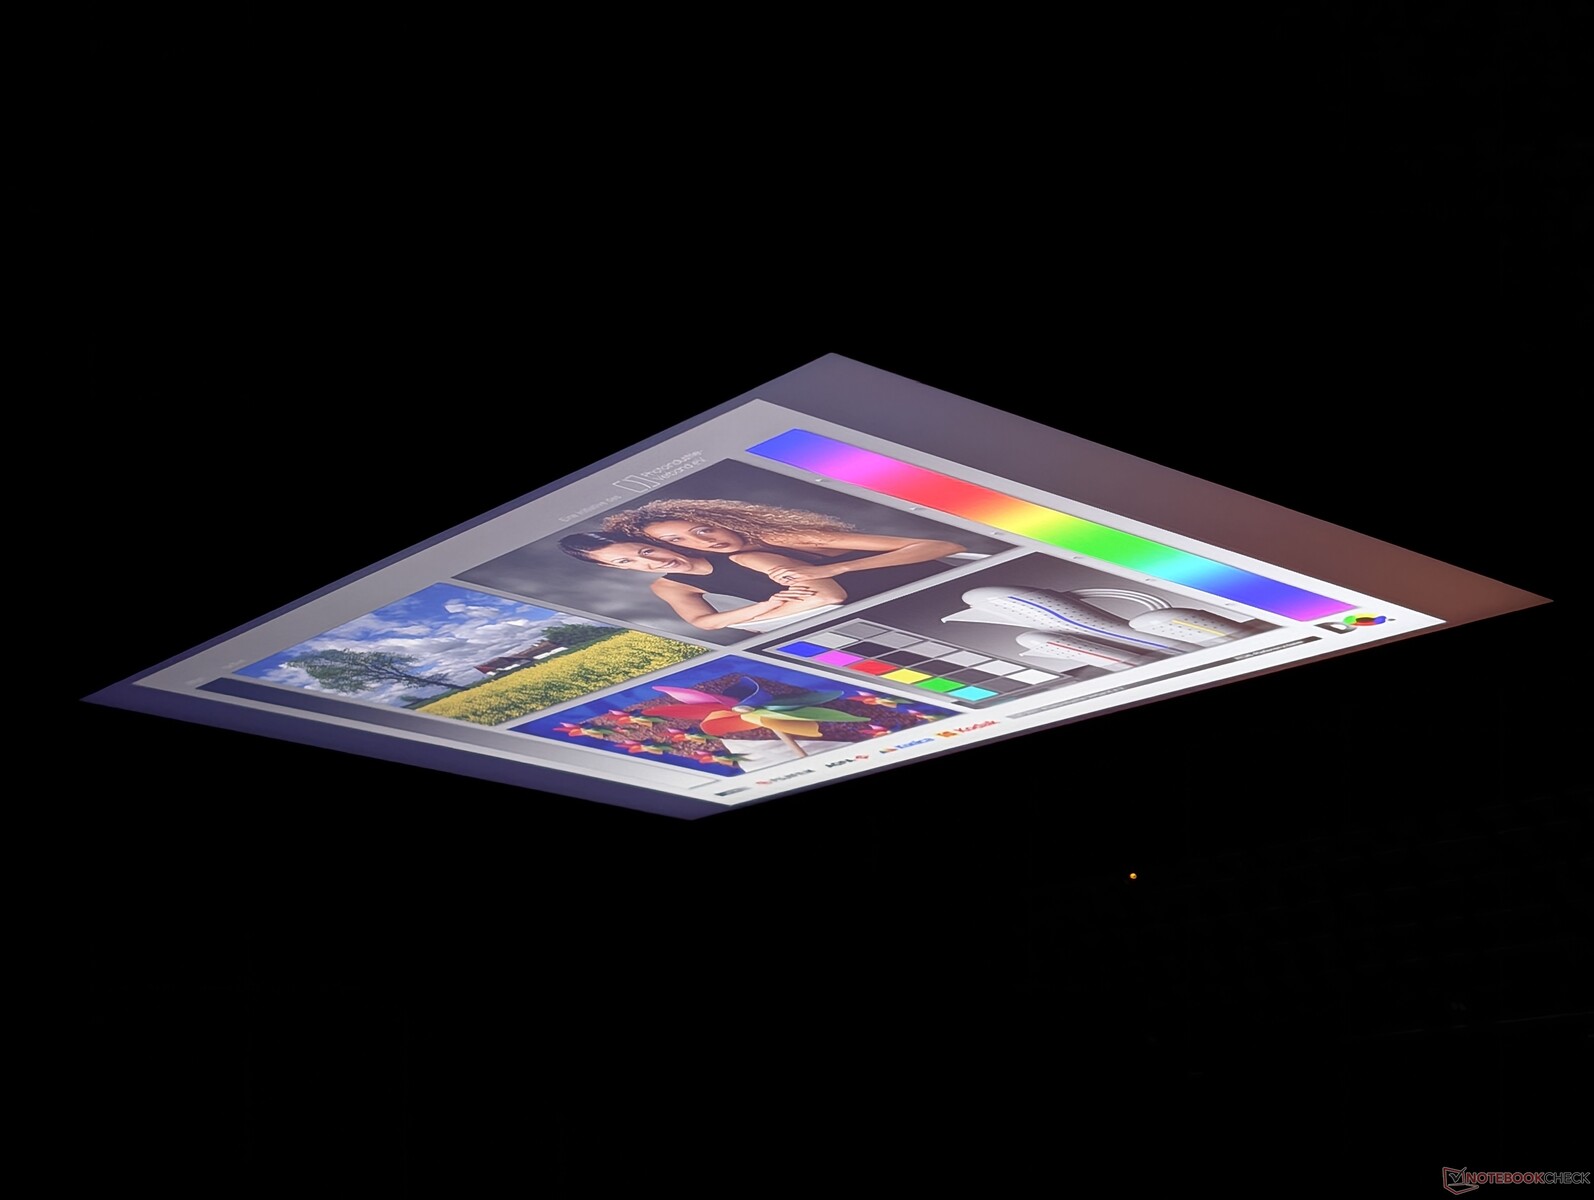
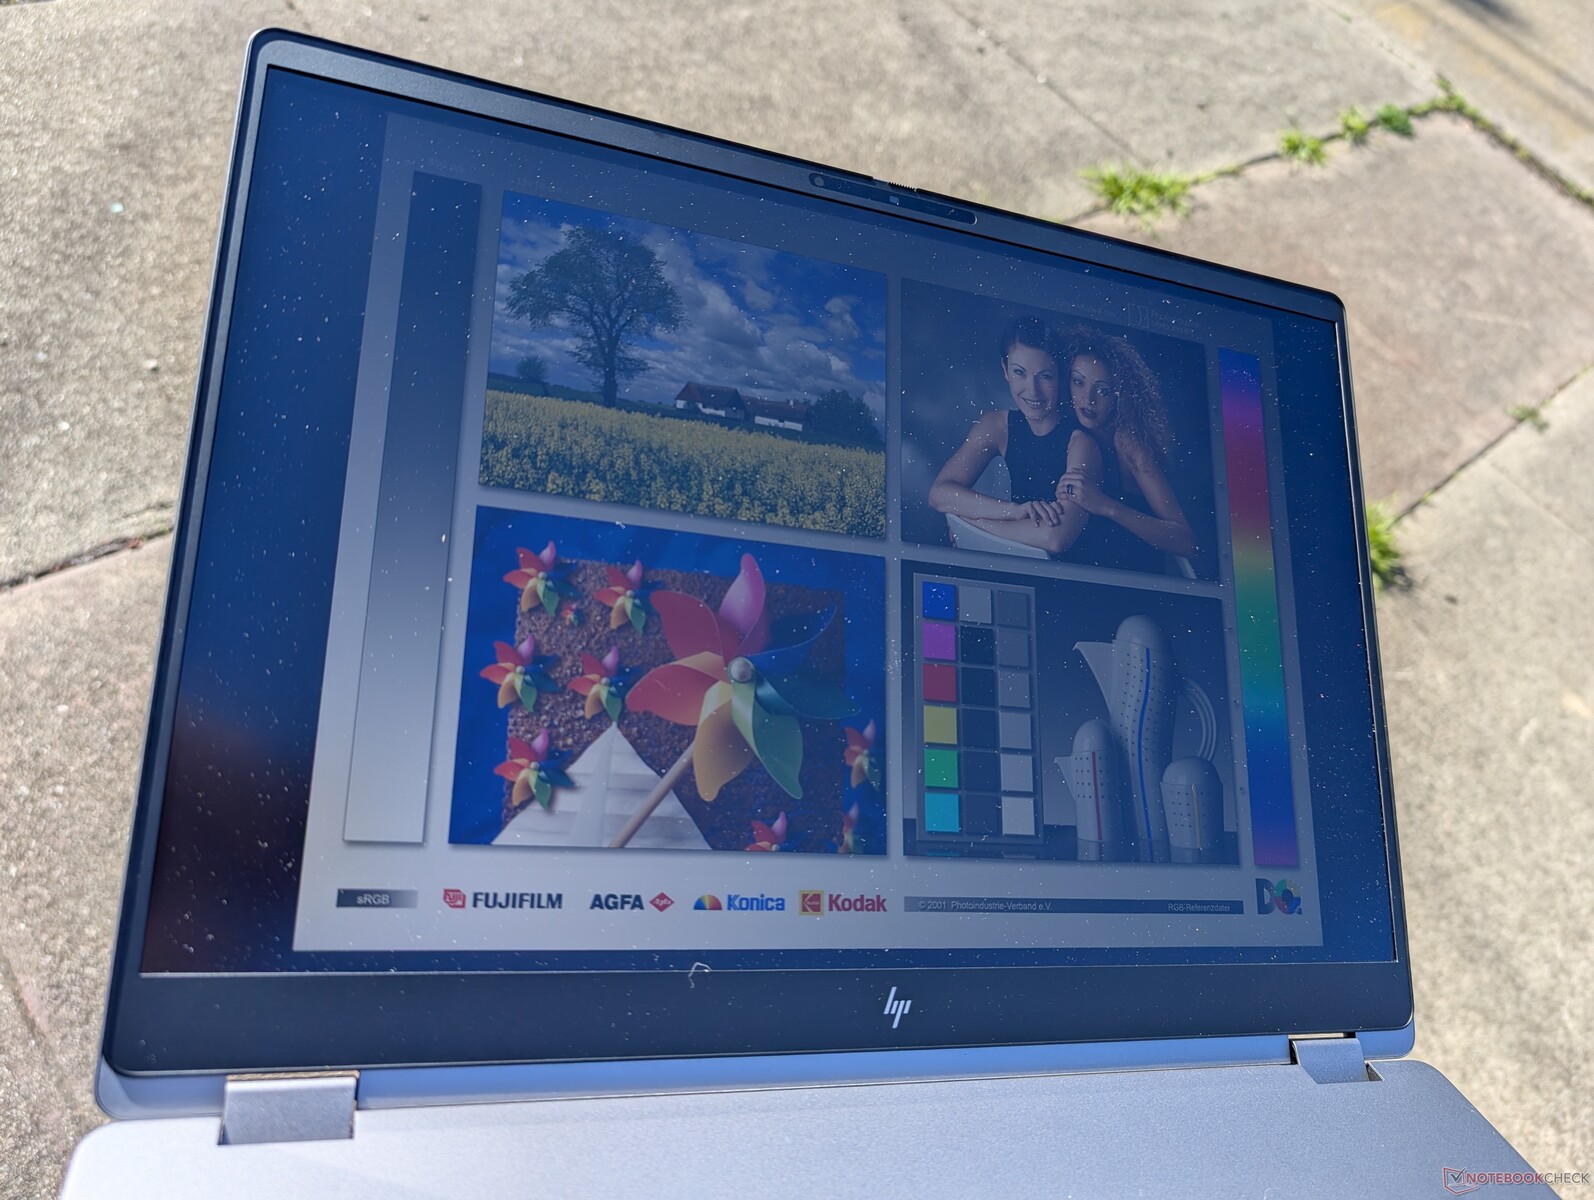
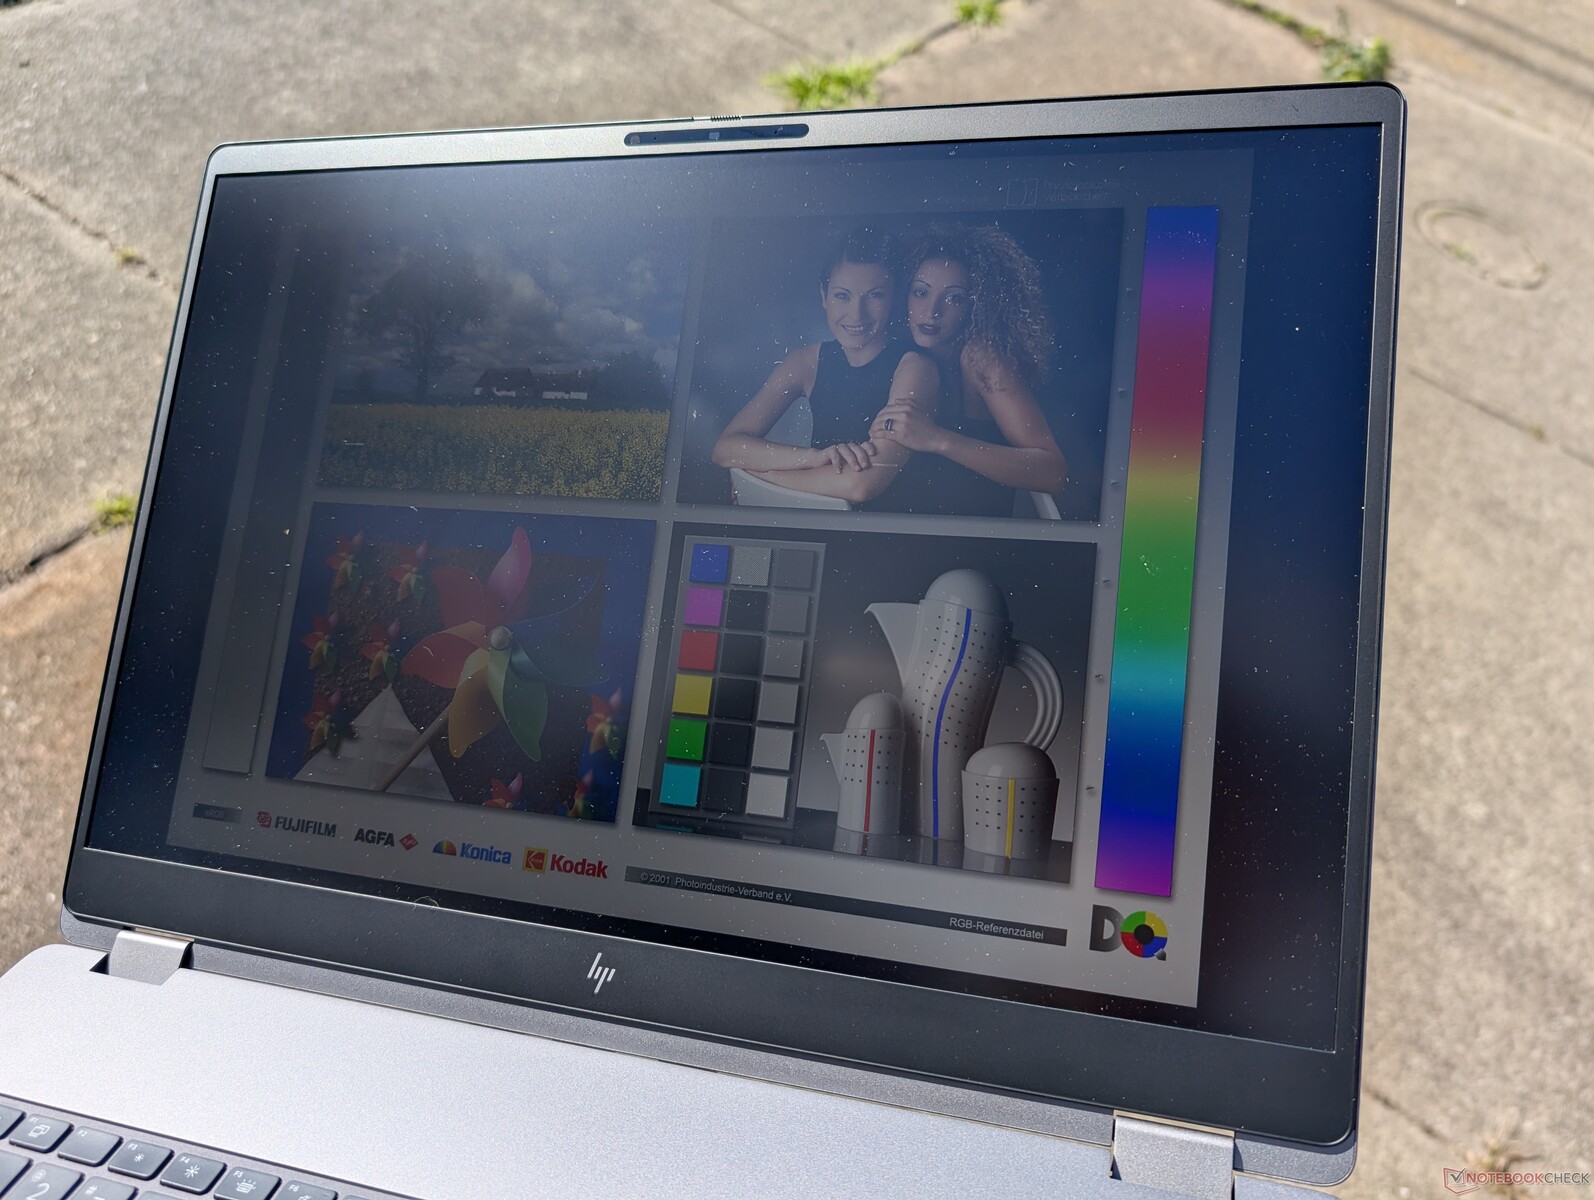
Precis som Dell Pro Max 18 Plusär vår HP ZBook Fury G1i 18 också begränsad till ett enda 2560 x 1600 IPS non-touch-alternativ. HP använder dock en annan panel från AU Optronics istället för BOE som erbjuder liknande P3-färger och ljusstyrka men med snabbare svartvita svarstider, snabbare inbyggd uppdateringsfrekvens, PSR2-stöd och något lägre kontrastnivåer.
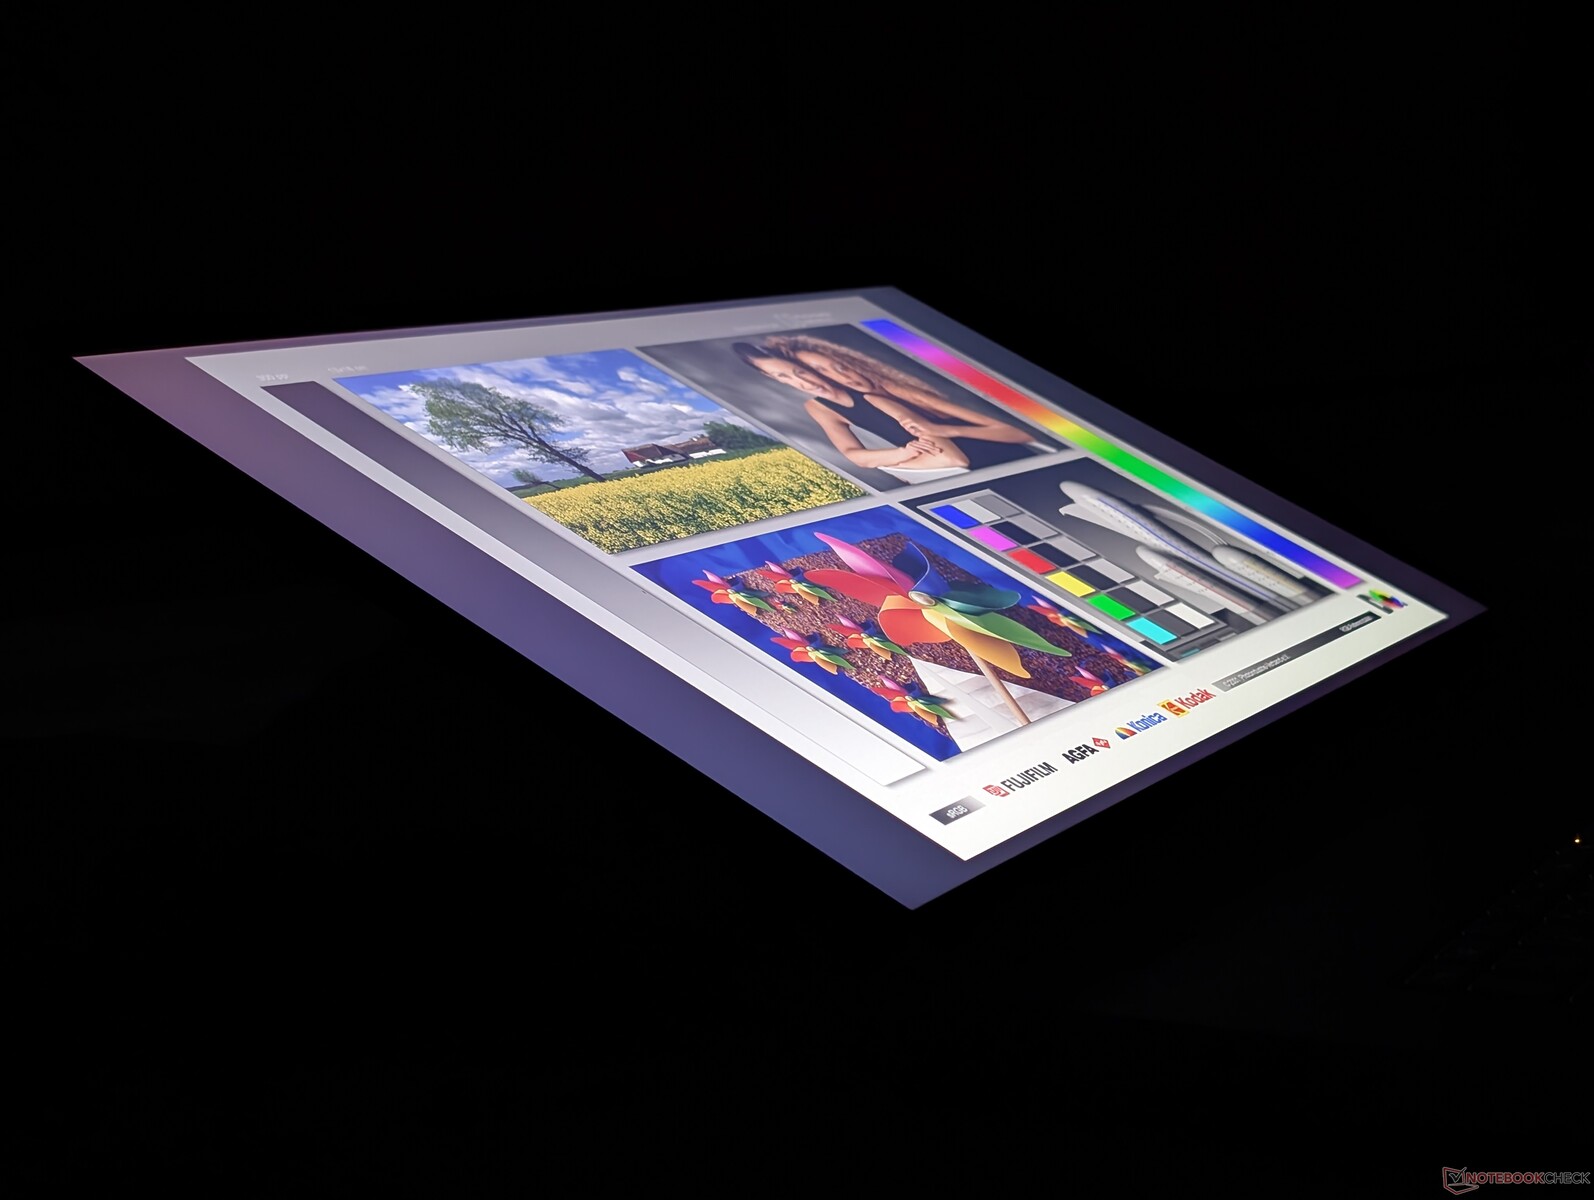
Vår testenhet lider av måttlig ojämn bakgrundsbelysning som blöder runt hörnen, vilket visas på bilden nedan. Även om det är acceptabelt på billigare bärbara datorer, är det en besvikelse att se detta på en förstklassig arbetsstation som ZBook.


| |||||||||||||||||||||||||
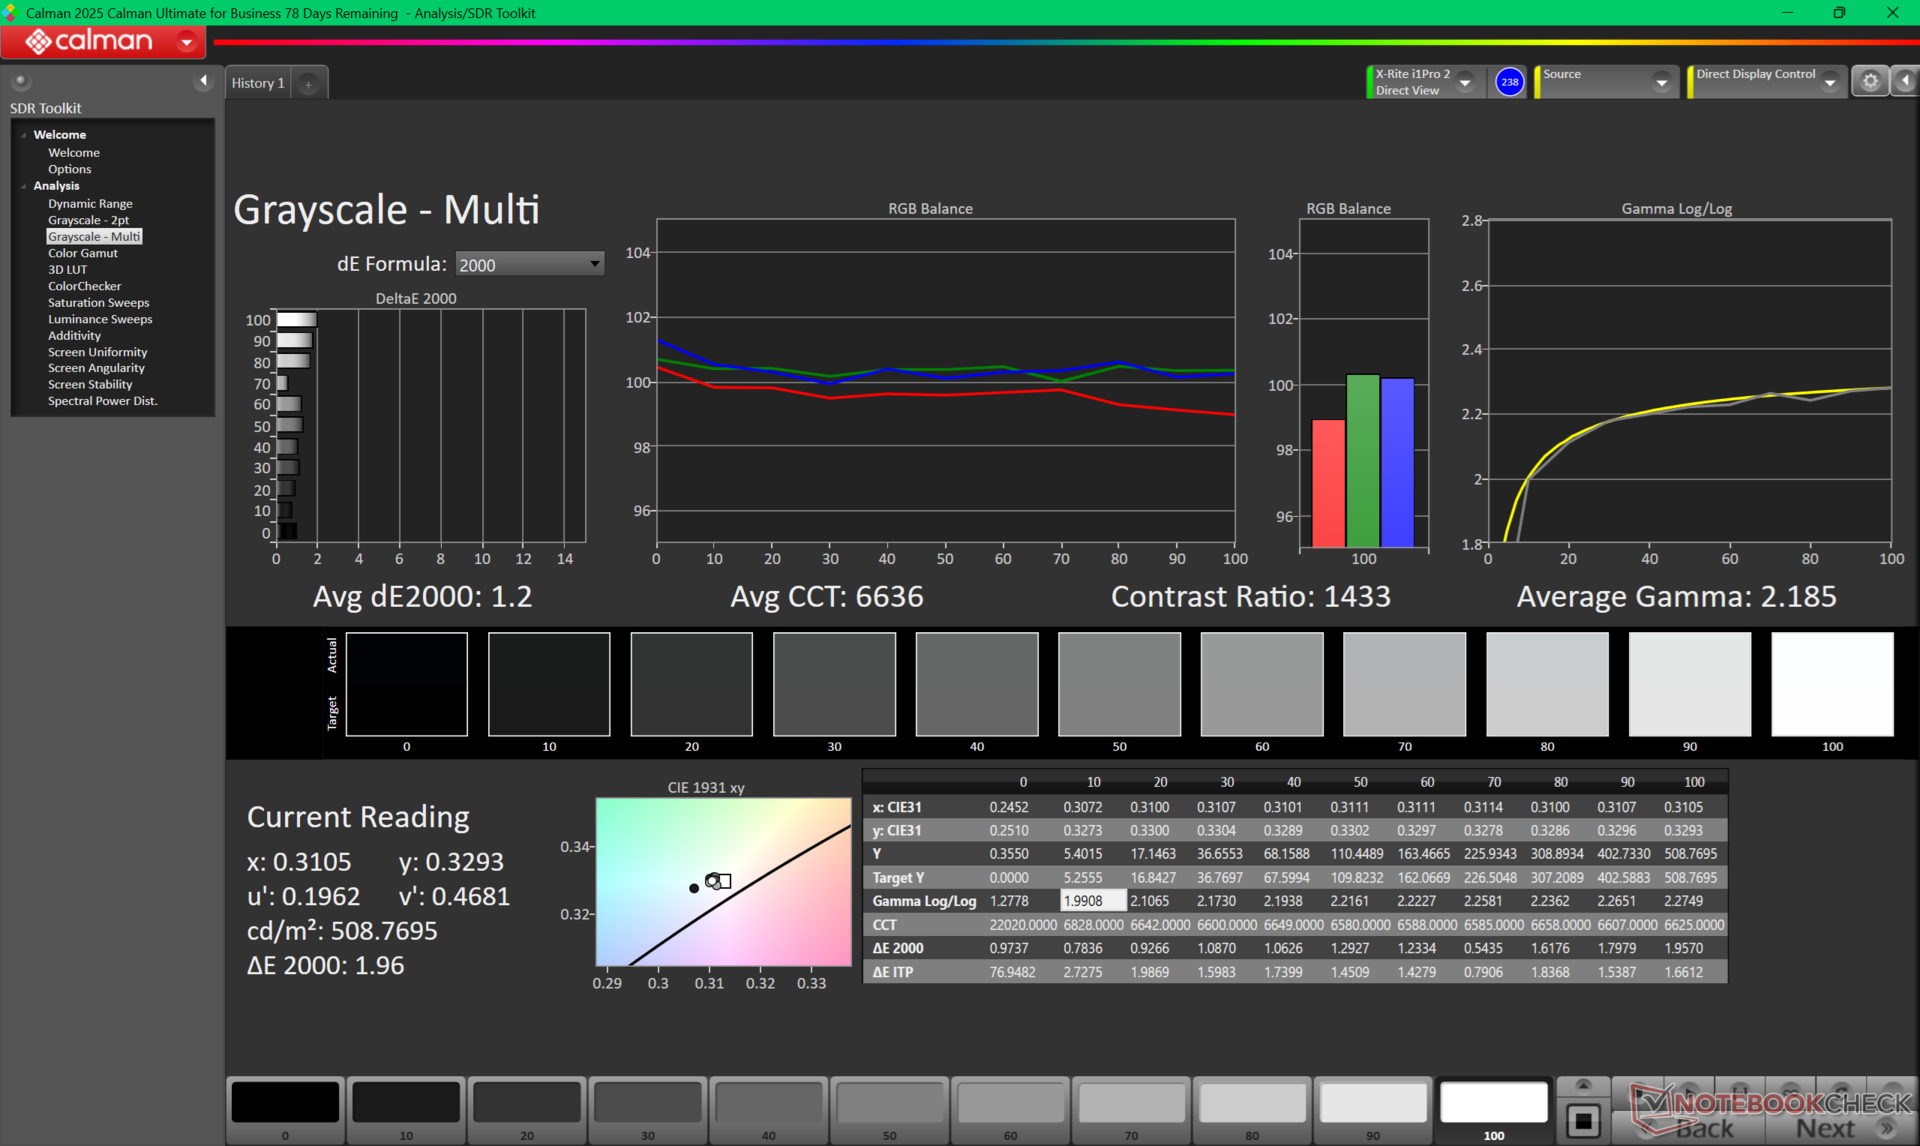
Distribution av ljusstyrkan: 92 %
Mitt på batteriet: 517.5 cd/m²
Kontrast: 1617:1 (Svärta: 0.32 cd/m²)
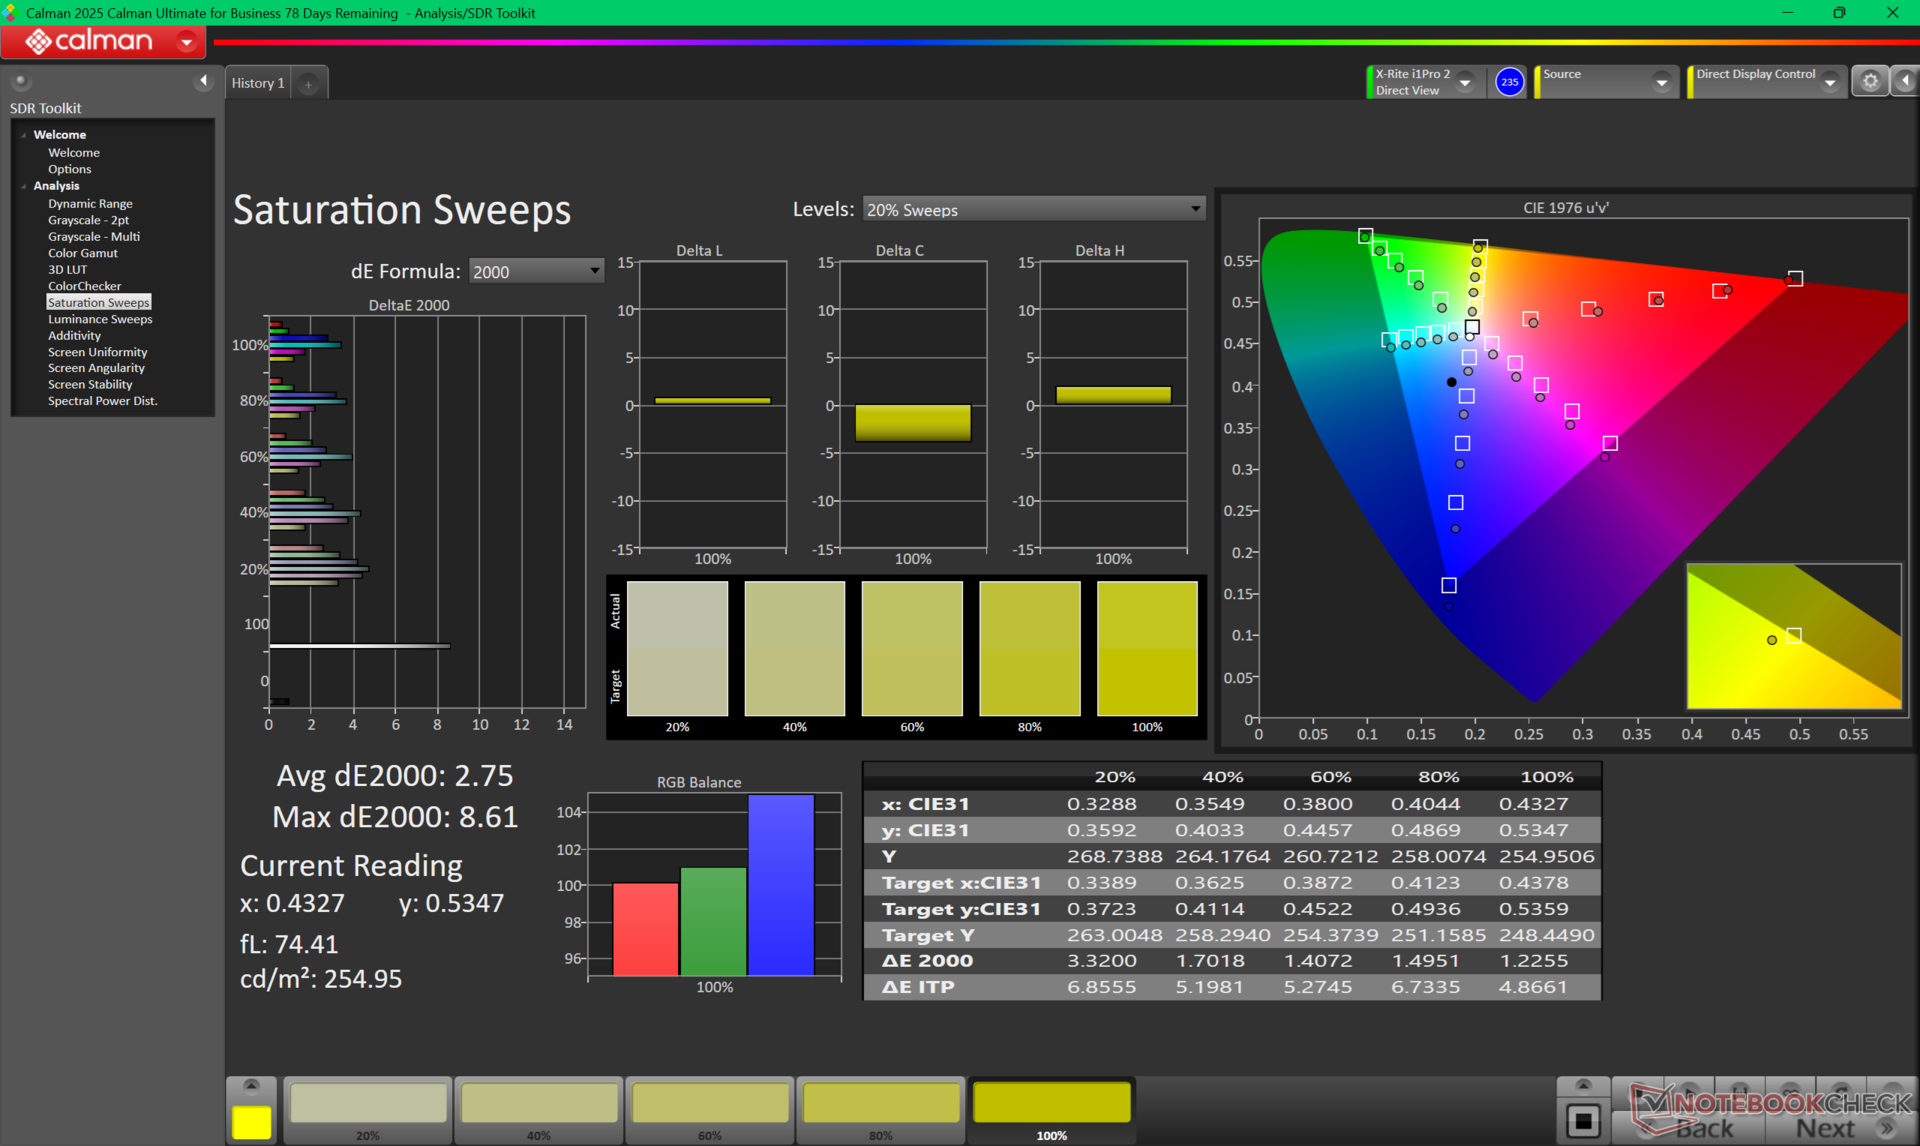
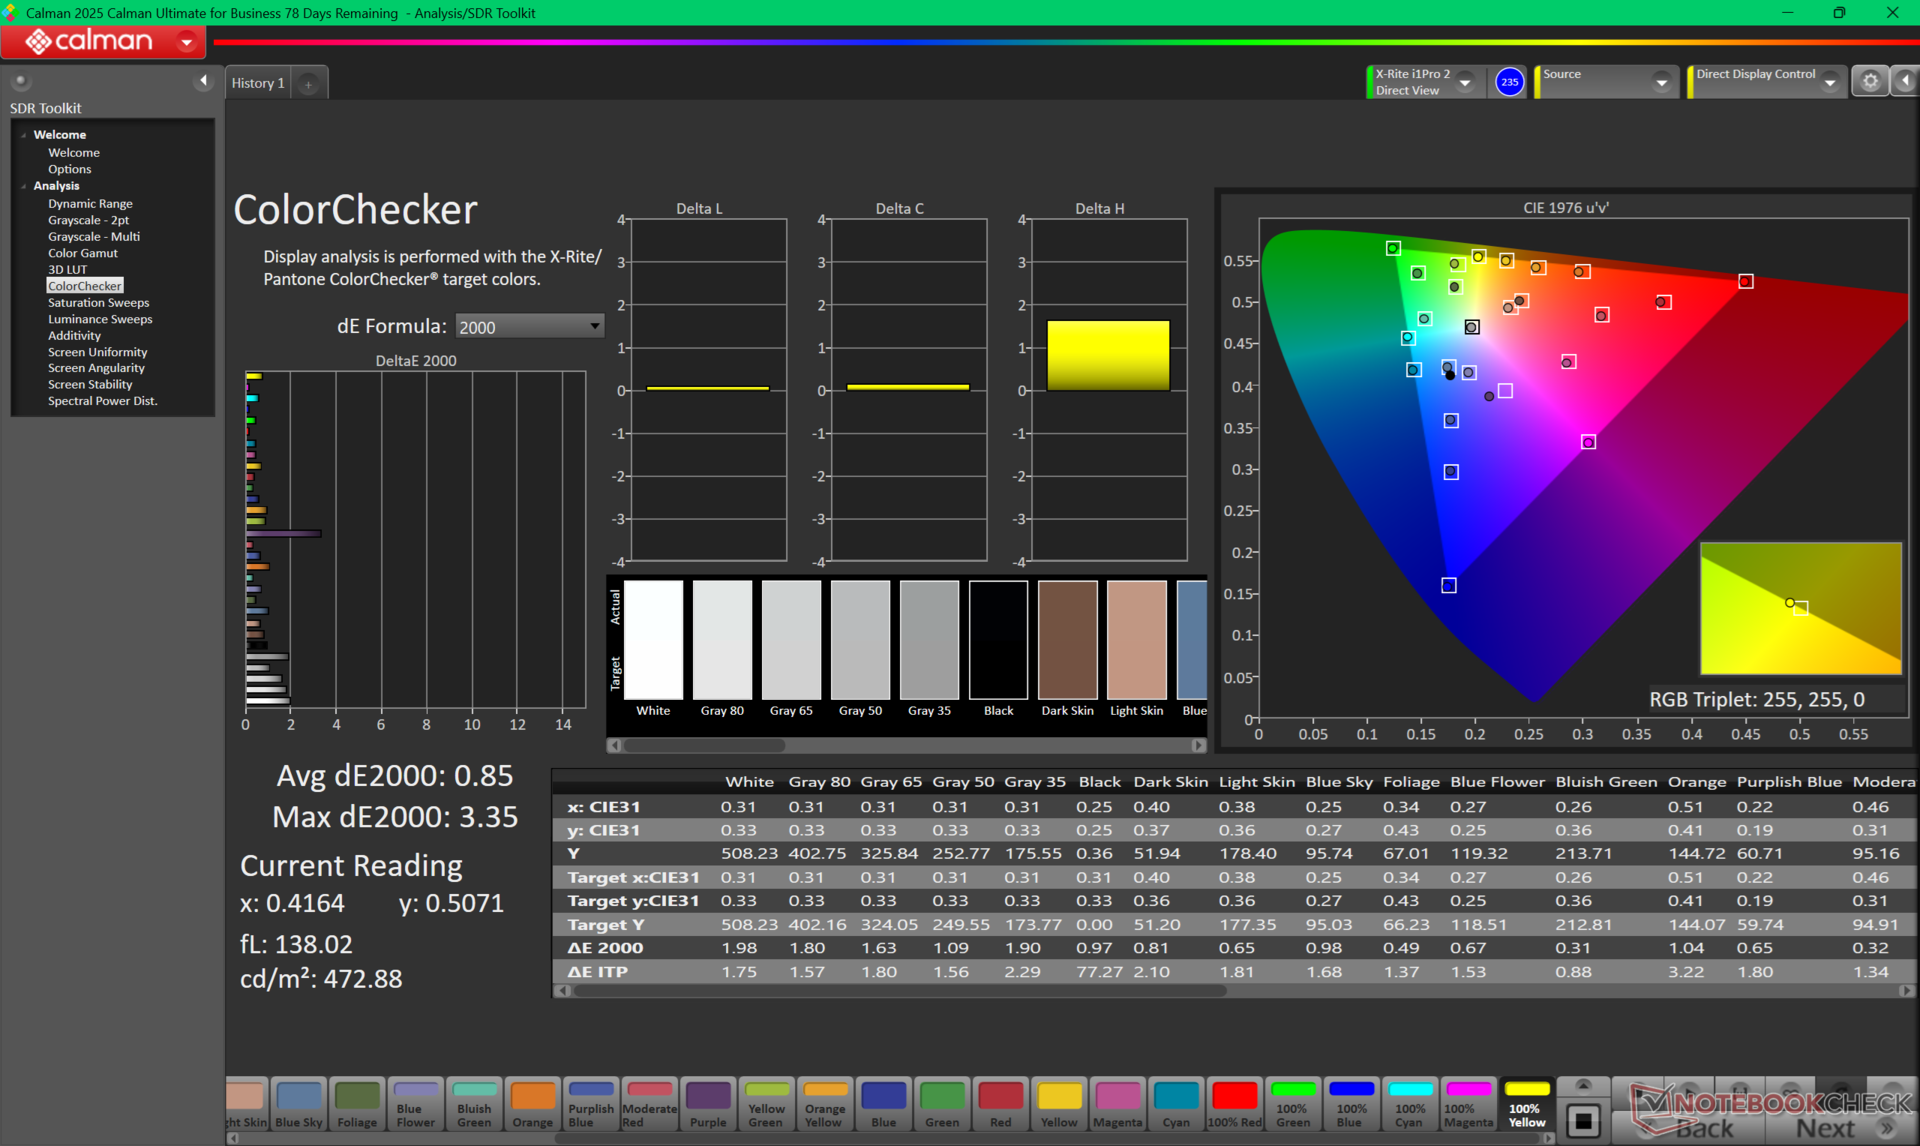
ΔE ColorChecker Calman: 3.62 | ∀{0.5-29.43 Ø4.72}
calibrated: 0.85
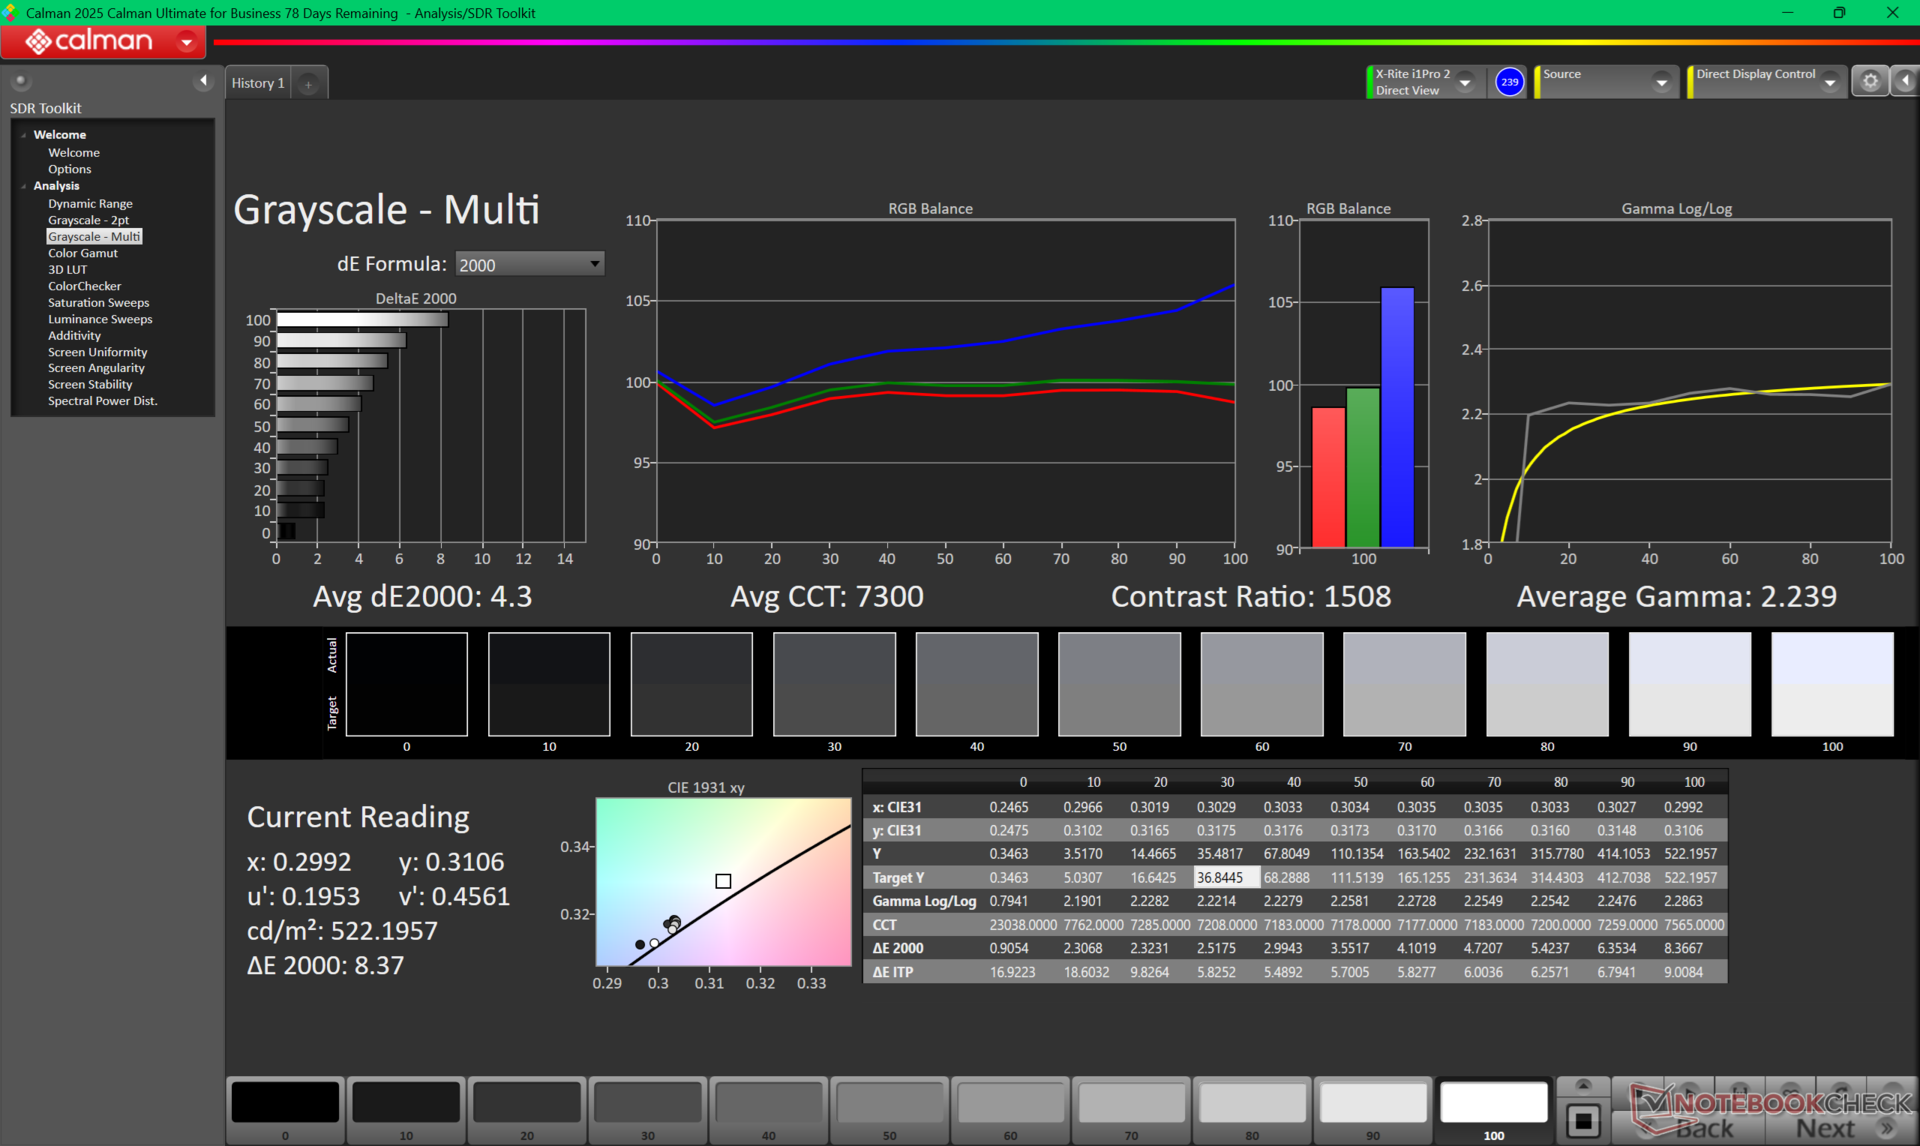
ΔE Greyscale Calman: 4.3 | ∀{0.09-98 Ø4.97}
87.7% AdobeRGB 1998 (Argyll 3D)
100% sRGB (Argyll 3D)
96.6% Display P3 (Argyll 3D)
Gamma: 2.24
CCT: 7300 K
| HP ZBook Fury G1i 18 AUO12B6, IPS, 2560x1600, 18", 165 Hz | Dell Pro Max 18 Plus MB18250 BOE NE18NZ7, IPS, 2560x1600, 18", 120 Hz | Schenker Key 18 Pro M25 RTX 5090 LQ180D1JW01, IPS, 3840x2400, 18", 200 Hz | Lenovo ThinkPad P16 Gen 2 NE160QDM-NY1, IPS, 2560x1600, 16", 165 Hz | HP ZBook X G1i 16 LG Philips LGD07B3, IPS, 2560x1600, 16", 120 Hz | HP ZBook Studio 16 G11 AUO87A8, IPS, 3840x2400, 16", 120 Hz | |
|---|---|---|---|---|---|---|
| Display | -0% | -2% | -17% | 5% | -0% | |
| Display P3 Coverage (%) | 96.6 | 97.7 1% | 90.5 -6% | 68.4 -29% | 97.2 1% | 97.7 1% |
| sRGB Coverage (%) | 100 | 99.9 0% | 100 0% | 96.9 -3% | 100 0% | 99.9 0% |
| AdobeRGB 1998 Coverage (%) | 87.7 | 85.9 -2% | 87.4 0% | 70.6 -19% | 99.9 14% | 85.7 -2% |
| Response Times | -225% | 55% | -12% | -229% | -17% | |
| Response Time Grey 50% / Grey 80% * (ms) | 12.5 ? | 39.9 ? -219% | 5.2 ? 58% | 14.1 ? -13% | 45.5 ? -264% | 14.2 ? -14% |
| Response Time Black / White * (ms) | 8.9 ? | 29.4 ? -230% | 4.3 ? 52% | 9.9 ? -11% | 26.1 ? -193% | 10.6 ? -19% |
| PWM Frequency (Hz) | 26536 ? | |||||
| PWM Amplitude * (%) | 47 | |||||
| Screen | 27% | 5% | 19% | -10% | 2% | |
| Brightness middle (cd/m²) | 517.5 | 528.8 2% | 529 2% | 531.5 3% | 461.8 -11% | 404.3 -22% |
| Brightness (cd/m²) | 497 | 515 4% | 513 3% | 499 0% | 427 -14% | 405 -19% |
| Brightness Distribution (%) | 92 | 91 -1% | 95 3% | 89 -3% | 88 -4% | 92 0% |
| Black Level * (cd/m²) | 0.32 | 0.22 31% | 0.31 3% | 0.38 -19% | 0.46 -44% | 0.28 12% |
| Contrast (:1) | 1617 | 2404 49% | 1706 6% | 1399 -13% | 1004 -38% | 1444 -11% |
| Colorchecker dE 2000 * | 3.62 | 2.76 24% | 2.7 25% | 1.82 50% | 4.08 -13% | 2.63 27% |
| Colorchecker dE 2000 max. * | 8.75 | 5.38 39% | 7.8 11% | 4.1 53% | 8.1 7% | 4.48 49% |
| Colorchecker dE 2000 calibrated * | 0.85 | 0.47 45% | 0.8 6% | 0.63 26% | 0.75 12% | 1.46 -72% |
| Greyscale dE 2000 * | 4.3 | 2.2 49% | 4.9 -14% | 1.2 72% | 3.5 19% | 2.1 51% |
| Gamma | 2.24 98% | 2.14 103% | 2.23 99% | 2.15 102% | 2.15 102% | 2.3 96% |
| CCT | 7300 89% | 2584 252% | 6997 93% | 6484 100% | 6715 97% | 6810 95% |
| Totalt genomsnitt (program/inställningar) | -66% /
-15% | 19% /
11% | -3% /
7% | -78% /
-38% | -5% /
-1% |
* ... mindre är bättre
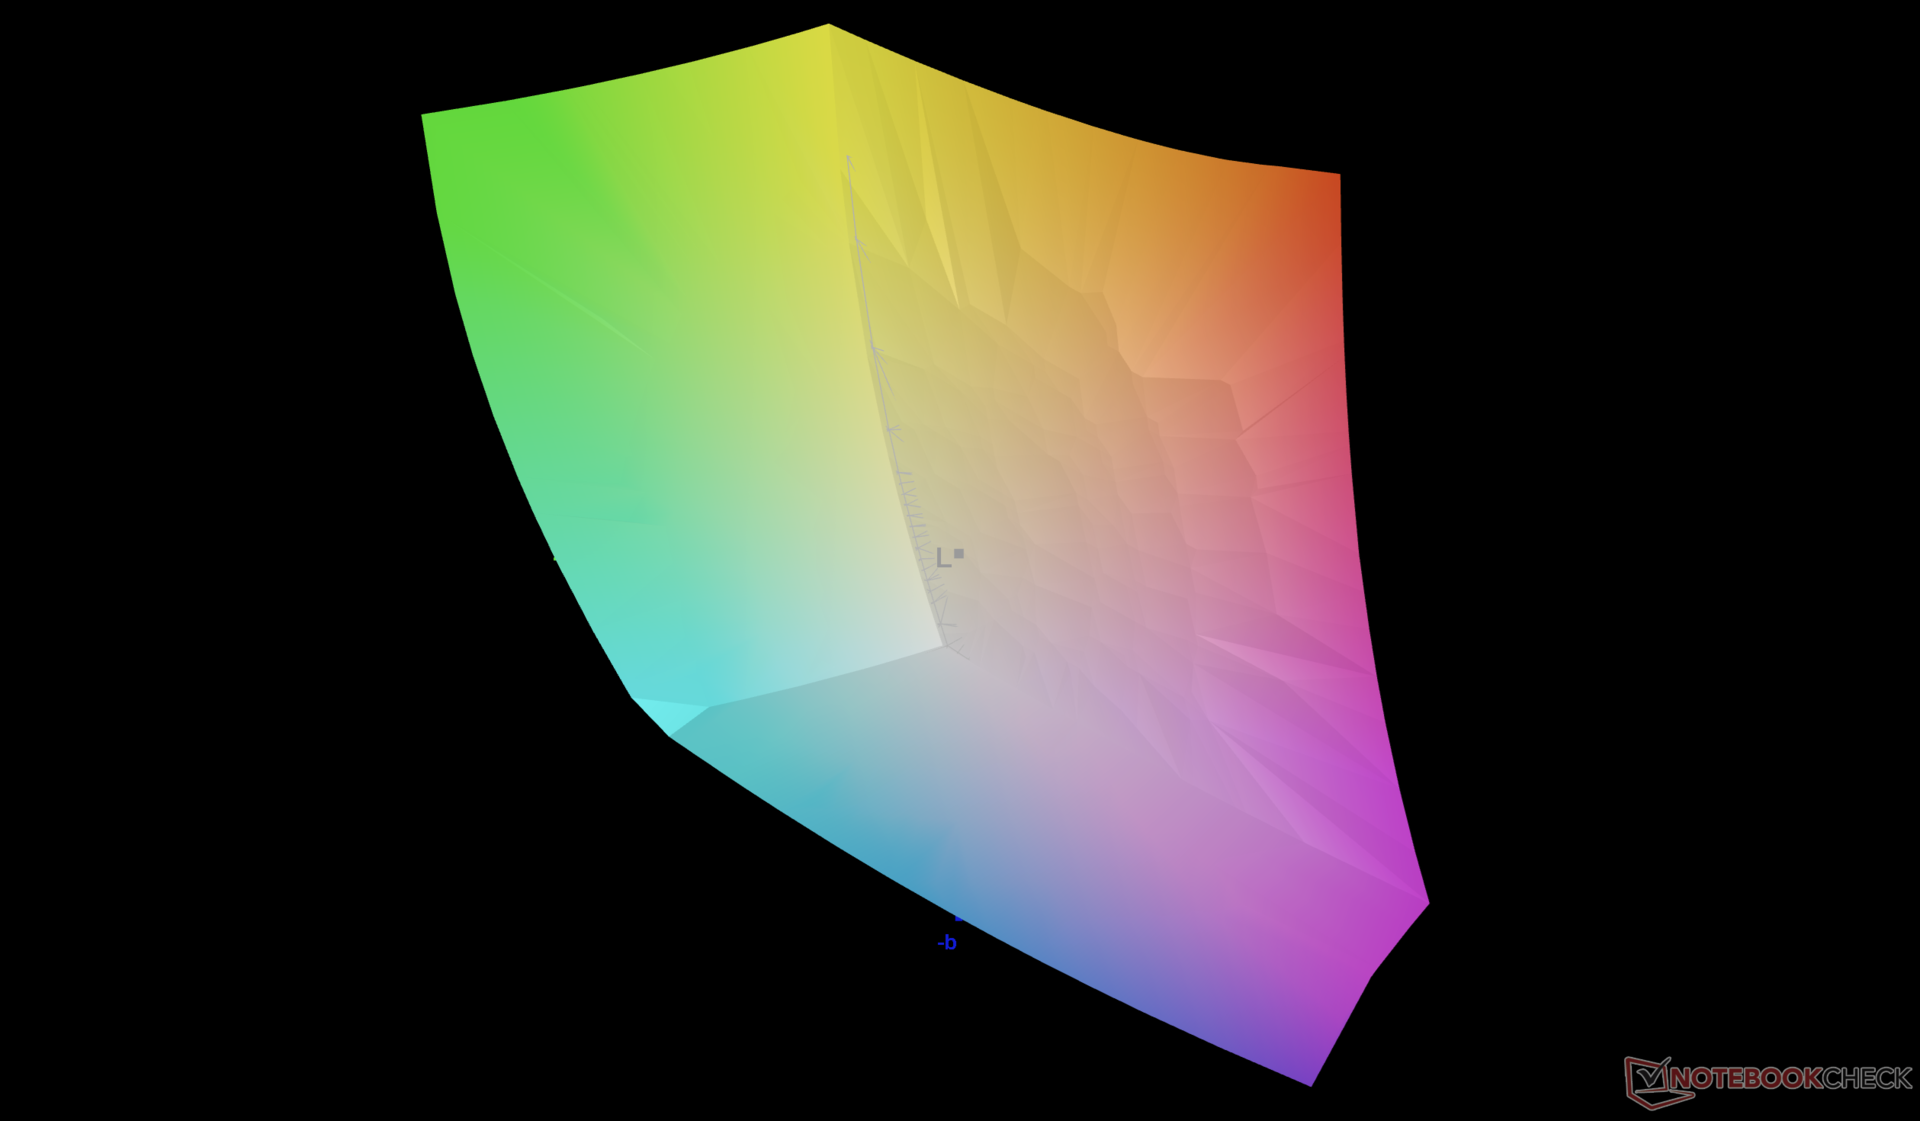
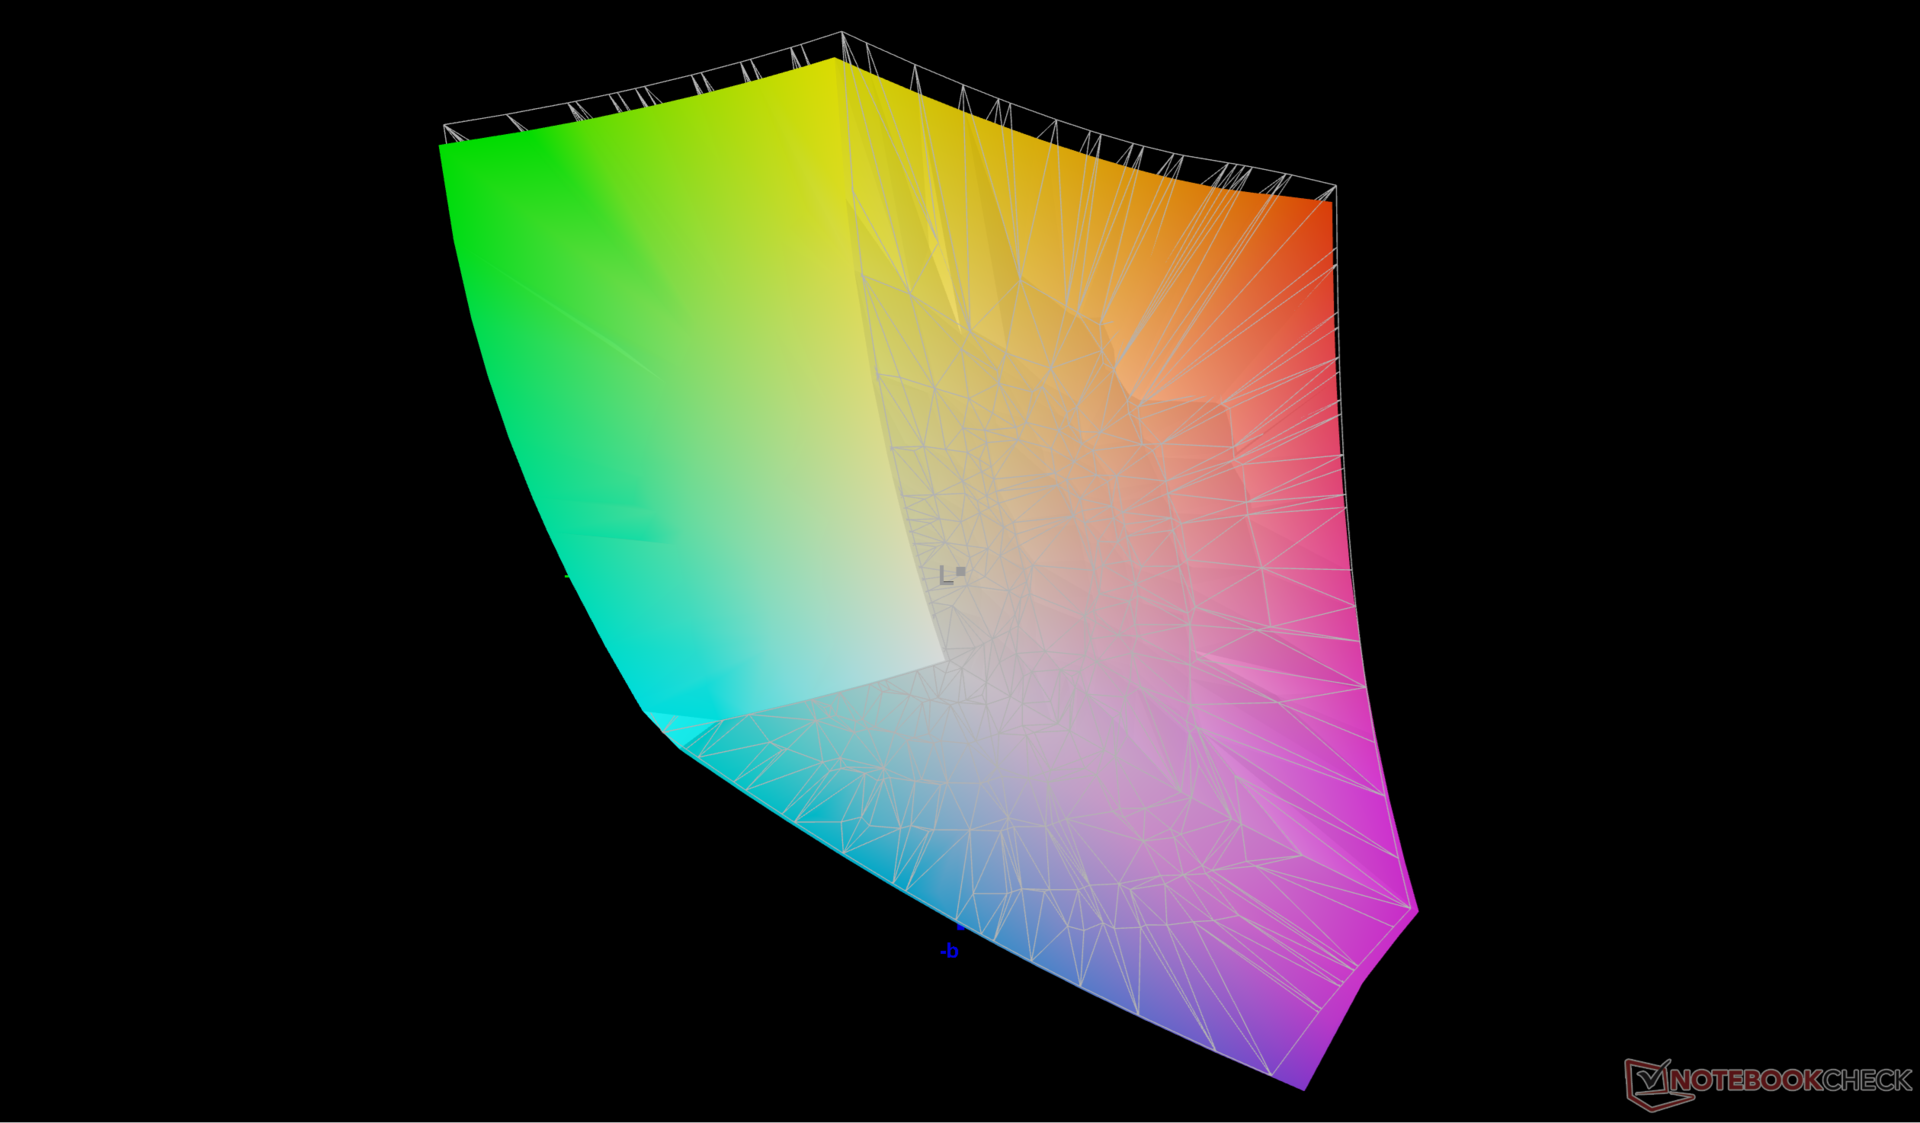
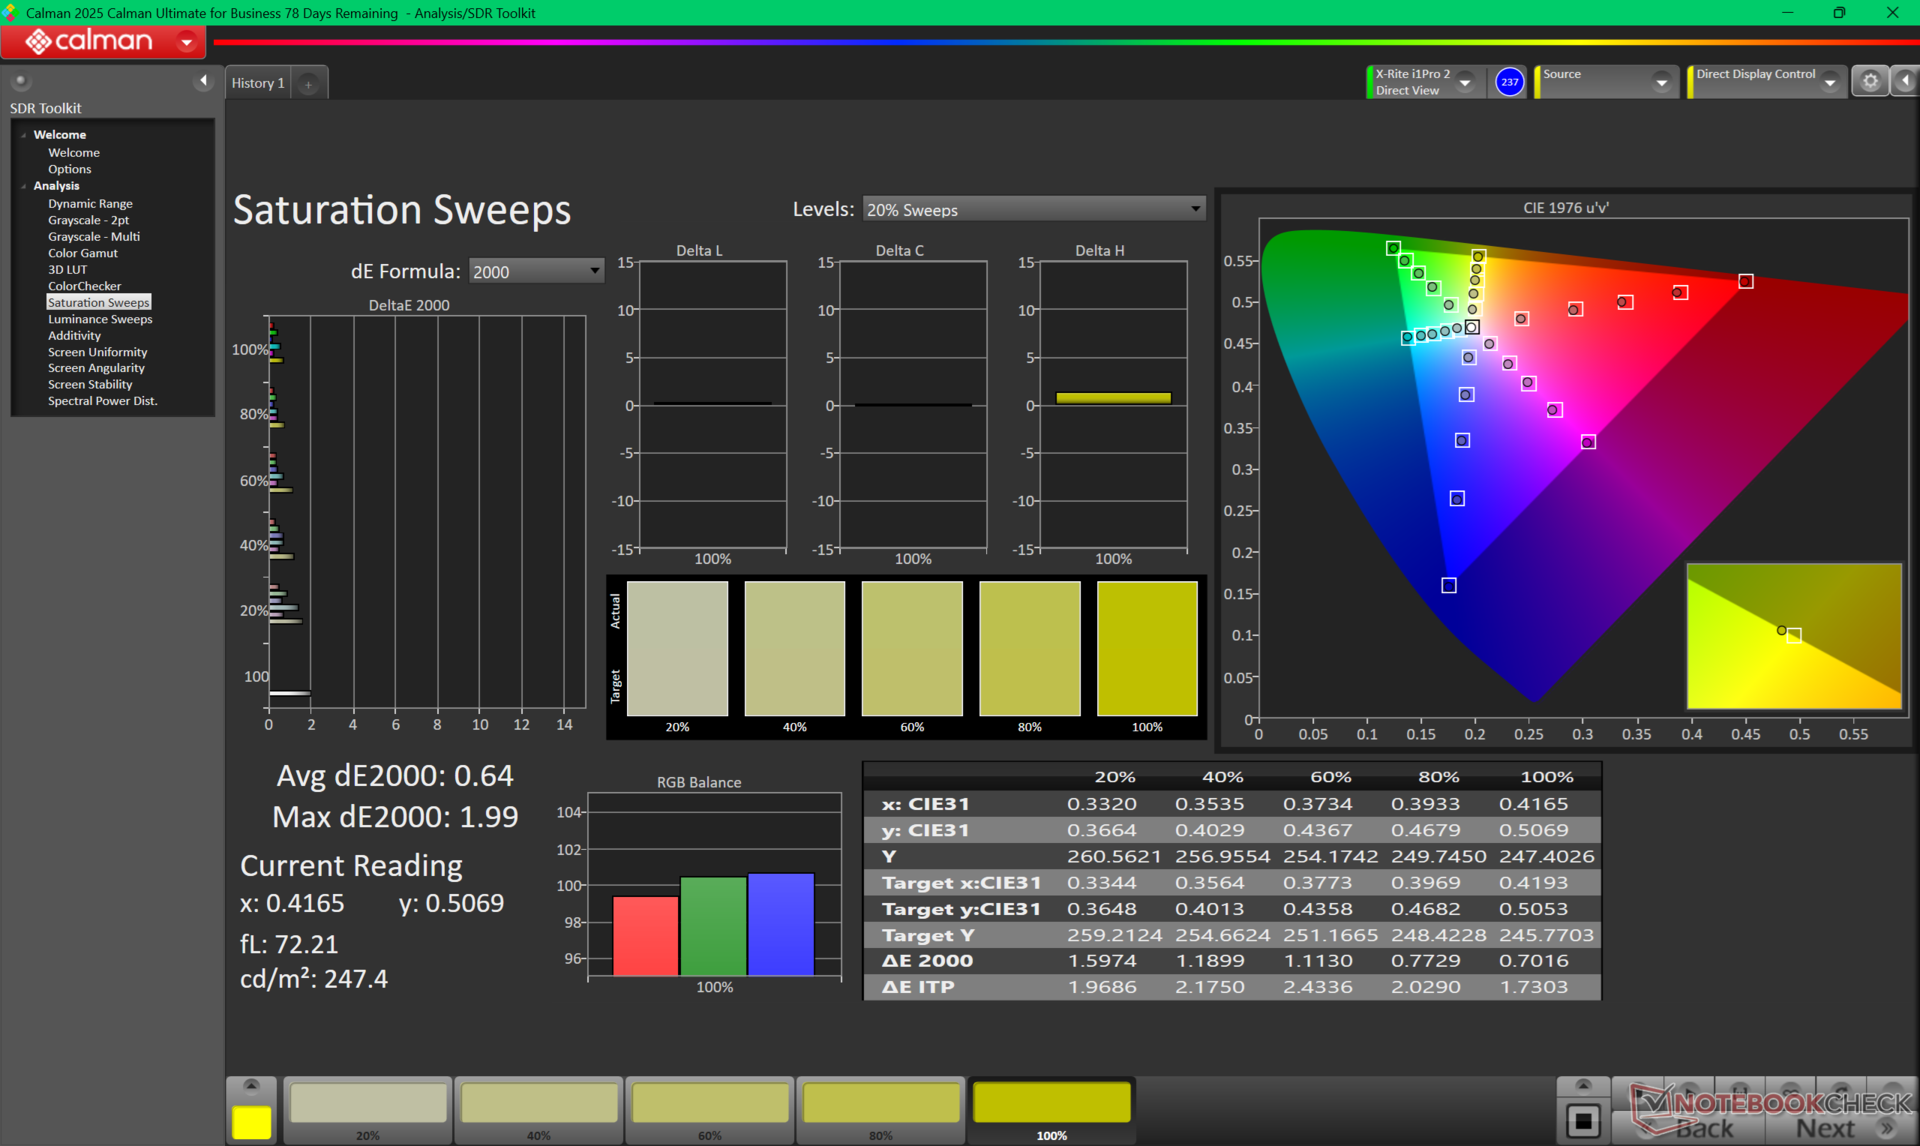
Färgtemperaturen är på den svala sidan med 7300. Skärmen är i övrigt hyfsat kalibrerad mot P3-standarden.

Visa svarstider
| ↔ Svarstid svart till vitt | ||
|---|---|---|
| 8.9 ms ... stiga ↗ och falla ↘ kombinerat | ↗ 4.5 ms stiga | 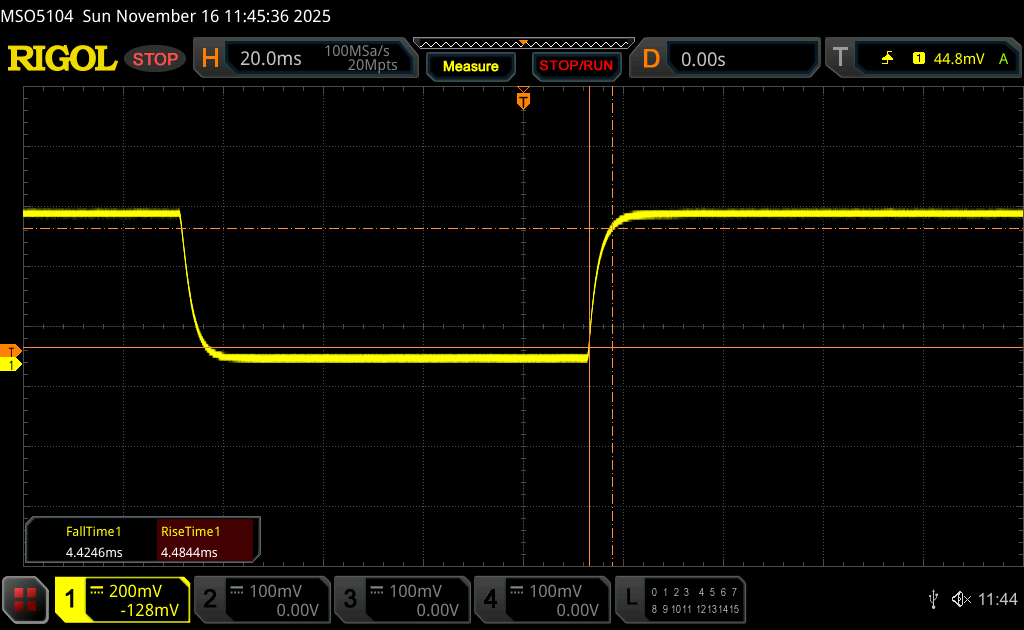 |
| ↘ 4.4 ms hösten | ||
| Skärmen visar snabba svarsfrekvenser i våra tester och bör passa för spel. I jämförelse sträcker sig alla testade enheter från 0.1 (minst) till 240 (maximalt) ms. » 25 % av alla enheter är bättre. Det betyder att den uppmätta svarstiden är bättre än genomsnittet av alla testade enheter (19.8 ms). | ||
| ↔ Svarstid 50 % grått till 80 % grått | ||
| 12.5 ms ... stiga ↗ och falla ↘ kombinerat | ↗ 6.1 ms stiga | 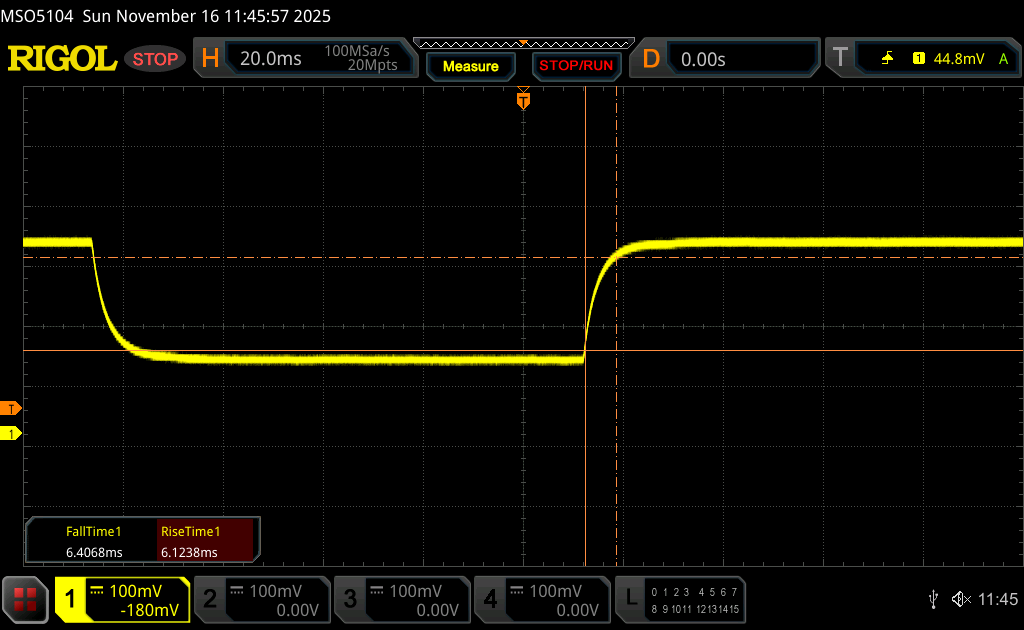 |
| ↘ 6.4 ms hösten | ||
| Skärmen visar bra svarsfrekvens i våra tester, men kan vara för långsam för konkurrenskraftiga spelare. I jämförelse sträcker sig alla testade enheter från 0.165 (minst) till 636 (maximalt) ms. » 26 % av alla enheter är bättre. Det betyder att den uppmätta svarstiden är bättre än genomsnittet av alla testade enheter (31 ms). | ||
Skärmflimmer / PWM (Puls-Width Modulation)
| Skärmflimmer / PWM upptäcktes inte | 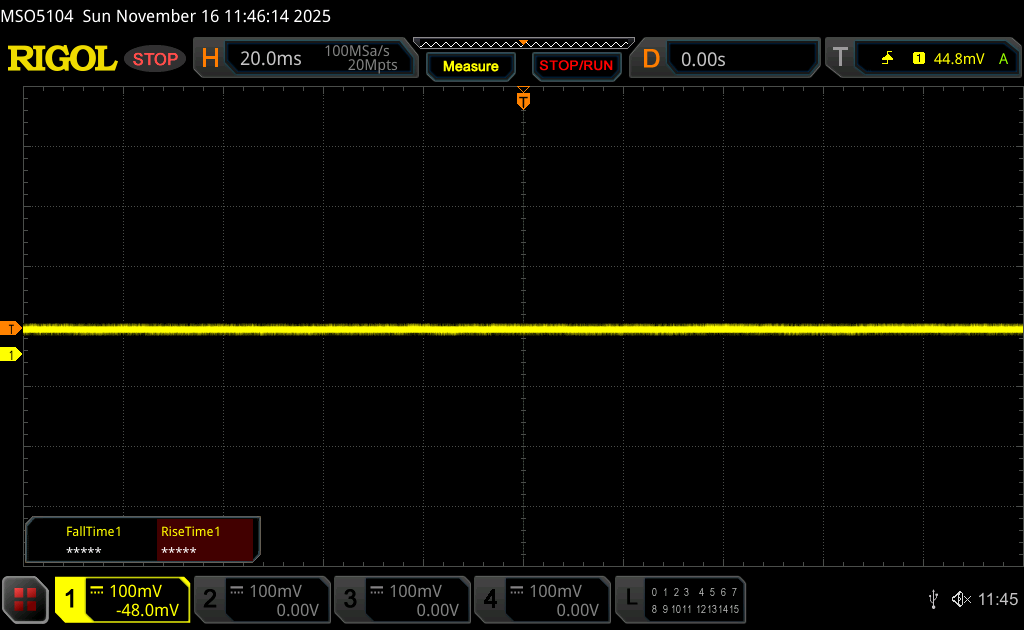 | ||
Som jämförelse: 52 % av alla testade enheter använder inte PWM för att dämpa skärmen. Om PWM upptäcktes mättes ett medelvärde av 7763 (minst: 5 - maximum: 343500) Hz. | |||

Prestanda - Arrow Lake-HX och Nvidia Blackwell
Testförhållanden
Vi ställde in Windows på prestandaläge med den diskreta GPU:n aktiv innan vi körde nedanstående riktmärken. Advanced Optimus stöds inte, till skillnad från på konkurrerande Dell Pro Max 18 Plus.
Processor
Core Ultra Core Ultra 9 285HX i vår HP körs konsekvent långsammare än samma CPU i Dell Pro Max 18 Plus med bara några få procentenheter. Turbo Boost verkar vara svagare på HP, vilket visas av våra CineBench R15 xT-loopresultat nedan, men båda maskinerna har nästan samma klockfrekvenser när Turbo Boost-fördelarna har lagt sig.
Konfigurering med Core Ultra 7 255HX istället för Core Ultra 9 285HX förväntas påverka processorns prestanda med bara 5 procent baserat på vår tid med Lenovo Legion Pro 5 16IAX10. Användare kanske därför vill överväga alternativet med en processor i den lägre prisklassen för att spara kostnader.
Cinebench R15 Multi Loop
Cinebench R23: Multi Core | Single Core
Cinebench R20: CPU (Multi Core) | CPU (Single Core)
Cinebench R15: CPU Multi 64Bit | CPU Single 64Bit
Blender: v2.79 BMW27 CPU
7-Zip 18.03: 7z b 4 | 7z b 4 -mmt1
Geekbench 6.7: Multi-Core | Single-Core
Geekbench 5.5: Multi-Core | Single-Core
HWBOT x265 Benchmark v2.2: 4k Preset
LibreOffice : 20 Documents To PDF
R Benchmark 2.5: Overall mean
* ... mindre är bättre
AIDA64: FP32 Ray-Trace | FPU Julia | CPU SHA3 | CPU Queen | FPU SinJulia | FPU Mandel | CPU AES | CPU ZLib | FP64 Ray-Trace | CPU PhotoWorxx
| Performance rating | |
| Dell Pro Max 18 Plus MB18250 | |
| Schenker Key 18 Pro M25 RTX 5090 | |
| Genomsnitt Intel Core Ultra 9 285HX | |
| HP ZBook Fury G1i 18 | |
| Lenovo ThinkPad P16 Gen 2 | |
| HP ZBook Studio 16 G11 | |
| AIDA64 / FP32 Ray-Trace | |
| Schenker Key 18 Pro M25 RTX 5090 | |
| Dell Pro Max 18 Plus MB18250 | |
| Genomsnitt Intel Core Ultra 9 285HX (29076 - 42341, n=6) | |
| HP ZBook Fury G1i 18 | |
| Lenovo ThinkPad P16 Gen 2 | |
| HP ZBook Studio 16 G11 | |
| AIDA64 / FPU Julia | |
| Schenker Key 18 Pro M25 RTX 5090 | |
| Genomsnitt Intel Core Ultra 9 285HX (161276 - 210885, n=6) | |
| Dell Pro Max 18 Plus MB18250 | |
| HP ZBook Fury G1i 18 | |
| Lenovo ThinkPad P16 Gen 2 | |
| HP ZBook Studio 16 G11 | |
| AIDA64 / CPU SHA3 | |
| Schenker Key 18 Pro M25 RTX 5090 | |
| Dell Pro Max 18 Plus MB18250 | |
| Genomsnitt Intel Core Ultra 9 285HX (7757 - 9815, n=6) | |
| HP ZBook Fury G1i 18 | |
| Lenovo ThinkPad P16 Gen 2 | |
| HP ZBook Studio 16 G11 | |
| AIDA64 / CPU Queen | |
| Lenovo ThinkPad P16 Gen 2 | |
| Genomsnitt Intel Core Ultra 9 285HX (134345 - 141681, n=6) | |
| Dell Pro Max 18 Plus MB18250 | |
| Schenker Key 18 Pro M25 RTX 5090 | |
| HP ZBook Fury G1i 18 | |
| HP ZBook Studio 16 G11 | |
| AIDA64 / FPU SinJulia | |
| Schenker Key 18 Pro M25 RTX 5090 | |
| Dell Pro Max 18 Plus MB18250 | |
| Lenovo ThinkPad P16 Gen 2 | |
| Genomsnitt Intel Core Ultra 9 285HX (12559 - 14431, n=6) | |
| HP ZBook Fury G1i 18 | |
| HP ZBook Studio 16 G11 | |
| AIDA64 / FPU Mandel | |
| Schenker Key 18 Pro M25 RTX 5090 | |
| Genomsnitt Intel Core Ultra 9 285HX (84053 - 108922, n=6) | |
| Dell Pro Max 18 Plus MB18250 | |
| HP ZBook Fury G1i 18 | |
| Lenovo ThinkPad P16 Gen 2 | |
| HP ZBook Studio 16 G11 | |
| AIDA64 / CPU AES | |
| Schenker Key 18 Pro M25 RTX 5090 | |
| Dell Pro Max 18 Plus MB18250 | |
| HP ZBook Fury G1i 18 | |
| Genomsnitt Intel Core Ultra 9 285HX (119553 - 134195, n=6) | |
| Lenovo ThinkPad P16 Gen 2 | |
| HP ZBook Studio 16 G11 | |
| AIDA64 / CPU ZLib | |
| Dell Pro Max 18 Plus MB18250 | |
| Schenker Key 18 Pro M25 RTX 5090 | |
| Genomsnitt Intel Core Ultra 9 285HX (1886 - 2267, n=6) | |
| HP ZBook Fury G1i 18 | |
| Lenovo ThinkPad P16 Gen 2 | |
| HP ZBook Studio 16 G11 | |
| AIDA64 / FP64 Ray-Trace | |
| Schenker Key 18 Pro M25 RTX 5090 | |
| Genomsnitt Intel Core Ultra 9 285HX (15059 - 22312, n=6) | |
| Dell Pro Max 18 Plus MB18250 | |
| HP ZBook Fury G1i 18 | |
| Lenovo ThinkPad P16 Gen 2 | |
| HP ZBook Studio 16 G11 | |
| AIDA64 / CPU PhotoWorxx | |
| Dell Pro Max 18 Plus MB18250 | |
| HP ZBook Studio 16 G11 | |
| Genomsnitt Intel Core Ultra 9 285HX (39232 - 62611, n=6) | |
| Lenovo ThinkPad P16 Gen 2 | |
| HP ZBook Fury G1i 18 | |
| Schenker Key 18 Pro M25 RTX 5090 | |
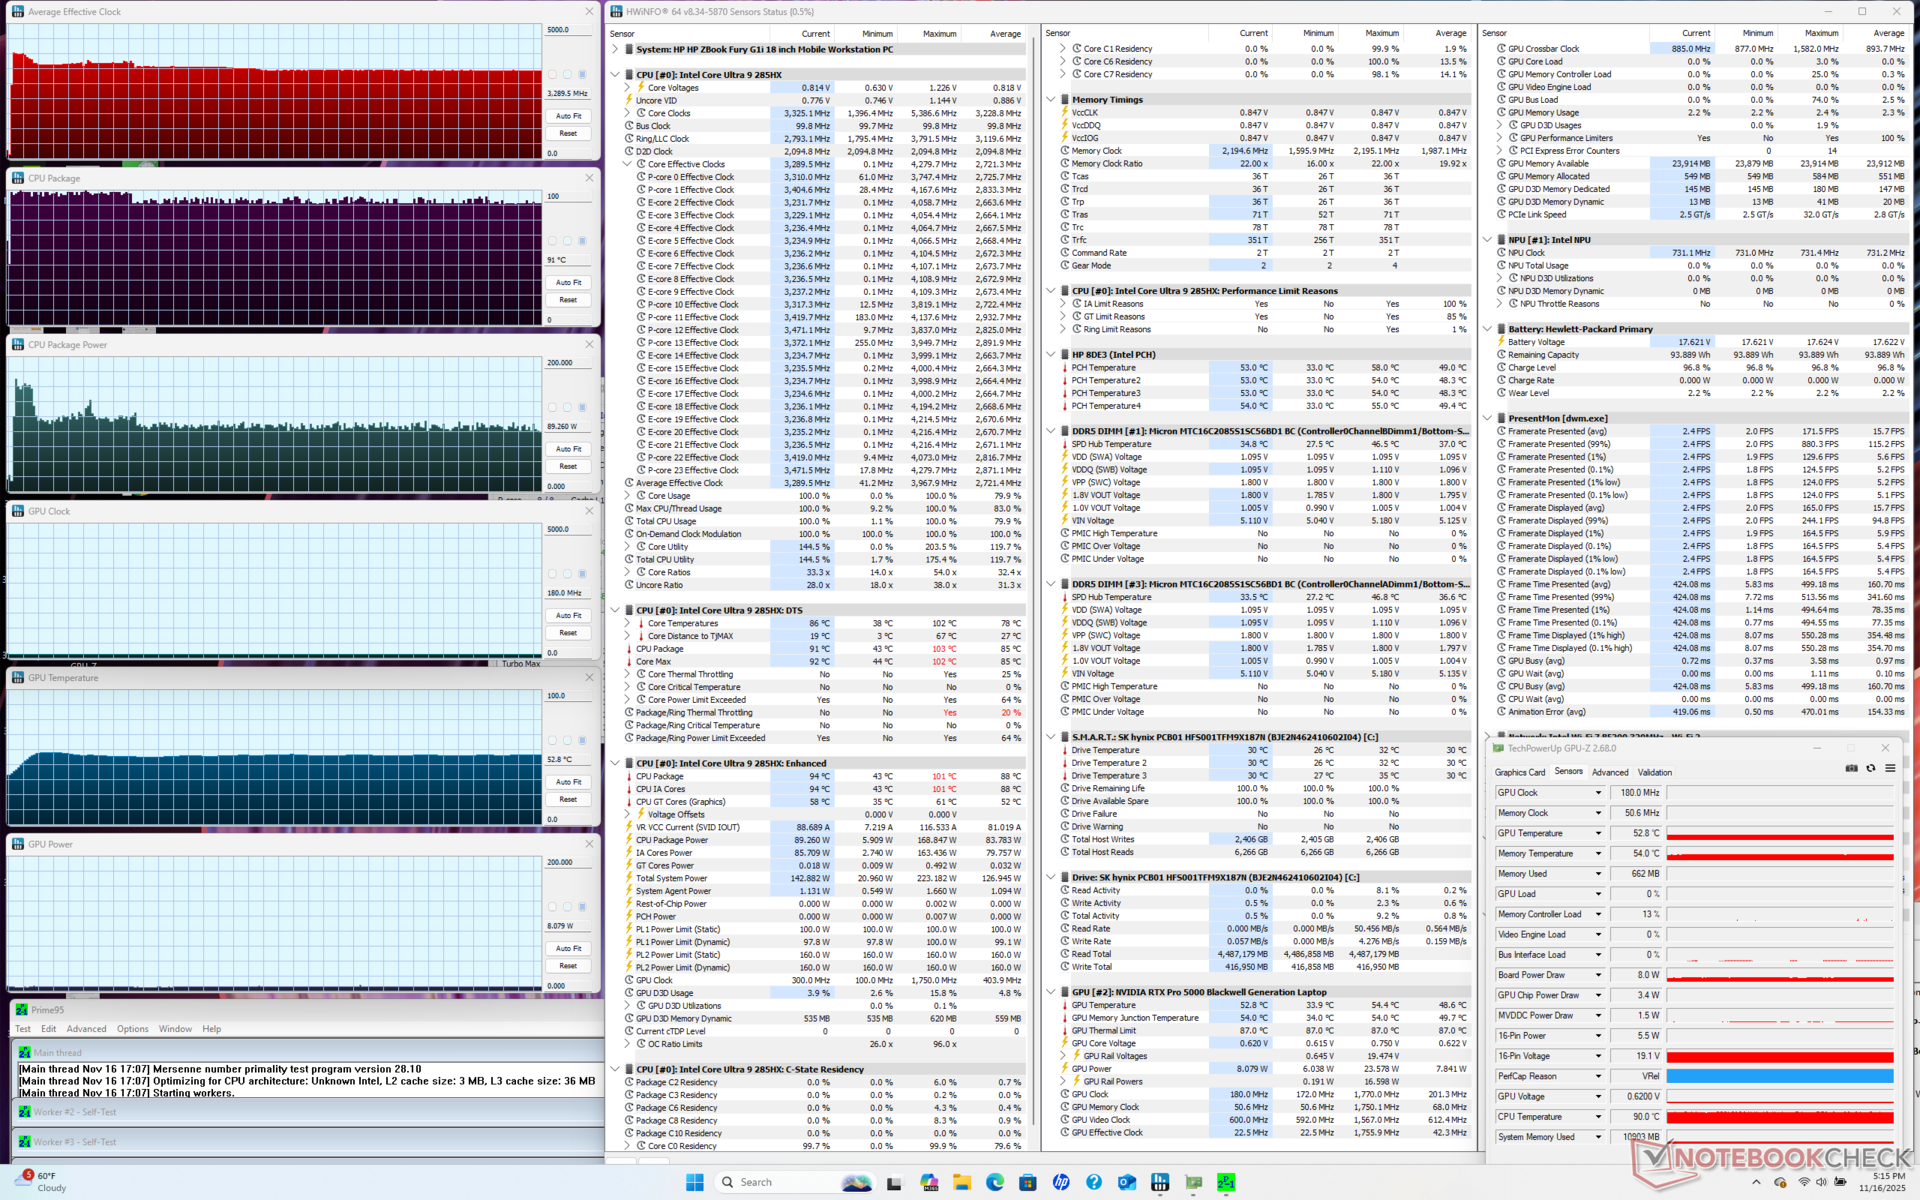
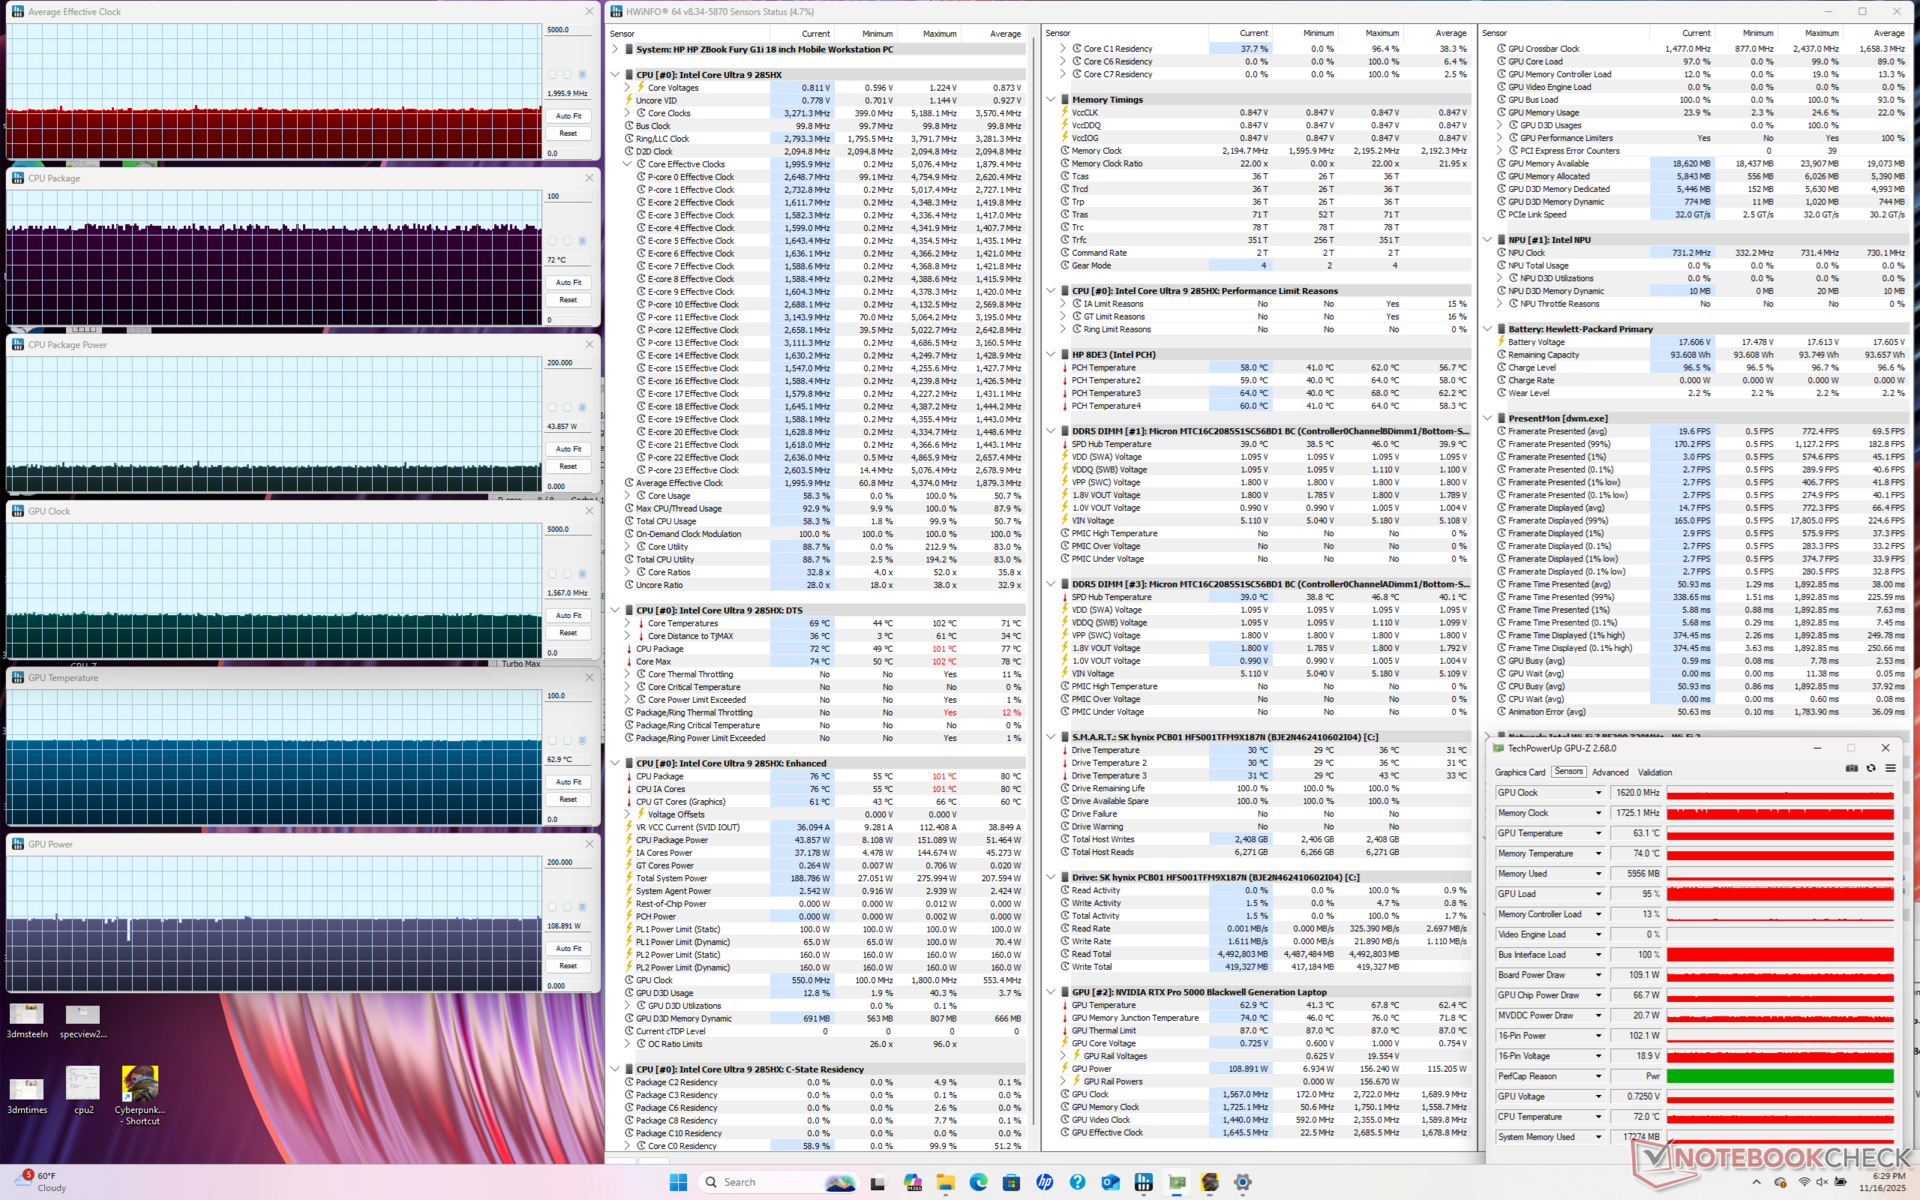
Stresstest
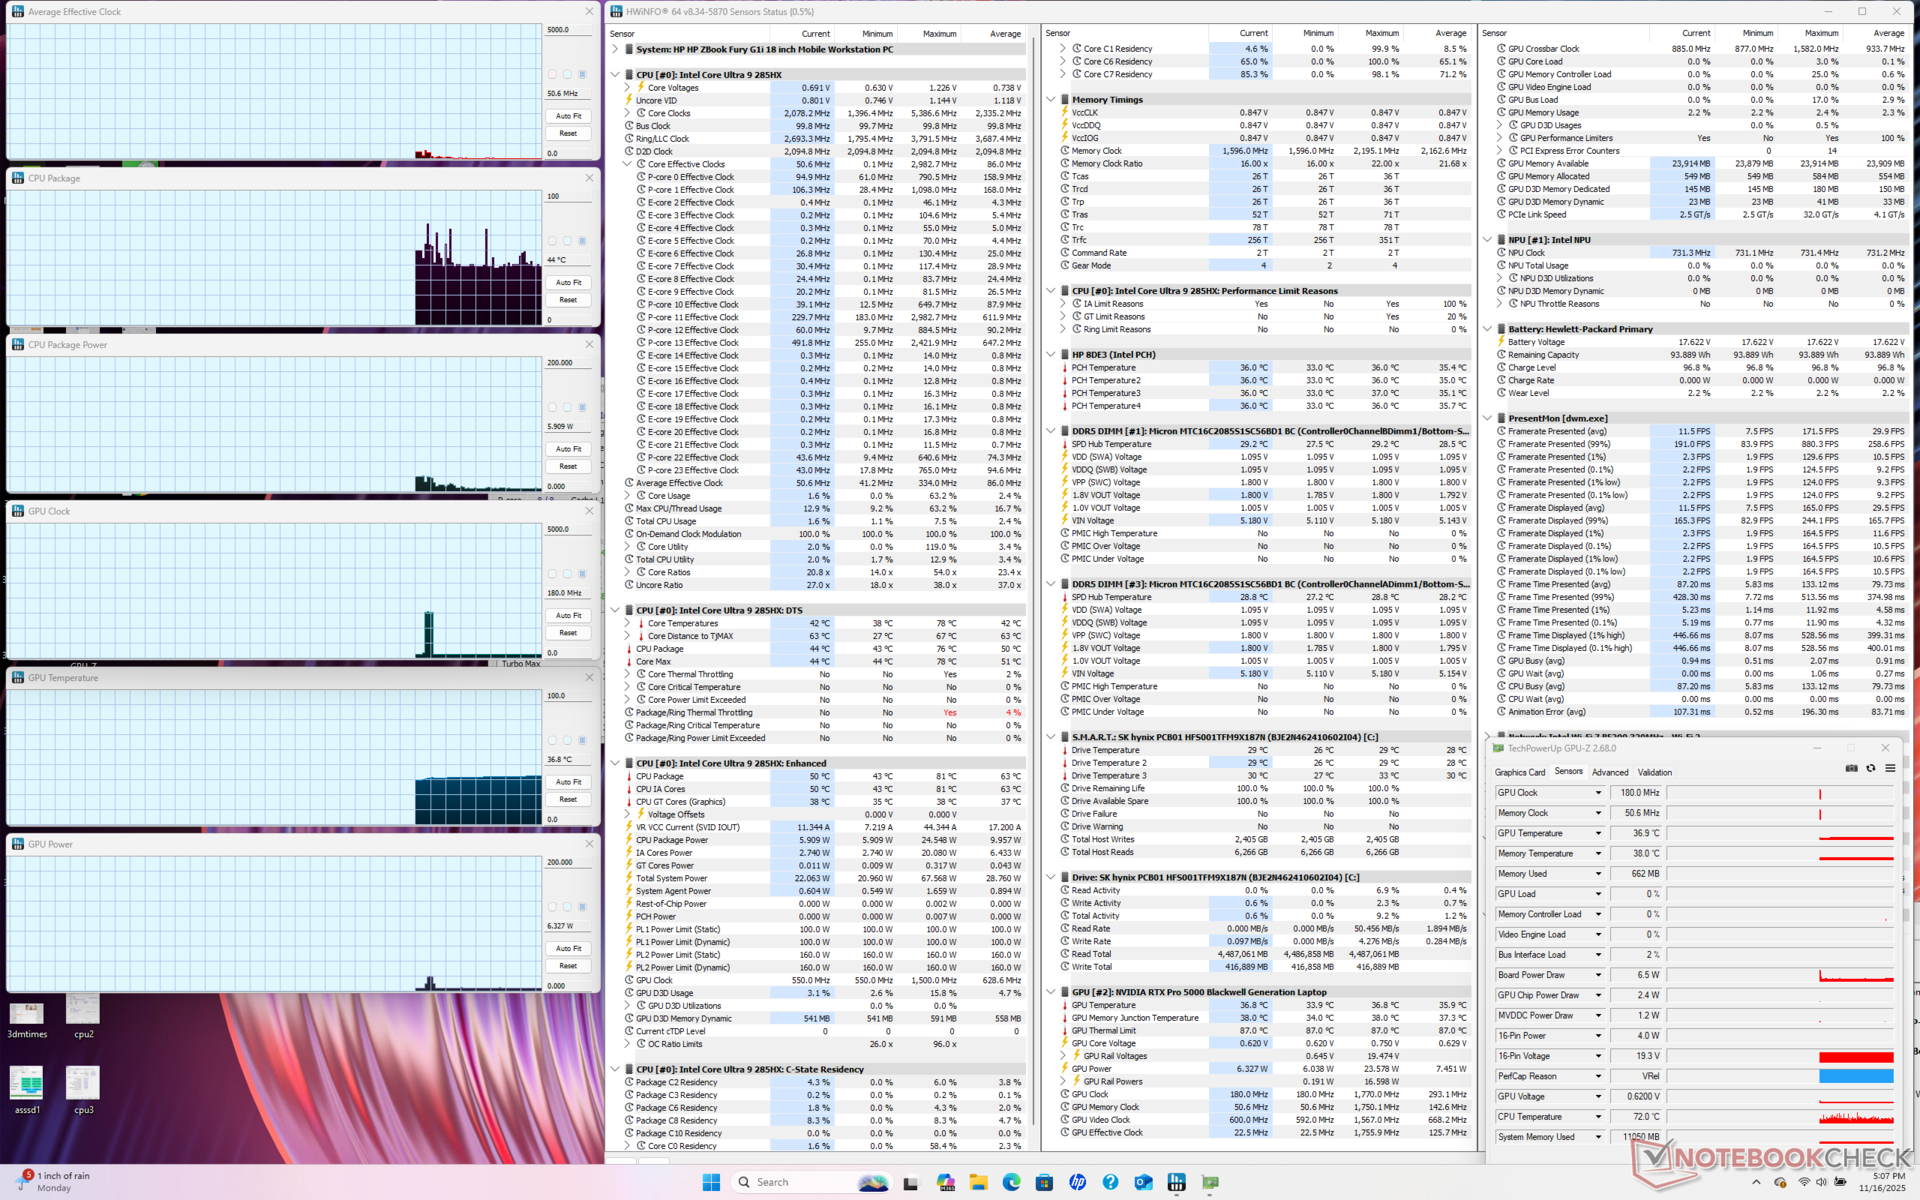
När Prime95 kördes för att stressa processorn ökade den genomsnittliga klockfrekvensen till 3,9 GHz, 99 C och 160 W under bara några sekunder innan den sjönk och stabiliserades på 3,3 GHz, 91 C och 89 W. Detta beteende liknar det vi observerade på Dell Pro Max 18 Plus, men med något lägre klockfrekvenser i genomsnitt på HP.
CPU- och GPU-temperaturerna när Cyberpunk 2077 kördes stabiliserades på 77 C respektive 64 C, jämfört med 104 C och 75 C på Dell Pro Max 18 Plus. Prestandan är dock något långsammare på HP med ett genomsnittligt GPU-effektuttag på bara 135 W jämfört med 163 W på Dell när båda systemen är inställda på prestandaläge.

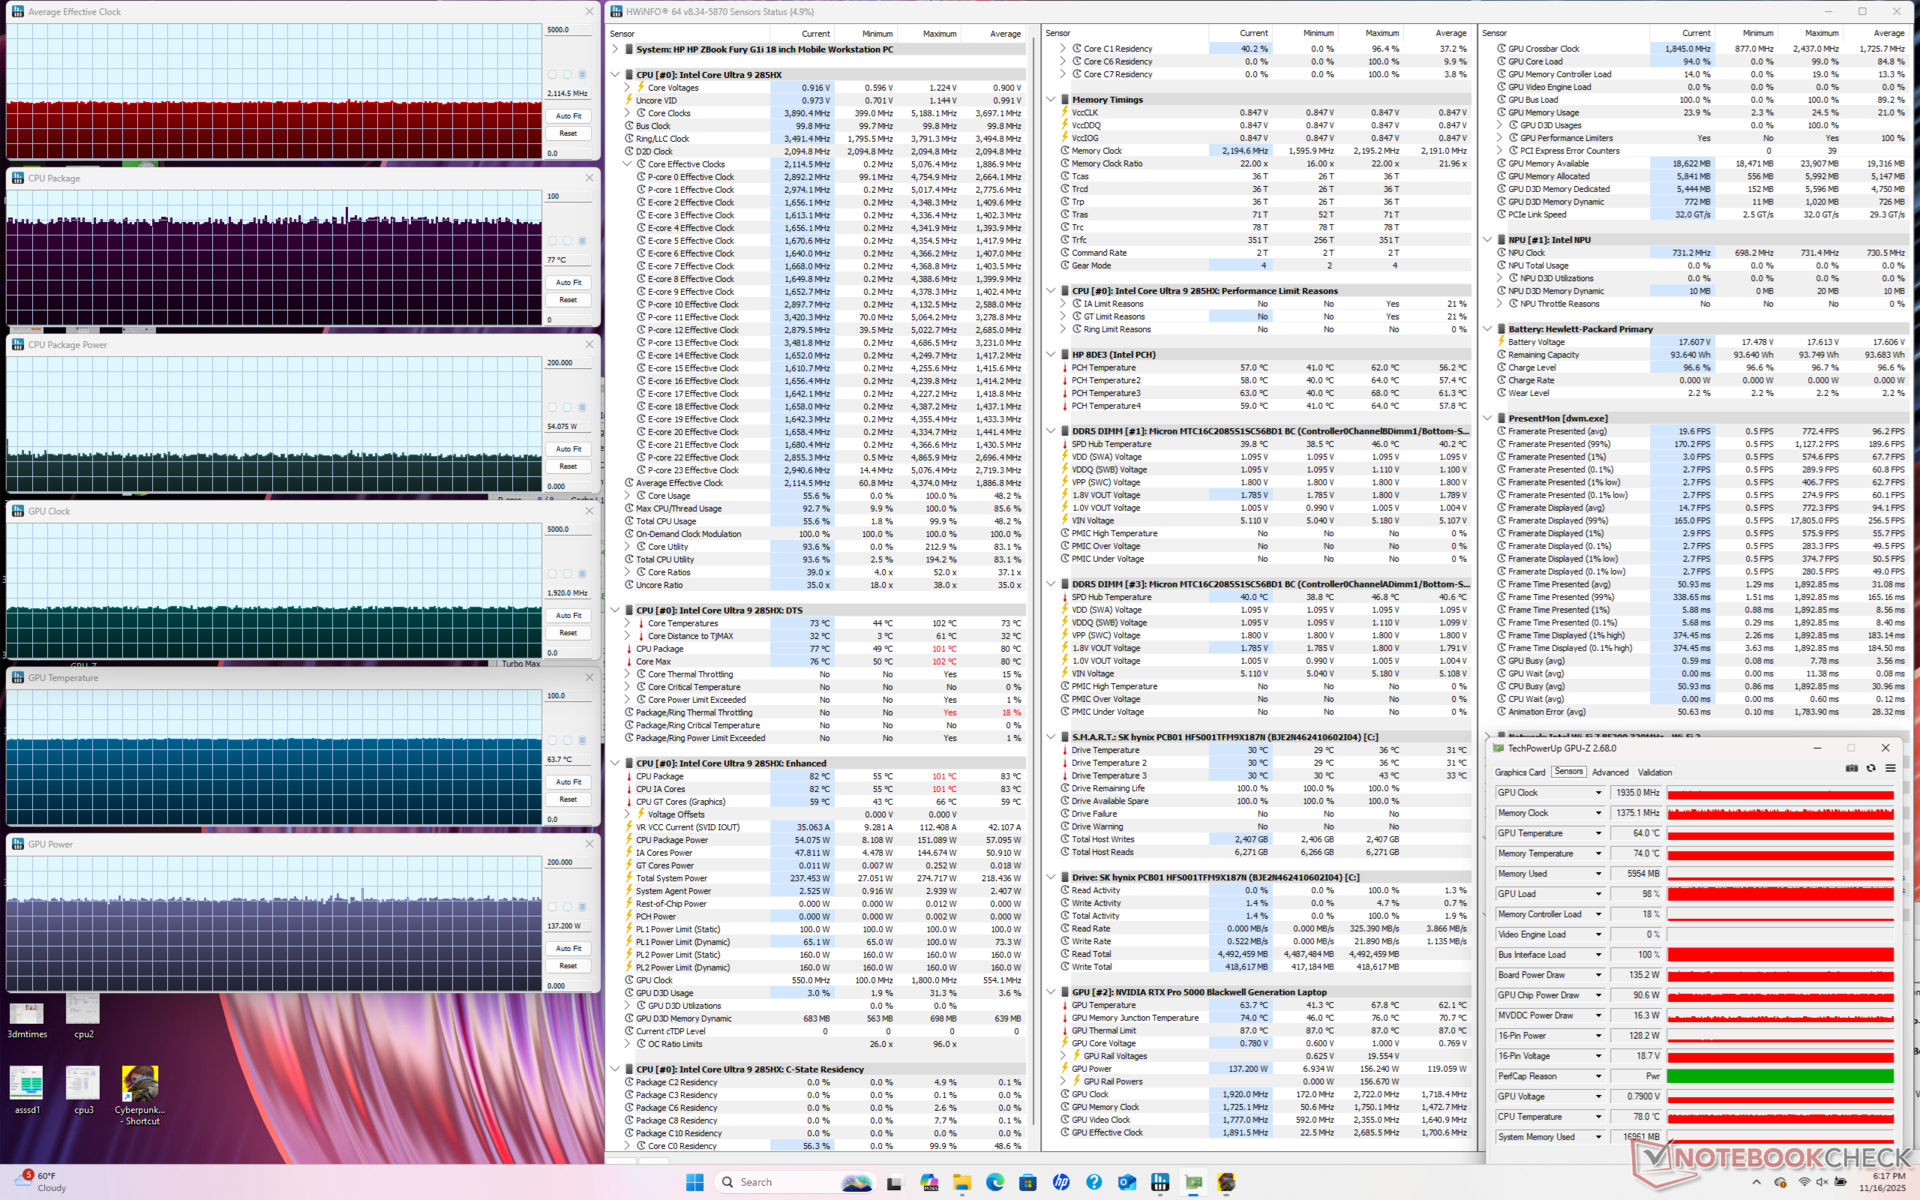
| Genomsnittlig CPU-klocka (GHz) | GPU-klocka (MHz) | Genomsnittlig CPU-temperatur (°C) | Genomsnittlig GPU-temperatur (°C) | |
| System i viloläge | -- | -- | 44 | 37 |
| Prime95 Stress | 3.3 | -- | 91 | 53 |
| Prime95 + FurMark Stress | 3.0 | 1882 | 86 | 65 |
| Cyberpunk 2077 Stress (Balanced Mode) | 2.0 | 1567 | 72 | 63 |
| Cyberpunk 2077 Stress (Performance Mode) | 2.1 | 1920 | 77 | 64 |
Systemets prestanda
PCMark 10 kunde inte köras färdigt oavsett GPU-inställningar och därför inkluderas inte dess resultat nedan. Observera att AIDA64-minnespoängen är betydligt långsammare än på Dell Pro Max 18 Plus eftersom RAM-tekniken är en av de viktigaste faktorerna som skiljer de två modellerna åt.
CrossMark: Overall | Productivity | Creativity | Responsiveness
WebXPRT 3: Overall
WebXPRT 4: Overall
Mozilla Kraken 1.1: Total
Geekbench AI: Quantized GPU 1.7 | Half Precision GPU 1.7 | Single Precision GPU 1.7
| Performance rating | |
| Dell Pro Max 18 Plus MB18250 | |
| Genomsnitt Intel Core Ultra 9 285HX, NVIDIA RTX PRO 5000 Blackwell Generation Laptop | |
| HP ZBook Fury G1i 18 | |
| Schenker Key 18 Pro M25 RTX 5090 | |
| Lenovo ThinkPad P16 Gen 2 -3! | |
| HP ZBook X G1i 16 | |
| HP ZBook Studio 16 G11 -3! | |
| CrossMark / Overall | |
| Dell Pro Max 18 Plus MB18250 | |
| Genomsnitt Intel Core Ultra 9 285HX, NVIDIA RTX PRO 5000 Blackwell Generation Laptop (2142 - 2267, n=3) | |
| HP ZBook Fury G1i 18 | |
| Schenker Key 18 Pro M25 RTX 5090 | |
| Lenovo ThinkPad P16 Gen 2 | |
| HP ZBook X G1i 16 | |
| HP ZBook Studio 16 G11 | |
| CrossMark / Productivity | |
| HP ZBook Fury G1i 18 | |
| Genomsnitt Intel Core Ultra 9 285HX, NVIDIA RTX PRO 5000 Blackwell Generation Laptop (2016 - 2028, n=3) | |
| Dell Pro Max 18 Plus MB18250 | |
| Schenker Key 18 Pro M25 RTX 5090 | |
| HP ZBook X G1i 16 | |
| Lenovo ThinkPad P16 Gen 2 | |
| HP ZBook Studio 16 G11 | |
| CrossMark / Creativity | |
| Dell Pro Max 18 Plus MB18250 | |
| Genomsnitt Intel Core Ultra 9 285HX, NVIDIA RTX PRO 5000 Blackwell Generation Laptop (2395 - 2725, n=3) | |
| HP ZBook Fury G1i 18 | |
| Lenovo ThinkPad P16 Gen 2 | |
| HP ZBook X G1i 16 | |
| Schenker Key 18 Pro M25 RTX 5090 | |
| HP ZBook Studio 16 G11 | |
| CrossMark / Responsiveness | |
| Schenker Key 18 Pro M25 RTX 5090 | |
| Dell Pro Max 18 Plus MB18250 | |
| Genomsnitt Intel Core Ultra 9 285HX, NVIDIA RTX PRO 5000 Blackwell Generation Laptop (1806 - 1858, n=3) | |
| HP ZBook Fury G1i 18 | |
| Lenovo ThinkPad P16 Gen 2 | |
| HP ZBook X G1i 16 | |
| HP ZBook Studio 16 G11 | |
| WebXPRT 3 / Overall | |
| HP ZBook Fury G1i 18 | |
| Dell Pro Max 18 Plus MB18250 | |
| Genomsnitt Intel Core Ultra 9 285HX, NVIDIA RTX PRO 5000 Blackwell Generation Laptop (327 - 360, n=3) | |
| Schenker Key 18 Pro M25 RTX 5090 | |
| Lenovo ThinkPad P16 Gen 2 | |
| HP ZBook X G1i 16 | |
| HP ZBook Studio 16 G11 | |
| WebXPRT 4 / Overall | |
| HP ZBook Fury G1i 18 | |
| Schenker Key 18 Pro M25 RTX 5090 | |
| Genomsnitt Intel Core Ultra 9 285HX, NVIDIA RTX PRO 5000 Blackwell Generation Laptop (306 - 323, n=3) | |
| Dell Pro Max 18 Plus MB18250 | |
| Lenovo ThinkPad P16 Gen 2 | |
| HP ZBook X G1i 16 | |
| HP ZBook Studio 16 G11 | |
| Mozilla Kraken 1.1 / Total | |
| HP ZBook Studio 16 G11 | |
| HP ZBook X G1i 16 | |
| Lenovo ThinkPad P16 Gen 2 | |
| Dell Pro Max 18 Plus MB18250 | |
| Genomsnitt Intel Core Ultra 9 285HX, NVIDIA RTX PRO 5000 Blackwell Generation Laptop (411 - 439, n=3) | |
| Schenker Key 18 Pro M25 RTX 5090 | |
| HP ZBook Fury G1i 18 | |
| Geekbench AI / Quantized GPU 1.7 | |
| Dell Pro Max 18 Plus MB18250 | |
| Schenker Key 18 Pro M25 RTX 5090 | |
| Genomsnitt Intel Core Ultra 9 285HX, NVIDIA RTX PRO 5000 Blackwell Generation Laptop (22519 - 24656, n=3) | |
| HP ZBook Fury G1i 18 | |
| HP ZBook X G1i 16 | |
| Geekbench AI / Half Precision GPU 1.7 | |
| Dell Pro Max 18 Plus MB18250 | |
| Genomsnitt Intel Core Ultra 9 285HX, NVIDIA RTX PRO 5000 Blackwell Generation Laptop (51812 - 55275, n=3) | |
| Schenker Key 18 Pro M25 RTX 5090 | |
| HP ZBook Fury G1i 18 | |
| HP ZBook X G1i 16 | |
| Geekbench AI / Single Precision GPU 1.7 | |
| Dell Pro Max 18 Plus MB18250 | |
| Schenker Key 18 Pro M25 RTX 5090 | |
| Genomsnitt Intel Core Ultra 9 285HX, NVIDIA RTX PRO 5000 Blackwell Generation Laptop (28665 - 32028, n=3) | |
| HP ZBook Fury G1i 18 | |
| HP ZBook X G1i 16 | |
* ... mindre är bättre
| AIDA64 / Memory Copy | |
| Dell Pro Max 18 Plus MB18250 | |
| Genomsnitt Intel Core Ultra 9 285HX (63431 - 93933, n=6) | |
| HP ZBook Studio 16 G11 | |
| HP ZBook Fury G1i 18 | |
| Lenovo ThinkPad P16 Gen 2 | |
| Schenker Key 18 Pro M25 RTX 5090 | |
| AIDA64 / Memory Read | |
| Dell Pro Max 18 Plus MB18250 | |
| Genomsnitt Intel Core Ultra 9 285HX (67084 - 97565, n=6) | |
| HP ZBook Studio 16 G11 | |
| Lenovo ThinkPad P16 Gen 2 | |
| HP ZBook Fury G1i 18 | |
| Schenker Key 18 Pro M25 RTX 5090 | |
| AIDA64 / Memory Write | |
| Dell Pro Max 18 Plus MB18250 | |
| Genomsnitt Intel Core Ultra 9 285HX (64112 - 89691, n=6) | |
| HP ZBook Studio 16 G11 | |
| HP ZBook Fury G1i 18 | |
| Lenovo ThinkPad P16 Gen 2 | |
| Schenker Key 18 Pro M25 RTX 5090 | |
| AIDA64 / Memory Latency | |
| Schenker Key 18 Pro M25 RTX 5090 | |
| HP ZBook Fury G1i 18 | |
| Genomsnitt Intel Core Ultra 9 285HX (104.8 - 151.7, n=6) | |
| HP ZBook Studio 16 G11 | |
| Dell Pro Max 18 Plus MB18250 | |
| Lenovo ThinkPad P16 Gen 2 | |
* ... mindre är bättre
DPC-fördröjning

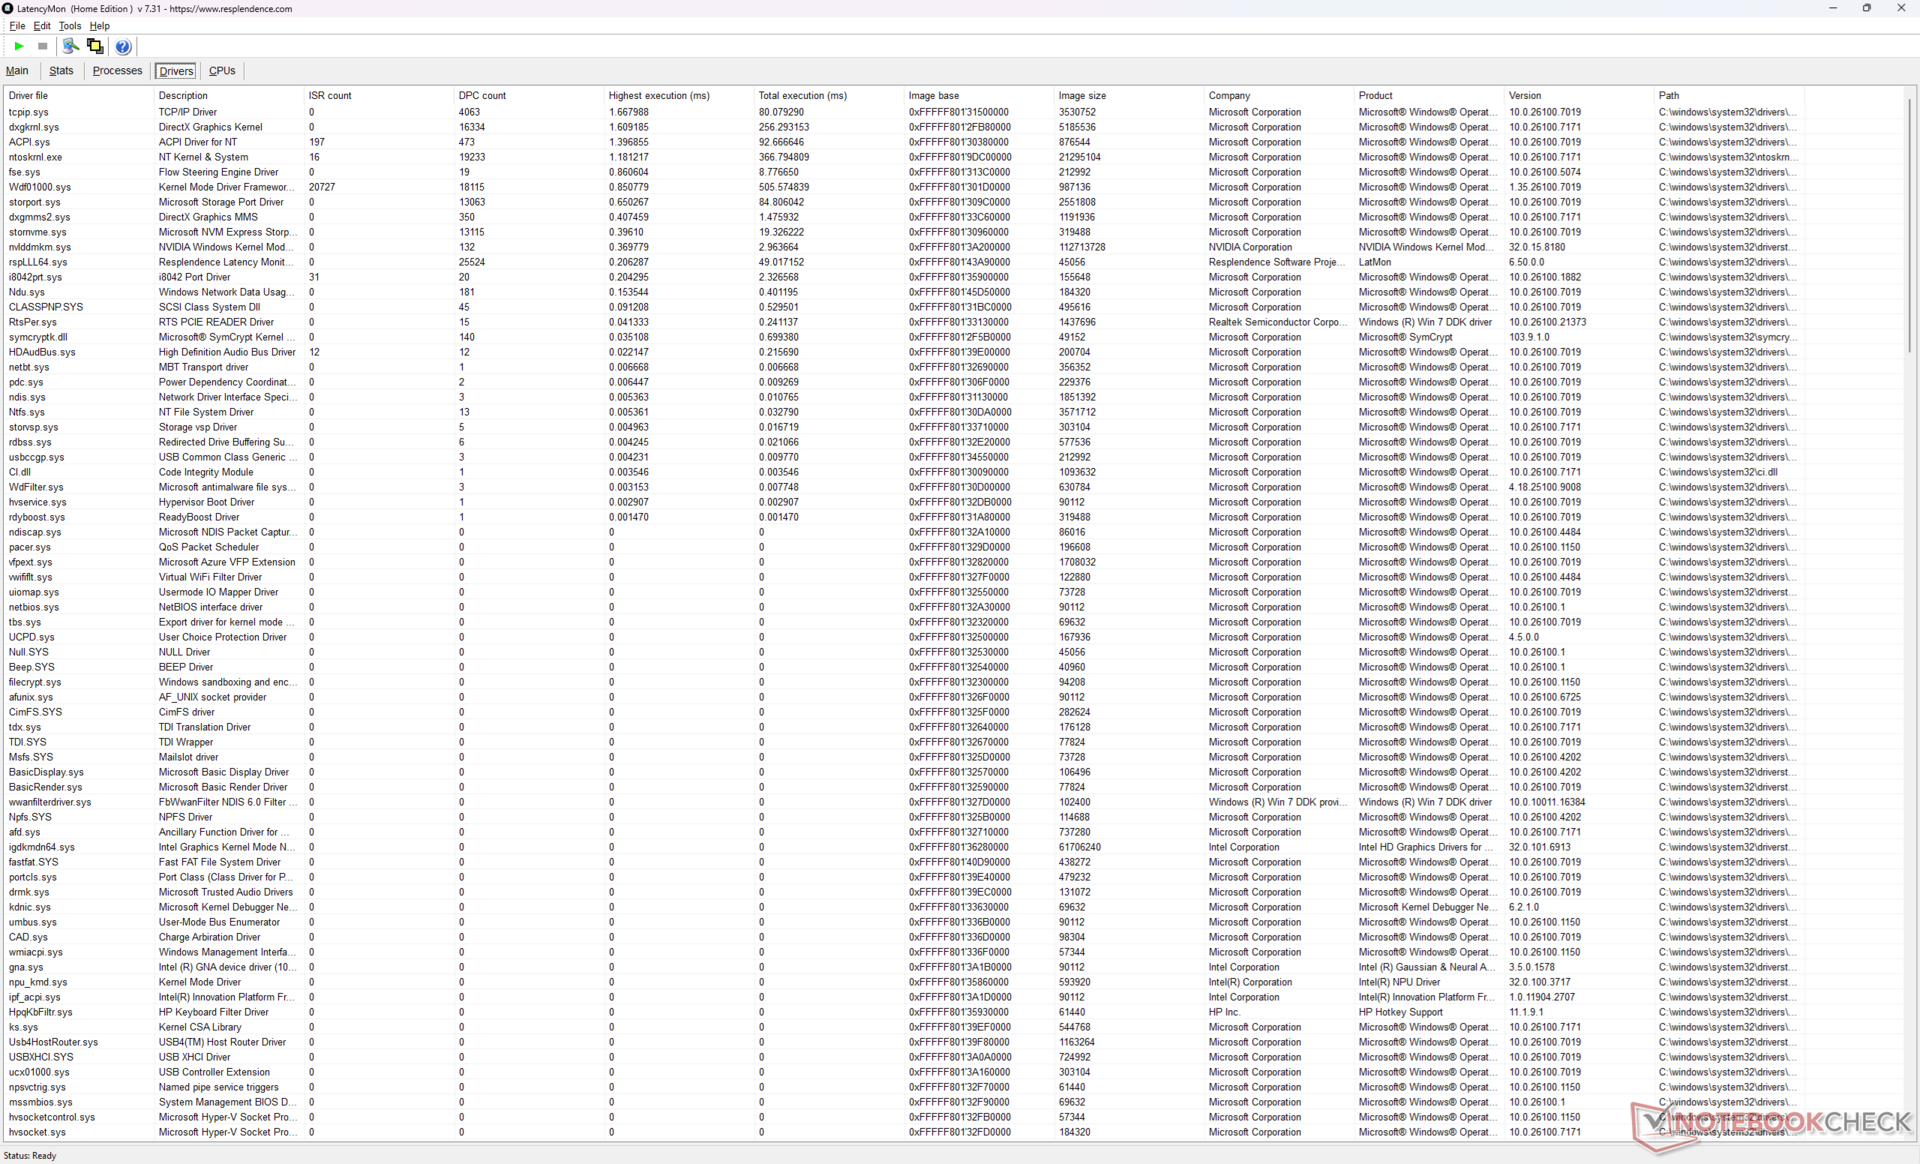
| DPC Latencies / LatencyMon - interrupt to process latency (max), Web, Youtube, Prime95 | |
| Schenker Key 18 Pro M25 RTX 5090 | |
| HP ZBook Fury G1i 18 | |
| HP ZBook Studio 16 G11 | |
| Dell Pro Max 18 Plus MB18250 | |
| Lenovo ThinkPad P16 Gen 2 | |
| HP ZBook X G1i 16 | |
* ... mindre är bättre
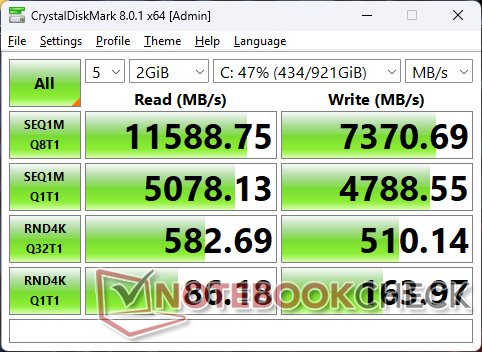
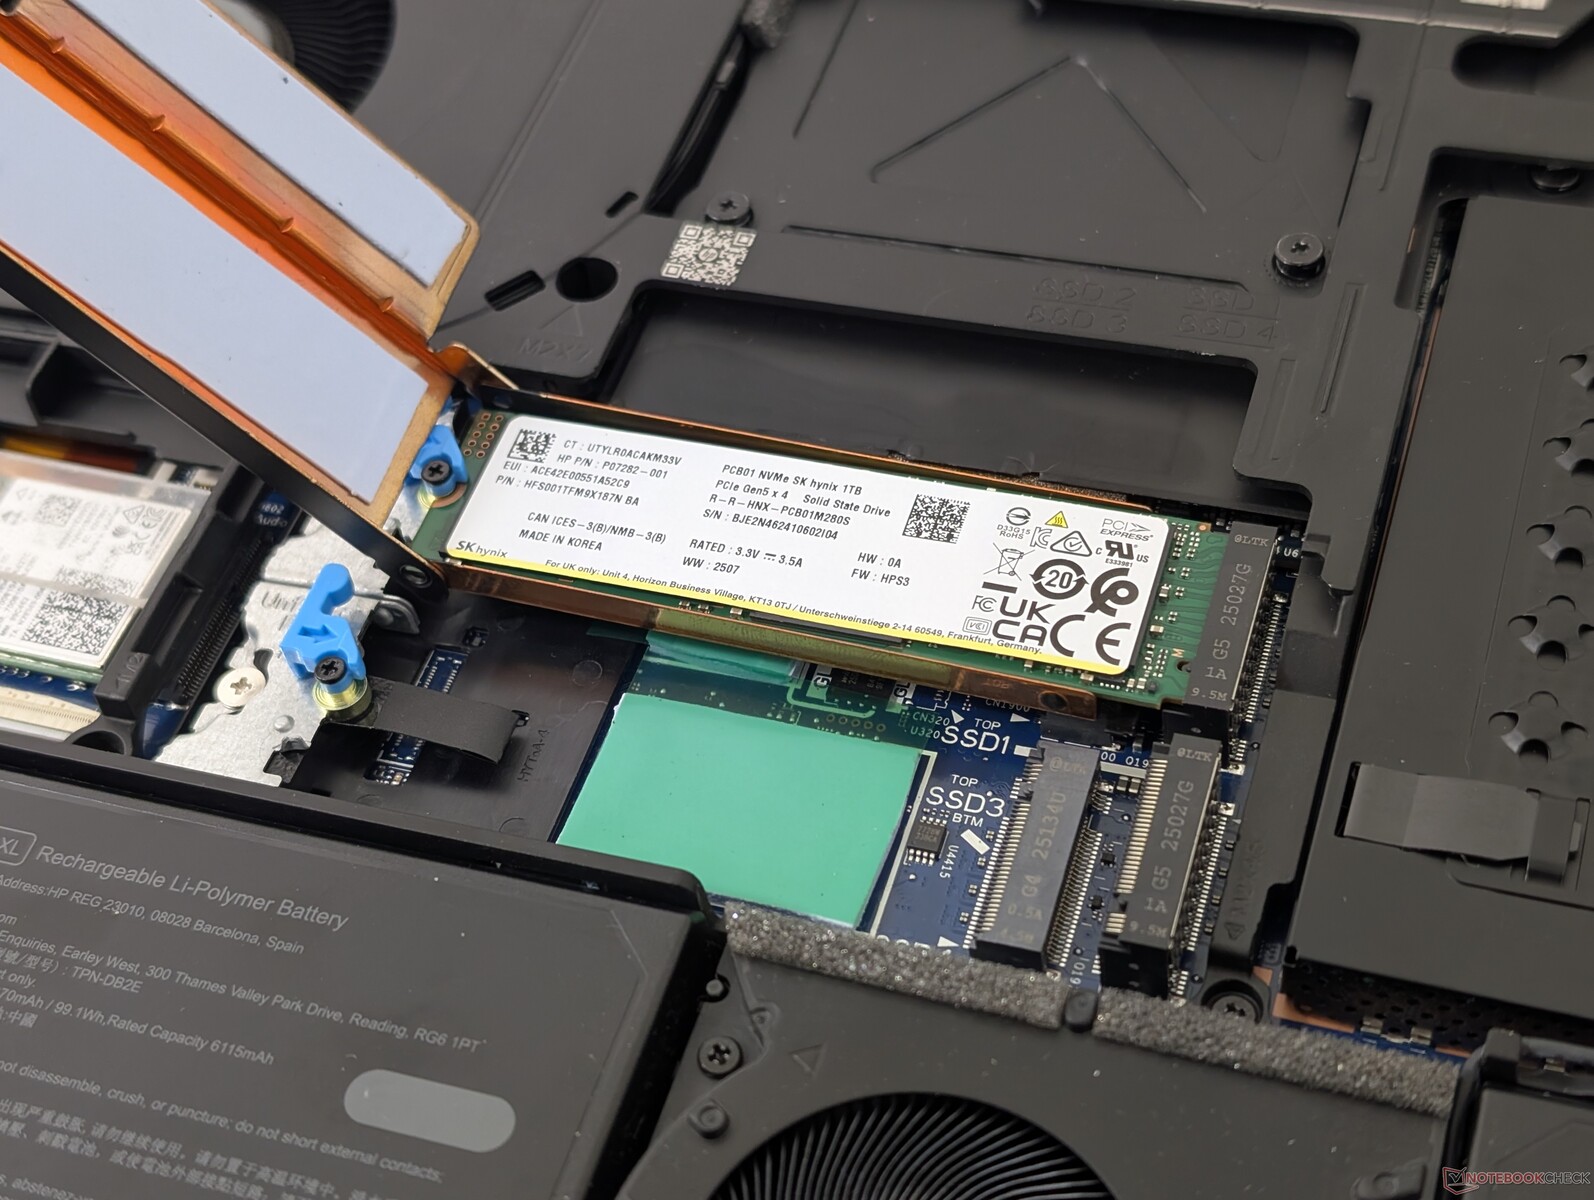
Lagringsenheter
Vår enhet levereras med SK Hynix PCB01 PCIe5 x4 NVMe SSD för stabila överföringshastigheter på cirka 12000 MB/s. HP har stöd för upp till fyra individuella M.2 2280 SSD-enheter medan Dell Pro Max 18 Plus endast har stöd för upp till två.


| Drive Performance rating - Percent | |
| Schenker Key 18 Pro M25 RTX 5090 | |
| HP ZBook Fury G1i 18 | |
| HP ZBook X G1i 16 | |
| Dell Pro Max 18 Plus MB18250 | |
| Lenovo ThinkPad P16 Gen 2 | |
| HP ZBook Studio 16 G11 | |
* ... mindre är bättre
Diskbegränsning: DiskSpd läsloop, ködjup 8
GPU-prestanda
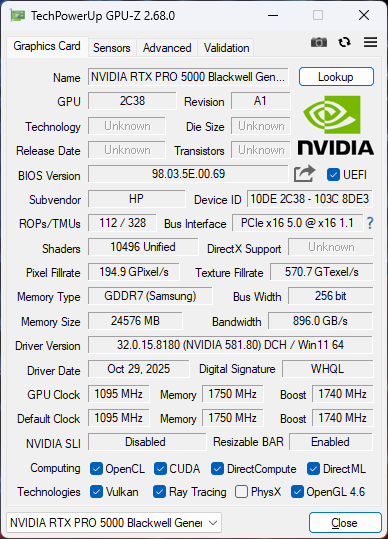
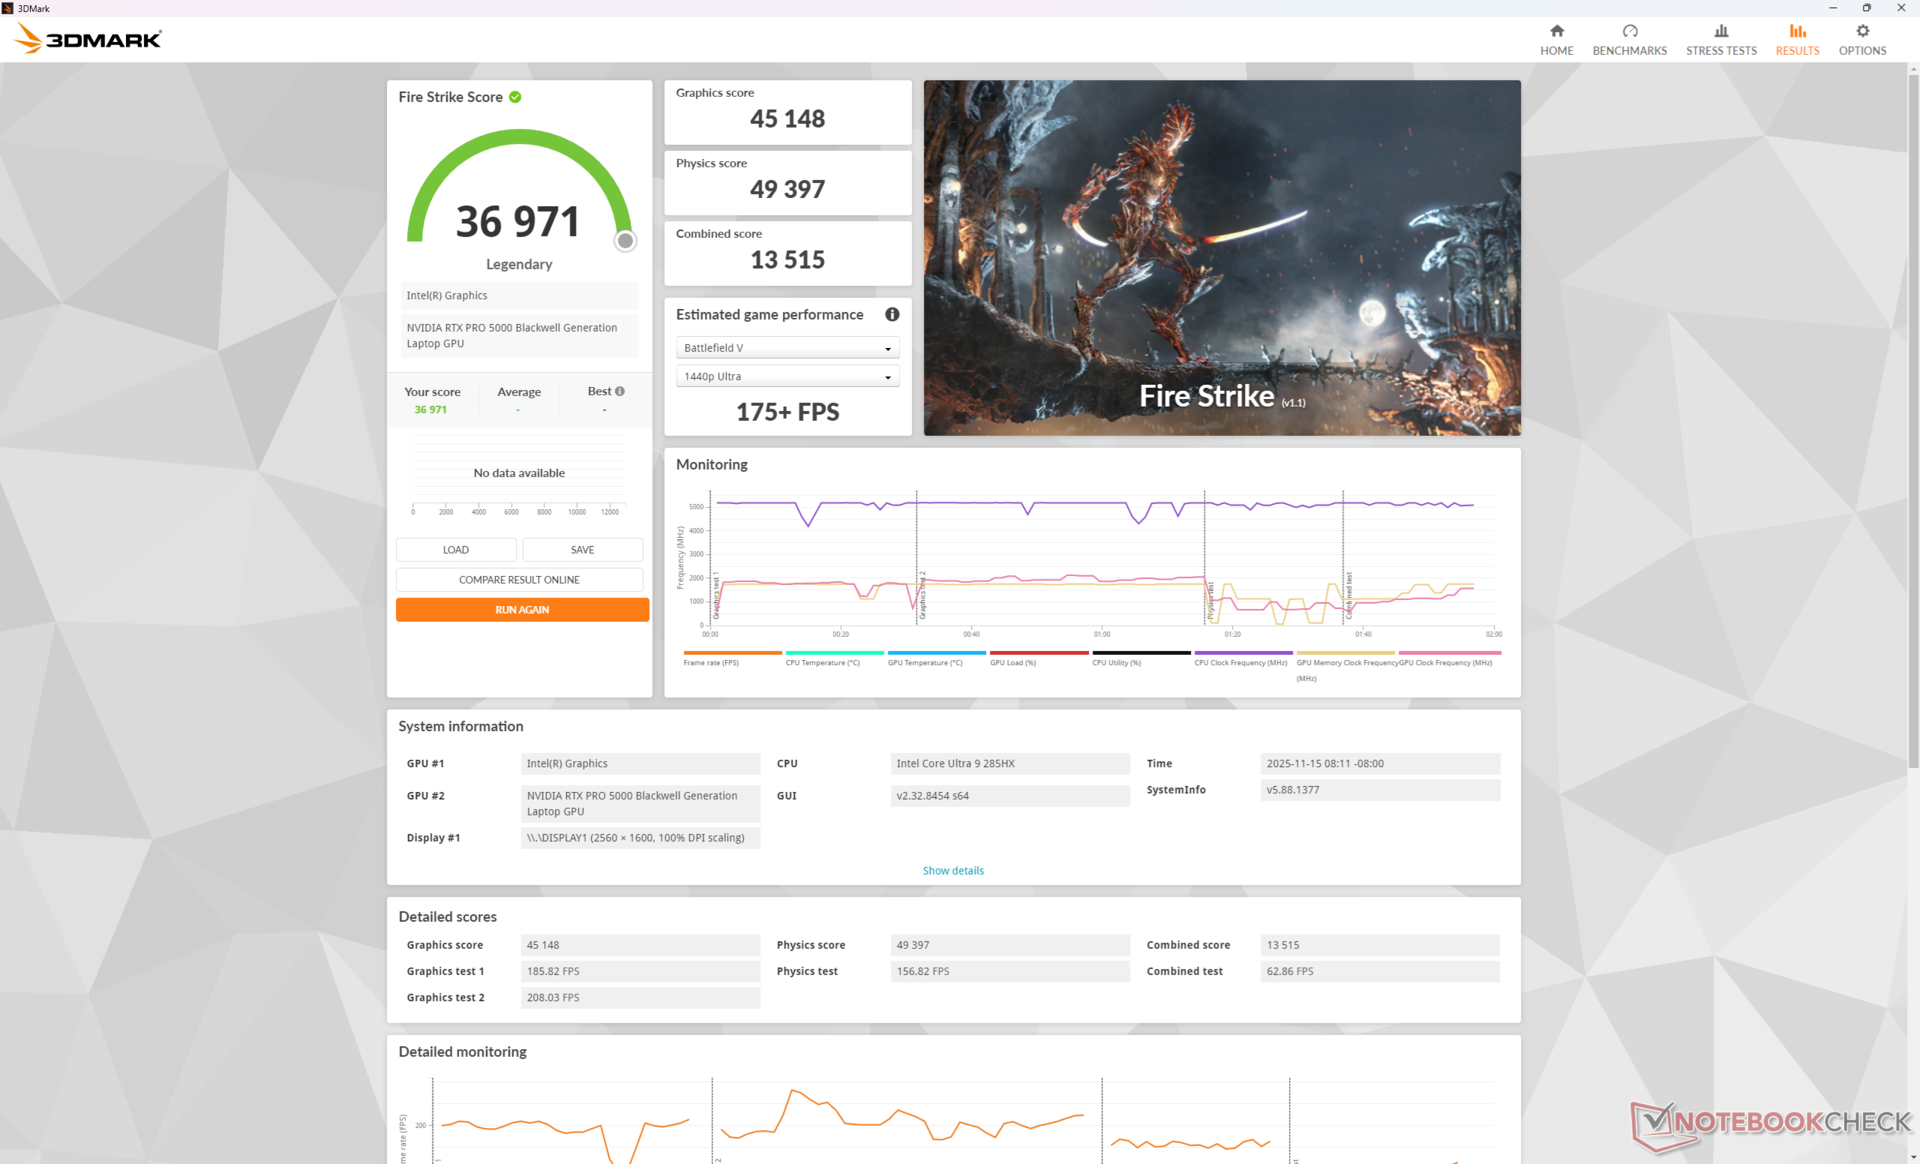
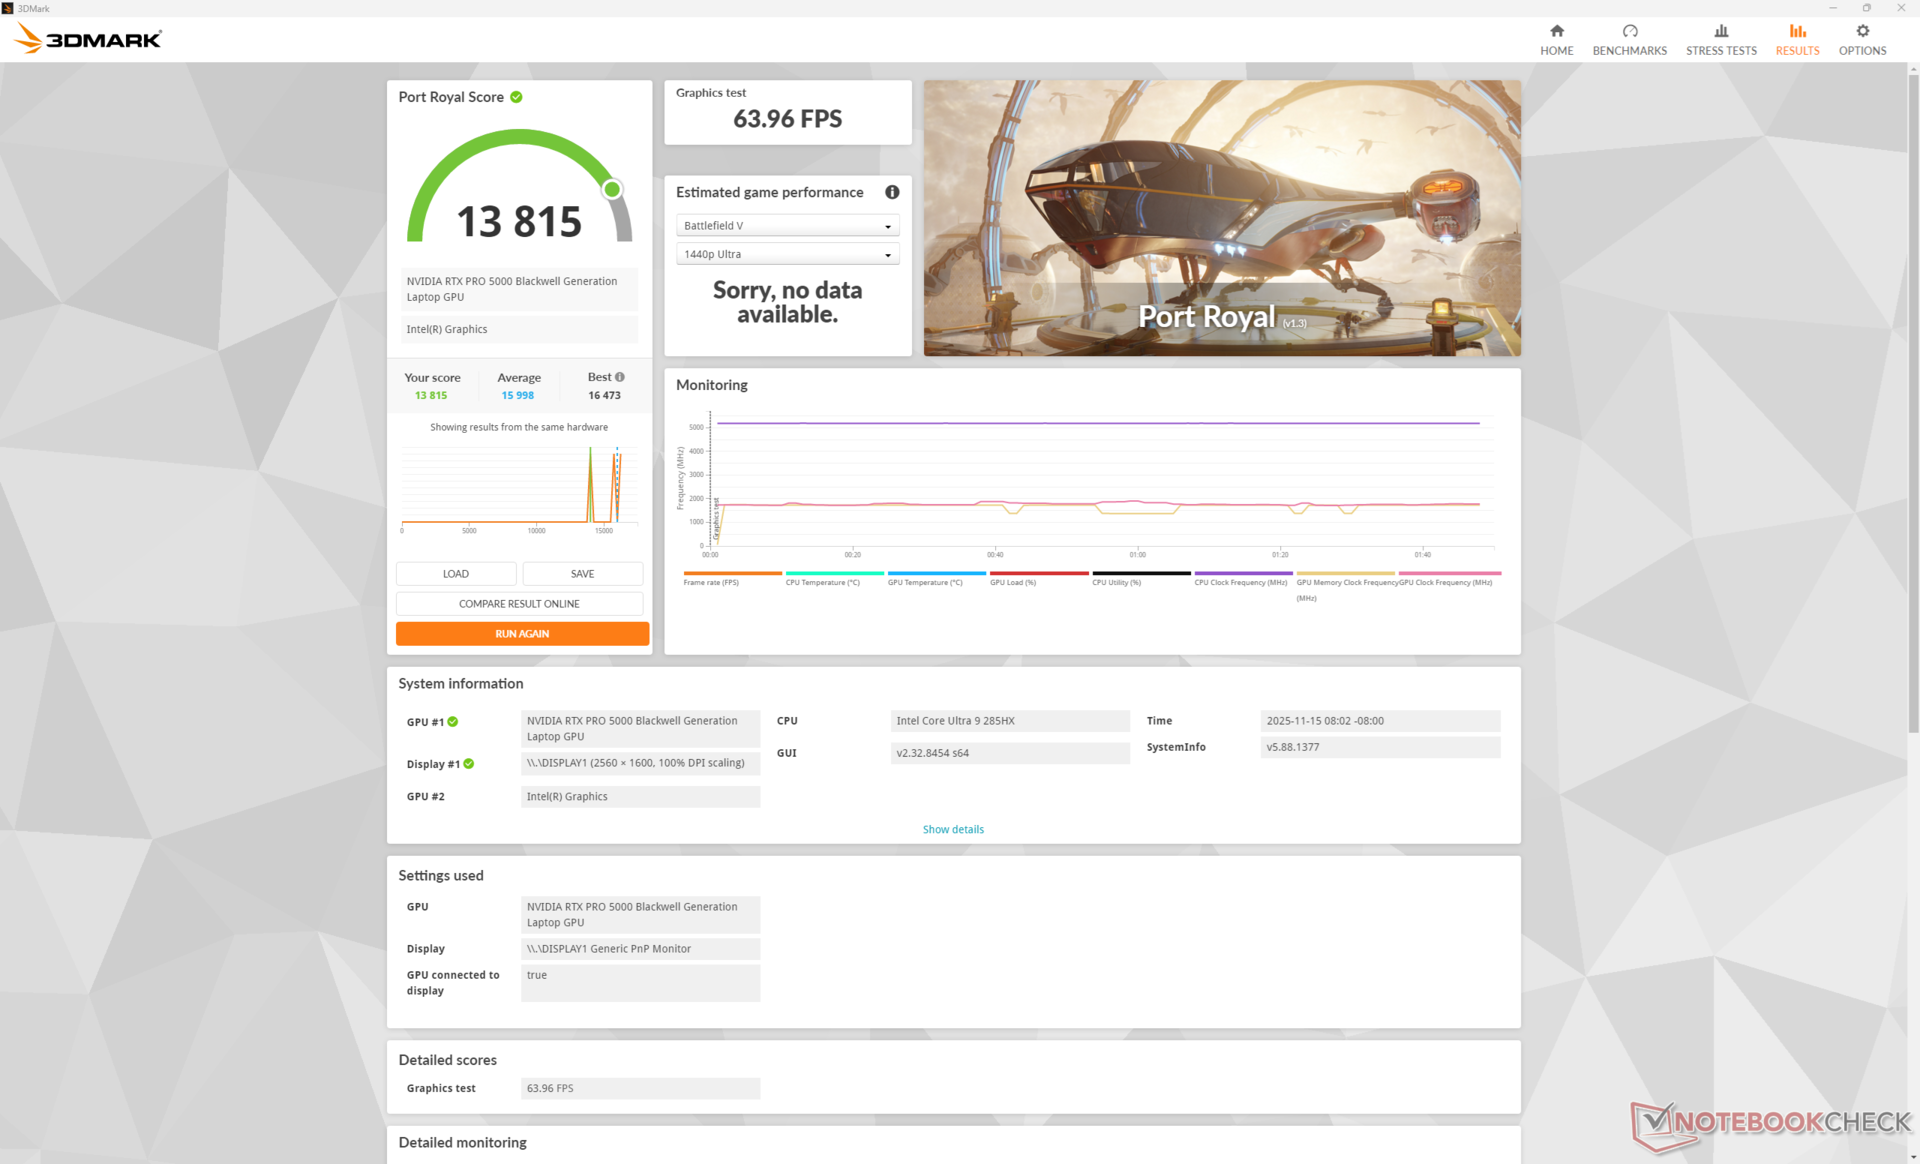
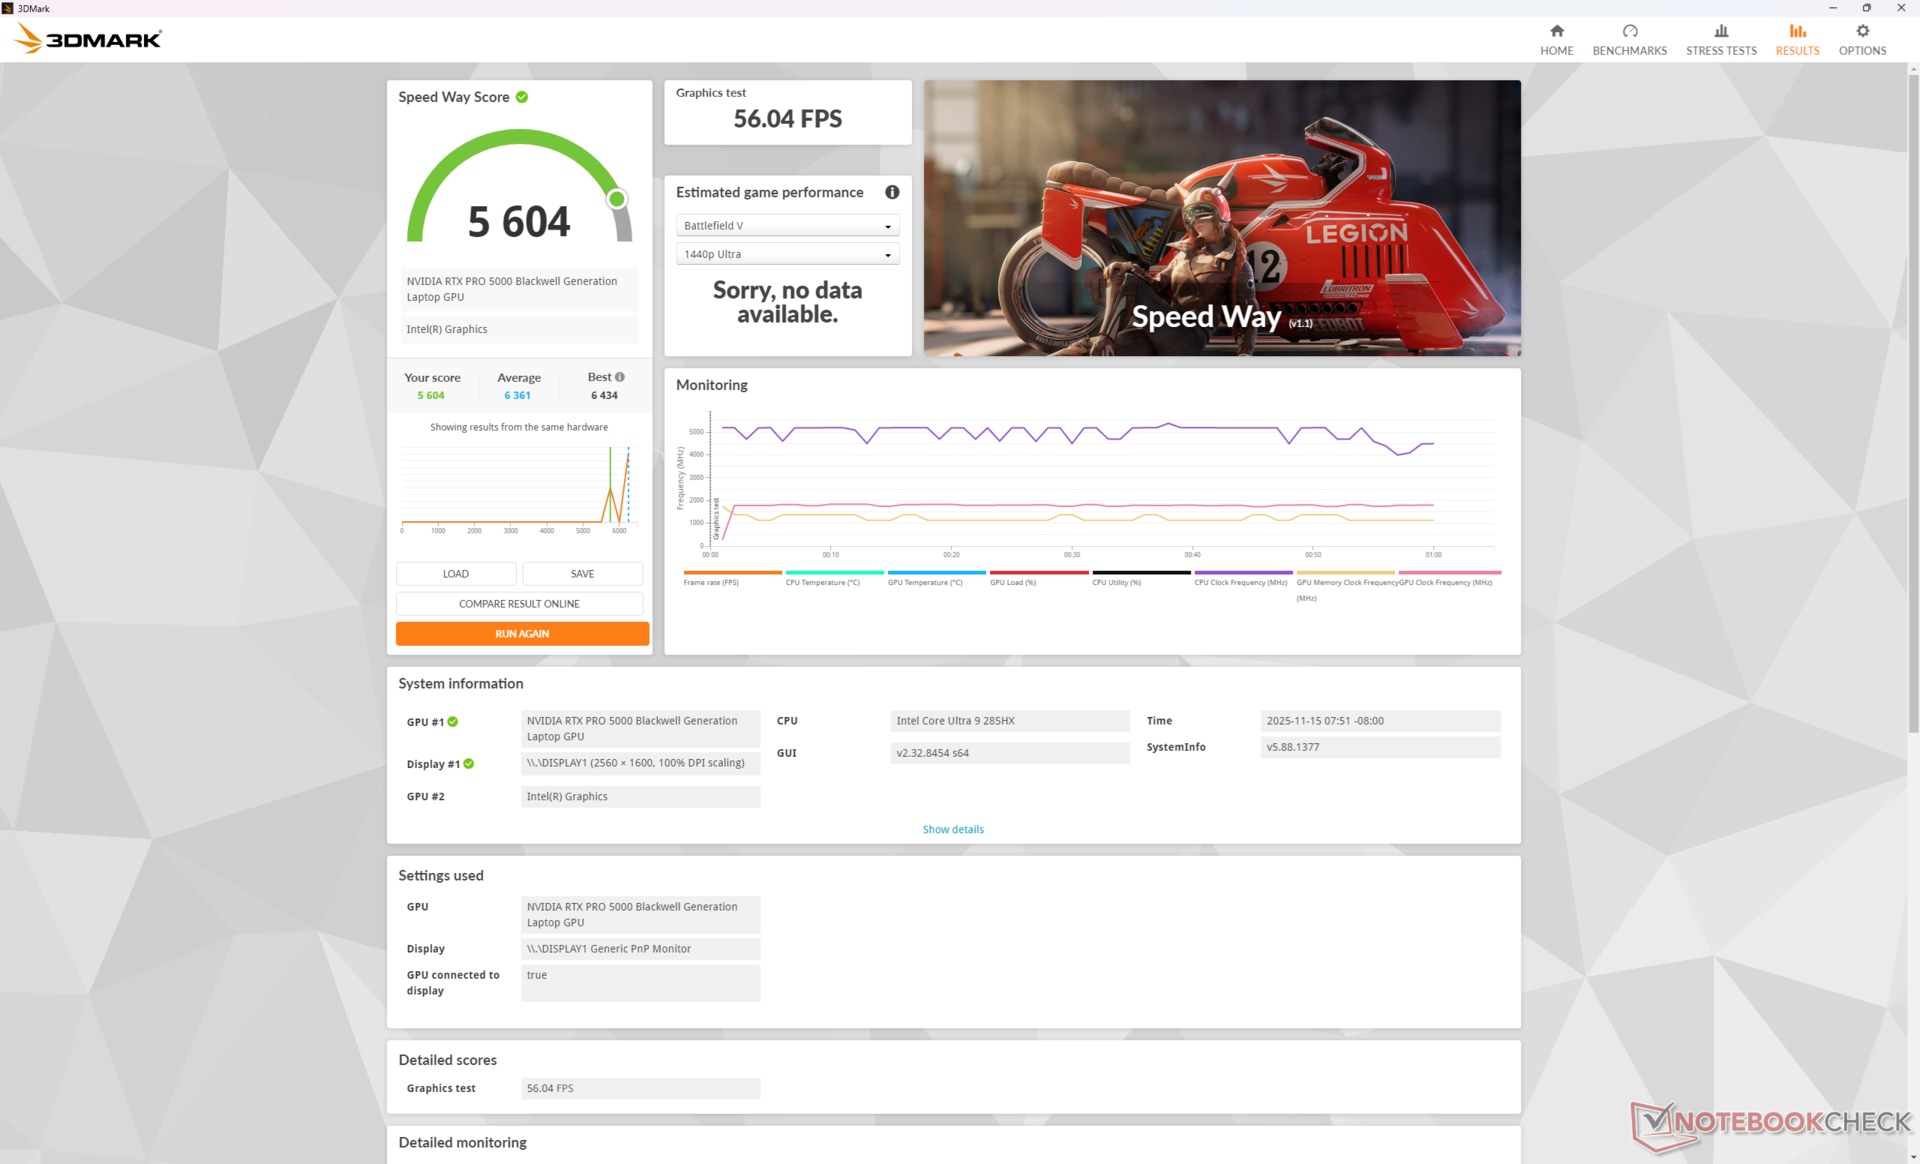
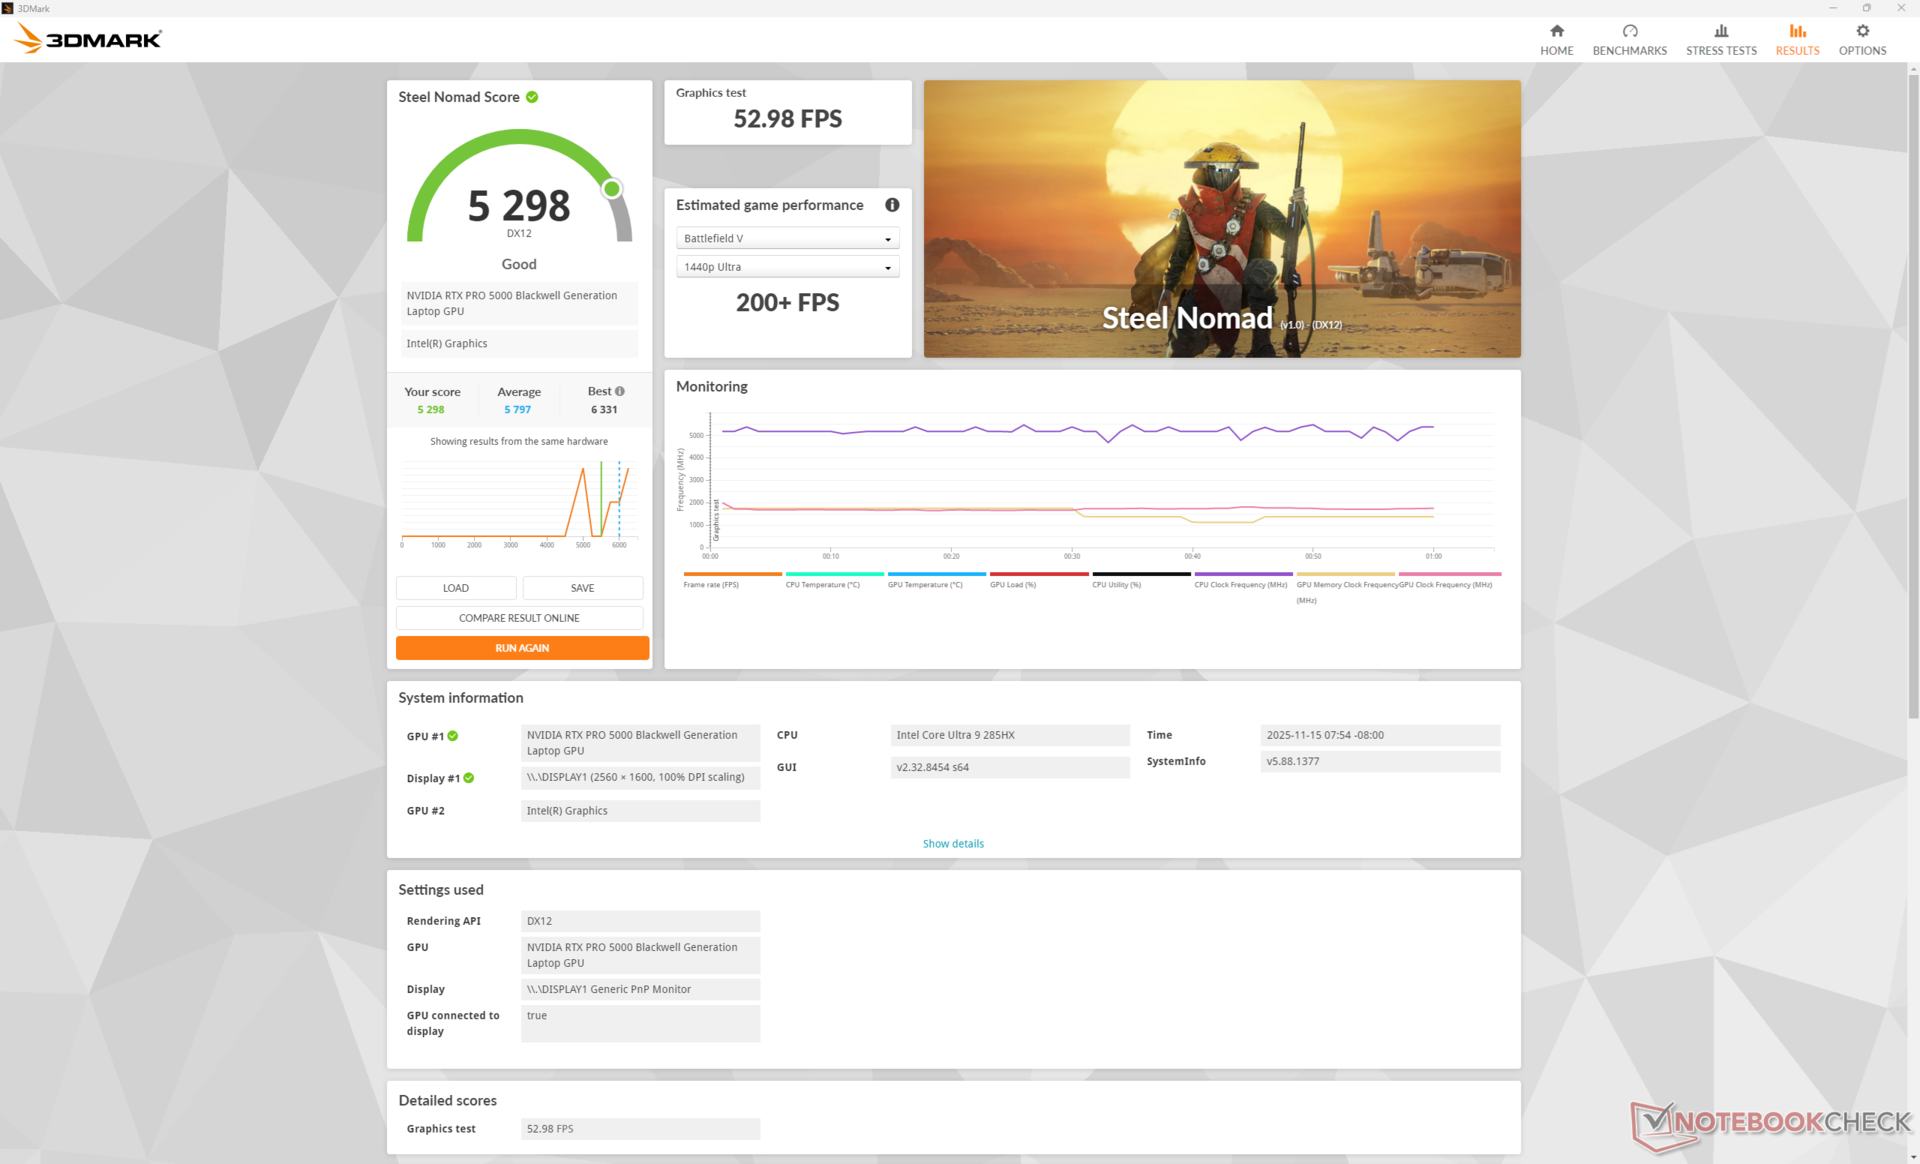
Nvidia RTX Pro 5000 Nvidia RTX Pro 5000 Blackwell i vår HP går genomgående långsammare än samma GPU i Dell Pro Max 18 Plus. Detta beror till stor del på att GPU:n i HP riktar in sig på 150 W medan GPU:n i Dell riktar in sig på 175 W för något snabbare prestanda. Prestandafördelarna jämfört med förra generationens Ada-alternativ är ändå mer betydande.
| Effektprofil | Grafikpoäng | Fysikpoäng | Kombinerad poäng |
| Prestanda-läge | 45148 | 49397 | 13515 |
| Balanserat läge | 43709 (-3%) | 48299 (-2%) | 11177 (-17%) |
| Batterikraft | 28042 (-38%) | 21361 (-57%) | 7409 (-45%) |
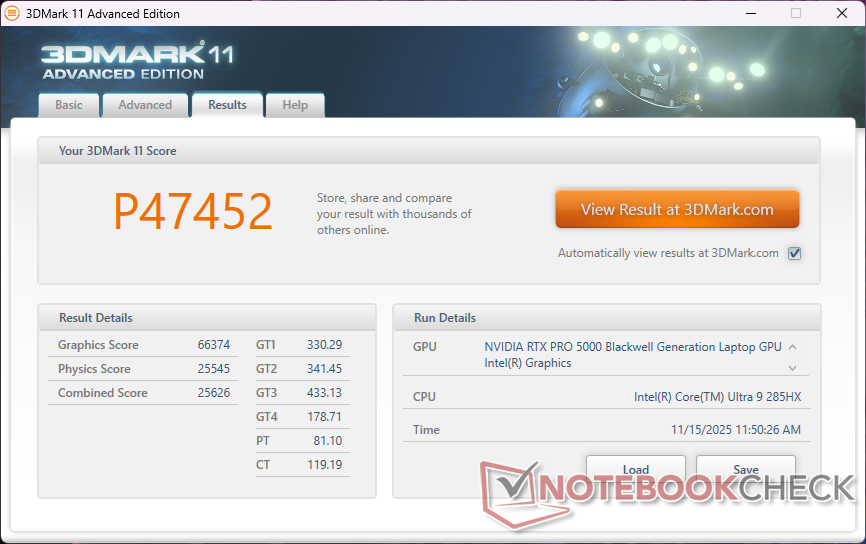

| 3DMark 11 Performance | 47452 poäng | |
| 3DMark Cloud Gate Standard Score | 51342 poäng | |
| 3DMark Fire Strike Score | 36971 poäng | |
| 3DMark Time Spy Score | 19519 poäng | |
| 3DMark Steel Nomad Score | 5298 poäng | |
Hjälp | ||
* ... mindre är bättre
| Performance rating - Percent | |
| Dell Pro Max 18 Plus MB18250 | |
| Schenker Key 18 Pro M25 RTX 5090 | |
| HP ZBook Fury G1i 18 | |
| Lenovo ThinkPad P16 Gen 2 | |
| HP ZBook X G1i 16 | |
| HP ZBook Studio 16 G11 | |
| Cyberpunk 2077 - 1920x1080 Ultra Preset (FSR off) | |
| Dell Pro Max 18 Plus MB18250 | |
| Schenker Key 18 Pro M25 RTX 5090 | |
| HP ZBook Fury G1i 18 | |
| Lenovo ThinkPad P16 Gen 2 | |
| HP ZBook X G1i 16 | |
| HP ZBook Studio 16 G11 | |
| Baldur's Gate 3 - 1920x1080 Ultra Preset AA:T | |
| Dell Pro Max 18 Plus MB18250 | |
| Schenker Key 18 Pro M25 RTX 5090 | |
| HP ZBook Fury G1i 18 | |
| Lenovo ThinkPad P16 Gen 2 | |
| HP ZBook Studio 16 G11 | |
| HP ZBook X G1i 16 | |
| GTA V - 1920x1080 Highest AA:4xMSAA + FX AF:16x | |
| Dell Pro Max 18 Plus MB18250 | |
| Schenker Key 18 Pro M25 RTX 5090 | |
| HP ZBook Fury G1i 18 | |
| Lenovo ThinkPad P16 Gen 2 | |
| HP ZBook X G1i 16 | |
| HP ZBook Studio 16 G11 | |
| Final Fantasy XV Benchmark - 1920x1080 High Quality | |
| Dell Pro Max 18 Plus MB18250 | |
| HP ZBook Fury G1i 18 | |
| Schenker Key 18 Pro M25 RTX 5090 | |
| Lenovo ThinkPad P16 Gen 2 | |
| HP ZBook X G1i 16 | |
| HP ZBook Studio 16 G11 | |
| Strange Brigade - 1920x1080 ultra AA:ultra AF:16 | |
| Dell Pro Max 18 Plus MB18250 | |
| HP ZBook Fury G1i 18 | |
| Schenker Key 18 Pro M25 RTX 5090 | |
| Lenovo ThinkPad P16 Gen 2 | |
| HP ZBook Studio 16 G11 | |
| HP ZBook X G1i 16 | |
| Dota 2 Reborn - 1920x1080 ultra (3/3) best looking | |
| Lenovo ThinkPad P16 Gen 2 | |
| Dell Pro Max 18 Plus MB18250 | |
| HP ZBook Fury G1i 18 | |
| Schenker Key 18 Pro M25 RTX 5090 | |
| HP ZBook Studio 16 G11 | |
| HP ZBook X G1i 16 | |
| X-Plane 11.11 - 1920x1080 high (fps_test=3) | |
| Lenovo ThinkPad P16 Gen 2 | |
| Dell Pro Max 18 Plus MB18250 | |
| Schenker Key 18 Pro M25 RTX 5090 | |
| HP ZBook Fury G1i 18 | |
| HP ZBook Studio 16 G11 | |
| HP ZBook X G1i 16 | |
| F1 24 | |
| 3840x2160 Ultra High Preset AA:T AF:16x | |
| Dell Pro Max 18 Plus MB18250 | |
| Genomsnitt NVIDIA RTX PRO 5000 Blackwell Generation Laptop (43.2 - 50.2, n=3) | |
| HP ZBook Fury G1i 18 | |
| Schenker Key 18 Pro M25 RTX 5090 | |
| 3840x2160 Ultra High Preset + Quality DLSS AF:16x | |
| Dell Pro Max 18 Plus MB18250 | |
| Genomsnitt NVIDIA RTX PRO 5000 Blackwell Generation Laptop (71.8 - 85.7, n=3) | |
| HP ZBook Fury G1i 18 | |
| Schenker Key 18 Pro M25 RTX 5090 | |
| 2560x1440 Ultra High Preset + Quality DLSS AF:16x | |
| Dell Pro Max 18 Plus MB18250 | |
| Genomsnitt NVIDIA RTX PRO 5000 Blackwell Generation Laptop (126.8 - 148.6, n=3) | |
| HP ZBook Fury G1i 18 | |
| Schenker Key 18 Pro M25 RTX 5090 | |
| HP ZBook X G1i 16 | |
| GTA V | |
| 3840x2160 High/On (Advanced Graphics Off) AA:FX AF:8x | |
| Genomsnitt NVIDIA RTX PRO 5000 Blackwell Generation Laptop (165.3 - 170.3, n=2) | |
| HP ZBook Fury G1i 18 | |
| Lenovo Legion Pro 5 16IAX10, RTX 5070 | |
| 3840x2160 Highest AA:4xMSAA + FX AF:16x | |
| Schenker Key 18 Pro M25 RTX 5090 | |
| Genomsnitt NVIDIA RTX PRO 5000 Blackwell Generation Laptop (101.6 - 105.5, n=2) | |
| HP ZBook Fury G1i 18 | |
| Lenovo Legion Pro 5 16IAX10, RTX 5070 | |
| Lenovo Legion Pro 5 16IAX10, RTX 5070 | |
| Final Fantasy XV Benchmark - 3840x2160 High Quality | |
| Schenker Key 18 Pro M25 RTX 5090 | |
| Dell Pro Max 18 Plus MB18250 | |
| Genomsnitt NVIDIA RTX PRO 5000 Blackwell Generation Laptop (88.4 - 102.2, n=3) | |
| HP ZBook Fury G1i 18 | |
| Lenovo Legion Pro 5 16IAX10, RTX 5070 | |
| Lenovo ThinkPad P16 G1 RTX A5500 | |
Cyberpunk 2077 ultra FPS-diagram
| låg | med. | hög | ultra | QHD DLSS | QHD | 4K DLSS | 4K | |
|---|---|---|---|---|---|---|---|---|
| GTA V (2015) | 186.5 | 181.3 | 175.3 | 133.6 | 130.5 | 165.3 | ||
| Dota 2 Reborn (2015) | 215 | 187.2 | 175 | 162 | 143.9 | |||
| Final Fantasy XV Benchmark (2018) | 232 | 222 | 183.8 | 145.7 | 88.4 | |||
| X-Plane 11.11 (2018) | 137.3 | 114.9 | 92 | 74.2 | ||||
| Strange Brigade (2018) | 619 | 493 | 440 | 396 | 303 | 165.7 | ||
| Baldur's Gate 3 (2023) | 245 | 208 | 182 | 177 | 179.4 | 129.5 | 114.3 | 74.1 |
| Cyberpunk 2077 (2023) | 171.8 | 173.3 | 157.7 | 143.7 | 109 | 98 | 46.1 | |
| F1 24 (2024) | 281 | 297 | 272 | 125.7 | 126.8 | 84.4 | 71.8 | 43.2 |
Utsläpp
Systembuller
De interna fläktarna är ohörbara när de går på tomgång eller kör mindre krävande uppgifter som webbläsare eller Excel. De ökar dock ganska lätt när högre belastningar introduceras. Faktum är att systemet inte körs tystare än Dell trots att båda modellerna levereras med samma CPU och GPU.
Ljudnivå
| Låg belastning |
| 25.7 / 25.7 / 25.7 dB(A) |
| Hög belastning |
| 48.3 / 56.5 dB(A) |
 | ||
30 dB tyst 40 dB(A) hörbar 50 dB(A) högt ljud |
||
min: | ||
| HP ZBook Fury G1i 18 Ultra 9 285HX, RTX PRO 5000 Blackwell Generation Laptop | Dell Pro Max 18 Plus MB18250 Ultra 9 285HX, RTX PRO 5000 Blackwell Generation Laptop | Schenker Key 18 Pro M25 RTX 5090 Ultra 9 275HX, GeForce RTX 5090 Laptop | Lenovo ThinkPad P16 Gen 2 i7-14700HX, RTX 4000 Ada Generation Laptop | HP ZBook X G1i 16 Ultra 7 265H, RTX PRO 2000 Blackwell Generation Laptop | HP ZBook Studio 16 G11 Ultra 9 185H, RTX 3000 Ada Generation Laptop | |
|---|---|---|---|---|---|---|
| Noise | 4% | 2% | -1% | 13% | 9% | |
| av / miljö * (dB) | 24.9 | 23.1 7% | 23.9 4% | 23.9 4% | 23.7 5% | 23.8 4% |
| Idle Minimum * (dB) | 25.7 | 27.1 -5% | 25.2 2% | 29.1 -13% | 23.7 8% | 23.8 7% |
| Idle Average * (dB) | 25.7 | 27.1 -5% | 25.2 2% | 29.1 -13% | 23.7 8% | 26.4 -3% |
| Idle Maximum * (dB) | 25.7 | 27.1 -5% | 25.2 2% | 29.1 -13% | 23.7 8% | 26.4 -3% |
| Load Average * (dB) | 48.3 | 38 21% | 47.8 1% | 41 15% | 32.7 32% | 33.7 30% |
| Cyberpunk 2077 ultra * (dB) | 58.2 | 53.8 8% | 54.4 7% | 52.8 9% | 50.9 13% | 46.1 21% |
| Load Maximum * (dB) | 56.5 | 53.8 5% | 58.6 -4% | 52.9 6% | 48 15% | 53.2 6% |
* ... mindre är bättre
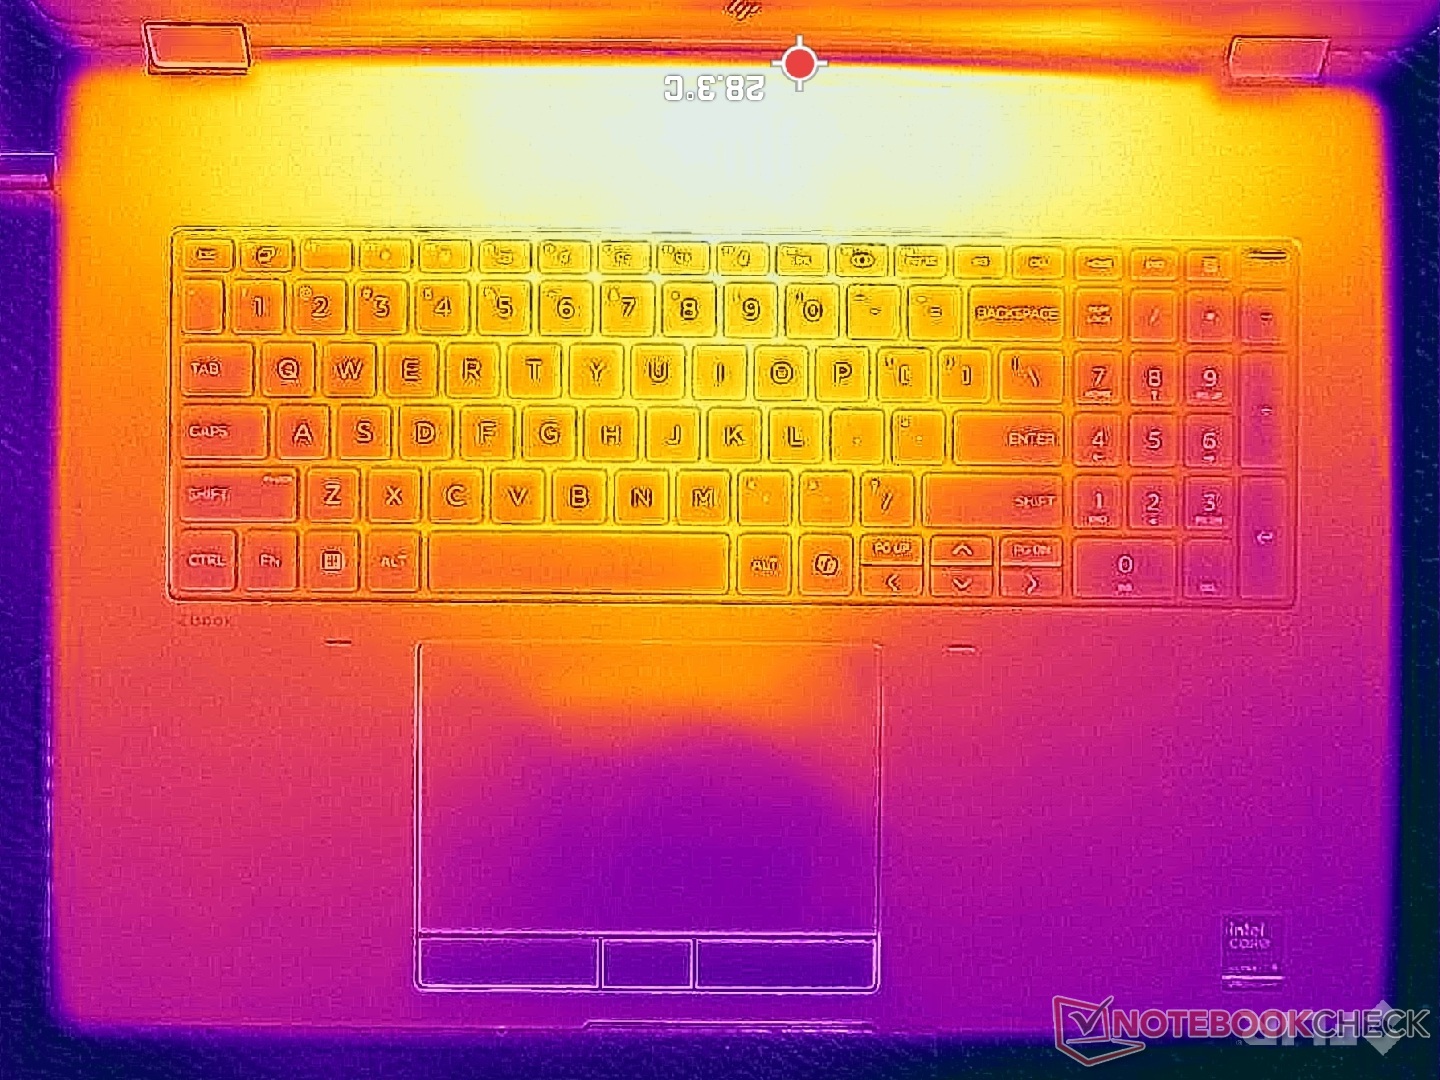
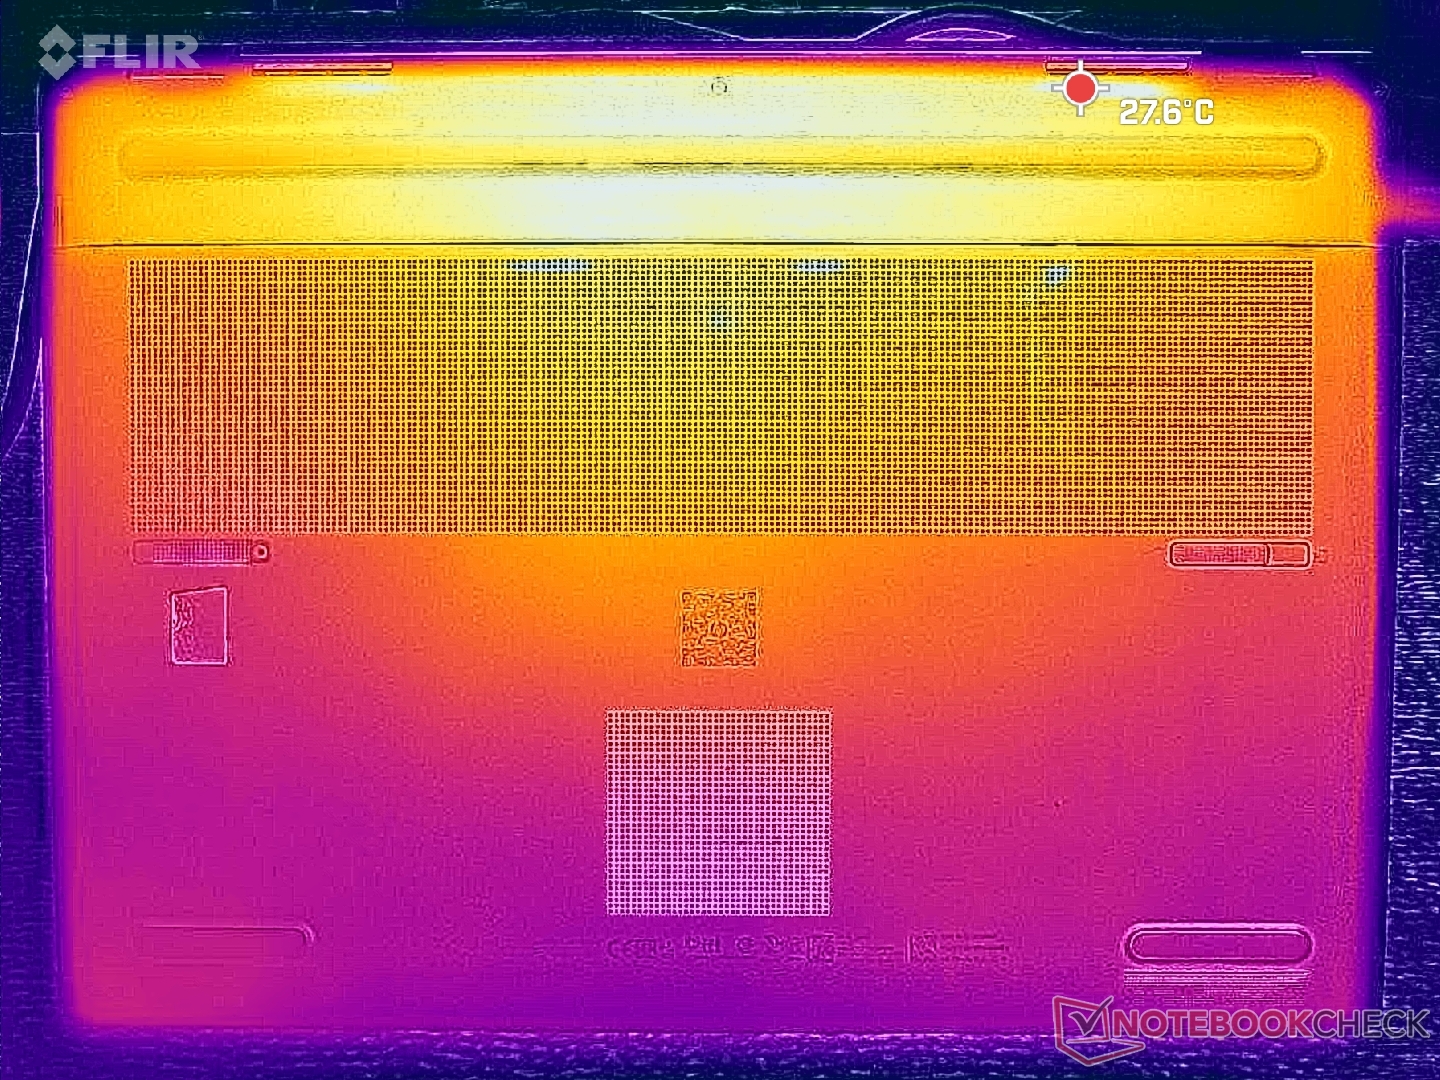
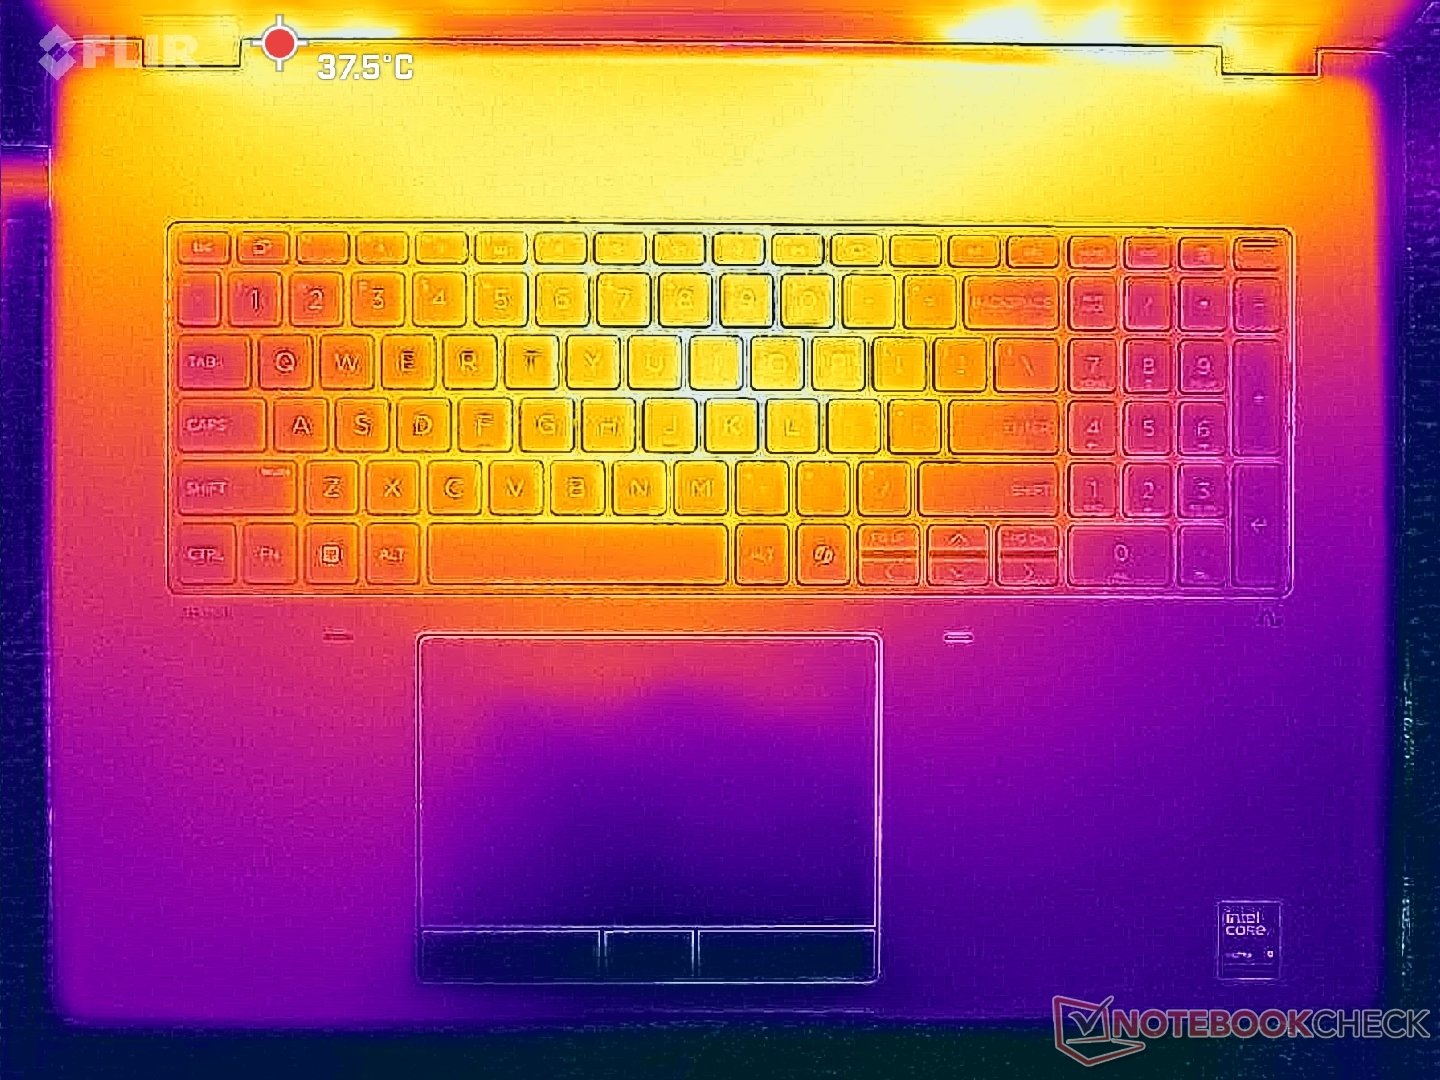
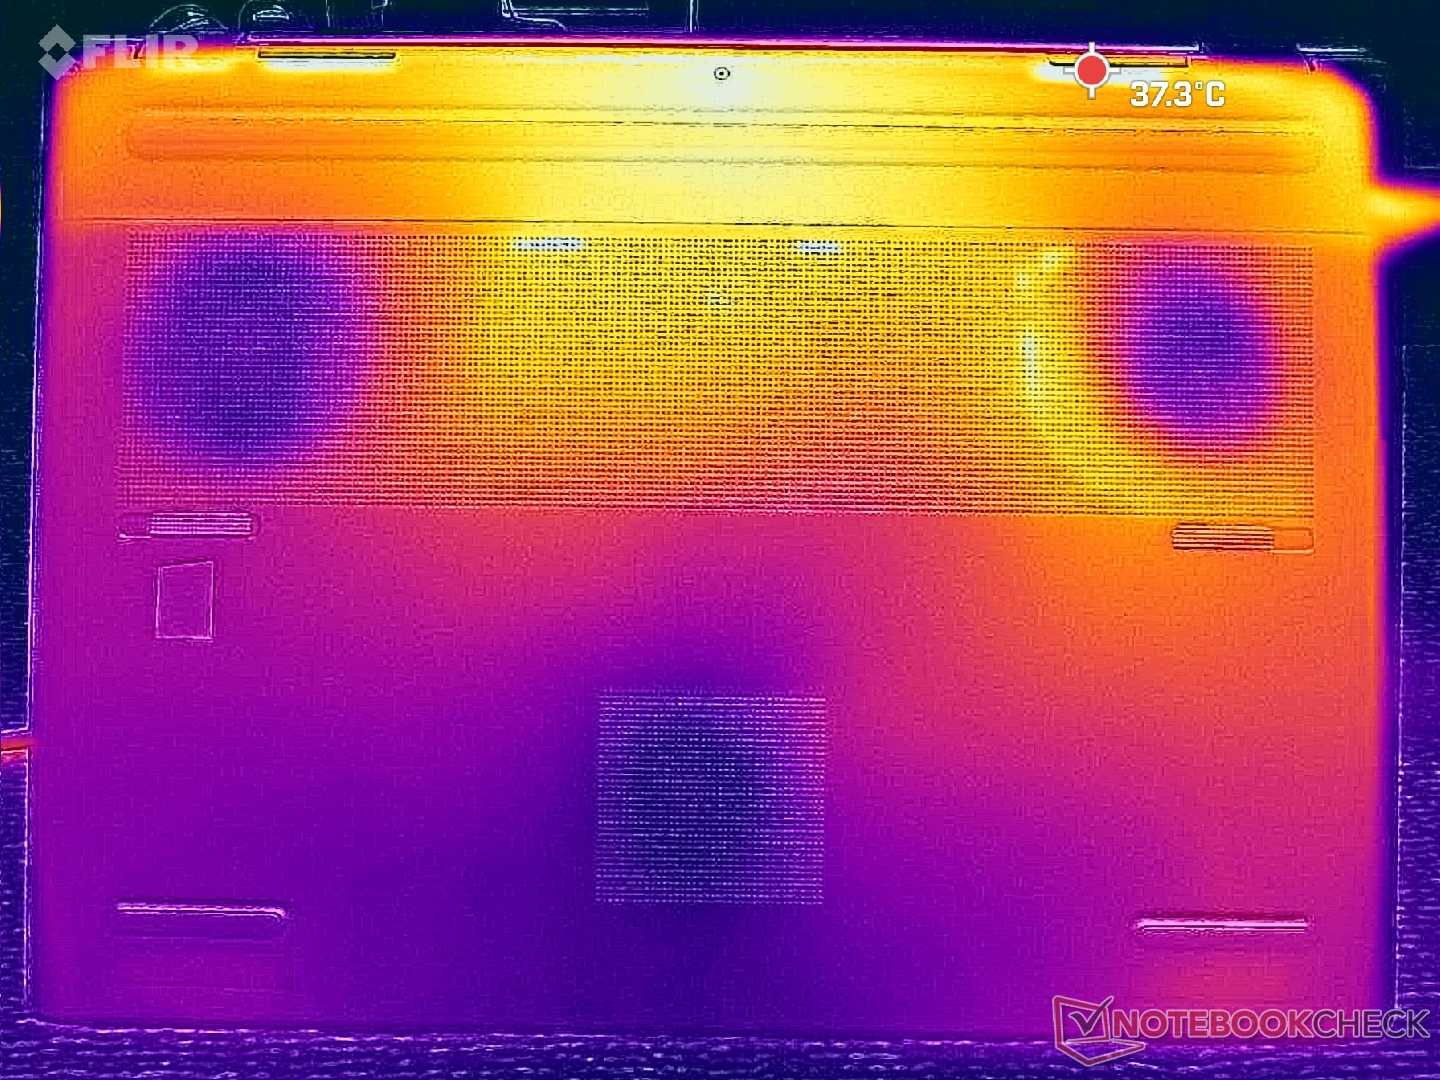
Temperatur
Yttemperaturerna förblir relativt svala även vid krävande belastningar. Heta punkter på tangentbordsdäcket och bottenkåpan når upp till 40 C respektive 36 C, jämfört med nästan 50 C på Schenker Key 18 Pro.
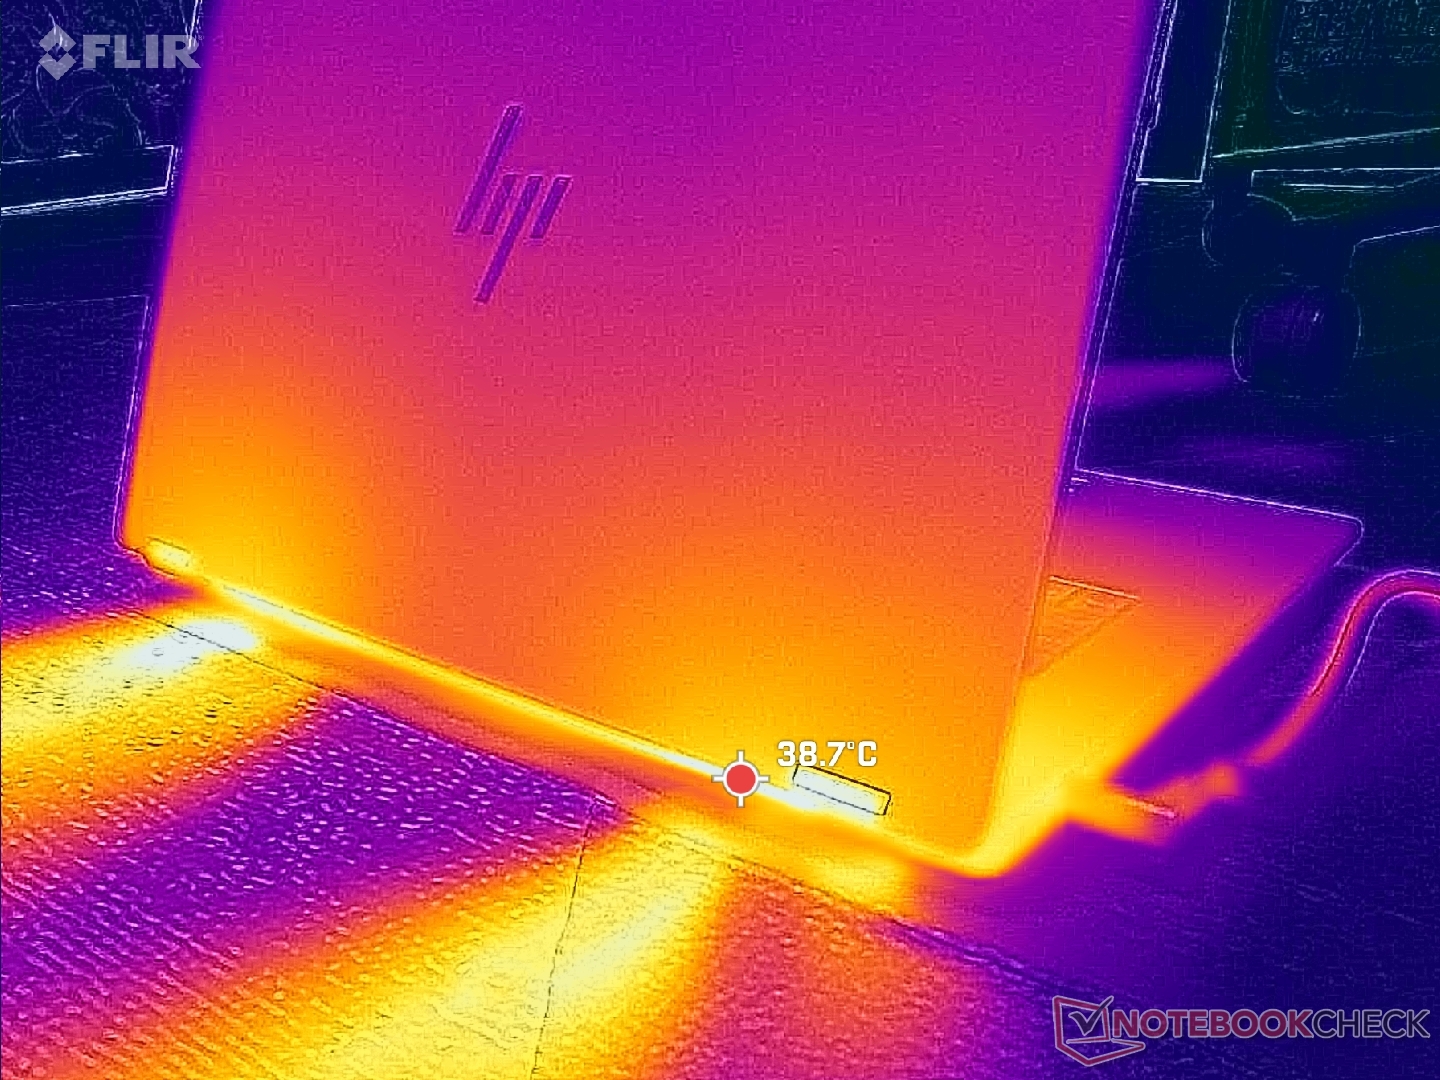
(+) Den maximala temperaturen på ovansidan är 39.6 °C / 103 F, jämfört med genomsnittet av 38.2 °C / 101 F , allt från 22.2 till 69.8 °C för klassen Workstation.
(+) Botten värms upp till maximalt 35.4 °C / 96 F, jämfört med genomsnittet av 41.1 °C / 106 F
(+) Vid tomgångsbruk är medeltemperaturen för ovansidan 28.4 °C / 83 F, jämfört med enhetsgenomsnittet på 32 °C / ### class_avg_f### F.
(+) Handledsstöden och pekplattan är kallare än hudtemperaturen med maximalt 26 °C / 78.8 F och är därför svala att ta på.
(±) Medeltemperaturen för handledsstödsområdet på liknande enheter var 27.8 °C / 82 F (+1.8 °C / 3.2 F).
| HP ZBook Fury G1i 18 Ultra 9 285HX, RTX PRO 5000 Blackwell Generation Laptop | Dell Pro Max 18 Plus MB18250 Ultra 9 285HX, RTX PRO 5000 Blackwell Generation Laptop | Schenker Key 18 Pro M25 RTX 5090 Ultra 9 275HX, GeForce RTX 5090 Laptop | Lenovo ThinkPad P16 Gen 2 i7-14700HX, RTX 4000 Ada Generation Laptop | HP ZBook X G1i 16 Ultra 7 265H, RTX PRO 2000 Blackwell Generation Laptop | HP ZBook Studio 16 G11 Ultra 9 185H, RTX 3000 Ada Generation Laptop | |
|---|---|---|---|---|---|---|
| Heat | -12% | -14% | -6% | 0% | -10% | |
| Maximum Upper Side * (°C) | 39.6 | 44.8 -13% | 47.5 -20% | 46.6 -18% | 36 9% | 36.6 8% |
| Maximum Bottom * (°C) | 35.4 | 47 -33% | 52.8 -49% | 51 -44% | 39.4 -11% | 47.8 -35% |
| Idle Upper Side * (°C) | 31.6 | 31.8 -1% | 28.5 10% | 24.8 22% | 30.4 4% | 31.4 1% |
| Idle Bottom * (°C) | 31.2 | 31.4 -1% | 30.1 4% | 25.6 18% | 31.8 -2% | 35.6 -14% |
* ... mindre är bättre
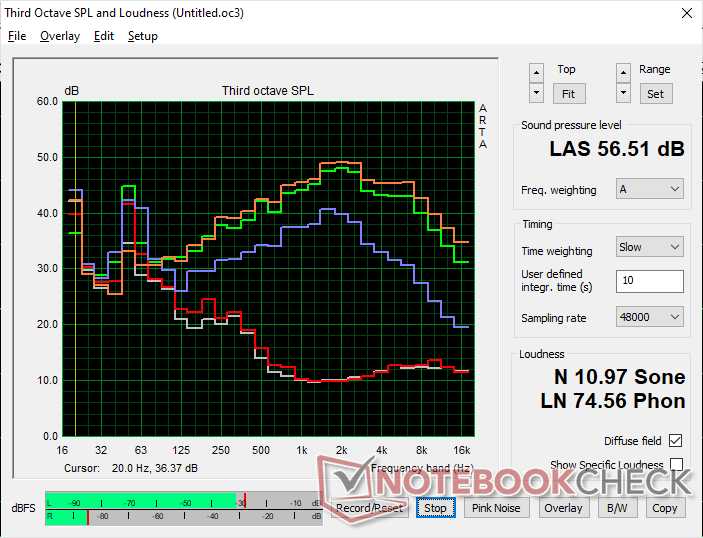
Högtalare
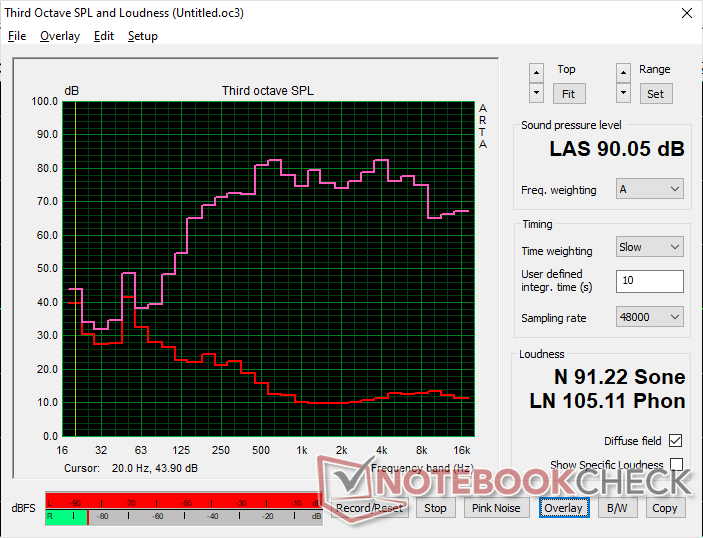
HP ZBook Fury G1i 18 ljudanalys
(+) | högtalare kan spela relativt högt (90.1 dB)
Bas 100 - 315 Hz
(±) | reducerad bas - i genomsnitt 11.4% lägre än medianen
(±) | linjäriteten för basen är genomsnittlig (8.9% delta till föregående frekvens)
Mellan 400 - 2000 Hz
(+) | balanserad mellan - endast 3.2% från medianen
(+) | mids är linjära (5.6% delta till föregående frekvens)
Högsta 2 - 16 kHz
(+) | balanserade toppar - endast 3.7% från medianen
(+) | toppar är linjära (6.5% delta till föregående frekvens)
Totalt 100 - 16 000 Hz
(+) | det totala ljudet är linjärt (10.8% skillnad mot median)
Jämfört med samma klass
» 10% av alla testade enheter i den här klassen var bättre, 4% liknande, 86% sämre
» Den bästa hade ett delta på 7%, genomsnittet var 17%, sämst var 35%
Jämfört med alla testade enheter
» 6% av alla testade enheter var bättre, 2% liknande, 92% sämre
» Den bästa hade ett delta på 4%, genomsnittet var 23%, sämst var 134%
Apple MacBook Pro 16 2021 M1 Pro ljudanalys
(+) | högtalare kan spela relativt högt (84.7 dB)
Bas 100 - 315 Hz
(+) | bra bas - bara 3.8% från medianen
(+) | basen är linjär (5.2% delta till föregående frekvens)
Mellan 400 - 2000 Hz
(+) | balanserad mellan - endast 1.3% från medianen
(+) | mids är linjära (2.1% delta till föregående frekvens)
Högsta 2 - 16 kHz
(+) | balanserade toppar - endast 1.9% från medianen
(+) | toppar är linjära (2.7% delta till föregående frekvens)
Totalt 100 - 16 000 Hz
(+) | det totala ljudet är linjärt (4.6% skillnad mot median)
Jämfört med samma klass
» 0% av alla testade enheter i den här klassen var bättre, 0% liknande, 100% sämre
» Den bästa hade ett delta på 5%, genomsnittet var 17%, sämst var 45%
Jämfört med alla testade enheter
» 0% av alla testade enheter var bättre, 0% liknande, 100% sämre
» Den bästa hade ett delta på 4%, genomsnittet var 23%, sämst var 134%
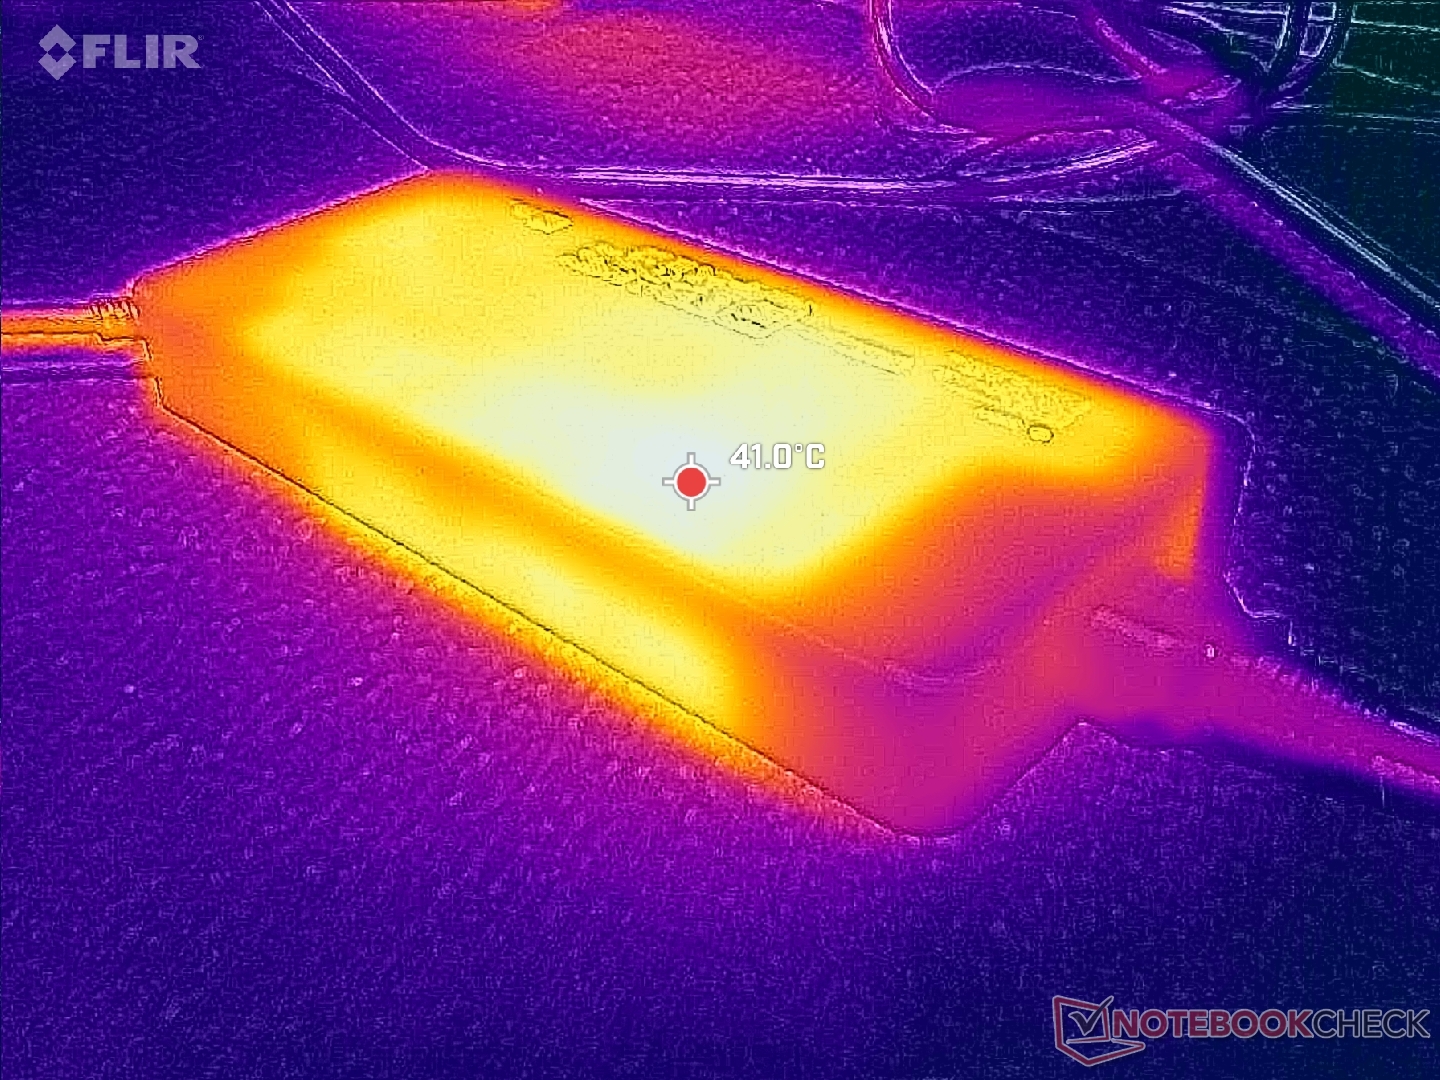
Energiförvaltning
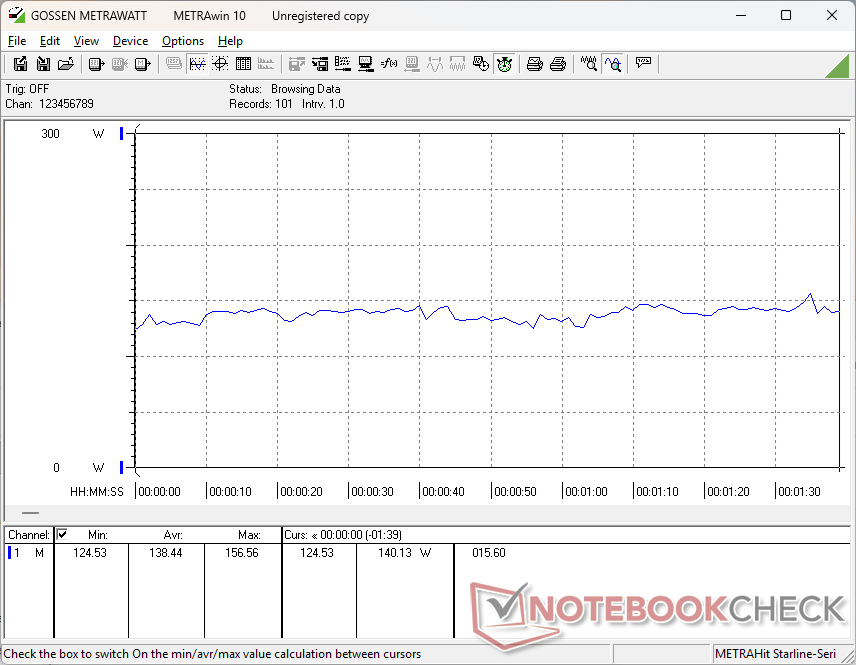
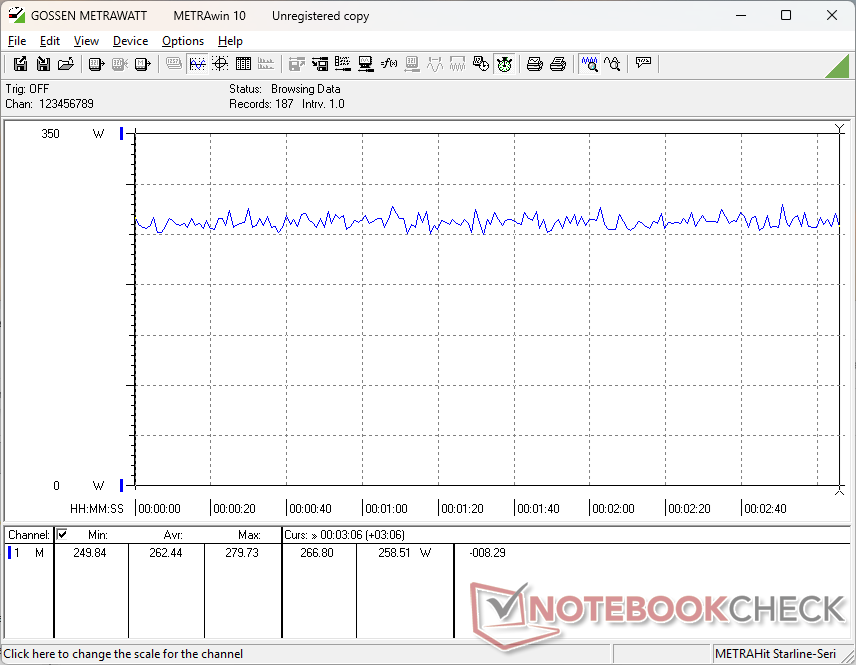
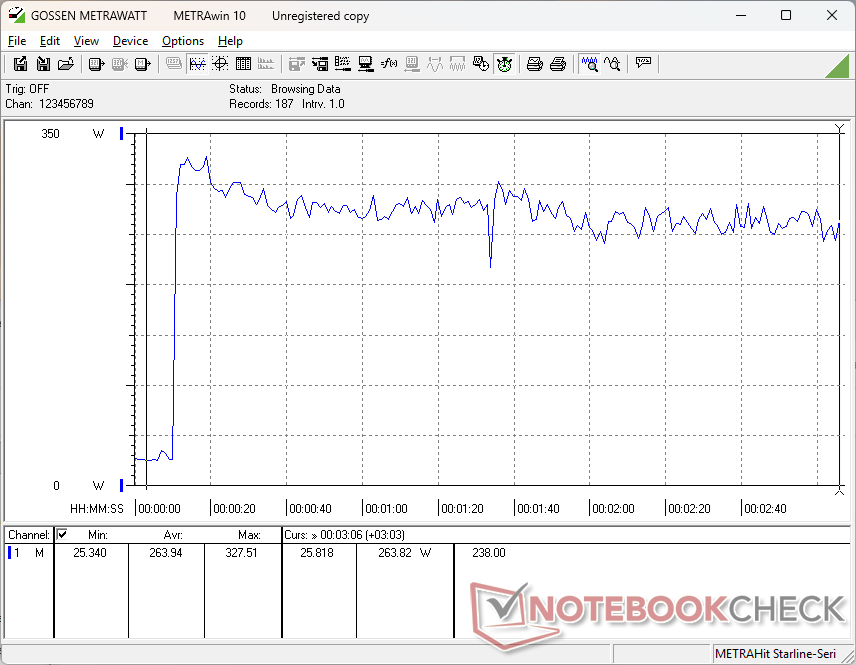
Strömförbrukning
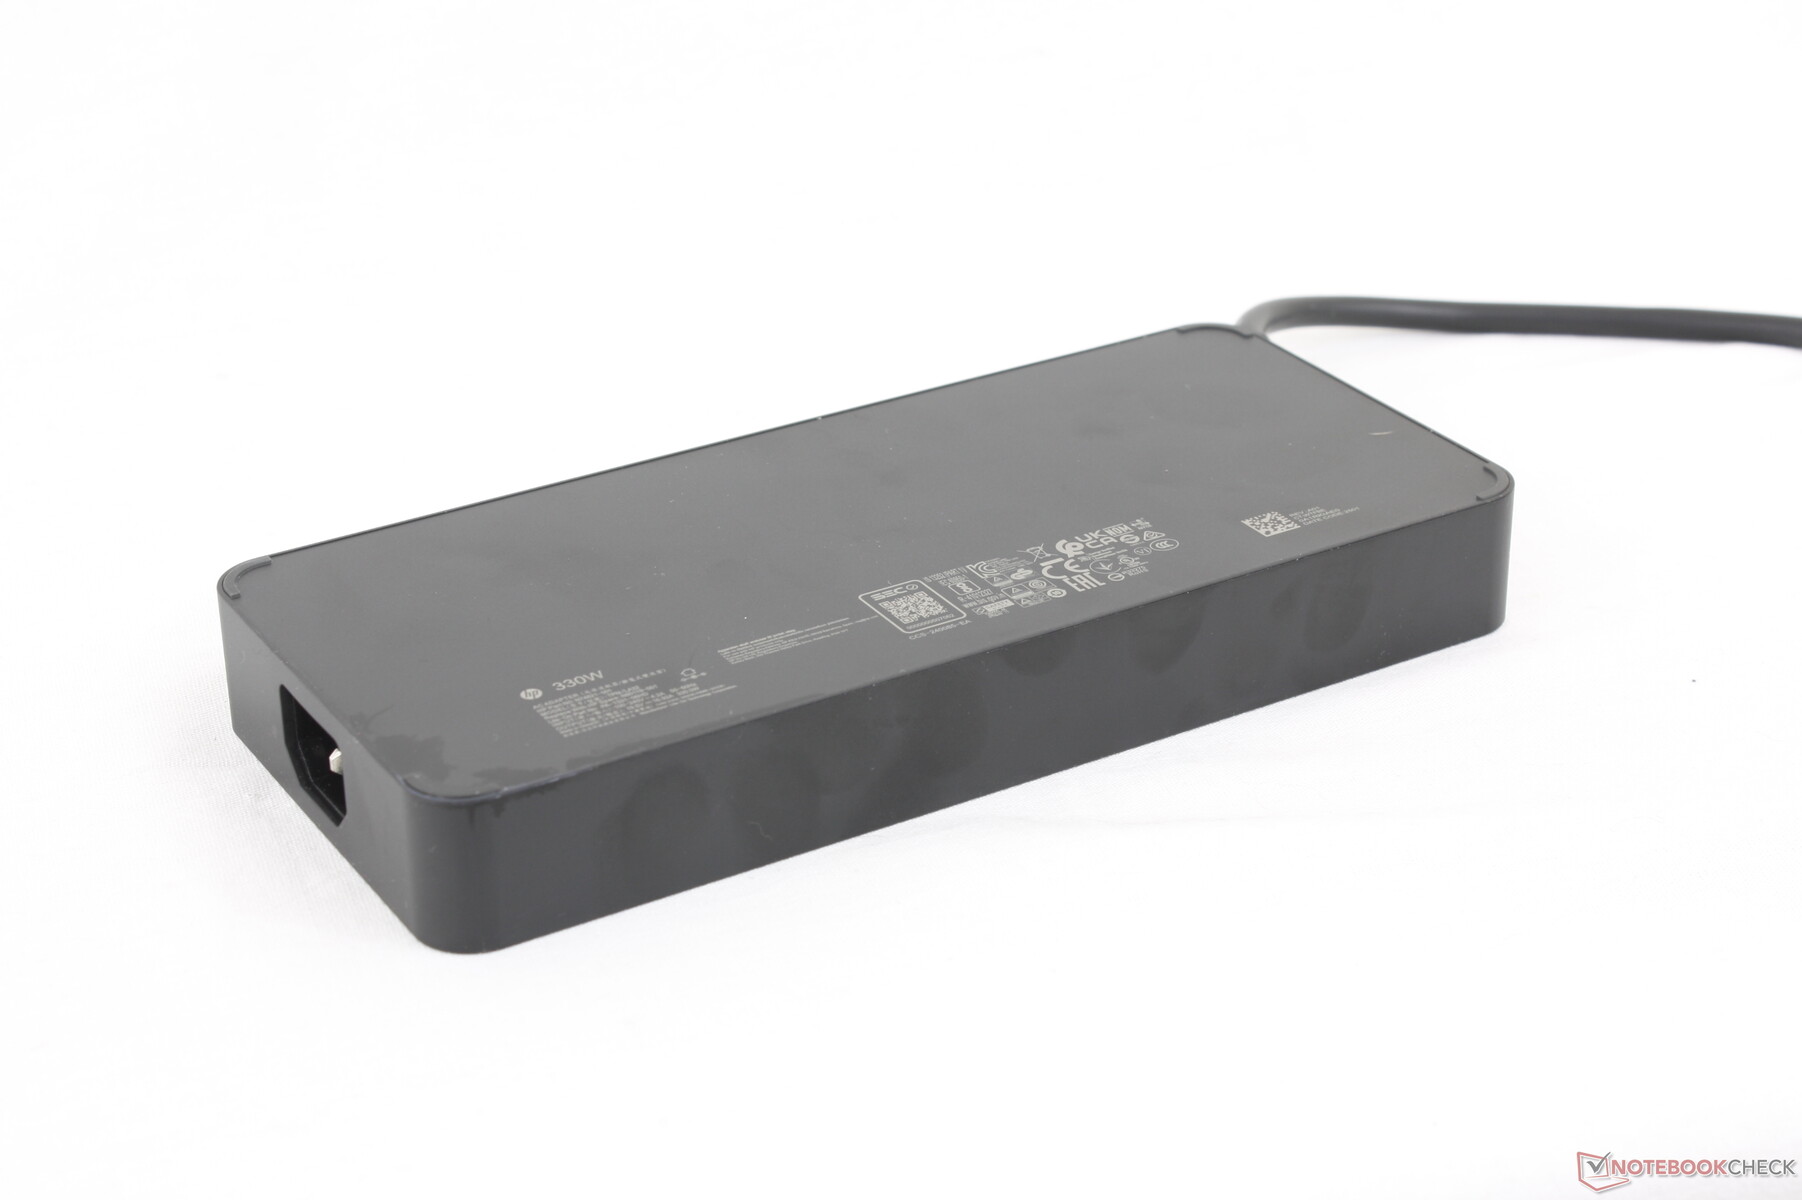
HP levereras med en 330 W AC-adapter medan Dell levereras med en 280 W USB-C AC-adapter. Den maximala förbrukningen är därför högre på HP där den kan nå upp till 328 W i våra tester jämfört med 281 W på Dell, men denna höga förbrukning är kortvarig på grund av termiska begränsningar eller pålagda tak. När vi till exempel körde Prime95 och FurMark samtidigt nådde förbrukningen en topp på 328 W innan den snabbt stabiliserades på cirka 265 W, vilket liknar det vi observerade på Dell. För prestandasyften spelar alltså den större 330 W AC-adaptern liten roll.

| Av/Standby | |
| Låg belastning | |
| Hög belastning |
|
Förklaring:
min: | |
| HP ZBook Fury G1i 18 Ultra 9 285HX, RTX PRO 5000 Blackwell Generation Laptop, , IPS, 2560x1600, 18" | Dell Pro Max 18 Plus MB18250 Ultra 9 285HX, RTX PRO 5000 Blackwell Generation Laptop, , IPS, 2560x1600, 18" | Schenker Key 18 Pro M25 RTX 5090 Ultra 9 275HX, GeForce RTX 5090 Laptop, Samsung 9100 Pro 4 TB, IPS, 3840x2400, 18" | Lenovo ThinkPad P16 Gen 2 i7-14700HX, RTX 4000 Ada Generation Laptop, SK hynix PC801 HFS001TEJ9X162N, IPS, 2560x1600, 16" | HP ZBook X G1i 16 Ultra 7 265H, RTX PRO 2000 Blackwell Generation Laptop, Samsung PM9A1 MZVL22T0HBLB, IPS, 2560x1600, 16" | HP ZBook Studio 16 G11 Ultra 9 185H, RTX 3000 Ada Generation Laptop, Kioxia XG8 KXG80ZNV1T02, IPS, 3840x2400, 16" | |
|---|---|---|---|---|---|---|
| Power Consumption | 11% | -11% | 21% | 58% | 28% | |
| Idle Minimum * (Watt) | 16.1 | 6.1 62% | 14 13% | 7.9 51% | 4.1 75% | 14 13% |
| Idle Average * (Watt) | 20.3 | 15.2 25% | 21.9 -8% | 13.1 35% | 9 56% | 22.4 -10% |
| Idle Maximum * (Watt) | 25 | 32.4 -30% | 22.3 11% | 24.2 3% | 9.4 62% | 25.7 -3% |
| Load Average * (Watt) | 138.5 | 130.1 6% | 149.5 -8% | 127.4 8% | 86.7 37% | 90.2 35% |
| Cyberpunk 2077 ultra external monitor * (Watt) | 255 | 252 1% | 336 -32% | 219 14% | 102 60% | 120.3 53% |
| Cyberpunk 2077 ultra * (Watt) | 262 | 256 2% | 333 -27% | 225 14% | 106.1 60% | 125.4 52% |
| Load Maximum * (Watt) | 327.5 | 280.9 14% | 415.4 -27% | 248.5 24% | 152.9 53% | 142 57% |
* ... mindre är bättre
Strömförbrukning Cyberpunk / Stresstest
Strömförbrukning extern monitor
Batteritid
Drifttiden för WLAN är fortfarande mycket bra för storleken, om än något kortare än på Dell Pro Max 18 Plus. Skärmen stöder PSR2 eller Panel Self Refresh 2 för strömbesparing i stället för Advanced Optimus.
| HP ZBook Fury G1i 18 Ultra 9 285HX, RTX PRO 5000 Blackwell Generation Laptop, 99 Wh | Dell Pro Max 18 Plus MB18250 Ultra 9 285HX, RTX PRO 5000 Blackwell Generation Laptop, 96 Wh | Schenker Key 18 Pro M25 RTX 5090 Ultra 9 275HX, GeForce RTX 5090 Laptop, 98 Wh | Lenovo ThinkPad P16 Gen 2 i7-14700HX, RTX 4000 Ada Generation Laptop, 94 Wh | HP ZBook X G1i 16 Ultra 7 265H, RTX PRO 2000 Blackwell Generation Laptop, 83 Wh | HP ZBook Studio 16 G11 Ultra 9 185H, RTX 3000 Ada Generation Laptop, 86 Wh | |
|---|---|---|---|---|---|---|
| Batteridrifttid | ||||||
| WiFi v1.3 (h) | 8 | 9.3 16% | 5.8 -27% | 2.5 -69% | 12.5 56% | 4.8 -40% |
Notebookcheck Betyg
HP ZBook Fury G1i 18 låter utmärkt på papperet, men den konservativa CPU- och GPU-prestandan och den övergripande bristen på innovationer gör Dell Pro Max 18 Plus till ett mer attraktivt alternativ.
HP ZBook Fury G1i 18
- 11/22/2025 v8
Allen Ngo
 Total Sustainability Score:
 Potentiella konkurrenter i jämförelse
Bild | Modell / recensioner | Pris | Vikt | Höjd | Skärm |
|---|---|---|---|---|---|
1. 89.5%  | HP ZBook Fury G1i 18 Intel Core Ultra 9 285HX ⎘ NVIDIA RTX PRO 5000 Blackwell Generation Laptop ⎘ 64 GB Minne | Amazon: Listpris: 11000 USD | 3.4 kg | 27 mm | 18.00" 2560x1600 168 PPI IPS |
2. 88.9%  | Dell Pro Max 18 Plus MB18250 Intel Core Ultra 9 285HX ⎘ NVIDIA RTX PRO 5000 Blackwell Generation Laptop ⎘ 128 GB Minne | Amazon: Listpris: 6000 USD | 3.6 kg | 30.2 mm | 18.00" 2560x1600 168 PPI IPS |
3. 84.6%  | Schenker Key 18 Pro M25 RTX 5090 Intel Core Ultra 9 275HX ⎘ NVIDIA GeForce RTX 5090 Laptop ⎘ 256 GB Minne, 4096 GB SSD | Amazon: Listpris: 6400€ | 4.1 kg | 29.5 mm | 18.00" 3840x2400 252 PPI IPS |
4. 85.9%  | Lenovo ThinkPad P16 Gen 2 Intel Core i7-14700HX ⎘ NVIDIA RTX 4000 Ada Generation Laptop ⎘ 32 GB Minne, 1024 GB SSD | Amazon: Listpris: 3500 USD | 3.1 kg | 30.23 mm | 16.00" 2560x1600 189 PPI IPS |
5. 87.4%  | HP ZBook X G1i 16 Intel Core Ultra 7 265H ⎘ NVIDIA RTX PRO 2000 Blackwell Generation Laptop ⎘ 64 GB Minne, 2048 GB SSD | Amazon: Listpris: 2700 USD | 2.2 kg | 23 mm | 16.00" 2560x1600 189 PPI IPS |
6. 84.2%  | HP ZBook Studio 16 G11 Intel Core Ultra 9 185H ⎘ NVIDIA RTX 3000 Ada Generation Laptop ⎘ 64 GB Minne, 1024 GB SSD | Amazon: Listpris: 4300 USD | 1.8 kg | 19 mm | 16.00" 3840x2400 283 PPI IPS |
Genomskinlighet
Valet av enheter som ska granskas görs av vår redaktion. Testprovet gavs till författaren som ett lån av tillverkaren eller återförsäljaren för denna recension. Långivaren hade inget inflytande på denna recension och inte heller fick tillverkaren en kopia av denna recension innan publiceringen. Det fanns ingen skyldighet att publicera denna recension. Som ett oberoende medieföretag är Notebookcheck inte föremål för auktoritet från tillverkare, återförsäljare eller förlag.
This is how Notebookcheck is testingEvery year, Notebookcheck independently reviews hundreds of laptops and smartphones using standardized procedures to ensure that all results are comparable. We have continuously developed our test methods for around 20 years and set industry standards in the process. In our test labs, high-quality measuring equipment is utilized by experienced technicians and editors. These tests involve a multi-stage validation process. Our complex rating system is based on hundreds of well-founded measurements and benchmarks, which maintains objectivity.

