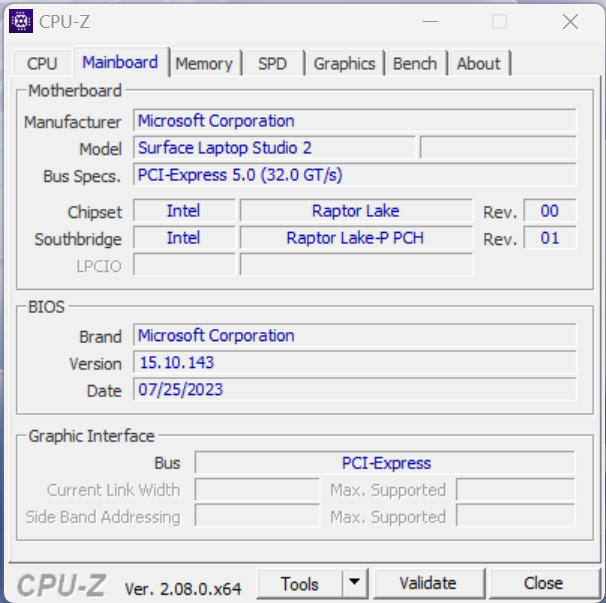
Microsoft Surface Laptop Studio 2 Recension - Multimedia Convertible med snabbare komponenter
Microsoft lanseradeSurface Laptop Studioi början av 2022 som efterföljare tillSurface Book. Tack vare vikmekanismen kan den bärbara multimediadatorn användas som en vanlig bärbar dator eller surfplatta, och det finns till och med ett särskilt presentationsläge. Det största problemet med den första generationen var den ganska långsamma fyrkärniga processorn från Intel. Microsoft fixade det för den andra generationen och använder nu Raptor LakeCore i7-13700HcPU i kombination med moderna Nvidia GPU:er hela vägen upp till den professionellaRTX 2000 ADA. Tillverkaren inkluderar också ett dedikerat AI-chip, som är tänkt att påskynda nya Windows-funktioner som Copilot.
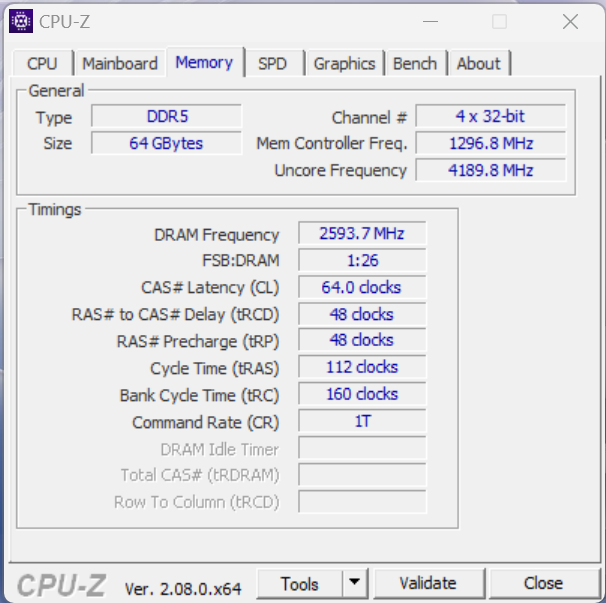
Den nya Surface Laptop Studio 2 kostar från 1999 USD med Core i7-13700H, 16 GB RAM samt en 512 GB SSD, men ingen Nvidia GPU. Vår granskningsenhet är versionen medGeForce RTX 4060, som automatiskt kombineras med en 1 TB SSD samt 64 GB RAM för $3299. De nuvarande modellerna är ganska begränsade när det gäller SSD- och RAM-kapacitet. Följande tabell visar de tillgängliga modellerna just nu:
| CPU | Core i7-13700H | Core i7-13700H | Core i7-13700H | Core i7-13700H | Core i7-13700H | Core i7-13700H |
|---|---|---|---|---|---|---|
| GPU | Iris Xe Graphics G7 | Nvidia GeForce RTX 4050 Laptop | Nvidia GeForce RTX 4050 Laptop | Nvidia GeForce RTX 4060 Laptop | Nvidia RTX 2000 Ada | Nvidia GeForce RTX 4060 Laptop |
| Display | 14,4-tums PixelSense Flow 120 Hz | 14,4-tums PixelSense Flow 120 Hz | 14,4-tums PixelSense Flow 120 Hz | 14,4-tums PixelSense Flow 120 Hz | 14,4-tums PixelSense Flow 120 Hz | 14,4-tums PixelSense Flow 120 Hz |
| RAM | 16 GB | 16 GB | 32 GB | 64 GB | 32 GB | 64 GB |
| SSD | 512 GB | 512 GB | 1 TB | 1 TB | 1 TB | 2 TB |
| Pris | $1999 | $2399 | $2799 | $3299 | $3599 | $3699 |
Enligt Microsoft är enheten främst avsedd för innehållsskapare, men detta kan sägas om många modeller i 14-tumssegmentet som kategoriseras som multimedia- eller gaming-laptops. De senare erbjuder ofta snabbare komponenter i kombination med mycket bra skärmar (OLED, Mini-LED).
Potentiella konkurrenter i jämförelse
Gradering | Datum | Modell | Vikt | Höjd | Storlek | Upplösning | Pris |
|---|---|---|---|---|---|---|---|
| 85.5 % v7 (old) | 10/2023 | Microsoft Surface Laptop Studio 2 RTX 4060 i7-13700H, GeForce RTX 4060 Laptop GPU | 2 kg | 22 mm | 14.40" | 2400x1600 | |
| 93.9 % v7 (old) | 03/2023 | Apple MacBook Pro 14 2023 M2 Pro M2 Pro, M2 Pro 19-Core GPU | 1.6 kg | 15.5 mm | 14.20" | 3024x1964 | |
| 89.8 % v7 (old) | 07/2023 | Lenovo Yoga Pro 9-14IRP G8 i7-13705H, GeForce RTX 4050 Laptop GPU | 1.7 kg | 17.6 mm | 14.50" | 3072x1920 | |
| 89.3 % v7 (old) | 06/2023 | Asus Zenbook Pro 14 OLED UX6404VI i9-13900H, GeForce RTX 4070 Laptop GPU | 1.7 kg | 17.9 mm | 14.50" | 2880x1800 | |
| 87 % v7 (old) | 06/2023 | Asus ZenBook Pro 14 Duo UX8402VV-P1021W i9-13900H, GeForce RTX 4060 Laptop GPU | 1.8 kg | 21 mm | 14.50" | 2880x1800 | |
| 90 % v7 (old) | 05/2023 | Asus ROG Zephyrus G14 GA402XY R9 7940HS, GeForce RTX 4090 Laptop GPU | 1.7 kg | 20.5 mm | 14.00" | 2560x1600 | |
| 87.7 % v7 (old) | 09/2023 | Lenovo Legion Slim 5 14APH8 R7 7840HS, GeForce RTX 4060 Laptop GPU | 1.7 kg | 20.79 mm | 14.50" | 2880x1600 |
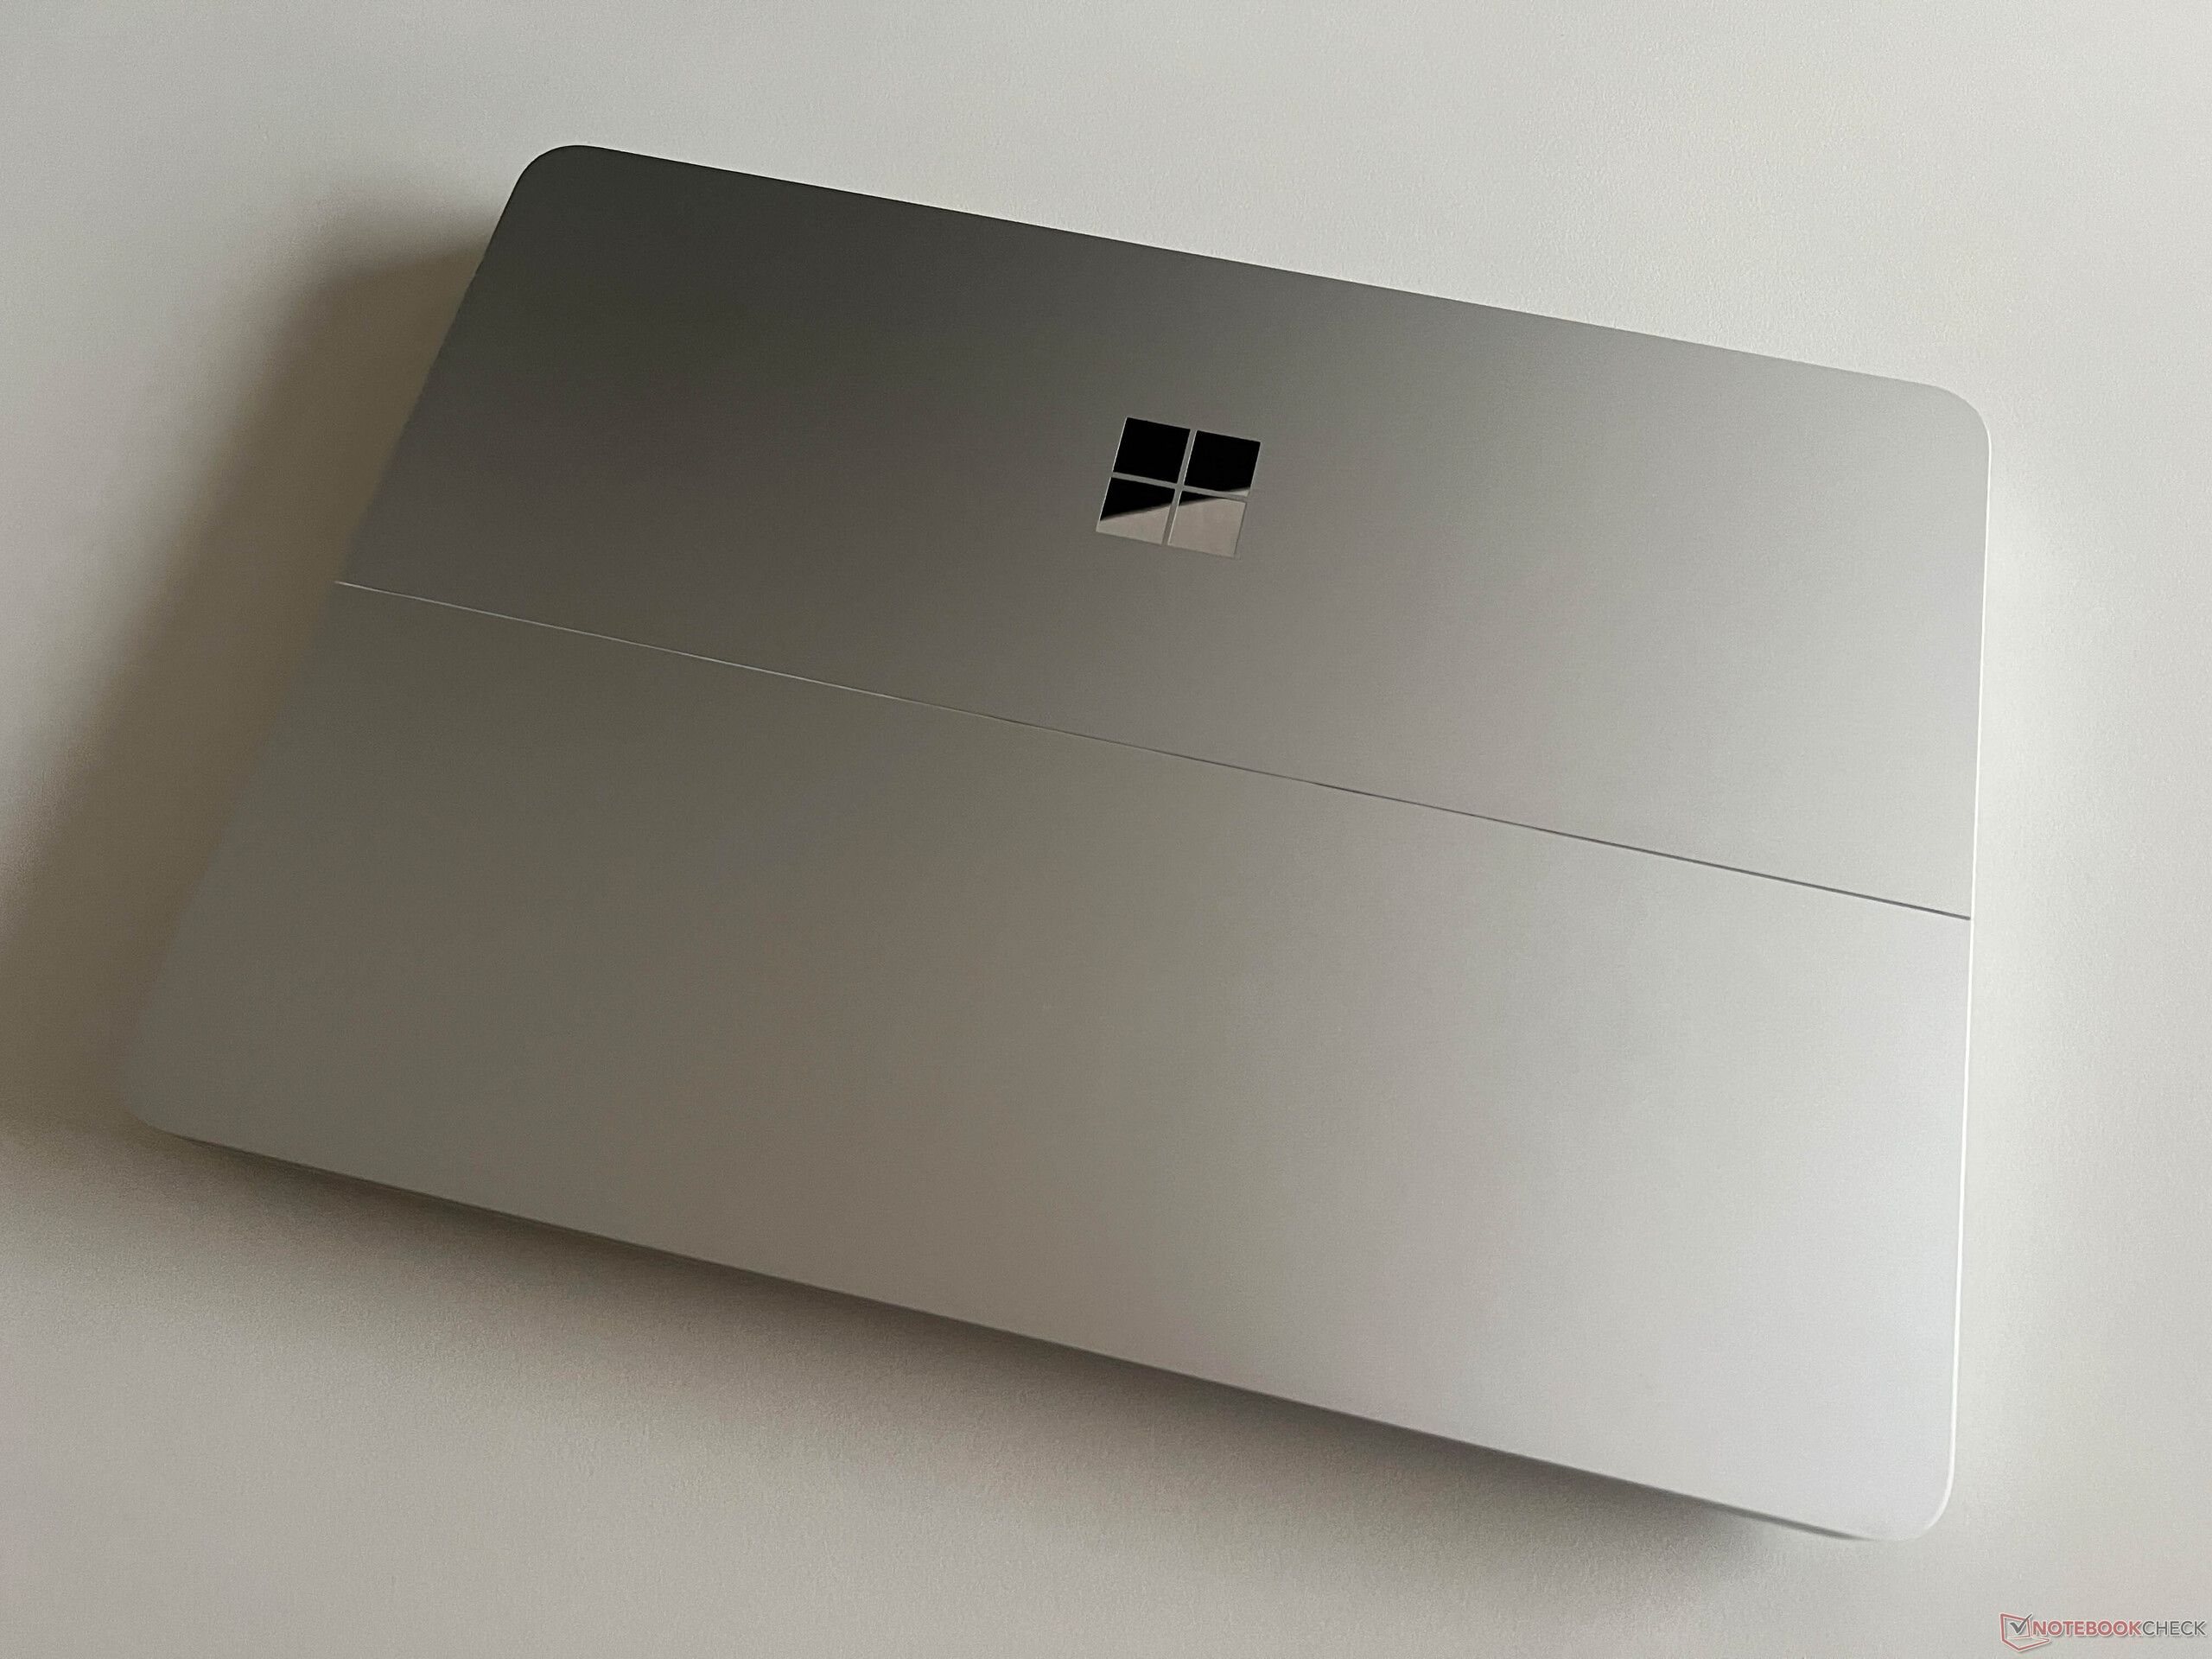
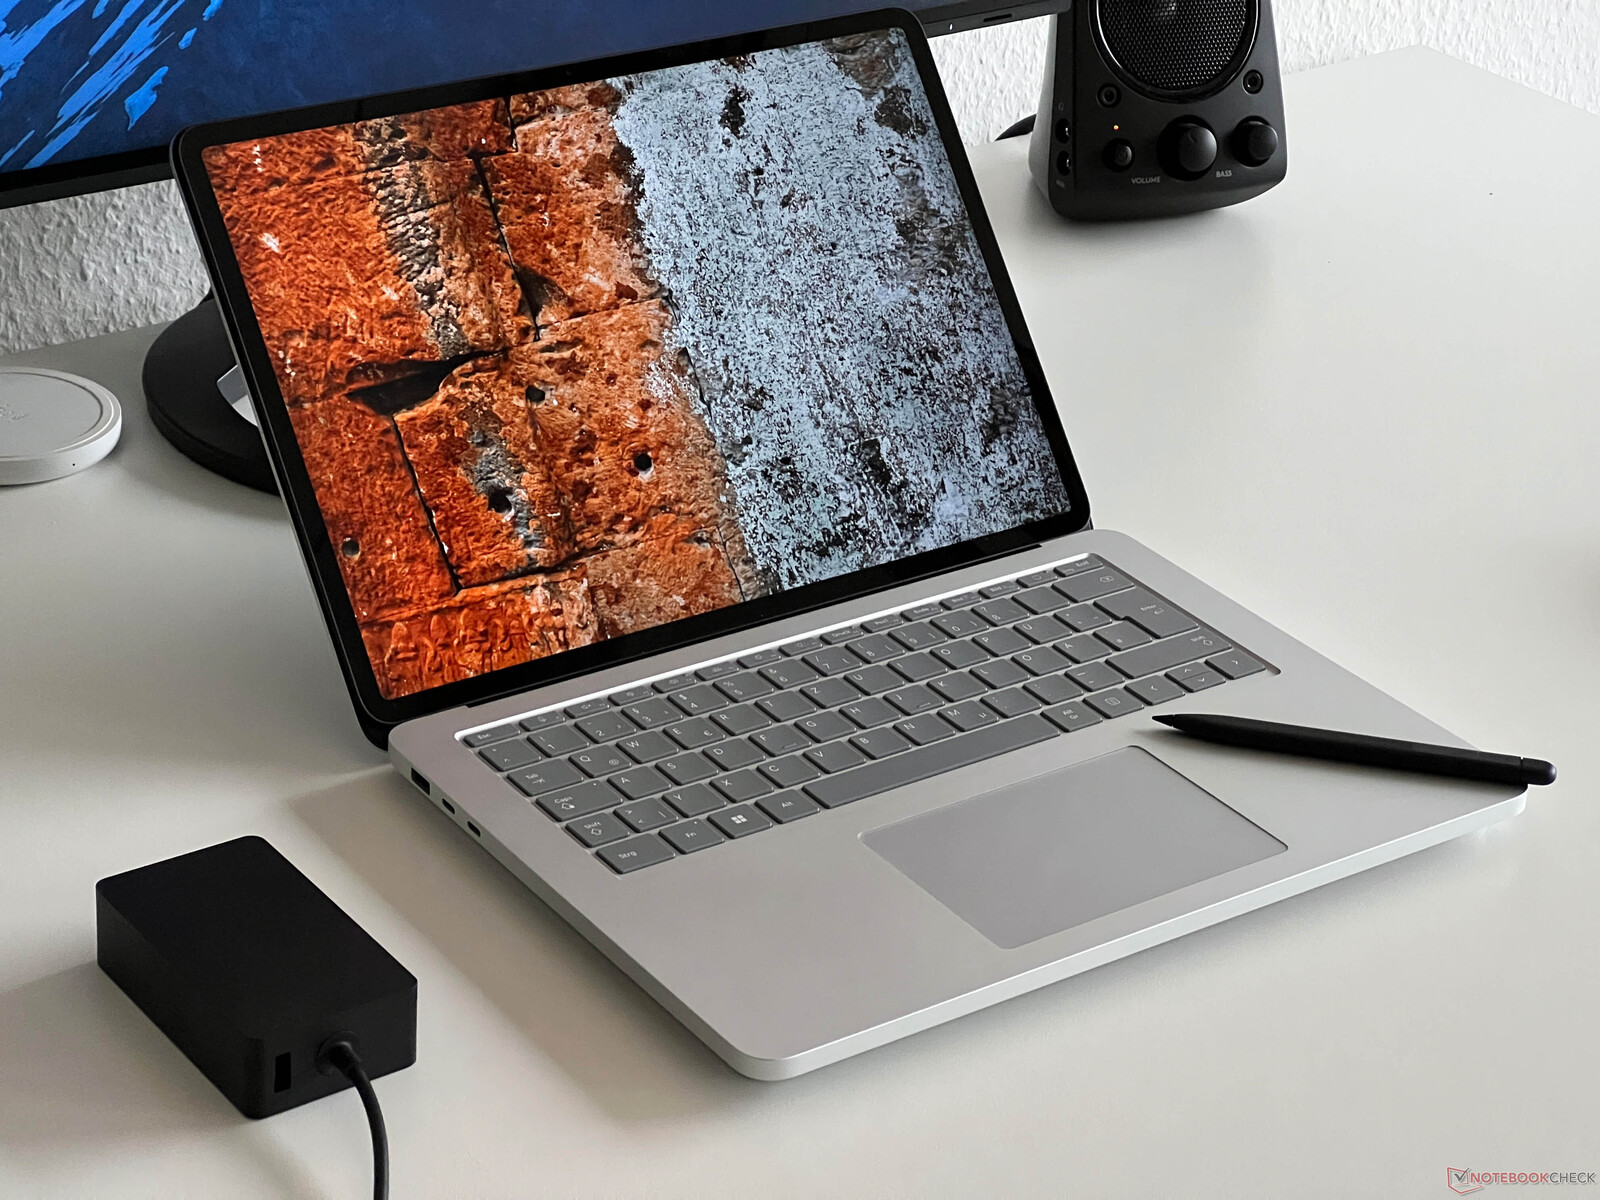
Fodral - Anodiserad aluminium och vikbar display
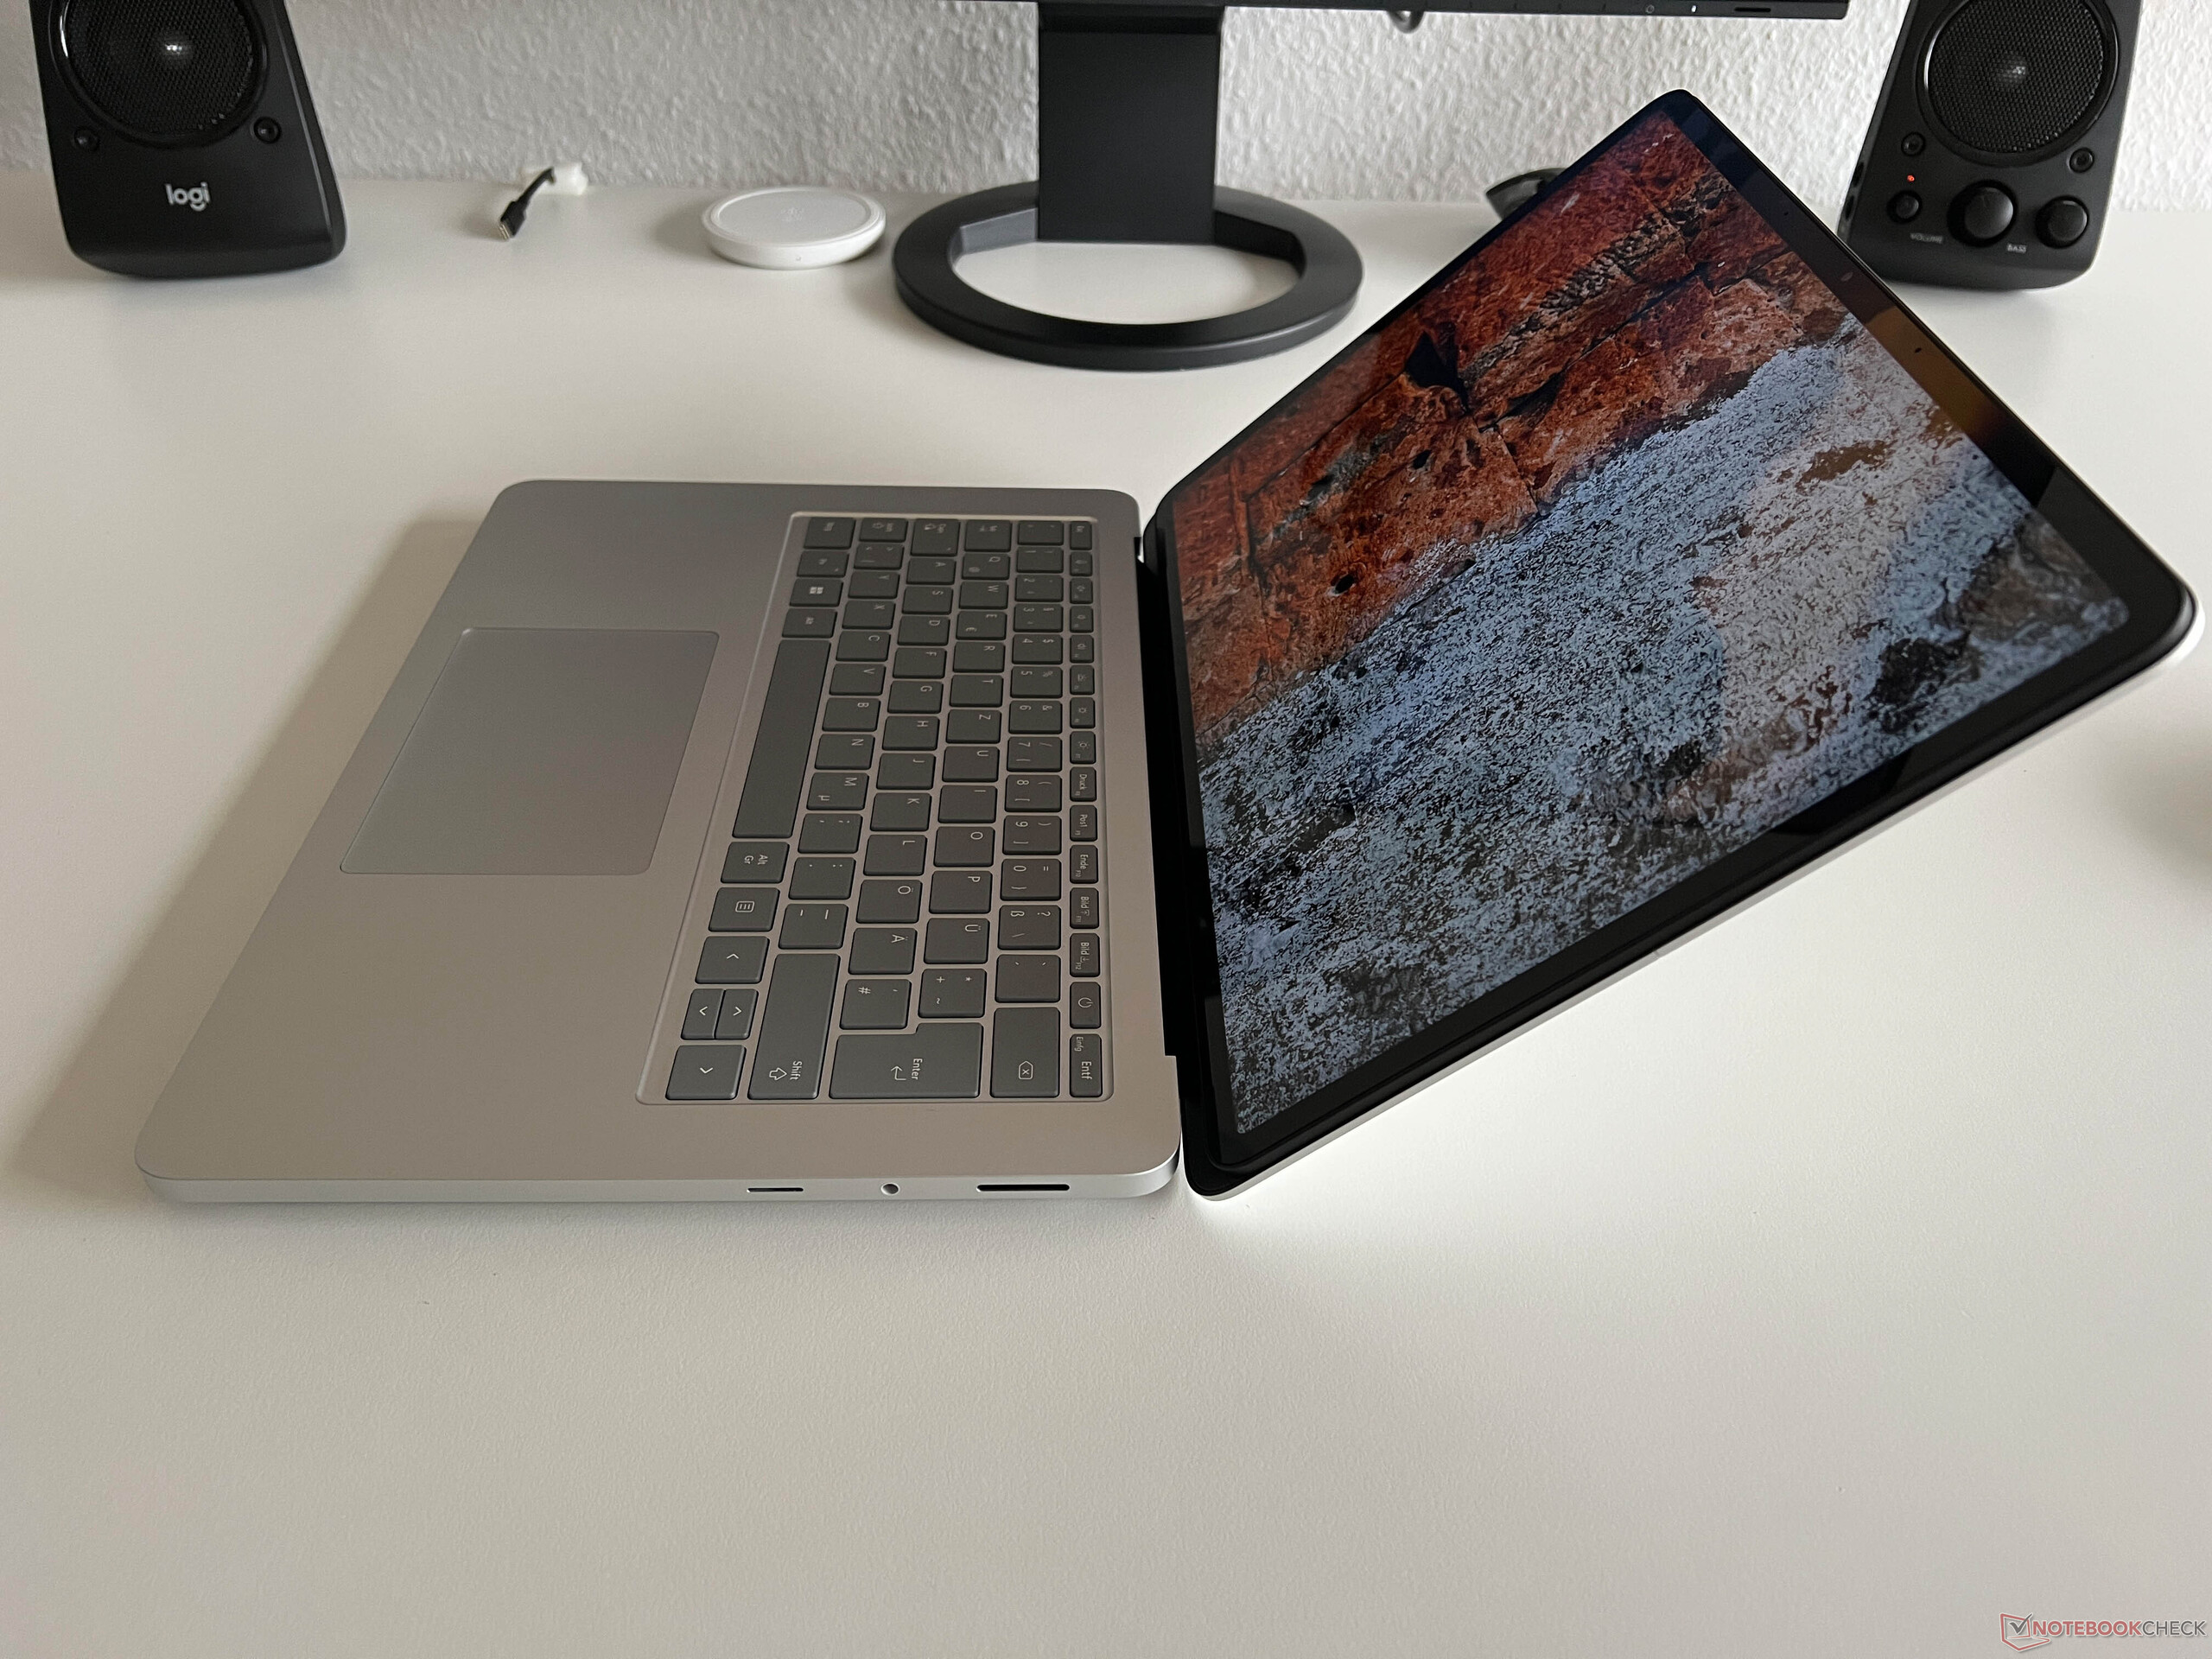
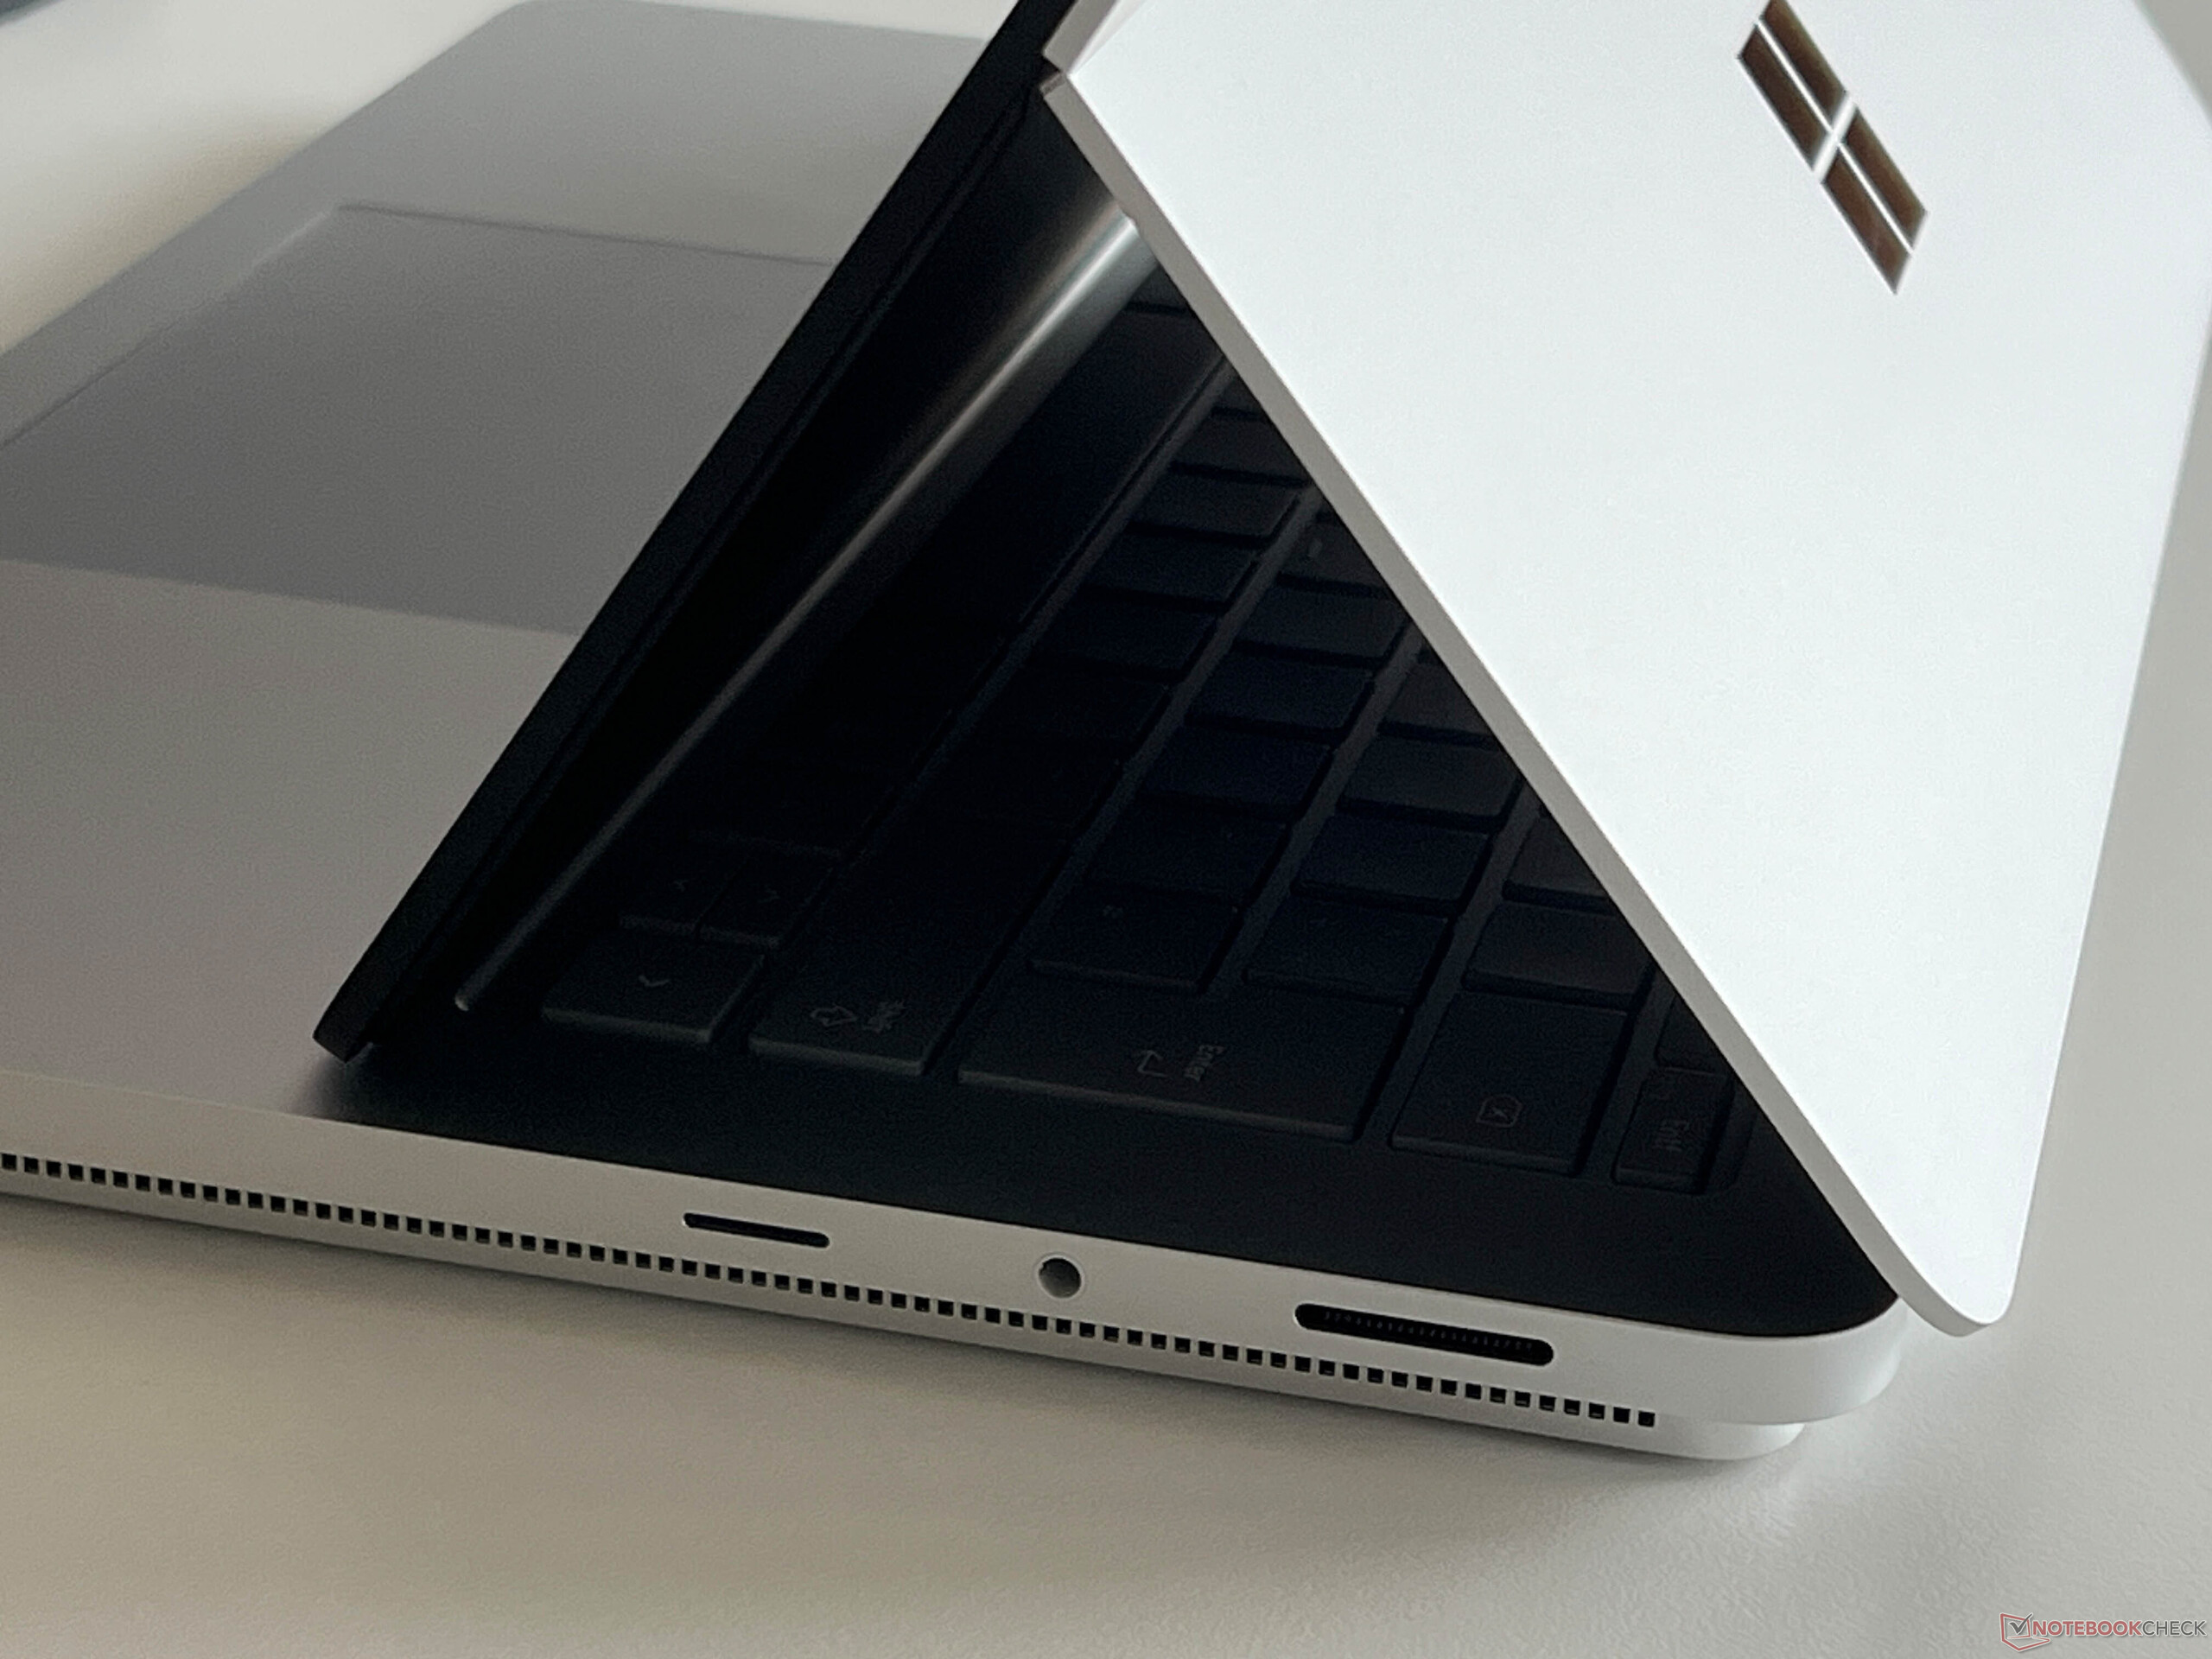
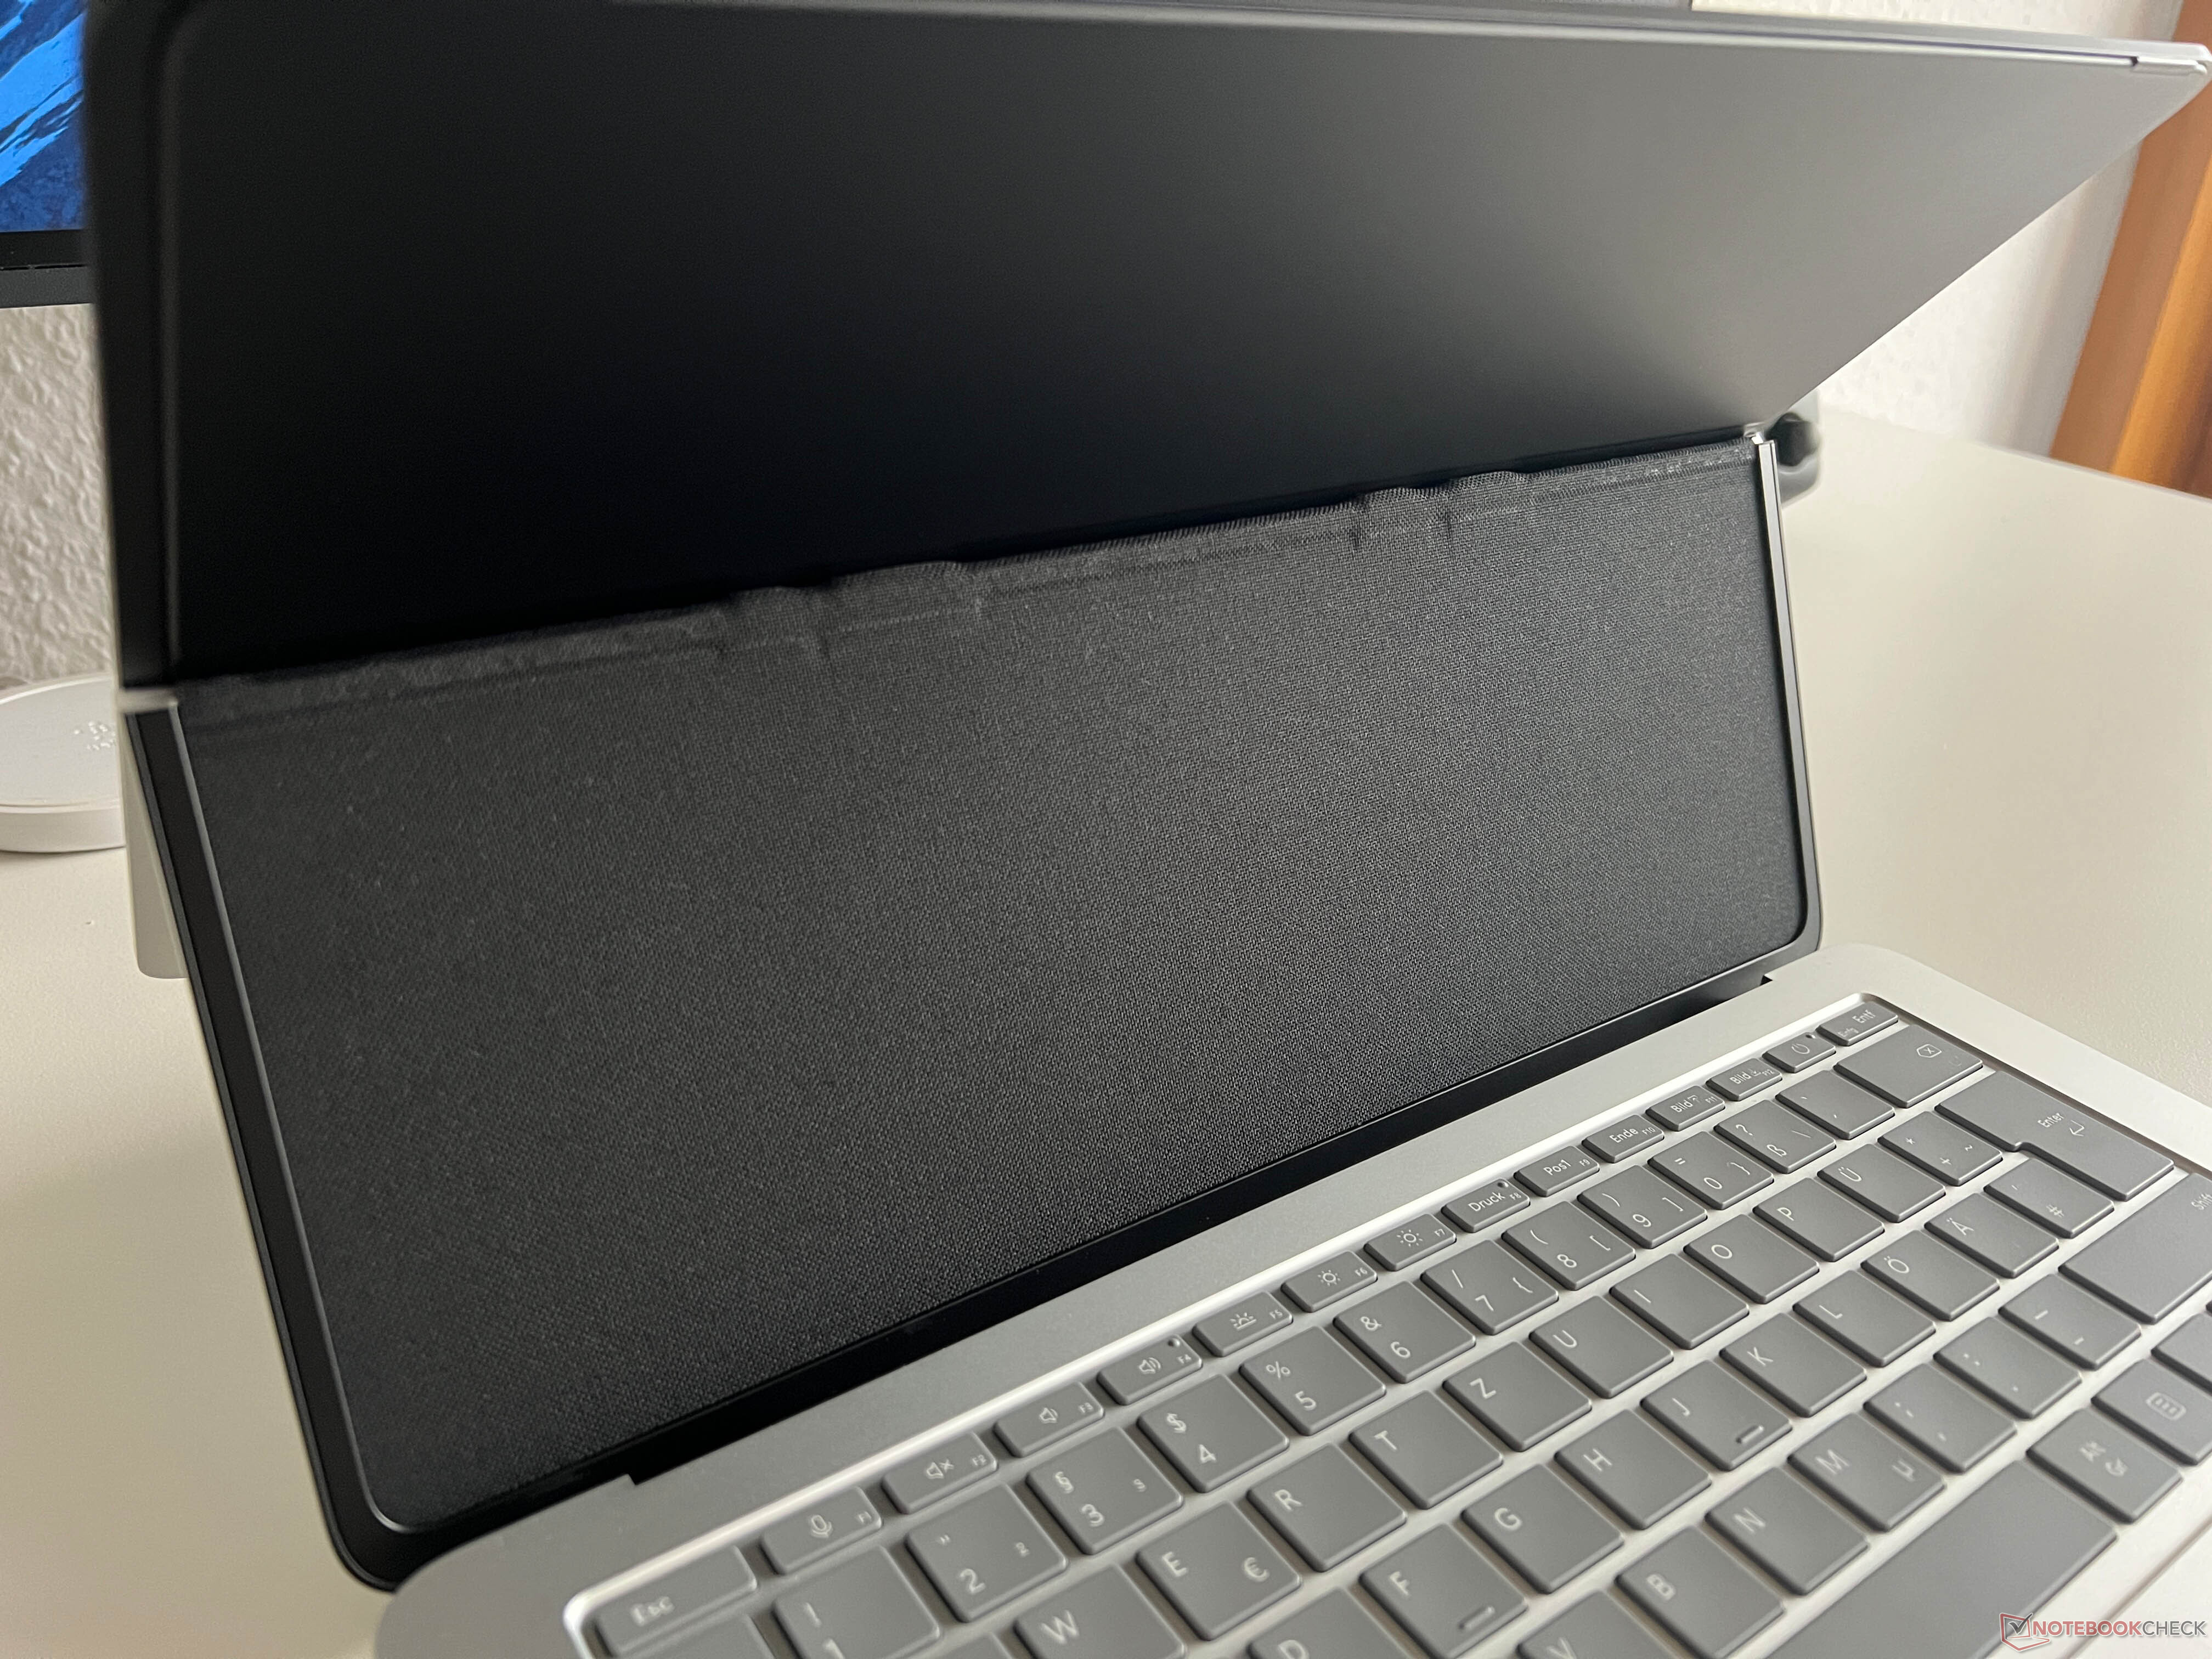
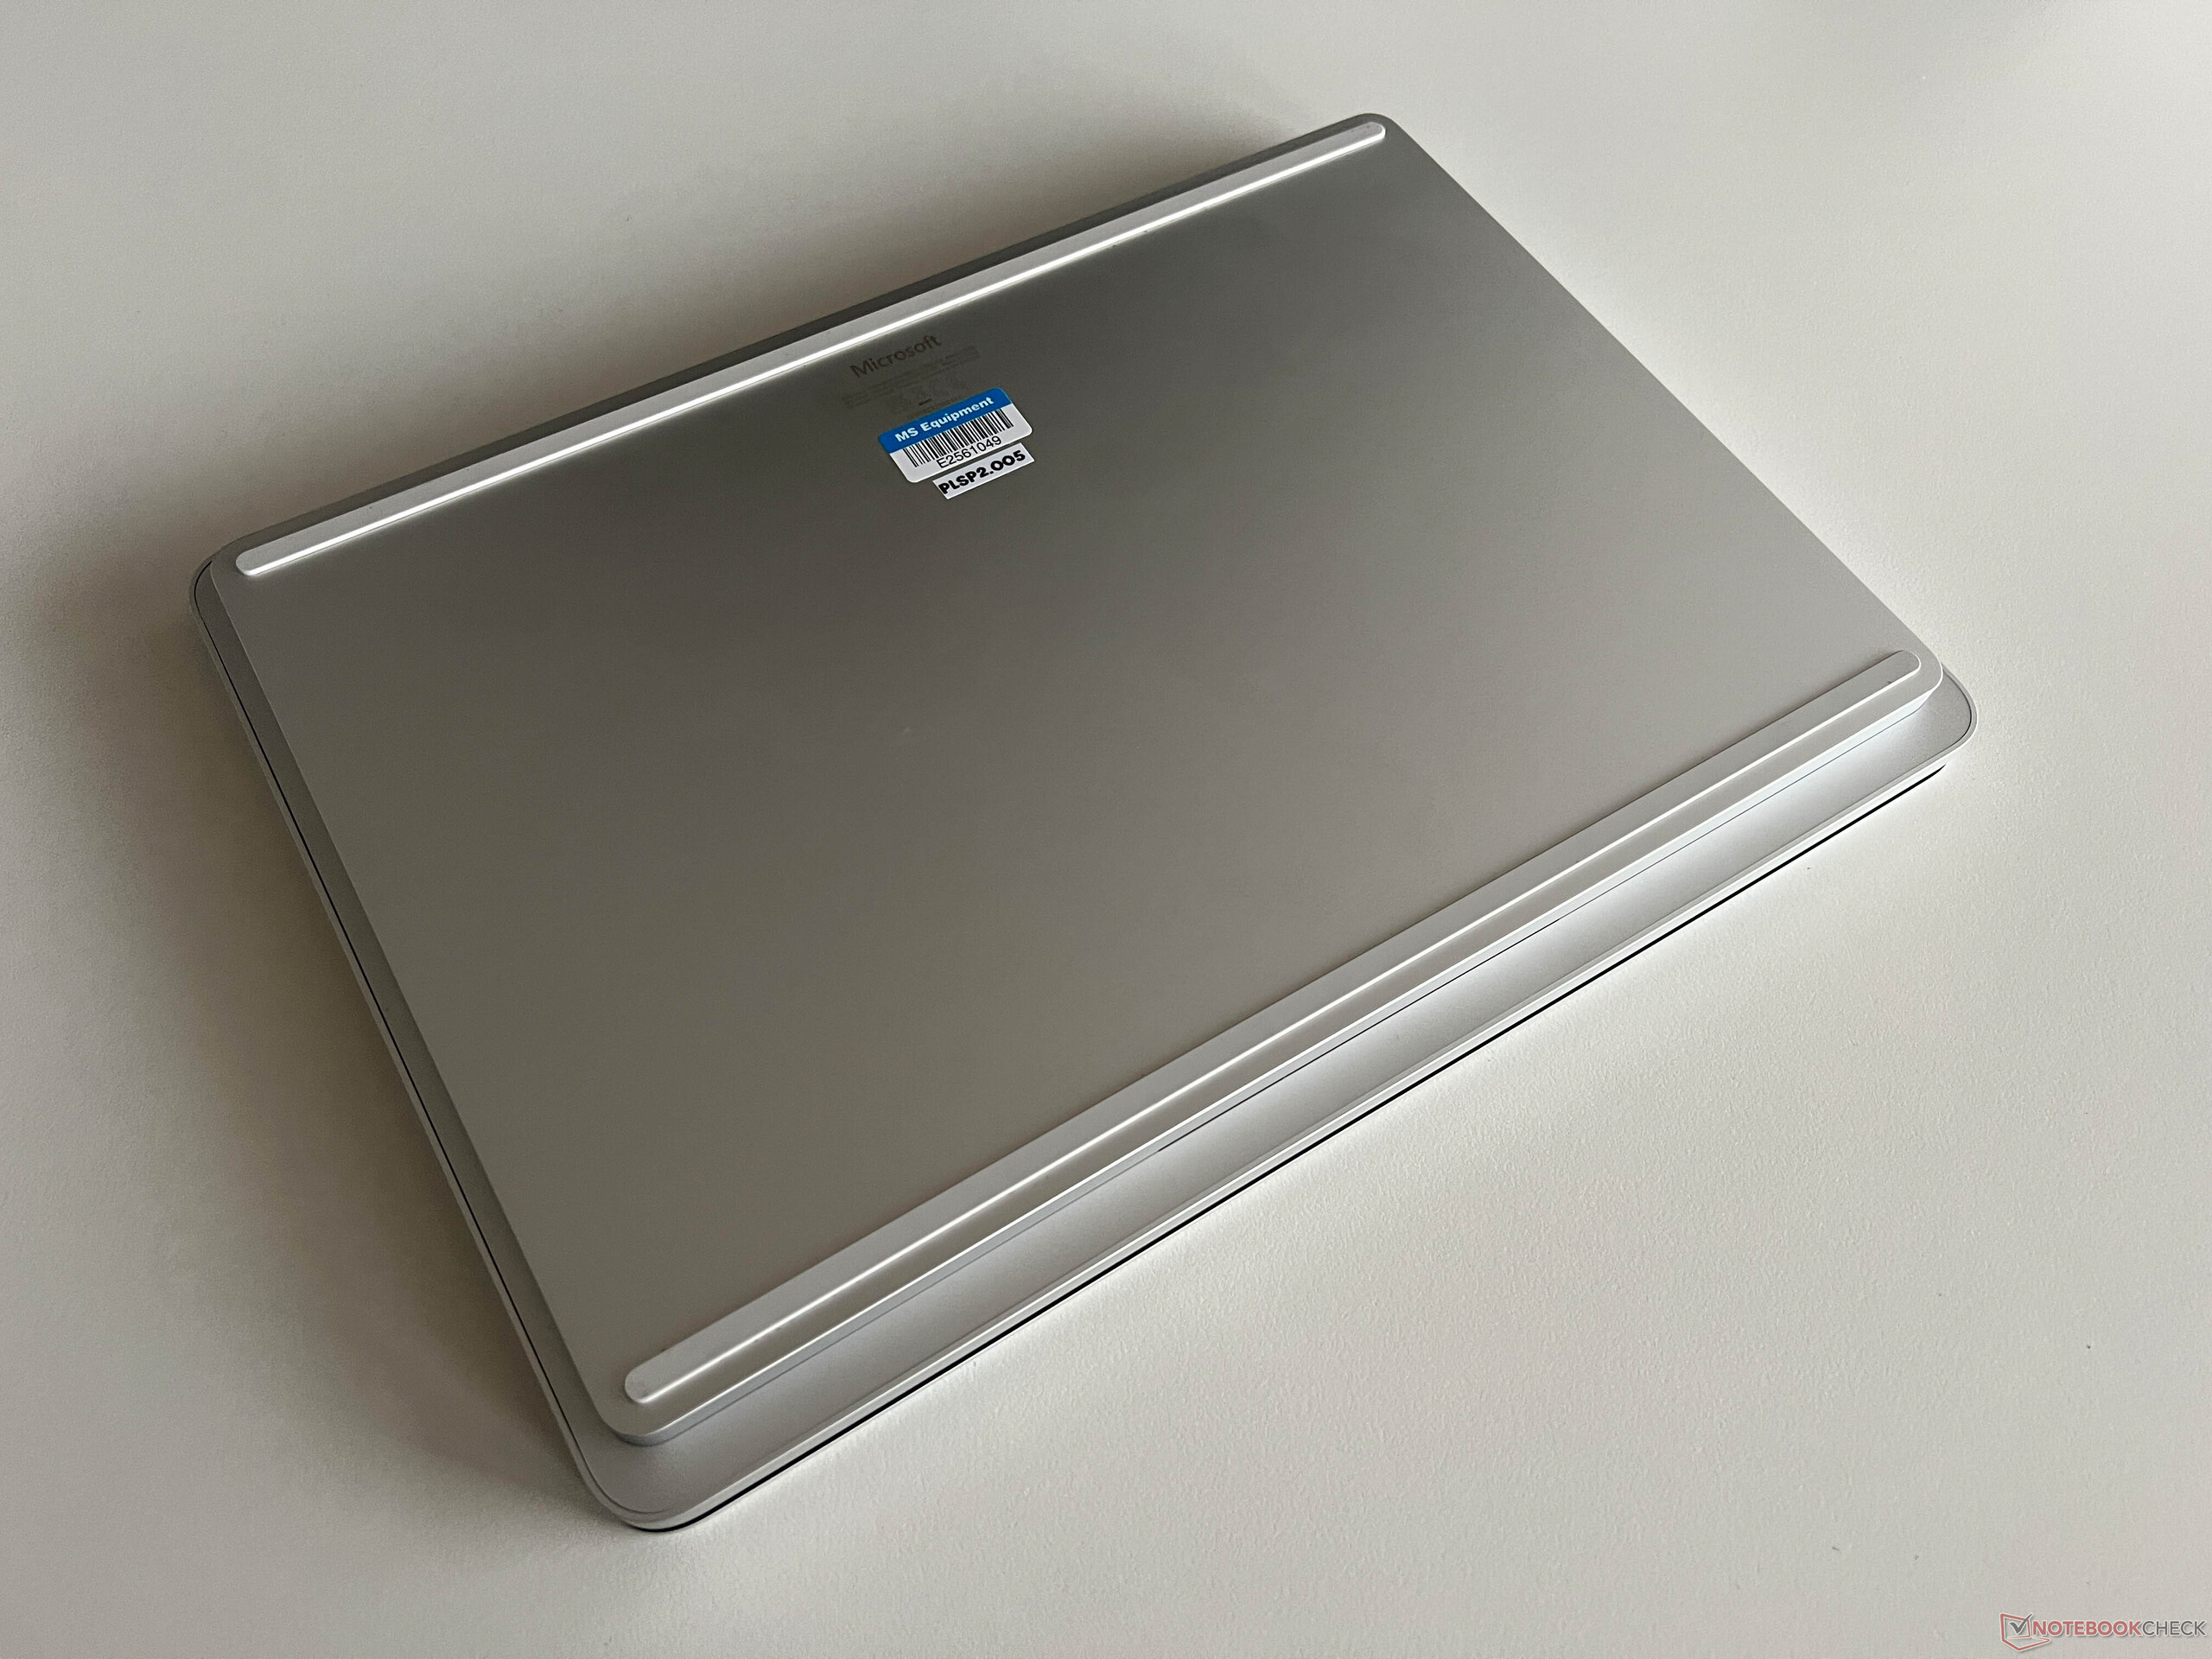
Chassidesignen har inte ändrats jämfört med den första generationensSurface Laptop Studio. Basenheten består av två nivåer och det övre däcket med tangentbordet är bredare på alla sidor, så enheten ser slankare ut än vad den faktiskt är med sina 15 mm. Microsoft använder anodiserad aluminium och både stabiliteten och byggkvaliteten är utmärkt. Skärmramarna är fortfarande mycket breda på ~1 cm, vilket inte verkar särskilt modernt.
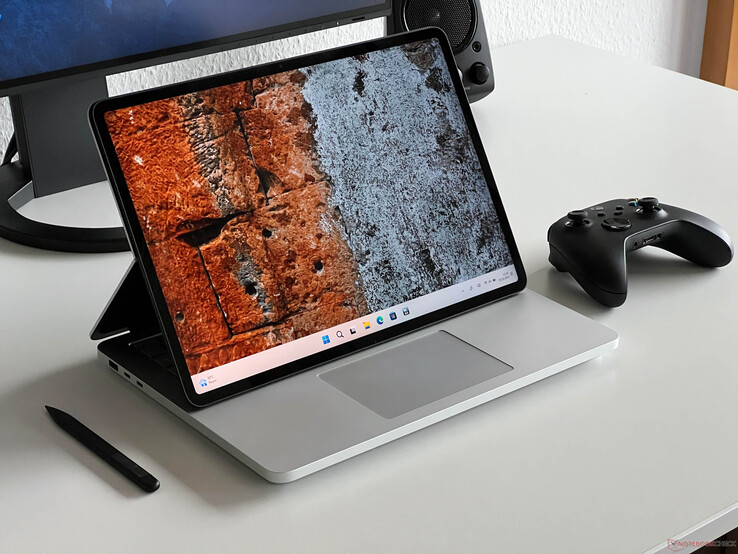
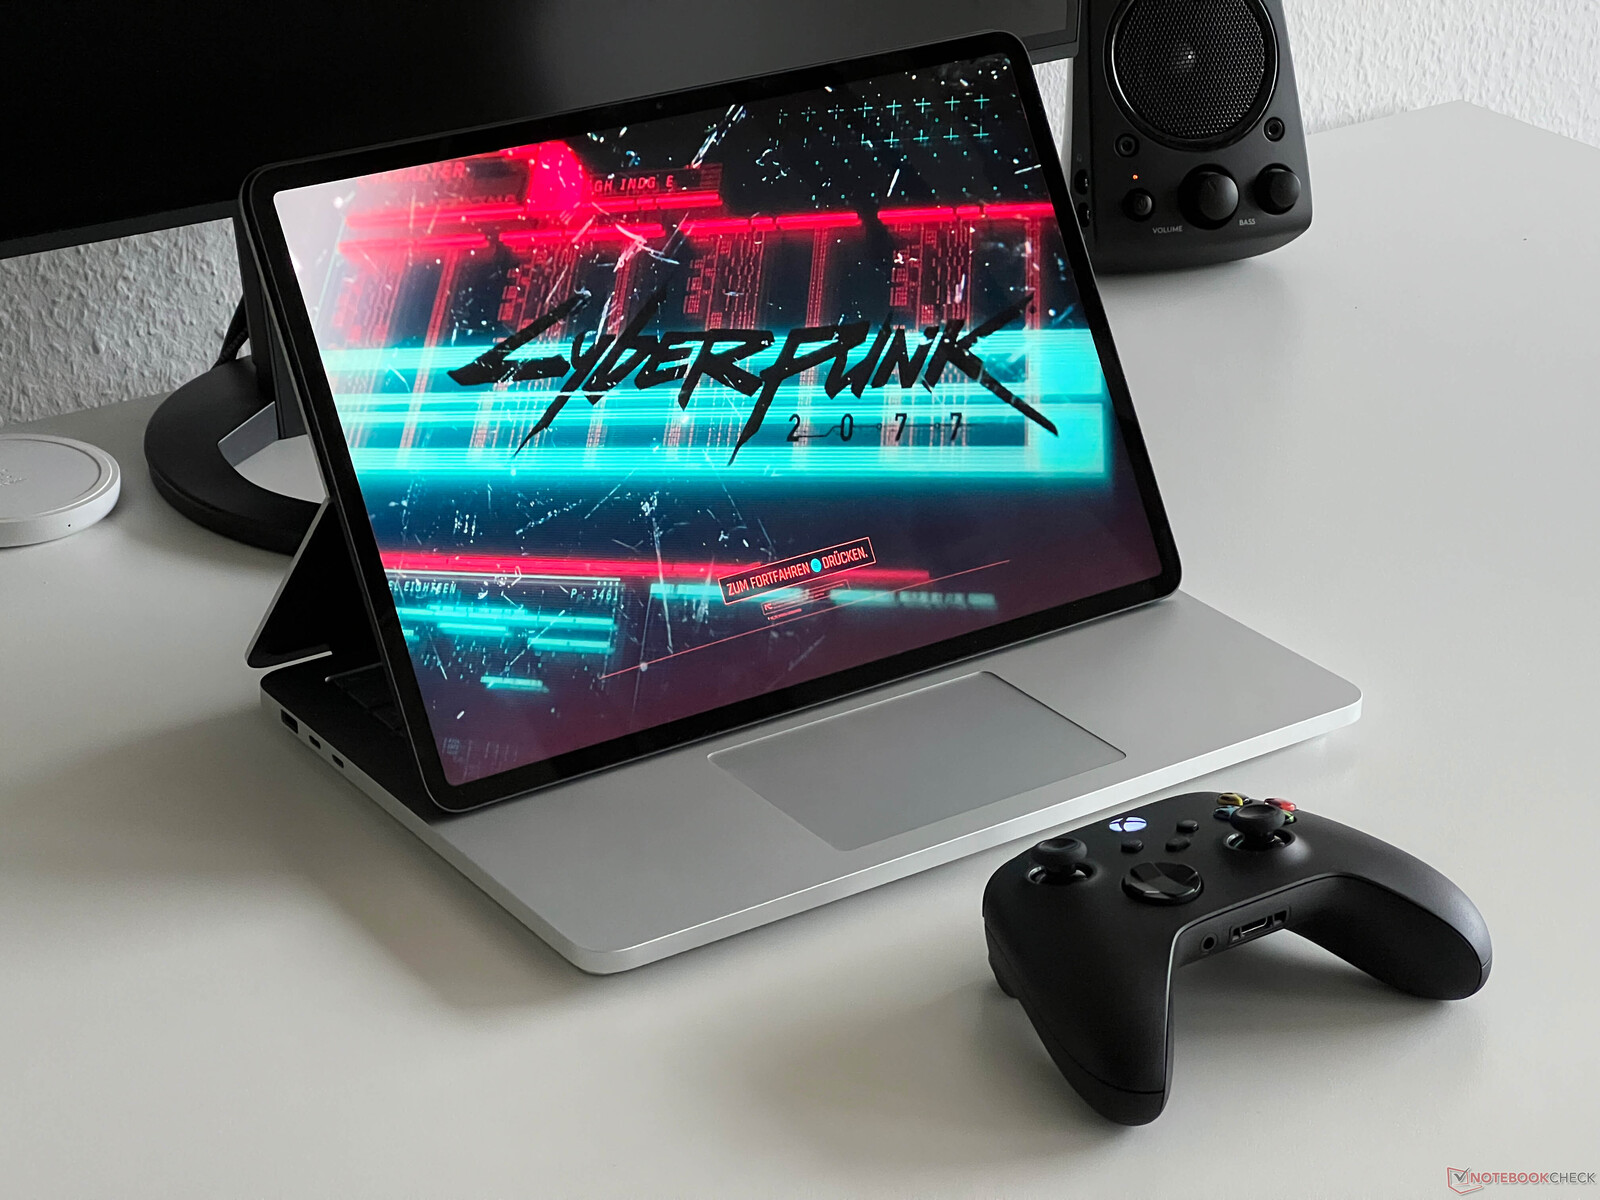
Höjdpunkten är fortfarande den vikbara skärmen med ett sekundärt gångjärn på baksidan av skärmen. Förutom vanlig laptop-användning kan du placera skärmen på basenheten med en liten vinkel, vilket kan vara användbart för touch-ingångar. Det är också möjligt att använda den som en vanlig surfplatta, men det finns hanteringsproblem som den höga vikten och de vassa kanterna på basenheten. Det finns ett annat läge där skärmen placeras på ytan mellan klickplattan och tangentbordet. Klickplattan är fortfarande åtkomlig och du kan självklart fortfarande använda pekskärmen. Det här läget lämpar sig bäst för uppspelning av media eller spel med en gamepad.
Ett av de största problemen med chassit är fortfarande bristen på underhållsalternativ för användarna. Det finns inga synliga skruvar (de är dolda under de limmade gummifötterna), vilket gör att du inte ens kan rengöra fläktarna eller uppgradera M.2-2280 SSD. RAM-minne och andra komponenter är lödda.

Surface Laptop Studio 2 är bland de största enheterna i vår jämförelsegrupp, även om skillnaderna när det gäller fotavtryck inte är enorma. Granskningsenheten är dock också den tjockaste enheten här och detta är märkbart. Det är också mycket tyngre än rivalerna på 2 kg skarpa. Den nya 127W PSU med Surface-kontakten tippar skalan på cirka 450 gram.
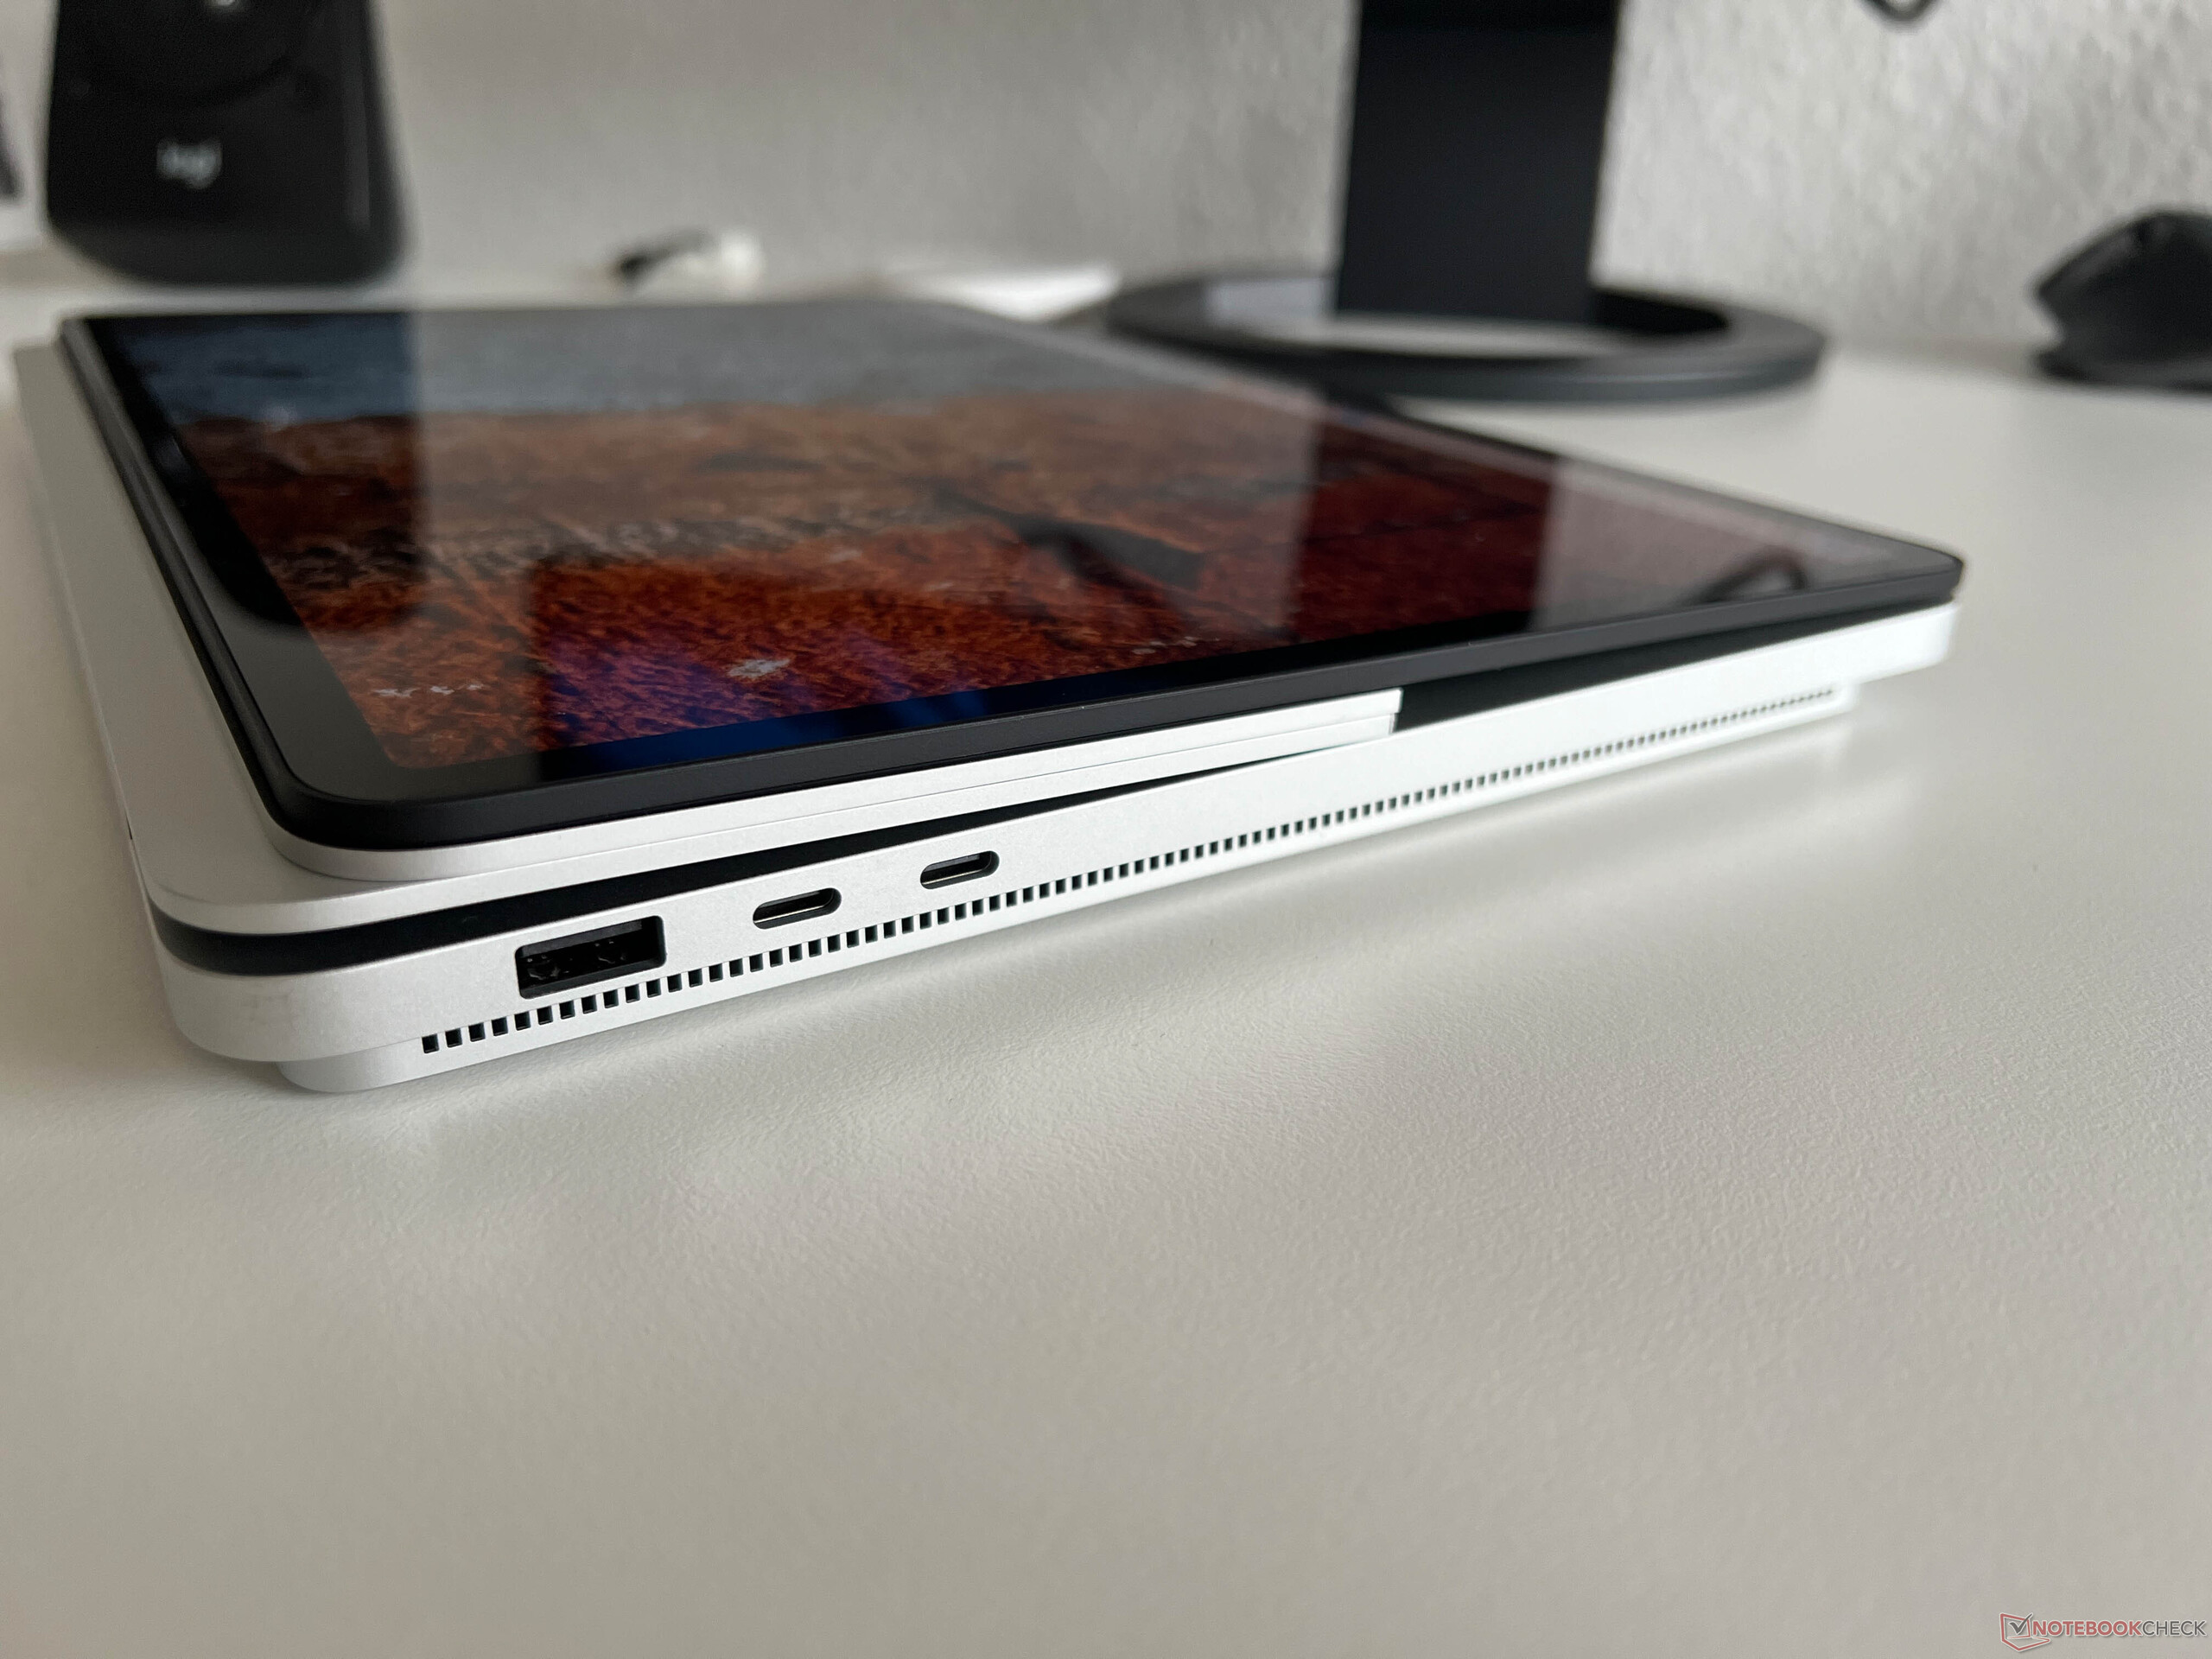
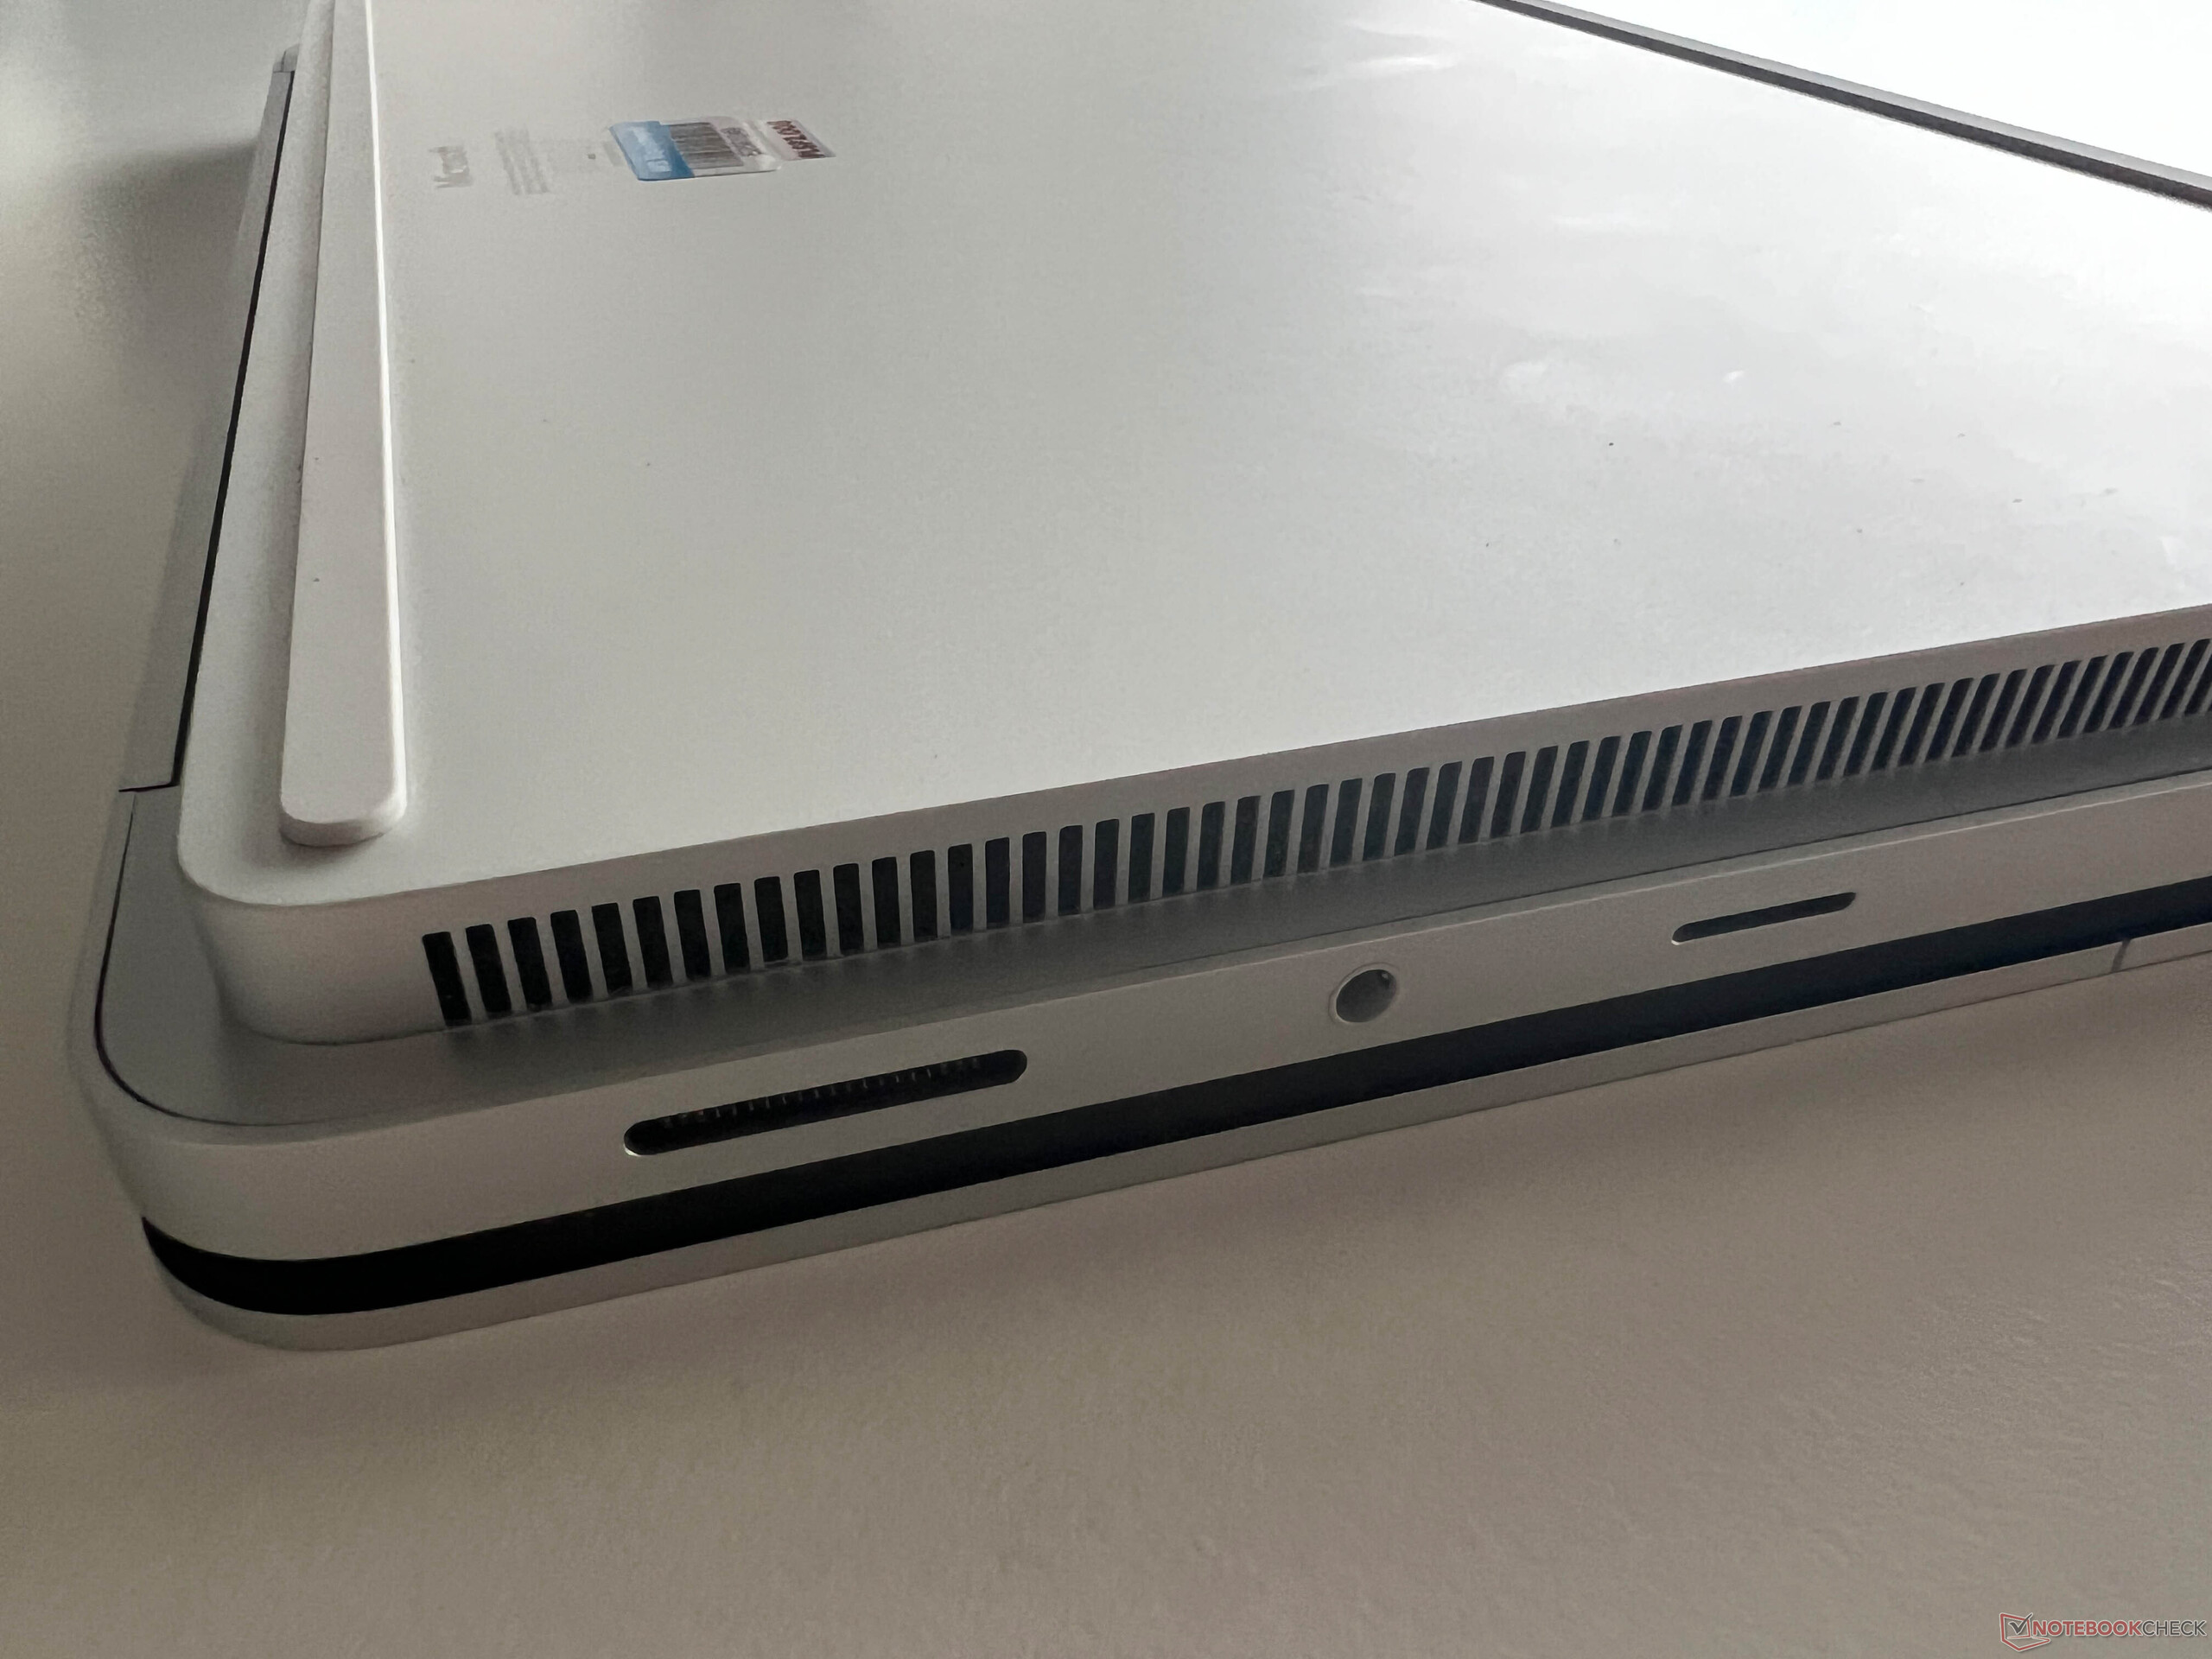
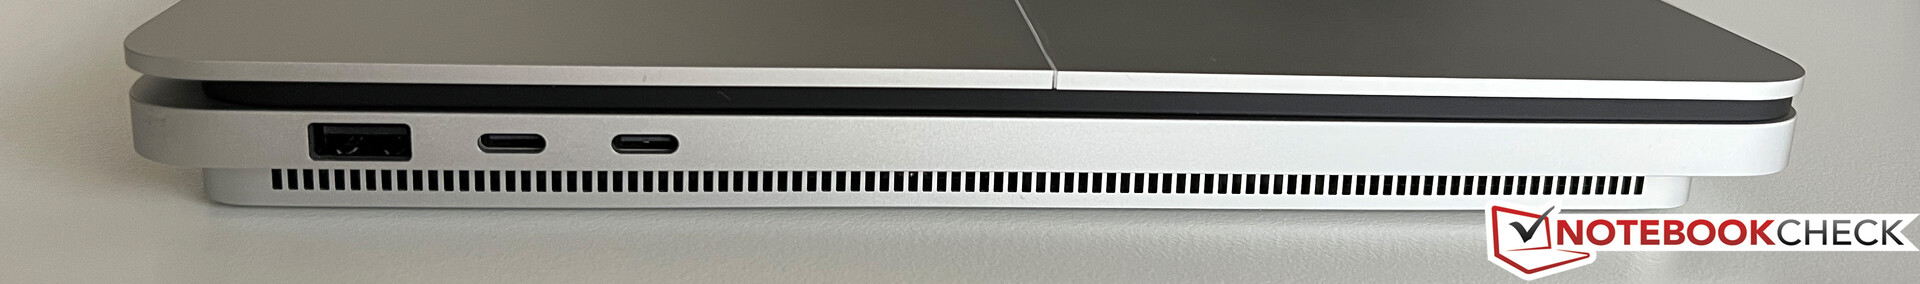
Anslutningsmöjligheter - Microsoft har fler portar
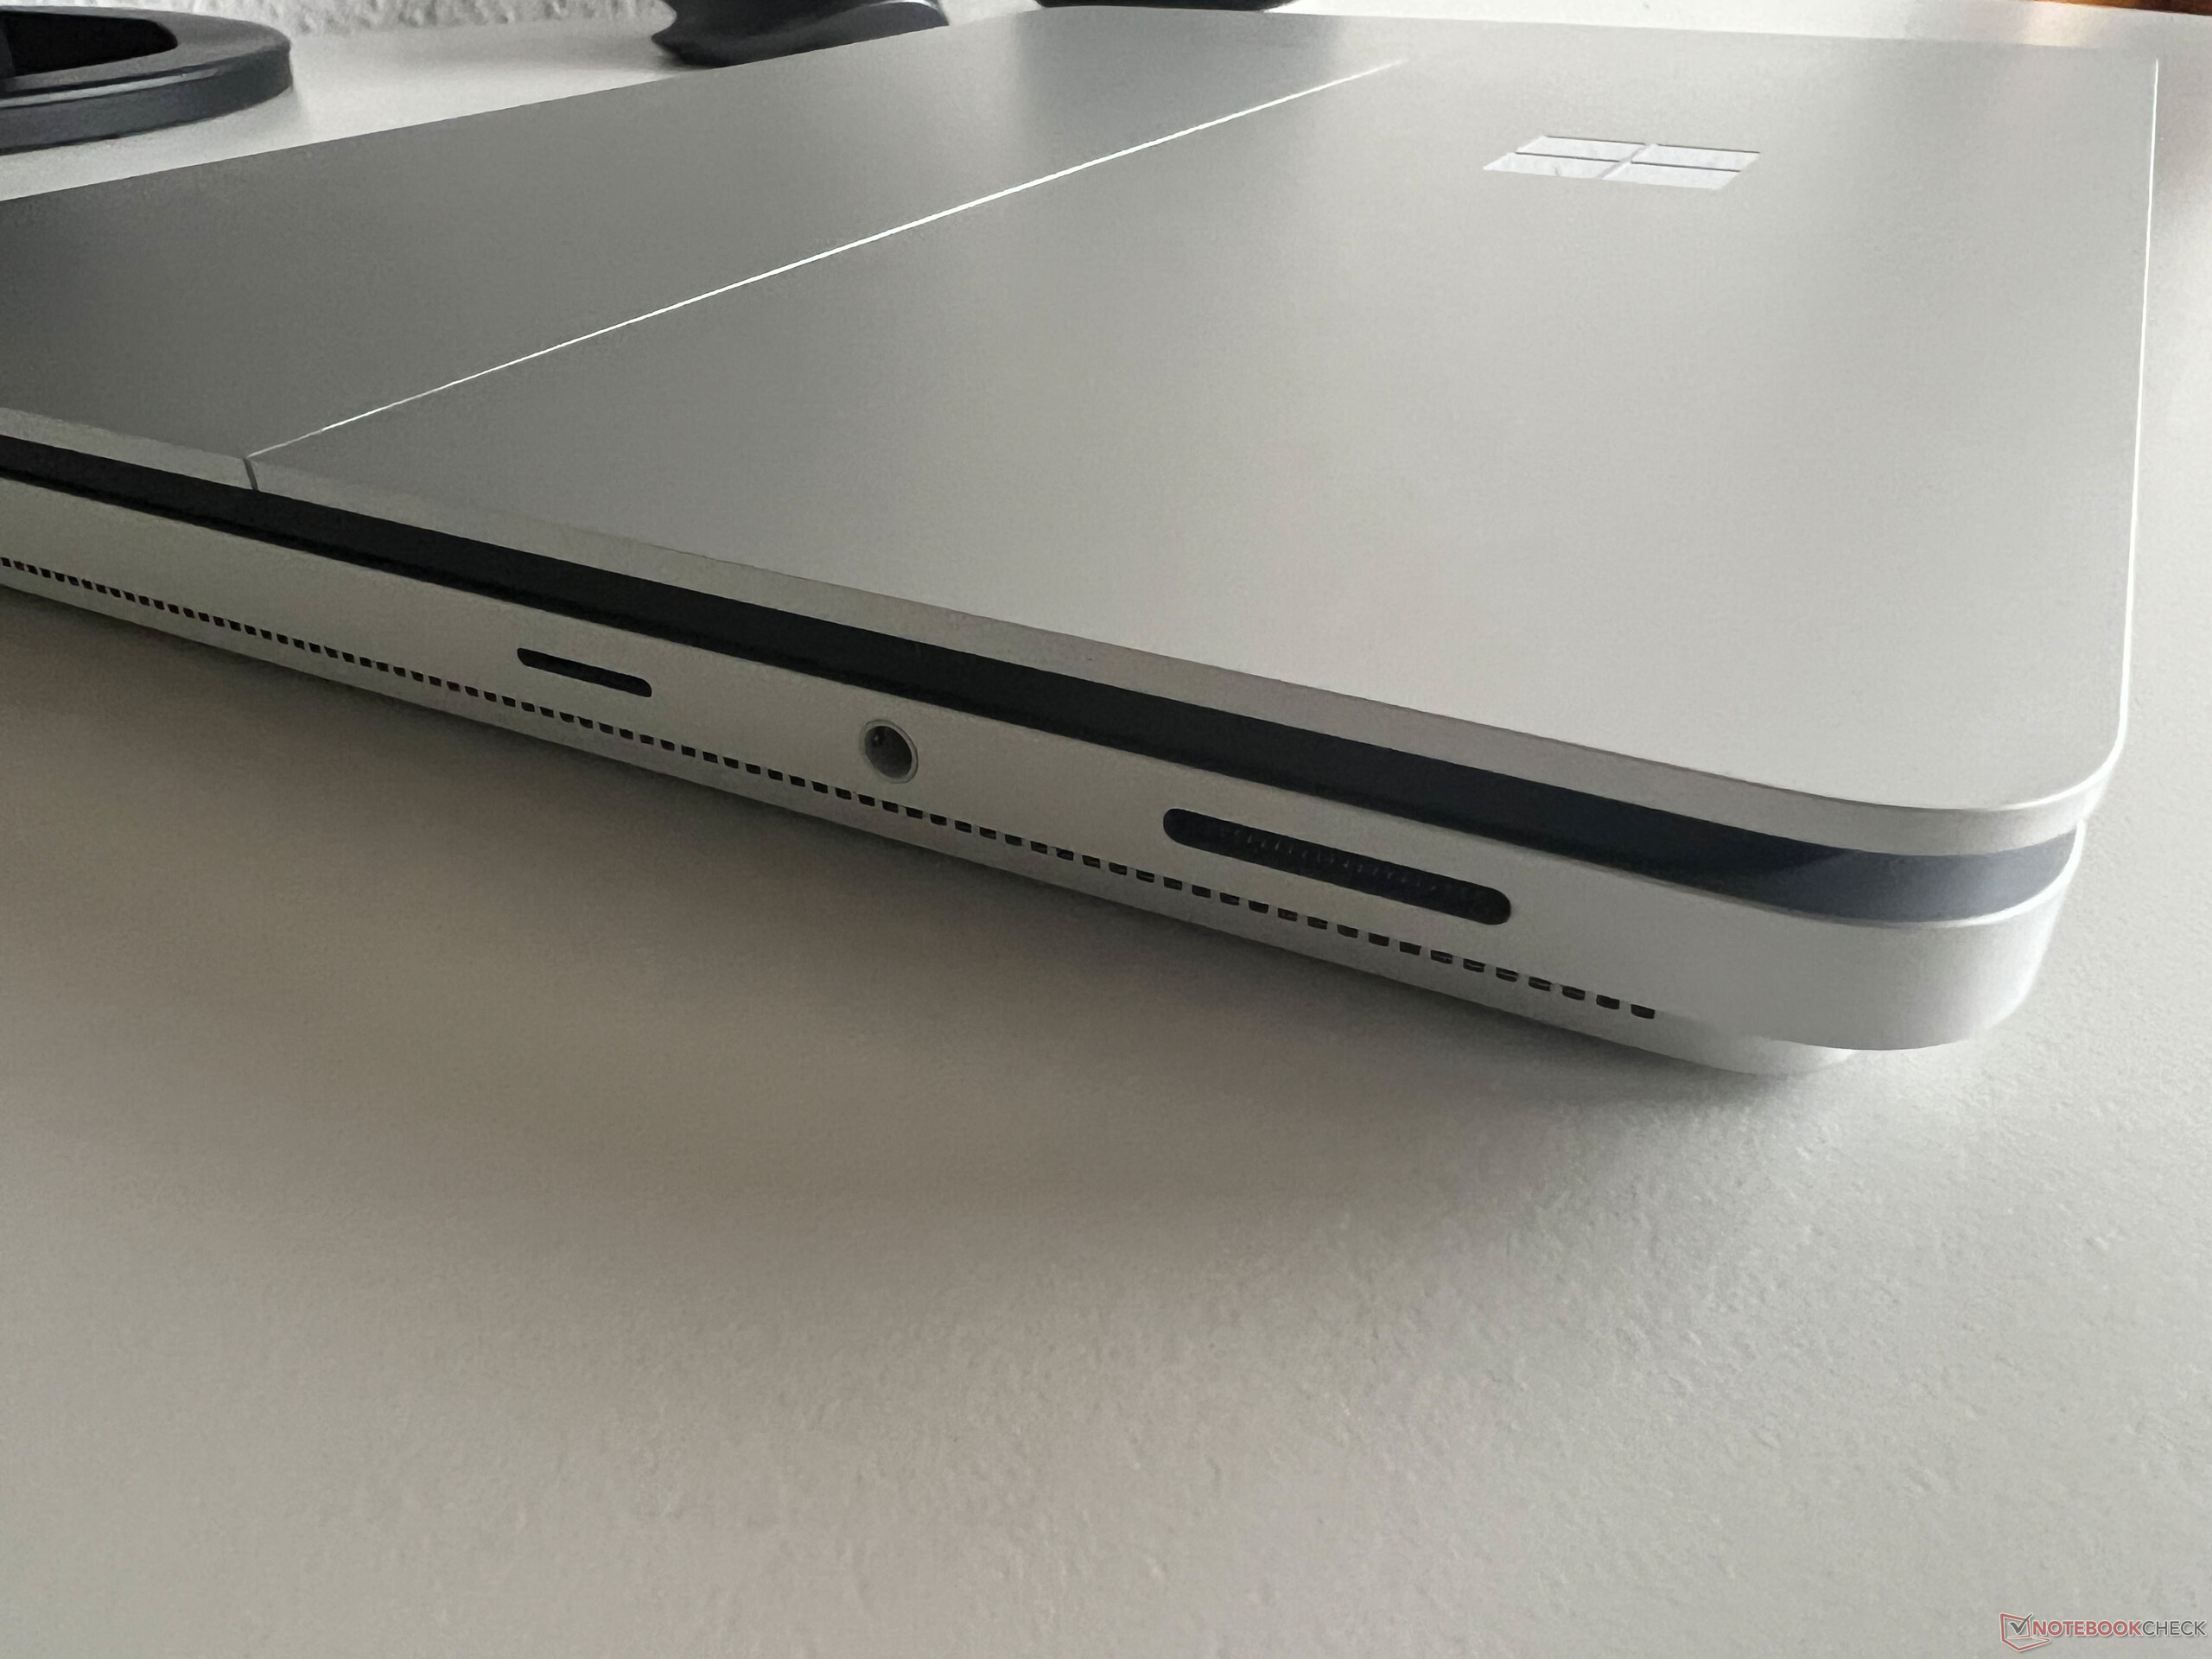
Portsituationen var en av våra kritikpunkter på den första generationens Surface Laptop Studio och det verkar som om Microsoft har lyssnat. Förutom USB-C-portarna med Thunderbolt 4 samt Surface Connect-porten får kunderna nu även en vanlig USB-A-port samt en microSD-kortläsare. Vi tycker fortfarande att Surface Connect-porten är lite otymplig, men Microsoft håller åtminstone fast vid den och fortsätter att erbjuda tillbehör.
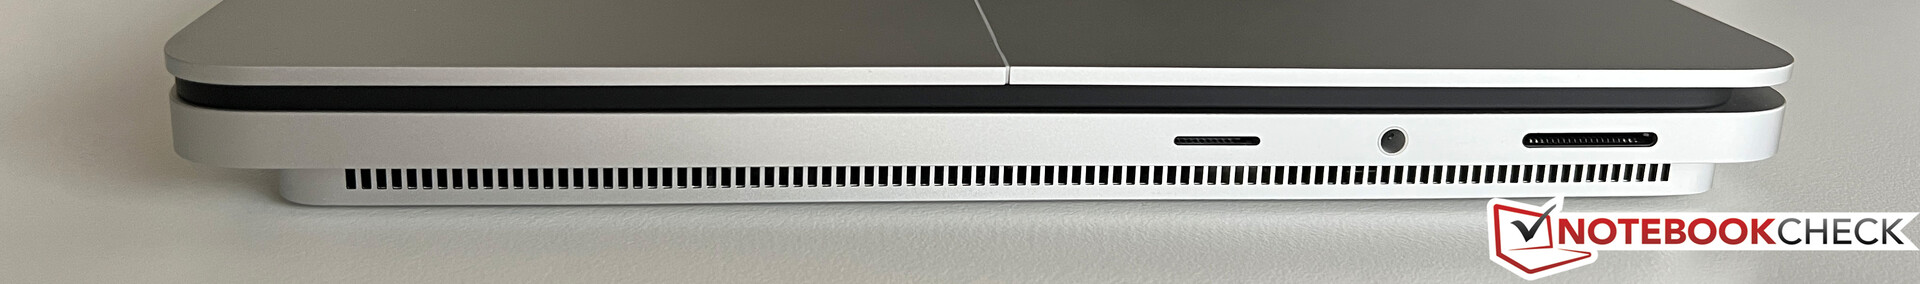
SD-kortläsare
På höger sida finns nu en microSD-kortläsare med fjädermekanism. Inskjutna kort sticker bara ut något, så du kan lämna kortet isatt under längre perioder. I kombination med vårt referenskort (Angelbird AV Pro V60) uppmäter vi höga överföringshastigheter på 190 MB/s.
Kommunikation
Microsoft använder en modern Wi-Fi 6E-modul från Intel (AX210), som också stöder moderna 6 GHz-nätverk samt Bluetooth 5.3. Överföringshastigheterna är bra, men kan vara ännu bättre när det gäller att skicka data. Detta är dock inte riktigt märkbart i praktiken.
| Networking | |
| Microsoft Surface Laptop Studio 2 RTX 4060 | |
| iperf3 transmit AXE11000 | |
| iperf3 receive AXE11000 | |
| Apple MacBook Pro 14 2023 M2 Pro | |
| iperf3 transmit AXE11000 6GHz | |
| iperf3 receive AXE11000 6GHz | |
| Lenovo Yoga Pro 9-14IRP G8 | |
| iperf3 transmit AXE11000 | |
| iperf3 receive AXE11000 | |
| Asus Zenbook Pro 14 OLED UX6404VI | |
| iperf3 transmit AXE11000 | |
| iperf3 receive AXE11000 | |
| Asus ZenBook Pro 14 Duo UX8402VV-P1021W | |
| iperf3 transmit AXE11000 | |
| iperf3 receive AXE11000 | |
| iperf3 transmit AXE11000 6GHz | |
| iperf3 receive AXE11000 6GHz | |
| Asus ROG Zephyrus G14 GA402XY | |
| iperf3 transmit AXE11000 | |
| iperf3 receive AXE11000 | |
| Lenovo Legion Slim 5 14APH8 | |
| iperf3 transmit AXE11000 | |
| iperf3 receive AXE11000 | |
| iperf3 transmit AXE11000 6GHz | |
| iperf3 receive AXE11000 6GHz | |
| Microsoft Surface Laptop Studio i7 RTX 3050 Ti | |
| iperf3 transmit AX12 | |
| iperf3 receive AX12 | |
Webbkamera
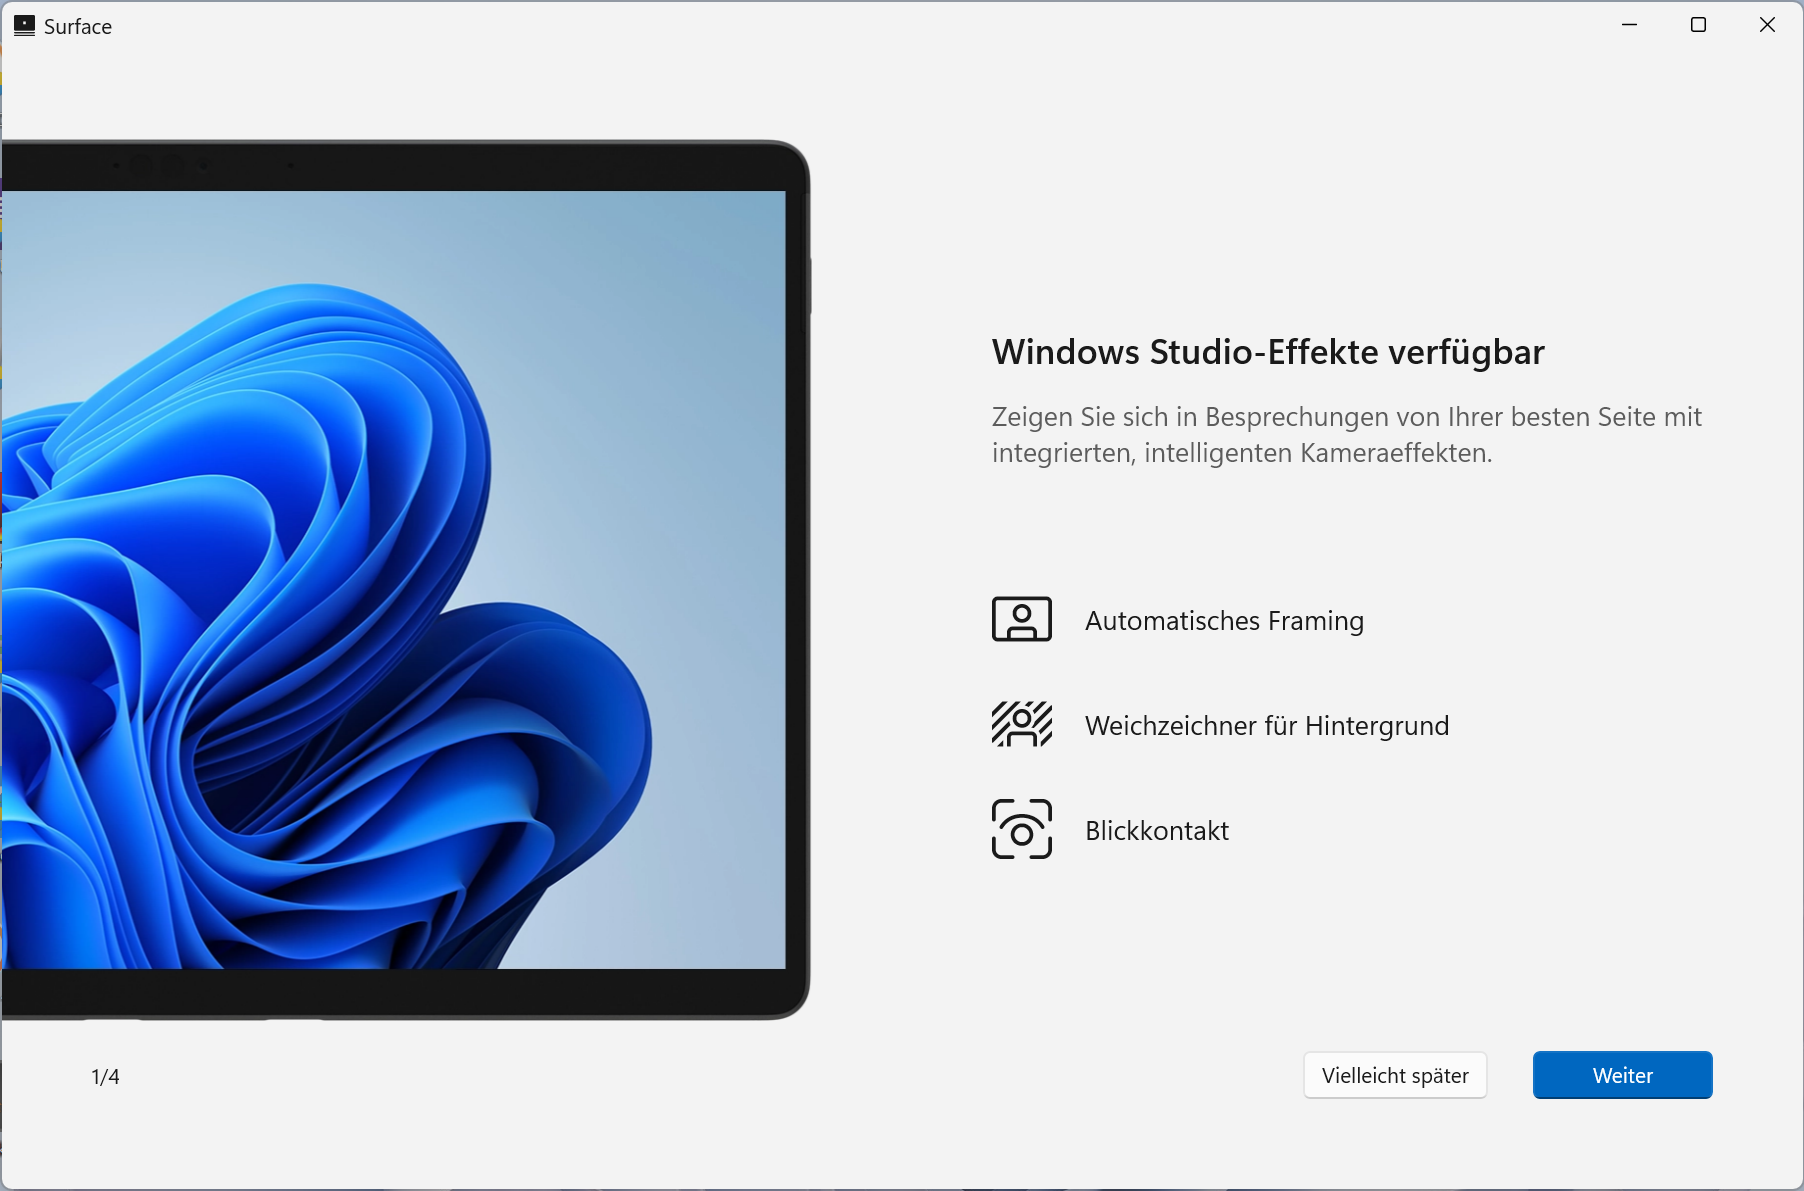
Kvaliteten på 1080p-webbkameran är hyfsad i bra ljusförhållanden, men Surface Pro-modellerna är utrustade med mycket bättre kameror. Microsoft använder nu en vidvinkellins, vilket resulterar i kraftiga förvrängningar när man kommer för nära linsen (se testbilden nedan). Kameran har stöd för studioeffekter som mjukfokus, automatisk inramning och ögonkontakt, vilket fungerar bra. Du kan också använda ansiktsigenkänning via Windows Hello tack vare en IR-modul.


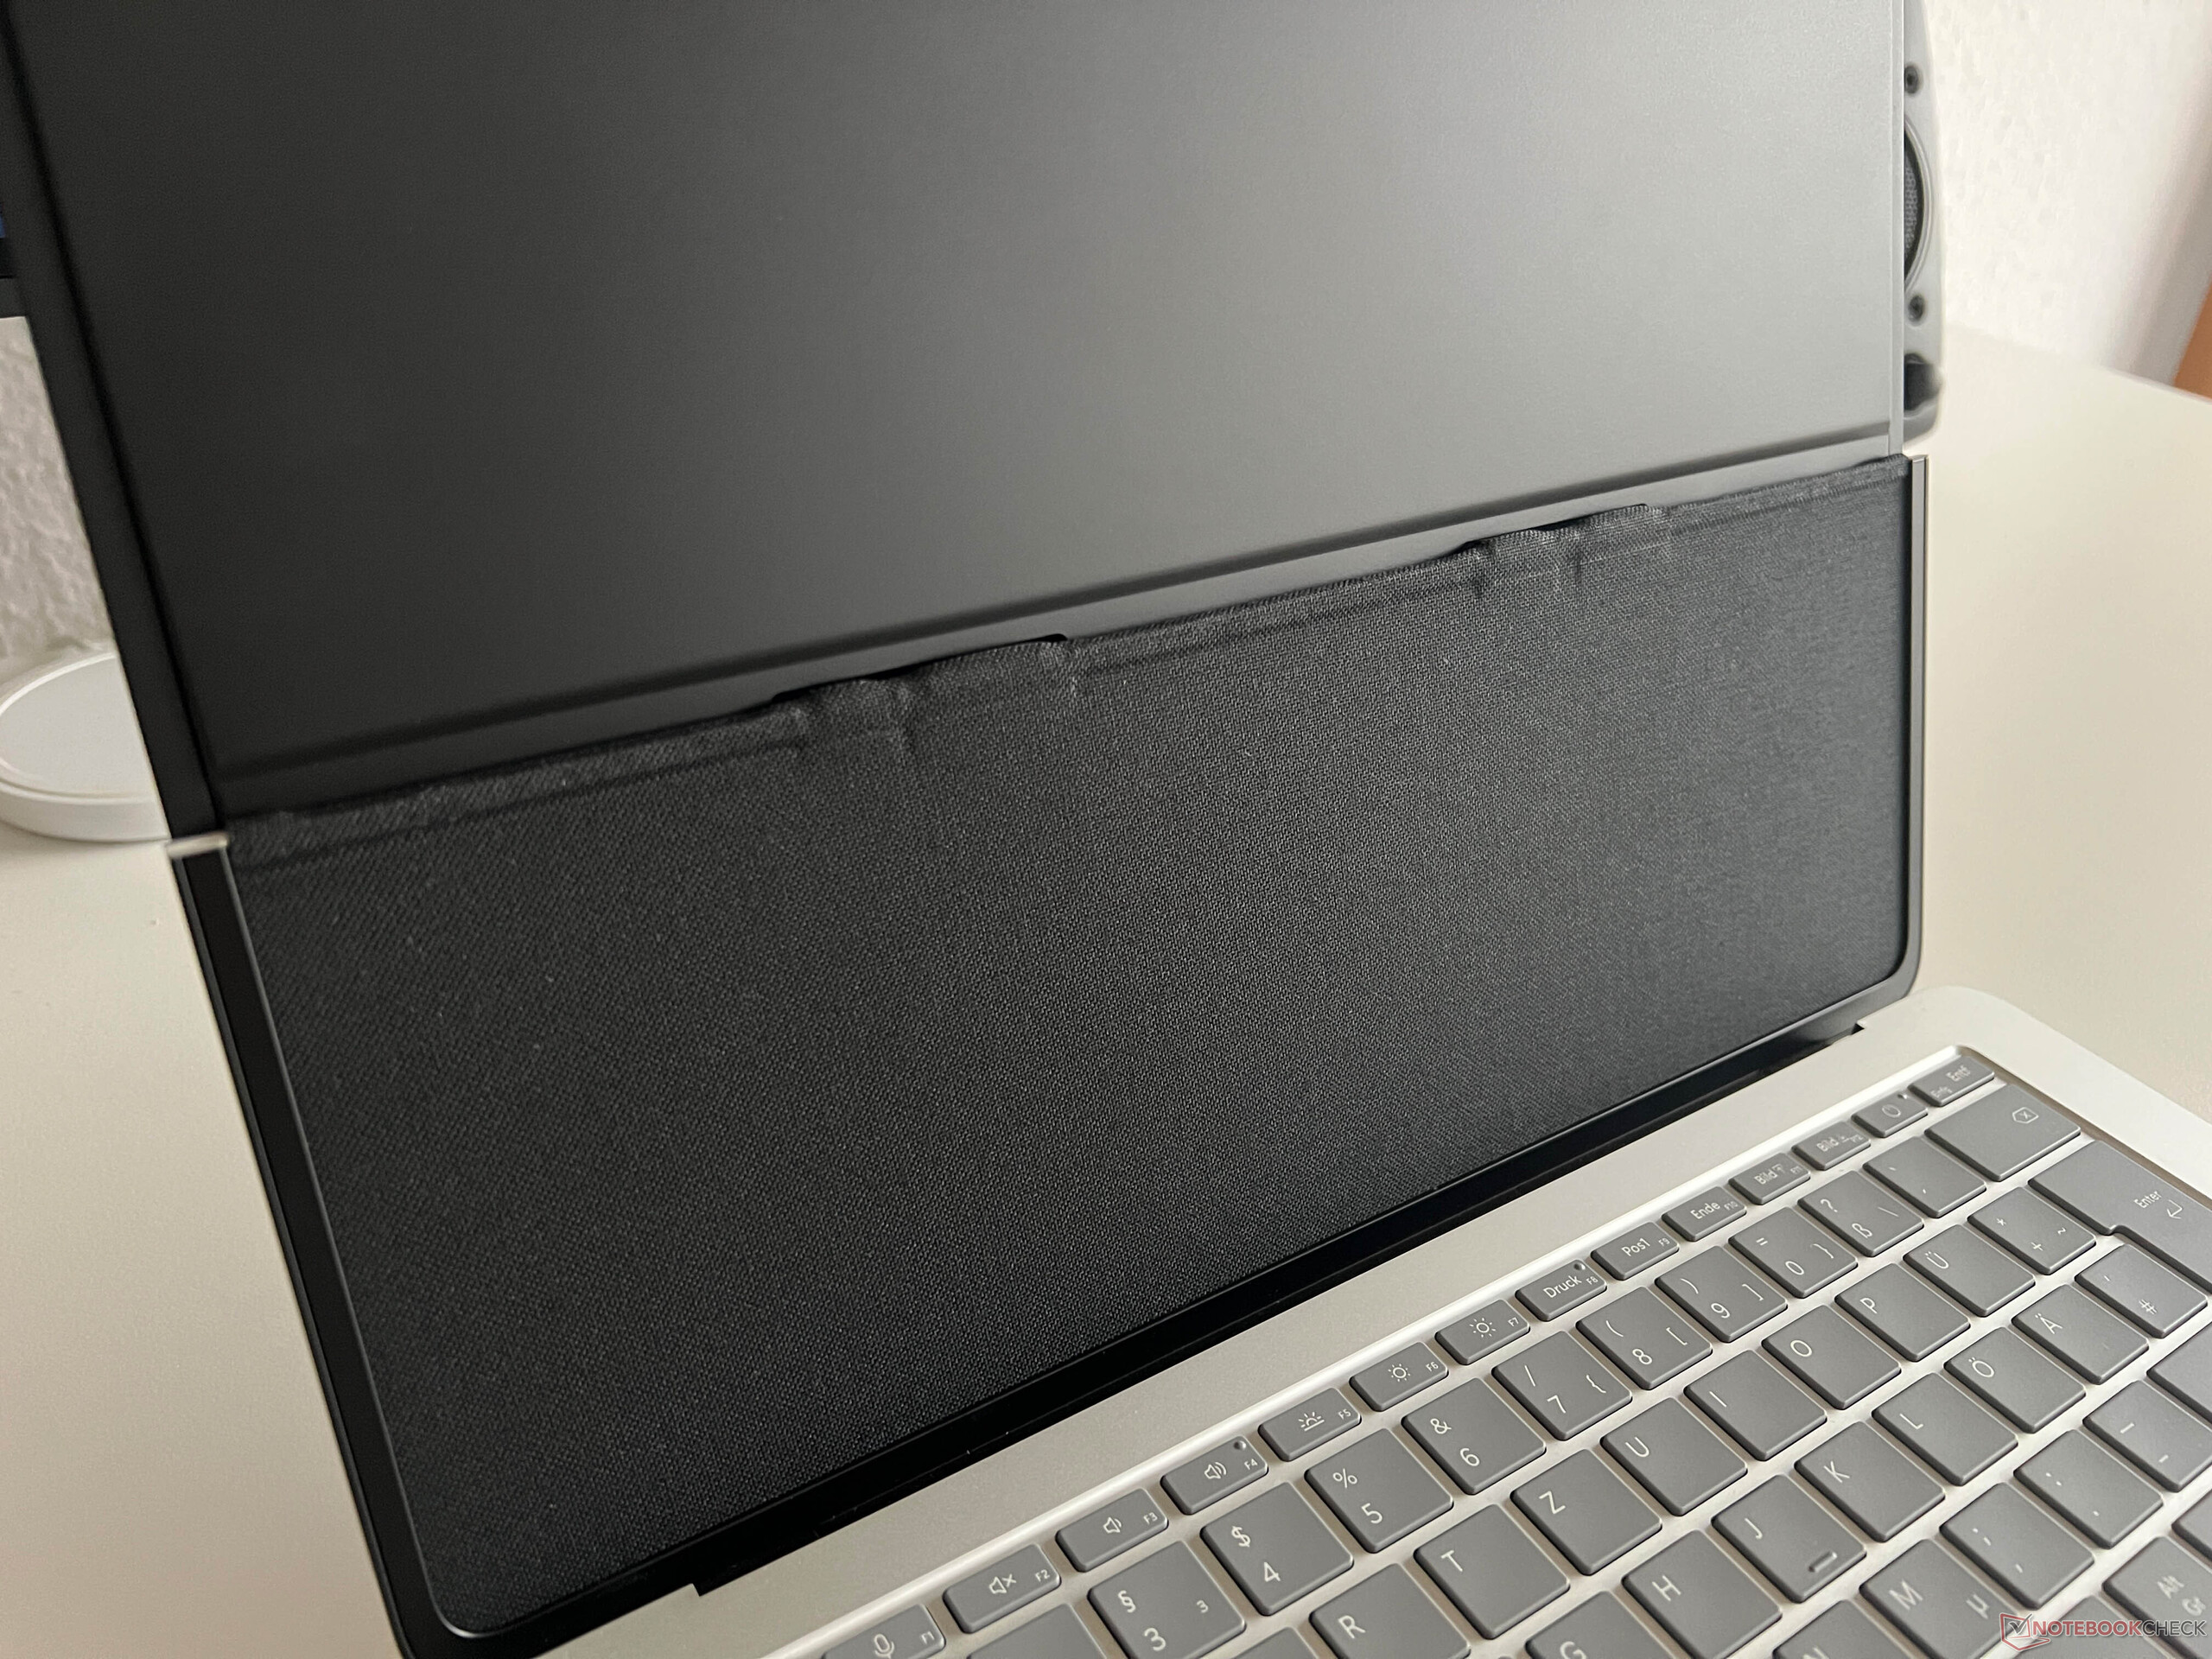
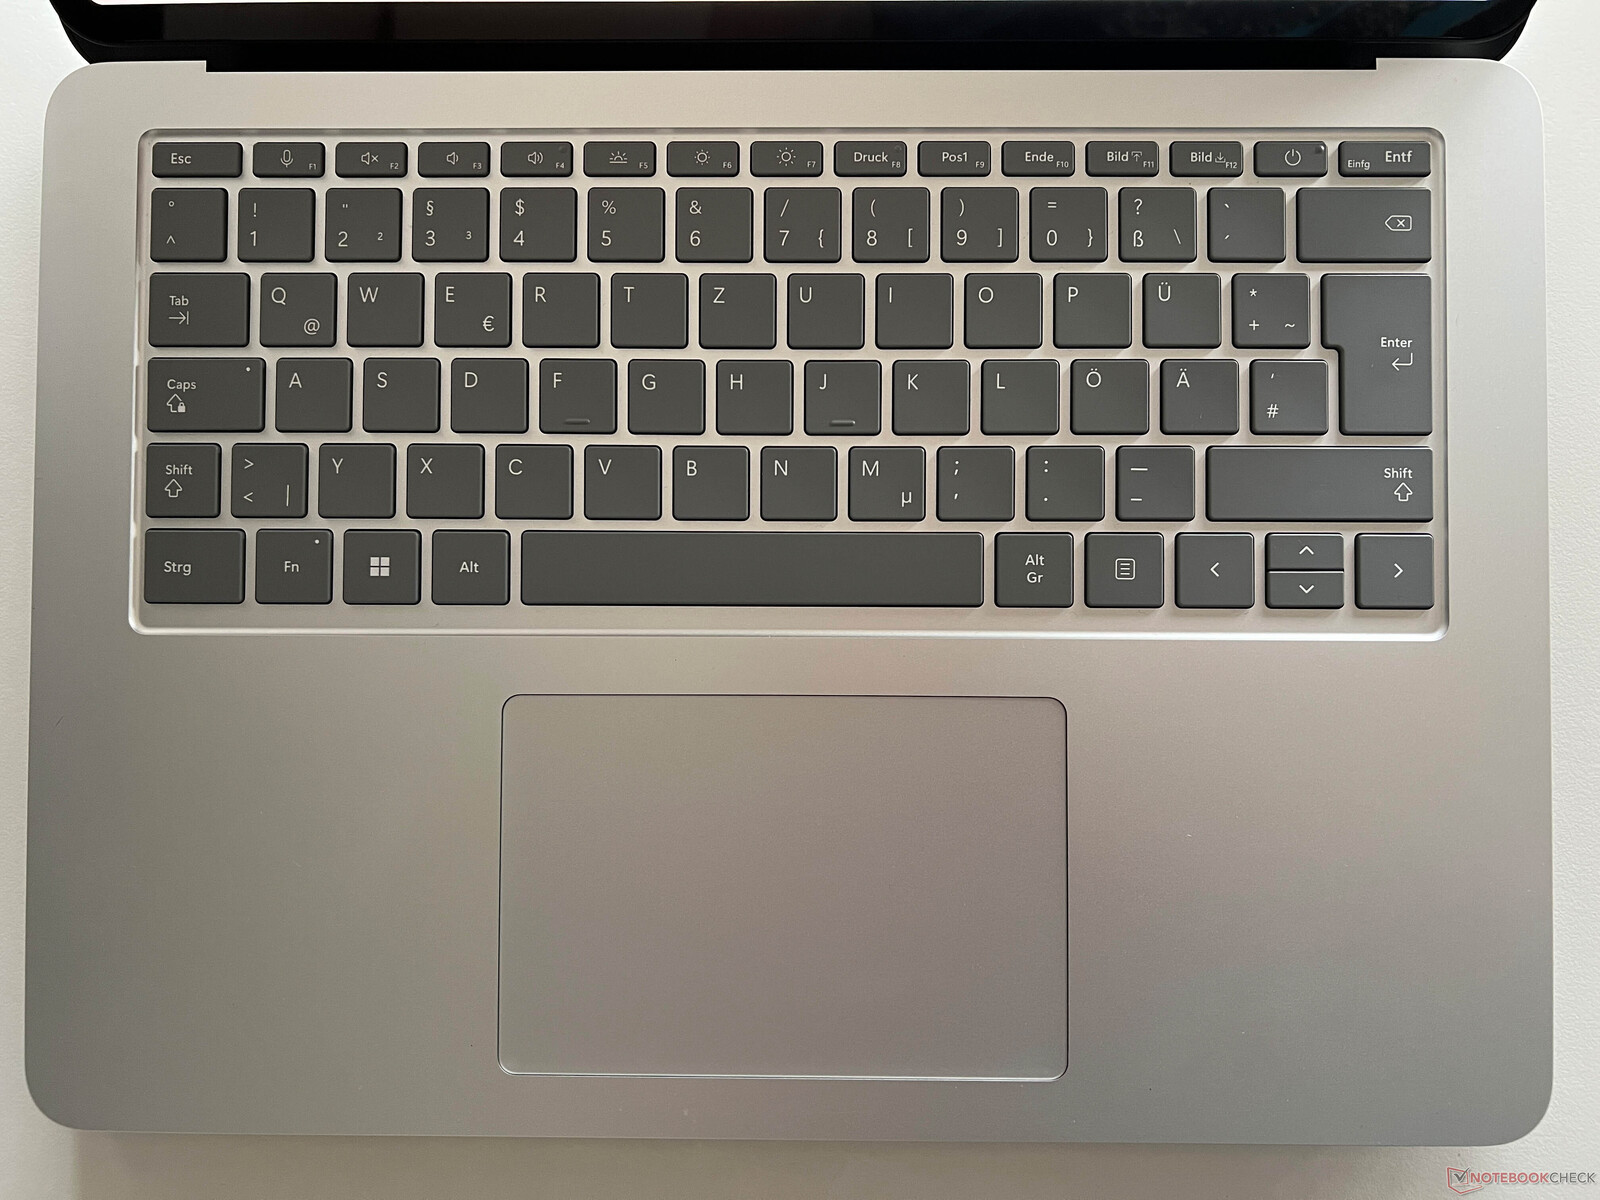
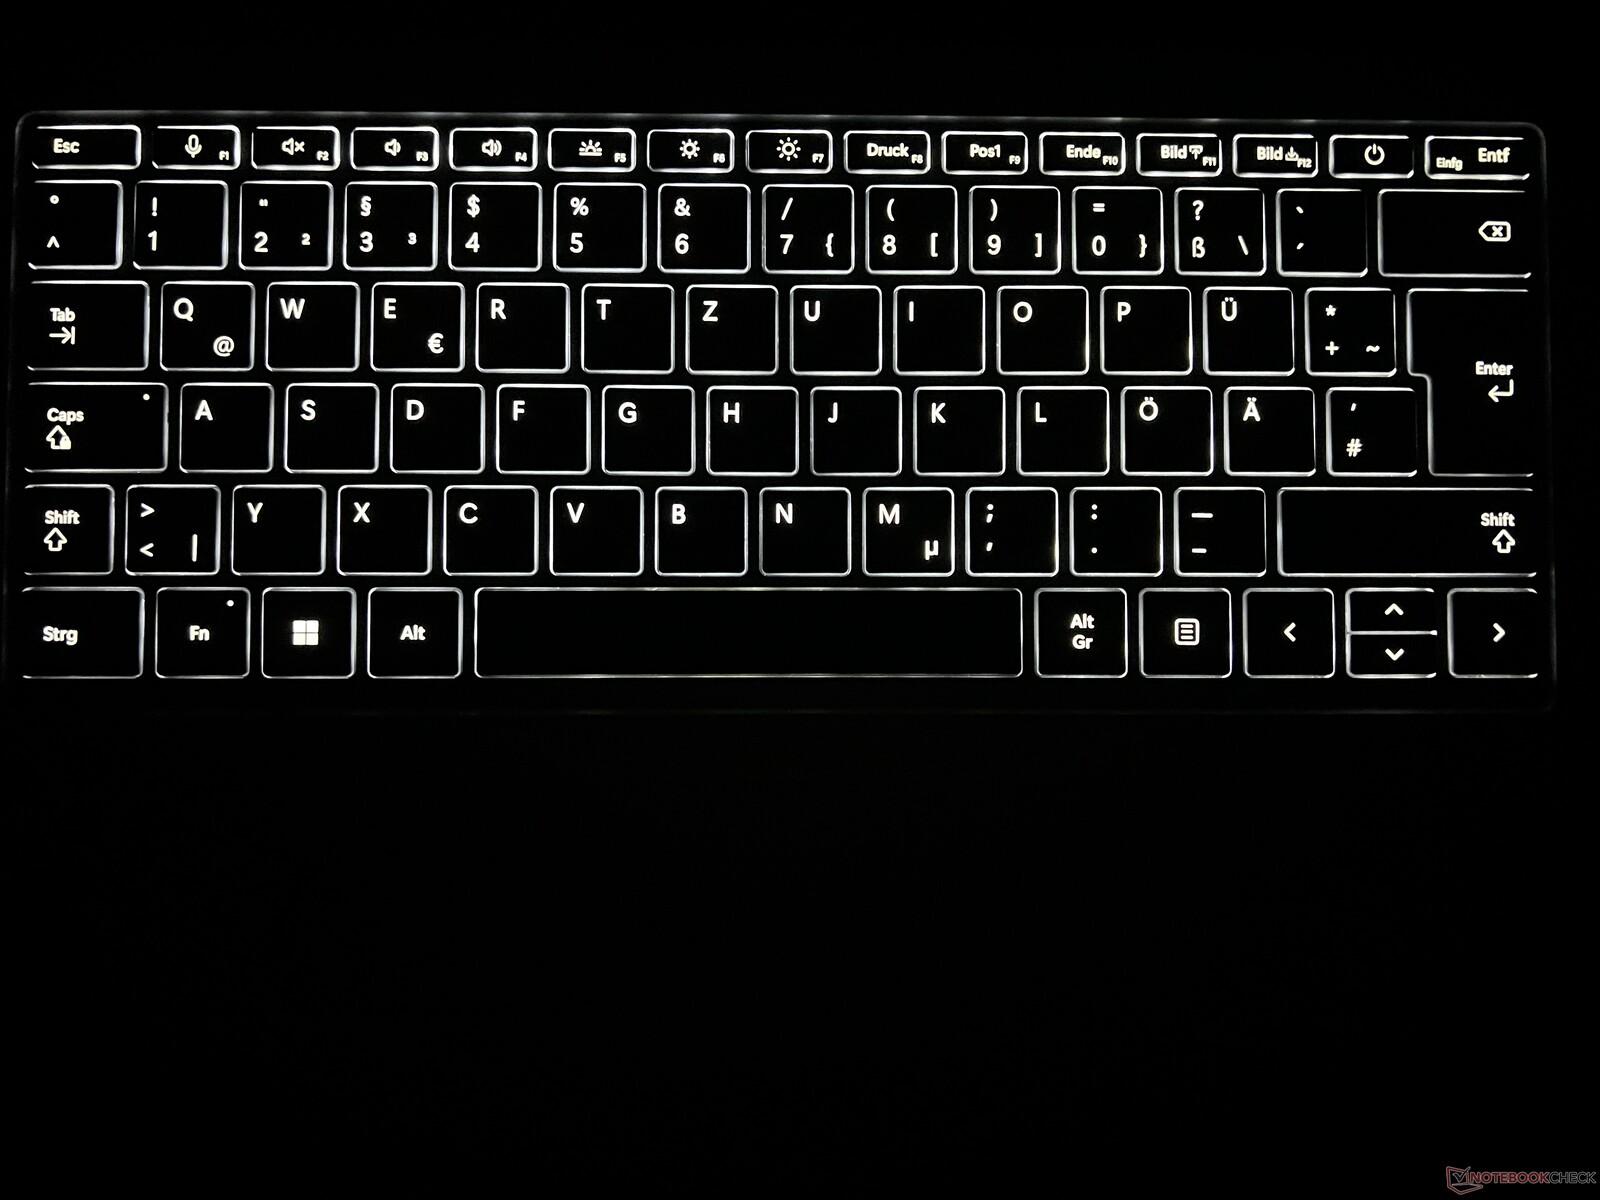
Inmatningsenheter - Surface Pen med haptisk återkoppling
Tangentbordet är oförändrat från den tidigare modellen. Tangenterna är mörkgrå och lättlästa och det finns även en bakgrundsbelysning i tre steg för mörkare miljöer, även om den inte kan slås på automatiskt via sensorn. Själva tangentbordet erbjuder en bekväm skrivupplevelse med tillräcklig rörelse, så längre texter är inga problem.
I likhet med Apples MacBooks använder Surface Laptop Studio 2 en så kallad Precision Haptic Touchpad, vilket innebär att det inte finns några rörliga delar. Istället ges feedback när du klickar genom vibrationer. Det innebär att klickupplevelsen alltid är identisk överallt på plattan, men du kan också avaktivera den haptiska återkopplingen om du föredrar det. Vi hade inga problem alls med paddan och de tillfälliga känslighetsproblem som vi upplevde med första generationens modell var inga problem här.
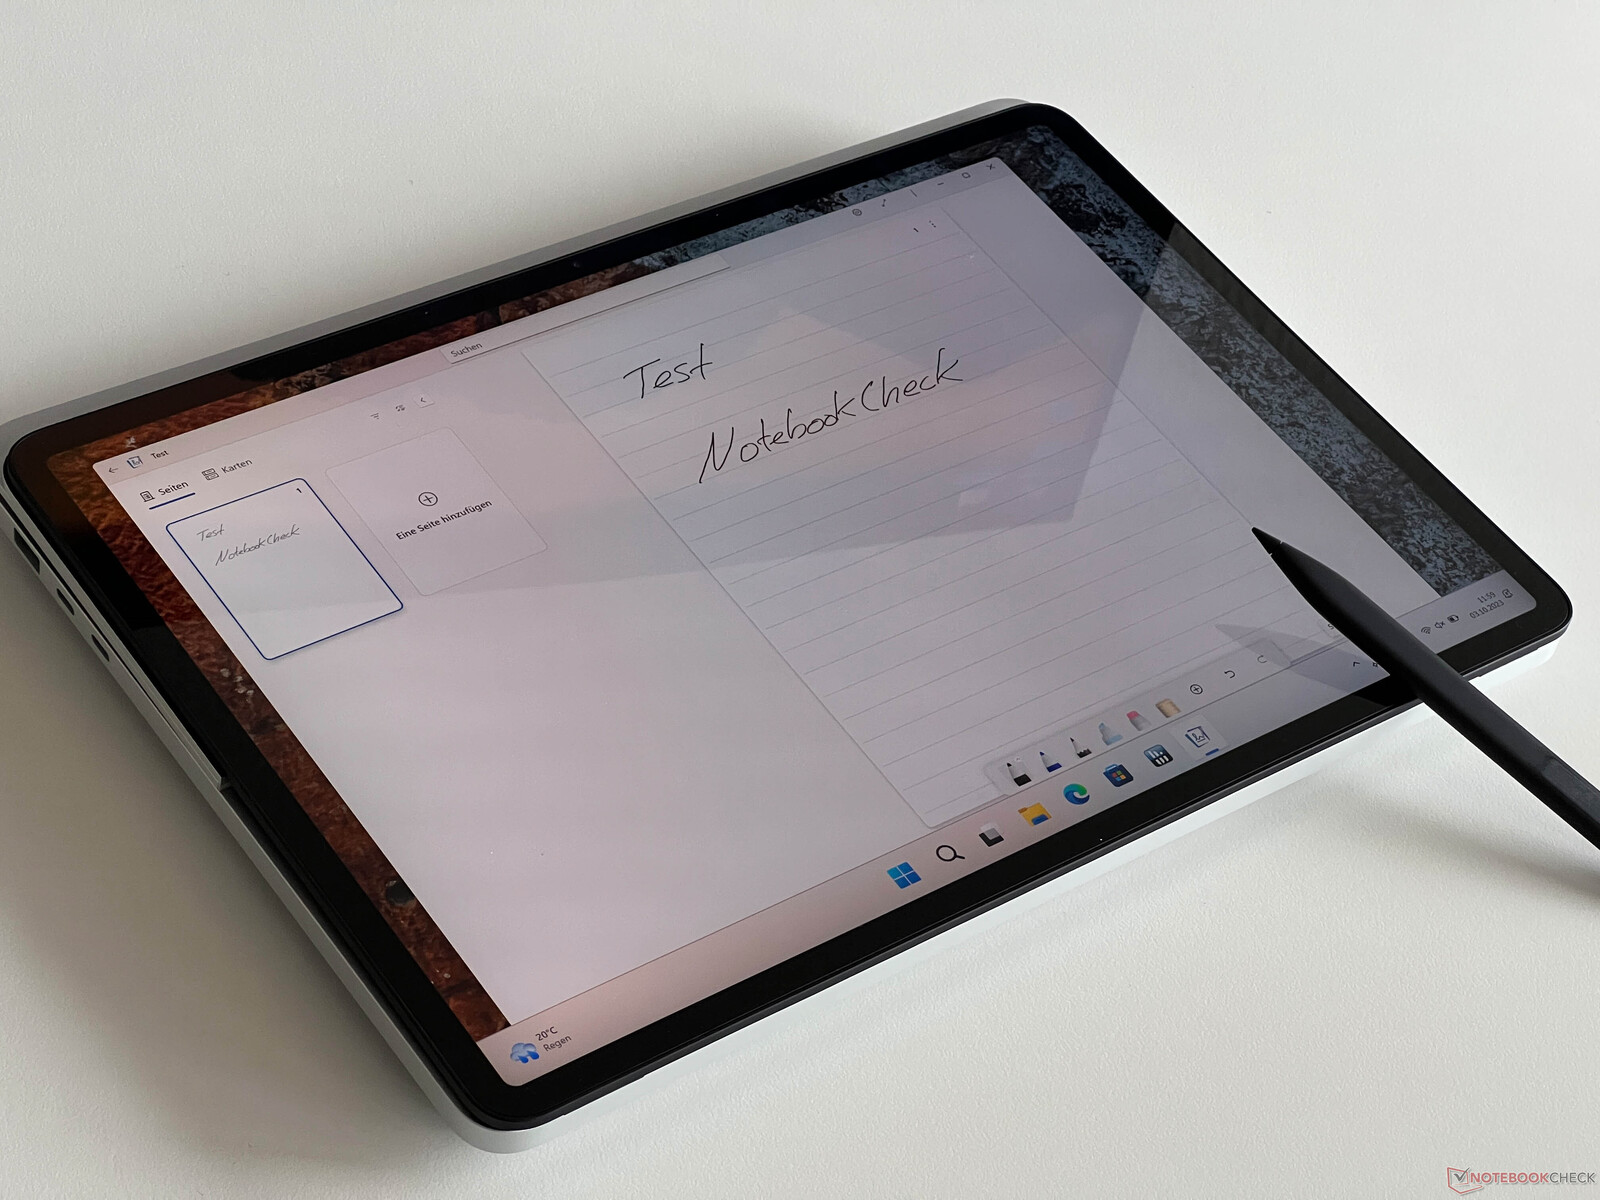
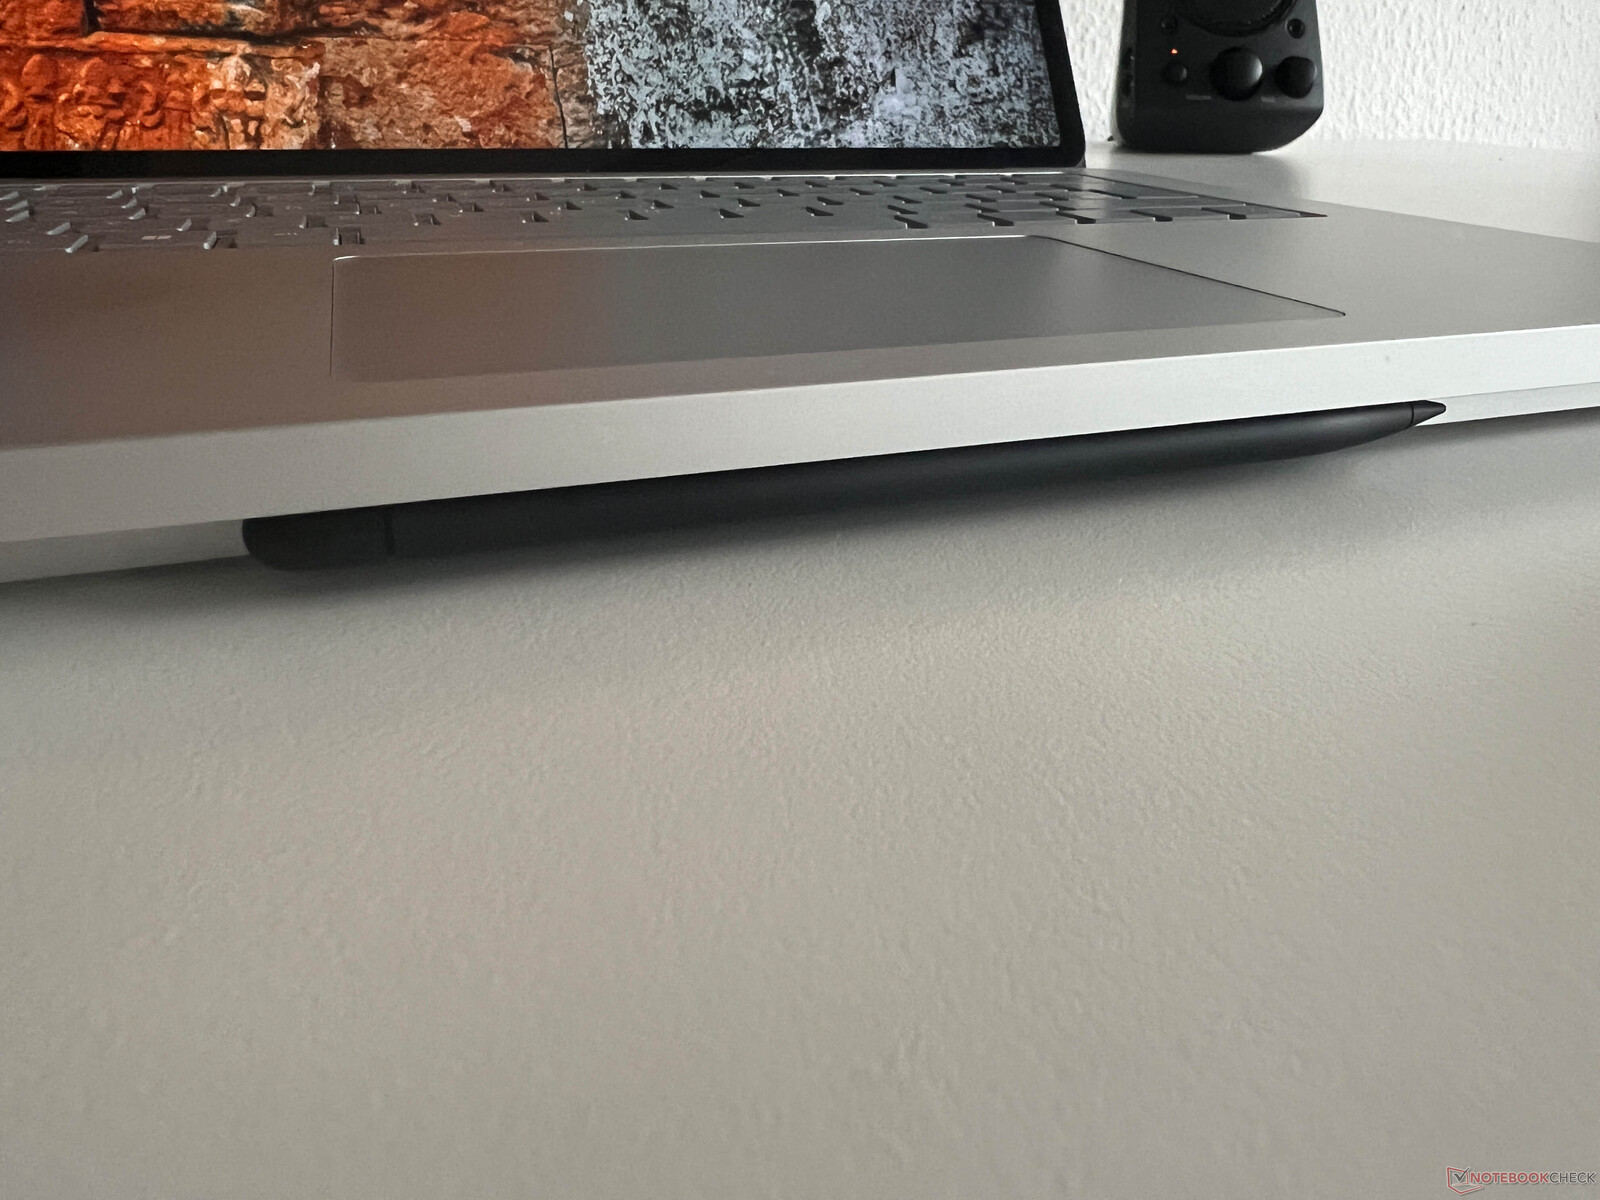
Den här gången hade vi även möjlighet att testa Slim Pen 2 (valfritt tillbehör för ~100 USD), som fästs magnetiskt på chassits framsida. Pennan stöder haptisk återkoppling i kompatibla appar (som Whiteboard eller Journal). Ju hårdare du trycker pennan mot pekskärmen, desto starkare blir vibrationerna och därmed det förnimbara motståndet. Om du bara låter pennan glida försiktigt över ytan får du däremot ingen haptisk återkoppling. På det hela taget fungerar inmatningen med pennan mycket bra och vi hade inga problem med felaktiga inmatningar, inte ens under mer omfattande anteckningar. Den kapacitiva pekskärmen fungerar också riktigt bra.
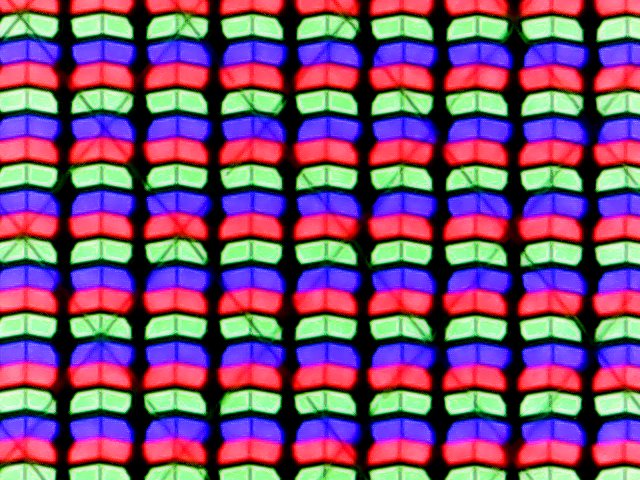
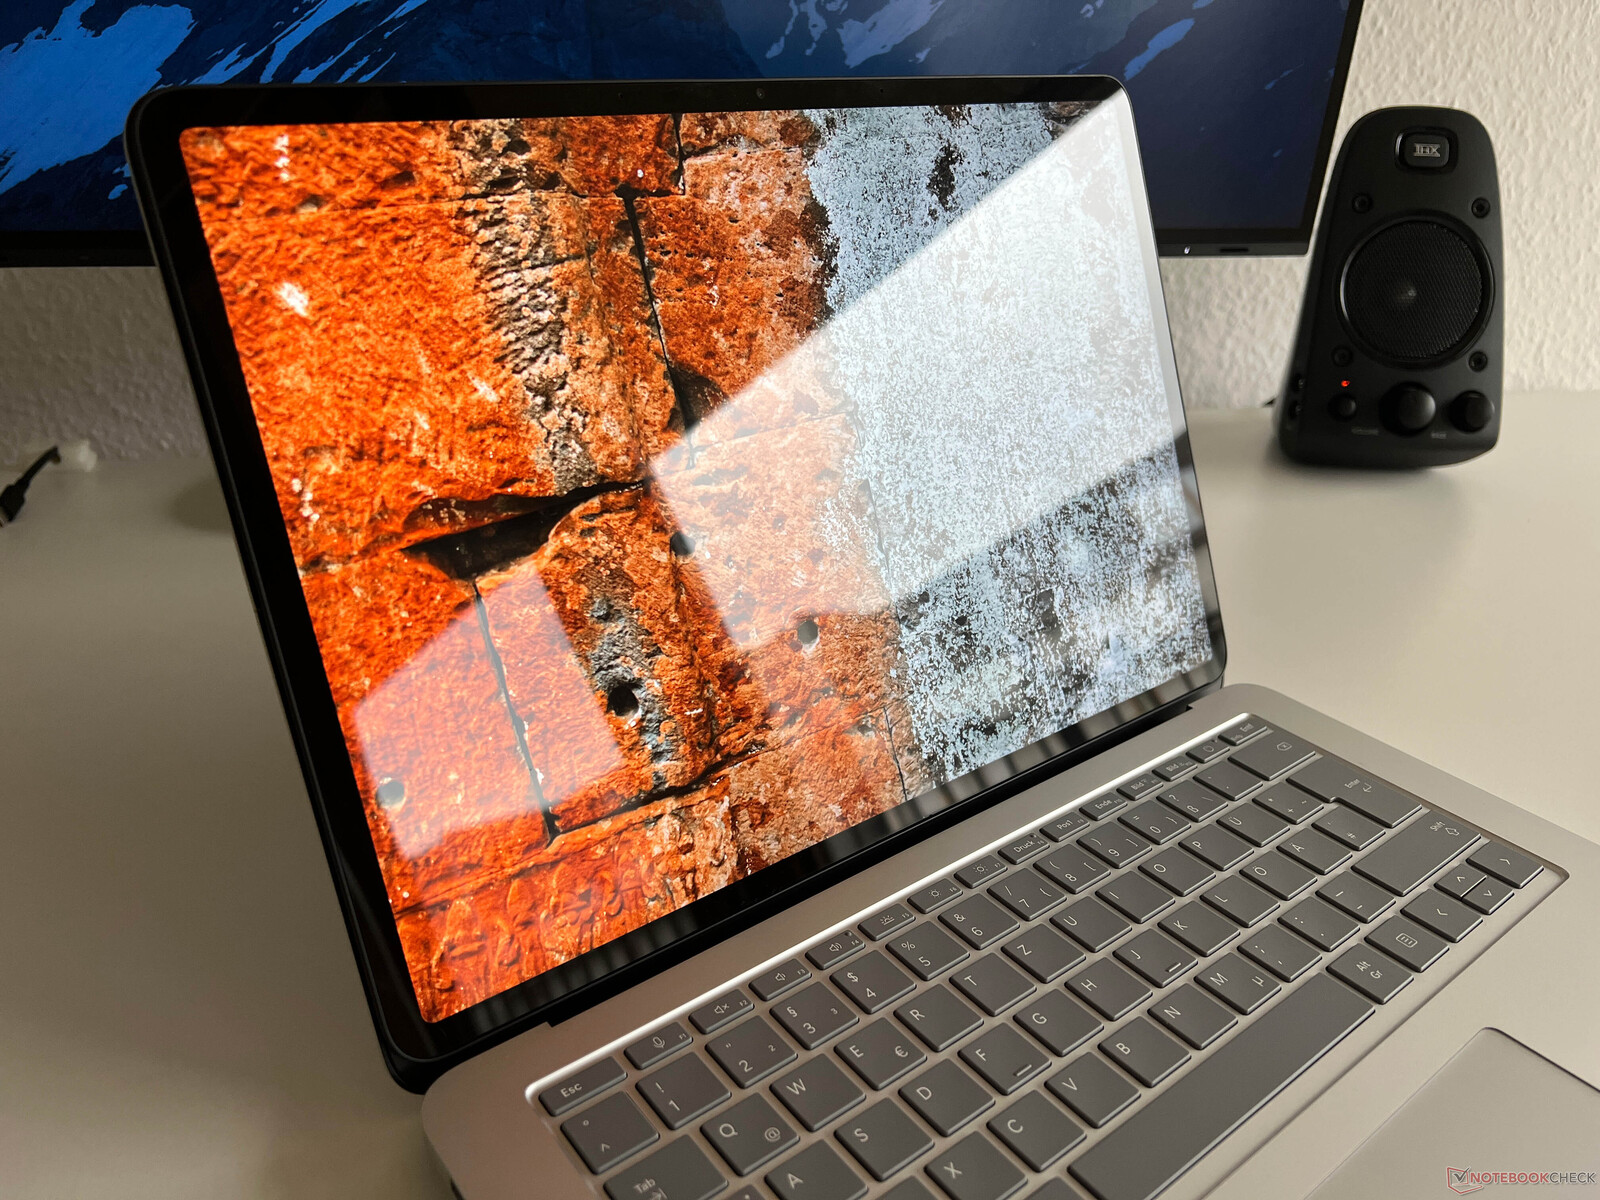
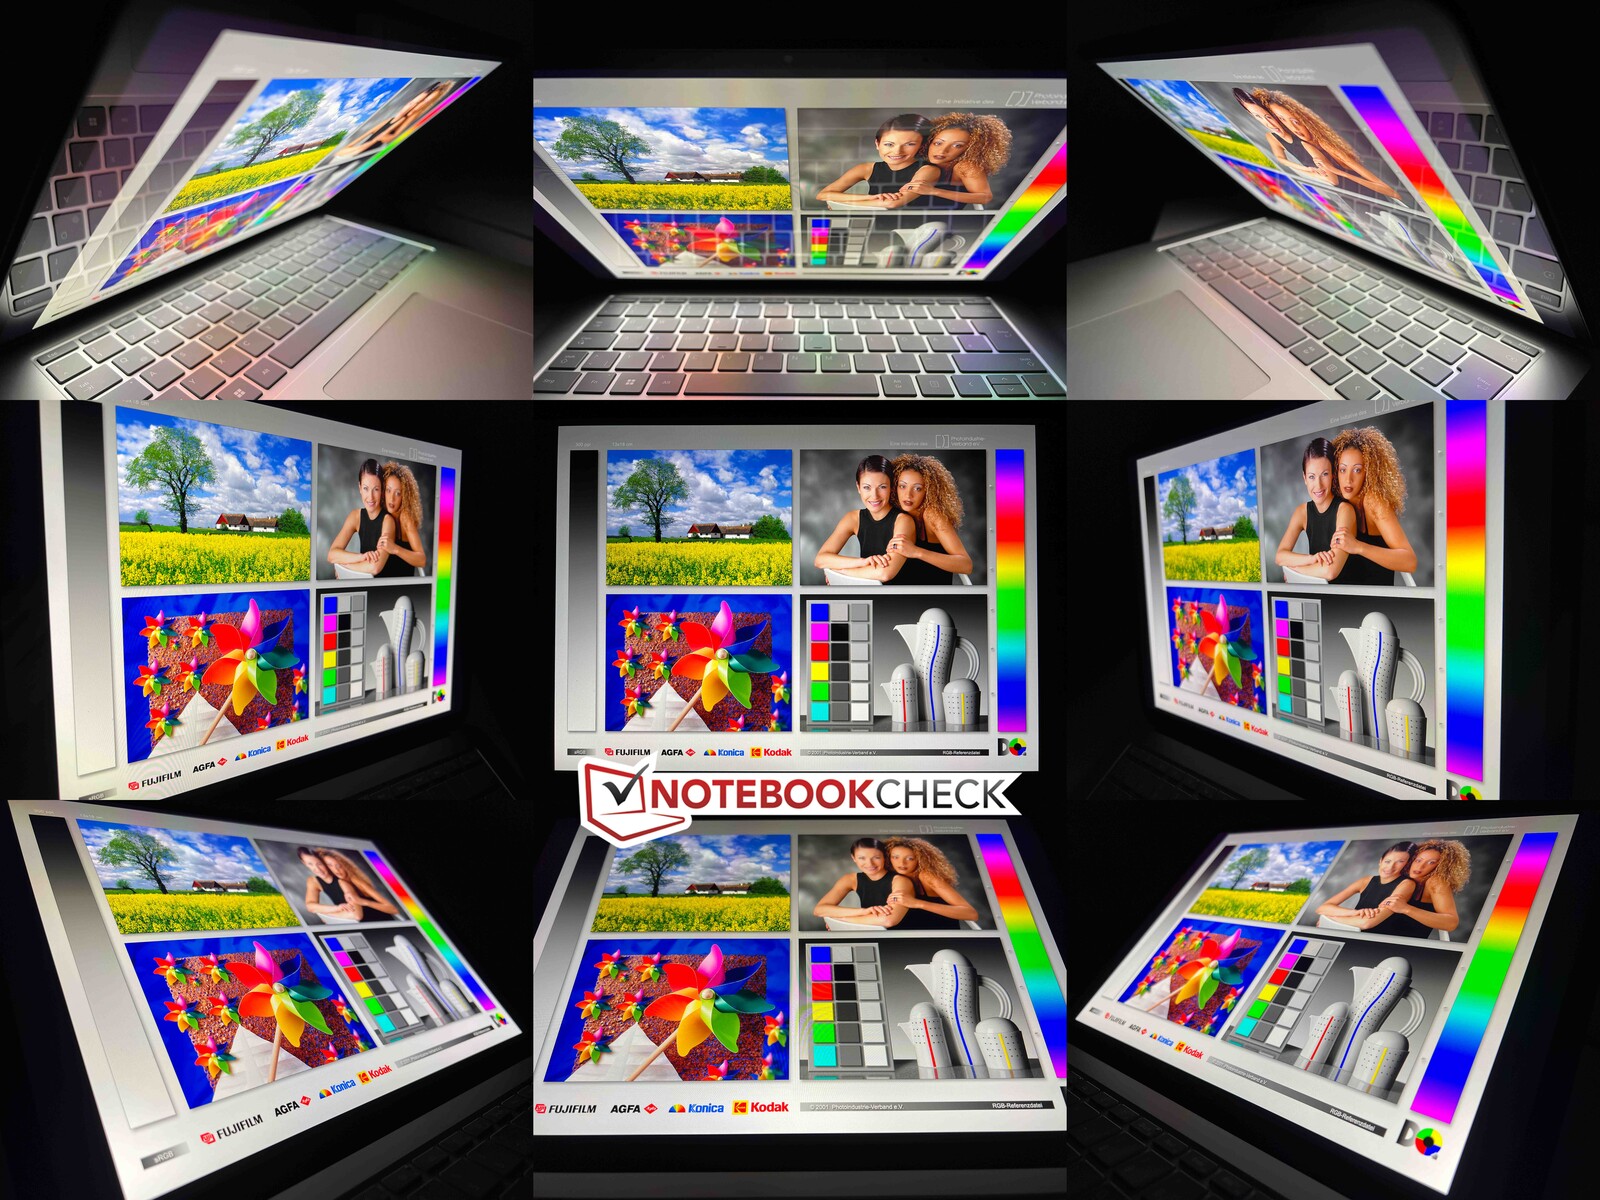
Display - 120 Hz och HDR, men endast sRGB
14,4-tumsskärmen har inte förändrats. Den har fortfarande en upplösning på 2400 x 1600 med ett bildförhållande på 3:2 samt en mycket glansig yta, vilket också kan vara ett problem inomhus. Den subjektiva bildkvaliteten är utmärkt med mycket skarpt innehåll och rika färger. Tack vare den högre frekvensen på 120 Hz är rörelserna mycket smidiga och det finns inga större problem med spökbilder, även om svarstiderna är ganska långsamma.
Microsoft annonserar en ljusstyrka på 500 nits för SDR-innehåll och våra egna mätningar bekräftar detta (upp till 529 nits & 503 nits i genomsnitt). Svartvärdet är ganska lågt på 0,26, vilket resulterar i ett utmärkt maximalt kontrastförhållande på nästan 2000:1.
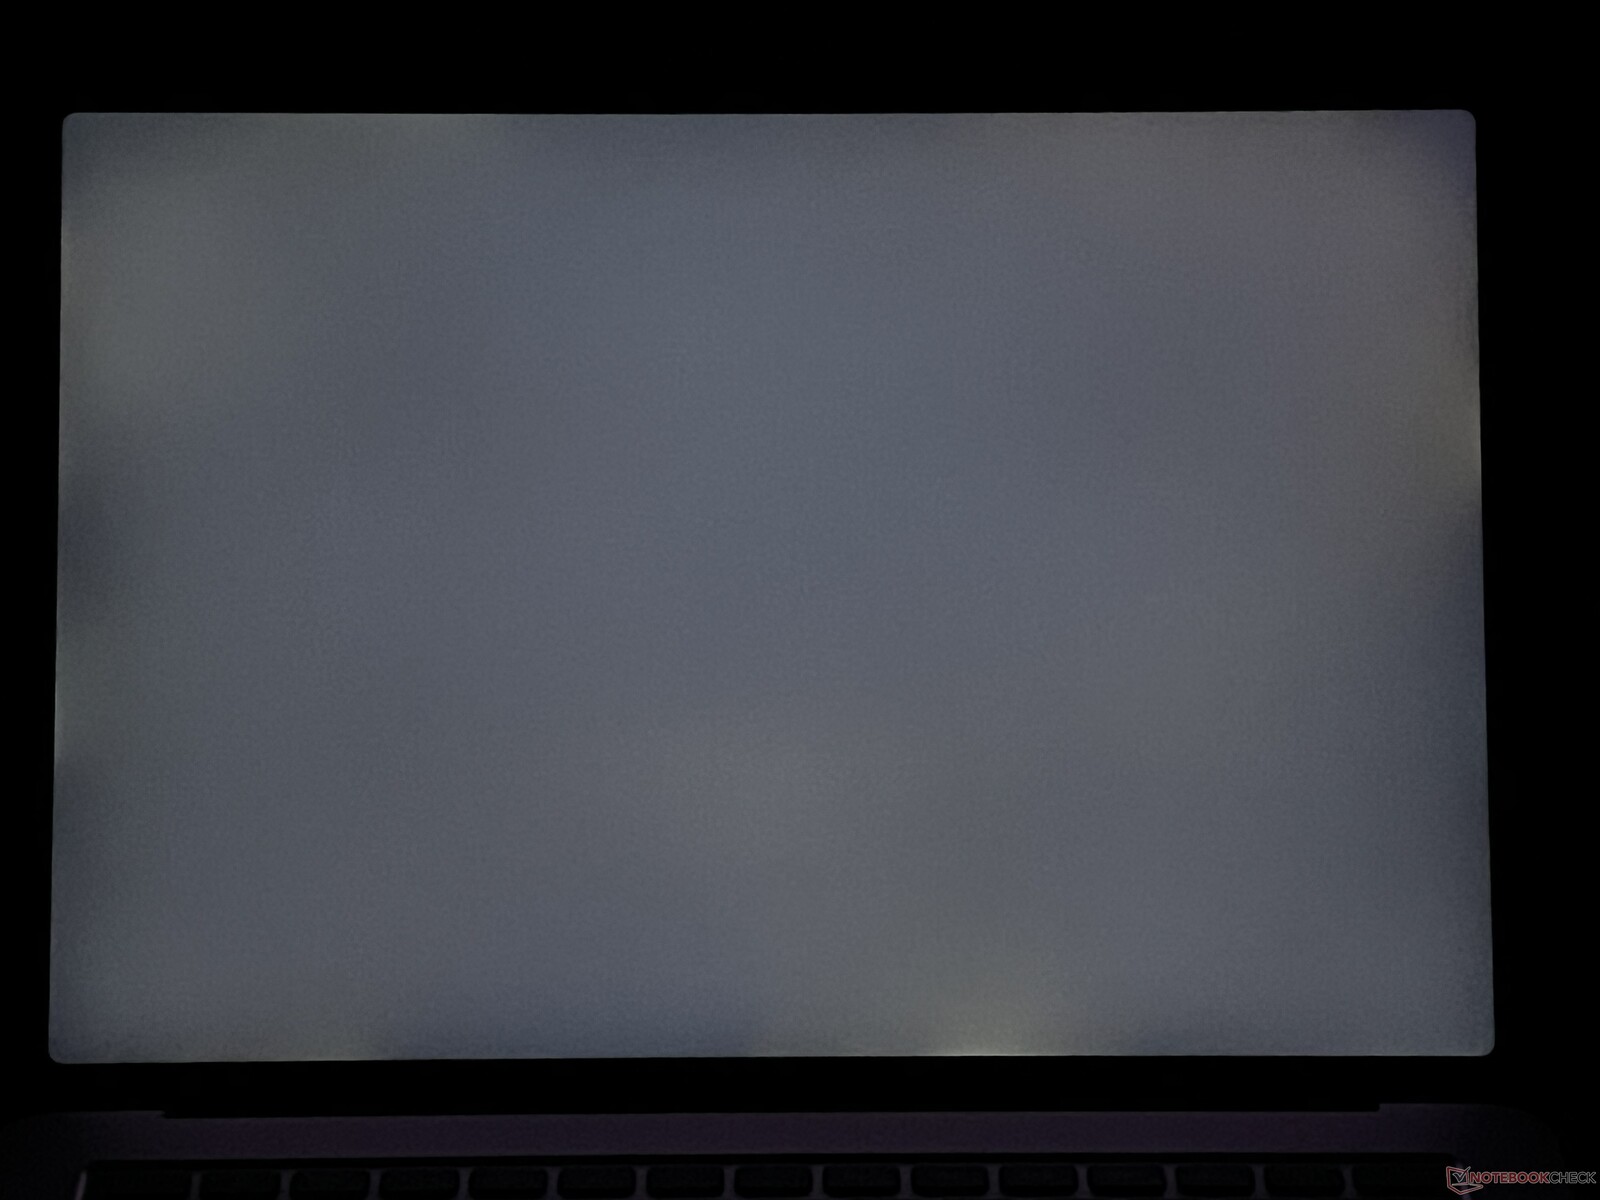
Den maximala ljusstyrkan i HDR-läge är 650 nits och detta beteende är vanligt för OLED- och Mini-LED-paneler, men det är ganska ovanligt för IPS-skärmar. Vi mätte upp till 647 nits och kan bekräfta påståendet. Endast Mini-LED-skärmen påApple MacBook Pro 14(upp till 1600 nits) har en betydande fördel i detta avseende. HDR-implementeringen i Windows är fortfarande ett problem eftersom den måste aktiveras manuellt (vilket resulterar i en svart skärm i en sekund) och färghantering fungerar inte heller ordentligt. ApplehDR-implementeringen i macOS är helt enkelt överlägsen.
| |||||||||||||||||||||||||
Distribution av ljusstyrkan: 89 %
Mitt på batteriet: 501 cd/m²
Kontrast: 1965:1 (Svärta: 0.26 cd/m²)
ΔE ColorChecker Calman: 0.5 | ∀{0.5-29.43 Ø4.71}
ΔE Greyscale Calman: 0.8 | ∀{0.09-98 Ø4.96}
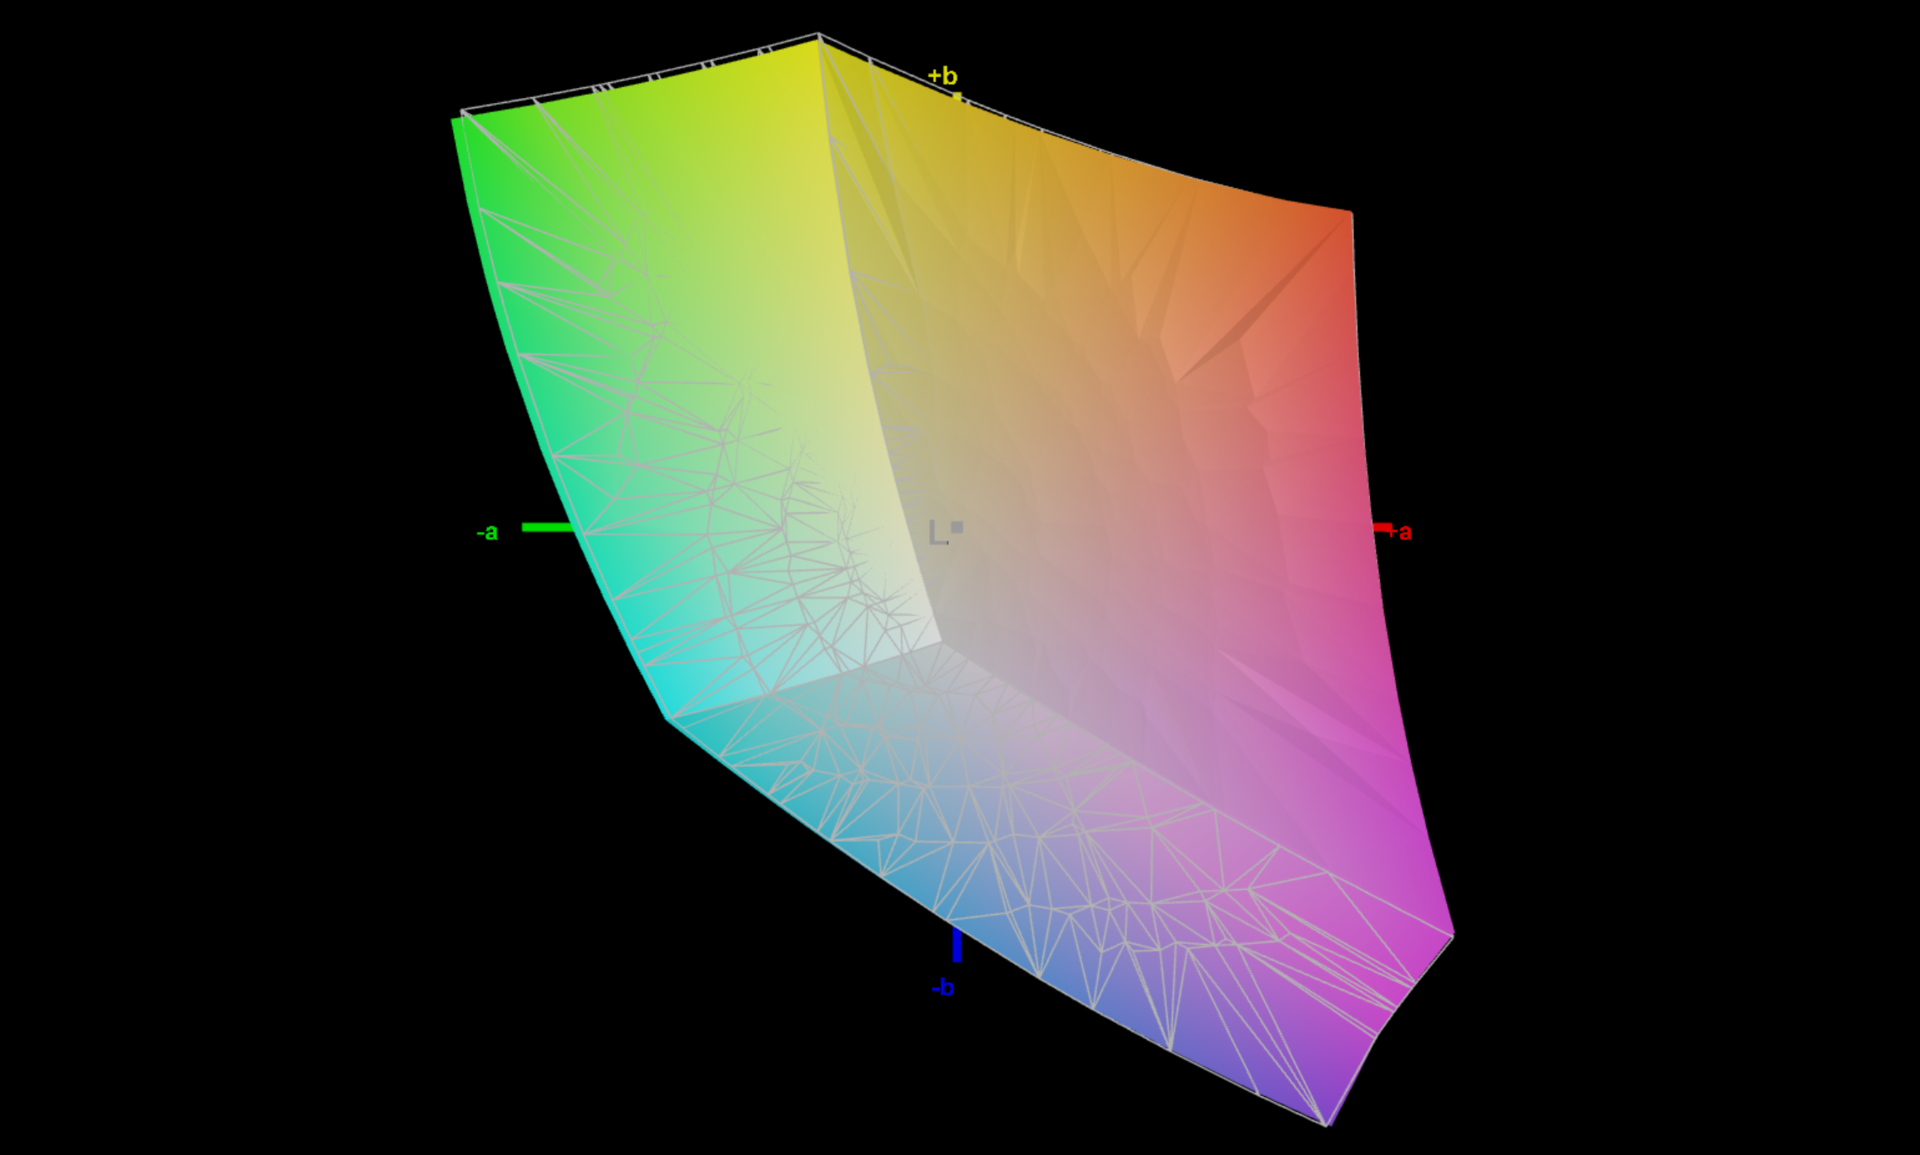
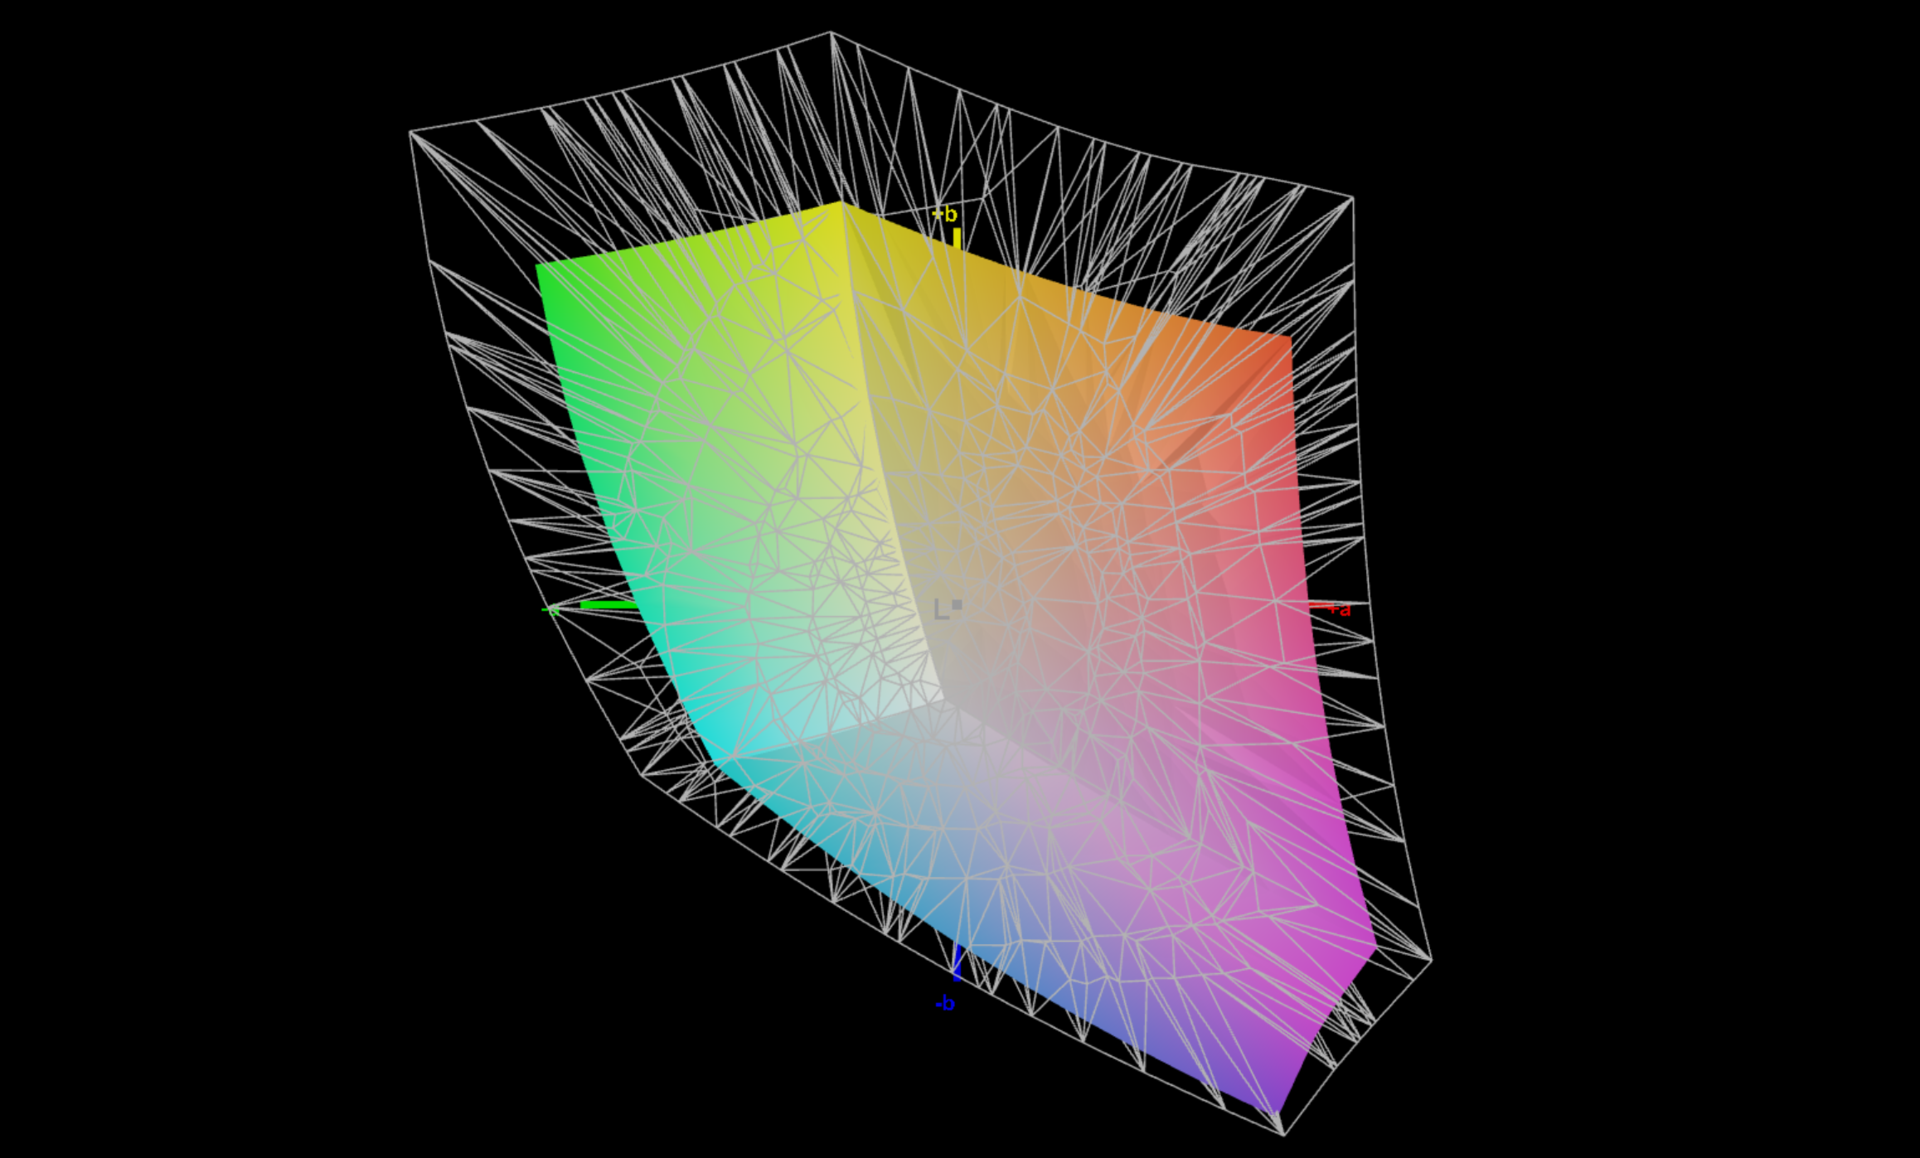
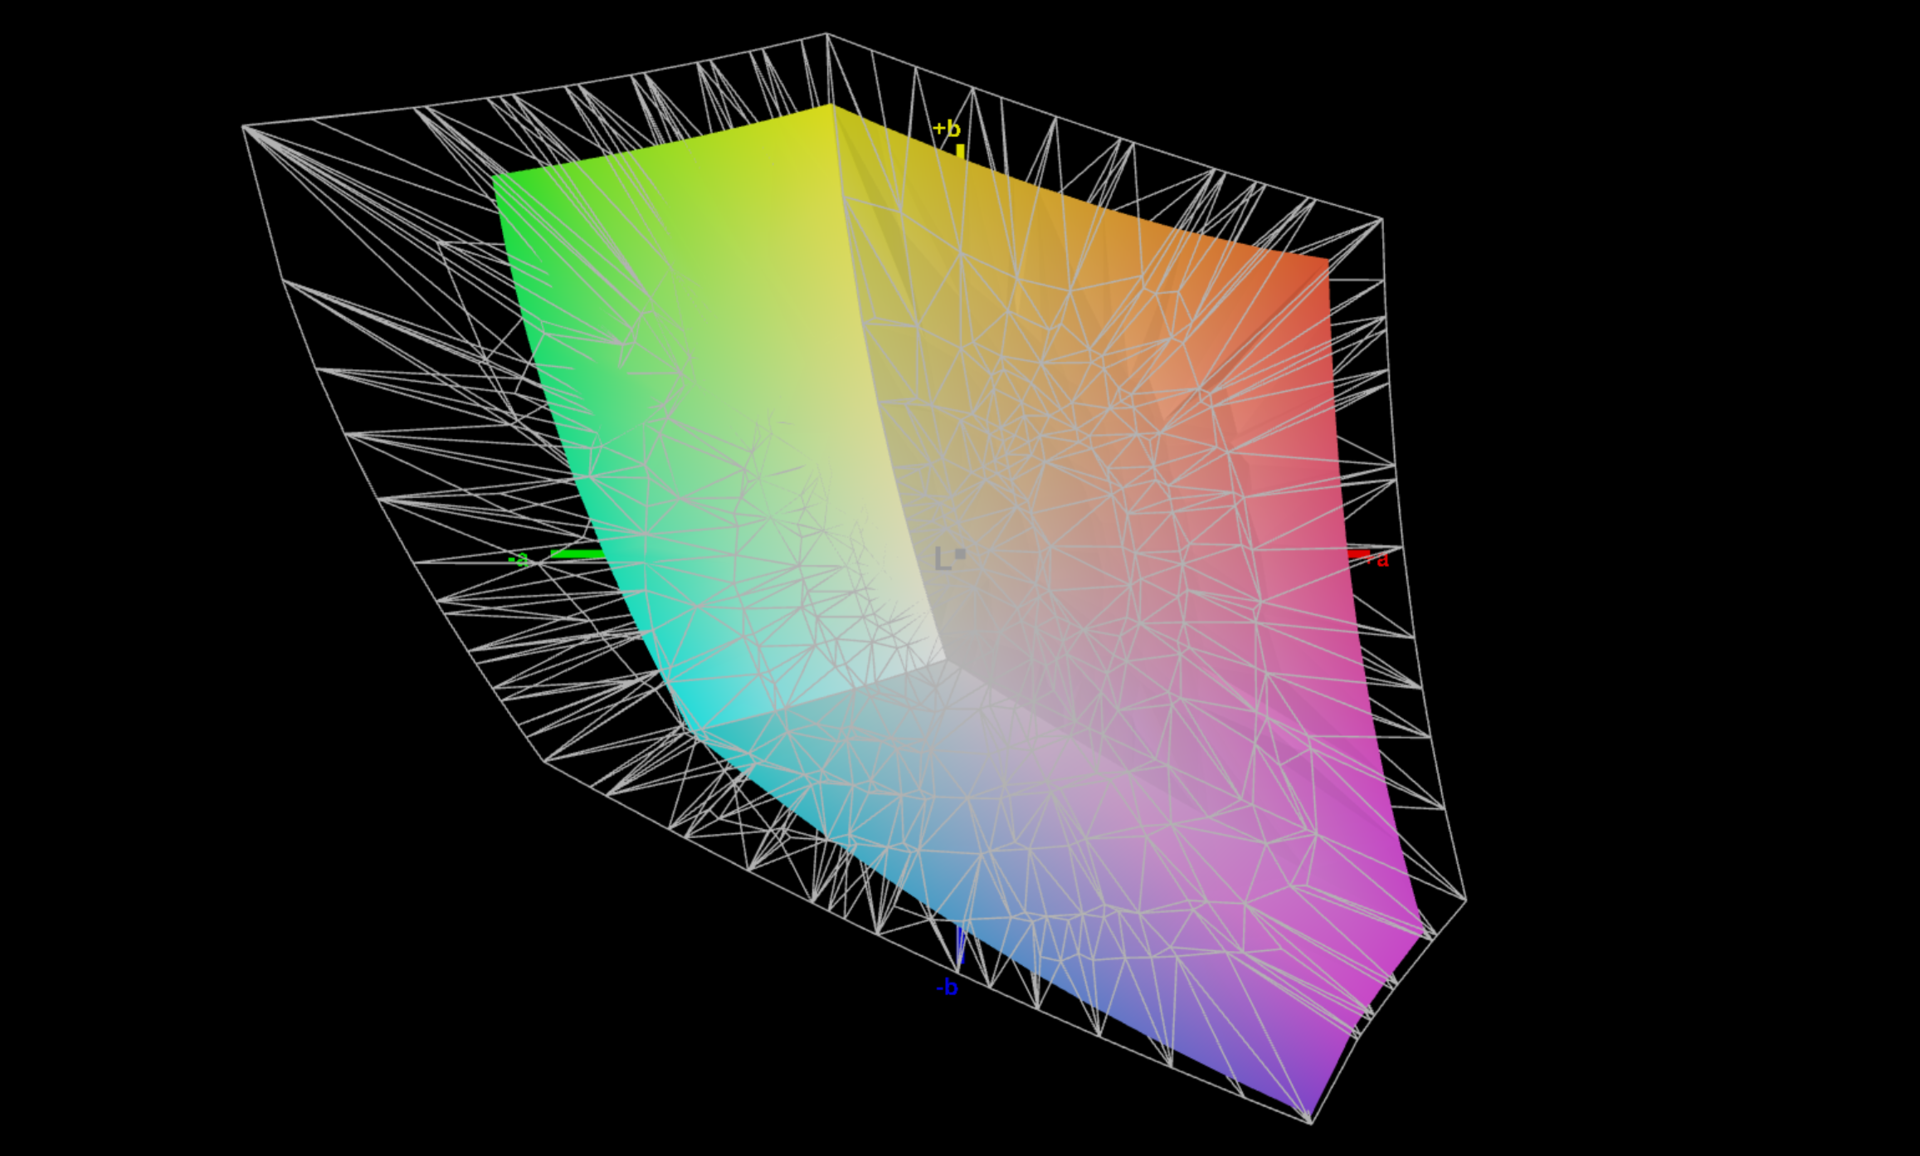
68.9% AdobeRGB 1998 (Argyll 3D)
99% sRGB (Argyll 3D)
66.7% Display P3 (Argyll 3D)
Gamma: 2.19
CCT: 6650 K
| Microsoft Surface Laptop Studio 2 RTX 4060 LQ144P1JX01, IPS, 2400x1600, 14.4" | Apple MacBook Pro 14 2023 M2 Pro Mini-LED, 3024x1964, 14.2" | Lenovo Yoga Pro 9-14IRP G8 CSOT T3 MNE507HZ2-1, Mini-LED, 3072x1920, 14.5" | Asus Zenbook Pro 14 OLED UX6404VI SDC4190, OLED, 2880x1800, 14.5" | Asus ZenBook Pro 14 Duo UX8402VV-P1021W ATNA45AF04-0 , OLED, 2880x1800, 14.5" | Asus ROG Zephyrus G14 GA402XY B140QAN06.S, Mini-LED, 2560x1600, 14" | Lenovo Legion Slim 5 14APH8 Samsung SDC ATNA45AF02-2, OLED, 2880x1600, 14.5" | Microsoft Surface Laptop Studio i7 RTX 3050 Ti LQ144P1JX01, IPS, 2400x1600, 14.4" | |
|---|---|---|---|---|---|---|---|---|
| Display | 49% | 27% | 31% | 30% | 29% | 30% | 12% | |
| Display P3 Coverage (%) | 66.7 | 99.2 49% | 92 38% | 99.6 49% | 99.91 50% | 99.6 49% | 99.9 50% | 80.6 21% |
| sRGB Coverage (%) | 99 | 99.7 1% | 100 1% | 100 1% | 100 1% | 100 1% | 99.9 1% | |
| AdobeRGB 1998 Coverage (%) | 68.9 | 96.9 41% | 97.5 42% | 95.35 38% | 93.4 36% | 96.5 40% | 78.5 14% | |
| Response Times | 39% | 76% | 98% | 96% | 75% | 98% | 28% | |
| Response Time Grey 50% / Grey 80% * (ms) | 77.6 ? | 35.2 ? 55% | 12.7 ? 84% | 0.67 ? 99% | 2 ? 97% | 17.2 ? 78% | 0.79 ? 99% | 58.4 ? 25% |
| Response Time Black / White * (ms) | 34.3 ? | 26.4 ? 23% | 11.4 ? 67% | 0.9 ? 97% | 2 ? 94% | 9.9 ? 71% | 1.01 ? 97% | 24 ? 30% |
| PWM Frequency (Hz) | 17600 ? | 14880 ? | 6000 ? | 240 | 240 | 5430 | 240.5 ? | 5000 ? |
| Screen | 110% | -169% | -28% | 1014% | -60% | -228% | -57% | |
| Brightness middle (cd/m²) | 511 | 500 -2% | 670 31% | 356 -30% | 340 -33% | 535 5% | 377.5 -26% | 497 -3% |
| Brightness (cd/m²) | 503 | 489 -3% | 680 35% | 358 -29% | 340 -32% | 563 12% | 381 -24% | 491 -2% |
| Brightness Distribution (%) | 89 | 94 6% | 89 0% | 99 11% | 99 11% | 91 2% | 97 9% | 92 3% |
| Black Level * (cd/m²) | 0.26 | 0.02 92% | 0.19 27% | 0.002 99% | 0.29 -12% | |||
| Contrast (:1) | 1965 | 25000 1172% | 3526 79% | 170000 8551% | 1714 -13% | |||
| Colorchecker dE 2000 * | 0.5 | 1.2 -140% | 4 -700% | 0.8 -60% | 1.76 -252% | 1 -100% | 4.19 -738% | 1.2 -140% |
| Colorchecker dE 2000 max. * | 1.1 | 2.6 -136% | 4.5 -309% | 1.6 -45% | 3.2 -191% | 2.8 -155% | 7.02 -538% | 2.8 -155% |
| Greyscale dE 2000 * | 0.8 | 1.7 -113% | 4.9 -513% | 0.9 -13% | 1.16 -45% | 1.8 -125% | 1.2 -50% | 1.9 -137% |
| Gamma | 2.19 100% | 2.24 98% | 2.22 99% | 2.19 100% | 2.43 91% | 2.24 98% | 2.22 99% | 2.14 103% |
| CCT | 6650 98% | 6791 96% | 5735 113% | 6590 99% | 6418 101% | 6337 103% | 6296 103% | 6821 95% |
| Colorchecker dE 2000 calibrated * | 1.3 | 1.62 | 0.81 | 0.8 | ||||
| Totalt genomsnitt (program/inställningar) | 66% /
91% | -22% /
-86% | 34% /
11% | 380% /
645% | 15% /
-11% | -33% /
-98% | -6% /
-28% |
* ... mindre är bättre
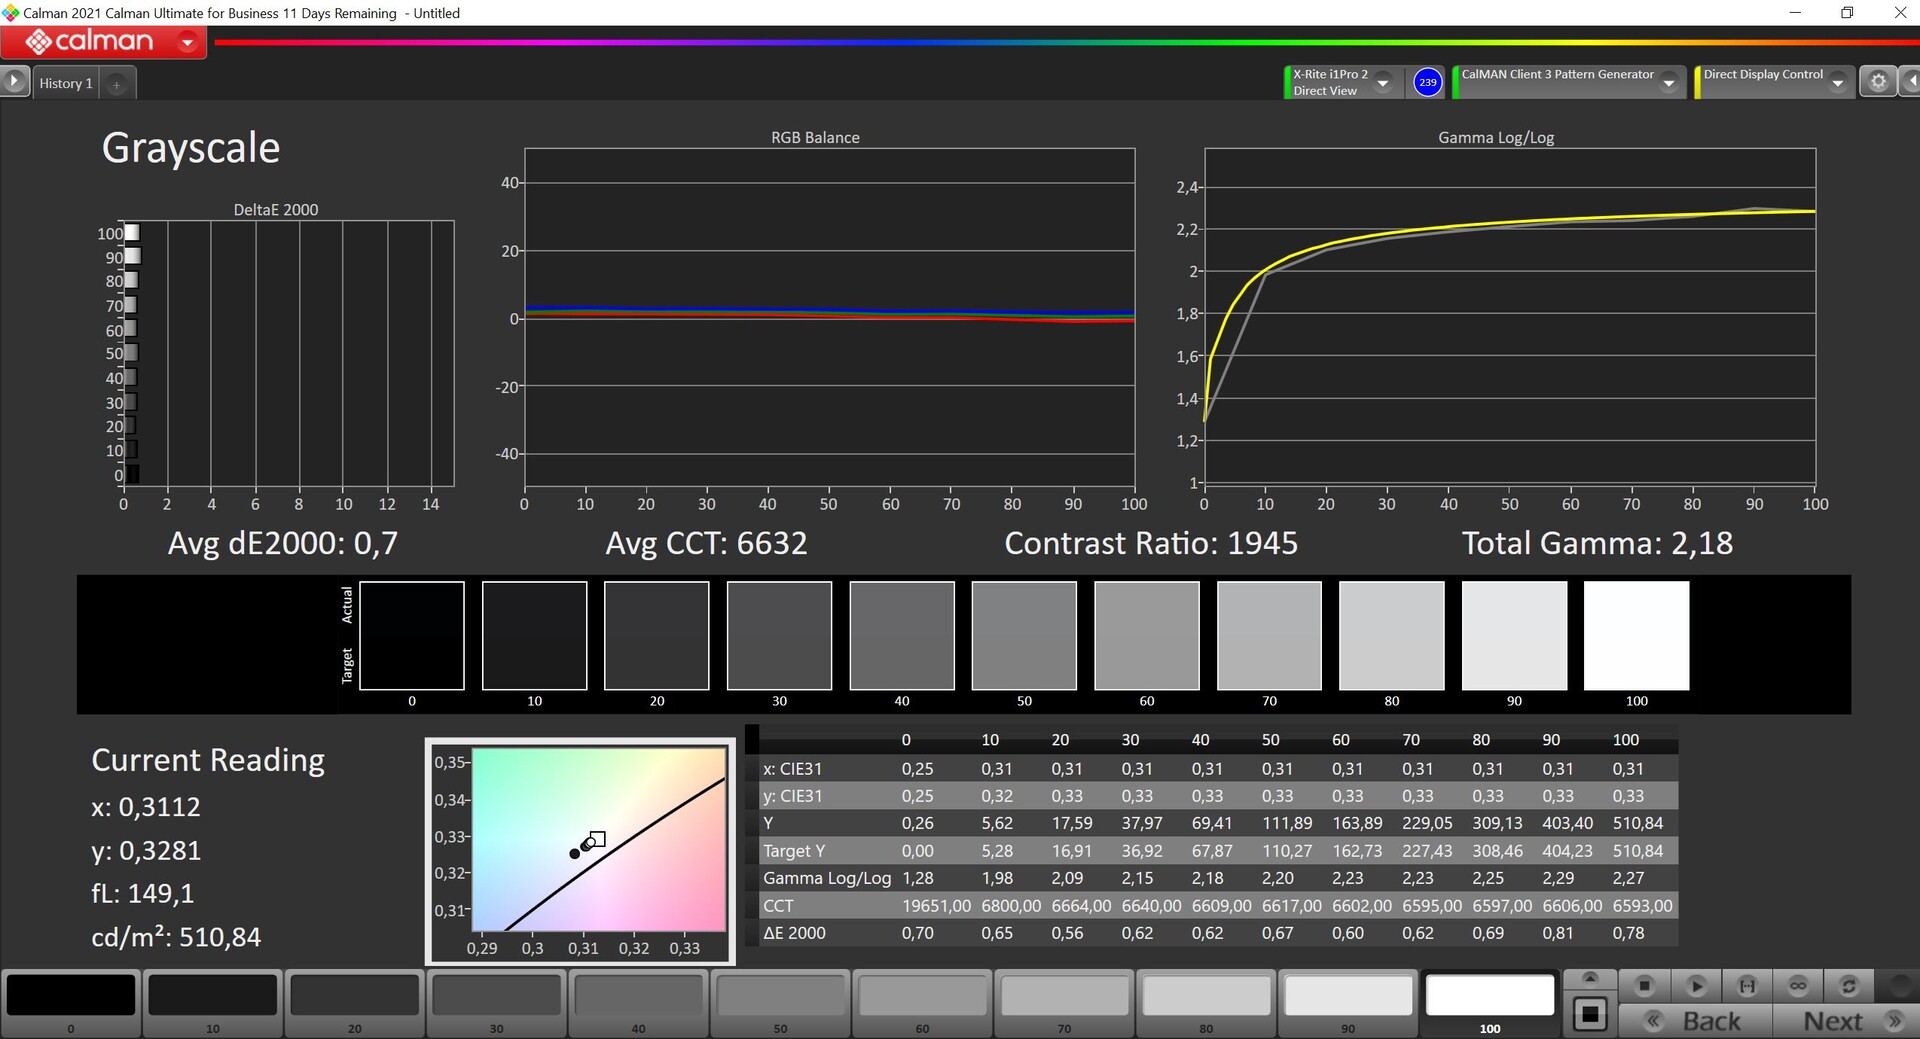
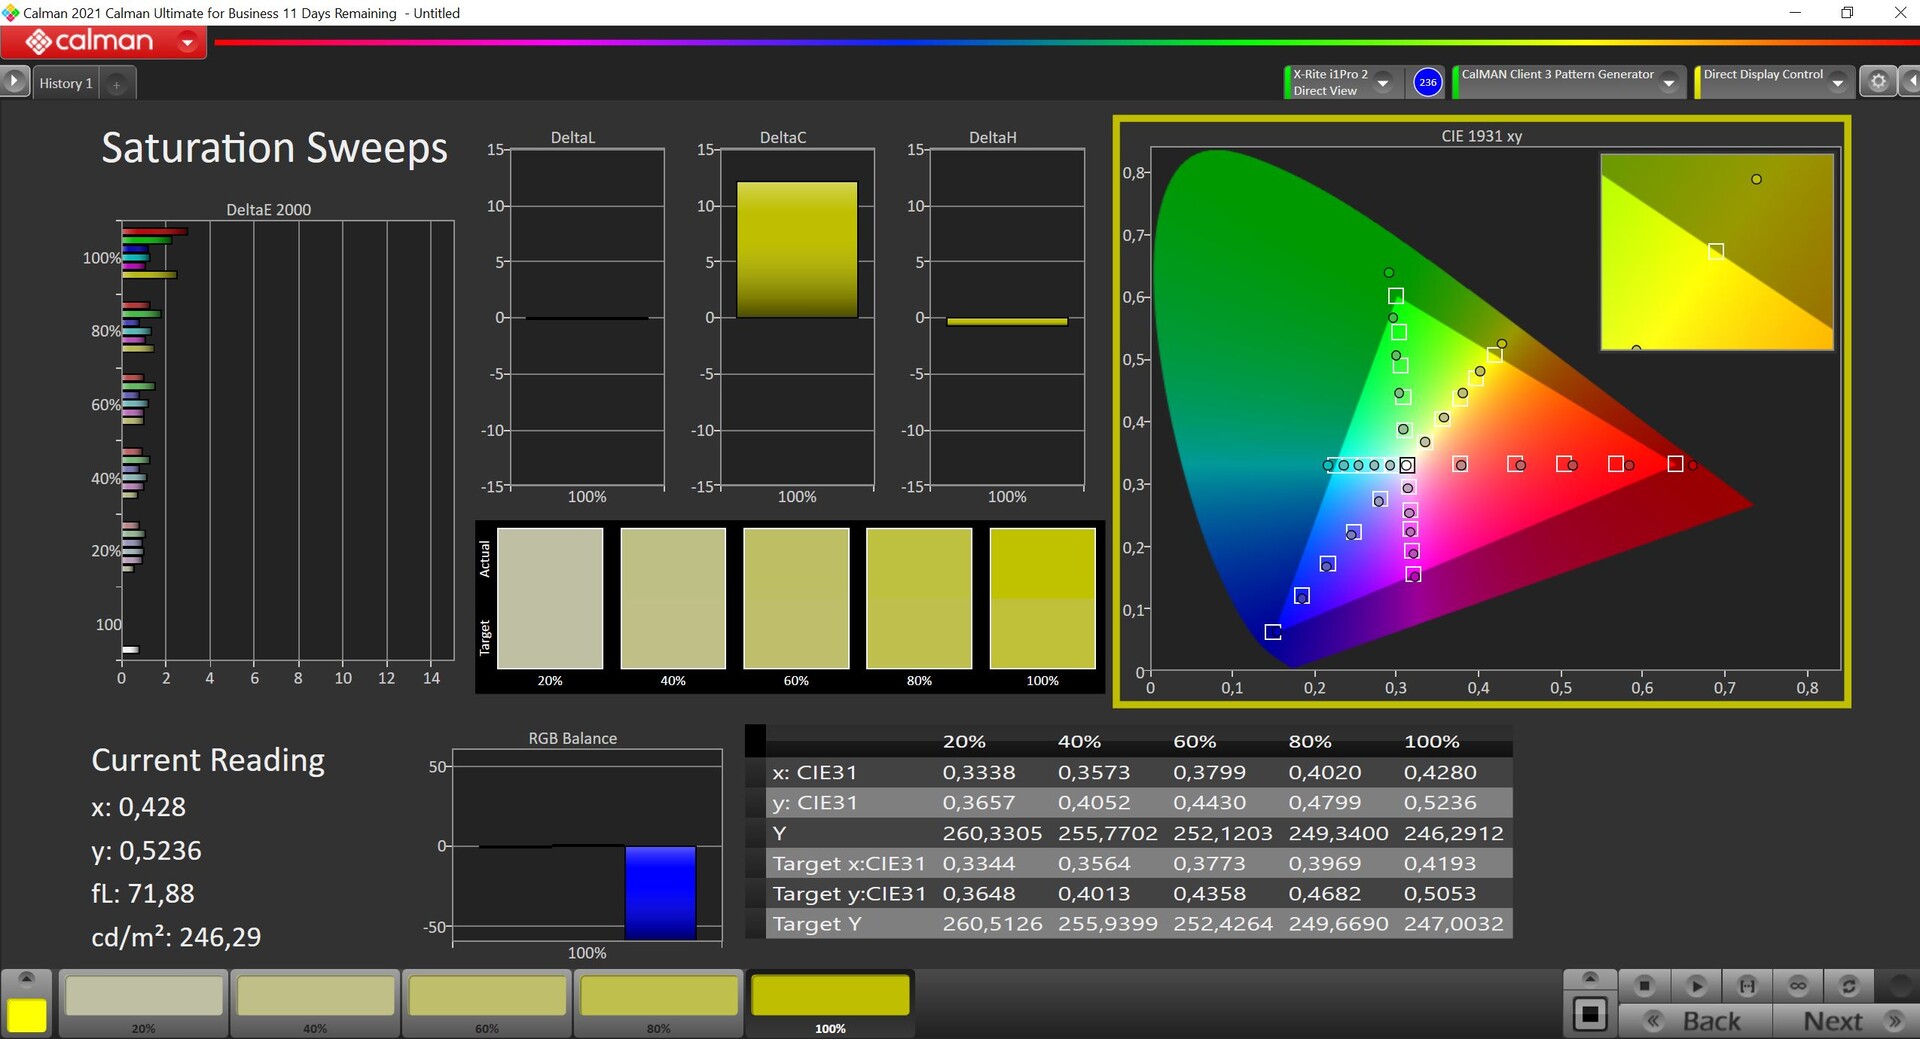
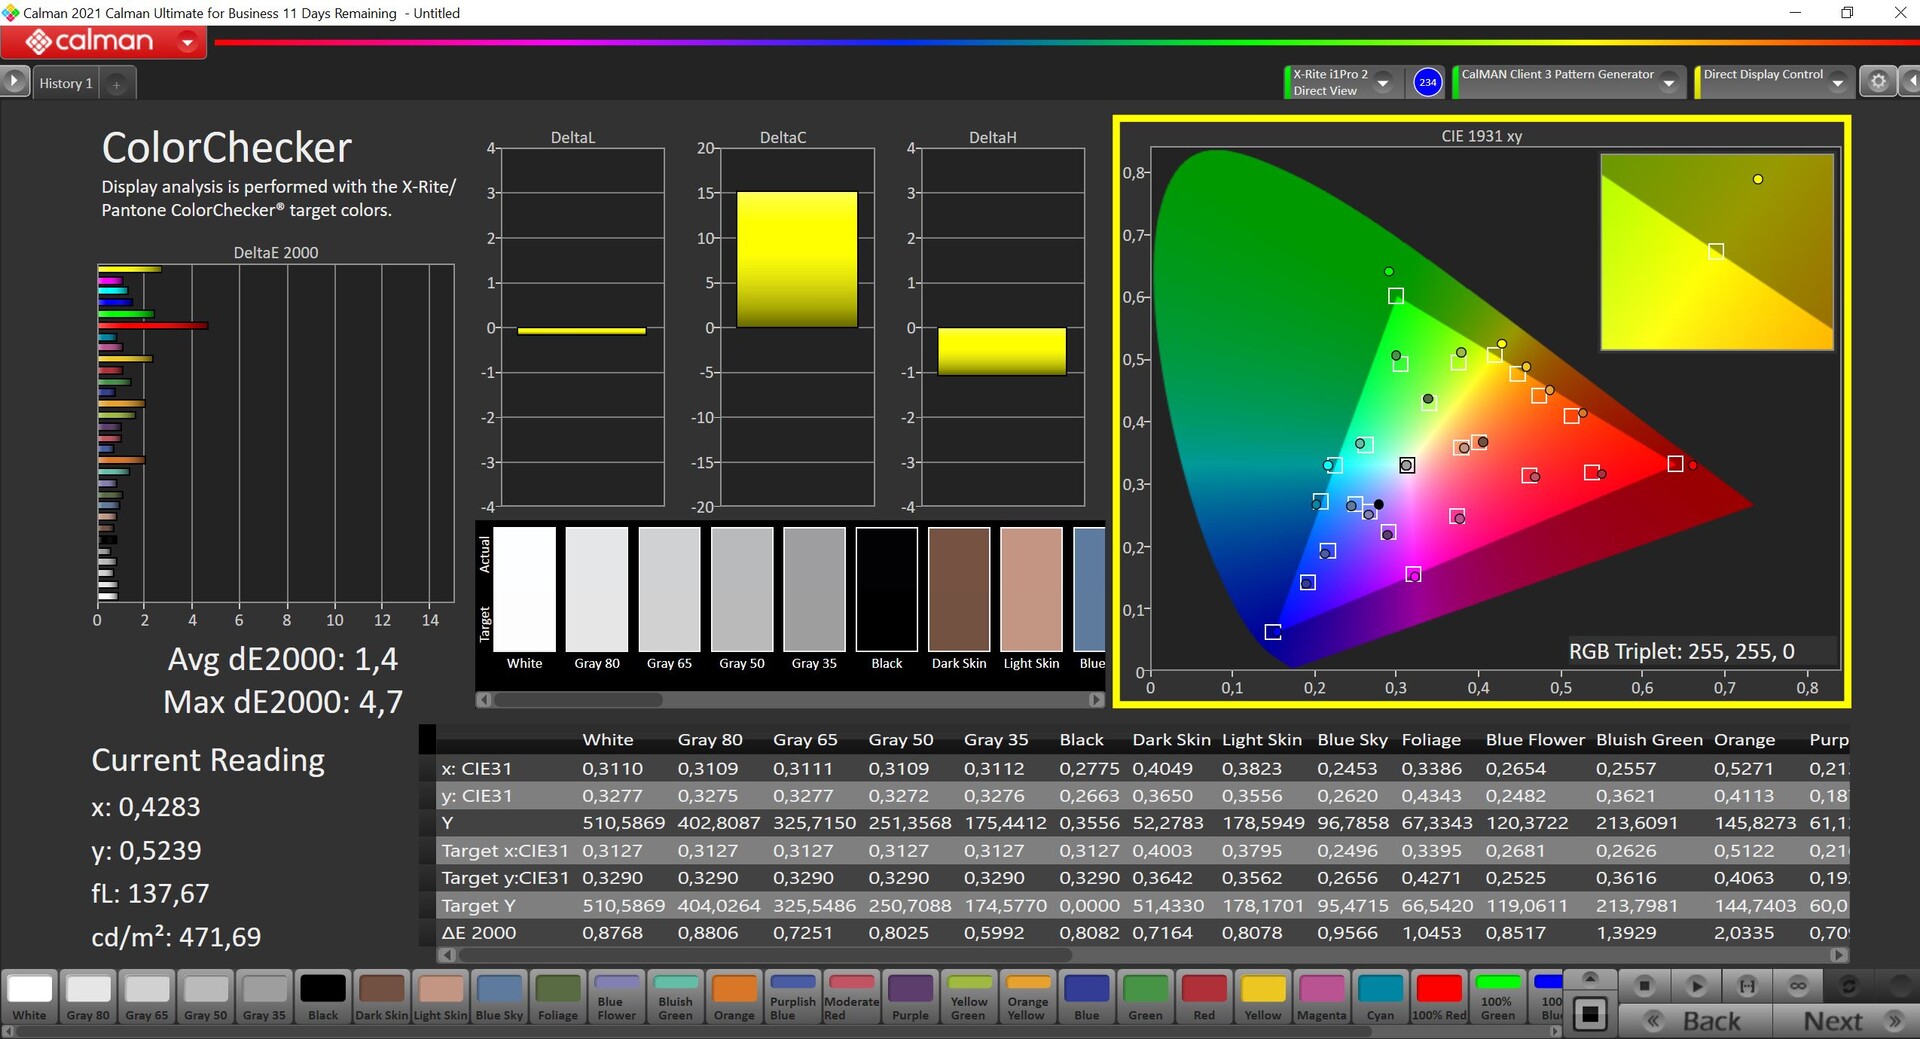

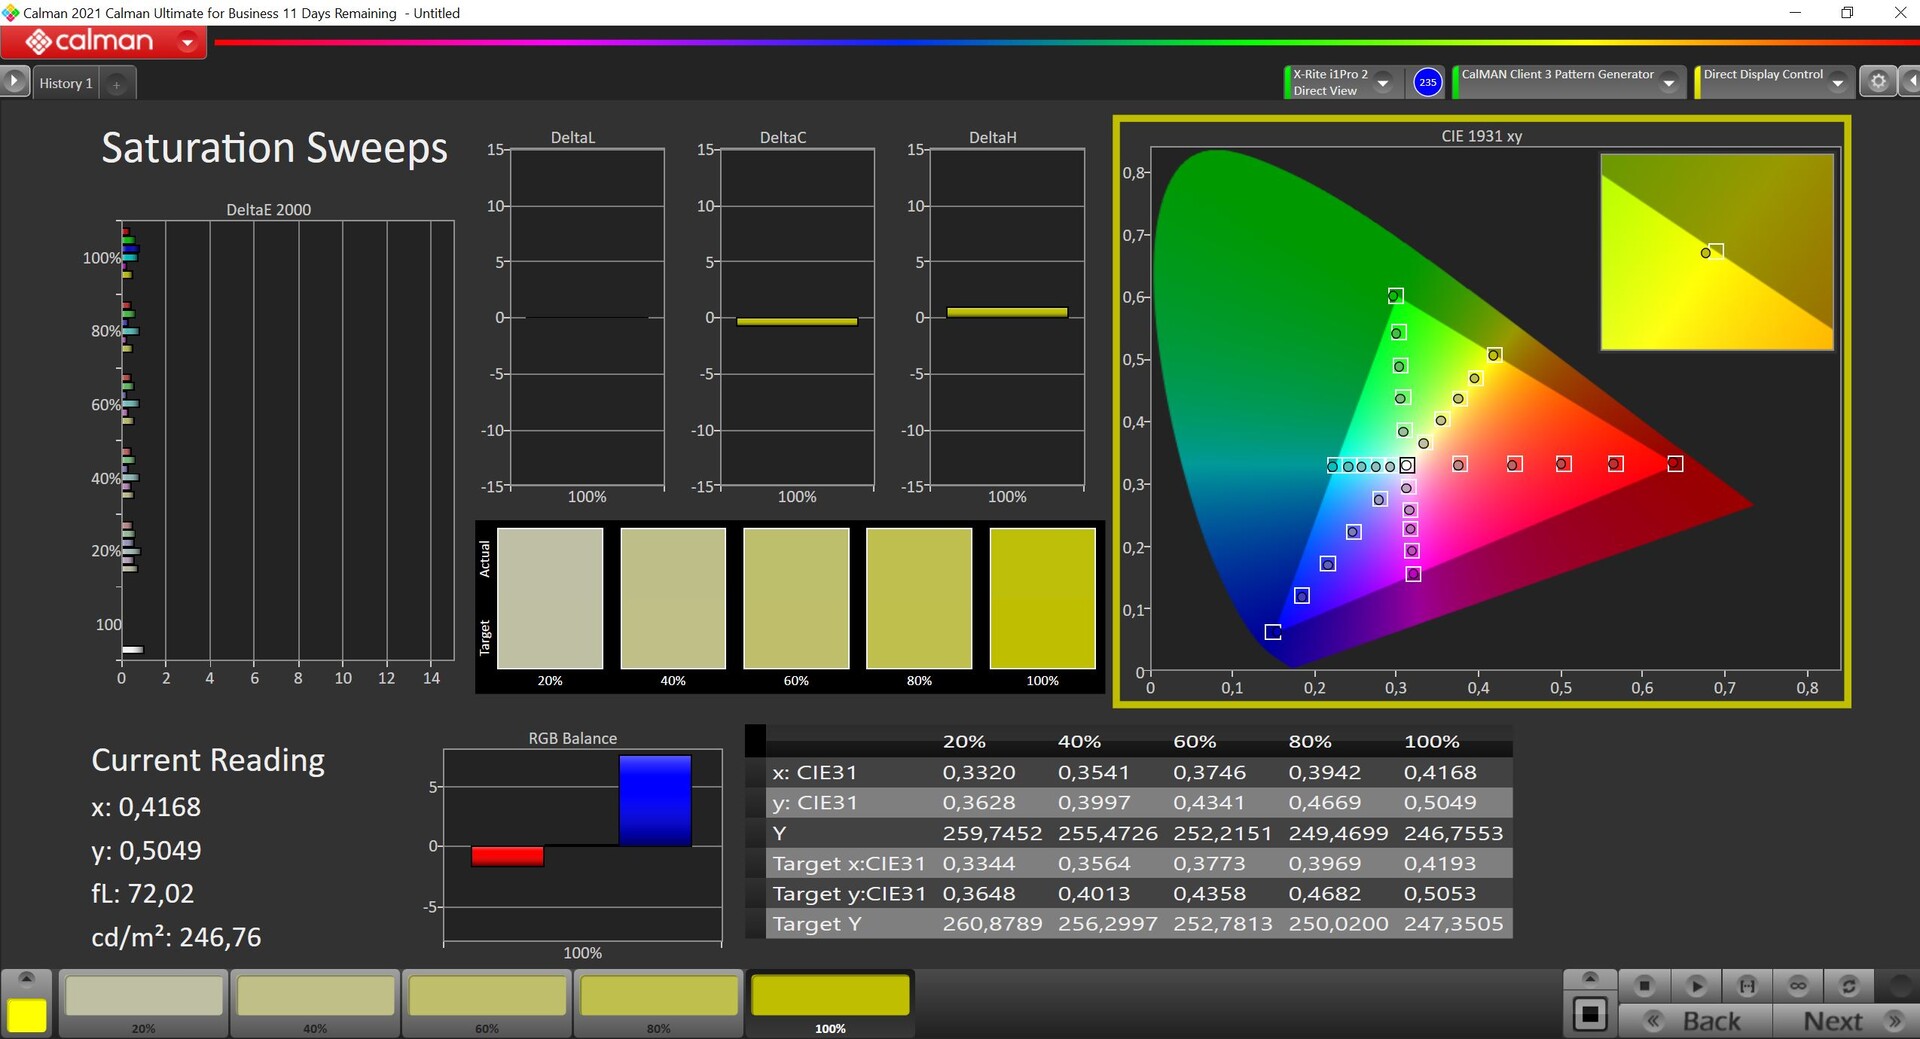
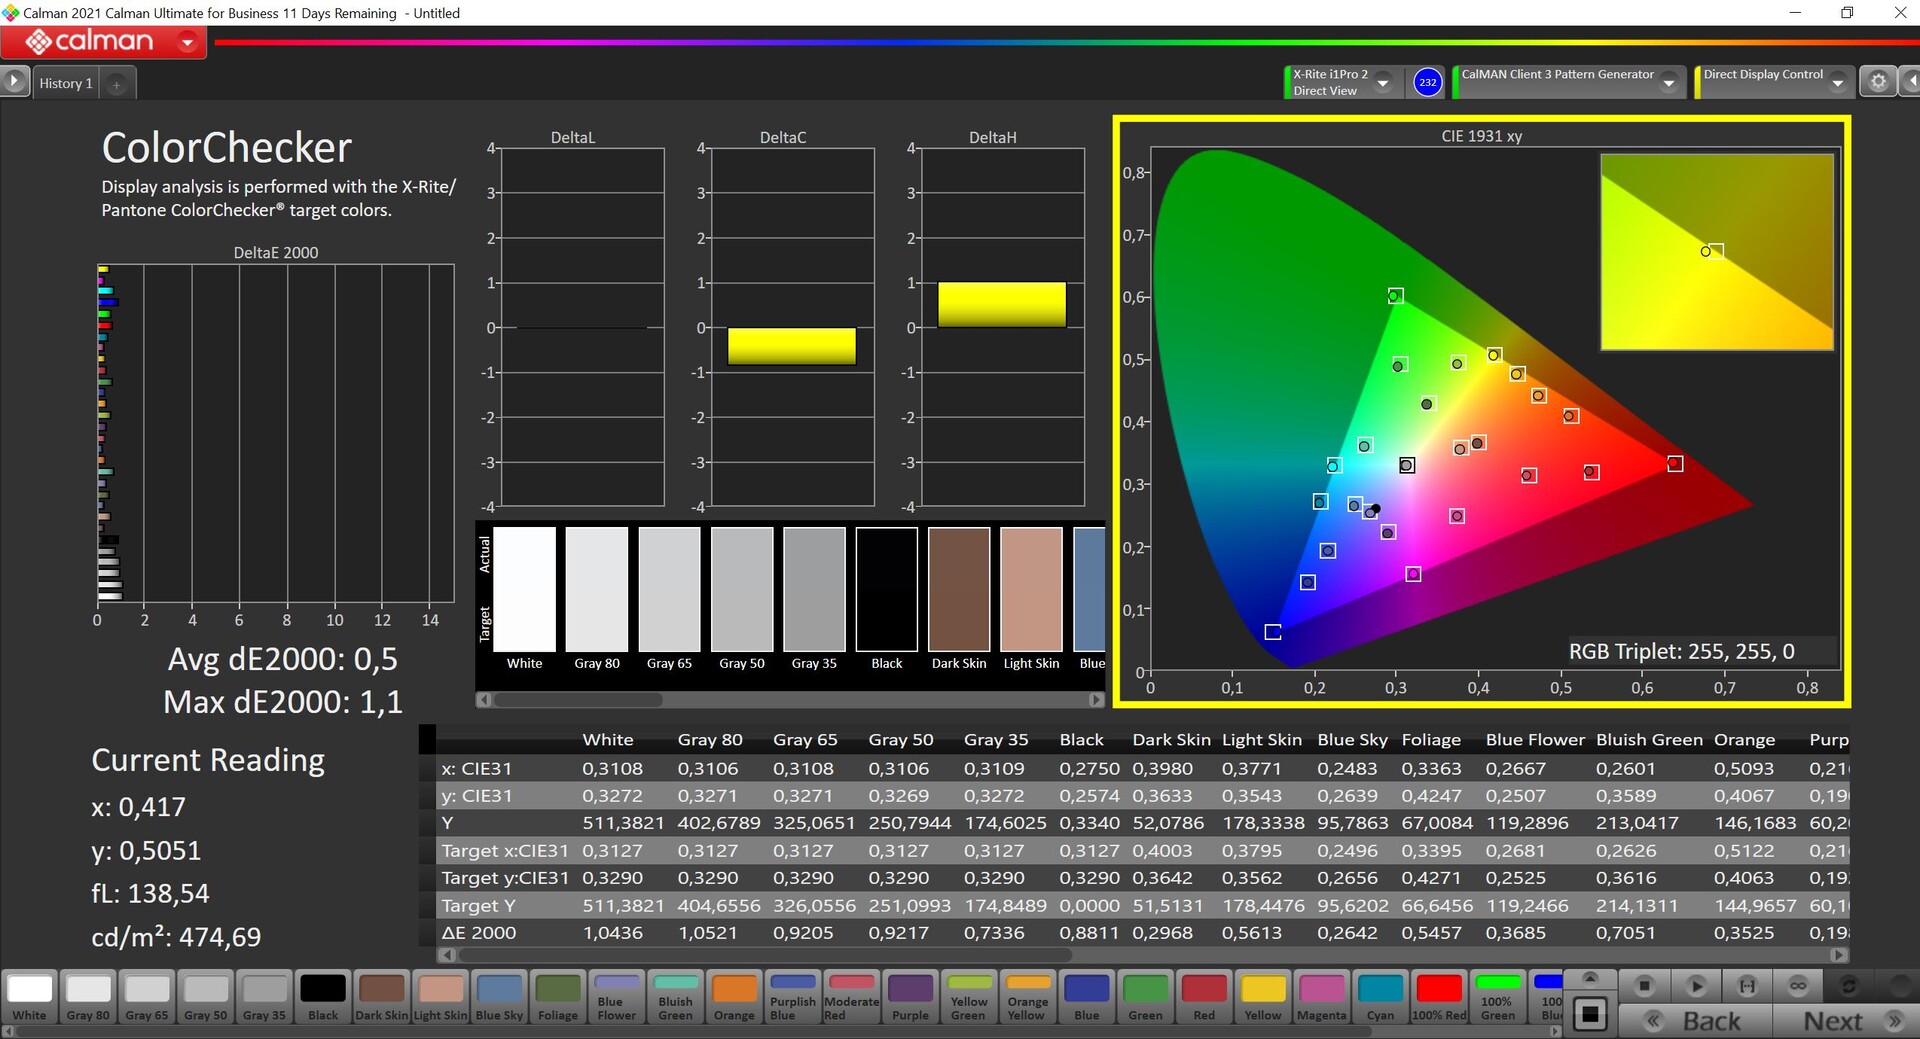
Microsoft skickar Surface Laptop Studio 2 med två färgprofiler för SDR-innehåll: Vivid och sRGB. Vivid-profilen är aktiv som standard och färgerna är lite övermättade, men noggrannheten är fortfarande okej. Vi kontrollerade båda profilerna med den professionella CalMAN-programvaran och sRGB-profilen är extremt väl kalibrerad utan några färgavvikelser. Om du vill redigera bilder eller videor bör du definitivt välja sRGB-profilen. Detta leder oss dock till ett av de största problemen, eftersom skärmen bara täcker det lilla sRGB-omfånget, vilket är en ganska stor nackdel med tanke på priset. Förresten kunde vi inte förbättra färgnoggrannheten ytterligare med vår egen kalibrering, så vi erbjuder inte en profil vid denna tidpunkt.
Visa svarstider
| ↔ Svarstid svart till vitt | ||
|---|---|---|
| 34.3 ms ... stiga ↗ och falla ↘ kombinerat | ↗ 7.7 ms stiga | 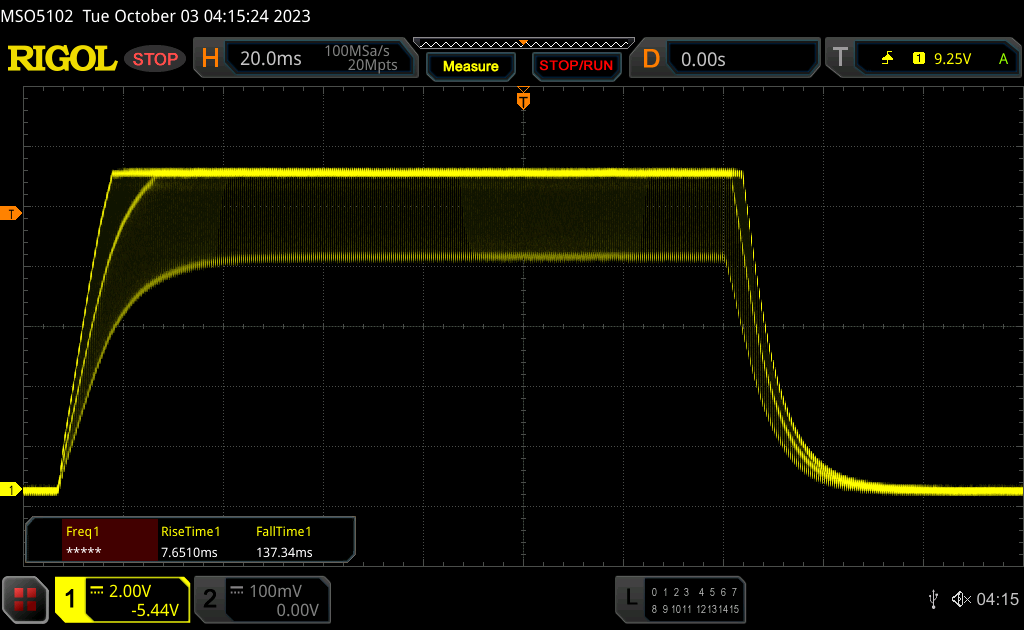 |
| ↘ 26.6 ms hösten | ||
| Skärmen visar långsamma svarsfrekvenser i våra tester och kommer att vara otillfredsställande för spelare. I jämförelse sträcker sig alla testade enheter från 0.1 (minst) till 240 (maximalt) ms. » 92 % av alla enheter är bättre. Detta innebär att den uppmätta svarstiden är sämre än genomsnittet av alla testade enheter (19.8 ms). | ||
| ↔ Svarstid 50 % grått till 80 % grått | ||
| 77.6 ms ... stiga ↗ och falla ↘ kombinerat | ↗ 35.4 ms stiga | 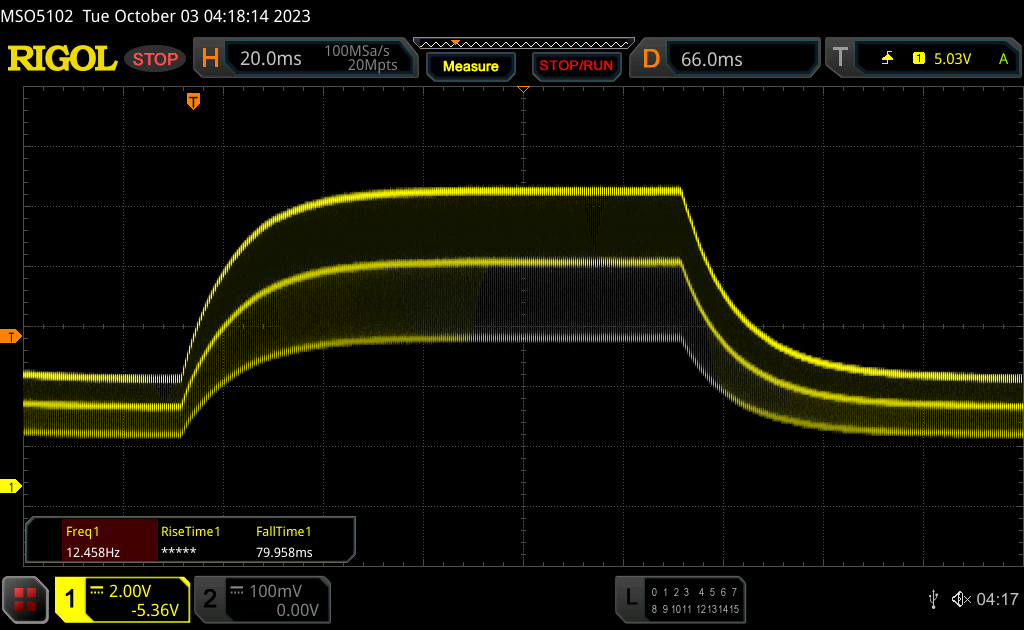 |
| ↘ 42.2 ms hösten | ||
| Skärmen visar långsamma svarsfrekvenser i våra tester och kommer att vara otillfredsställande för spelare. I jämförelse sträcker sig alla testade enheter från 0.165 (minst) till 636 (maximalt) ms. » 99 % av alla enheter är bättre. Detta innebär att den uppmätta svarstiden är sämre än genomsnittet av alla testade enheter (31 ms). | ||
Skärmflimmer / PWM (Puls-Width Modulation)
| Skärmflimmer / PWM upptäckt | 17600 Hz | ≤ 100 % ljusstyrka inställning | 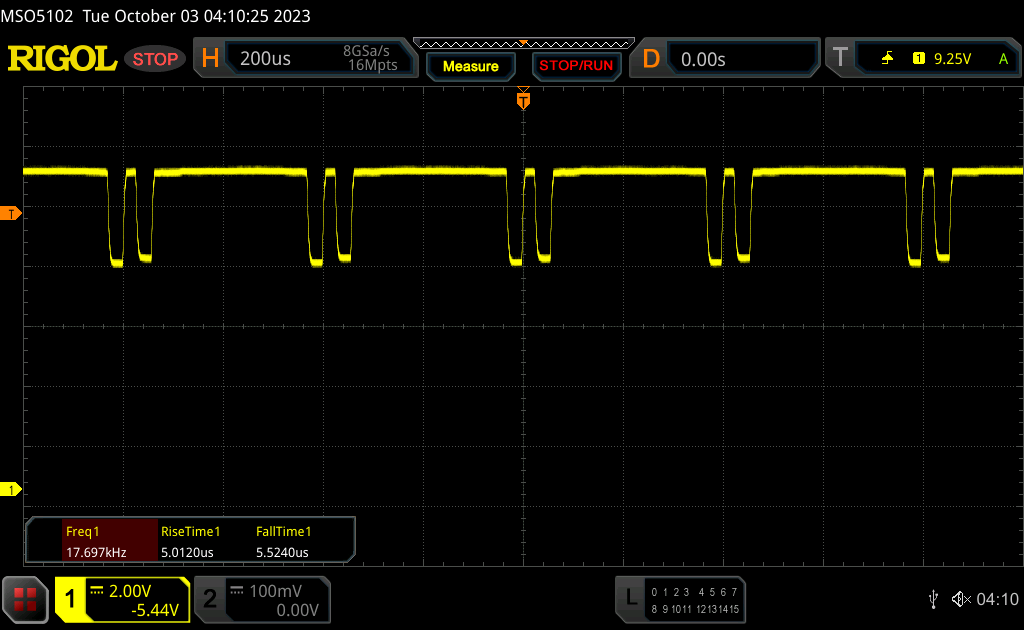 |
Displayens bakgrundsbelysning flimrar vid 17600 Hz (i värsta fall, t.ex. med PWM) Flimrande upptäckt vid en ljusstyrkeinställning på 100 % och lägre. Det ska inte finnas något flimmer eller PWM över denna ljusstyrkeinställning. Frekvensen för 17600 Hz är ganska hög, så de flesta användare som är känsliga för PWM bör inte märka något flimmer. Som jämförelse: 52 % av alla testade enheter använder inte PWM för att dämpa skärmen. Om PWM upptäcktes mättes ett medelvärde av 7757 (minst: 5 - maximum: 343500) Hz. | |||

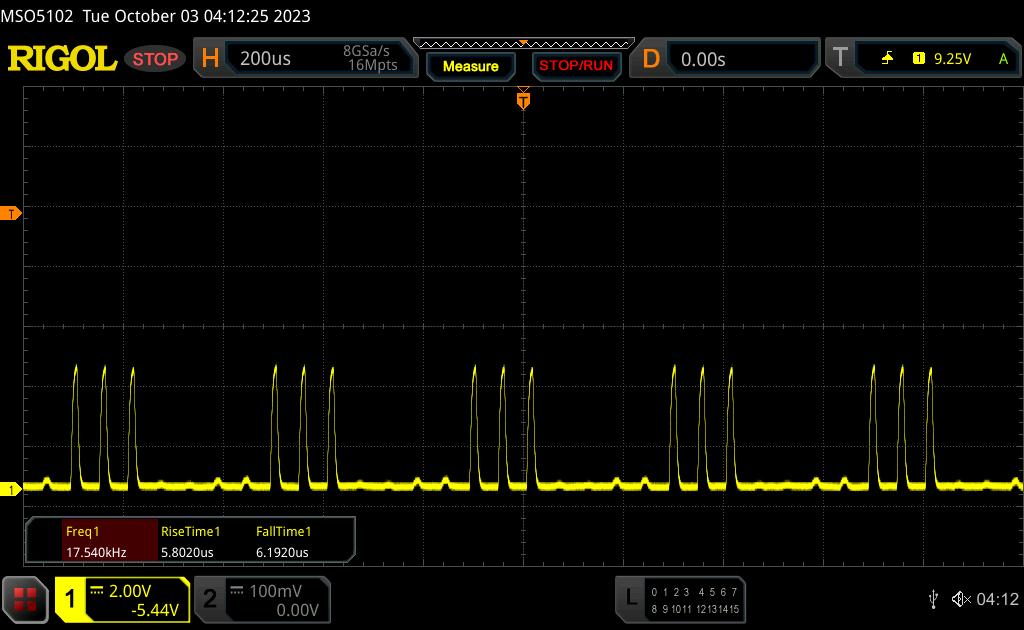
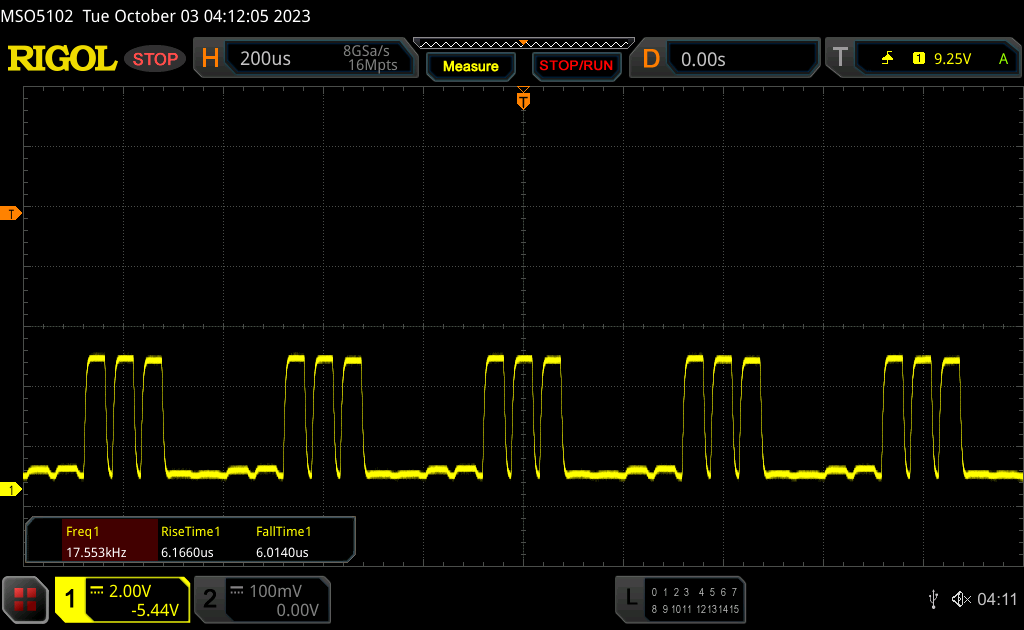
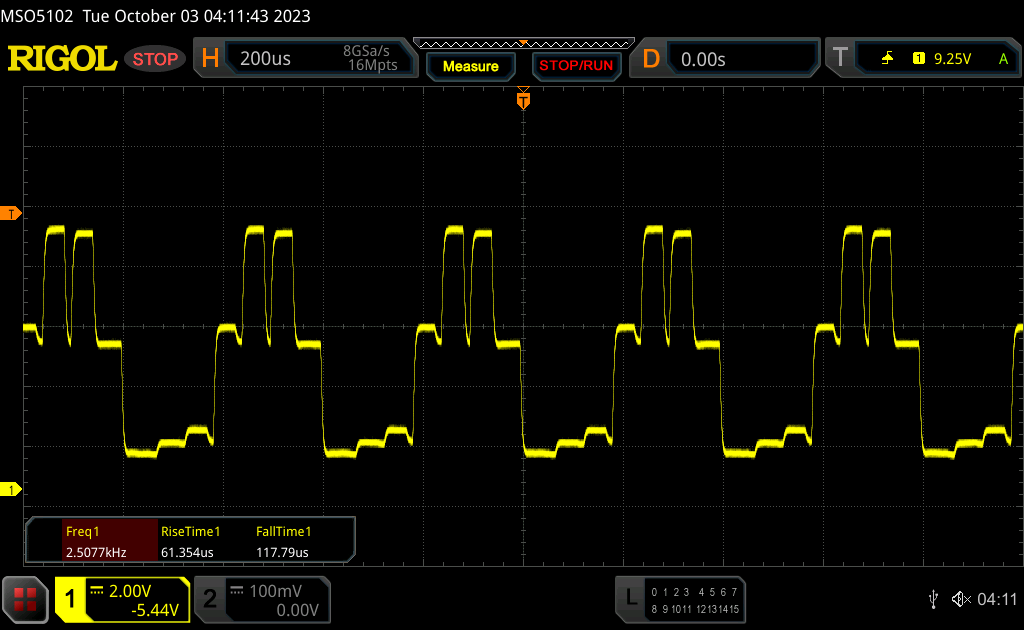
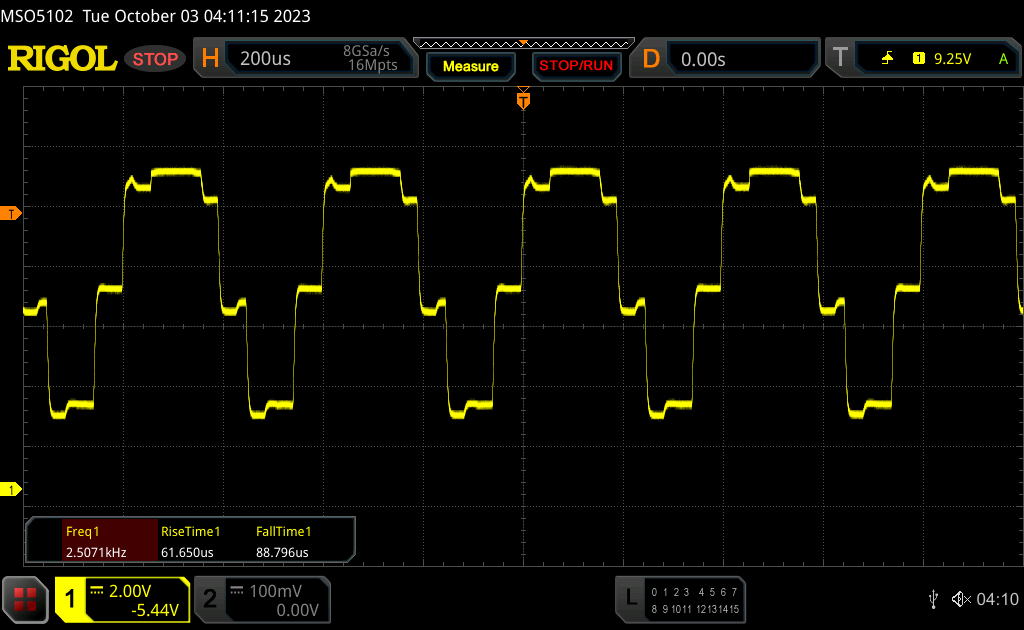
PWM-beteendet har förändrats jämfört med förra årets modell och vi kan nu mäta flimmer vid full ljusstyrka. Frekvensen är dock mycket hög, 17 kHz, så det bör inte vara några problem.
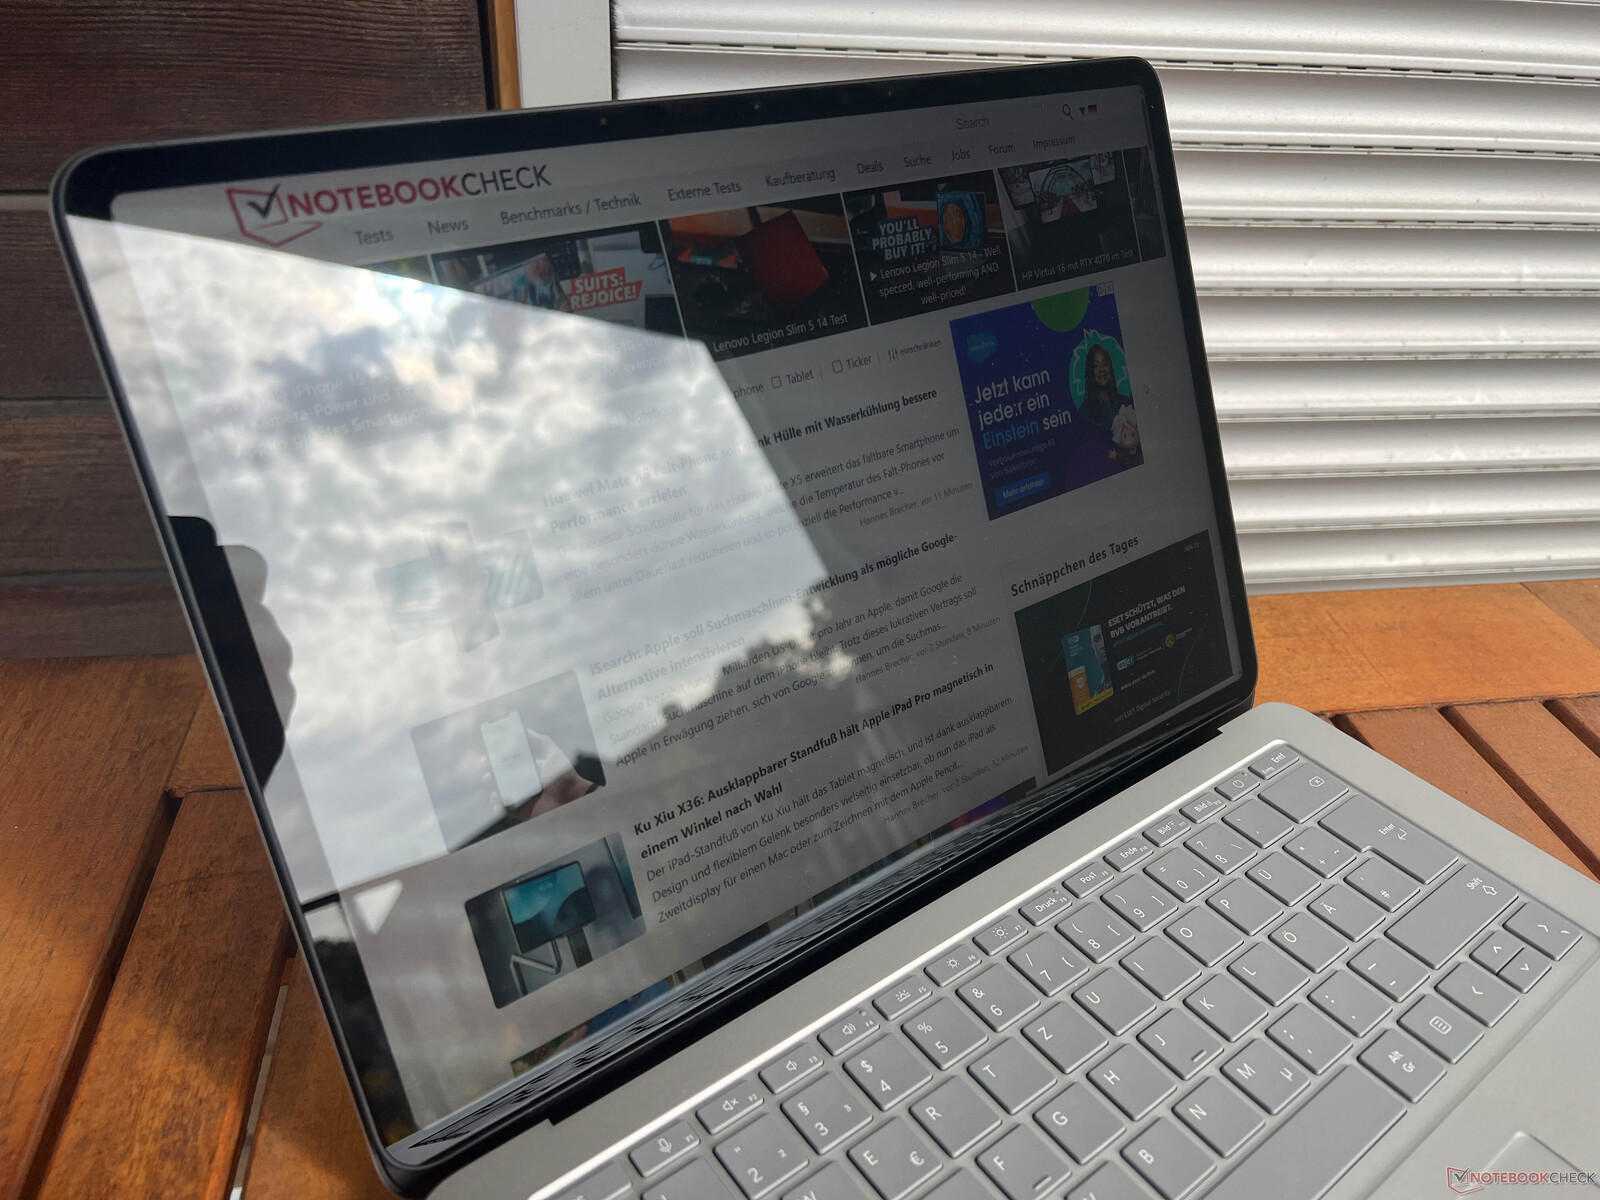
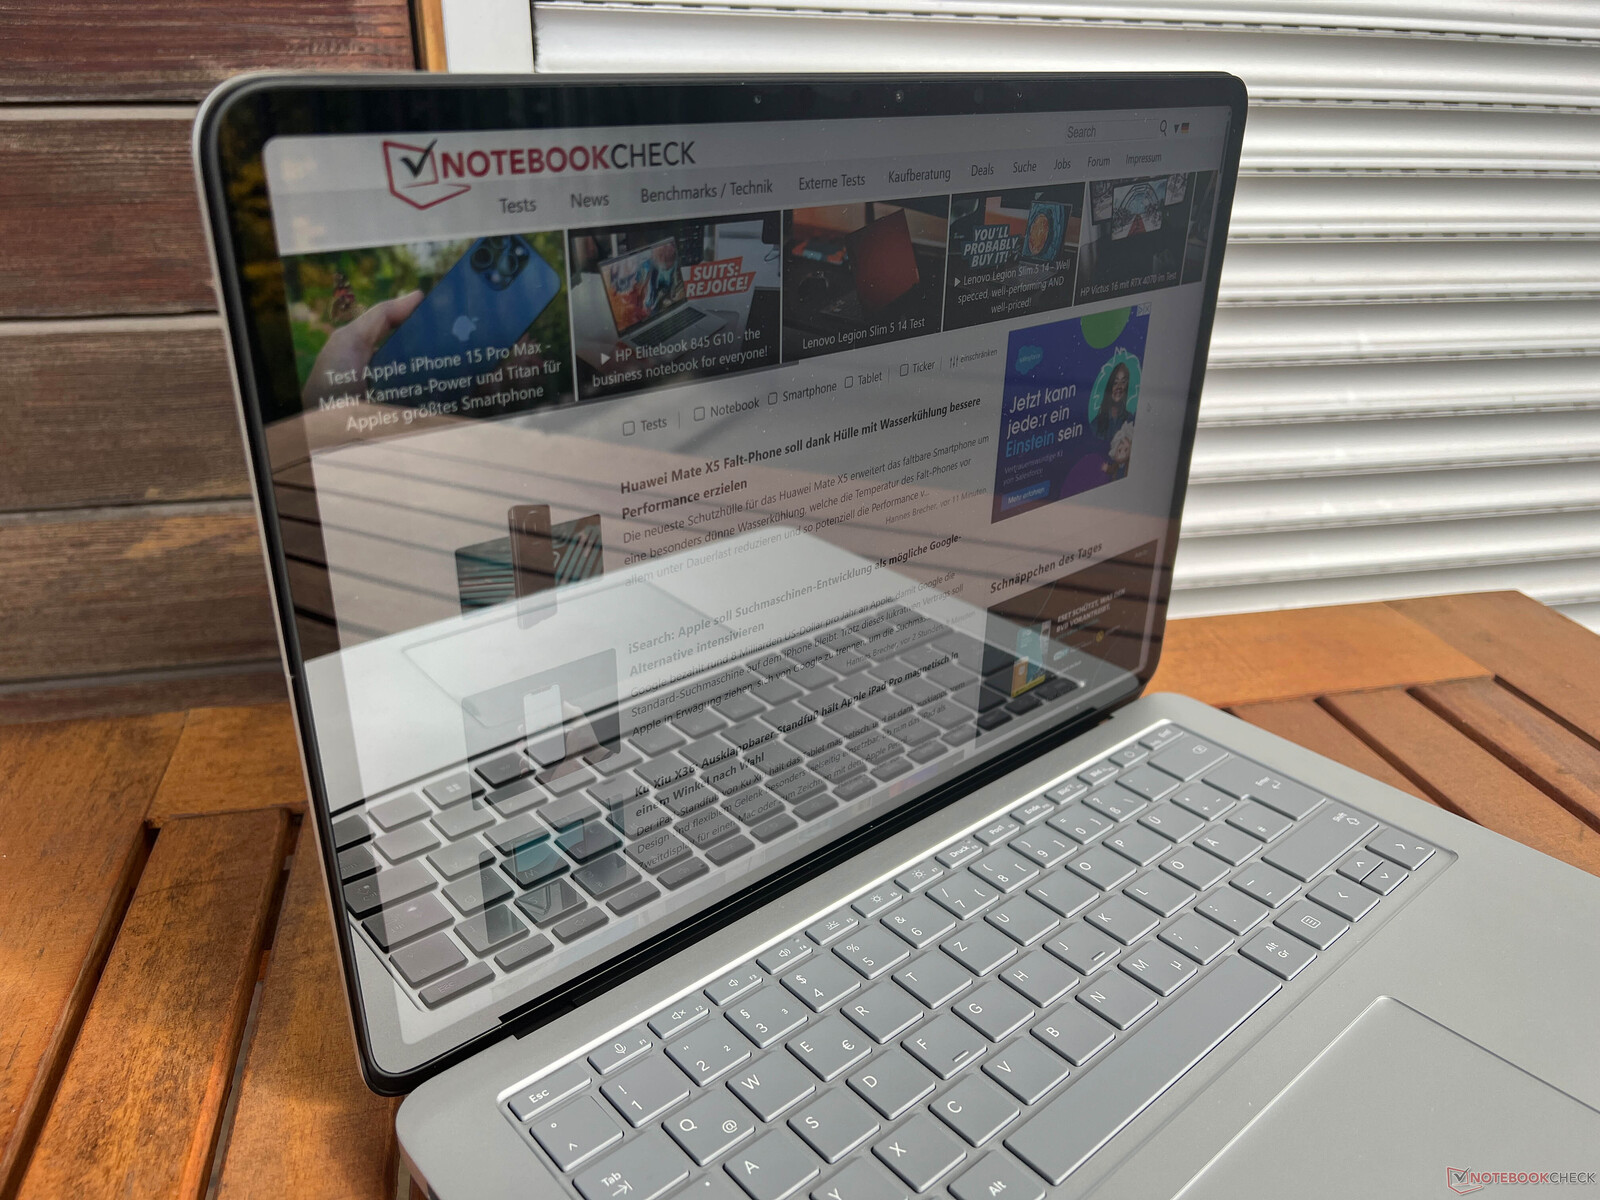
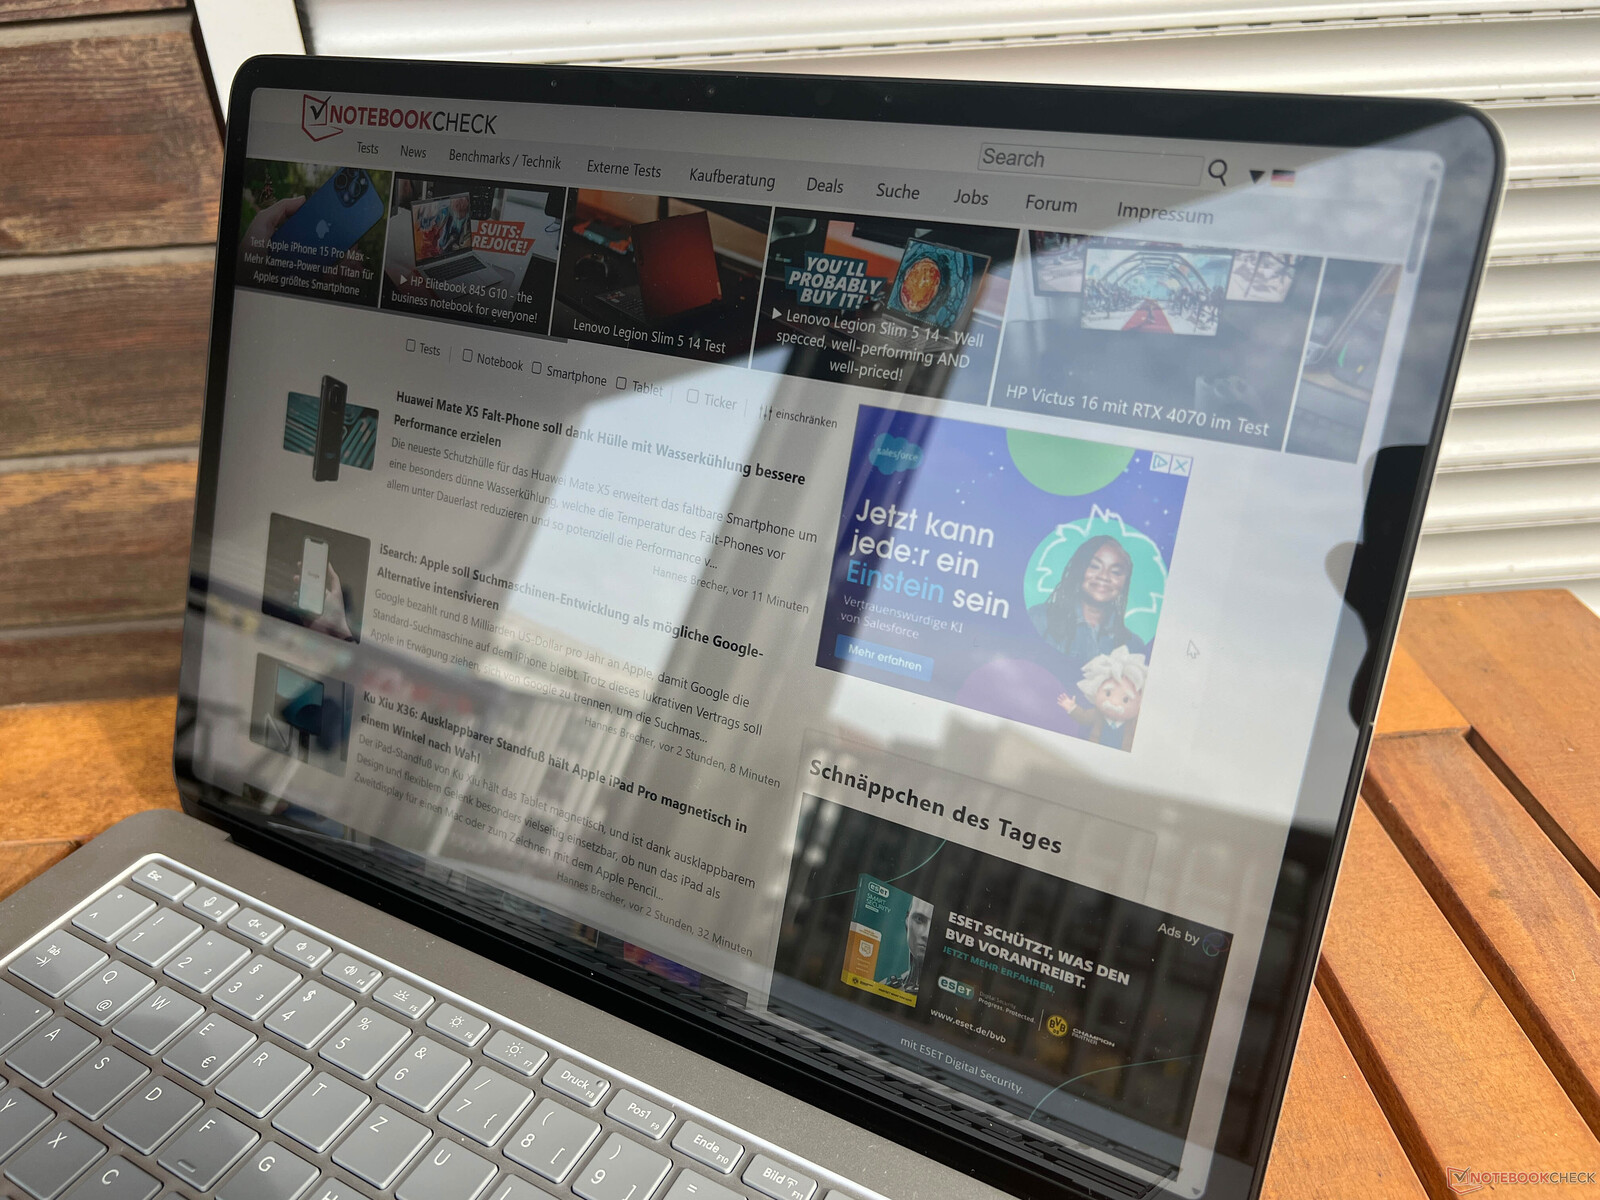
Ljusstyrkan är bra, men du måste undvika reflexer på den blanka pekskärmen när du vill använda den utomhus. Betraktningsvinkelstabiliteten hos IPS-skärmen är mycket bra.
Prestanda - Raptor Lake och ADA-Lovelace
Inställningar för granskning
Som vanligt för Microsoft-enheter får du bara Windows energiprofiler, men de har olika namn jämfört med andra Windows-enheter. Användare kan välja mellan Rekommenderad, Bättre prestanda samt Bästa prestanda. Vi listade motsvarande TDP/TGP-värden i följande tabell. Våra mätningar och benchmarks utfördes med profilen Best Performance, men du kan enkelt använda profilen Recommended för vardagliga uppgifter.
| CPU-belastning | GPU-belastning | Stresstest | |
|---|---|---|---|
| Rekommenderad | 35 watt | 60 watt | CPU: 16 watt GPU: 32 watt |
| Bättre prestanda | 45 -> 35 Watts | 70 Watts | CPU: 18 watt GPU: 37 watt |
| Bästa prestanda | 82 -> 50 watt | 80 watt | CPU: 23 watt GPU: 57 watt |
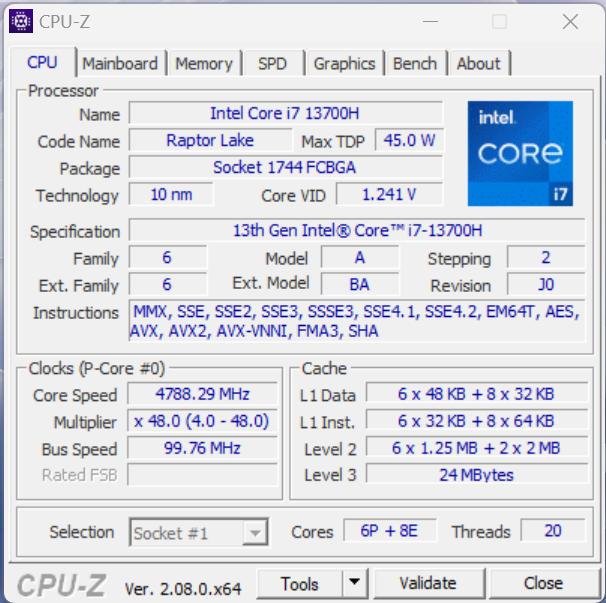
Processor - Core i7-13700H
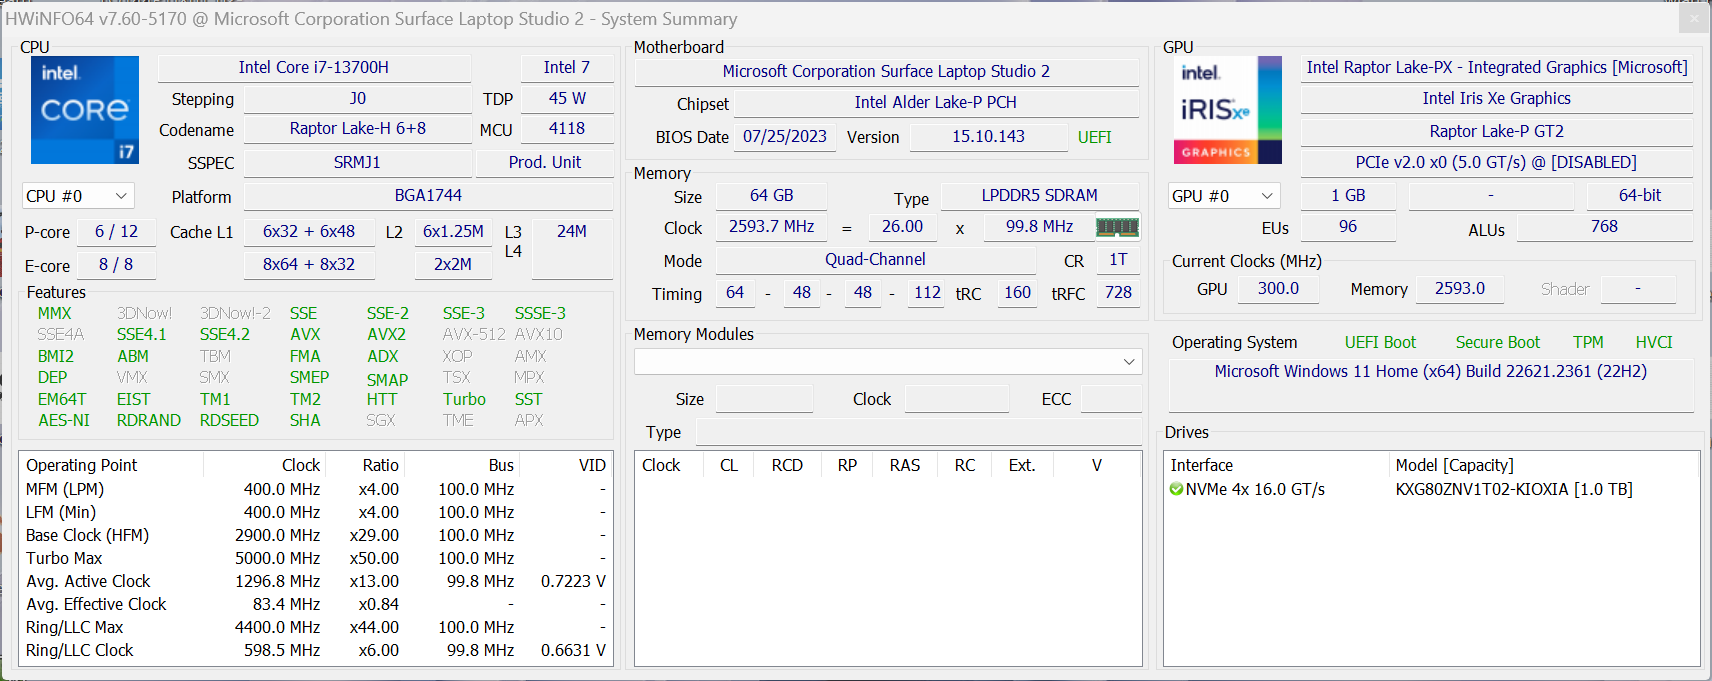
Microsoft ersatte processorn Tiger Lake Core i7-11370H(fyra kärnor) med den nuvarande Raptor LakeCore i7-13700Hsom använder en hybridarkitektur med sex prestandakärnor och åtta effektivitetskärnor, så att den kan exekvera upp till 20 trådar samtidigt. 45W-processorn kan förbruka upp till 82 watt under en kort period för att sedan plana ut på 52 watt.
Cinebench R15 Multi Loop
Fördelen jämfört med den gamla Surface Laptop Studio är enorm (+150 % i flerkärniga tester) och den enkelkärniga prestandan är också mycket bra, men chipet kan inte bibehålla prestandan särskilt länge, vilket framgår av vår Cinebench R15 Multi-loop. Det sjunker till och med till nivån förApple M2 Pro(där Cinebench R15 är emulerad, vilket kostar prestanda). Konkurrenter med AMD-processor erbjuder bättre och mer stabila prestandasiffror.
Prestandan sjunker ytterligare på batteridrift eftersom förbrukningen är begränsad till 55/40 watt. Detta påverkar inte single-core-prestandan, men multi-core-prestandan är cirka 18 % lägre. Fler CPU-riktmärken finns tillgängliga i vårt teknikavsnitt.
Cinebench R20: CPU (Multi Core) | CPU (Single Core)
Cinebench R15: CPU Multi 64Bit | CPU Single 64Bit
Blender: v2.79 BMW27 CPU
7-Zip 18.03: 7z b 4 | 7z b 4 -mmt1
Geekbench 5.5: Multi-Core | Single-Core
HWBOT x265 Benchmark v2.2: 4k Preset
LibreOffice : 20 Documents To PDF
R Benchmark 2.5: Overall mean
| Cinebench R23 / Multi Core | |
| Asus Zenbook Pro 14 OLED UX6404VI | |
| Asus ROG Zephyrus G14 GA402XY | |
| Lenovo Yoga Pro 9-14IRP G8 | |
| Asus ZenBook Pro 14 Duo UX8402VV-P1021W | |
| Lenovo Legion Slim 5 14APH8 | |
| Genomsnitt av klass Multimedia (4861 - 33362, n=74, senaste 2 åren) | |
| Microsoft Surface Laptop Studio 2 RTX 4060 | |
| Genomsnitt Intel Core i7-13700H (5890 - 20034, n=29) | |
| Apple MacBook Pro 14 2023 M2 Pro | |
| Microsoft Surface Laptop Studio i7 RTX 3050 Ti | |
| Cinebench R23 / Single Core | |
| Asus Zenbook Pro 14 OLED UX6404VI | |
| Asus ZenBook Pro 14 Duo UX8402VV-P1021W | |
| Genomsnitt av klass Multimedia (1128 - 2459, n=66, senaste 2 åren) | |
| Microsoft Surface Laptop Studio 2 RTX 4060 | |
| Lenovo Yoga Pro 9-14IRP G8 | |
| Genomsnitt Intel Core i7-13700H (1323 - 1914, n=29) | |
| Lenovo Legion Slim 5 14APH8 | |
| Asus ROG Zephyrus G14 GA402XY | |
| Apple MacBook Pro 14 2023 M2 Pro | |
| Microsoft Surface Laptop Studio i7 RTX 3050 Ti | |
| Cinebench R20 / CPU (Multi Core) | |
| Asus Zenbook Pro 14 OLED UX6404VI | |
| Asus ROG Zephyrus G14 GA402XY | |
| Lenovo Yoga Pro 9-14IRP G8 | |
| Asus ZenBook Pro 14 Duo UX8402VV-P1021W | |
| Lenovo Legion Slim 5 14APH8 | |
| Genomsnitt av klass Multimedia (1887 - 12912, n=57, senaste 2 åren) | |
| Microsoft Surface Laptop Studio 2 RTX 4060 | |
| Genomsnitt Intel Core i7-13700H (2322 - 7674, n=29) | |
| Apple MacBook Pro 14 2023 M2 Pro | |
| Microsoft Surface Laptop Studio i7 RTX 3050 Ti | |
| Cinebench R20 / CPU (Single Core) | |
| Asus Zenbook Pro 14 OLED UX6404VI | |
| Asus ZenBook Pro 14 Duo UX8402VV-P1021W | |
| Microsoft Surface Laptop Studio 2 RTX 4060 | |
| Genomsnitt av klass Multimedia (425 - 853, n=57, senaste 2 åren) | |
| Lenovo Yoga Pro 9-14IRP G8 | |
| Asus ROG Zephyrus G14 GA402XY | |
| Genomsnitt Intel Core i7-13700H (508 - 741, n=29) | |
| Lenovo Legion Slim 5 14APH8 | |
| Microsoft Surface Laptop Studio i7 RTX 3050 Ti | |
| Apple MacBook Pro 14 2023 M2 Pro | |
| Cinebench R15 / CPU Multi 64Bit | |
| Asus Zenbook Pro 14 OLED UX6404VI | |
| Asus ROG Zephyrus G14 GA402XY | |
| Lenovo Yoga Pro 9-14IRP G8 | |
| Lenovo Legion Slim 5 14APH8 | |
| Asus ZenBook Pro 14 Duo UX8402VV-P1021W | |
| Microsoft Surface Laptop Studio 2 RTX 4060 | |
| Genomsnitt av klass Multimedia (856 - 5224, n=61, senaste 2 åren) | |
| Genomsnitt Intel Core i7-13700H (905 - 2982, n=29) | |
| Apple MacBook Pro 14 2023 M2 Pro | |
| Microsoft Surface Laptop Studio i7 RTX 3050 Ti | |
| Cinebench R15 / CPU Single 64Bit | |
| Asus Zenbook Pro 14 OLED UX6404VI | |
| Asus ZenBook Pro 14 Duo UX8402VV-P1021W | |
| Asus ROG Zephyrus G14 GA402XY | |
| Genomsnitt av klass Multimedia (184.8 - 326, n=59, senaste 2 åren) | |
| Lenovo Legion Slim 5 14APH8 | |
| Microsoft Surface Laptop Studio 2 RTX 4060 | |
| Lenovo Yoga Pro 9-14IRP G8 | |
| Genomsnitt Intel Core i7-13700H (213 - 278, n=29) | |
| Apple MacBook Pro 14 2023 M2 Pro | |
| Microsoft Surface Laptop Studio i7 RTX 3050 Ti | |
| Blender / v2.79 BMW27 CPU | |
| Microsoft Surface Laptop Studio i7 RTX 3050 Ti | |
| Genomsnitt av klass Multimedia (100 - 557, n=58, senaste 2 åren) | |
| Microsoft Surface Laptop Studio 2 RTX 4060 | |
| Genomsnitt Intel Core i7-13700H (169 - 555, n=29) | |
| Lenovo Yoga Pro 9-14IRP G8 | |
| Lenovo Legion Slim 5 14APH8 | |
| Asus ZenBook Pro 14 Duo UX8402VV-P1021W | |
| Asus ROG Zephyrus G14 GA402XY | |
| Asus Zenbook Pro 14 OLED UX6404VI | |
| 7-Zip 18.03 / 7z b 4 | |
| Asus Zenbook Pro 14 OLED UX6404VI | |
| Asus ROG Zephyrus G14 GA402XY | |
| Lenovo Yoga Pro 9-14IRP G8 | |
| Asus ZenBook Pro 14 Duo UX8402VV-P1021W | |
| Lenovo Legion Slim 5 14APH8 | |
| Microsoft Surface Laptop Studio 2 RTX 4060 | |
| Genomsnitt Intel Core i7-13700H (27322 - 76344, n=29) | |
| Genomsnitt av klass Multimedia (26062 - 130368, n=55, senaste 2 åren) | |
| Microsoft Surface Laptop Studio i7 RTX 3050 Ti | |
| 7-Zip 18.03 / 7z b 4 -mmt1 | |
| Asus ROG Zephyrus G14 GA402XY | |
| Asus Zenbook Pro 14 OLED UX6404VI | |
| Asus ZenBook Pro 14 Duo UX8402VV-P1021W | |
| Microsoft Surface Laptop Studio 2 RTX 4060 | |
| Lenovo Legion Slim 5 14APH8 | |
| Lenovo Yoga Pro 9-14IRP G8 | |
| Genomsnitt av klass Multimedia (3666 - 7545, n=56, senaste 2 åren) | |
| Genomsnitt Intel Core i7-13700H (4825 - 6238, n=29) | |
| Microsoft Surface Laptop Studio i7 RTX 3050 Ti | |
| Geekbench 5.5 / Multi-Core | |
| Apple MacBook Pro 14 2023 M2 Pro | |
| Asus Zenbook Pro 14 OLED UX6404VI | |
| Lenovo Yoga Pro 9-14IRP G8 | |
| Genomsnitt av klass Multimedia (4652 - 20422, n=56, senaste 2 åren) | |
| Microsoft Surface Laptop Studio 2 RTX 4060 | |
| Asus ZenBook Pro 14 Duo UX8402VV-P1021W | |
| Asus ROG Zephyrus G14 GA402XY | |
| Genomsnitt Intel Core i7-13700H (6165 - 14215, n=29) | |
| Lenovo Legion Slim 5 14APH8 | |
| Microsoft Surface Laptop Studio i7 RTX 3050 Ti | |
| Geekbench 5.5 / Single-Core | |
| Asus ROG Zephyrus G14 GA402XY | |
| Asus Zenbook Pro 14 OLED UX6404VI | |
| Genomsnitt av klass Multimedia (805 - 2974, n=56, senaste 2 åren) | |
| Apple MacBook Pro 14 2023 M2 Pro | |
| Lenovo Legion Slim 5 14APH8 | |
| Asus ZenBook Pro 14 Duo UX8402VV-P1021W | |
| Lenovo Yoga Pro 9-14IRP G8 | |
| Microsoft Surface Laptop Studio 2 RTX 4060 | |
| Genomsnitt Intel Core i7-13700H (1362 - 1919, n=29) | |
| Microsoft Surface Laptop Studio i7 RTX 3050 Ti | |
| HWBOT x265 Benchmark v2.2 / 4k Preset | |
| Asus ROG Zephyrus G14 GA402XY | |
| Lenovo Legion Slim 5 14APH8 | |
| Asus Zenbook Pro 14 OLED UX6404VI | |
| Lenovo Yoga Pro 9-14IRP G8 | |
| Genomsnitt av klass Multimedia (5.26 - 36.1, n=56, senaste 2 åren) | |
| Asus ZenBook Pro 14 Duo UX8402VV-P1021W | |
| Microsoft Surface Laptop Studio 2 RTX 4060 | |
| Genomsnitt Intel Core i7-13700H (6.72 - 21.2, n=29) | |
| Microsoft Surface Laptop Studio i7 RTX 3050 Ti | |
| LibreOffice / 20 Documents To PDF | |
| Microsoft Surface Laptop Studio i7 RTX 3050 Ti | |
| Genomsnitt av klass Multimedia (23.9 - 146.7, n=57, senaste 2 åren) | |
| Genomsnitt Intel Core i7-13700H (31.3 - 62.4, n=29) | |
| Lenovo Yoga Pro 9-14IRP G8 | |
| Microsoft Surface Laptop Studio 2 RTX 4060 | |
| Asus Zenbook Pro 14 OLED UX6404VI | |
| Lenovo Legion Slim 5 14APH8 | |
| Asus ZenBook Pro 14 Duo UX8402VV-P1021W | |
| Asus ROG Zephyrus G14 GA402XY | |
| R Benchmark 2.5 / Overall mean | |
| Microsoft Surface Laptop Studio i7 RTX 3050 Ti | |
| Genomsnitt Intel Core i7-13700H (0.4308 - 0.607, n=29) | |
| Genomsnitt av klass Multimedia (0.3604 - 0.947, n=56, senaste 2 åren) | |
| Lenovo Legion Slim 5 14APH8 | |
| Microsoft Surface Laptop Studio 2 RTX 4060 | |
| Asus ZenBook Pro 14 Duo UX8402VV-P1021W | |
| Lenovo Yoga Pro 9-14IRP G8 | |
| Asus ROG Zephyrus G14 GA402XY | |
| Asus Zenbook Pro 14 OLED UX6404VI | |
* ... mindre är bättre
AIDA64: FP32 Ray-Trace | FPU Julia | CPU SHA3 | CPU Queen | FPU SinJulia | FPU Mandel | CPU AES | CPU ZLib | FP64 Ray-Trace | CPU PhotoWorxx
| Performance rating | |
| Lenovo Legion Slim 5 14APH8 | |
| Asus Zenbook Pro 14 OLED UX6404VI | |
| Lenovo Yoga Pro 9-14IRP G8 | |
| Genomsnitt av klass Multimedia | |
| Asus ZenBook Pro 14 Duo UX8402VV-P1021W | |
| Genomsnitt Intel Core i7-13700H | |
| Microsoft Surface Laptop Studio 2 RTX 4060 | |
| Microsoft Surface Laptop Studio i7 RTX 3050 Ti | |
| AIDA64 / FP32 Ray-Trace | |
| Lenovo Legion Slim 5 14APH8 | |
| Genomsnitt av klass Multimedia (2214 - 50388, n=53, senaste 2 åren) | |
| Lenovo Yoga Pro 9-14IRP G8 | |
| Asus Zenbook Pro 14 OLED UX6404VI | |
| Asus ZenBook Pro 14 Duo UX8402VV-P1021W | |
| Genomsnitt Intel Core i7-13700H (4986 - 18908, n=29) | |
| Microsoft Surface Laptop Studio 2 RTX 4060 | |
| Microsoft Surface Laptop Studio i7 RTX 3050 Ti | |
| AIDA64 / FPU Julia | |
| Lenovo Legion Slim 5 14APH8 | |
| Asus Zenbook Pro 14 OLED UX6404VI | |
| Genomsnitt av klass Multimedia (12867 - 201874, n=54, senaste 2 åren) | |
| Lenovo Yoga Pro 9-14IRP G8 | |
| Asus ZenBook Pro 14 Duo UX8402VV-P1021W | |
| Microsoft Surface Laptop Studio 2 RTX 4060 | |
| Genomsnitt Intel Core i7-13700H (25360 - 92359, n=29) | |
| Microsoft Surface Laptop Studio i7 RTX 3050 Ti | |
| AIDA64 / CPU SHA3 | |
| Lenovo Legion Slim 5 14APH8 | |
| Asus Zenbook Pro 14 OLED UX6404VI | |
| Genomsnitt av klass Multimedia (626 - 8623, n=54, senaste 2 åren) | |
| Lenovo Yoga Pro 9-14IRP G8 | |
| Microsoft Surface Laptop Studio 2 RTX 4060 | |
| Genomsnitt Intel Core i7-13700H (1339 - 4224, n=29) | |
| Asus ZenBook Pro 14 Duo UX8402VV-P1021W | |
| Microsoft Surface Laptop Studio i7 RTX 3050 Ti | |
| AIDA64 / CPU Queen | |
| Lenovo Legion Slim 5 14APH8 | |
| Asus Zenbook Pro 14 OLED UX6404VI | |
| Asus ZenBook Pro 14 Duo UX8402VV-P1021W | |
| Lenovo Yoga Pro 9-14IRP G8 | |
| Microsoft Surface Laptop Studio 2 RTX 4060 | |
| Genomsnitt Intel Core i7-13700H (59324 - 107159, n=29) | |
| Genomsnitt av klass Multimedia (13483 - 181505, n=41, senaste 2 åren) | |
| Microsoft Surface Laptop Studio i7 RTX 3050 Ti | |
| AIDA64 / FPU SinJulia | |
| Lenovo Legion Slim 5 14APH8 | |
| Lenovo Yoga Pro 9-14IRP G8 | |
| Asus Zenbook Pro 14 OLED UX6404VI | |
| Asus ZenBook Pro 14 Duo UX8402VV-P1021W | |
| Genomsnitt Intel Core i7-13700H (4800 - 11050, n=29) | |
| Genomsnitt av klass Multimedia (886 - 28794, n=54, senaste 2 åren) | |
| Microsoft Surface Laptop Studio 2 RTX 4060 | |
| Microsoft Surface Laptop Studio i7 RTX 3050 Ti | |
| AIDA64 / FPU Mandel | |
| Lenovo Legion Slim 5 14APH8 | |
| Genomsnitt av klass Multimedia (6395 - 105740, n=53, senaste 2 åren) | |
| Lenovo Yoga Pro 9-14IRP G8 | |
| Asus Zenbook Pro 14 OLED UX6404VI | |
| Asus ZenBook Pro 14 Duo UX8402VV-P1021W | |
| Genomsnitt Intel Core i7-13700H (12321 - 45118, n=29) | |
| Microsoft Surface Laptop Studio 2 RTX 4060 | |
| Microsoft Surface Laptop Studio i7 RTX 3050 Ti | |
| AIDA64 / CPU AES | |
| Asus Zenbook Pro 14 OLED UX6404VI | |
| Lenovo Yoga Pro 9-14IRP G8 | |
| Genomsnitt Intel Core i7-13700H (28769 - 151254, n=29) | |
| Lenovo Legion Slim 5 14APH8 | |
| Microsoft Surface Laptop Studio 2 RTX 4060 | |
| Genomsnitt av klass Multimedia (8171 - 126790, n=54, senaste 2 åren) | |
| Asus ZenBook Pro 14 Duo UX8402VV-P1021W | |
| Microsoft Surface Laptop Studio i7 RTX 3050 Ti | |
| AIDA64 / CPU ZLib | |
| Asus Zenbook Pro 14 OLED UX6404VI | |
| Lenovo Yoga Pro 9-14IRP G8 | |
| Lenovo Legion Slim 5 14APH8 | |
| Genomsnitt av klass Multimedia (143.8 - 2022, n=54, senaste 2 åren) | |
| Microsoft Surface Laptop Studio 2 RTX 4060 | |
| Genomsnitt Intel Core i7-13700H (389 - 1215, n=29) | |
| Asus ZenBook Pro 14 Duo UX8402VV-P1021W | |
| Microsoft Surface Laptop Studio i7 RTX 3050 Ti | |
| AIDA64 / FP64 Ray-Trace | |
| Lenovo Legion Slim 5 14APH8 | |
| Genomsnitt av klass Multimedia (1014 - 26875, n=54, senaste 2 åren) | |
| Lenovo Yoga Pro 9-14IRP G8 | |
| Asus Zenbook Pro 14 OLED UX6404VI | |
| Asus ZenBook Pro 14 Duo UX8402VV-P1021W | |
| Genomsnitt Intel Core i7-13700H (2540 - 10135, n=29) | |
| Microsoft Surface Laptop Studio 2 RTX 4060 | |
| Microsoft Surface Laptop Studio i7 RTX 3050 Ti | |
| AIDA64 / CPU PhotoWorxx | |
| Lenovo Yoga Pro 9-14IRP G8 | |
| Genomsnitt av klass Multimedia (8187 - 88154, n=54, senaste 2 åren) | |
| Microsoft Surface Laptop Studio 2 RTX 4060 | |
| Asus Zenbook Pro 14 OLED UX6404VI | |
| Asus ZenBook Pro 14 Duo UX8402VV-P1021W | |
| Genomsnitt Intel Core i7-13700H (12872 - 52727, n=29) | |
| Microsoft Surface Laptop Studio i7 RTX 3050 Ti | |
| Lenovo Legion Slim 5 14APH8 | |
Systemets prestanda
Surface Laptop Studio 2 är en mycket responsiv enhet, men det är knappast en överraskning med tanke på de kraftfulla komponenterna. Den presterar också bra i de syntetiska riktmärkena och vi märkte inga problem under vår granskningsperiod.
CrossMark: Overall | Productivity | Creativity | Responsiveness
| PCMark 10 / Score | |
| Asus ROG Zephyrus G14 GA402XY | |
| Lenovo Legion Slim 5 14APH8 | |
| Genomsnitt av klass Multimedia (4325 - 10386, n=52, senaste 2 åren) | |
| Asus ZenBook Pro 14 Duo UX8402VV-P1021W | |
| Asus Zenbook Pro 14 OLED UX6404VI | |
| Genomsnitt Intel Core i7-13700H, NVIDIA GeForce RTX 4060 Laptop GPU (7157 - 7661, n=5) | |
| Lenovo Yoga Pro 9-14IRP G8 | |
| Microsoft Surface Laptop Studio 2 RTX 4060 | |
| Microsoft Surface Laptop Studio i7 RTX 3050 Ti | |
| PCMark 10 / Essentials | |
| Asus ZenBook Pro 14 Duo UX8402VV-P1021W | |
| Lenovo Yoga Pro 9-14IRP G8 | |
| Lenovo Legion Slim 5 14APH8 | |
| Asus Zenbook Pro 14 OLED UX6404VI | |
| Genomsnitt Intel Core i7-13700H, NVIDIA GeForce RTX 4060 Laptop GPU (10179 - 11200, n=5) | |
| Microsoft Surface Laptop Studio 2 RTX 4060 | |
| Asus ROG Zephyrus G14 GA402XY | |
| Genomsnitt av klass Multimedia (8025 - 11664, n=51, senaste 2 åren) | |
| Microsoft Surface Laptop Studio i7 RTX 3050 Ti | |
| PCMark 10 / Productivity | |
| Genomsnitt av klass Multimedia (7323 - 18233, n=51, senaste 2 åren) | |
| Asus ROG Zephyrus G14 GA402XY | |
| Asus ZenBook Pro 14 Duo UX8402VV-P1021W | |
| Lenovo Legion Slim 5 14APH8 | |
| Asus Zenbook Pro 14 OLED UX6404VI | |
| Genomsnitt Intel Core i7-13700H, NVIDIA GeForce RTX 4060 Laptop GPU (8238 - 10249, n=5) | |
| Microsoft Surface Laptop Studio 2 RTX 4060 | |
| Lenovo Yoga Pro 9-14IRP G8 | |
| Microsoft Surface Laptop Studio i7 RTX 3050 Ti | |
| PCMark 10 / Digital Content Creation | |
| Asus ROG Zephyrus G14 GA402XY | |
| Lenovo Legion Slim 5 14APH8 | |
| Genomsnitt Intel Core i7-13700H, NVIDIA GeForce RTX 4060 Laptop GPU (10308 - 11862, n=5) | |
| Asus Zenbook Pro 14 OLED UX6404VI | |
| Lenovo Yoga Pro 9-14IRP G8 | |
| Microsoft Surface Laptop Studio 2 RTX 4060 | |
| Asus ZenBook Pro 14 Duo UX8402VV-P1021W | |
| Genomsnitt av klass Multimedia (3651 - 16240, n=51, senaste 2 åren) | |
| Microsoft Surface Laptop Studio i7 RTX 3050 Ti | |
| CrossMark / Overall | |
| Asus Zenbook Pro 14 OLED UX6404VI | |
| Genomsnitt av klass Multimedia (866 - 2728, n=60, senaste 2 åren) | |
| Asus ZenBook Pro 14 Duo UX8402VV-P1021W | |
| Lenovo Yoga Pro 9-14IRP G8 | |
| Lenovo Legion Slim 5 14APH8 | |
| Asus ROG Zephyrus G14 GA402XY | |
| Apple MacBook Pro 14 2023 M2 Pro | |
| Microsoft Surface Laptop Studio 2 RTX 4060 | |
| Genomsnitt Intel Core i7-13700H, NVIDIA GeForce RTX 4060 Laptop GPU (1629 - 1849, n=5) | |
| Microsoft Surface Laptop Studio i7 RTX 3050 Ti | |
| CrossMark / Productivity | |
| Lenovo Legion Slim 5 14APH8 | |
| Asus Zenbook Pro 14 OLED UX6404VI | |
| Asus ZenBook Pro 14 Duo UX8402VV-P1021W | |
| Genomsnitt av klass Multimedia (931 - 2489, n=60, senaste 2 åren) | |
| Asus ROG Zephyrus G14 GA402XY | |
| Lenovo Yoga Pro 9-14IRP G8 | |
| Genomsnitt Intel Core i7-13700H, NVIDIA GeForce RTX 4060 Laptop GPU (1561 - 1743, n=5) | |
| Microsoft Surface Laptop Studio 2 RTX 4060 | |
| Apple MacBook Pro 14 2023 M2 Pro | |
| Microsoft Surface Laptop Studio i7 RTX 3050 Ti | |
| CrossMark / Creativity | |
| Apple MacBook Pro 14 2023 M2 Pro | |
| Asus Zenbook Pro 14 OLED UX6404VI | |
| Genomsnitt av klass Multimedia (907 - 3465, n=60, senaste 2 åren) | |
| Lenovo Yoga Pro 9-14IRP G8 | |
| Asus ZenBook Pro 14 Duo UX8402VV-P1021W | |
| Asus ROG Zephyrus G14 GA402XY | |
| Microsoft Surface Laptop Studio 2 RTX 4060 | |
| Lenovo Legion Slim 5 14APH8 | |
| Genomsnitt Intel Core i7-13700H, NVIDIA GeForce RTX 4060 Laptop GPU (1691 - 2064, n=5) | |
| Microsoft Surface Laptop Studio i7 RTX 3050 Ti | |
| CrossMark / Responsiveness | |
| Lenovo Legion Slim 5 14APH8 | |
| Asus Zenbook Pro 14 OLED UX6404VI | |
| Asus ZenBook Pro 14 Duo UX8402VV-P1021W | |
| Lenovo Yoga Pro 9-14IRP G8 | |
| Genomsnitt av klass Multimedia (605 - 2024, n=60, senaste 2 åren) | |
| Genomsnitt Intel Core i7-13700H, NVIDIA GeForce RTX 4060 Laptop GPU (1381 - 1656, n=5) | |
| Asus ROG Zephyrus G14 GA402XY | |
| Microsoft Surface Laptop Studio 2 RTX 4060 | |
| Apple MacBook Pro 14 2023 M2 Pro | |
| Microsoft Surface Laptop Studio i7 RTX 3050 Ti | |
| PCMark 10 Score | 7351 poäng | |
Hjälp | ||
| AIDA64 / Memory Copy | |
| Genomsnitt av klass Multimedia (11299 - 132135, n=54, senaste 2 åren) | |
| Lenovo Yoga Pro 9-14IRP G8 | |
| Lenovo Legion Slim 5 14APH8 | |
| Microsoft Surface Laptop Studio 2 RTX 4060 | |
| Asus Zenbook Pro 14 OLED UX6404VI | |
| Genomsnitt Intel Core i7-13700H (24334 - 78081, n=29) | |
| Asus ZenBook Pro 14 Duo UX8402VV-P1021W | |
| Microsoft Surface Laptop Studio i7 RTX 3050 Ti | |
| AIDA64 / Memory Read | |
| Genomsnitt av klass Multimedia (11624 - 174586, n=54, senaste 2 åren) | |
| Lenovo Yoga Pro 9-14IRP G8 | |
| Asus Zenbook Pro 14 OLED UX6404VI | |
| Genomsnitt Intel Core i7-13700H (23681 - 79656, n=29) | |
| Microsoft Surface Laptop Studio 2 RTX 4060 | |
| Asus ZenBook Pro 14 Duo UX8402VV-P1021W | |
| Microsoft Surface Laptop Studio i7 RTX 3050 Ti | |
| Lenovo Legion Slim 5 14APH8 | |
| AIDA64 / Memory Write | |
| Lenovo Legion Slim 5 14APH8 | |
| Lenovo Yoga Pro 9-14IRP G8 | |
| Genomsnitt av klass Multimedia (11755 - 134998, n=54, senaste 2 åren) | |
| Microsoft Surface Laptop Studio 2 RTX 4060 | |
| Asus ZenBook Pro 14 Duo UX8402VV-P1021W | |
| Genomsnitt Intel Core i7-13700H (22986 - 99898, n=29) | |
| Asus Zenbook Pro 14 OLED UX6404VI | |
| Microsoft Surface Laptop Studio i7 RTX 3050 Ti | |
| AIDA64 / Memory Latency | |
| Genomsnitt av klass Multimedia (7 - 535, n=53, senaste 2 åren) | |
| Lenovo Legion Slim 5 14APH8 | |
| Microsoft Surface Laptop Studio i7 RTX 3050 Ti | |
| Genomsnitt Intel Core i7-13700H (82.4 - 136.8, n=29) | |
| Lenovo Yoga Pro 9-14IRP G8 | |
| Asus ZenBook Pro 14 Duo UX8402VV-P1021W | |
| Microsoft Surface Laptop Studio 2 RTX 4060 | |
| Asus Zenbook Pro 14 OLED UX6404VI | |
* ... mindre är bättre
DPC-fördröjning
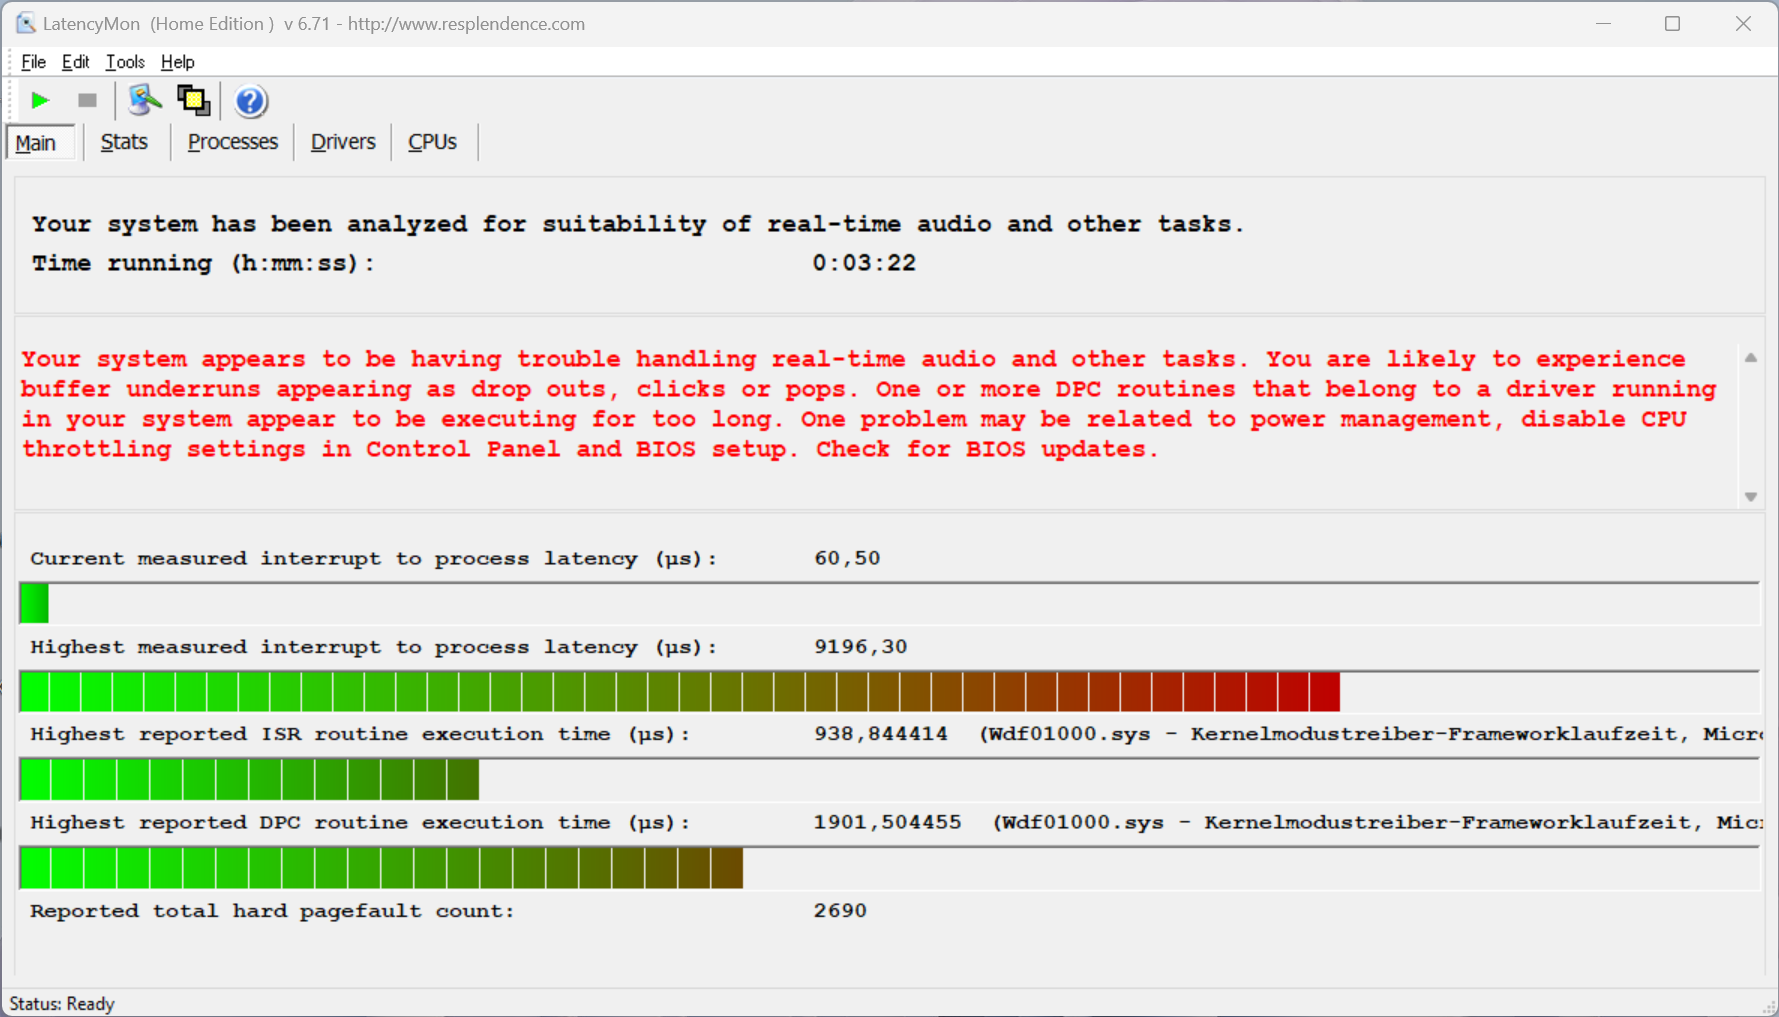
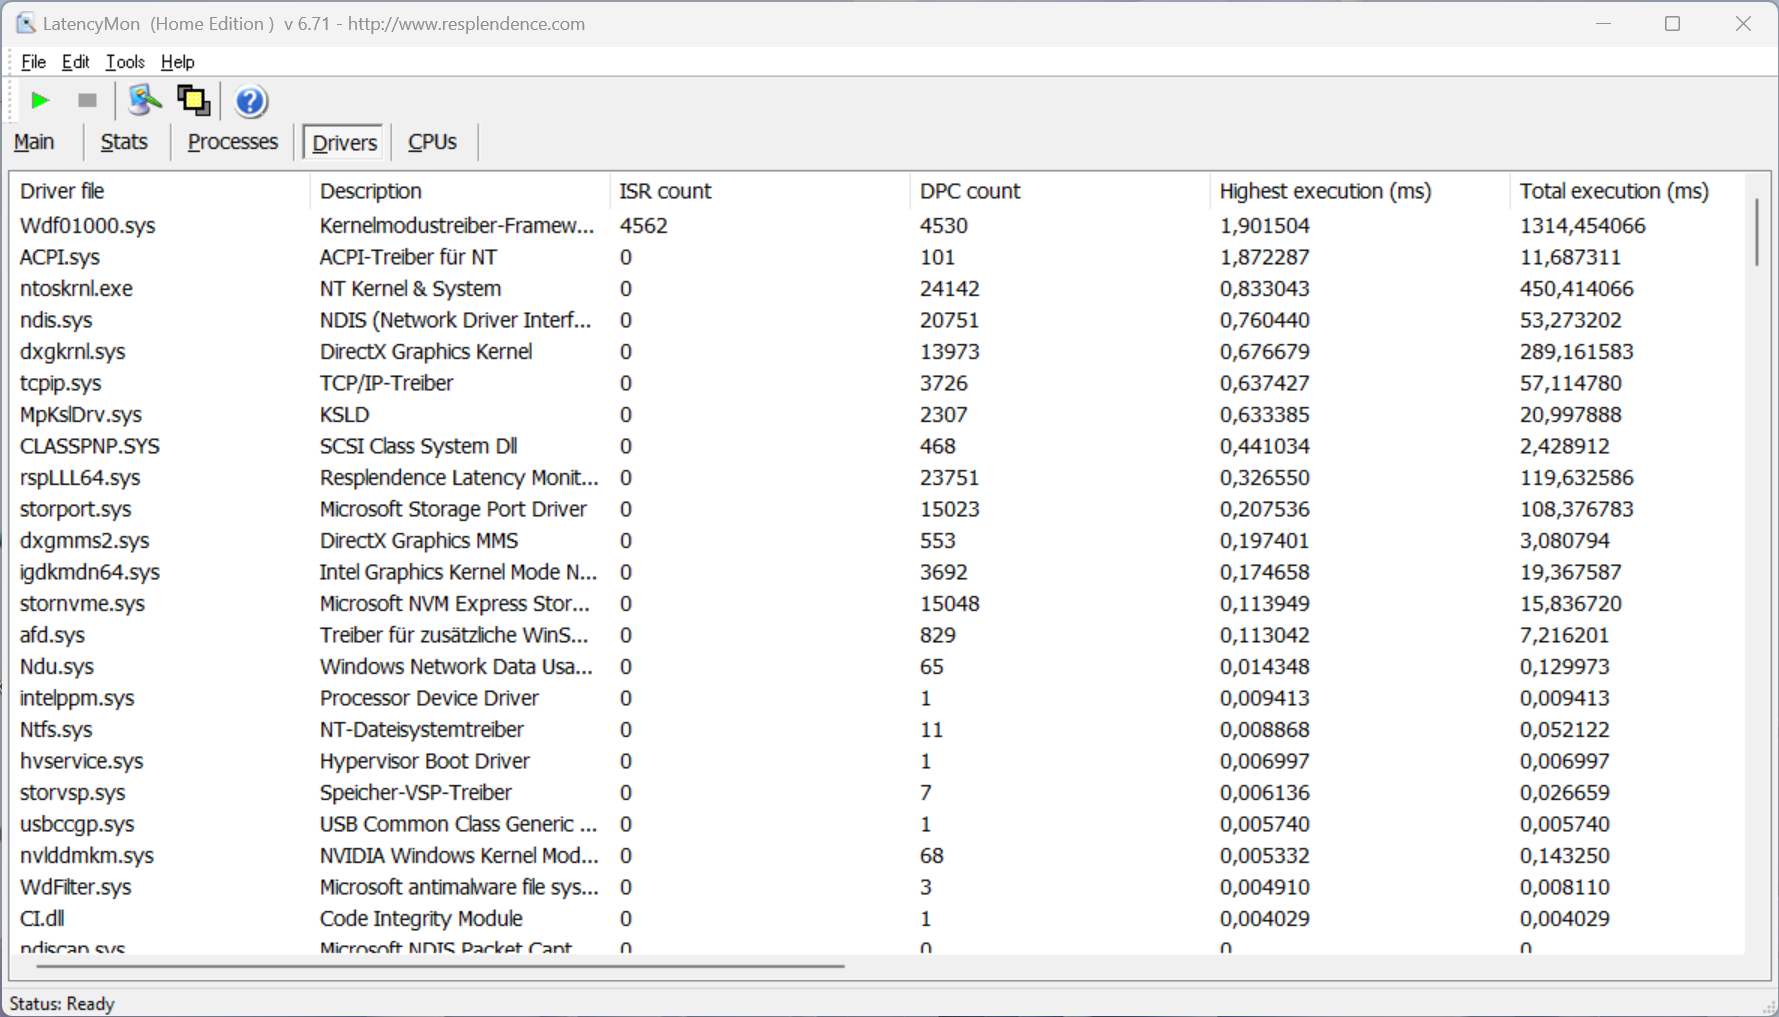
Vårt standardiserade latens-test (webbsurfning, 4K YouTube-uppspelning, CPU-belastning) visar massiva begränsningar för granskningsenheten med den aktuella BIOS-versionen om du vill använda ljudapplikationer i realtid.
| DPC Latencies / LatencyMon - interrupt to process latency (max), Web, Youtube, Prime95 | |
| Microsoft Surface Laptop Studio 2 RTX 4060 | |
| Lenovo Legion Slim 5 14APH8 | |
| Asus Zenbook Pro 14 OLED UX6404VI | |
| Asus ZenBook Pro 14 Duo UX8402VV-P1021W | |
| Lenovo Yoga Pro 9-14IRP G8 | |
| Asus ROG Zephyrus G14 GA402XY | |
| Microsoft Surface Laptop Studio i7 RTX 3050 Ti | |
* ... mindre är bättre
Lagringsenheter
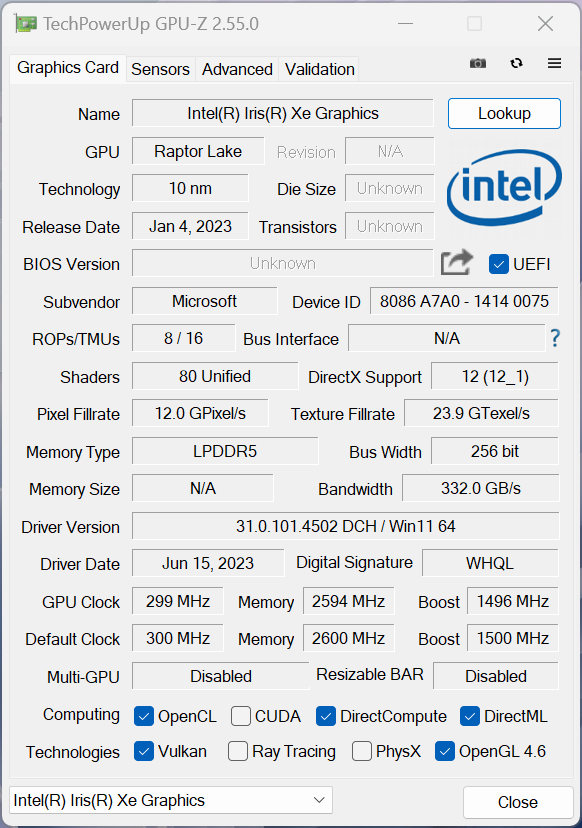
Microsoft använder M.2-2280 PCIe-4.0 SSD-enheter för Surface Laptop Studio 2. Vår enhet är utrustad med 1 TB-versionen av Kioxia XG8, som lämnar ett gott intryck med överföringshastigheter på upp till 7 GB/s. Prestandan är också stabil under längre arbetsbelastningar. Du kan använda 863 GB för dina egna appar och filer efter den första installationen. Fler SSD-riktmärken listas här.

* ... mindre är bättre
Disk Throttling: DiskSpd Read Loop, Queue Depth 8
GPU-prestanda - GeForce RTX 4060 Laptop
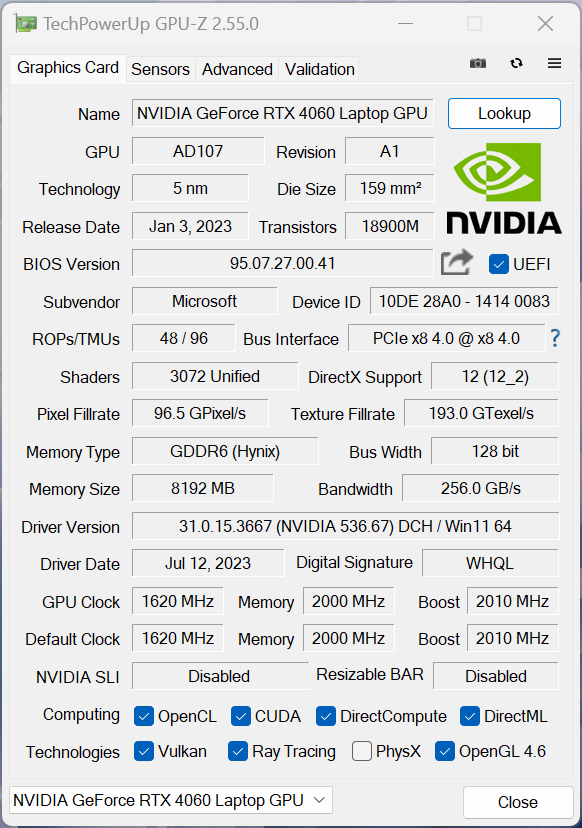
Lätta arbetsbelastningar hanteras av den integreradeIris Xe Graphics G7i processorn, men systemet växlar automatiskt till NvidiaGeForce RTX 4060 bärbar datorför mer krävande appar som spel. Grafikväxlingen hanteras av den vanliga Optimus-tekniken, vilket är bra för en bärbar multimediadator. Det är 80W-varianten (inklusive 20W Dynamic Boost från CPU:n) av RTX 4060 laptop och prestandan är mycket högre jämfört med den gamlaGeForce RTX 3050 Tifrån första generationens Studio. RTX 4060 är också 18 % snabbare änM2 Pro GPUi MacBook Pro 14 i WildLife Extreme Unlimited-testet.
Du bör dock veta att detta inte är den snabbaste RTX 4060 Laptop ochLegion Slim 5 14är cirka 12 % snabbare i Time Spy -testet. GPU-prestandan är inte heller stabil och sjunker från 80 till bara 68 watt efter ett par minuter. Det motsvarande stresstestet på Time Spy klaras därför inte med 72,9 %. Batteriets prestanda är begränsad till 40 watt, vilket resulterar i en prestandaförlust på ~20 %. Fler GPU-riktmärken finns tillgängliga i vårt teknikavsnitt.
| 3DMark 11 Performance | 25182 poäng | |
| 3DMark Fire Strike Score | 17076 poäng | |
| 3DMark Time Spy Score | 9541 poäng | |
Hjälp | ||
| Blender / v3.3 Classroom OPTIX/RTX | |
| Genomsnitt av klass Multimedia (12 - 105, n=22, senaste 2 åren) | |
| Lenovo Yoga Pro 9-14IRP G8 | |
| Asus ZenBook Pro 14 Duo UX8402VV-P1021W | |
| Microsoft Surface Laptop Studio 2 RTX 4060 | |
| Asus Zenbook Pro 14 OLED UX6404VI | |
| Genomsnitt NVIDIA GeForce RTX 4060 Laptop GPU (19 - 28, n=53) | |
| Lenovo Legion Slim 5 14APH8 | |
| Asus ROG Zephyrus G14 GA402XY | |
| Blender / v3.3 Classroom CUDA | |
| Genomsnitt av klass Multimedia (20 - 186, n=22, senaste 2 åren) | |
| Asus ZenBook Pro 14 Duo UX8402VV-P1021W | |
| Lenovo Yoga Pro 9-14IRP G8 | |
| Genomsnitt NVIDIA GeForce RTX 4060 Laptop GPU (39 - 53, n=53) | |
| Microsoft Surface Laptop Studio 2 RTX 4060 | |
| Lenovo Legion Slim 5 14APH8 | |
| Asus Zenbook Pro 14 OLED UX6404VI | |
| Asus ROG Zephyrus G14 GA402XY | |
| Blender / v3.3 Classroom METAL | |
| Apple MacBook Pro 14 2023 M2 Pro | |
| Genomsnitt av klass Multimedia (17.8 - 68, n=5, senaste 2 åren) | |
| Blender / v3.3 Classroom CPU | |
| Genomsnitt av klass Multimedia (134.5 - 1042, n=62, senaste 2 åren) | |
| Microsoft Surface Laptop Studio 2 RTX 4060 | |
| Lenovo Yoga Pro 9-14IRP G8 | |
| Apple MacBook Pro 14 2023 M2 Pro | |
| Asus ZenBook Pro 14 Duo UX8402VV-P1021W | |
| Genomsnitt NVIDIA GeForce RTX 4060 Laptop GPU (189 - 452, n=53) | |
| Asus Zenbook Pro 14 OLED UX6404VI | |
| Lenovo Legion Slim 5 14APH8 | |
| Asus ROG Zephyrus G14 GA402XY | |
* ... mindre är bättre
Spelprestanda
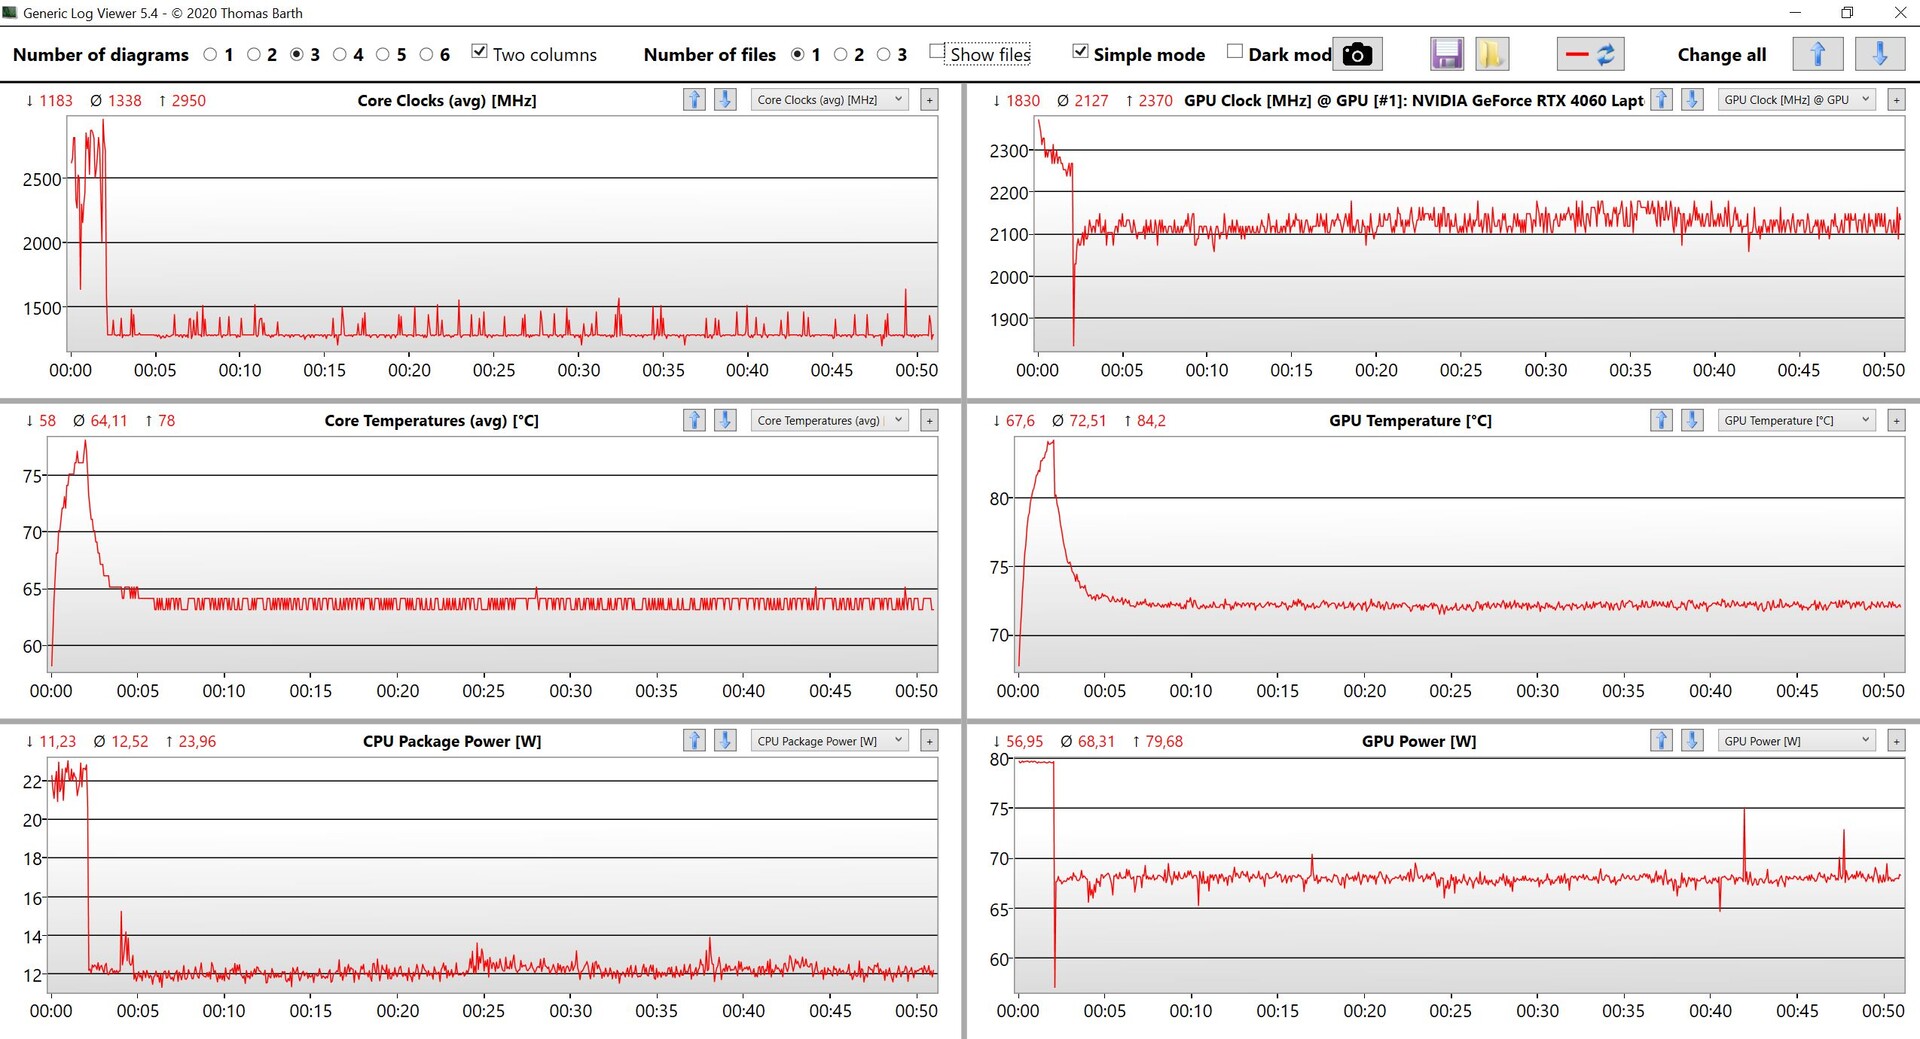
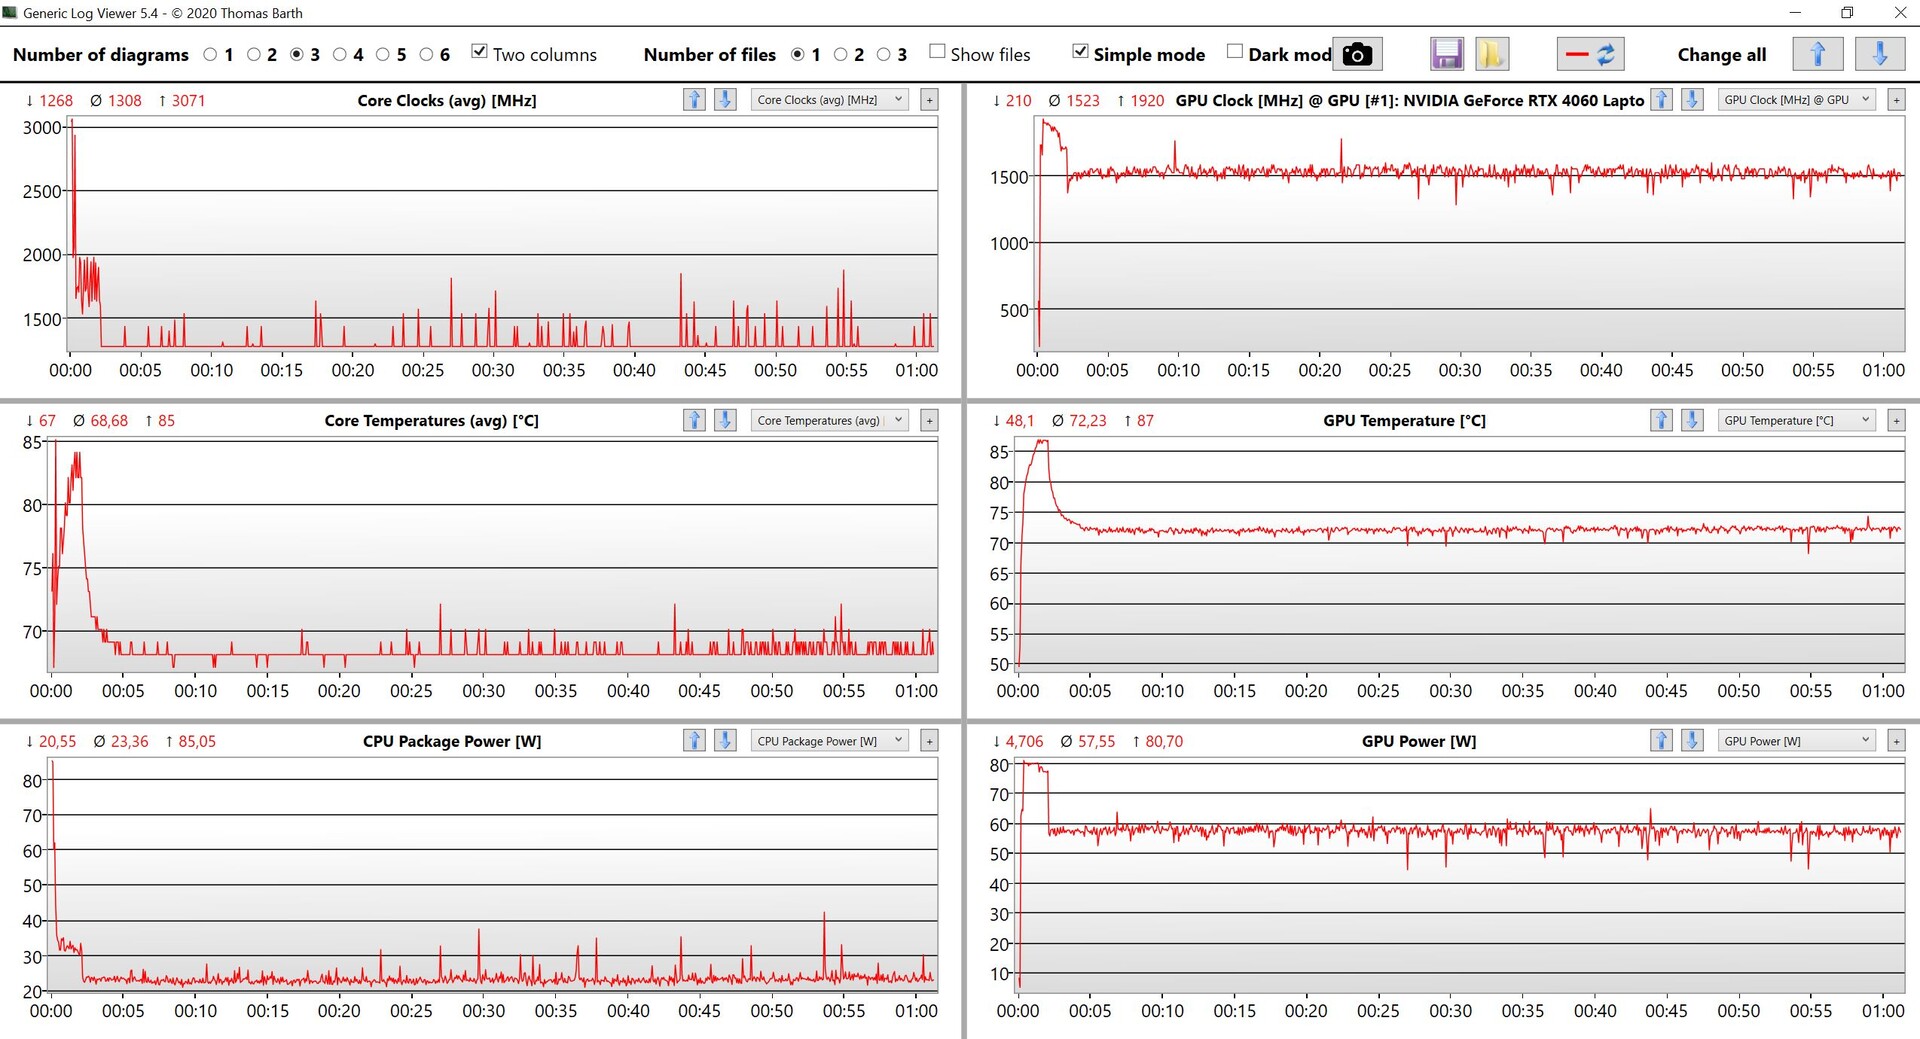
Spelprestandan är återigen mycket bättre jämfört med den gamlaRTX 3050 Ti(50% snabbare i våra standardspelstester), men de direkta konkurrenterna är vanligtvis snabbare. Vår Witcher 3 loop visar också att GPU-prestandan inte är stabil och att TGP på 80 watt inte kan upprätthållas. Den sjunker under 70 watt efter några minuter, vilket också syns tydligt i datagraferna. Sammantaget kan du fortfarande spela moderna spel med de högsta inställningarna i 1080p. Fler riktmärken för spel listas här.
Witcher 3 FPS Chart
| låg | med. | hög | ultra | |
|---|---|---|---|---|
| GTA V (2015) | 180 | 172.2 | 160.4 | 94.6 |
| The Witcher 3 (2015) | 181 | 81.4 | ||
| Dota 2 Reborn (2015) | 168.7 | 153.7 | 145.4 | 135 |
| Final Fantasy XV Benchmark (2018) | 109.9 | 84.2 | ||
| X-Plane 11.11 (2018) | 138.9 | 107 | 86.9 | |
| Far Cry 5 (2018) | 137 | 113 | 104 | 99 |
| Strange Brigade (2018) | 372 | 195.4 | 199.4 | 169.3 |
| Shadow of the Tomb Raider (2018) | 122 | 109 | ||
| F1 2021 (2021) | 298 | 249 | 208 | 113.2 |
| Cyberpunk 2077 1.6 (2022) | 95 | 82 | 72 | 68 |
| F1 22 (2022) | 198.3 | 199.2 | 148.7 | 56.7 |
| Call of Duty Modern Warfare 2 2022 (2022) | 88 | 80 | ||
| F1 23 (2023) | 177.9 | 180.7 | 143.7 | 43.8 |
| Cyberpunk 2077 (2023) | 67.11 | 60.59 |
Utsläpp - bullrigare fläktar
Buller från systemet
Precis som den tidigare modellen är den nya Surface Laptop Studio vanligtvis tyst vid lätta arbetsbelastningar, åtminstone när det gäller fläktljud. Vår testenhet led av nästan konstanta elektroniska ljud (sprakande). Fläktarna hörs mycket snabbt när du börjar belasta CPU:n och särskilt GPU:n och det totala fläktljudet är högre jämfört med den gamla modellen. Vi uppmätte nästan 52 dB(A) under spel och vårt stresstest, vilket inte är bra med tanke på de genomsnittliga prestandasiffrorna. De två mer effektiva profilerna är tystare med upp till 41,4 respektive 42,8 dB(A). Vi noterade också att spolen gnisslade i vissa spel.
Ljudnivå
| Låg belastning |
| 23.9 / 24.4 / 26.9 dB(A) |
| Hög belastning |
| 48.5 / 51.8 dB(A) |
 | ||
30 dB tyst 40 dB(A) hörbar 50 dB(A) högt ljud |
||
min: | ||
| Microsoft Surface Laptop Studio 2 RTX 4060 GeForce RTX 4060 Laptop GPU, i7-13700H, Kioxia XG8 KXG80ZNV1T02 | Apple MacBook Pro 14 2023 M2 Pro M2 Pro 19-Core GPU, M2 Pro, Apple SSD AP2048Z | Lenovo Yoga Pro 9-14IRP G8 GeForce RTX 4050 Laptop GPU, i7-13705H, Samsung PM9A1 MZVL21T0HCLR | Asus Zenbook Pro 14 OLED UX6404VI GeForce RTX 4070 Laptop GPU, i9-13900H, Micron 3400 2TB MTFDKBA2T0TFH | Asus ZenBook Pro 14 Duo UX8402VV-P1021W GeForce RTX 4060 Laptop GPU, i9-13900H, Samsung PM9A1 MZVL22T0HBLB | Asus ROG Zephyrus G14 GA402XY GeForce RTX 4090 Laptop GPU, R9 7940HS, Samsung PM9A1 MZVL21T0HCLR | Lenovo Legion Slim 5 14APH8 GeForce RTX 4060 Laptop GPU, R7 7840HS, SK Hynix HFS001TEJ9X115N | Microsoft Surface Laptop Studio i7 RTX 3050 Ti GeForce RTX 3050 Ti Laptop GPU, i7-11370H, SK Hynix PC711 1TB HFS001TDE9X084N | |
|---|---|---|---|---|---|---|---|---|
| Noise | 13% | -1% | 8% | -13% | -3% | -1% | 8% | |
| av / miljö * (dB) | 23.9 | 23.9 -0% | 24.8 -4% | 23.3 3% | 25.2 -5% | 23.3 3% | 22.8 5% | 24.7 -3% |
| Idle Minimum * (dB) | 23.9 | 23.9 -0% | 24.8 -4% | 23.3 3% | 25.2 -5% | 23.6 1% | 22.8 5% | 24.7 -3% |
| Idle Average * (dB) | 24.4 | 23.9 2% | 24.8 -2% | 23.3 5% | 25.2 -3% | 23.6 3% | 27.3 -12% | 24.7 -1% |
| Idle Maximum * (dB) | 26.9 | 23.9 11% | 24.8 8% | 23.3 13% | 32.5 -21% | 33 -23% | 30.7 -14% | 24.7 8% |
| Load Average * (dB) | 48.5 | 26 46% | 47.4 2% | 39.3 19% | 59.7 -23% | 49.5 -2% | 41.6 14% | 33.2 32% |
| Witcher 3 ultra * (dB) | 51.8 | 52.9 -2% | 48.8 6% | 52.2 -1% | 52.8 -2% | 44.5 14% | ||
| Load Maximum * (dB) | 51.8 | 43.2 17% | 52.9 -2% | 48.8 6% | 60.9 -18% | 52.2 -1% | 52.6 -2% | 46.7 10% |
* ... mindre är bättre
Temperatur
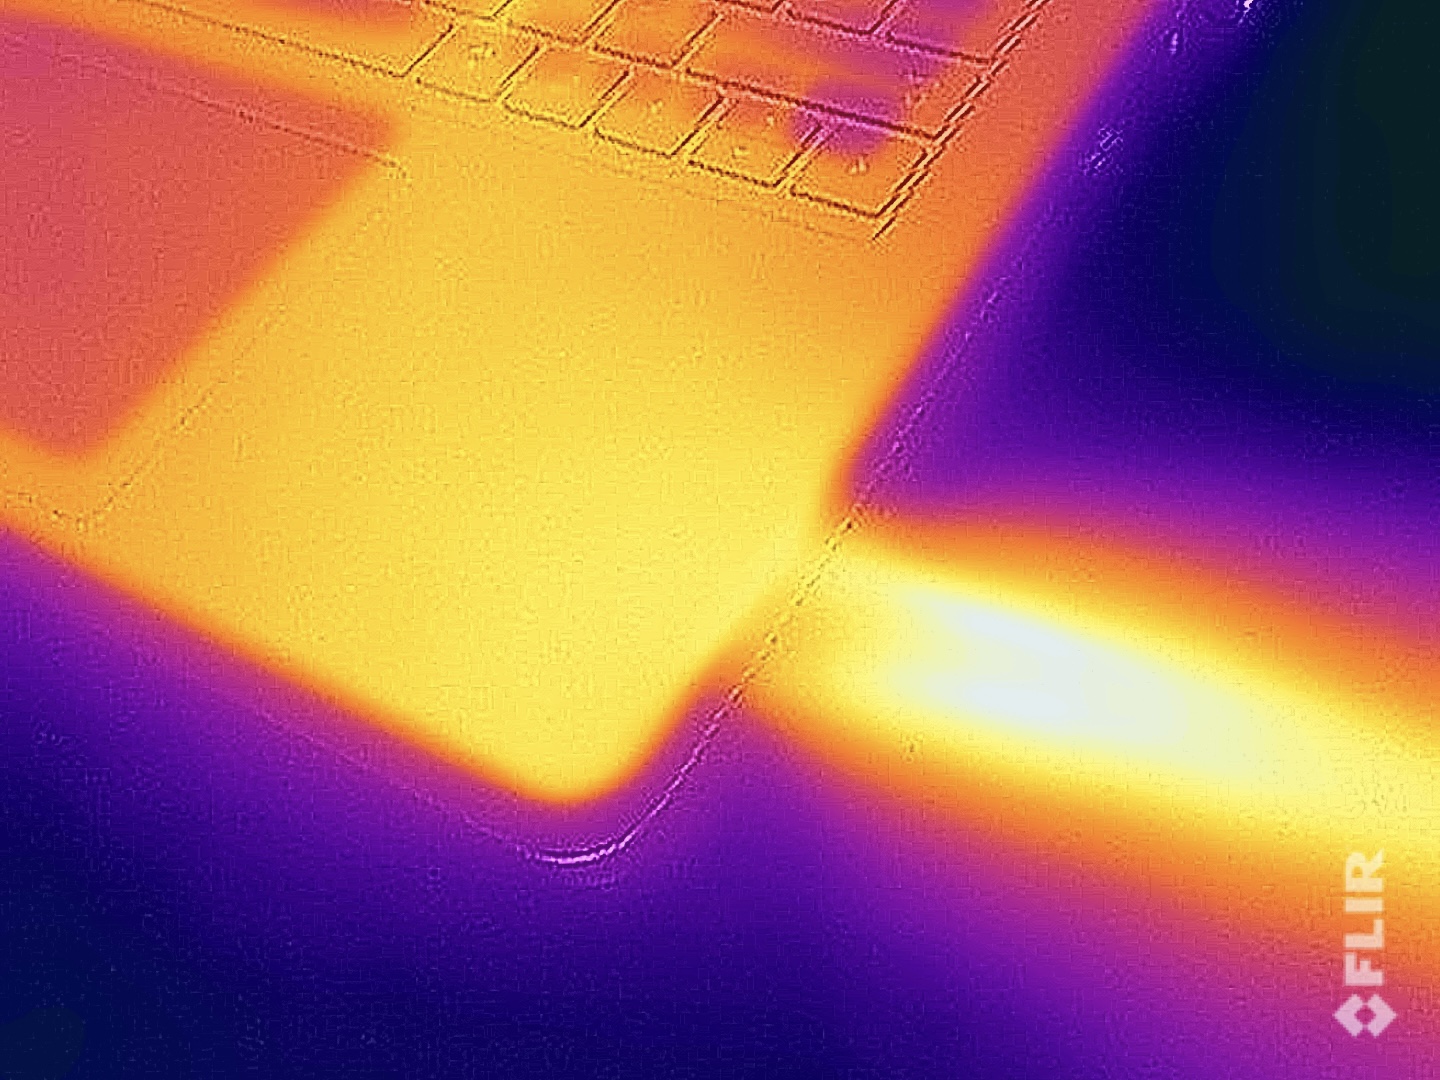
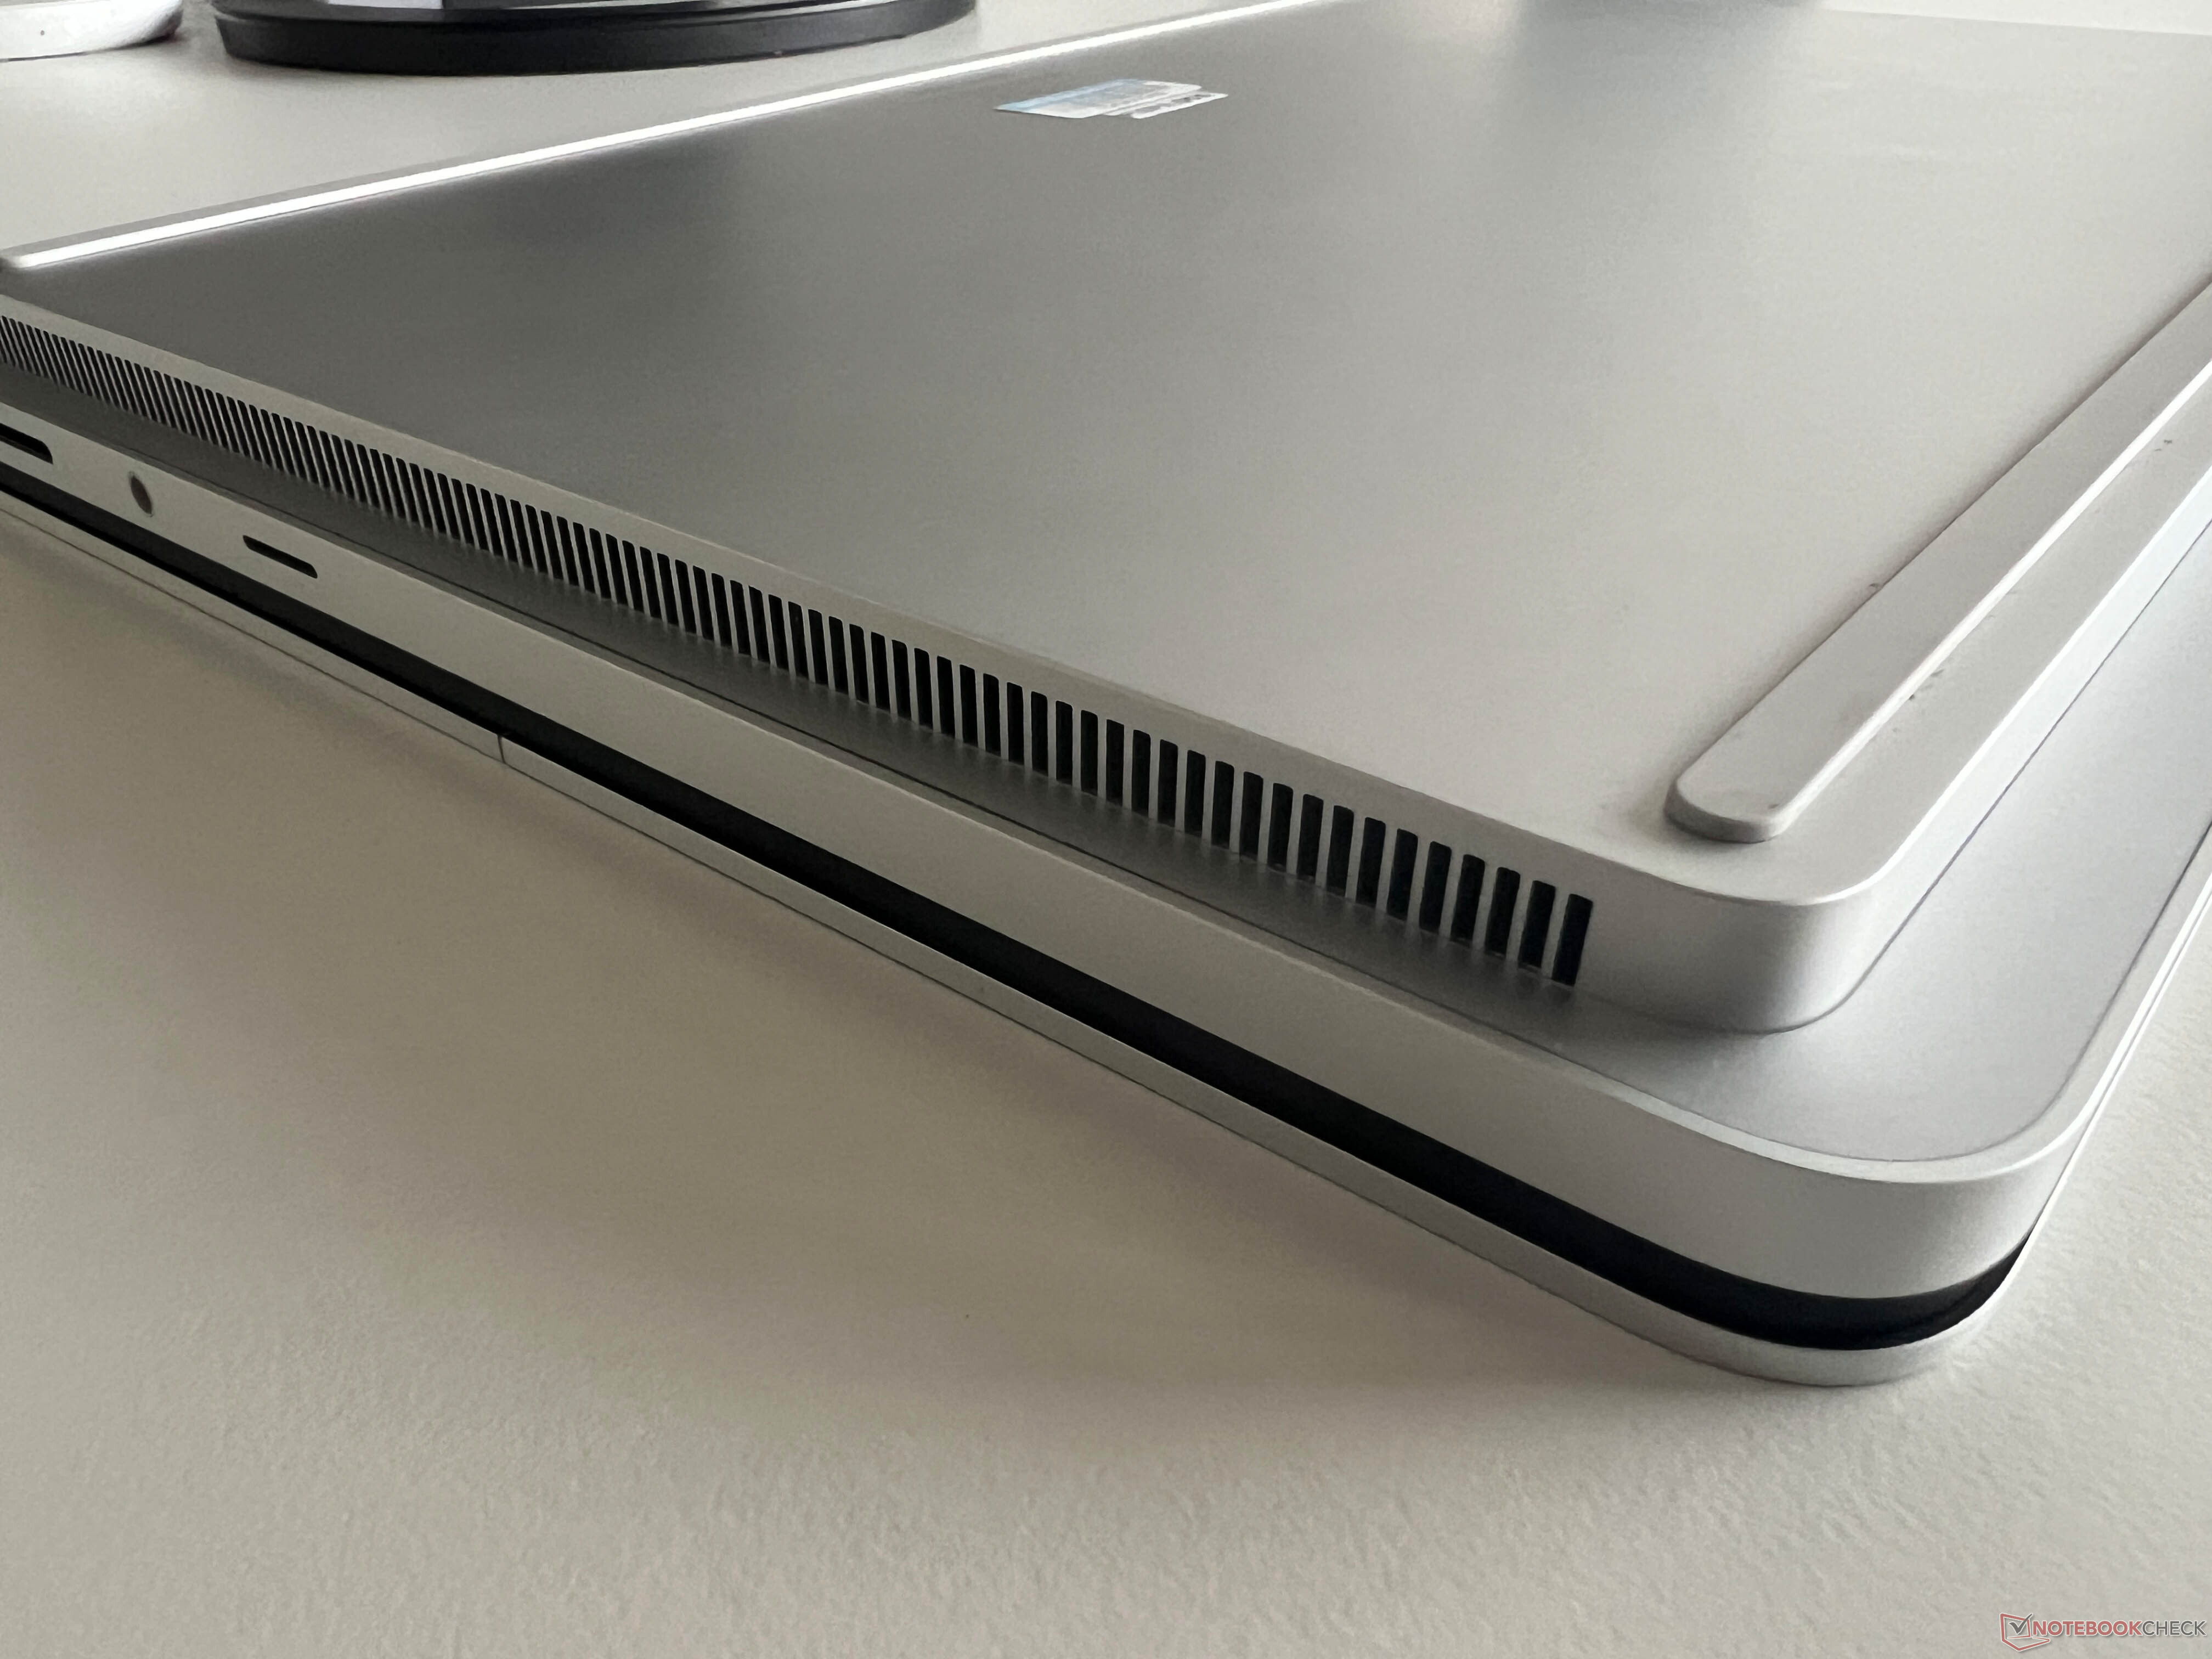
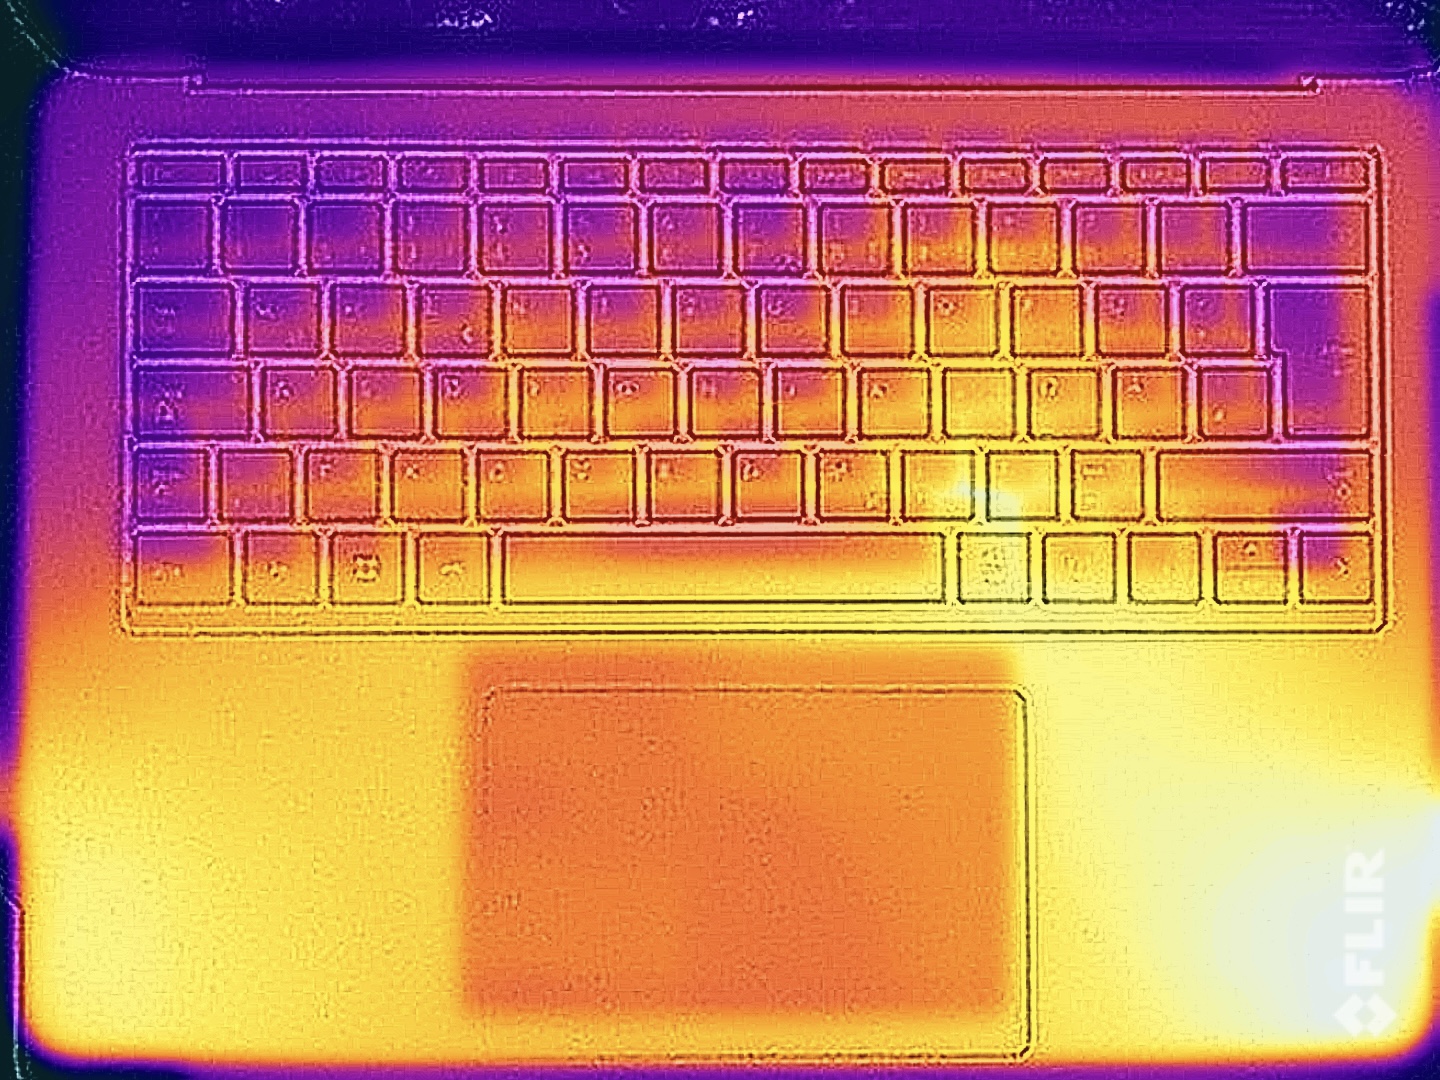
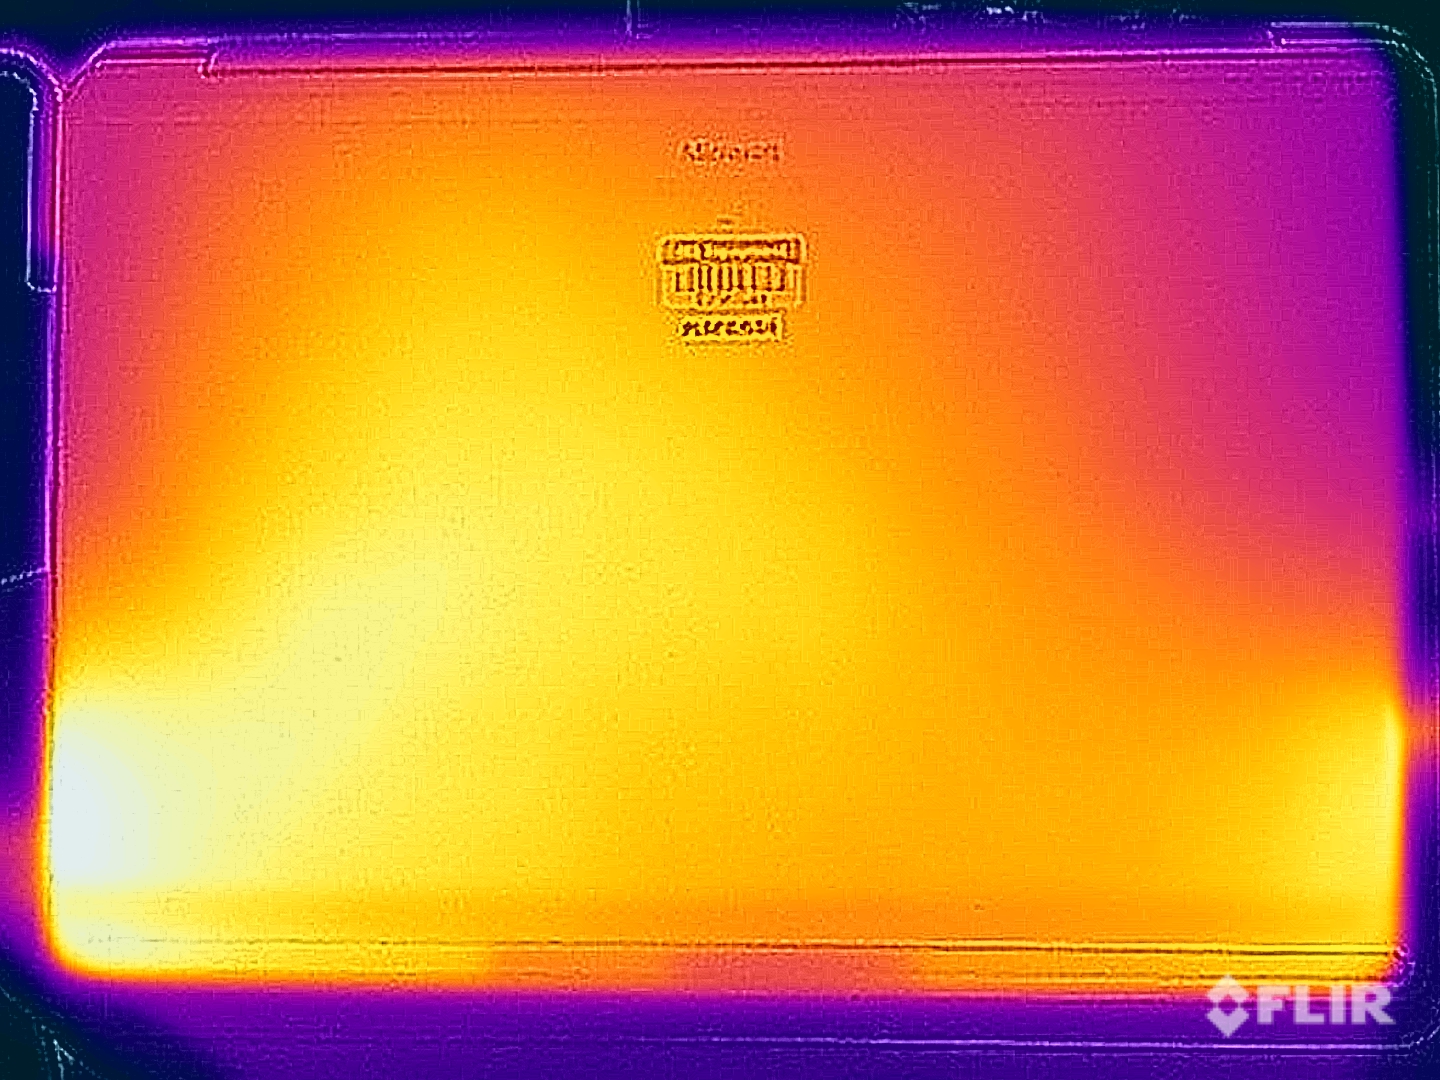
Våra temperaturmätningar avslöjar problemet med kyllösningen. Allt är bra under lätta arbetsbelastningar, men handflatans stödområde värms snabbt upp under belastning eftersom fläktarna är placerade på framsidan av basenheten. Vi känner redan till detta beteende från den gamla modellen, men temperaturerna på Surface Laptop Studio 2 är högre. Vi uppmätte cirka 40 °C på handflatans stödyta, vilket snabbt blir obekvämt i kombination med metallytorna. Det hjälper inte direkt att resten av chassit förblir svalare. Placeringen av fläktutblåsen i det främre området på de två sidorna är ett annat problem, särskilt när du använder en extern mus.
Vårt stresstest med kombinerad CPU/GPU-belastning visar att CPU-prestandan sjunker avsevärt efter några minuter och planar ut på bara 23 watt. GPU:n gynnas av systemet med en förbrukning på cirka 58 watt.
(±) Den maximala temperaturen på ovansidan är 40.4 °C / 105 F, jämfört med genomsnittet av 36.8 °C / 98 F , allt från 21 till 71 °C för klassen Multimedia.
(±) Botten värms upp till maximalt 42.2 °C / 108 F, jämfört med genomsnittet av 39.1 °C / 102 F
(+) Vid tomgångsbruk är medeltemperaturen för ovansidan 26.4 °C / 80 F, jämfört med enhetsgenomsnittet på 31.3 °C / ### class_avg_f### F.
(±) När du spelar The Witcher 3 är medeltemperaturen för ovansidan 37 °C / 99 F, jämfört med enhetsgenomsnittet på 31.3 °C / ## #class_avg_f### F.
(-) Handledsstöden och pekplattan kan bli väldigt varma vid beröring med maximalt 40.4 °C / 104.7 F.
(-) Medeltemperaturen för handledsstödsområdet på liknande enheter var 28.7 °C / 83.7 F (-11.7 °C / -21 F).
| Microsoft Surface Laptop Studio 2 RTX 4060 Intel Core i7-13700H, NVIDIA GeForce RTX 4060 Laptop GPU | Apple MacBook Pro 14 2023 M2 Pro Apple M2 Pro, Apple M2 Pro 19-Core GPU | Lenovo Yoga Pro 9-14IRP G8 Intel Core i7-13705H, NVIDIA GeForce RTX 4050 Laptop GPU | Asus Zenbook Pro 14 OLED UX6404VI Intel Core i9-13900H, NVIDIA GeForce RTX 4070 Laptop GPU | Asus ZenBook Pro 14 Duo UX8402VV-P1021W Intel Core i9-13900H, NVIDIA GeForce RTX 4060 Laptop GPU | Asus ROG Zephyrus G14 GA402XY AMD Ryzen 9 7940HS, NVIDIA GeForce RTX 4090 Laptop GPU | Lenovo Legion Slim 5 14APH8 AMD Ryzen 7 7840HS, NVIDIA GeForce RTX 4060 Laptop GPU | Microsoft Surface Laptop Studio i7 RTX 3050 Ti Intel Core i7-11370H, NVIDIA GeForce RTX 3050 Ti Laptop GPU | |
|---|---|---|---|---|---|---|---|---|
| Heat | 7% | -12% | -9% | -11% | -7% | -8% | 7% | |
| Maximum Upper Side * (°C) | 40.4 | 46.9 -16% | 41 -1% | 40.6 -0% | 37.1 8% | 47 -16% | 40.4 -0% | 42.3 -5% |
| Maximum Bottom * (°C) | 42.2 | 41.7 1% | 56.7 -34% | 49.5 -17% | 49.4 -17% | 46.5 -10% | 49.4 -17% | 38.2 9% |
| Idle Upper Side * (°C) | 26.6 | 21.4 20% | 27.4 -3% | 28.2 -6% | 30 -13% | 25.9 3% | 28.2 -6% | 23.4 12% |
| Idle Bottom * (°C) | 27 | 21.4 21% | 29.1 -8% | 30.6 -13% | 32.4 -20% | 28 -4% | 29.8 -10% | 23.5 13% |
* ... mindre är bättre
Högtalare
Högtalarna är lite sämre jämfört med förra årets modell enligt vår ljudanalys. Den maximala volymen är något svagare och basen är inte lika kraftfull. Rivaler som Lenovo Yoga Pro 9i 14 ochApple MacBook Pro 14har en liten fördel, men du kommer knappast att bli besviken över ljudsystemet utan en direkt jämförelse.
Microsoft Surface Laptop Studio 2 RTX 4060 ljudanalys
(±) | högtalarljudstyrkan är genomsnittlig men bra (81.8 dB)
Bas 100 - 315 Hz
(±) | reducerad bas - i genomsnitt 12% lägre än medianen
(±) | linjäriteten för basen är genomsnittlig (10% delta till föregående frekvens)
Mellan 400 - 2000 Hz
(±) | högre mellan - i genomsnitt 6.1% högre än median
(+) | mids är linjära (2.3% delta till föregående frekvens)
Högsta 2 - 16 kHz
(+) | balanserade toppar - endast 2.3% från medianen
(+) | toppar är linjära (4.1% delta till föregående frekvens)
Totalt 100 - 16 000 Hz
(+) | det totala ljudet är linjärt (13.9% skillnad mot median)
Jämfört med samma klass
» 31% av alla testade enheter i den här klassen var bättre, 4% liknande, 65% sämre
» Den bästa hade ett delta på 5%, genomsnittet var 17%, sämst var 45%
Jämfört med alla testade enheter
» 16% av alla testade enheter var bättre, 4% liknande, 80% sämre
» Den bästa hade ett delta på 4%, genomsnittet var 23%, sämst var 134%
Apple MacBook Pro 14 2023 M2 Pro ljudanalys
(+) | högtalare kan spela relativt högt (84.3 dB)
Bas 100 - 315 Hz
(+) | bra bas - bara 3.8% från medianen
(+) | basen är linjär (6.9% delta till föregående frekvens)
Mellan 400 - 2000 Hz
(+) | balanserad mellan - endast 2.1% från medianen
(+) | mids är linjära (2.2% delta till föregående frekvens)
Högsta 2 - 16 kHz
(+) | balanserade toppar - endast 2.7% från medianen
(+) | toppar är linjära (4.8% delta till föregående frekvens)
Totalt 100 - 16 000 Hz
(+) | det totala ljudet är linjärt (6% skillnad mot median)
Jämfört med samma klass
» 3% av alla testade enheter i den här klassen var bättre, 0% liknande, 97% sämre
» Den bästa hade ett delta på 5%, genomsnittet var 17%, sämst var 45%
Jämfört med alla testade enheter
» 0% av alla testade enheter var bättre, 0% liknande, 100% sämre
» Den bästa hade ett delta på 4%, genomsnittet var 23%, sämst var 134%
Lenovo Yoga Pro 9-14IRP G8 ljudanalys
(±) | högtalarljudstyrkan är genomsnittlig men bra (81.8 dB)
Bas 100 - 315 Hz
(±) | reducerad bas - i genomsnitt 5.9% lägre än medianen
(±) | linjäriteten för basen är genomsnittlig (7.8% delta till föregående frekvens)
Mellan 400 - 2000 Hz
(+) | balanserad mellan - endast 2.3% från medianen
(+) | mids är linjära (3.2% delta till föregående frekvens)
Högsta 2 - 16 kHz
(+) | balanserade toppar - endast 2.5% från medianen
(+) | toppar är linjära (3.4% delta till föregående frekvens)
Totalt 100 - 16 000 Hz
(+) | det totala ljudet är linjärt (7.3% skillnad mot median)
Jämfört med samma klass
» 6% av alla testade enheter i den här klassen var bättre, 1% liknande, 94% sämre
» Den bästa hade ett delta på 5%, genomsnittet var 17%, sämst var 45%
Jämfört med alla testade enheter
» 1% av alla testade enheter var bättre, 0% liknande, 99% sämre
» Den bästa hade ett delta på 4%, genomsnittet var 23%, sämst var 134%
Energihantering - Hyfsad uthållighet med litet batteri
Strömförbrukning
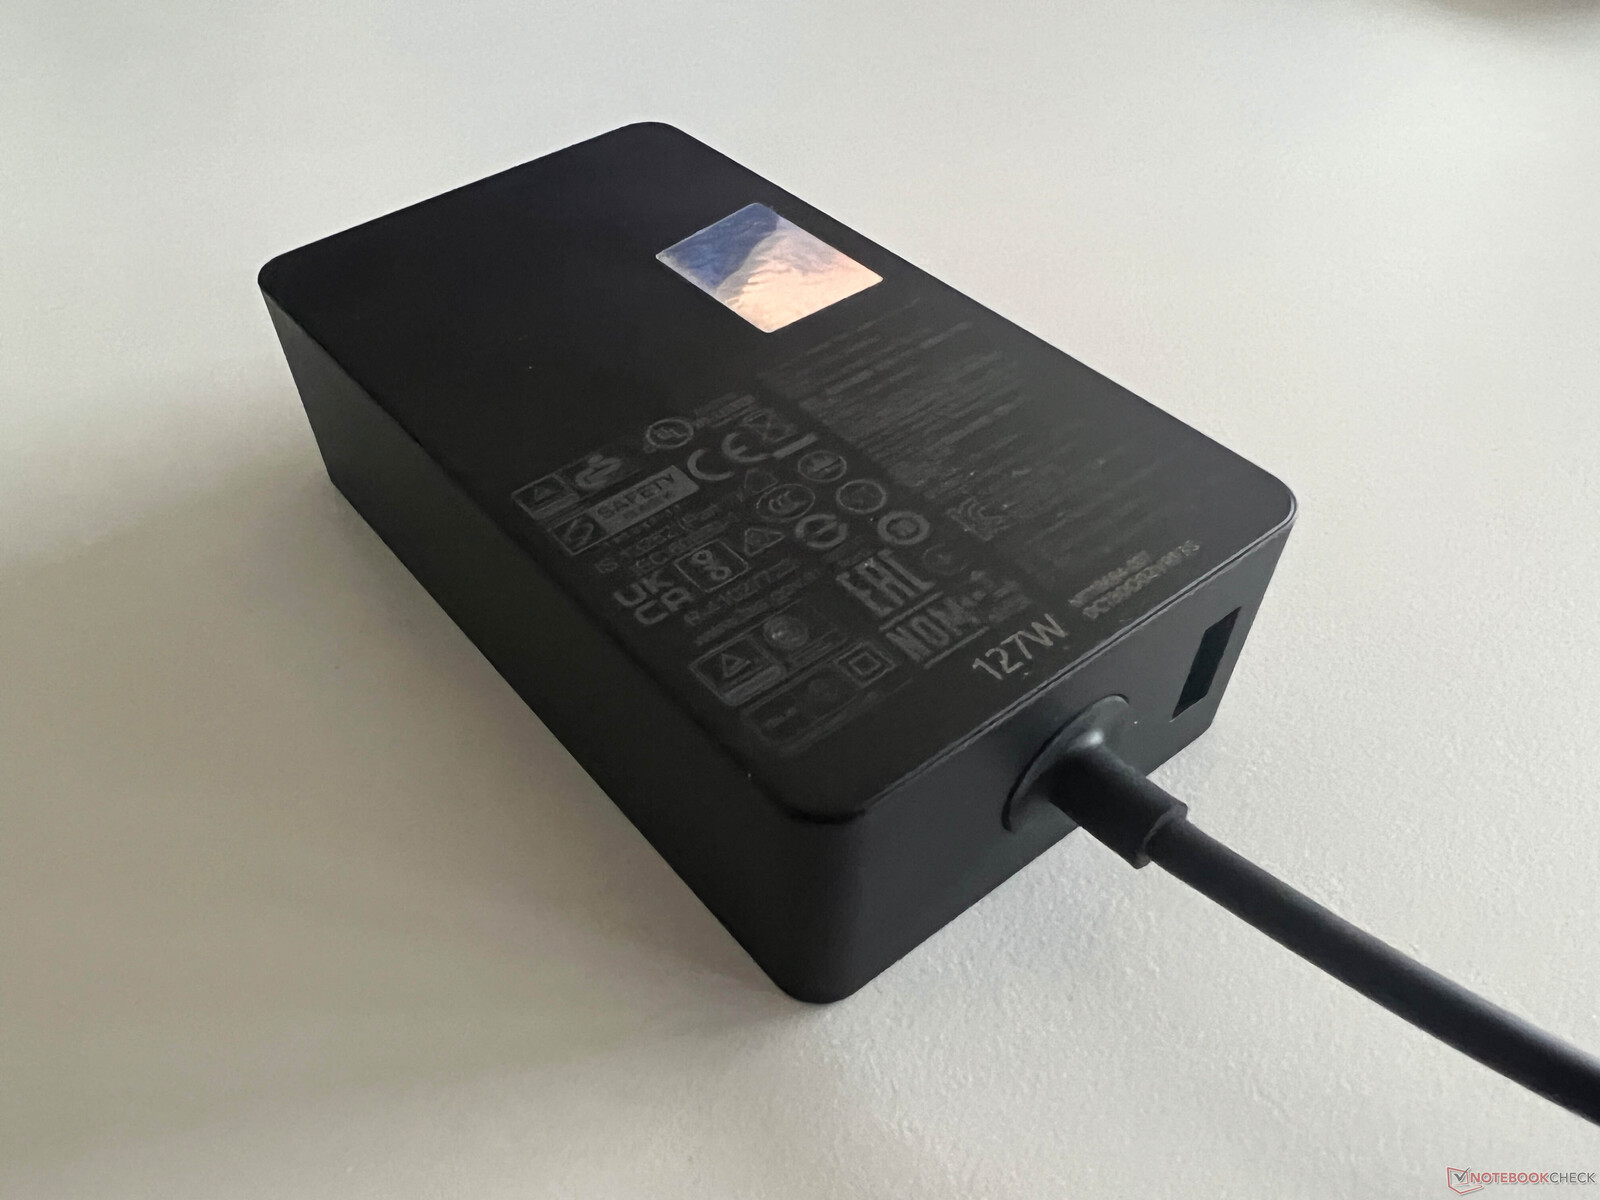
Våra förbrukningsmätningar avslöjar inga överraskningar och tomgångsvärdena är ganska mycket i nivå med föregångaren. Vi märker de kraftfullare komponenterna under belastning med en kortvarig maximal förbrukning på 128 watt, men den planar snabbt ut på cirka 110 watt. Den medföljande 127W nätadaptern är därför tillräcklig. Den erbjuder också en extra USB-A-port för att ladda tillbehör som smartphones.
| Av/Standby | |
| Låg belastning | |
| Hög belastning |
|
Förklaring:
min: | |
| Microsoft Surface Laptop Studio 2 RTX 4060 i7-13700H, GeForce RTX 4060 Laptop GPU, Kioxia XG8 KXG80ZNV1T02, IPS, 2400x1600, 14.4" | Apple MacBook Pro 14 2023 M2 Pro M2 Pro, M2 Pro 19-Core GPU, Apple SSD AP2048Z, Mini-LED, 3024x1964, 14.2" | Lenovo Yoga Pro 9-14IRP G8 i7-13705H, GeForce RTX 4050 Laptop GPU, Samsung PM9A1 MZVL21T0HCLR, Mini-LED, 3072x1920, 14.5" | Asus Zenbook Pro 14 OLED UX6404VI i9-13900H, GeForce RTX 4070 Laptop GPU, Micron 3400 2TB MTFDKBA2T0TFH, OLED, 2880x1800, 14.5" | Asus ZenBook Pro 14 Duo UX8402VV-P1021W i9-13900H, GeForce RTX 4060 Laptop GPU, Samsung PM9A1 MZVL22T0HBLB, OLED, 2880x1800, 14.5" | Asus ROG Zephyrus G14 GA402XY R9 7940HS, GeForce RTX 4090 Laptop GPU, Samsung PM9A1 MZVL21T0HCLR, Mini-LED, 2560x1600, 14" | Lenovo Legion Slim 5 14APH8 R7 7840HS, GeForce RTX 4060 Laptop GPU, SK Hynix HFS001TEJ9X115N, OLED, 2880x1600, 14.5" | Microsoft Surface Laptop Studio i7 RTX 3050 Ti i7-11370H, GeForce RTX 3050 Ti Laptop GPU, SK Hynix PC711 1TB HFS001TDE9X084N, IPS, 2400x1600, 14.4" | Genomsnitt NVIDIA GeForce RTX 4060 Laptop GPU | Genomsnitt av klass Multimedia | |
|---|---|---|---|---|---|---|---|---|---|---|
| Power Consumption | 0% | -104% | -61% | -60% | -89% | -62% | 9% | -133% | -35% | |
| Idle Minimum * (Watt) | 3 | 2.4 20% | 10.9 -263% | 7.5 -150% | 8.5 -183% | 9.4 -213% | 7.3 -143% | 2.6 13% | 11.5 ? -283% | 5.66 ? -89% |
| Idle Average * (Watt) | 7.1 | 11.3 -59% | 17.7 -149% | 11.1 -56% | 8.8 -24% | 14.2 -100% | 9.6 -35% | 7.1 -0% | 16 ? -125% | 10.2 ? -44% |
| Idle Maximum * (Watt) | 7.6 | 11.5 -51% | 19.3 -154% | 11.6 -53% | 16.5 -117% | 14.5 -91% | 17.3 -128% | 7.9 -4% | 20.3 ? -167% | 12.5 ? -64% |
| Load Average * (Watt) | 73.1 | 59.6 18% | 93.3 -28% | 91.9 -26% | 102 -40% | 79 -8% | 76.6 -5% | 76.8 -5% | 92.9 ? -27% | 65.2 ? 11% |
| Witcher 3 ultra * (Watt) | 113.9 | 55.9 51% | 129.5 -14% | 132.2 -16% | 101.2 11% | 172 -51% | 152 -33% | 83 27% | ||
| Load Maximum * (Watt) | 128.5 | 100 22% | 150.2 -17% | 208 -62% | 140 -9% | 220.8 -72% | 160.9 -25% | 97.3 24% | 210 ? -63% | 113.5 ? 12% |
* ... mindre är bättre
Energieaufnahme Witcher 3 / Stresstest
Energieaufnahme mit externem Monitor
Batteriets drifttid
Microsoft använder samma 58 Wh-batteri som i den tidigare modellen, vilket innebär att det är det minsta batteriet i vår jämförelsegrupp. Om du utesluter MacBook Pro 14 är resultaten fortfarande konkurrenskraftiga. Vårt videotest vid 150 nits (62 % av maximal SDR-ljusstyrka) varar i 11:15 timmar och Wi-Fi-testet i 8:18 timmar, vilket är bra resultat. Wi-Fi-testet med maximal SDR-ljusstyrka pågår i nästan 6 timmar (alla tester med 120 Hz). En fullständig laddning tar 126 minuter när enheten är påslagen; 80 % av kapaciteten är klar efter 65 minuter.
Vi kommer att utföra ytterligare batteritester (HDR & 60 Hz) under de närmaste dagarna och lägga till resultaten senare.
| Microsoft Surface Laptop Studio 2 RTX 4060 i7-13700H, GeForce RTX 4060 Laptop GPU, 58 Wh | Apple MacBook Pro 14 2023 M2 Pro M2 Pro, M2 Pro 19-Core GPU, 70 Wh | Lenovo Yoga Pro 9-14IRP G8 i7-13705H, GeForce RTX 4050 Laptop GPU, 75 Wh | Asus Zenbook Pro 14 OLED UX6404VI i9-13900H, GeForce RTX 4070 Laptop GPU, 76 Wh | Asus ZenBook Pro 14 Duo UX8402VV-P1021W i9-13900H, GeForce RTX 4060 Laptop GPU, 76 Wh | Asus ROG Zephyrus G14 GA402XY R9 7940HS, GeForce RTX 4090 Laptop GPU, 76 Wh | Lenovo Legion Slim 5 14APH8 R7 7840HS, GeForce RTX 4060 Laptop GPU, 73.6 Wh | Microsoft Surface Laptop Studio i7 RTX 3050 Ti i7-11370H, GeForce RTX 3050 Ti Laptop GPU, 58 Wh | Genomsnitt av klass Multimedia | |
|---|---|---|---|---|---|---|---|---|---|
| Batteridrifttid | 18% | -23% | -29% | 34% | -34% | -26% | -17% | 25% | |
| H.264 (h) | 11.3 | 15.3 35% | 9.1 -19% | 8.5 -25% | 7.2 -36% | 12.3 9% | 17.1 ? 51% | ||
| WiFi v1.3 (h) | 8.3 | 13.5 63% | 8 -4% | 7.6 -8% | 9 8% | 7.5 -10% | 7.5 -10% | 8 -4% | 12.2 ? 47% |
| Load (h) | 2.2 | 1.2 -45% | 1.2 -45% | 1 -55% | 3.5 59% | 1 -55% | 1.3 -41% | 1 -55% | 1.664 ? -24% |
För
Emot
Dom - Surface Laptop Studio 2 är både bättre och sämre
Microsoft har tagit bort två stora problem som vi hade med den ursprungliga Surface Laptop Studio, och den andra generationen får ytterligare portar (USB-A och en snabb kortläsare) samt en aktuell processor. Grafikkortet har också uppdaterats och prestandan är hyfsad för en multimedia-laptop. Den ökade prestandan är dock en stor utmaning för kylningskonceptet med fläktarna på framsidan av basenheten. Handledsstödet blir obehagligt varmt och den varma luften sprids ut över sidornas främre del, vilket är ett problem när du använder en mus. Det finns också små elektroniska ljud i stort sett hela tiden, vilket är irriterande.
Konstruktionen med de två nivåerna av basenheten har också nackdelen att den är ganska skrymmande och inte särskilt bekväm när du vill använda den som en surfplatta. Själva chassikvaliteten är dock utmärkt och vikmekanismen för displayen lämnar också ett gott intryck. Skärmen i sig är mycket bra med exakta färger, men den är mycket glansig och täcker bara den lilla sRGB-färgskalan, vilket är förvånande vid denna prispunkt.
Microsoft levererar den nya Surface Laptop Studio 2 med fler portar och snabbare komponenter, men kyllösningen har nått sina gränser. Det finns fortfarande inga underhållsalternativ och priserna är mycket höga.
Surface Laptop Studio 2 erbjuder fortfarande ett intressant koncept, men förhållandet mellan pris och prestanda är inte bra. Vi förstår inte heller varför Microsoft bara erbjuder ett begränsat antal modeller och användare måste skaffa 64 GB RAM när de vill ha den snabbare RTX 4060 Laptop GPU. Det finns återigen inga underhållsalternativ (du kan inte ens öppna chassit) och uppgraderingar är inte möjliga.
Med tanke på konkurrenterna tvivlar vi på att den nya Surface Laptop Studio 2 kommer att bli mycket framgångsrik. Apple'sMacBook Pro 14har ingen pekskärm eller USB-A, men systemet är tystare, batteriet räcker mycket längre och skärmen är överlägsen, särskilt när det gäller HDR. Och du kan rengöra fläktarna. Ett intressant Windows-alternativ med fokus på pekingångar är AsusZenbook Pro Duo. Den Lenovo Yoga Pro 9i 14 är också ett bättre alternativ totalt sett och om du inte har problem med en spelmaskin får du Lenovo Legion Slim 5 14 med mer prestanda och en OLED-panel för inte ens halva priset.
Pris och tillgänglighet
Du kan beställa den nya Surface Laptop Studio 2 direkt från Microsoft från ett pris på 999 USD. Vår recensionskonfiguration med RTX 4060 Laptop är tillgänglig för $3299 på BestBuy.
Microsoft Surface Laptop Studio 2 RTX 4060
- 10/03/2023 v7 (old)
Andreas Osthoff
Genomskinlighet
Valet av enheter som ska granskas görs av vår redaktion. Testprovet gavs till författaren som ett lån av tillverkaren eller återförsäljaren för denna recension. Långivaren hade inget inflytande på denna recension och inte heller fick tillverkaren en kopia av denna recension innan publiceringen. Det fanns ingen skyldighet att publicera denna recension. Som ett oberoende medieföretag är Notebookcheck inte föremål för auktoritet från tillverkare, återförsäljare eller förlag.
This is how Notebookcheck is testingEvery year, Notebookcheck independently reviews hundreds of laptops and smartphones using standardized procedures to ensure that all results are comparable. We have continuously developed our test methods for around 20 years and set industry standards in the process. In our test labs, high-quality measuring equipment is utilized by experienced technicians and editors. These tests involve a multi-stage validation process. Our complex rating system is based on hundreds of well-founded measurements and benchmarks, which maintains objectivity.
Price comparison

