Test: Xiaomi Mi Mix 3 Smartphone (Sammanfattning)


| |||||||||||||||||||||||||
Distribution av ljusstyrkan: 96 %
Mitt på batteriet: 599 cd/m²
Kontrast: ∞:1 (Svärta: 0 cd/m²)
ΔE ColorChecker Calman: 1.4 | ∀{0.5-29.43 Ø4.71}
ΔE Greyscale Calman: 2 | ∀{0.09-98 Ø4.96}
97.5% sRGB (Calman 2D)
Gamma: 2.25
CCT: 6496 K
| Xiaomi Mi Mix 3 OLED, 2340x1080, 6.4" | Xiaomi Mi 8 Explorer Edition Super AMOLED, 2248x1080, 6.2" | Oppo Find X AMOLED, 2340x1080, 6.4" | Vivo Nex Ultimate Super AMOLED, 2316x1080, 6.6" | OnePlus 6T Optic AMOLED, 2340x1080, 6.4" | Samsung Galaxy S9 Plus Super AMOLED, 2960x1440, 6.2" | HTC U12 Plus Super LCD 6, 2880x1440, 6" | Huawei Mate 20 Pro OLED, 3120x1440, 6.3" | |
|---|---|---|---|---|---|---|---|---|
| Screen | -56% | -97% | -161% | -25% | -20% | -8% | 1% | |
| Brightness middle (cd/m²) | 599 | 429 -28% | 427 -29% | 356 -41% | 437 -27% | 565 -6% | 395 -34% | 576 -4% |
| Brightness (cd/m²) | 593 | 432 -27% | 432 -27% | 352 -41% | 442 -25% | 571 -4% | 402 -32% | 582 -2% |
| Brightness Distribution (%) | 96 | 88 -8% | 87 -9% | 95 -1% | 95 -1% | 96 0% | 90 -6% | 90 -6% |
| Black Level * (cd/m²) | 0.37 | |||||||
| Colorchecker dE 2000 * | 1.4 | 3.39 -142% | 5.37 -284% | 7.08 -406% | 2.21 -58% | 2.3 -64% | 1.6 -14% | 1.3 7% |
| Colorchecker dE 2000 max. * | 3.2 | 5.25 -64% | 7.51 -135% | 14.1 -341% | 4.27 -33% | 4.8 -50% | 3.4 -6% | 3.5 -9% |
| Greyscale dE 2000 * | 2 | 3.3 -65% | 4 -100% | 4.7 -135% | 2.1 -5% | 1.9 5% | 1.1 45% | 1.6 20% |
| Gamma | 2.25 98% | 2.238 98% | 2.243 98% | 2.096 105% | 2.307 95% | 2.16 102% | 2.14 103% | 2.18 101% |
| CCT | 6496 100% | 7135 91% | 6851 95% | 7297 89% | 6353 102% | 6332 103% | 6536 99% | 6561 99% |
| Contrast (:1) | 1068 |
* ... mindre är bättre
Skärmflimmer / PWM (Puls-Width Modulation)
| Skärmflimmer / PWM upptäckt | 240.4 Hz | 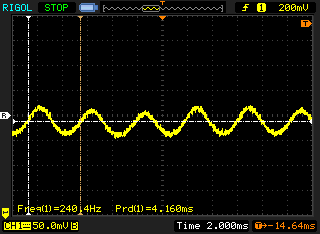 | |
Displayens bakgrundsbelysning flimrar vid 240.4 Hz (i värsta fall, t.ex. med PWM) . Frekvensen för 240.4 Hz är relativt låg, så känsliga användare kommer sannolikt att märka flimmer och uppleva ansträngda ögon vid den angivna ljusstyrkeinställningen och nedan. Som jämförelse: 52 % av alla testade enheter använder inte PWM för att dämpa skärmen. Om PWM upptäcktes mättes ett medelvärde av 7757 (minst: 5 - maximum: 343500) Hz. | |||
Visa svarstider
| ↔ Svarstid svart till vitt | ||
|---|---|---|
| 12.2 ms ... stiga ↗ och falla ↘ kombinerat | ↗ 9.4 ms stiga | 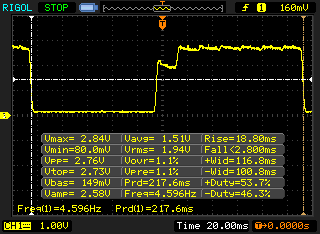 |
| ↘ 2.8 ms hösten | ||
| Skärmen visar bra svarsfrekvens i våra tester, men kan vara för långsam för konkurrenskraftiga spelare. I jämförelse sträcker sig alla testade enheter från 0.1 (minst) till 240 (maximalt) ms. » 33 % av alla enheter är bättre. Det betyder att den uppmätta svarstiden är bättre än genomsnittet av alla testade enheter (19.8 ms). | ||
| ↔ Svarstid 50 % grått till 80 % grått | ||
| 7.6 ms ... stiga ↗ och falla ↘ kombinerat | ↗ 2.8 ms stiga | 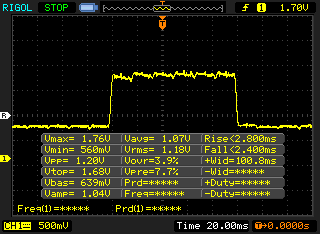 |
| ↘ 4.8 ms hösten | ||
| Skärmen visar väldigt snabba svarsfrekvenser i våra tester och borde vara mycket väl lämpad för fartfyllt spel. I jämförelse sträcker sig alla testade enheter från 0.165 (minst) till 636 (maximalt) ms. » 20 % av alla enheter är bättre. Det betyder att den uppmätta svarstiden är bättre än genomsnittet av alla testade enheter (31 ms). | ||
| JetStream 1.1 - 1.1 Total | |
| Huawei Mate 20 Pro (Chrome 69) | |
| HTC U12 Plus (Chrome 66) | |
| OnePlus 6T (Chrome 70) | |
| Xiaomi Mi Mix 3 (Chrome 70) | |
| Xiaomi Mi 8 Explorer Edition (Chrome 69) | |
| Genomsnitt Qualcomm Snapdragon 845 (22.5 - 90.9, n=25) | |
| Samsung Galaxy S9 Plus (Samsung Browser 7.0) | |
| Oppo Find X (Chrome 69) | |
| Vivo Nex Ultimate (Chrome 67) | |
| Octane V2 - Total Score | |
| Genomsnitt av klass Smartphone (2800 - 126661, n=142, senaste 2 åren) | |
| Huawei Mate 20 Pro (Chrome 69) | |
| OnePlus 6T (Chrome 70) | |
| Xiaomi Mi Mix 3 (Chrome 70) | |
| HTC U12 Plus (Chrome 66) | |
| Genomsnitt Qualcomm Snapdragon 845 (3991 - 18275, n=28) | |
| Samsung Galaxy S9 Plus (Samsung Browser 7.0) | |
| Xiaomi Mi 8 Explorer Edition (Chrome 69) | |
| Oppo Find X (Chrome 69) | |
| Vivo Nex Ultimate (Chrome 67) | |
| Mozilla Kraken 1.1 - Total | |
| Vivo Nex Ultimate (Chrome 67) | |
| Oppo Find X (Chrome 69) | |
| Genomsnitt Qualcomm Snapdragon 845 (2154 - 11204, n=28) | |
| HTC U12 Plus (Chrome 66) | |
| Xiaomi Mi 8 Explorer Edition (Chrome 69) | |
| Xiaomi Mi Mix 3 (Chrome 70) | |
| OnePlus 6T (Chrome 70) | |
| Samsung Galaxy S9 Plus (Samsung Browser 7.0) | |
| Huawei Mate 20 Pro (Chrome 69) | |
| Genomsnitt av klass Smartphone (257 - 28190, n=121, senaste 2 åren) | |
| WebXPRT 3 - Overall | |
| Genomsnitt av klass Smartphone (104 - 380, n=12, senaste 2 åren) | |
| Huawei Mate 20 Pro (Chrome 69) | |
| HTC U12 Plus (Chrome 66) | |
| Xiaomi Mi Mix 3 (Chrome 70) | |
| Genomsnitt Qualcomm Snapdragon 845 (19 - 103, n=17) | |
| Samsung Galaxy S9 Plus | |
| Vivo Nex Ultimate (Stock Browser) | |
| WebXPRT 2015 - Overall | |
| Huawei Mate 20 Pro (Chrome 69) | |
| OnePlus 6T (Chrome 70) | |
| Xiaomi Mi Mix 3 (Chrome 70) | |
| HTC U12 Plus (Chrome 66) | |
| Xiaomi Mi 8 Explorer Edition (Chrome 69) | |
| Genomsnitt Qualcomm Snapdragon 845 (96 - 291, n=23) | |
| Samsung Galaxy S9 Plus (Samsung Browser 7.0) | |
| Vivo Nex Ultimate (Chrome 67) | |
* ... mindre är bättre
| Xiaomi Mi Mix 3 | Xiaomi Mi 8 Explorer Edition | Oppo Find X | Vivo Nex Ultimate | OnePlus 6T | Samsung Galaxy S9 Plus | HTC U12 Plus | Huawei Mate 20 Pro | Genomsnitt 128 GB UFS 2.1 Flash | Genomsnitt av klass Smartphone | |
|---|---|---|---|---|---|---|---|---|---|---|
| AndroBench 3-5 | 5% | 15% | 5% | 6% | 8% | 106% | 187% | 161% | 729% | |
| Sequential Read 256KB (MB/s) | 675 | 692 3% | 761 13% | 687 2% | 735 9% | 819 21% | 709 5% | 853 26% | 762 ? 13% | 2225 ? 230% |
| Sequential Write 256KB (MB/s) | 206.8 | 205.2 -1% | 206.9 0% | 228.4 10% | 204.4 -1% | 204.9 -1% | 195.8 -5% | 196.4 -5% | 300 ? 45% | 1903 ? 820% |
| Random Read 4KB (MB/s) | 133.2 | 135.2 2% | 145.9 10% | 126.7 -5% | 138.5 4% | 129.7 -3% | 118.1 -11% | 157.4 18% | 154.7 ? 16% | 311 ? 133% |
| Random Write 4KB (MB/s) | 19.54 | 22.65 16% | 26.98 38% | 22.1 13% | 22 13% | 22.74 16% | 104.2 433% | 157.8 708% | 131.1 ? 571% | 358 ? 1732% |
PUBG Mobile
Asphalt 9 Legends
(+) Den maximala temperaturen på ovansidan är 32 °C / 90 F, jämfört med genomsnittet av 35.3 °C / 96 F , allt från 21.9 till 247 °C för klassen Smartphone.
(+) Botten värms upp till maximalt 31.1 °C / 88 F, jämfört med genomsnittet av 34 °C / 93 F
(+) Vid tomgångsbruk är medeltemperaturen för ovansidan 26.5 °C / 80 F, jämfört med enhetsgenomsnittet på 33 °C / ### class_avg_f### F.
Xiaomi Mi Mix 3 ljudanalys
(+) | högtalare kan spela relativt högt (84.8 dB)
Bas 100 - 315 Hz
(-) | nästan ingen bas - i genomsnitt 27.4% lägre än medianen
(±) | linjäriteten för basen är genomsnittlig (10.7% delta till föregående frekvens)
Mellan 400 - 2000 Hz
(+) | balanserad mellan - endast 3.2% från medianen
(+) | mids är linjära (4.5% delta till föregående frekvens)
Högsta 2 - 16 kHz
(±) | högre toppar - i genomsnitt 7.4% högre än medianen
(+) | toppar är linjära (4.3% delta till föregående frekvens)
Totalt 100 - 16 000 Hz
(±) | linjäriteten för det totala ljudet är genomsnittlig (21.7% skillnad mot median)
Jämfört med samma klass
» 44% av alla testade enheter i den här klassen var bättre, 8% liknande, 48% sämre
» Den bästa hade ett delta på 11%, genomsnittet var 34%, sämst var 134%
Jämfört med alla testade enheter
» 62% av alla testade enheter var bättre, 7% liknande, 31% sämre
» Den bästa hade ett delta på 4%, genomsnittet var 23%, sämst var 134%
OnePlus 6T ljudanalys
(±) | högtalarljudstyrkan är genomsnittlig men bra (80.5 dB)
Bas 100 - 315 Hz
(-) | nästan ingen bas - i genomsnitt 62.9% lägre än medianen
(+) | basen är linjär (0% delta till föregående frekvens)
Mellan 400 - 2000 Hz
(-) | nästan inga mids - i genomsnitt 62.9% lägre än medianen
(+) | mids är linjära (0% delta till föregående frekvens)
Högsta 2 - 16 kHz
(-) | nästan inga toppar - i genomsnitt 62.9% lägre än medianen
(+) | toppar är linjära (0% delta till föregående frekvens)
Totalt 100 - 16 000 Hz
(-) | det totala ljudet är inte linjärt (116.1% skillnad mot median)
Jämfört med samma klass
» 88% av alla testade enheter i den här klassen var bättre, 4% liknande, 8% sämre
» Den bästa hade ett delta på 11%, genomsnittet var 34%, sämst var 134%
Jämfört med alla testade enheter
» 96% av alla testade enheter var bättre, 1% liknande, 2% sämre
» Den bästa hade ett delta på 4%, genomsnittet var 23%, sämst var 134%
| Av/Standby | |
| Låg belastning | |
| Hög belastning |
|
Förklaring:
min: | |
| Xiaomi Mi Mix 3 3200 mAh | Xiaomi Mi 8 Explorer Edition 3000 mAh | Oppo Find X 3730 mAh | Vivo Nex Ultimate 4000 mAh | OnePlus 6T 3700 mAh | Samsung Galaxy S9 Plus 3500 mAh | HTC U12 Plus 3500 mAh | Huawei Mate 20 Pro 4200 mAh | Genomsnitt Qualcomm Snapdragon 845 | Genomsnitt av klass Smartphone | |
|---|---|---|---|---|---|---|---|---|---|---|
| Power Consumption | -192% | -130% | -57% | -51% | -18% | -104% | -94% | -82% | -81% | |
| Idle Minimum * (Watt) | 0.49 | 1.8 -267% | 0.9 -84% | 0.9 -84% | 0.7 -43% | 0.68 -39% | 0.77 -57% | 0.95 -94% | 0.862 ? -76% | 0.887 ? -81% |
| Idle Average * (Watt) | 0.67 | 2.9 -333% | 1.9 -184% | 1.5 -124% | 1.1 -64% | 0.95 -42% | 2.18 -225% | 2.17 -224% | 1.728 ? -158% | 1.485 ? -122% |
| Idle Maximum * (Watt) | 0.87 | 3.5 -302% | 3.2 -268% | 1.7 -95% | 2.1 -141% | 1.09 -25% | 2.21 -154% | 2.25 -159% | 2.07 ? -138% | 1.672 ? -92% |
| Load Average * (Watt) | 3.64 | 4.8 -32% | 7.1 -95% | 3.7 -2% | 4.2 -15% | 4.58 -26% | 6.25 -72% | 4.47 -23% | 4.87 ? -34% | 6.76 ? -86% |
| Load Maximum * (Watt) | 9.04 | 11.2 -24% | 10.7 -18% | 7.2 20% | 8.3 8% | 5.16 43% | 10.16 -12% | 6.15 32% | 9.27 ? -3% | 11.2 ? -24% |
* ... mindre är bättre
| Xiaomi Mi Mix 3 3200 mAh | Xiaomi Mi 8 Explorer Edition 3000 mAh | Oppo Find X 3730 mAh | Vivo Nex Ultimate 4000 mAh | OnePlus 6T 3700 mAh | Samsung Galaxy S9 Plus 3500 mAh | HTC U12 Plus 3500 mAh | Huawei Mate 20 Pro 4200 mAh | |
|---|---|---|---|---|---|---|---|---|
| Batteridrifttid | -4% | -17% | 23% | 19% | -12% | -19% | 13% | |
| Reader / Idle (h) | 30.2 | 23.4 -23% | 32.1 6% | 32.3 7% | 22.4 -26% | 24.2 -20% | 29.1 -4% | |
| H.264 (h) | 13.9 | 15.4 11% | 18.9 36% | 15.1 9% | 11.2 -19% | 7.7 -45% | 14.2 2% | |
| WiFi v1.3 (h) | 12 | 11.6 -3% | 9.9 -17% | 17.1 43% | 14.4 20% | 8.7 -27% | 8.5 -29% | 12.8 7% |
| Load (h) | 3.2 | 3.2 0% | 3.4 6% | 4.4 38% | 4 25% | 3.8 19% | 4.7 47% |
För
Emot
Läs den fullständiga versionen av den här recensionen på engelska här.
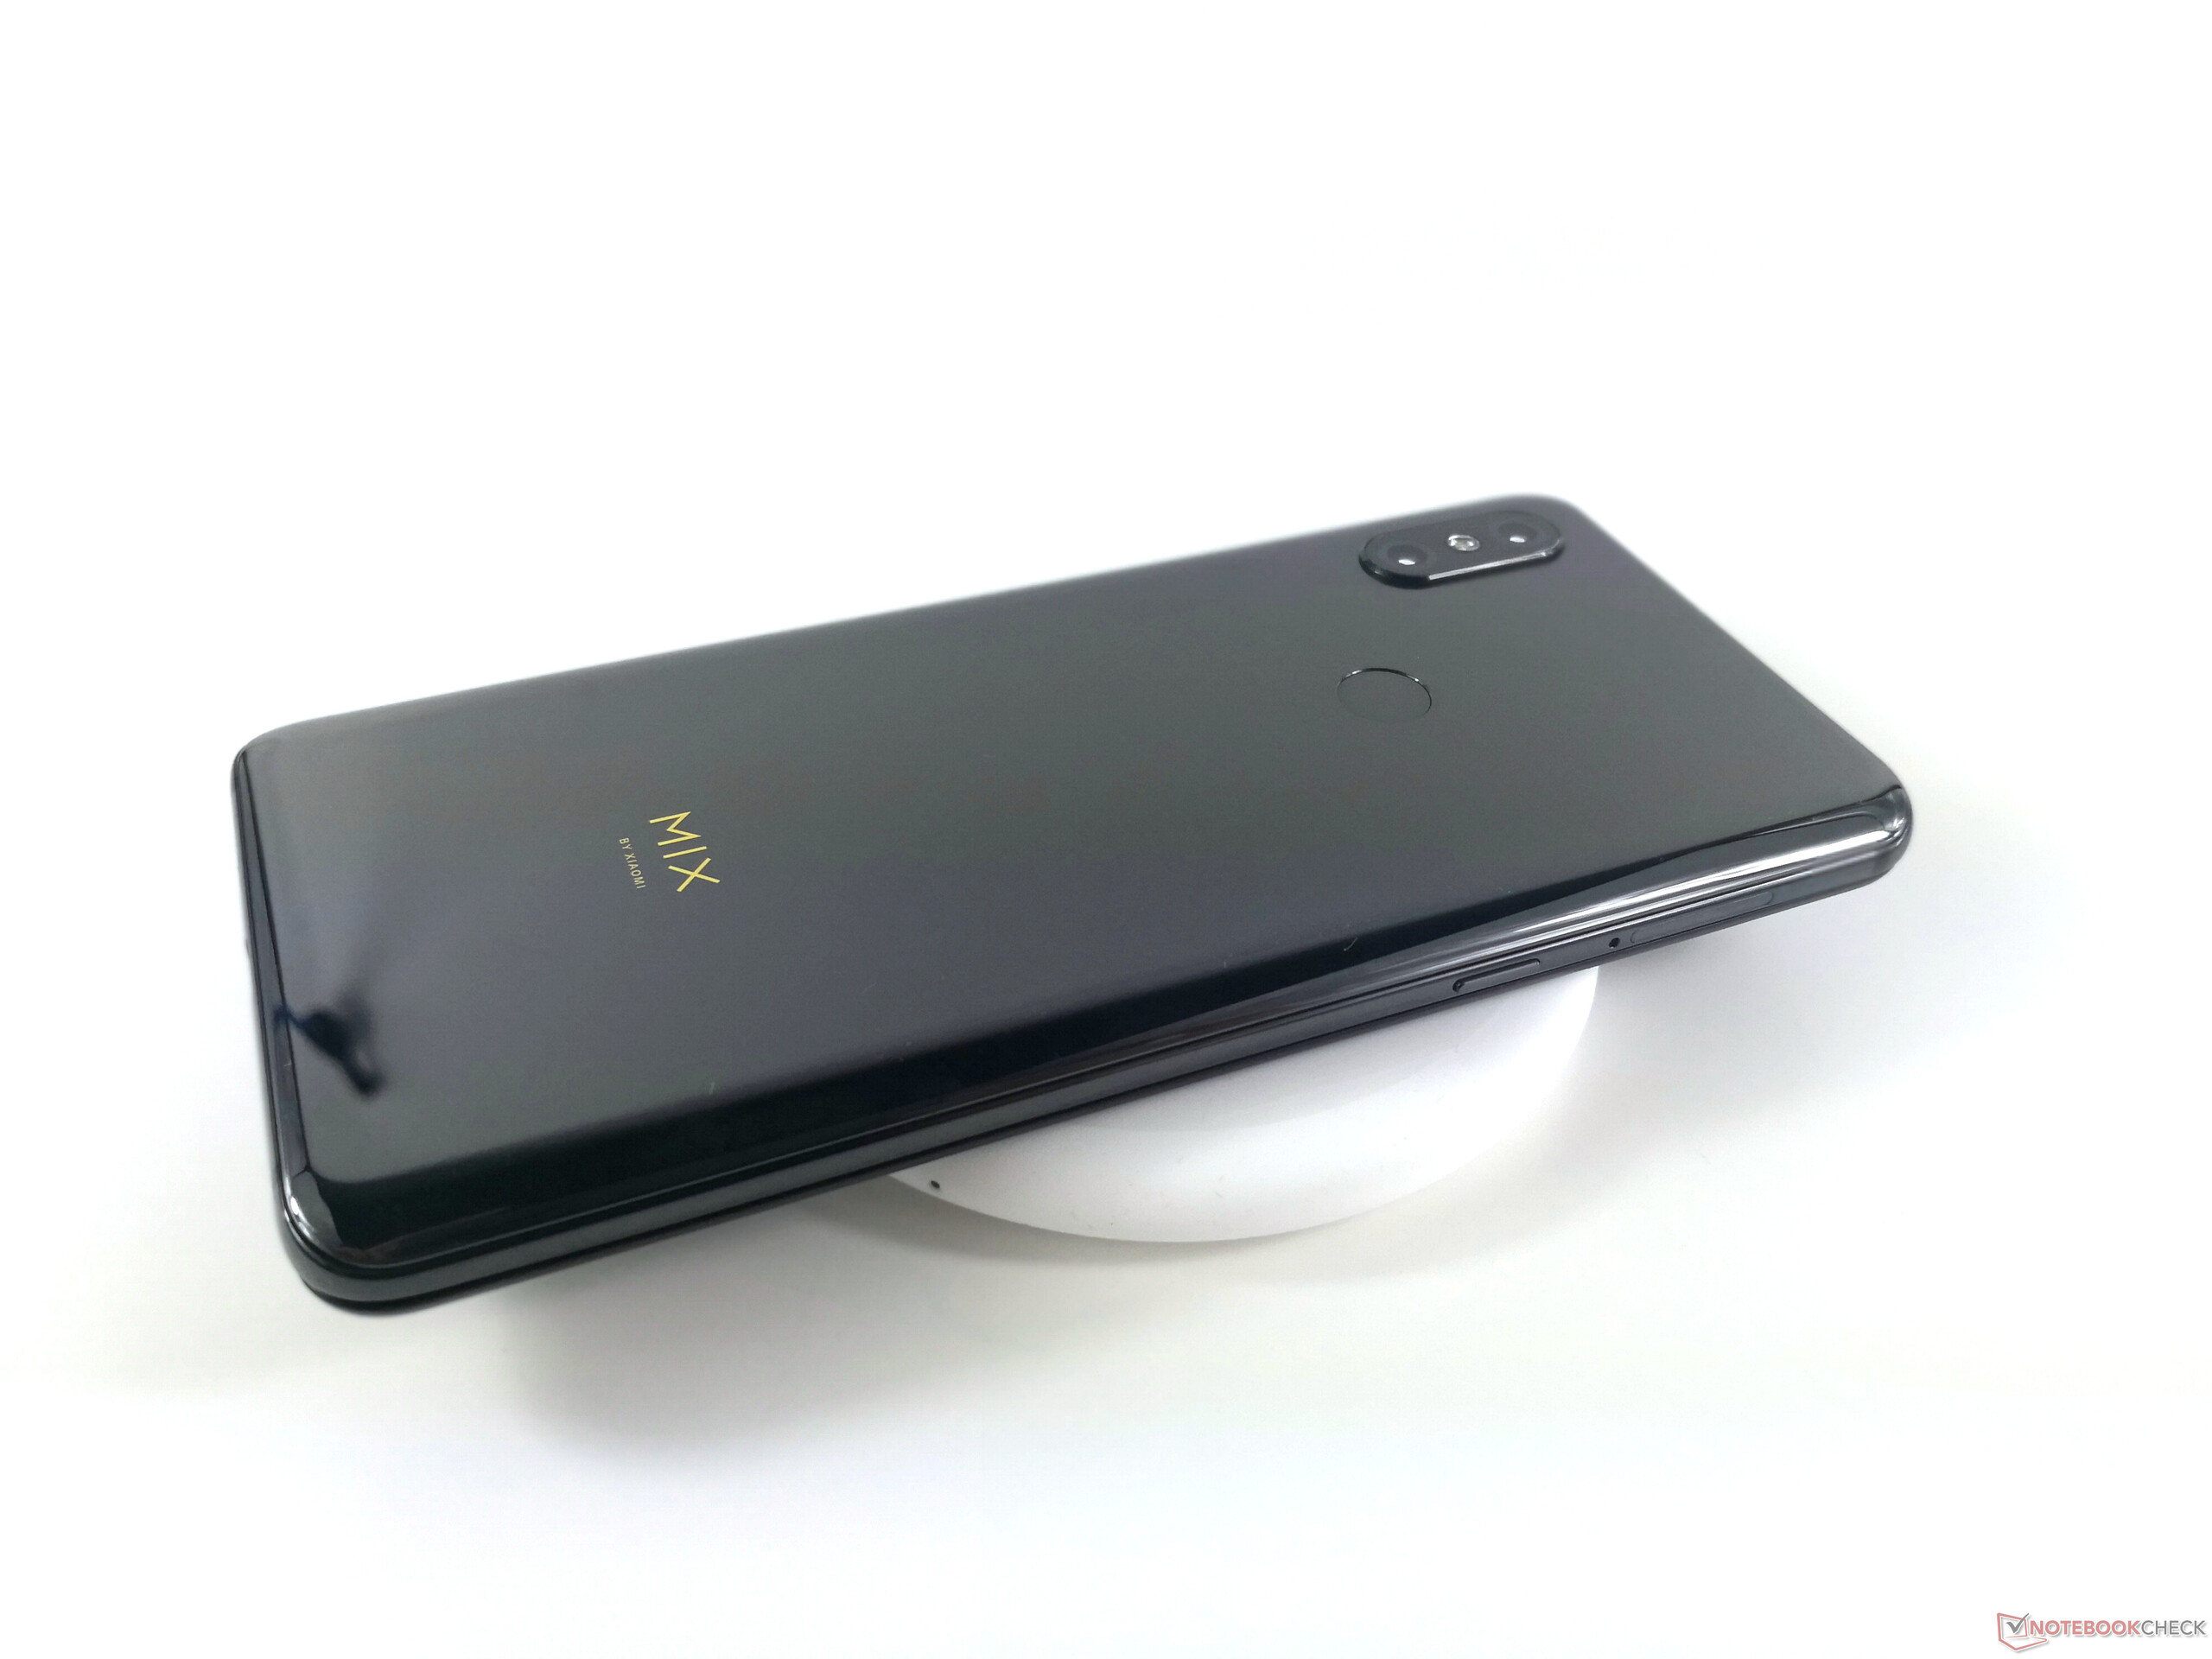
Mi Mix 3 är en riktigt bra infattningsfri smartphone som klarar sig utan ett jack i skärmen. Skärmen i synnerhet är ett steg upp jämfört med Mi 8. Skärmtekniken som Xiaomi använder är utmärkt.
Vi överraskades av hur bra det relativt lilla batteriet i den här slider-telefonen presterade. Vårt batteritest visade att Mi Mix 3 kan ge bra batteritid tack vare en riktigt bra nivå av energiförbrukning. De flesta användare bör lätt kunna ta sig igenom en hel dag på en laddning.
Mi Mix är en riktigt trevlig smartphone som kanske inte är den perfekta resekamraten för alla på grund av glidmekanismen.
Xiaomis Mi Mix 3 har inte särskilt många svagheter. På grund av glidmekanismen har denna avancerade telefon ingen IP-certifiering, är ganska tung och är troligen lite ömtåligare än en "vanlig" smartphone med en helgjuten kropp.
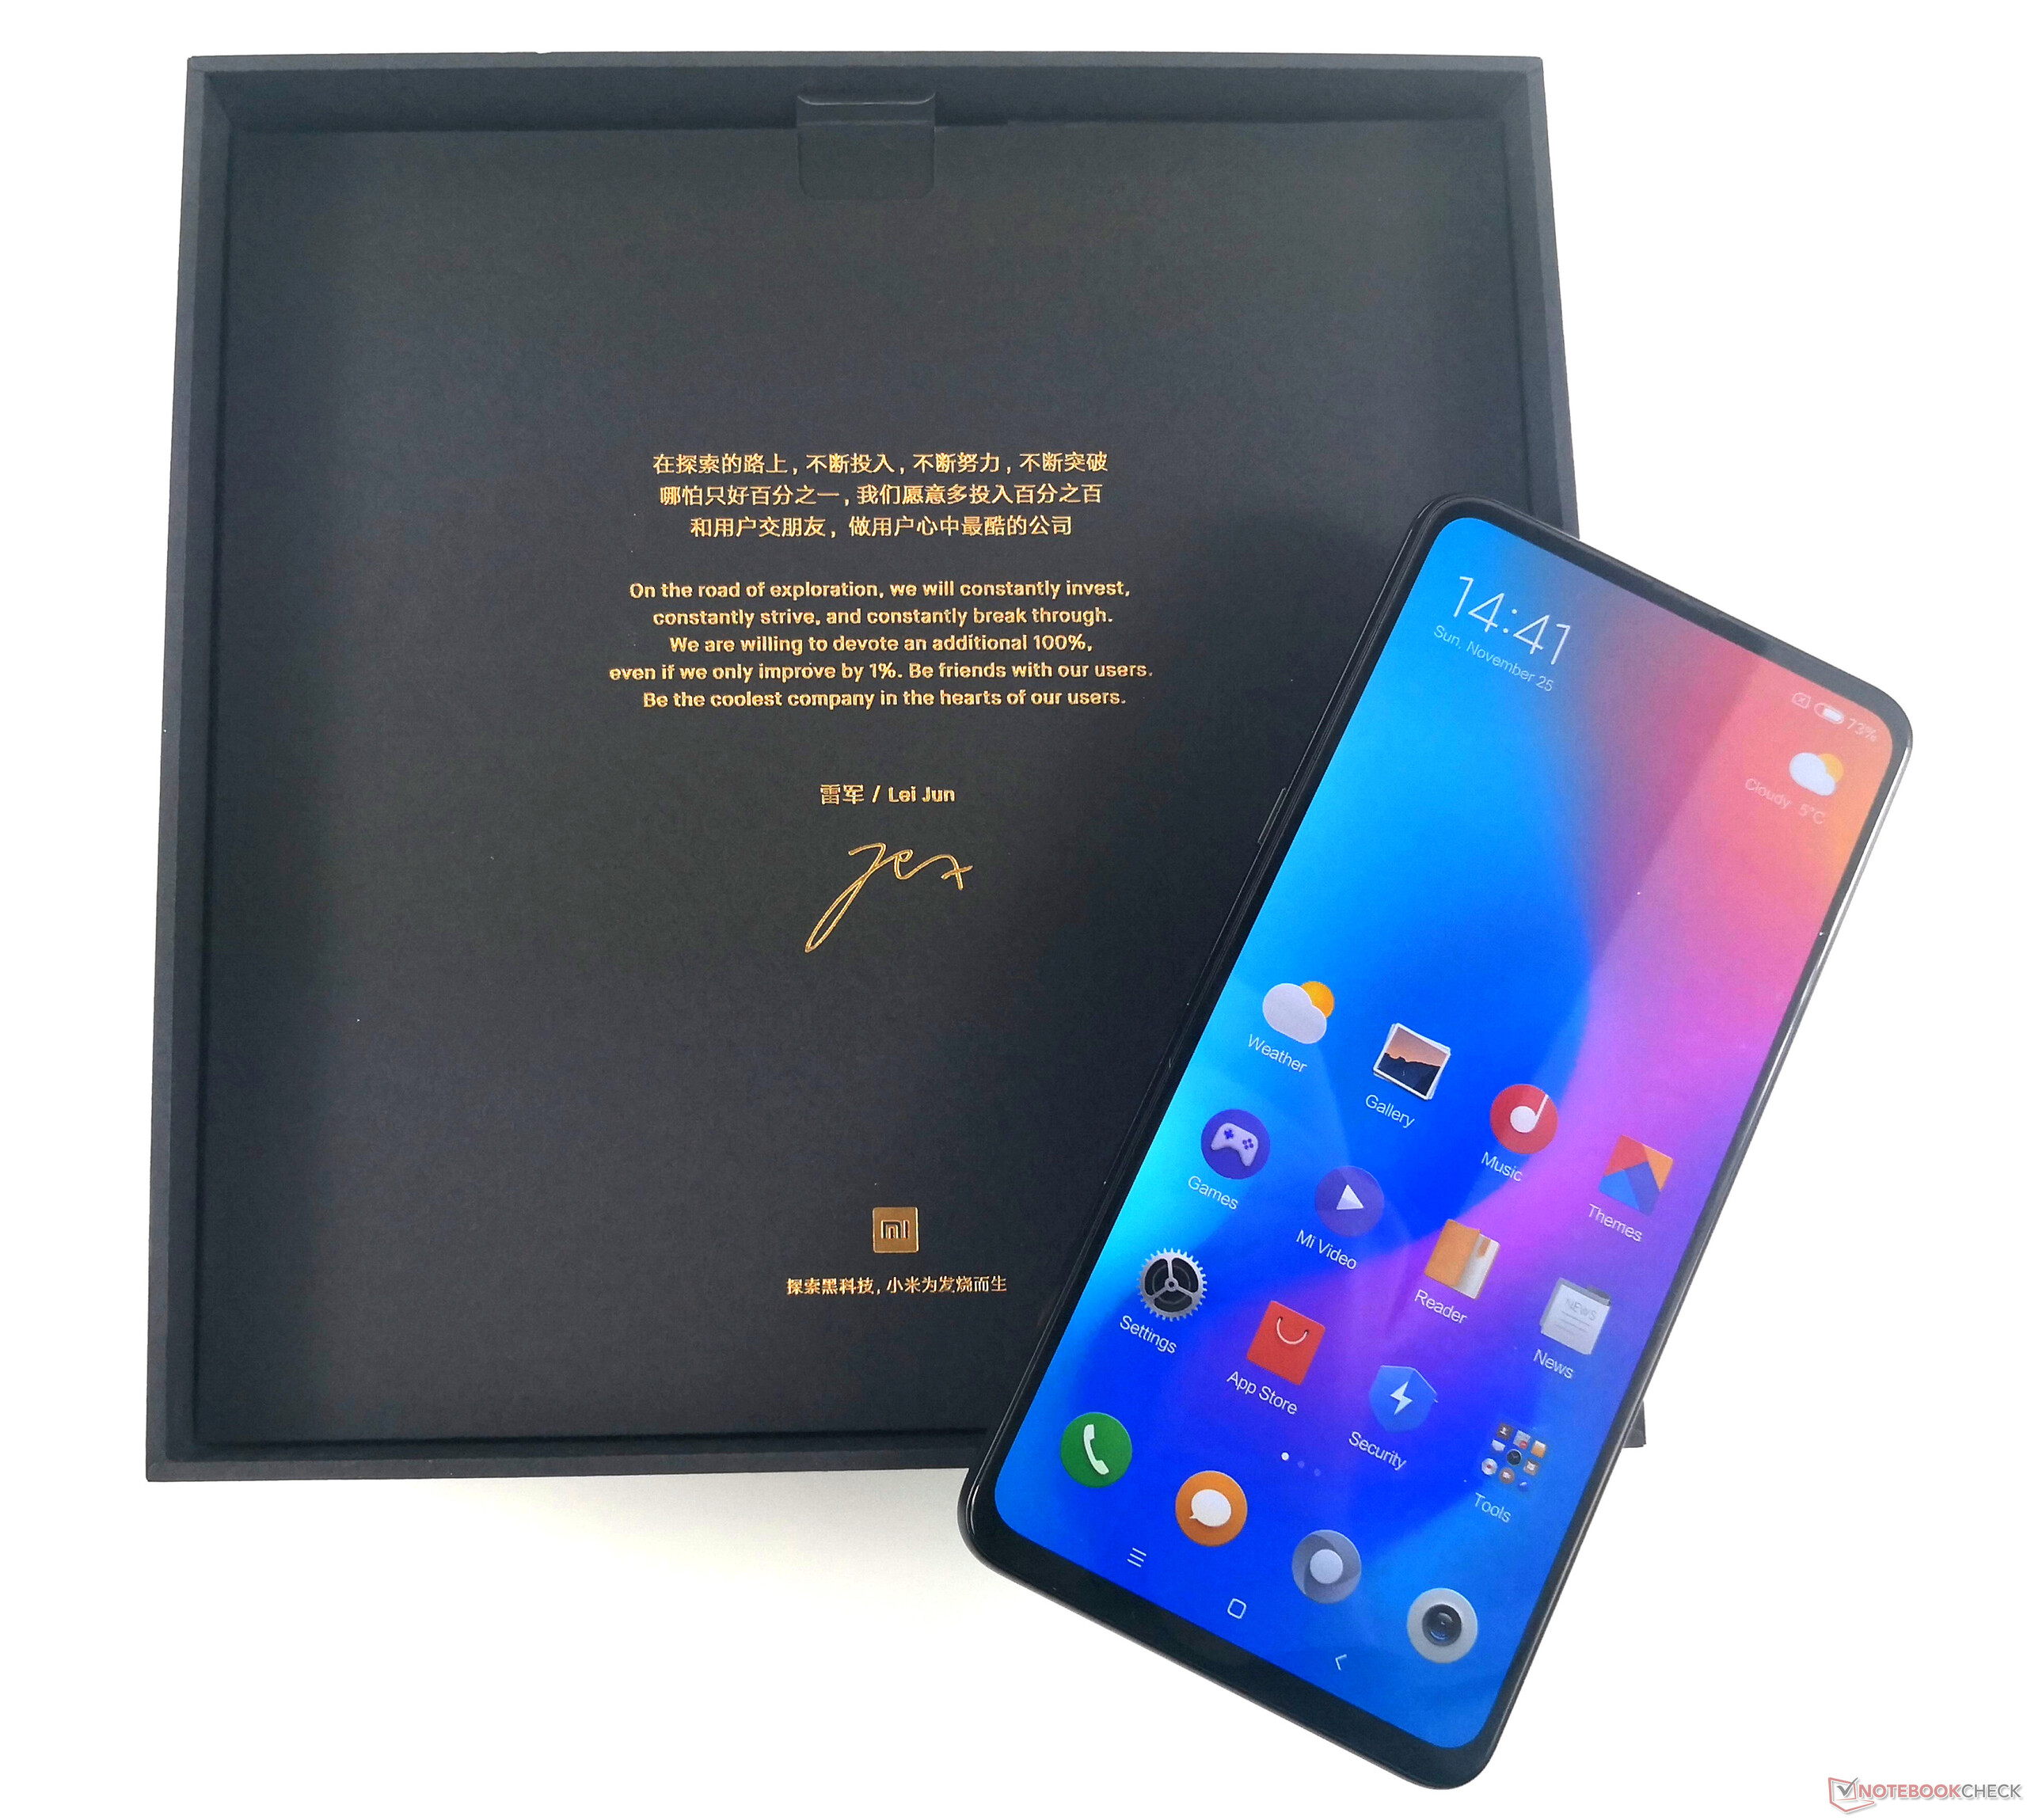
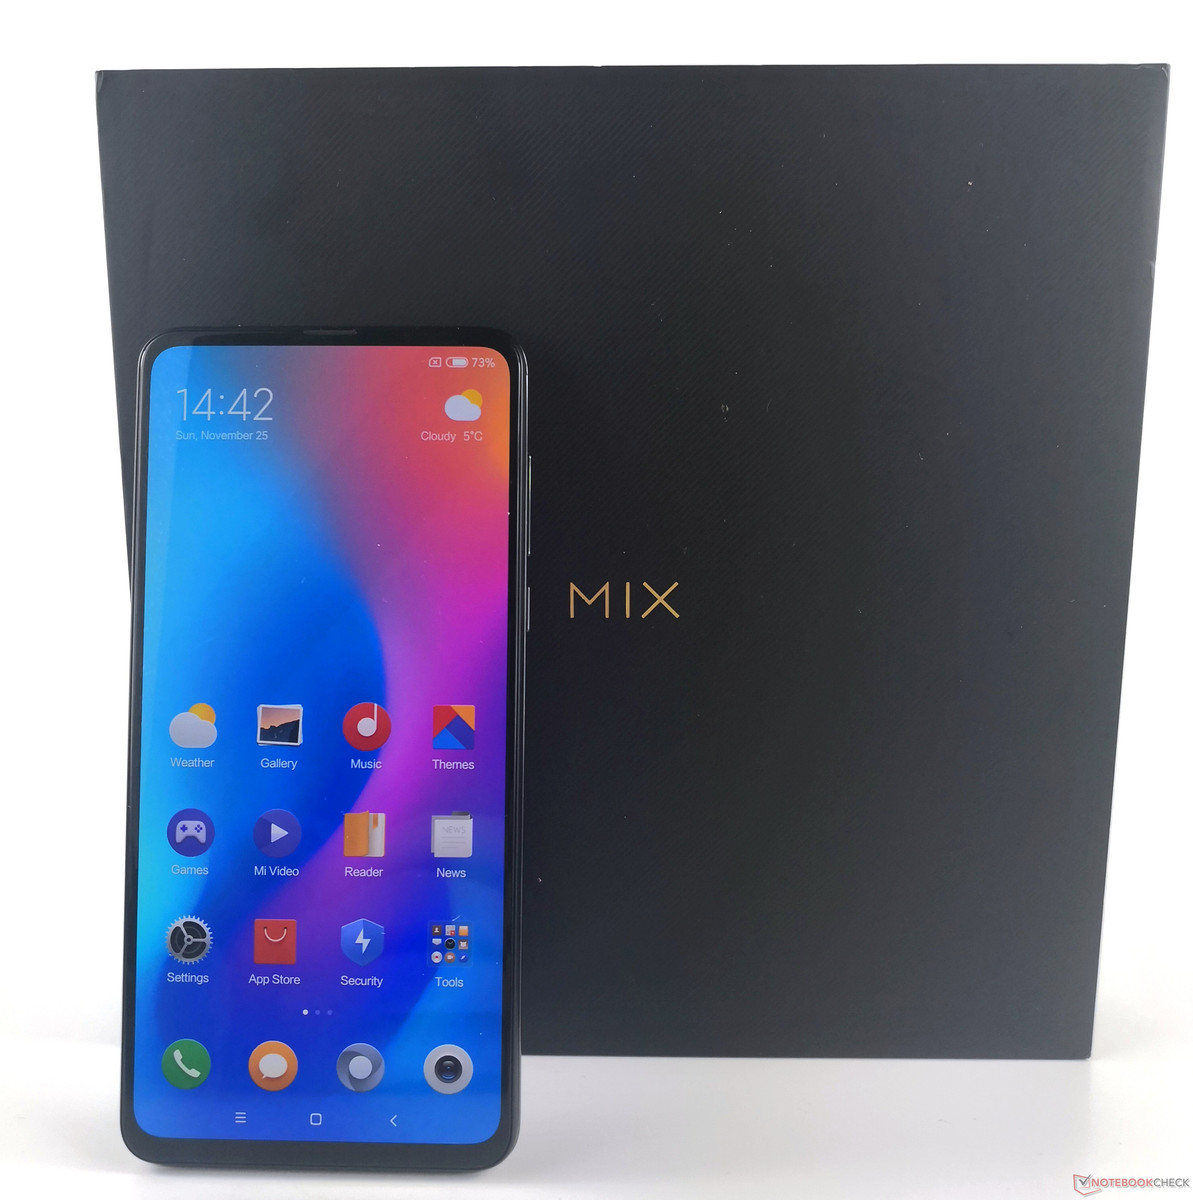
Xiaomi Mi Mix 3
- 12/03/2018 v6 (old)
Marcus Herbrich
Price comparison
