Notebookcheck Logo

Test: Xiaomi Mi Mix 2S Smartphone (Sammanfattning)

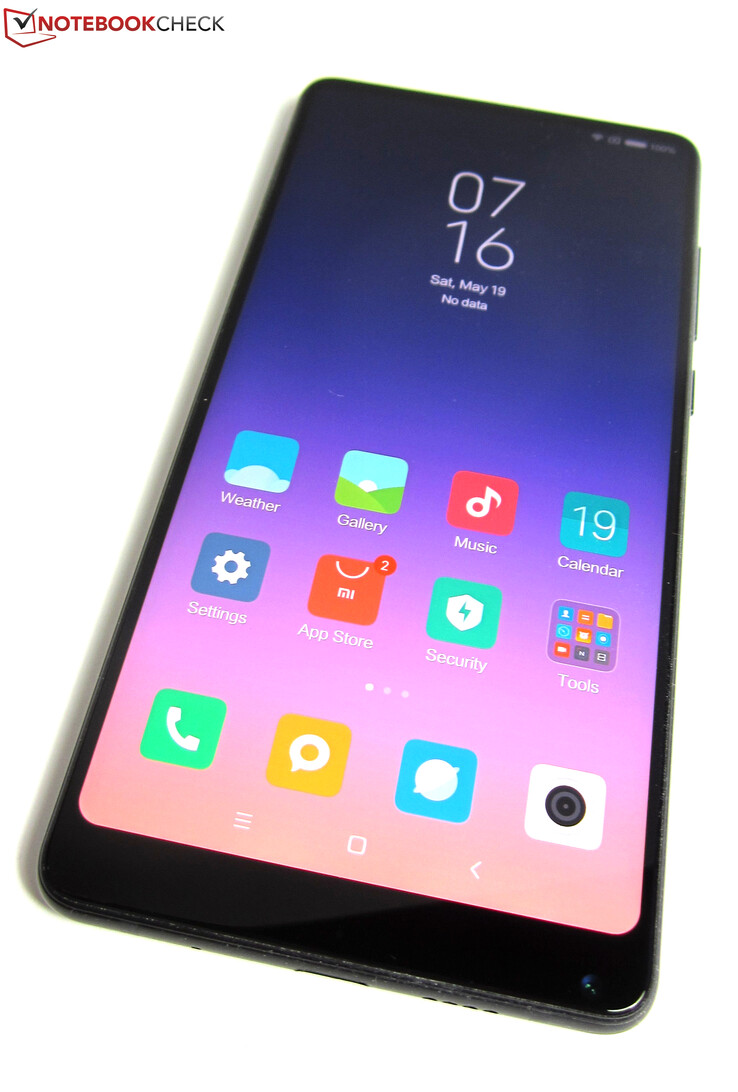
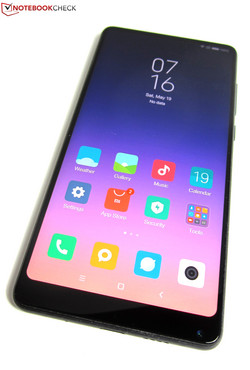
Första klass. En Snapdragon 845 SoC, upp till 8 GB RAM, ett dualkamera-system och en skärm på 6 tum - med sin förstklassiga utrustning tar sig Xiaomi Mi Mix 2S direkt an konkurrensen mot toppmodeller såsom Apple iPhone X. Vårt test visar huruvida Xiaomis nya flaggskepp verkligen kan röra om i smartphone-toppskiktet.
Xiaomi Mi Mix 2S (Mi Serie)
Processor
Qualcomm Snapdragon 845 8 x 2.8 GHz, Cortex-A75 / A55 (Kryo 385)
Minne
6 GB 
, LPDDR4
Skärm
5.99 tum 18:9, 2160 x 1080 pixlar 403 PPI, IPS, 81.9% förhållande mellan skärm och kropp, Corning Gorilla Glass 4, glansig: ja
Hårddisk
128 GB UFS 2.1 Flash, 128 GB 
, 116.6 GB ledigt
Anslutningar
1 USB 2.0, Ljudanslutningar: 3.5-ljud via USB C-adapter, 1 Fingeravtrycksläsare, NFC, Brightness Sensor, Sensorer: accelerationssensor, gyroskop, närhetssensor, kompass, fingeravtrycksläsare, USB OTG, WiFi Direct, Qualcomm Quick Charge 3, Qi Wireless Charging
Nätverk
802.11 a/b/g/n/ac (a/b/g/n = Wi-Fi 4/ac = Wi-Fi 5/), Bluetooth 5.0, GSM (850, 900, 1800, 1900 MHz), UMTS (850, 900, 1900, 2100 MHz), LTE Cat. 18 (Band 1, 2, 3, 4, 5, 7, 8, 12, 17, 20), nerladdning i upp till 1.2 GBit/s, 2x Nano-SIM, SAR (huvud) 0.542 W/kg, SAR (kropp) 1.593 W/kg, Dual SIM, LTE, GPS
Storlek
höjd x bredd x djup (i mm) 8.1 x 150.9 x 74.9
Batteri
3400 mAh Litiumjon
Operativsystem
Android 8.0 Oreo
Camera
Primary Camera: 12 MPix dual-kamera 12 MP (f/1.8, 1/2.55", 1.4 µm) + 12 MP (f/2.4, 1/2.9", 1.0 µm), 4-axlars stabilisering, dual-pixel autofokus, multiframe-brusreducering, slowmotion i 240 FPS
Secondary Camera: 5 MPix f/2.0; 1.4 µm
Övrigt
Högtalare: en högtalare på nedre kanten, Tangentbord: virtuellt, modulär laddare, USB-kabel (Typ A till Typ C), 3.5 mm ljud via USB C-adapter, SIM-verktyg, skyddsfodral, snabbstartsguide, MIUI 9.5, 24 Månader Garanti, fanless
Vikt
189 g, Strömförsörjning: 45 g
Pris
799 EUR
Note: The manufacturer may use components from different suppliers including display panels, drives or memory sticks with similar specifications.


Xiaomi Mi Mix 2S
Xiaomi Mi Mix 2S
Xiaomi Mi Mix 2S
Xiaomi Mi Mix 2S
Xiaomi Mi Mix 2S
Xiaomi Mi Mix 2S
Xiaomi Mi Mix 2S
Xiaomi Mi Mix 2S
Xiaomi Mi Mix 2S
Xiaomi Mi Mix 2S
Xiaomi Mi Mix 2S

Size Comparison

158.1 mm 73.8 mm 8.5 mm 189 g153 mm 72 mm 11.1 mm 198 g155 mm 73.88 mm 7.65 mm 174 g151.8 mm 75.5 mm 7.7 mm 185 g150.9 mm 74.9 mm 8.1 mm 189 g143.6 mm 70.9 mm 7.7 mm 174 g148 mm 105 mm 1 mm 1.5 g
Networking
iperf3 transmit AX12
Xiaomi Mi Mix 2S
Adreno 630, SD 845, 128 GB UFS 2.1 Flash
668 MBit/s
Sony Xperia XZ2
Adreno 630, SD 845, 64 GB UFS 2.1 Flash
633 MBit/s -5%
Xiaomi Mi Mix 2
Adreno 540, SD 835, 64 GB eMMC Flash
585 MBit/s -12%
Samsung Galaxy S9 Plus
Mali-G72 MP18, Exynos 9810, 64 GB UFS 2.1 Flash
519 MBit/s -22%
Apple iPhone X
A11 Bionic GPU, A11 Bionic, 64 GB eMMC Flash
456 MBit/s -32%
Huawei P20 Pro
Mali-G72 MP12, Kirin 970, 128 GB UFS 2.1 Flash
437 MBit/s -35%
iperf3 receive AX12
Apple iPhone X
A11 Bionic GPU, A11 Bionic, 64 GB eMMC Flash
939 MBit/s +44%
Sony Xperia XZ2
Adreno 630, SD 845, 64 GB UFS 2.1 Flash
669 MBit/s +2%
Xiaomi Mi Mix 2
Adreno 540, SD 835, 64 GB eMMC Flash
656 MBit/s 0%
Xiaomi Mi Mix 2S
Adreno 630, SD 845, 128 GB UFS 2.1 Flash
654 MBit/s
Samsung Galaxy S9 Plus
Mali-G72 MP18, Exynos 9810, 64 GB UFS 2.1 Flash
652 MBit/s 0%
Huawei P20 Pro
Mali-G72 MP12, Kirin 970, 128 GB UFS 2.1 Flash
635 MBit/s -3%
Average of class Smartphone
  (last 2 years)
376 MBit/s -43%
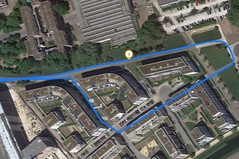
Xiaomi Mi Mix 2S: overall route
Xiaomi Mi Mix 2S: lake
Xiaomi Mi Mix 2S: turning point
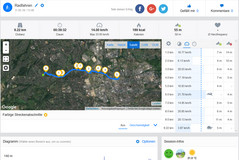
Garmin Edge 500: overall route
Garmin Edge 500: lake
Garmin Edge 500: turning point

Image Comparison

Choose a scene and navigate within the first image. One click changes the position on touchscreens. One click on the zoomed-in image opens the original in a new window. The first image shows the scaled photograph of the test device.

Scene 1Scene 2Scene 3
click to load images
463
cd/m²
481
cd/m²
463
cd/m²
447
cd/m²
492
cd/m²
461
cd/m²
447
cd/m²
466
cd/m²
444
cd/m²
Distribution av ljusstyrkan
tested with X-Rite i1Pro 2
Max: 492 cd/m² (Nits) Medel: 462.7 cd/m² Minimum: 1.35 cd/m²
Distribution av ljusstyrkan: 90 %
Mitt på batteriet: 492 cd/m²
Kontrast: 834:1 (Svärta: 0.59 cd/m²)
ΔE Color 2.4 | 0.5-29.43 Ø5
ΔE Greyscale 4.5 | 0.57-98 Ø5.3
Gamma: 2.25
Xiaomi Mi Mix 2S
IPS, 2160x1080, 5.99
Apple iPhone X
Super AMOLED, 2436x1125, 5.80
Huawei P20 Pro
OLED, 2240x1080, 6.10
Samsung Galaxy S9 Plus
Super AMOLED, 2960x1440, 6.20
Sony Xperia XZ2
IPS, 2160x1080, 5.70
Xiaomi Mi Mix 2
IPS, 2160x1080, 6.00
Screen
37%
37%
22%
36%
15%
Brightness middle
492
600
22%
569
16%
565
15%
630
28%
472
-4%
Brightness
463
606
31%
578
25%
571
23%
632
37%
430
-7%
Brightness Distribution
90
94
4%
95
6%
96
7%
96
7%
87
-3%
Black Level *
0.59
0.44
25%
0.27
54%
Contrast
834
1432
72%
1748
110%
Colorchecker dE 2000 *
2.4
1.2
50%
1.3
46%
2.3
4%
1.5
37%
3.5
-46%
Colorchecker dE 2000 max. *
6.2
3
52%
2.1
66%
4.8
23%
4.3
31%
5.9
5%
Greyscale dE 2000 *
4.5
1.6
64%
1.6
64%
1.9
58%
2.1
53%
4
11%
Gamma
2.25 98%
2.23 99%
2.31 95%
2.16 102%
2.17 101%
2.29 96%
CCT
6395 102%
6707 97%
6401 102%
6332 103%
6513 100%
7048 92%

* ... smaller is better

Screen Flickering / PWM (Pulse-Width Modulation)

To dim the screen, some notebooks will simply cycle the backlight on and off in rapid succession - a method called Pulse Width Modulation (PWM) . This cycling frequency should ideally be undetectable to the human eye. If said frequency is too low, users with sensitive eyes may experience strain or headaches or even notice the flickering altogether.
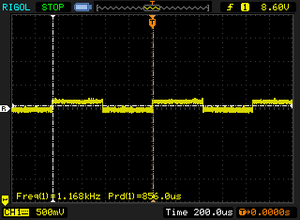
Screen flickering / PWM detected 1168 Hz ≤ 36 % brightness setting

The display backlight flickers at 1168 Hz (worst case, e.g., utilizing PWM) Flickering detected at a brightness setting of 36 % and below. There should be no flickering or PWM above this brightness setting.

The frequency of 1168 Hz is quite high, so most users sensitive to PWM should not notice any flickering.

In comparison: 53 % of all tested devices do not use PWM to dim the display. If PWM was detected, an average of 18071 (minimum: 5 - maximum: 3846000) Hz was measured.

Display Response Times

Display response times show how fast the screen is able to change from one color to the next. Slow response times can lead to afterimages and can cause moving objects to appear blurry (ghosting). Gamers of fast-paced 3D titles should pay special attention to fast response times.
       Response Time Black to White
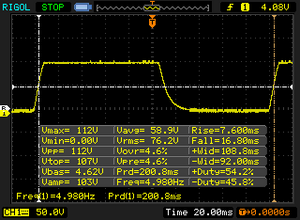
25.4 ms ... rise ↗ and fall ↘ combined↗ 7.6 ms rise
↘ 16.8 ms fall
The screen shows relatively slow response rates in our tests and may be too slow for gamers.
In comparison, all tested devices range from 0.1 (minimum) to 240 (maximum) ms. » 55 % of all devices are better.
This means that the measured response time is worse than the average of all tested devices (21.6 ms).
       Response Time 50% Grey to 80% Grey
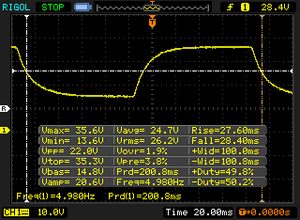
56 ms ... rise ↗ and fall ↘ combined↗ 27.6 ms rise
↘ 28.4 ms fall
The screen shows slow response rates in our tests and will be unsatisfactory for gamers.
In comparison, all tested devices range from 0.2 (minimum) to 636 (maximum) ms. » 91 % of all devices are better.
This means that the measured response time is worse than the average of all tested devices (33.9 ms).
AnTuTu v6 - Total Score (sort by value)
Xiaomi Mi Mix 2S
162183 Points
Apple iPhone X
197851 Points +22%
Huawei P20 Pro
179709 Points +11%
Samsung Galaxy S9 Plus
222290 Points +37%
Sony Xperia XZ2
225663 Points +39%
Average Qualcomm Snapdragon 845 (162183 - 242953, n=23)
225534 Points +39%
AnTuTu v7 - Total Score (sort by value)
Xiaomi Mi Mix 2S
266601 Points
Apple iPhone X
256297 Points -4%
Huawei P20 Pro
207959 Points -22%
Samsung Galaxy S9 Plus
250577 Points -6%
Sony Xperia XZ2
266981 Points 0%
Xiaomi Mi Mix 2
204457 Points -23%
Average Qualcomm Snapdragon 845 (246366 - 299878, n=27)
277434 Points +4%
PCMark for Android
Work performance score (sort by value)
Xiaomi Mi Mix 2S
9179 Points
Huawei P20 Pro
8115 Points -12%
Samsung Galaxy S9 Plus
5822 Points -37%
Sony Xperia XZ2
9319 Points +2%
Xiaomi Mi Mix 2
8169 Points -11%
Average Qualcomm Snapdragon 845 (7998 - 13211, n=26)
10123 Points +10%
Average of class Smartphone (10884 - 19297, n=2, last 2 years)
15091 Points +64%
Work 2.0 performance score (sort by value)
Xiaomi Mi Mix 2S
8078 Points
Huawei P20 Pro
6982 Points -14%
Samsung Galaxy S9 Plus
5319 Points -34%
Sony Xperia XZ2
8069 Points 0%
Xiaomi Mi Mix 2
7046 Points -13%
Average Qualcomm Snapdragon 845 (7360 - 9868, n=27)
8368 Points +4%
Average of class Smartphone (9101 - 12871, n=4, last 2 years)
10872 Points +35%
BaseMark OS II
Overall (sort by value)
Xiaomi Mi Mix 2S
3614 Points
Apple iPhone X
3737 Points +3%
Huawei P20 Pro
3271 Points -9%
Samsung Galaxy S9 Plus
3302 Points -9%
Sony Xperia XZ2
3738 Points +3%
Xiaomi Mi Mix 2
3527 Points -2%
Average Qualcomm Snapdragon 845 (3291 - 4693, n=26)
4111 Points +14%
Average of class Smartphone (411 - 11438, n=162, last 2 years)
5686 Points +57%
System (sort by value)
Xiaomi Mi Mix 2S
5792 Points
Apple iPhone X
10281 Points +78%
Huawei P20 Pro
5965 Points +3%
Samsung Galaxy S9 Plus
6413 Points +11%
Sony Xperia XZ2
8402 Points +45%
Xiaomi Mi Mix 2
5822 Points +1%
Average Qualcomm Snapdragon 845 (4417 - 8613, n=26)
7644 Points +32%
Average of class Smartphone (2376 - 16475, n=162, last 2 years)
9595 Points +66%
Memory (sort by value)
Xiaomi Mi Mix 2S
3012 Points
Apple iPhone X
1219 Points -60%
Huawei P20 Pro
4050 Points +34%
Samsung Galaxy S9 Plus
2625 Points -13%
Sony Xperia XZ2
2193 Points -27%
Xiaomi Mi Mix 2
3544 Points +18%
Average Qualcomm Snapdragon 845 (2193 - 5296, n=26)
3649 Points +21%
Average of class Smartphone (670 - 12306, n=162, last 2 years)
6206 Points +106%
Graphics (sort by value)
Xiaomi Mi Mix 2S
7918 Points
Apple iPhone X
9248 Points +17%
Huawei P20 Pro
3725 Points -53%
Samsung Galaxy S9 Plus
6370 Points -20%
Sony Xperia XZ2
7868 Points -1%
Xiaomi Mi Mix 2
5936 Points -25%
Average Qualcomm Snapdragon 845 (5846 - 8001, n=26)
7797 Points -2%
Average of class Smartphone (697 - 58651, n=162, last 2 years)
13856 Points +75%
Web (sort by value)
Xiaomi Mi Mix 2S
1234 Points
Apple iPhone X
1682 Points +36%
Huawei P20 Pro
1273 Points +3%
Samsung Galaxy S9 Plus
1109 Points -10%
Sony Xperia XZ2
1346 Points +9%
Xiaomi Mi Mix 2
1264 Points +2%
Average Qualcomm Snapdragon 845 (1009 - 1613, n=26)
1344 Points +9%
Average of class Smartphone (10 - 2145, n=162, last 2 years)
1487 Points +21%
Geekbench 4.4
64 Bit Single-Core Score (sort by value)
Xiaomi Mi Mix 2S
2456 Points
Apple iPhone X
4265 Points +74%
Huawei P20 Pro
1922 Points -22%
Samsung Galaxy S9 Plus
3776 Points +54%
Sony Xperia XZ2
2464 Points 0%
Xiaomi Mi Mix 2
1943 Points -21%
Average Qualcomm Snapdragon 845 (2272 - 2500, n=27)
2416 Points -2%
Average of class Smartphone (800 - 9574, n=91, last 2 years)
5109 Points +108%
64 Bit Multi-Core Score (sort by value)
Xiaomi Mi Mix 2S
8937 Points
Apple iPhone X
10255 Points +15%
Huawei P20 Pro
6756 Points -24%
Samsung Galaxy S9 Plus
8963 Points 0%
Sony Xperia XZ2
8510 Points -5%
Xiaomi Mi Mix 2
6649 Points -26%
Average Qualcomm Snapdragon 845 (7754 - 9231, n=27)
8705 Points -3%
Average of class Smartphone (2630 - 26990, n=91, last 2 years)
13696 Points +53%
Compute RenderScript Score (sort by value)
Huawei P20 Pro
8025 Points
Samsung Galaxy S9 Plus
6202 Points
Sony Xperia XZ2
14362 Points
Xiaomi Mi Mix 2
7750 Points
Average Qualcomm Snapdragon 845 (10876 - 14489, n=25)
13578 Points
Average of class Smartphone (2053 - 18432, n=71, last 2 years)
10674 Points
3DMark
1280x720 offscreen Ice Storm Unlimited Score (sort by value)
Xiaomi Mi Mix 2S
56913 Points
Apple iPhone X
64169 Points +13%
Huawei P20 Pro
30176 Points -47%
Samsung Galaxy S9 Plus
39745 Points -30%
Sony Xperia XZ2
62926 Points +11%
Xiaomi Mi Mix 2
41618 Points -27%
Average Qualcomm Snapdragon 845 (34855 - 65330, n=27)
61139 Points +7%
1280x720 offscreen Ice Storm Unlimited Graphics Score (sort by value)
Xiaomi Mi Mix 2S
76078 Points
Apple iPhone X
112489 Points +48%
Huawei P20 Pro
33472 Points -56%
Samsung Galaxy S9 Plus
46610 Points -39%
Sony Xperia XZ2
80233 Points +5%
Xiaomi Mi Mix 2
57134 Points -25%
Average Qualcomm Snapdragon 845 (53794 - 85487, n=27)
80548 Points +6%
1280x720 offscreen Ice Storm Unlimited Physics (sort by value)
Xiaomi Mi Mix 2S
30245 Points
Apple iPhone X
25633 Points -15%
Huawei P20 Pro
22441 Points -26%
Samsung Galaxy S9 Plus
26226 Points -13%
Sony Xperia XZ2
35856 Points +19%
Xiaomi Mi Mix 2
21337 Points -29%
Average Qualcomm Snapdragon 845 (15614 - 37475, n=27)
33322 Points +10%
2560x1440 Sling Shot OpenGL ES 3.0 (sort by value)
Xiaomi Mi Mix 2S
4540 Points
Huawei P20 Pro
3223 Points -29%
Samsung Galaxy S9 Plus
3895 Points -14%
Sony Xperia XZ2
6378 Points +40%
Xiaomi Mi Mix 2
4422 Points -3%
Average Qualcomm Snapdragon 845 (4363 - 6454, n=27)
5811 Points +28%
Average of class Smartphone (712 - 7285, n=52, last 2 years)
3548 Points -22%
2560x1440 Sling Shot OpenGL ES 3.0 Graphics (sort by value)
Xiaomi Mi Mix 2S
6630 Points
Huawei P20 Pro
3335 Points -50%
Samsung Galaxy S9 Plus
4637 Points -30%
Sony Xperia XZ2
8122 Points +23%
Xiaomi Mi Mix 2
5599 Points -16%
Average Qualcomm Snapdragon 845 (5637 - 8312, n=27)
7763 Points +17%
Average of class Smartphone (618 - 9451, n=52, last 2 years)
3905 Points -41%
2560x1440 Sling Shot OpenGL ES 3.0 Physics (sort by value)
Xiaomi Mi Mix 2S
2159 Points
Huawei P20 Pro
2885 Points +34%
Samsung Galaxy S9 Plus
2496 Points +16%
Sony Xperia XZ2
3642 Points +69%
Xiaomi Mi Mix 2
2547 Points +18%
Average Qualcomm Snapdragon 845 (2124 - 3668, n=27)
3115 Points +44%
Average of class Smartphone (1093 - 4525, n=52, last 2 years)
3005 Points +39%
2560x1440 Sling Shot Extreme (ES 3.1) (sort by value)
Xiaomi Mi Mix 2S
4248 Points
Apple iPhone X
3138 Points -26%
Huawei P20 Pro
2996 Points -29%
Samsung Galaxy S9 Plus
3256 Points -23%
Sony Xperia XZ2
4693 Points +10%
Xiaomi Mi Mix 2
3732 Points -12%
Average Qualcomm Snapdragon 845 (3197 - 4734, n=27)
4388 Points +3%
Average of class Smartphone (286 - 7890, n=104, last 2 years)
2680 Points -37%
2560x1440 Sling Shot Extreme (ES 3.1) Graphics (sort by value)
Xiaomi Mi Mix 2S
5181 Points
Apple iPhone X
3463 Points -33%
Huawei P20 Pro
3017 Points -42%
Samsung Galaxy S9 Plus
3582 Points -31%
Sony Xperia XZ2
5122 Points -1%
Xiaomi Mi Mix 2
4034 Points -22%
Average Qualcomm Snapdragon 845 (3488 - 5246, n=27)
4919 Points -5%
Average of class Smartphone (240 - 9814, n=104, last 2 years)
2667 Points -49%
2560x1440 Sling Shot Extreme (ES 3.1) Physics (sort by value)
Xiaomi Mi Mix 2S
2606 Points
Apple iPhone X
2361 Points -9%
Huawei P20 Pro
2926 Points +12%
Samsung Galaxy S9 Plus
2469 Points -5%
Sony Xperia XZ2
3630 Points +39%
Xiaomi Mi Mix 2
2956 Points +13%
Average Qualcomm Snapdragon 845 (2118 - 3703, n=27)
3217 Points +23%
Average of class Smartphone (858 - 4679, n=104, last 2 years)
3126 Points +20%
GFXBench (DX / GLBenchmark) 2.7
T-Rex Onscreen (sort by value)
Xiaomi Mi Mix 2S
60 fps
Apple iPhone X
59.4 fps -1%
Huawei P20 Pro
60 fps 0%
Samsung Galaxy S9 Plus
60 fps 0%
Sony Xperia XZ2
60 fps 0%
Xiaomi Mi Mix 2
60 fps 0%
Average Qualcomm Snapdragon 845 (58 - 89, n=27)
62.1 fps +4%
Average of class Smartphone (22 - 165, n=180, last 2 years)
83.1 fps +39%
1920x1080 T-Rex Offscreen (sort by value)
Xiaomi Mi Mix 2S
150 fps
Apple iPhone X
177.4 fps +18%
Huawei P20 Pro
121 fps -19%
Samsung Galaxy S9 Plus
147 fps -2%
Sony Xperia XZ2
150 fps 0%
Xiaomi Mi Mix 2
102 fps -32%
Average Qualcomm Snapdragon 845 (98 - 152, n=28)
142.5 fps -5%
Average of class Smartphone (19 - 791, n=180, last 2 years)
243 fps +62%
GFXBench 3.0
on screen Manhattan Onscreen OGL (sort by value)
Xiaomi Mi Mix 2S
59 fps
Apple iPhone X
58.5 fps -1%
Huawei P20 Pro
54 fps -8%
Samsung Galaxy S9 Plus
45 fps -24%
Sony Xperia XZ2
59 fps 0%
Xiaomi Mi Mix 2
45 fps -24%
Average Qualcomm Snapdragon 845 (33 - 75, n=27)
54.4 fps -8%
Average of class Smartphone (6.8 - 165, n=181, last 2 years)
70.8 fps +20%
1920x1080 1080p Manhattan Offscreen (sort by value)
Xiaomi Mi Mix 2S
74 fps
Apple iPhone X
88.2 fps +19%
Huawei P20 Pro
61 fps -18%
Samsung Galaxy S9 Plus
74 fps 0%
Sony Xperia XZ2
82 fps +11%
Xiaomi Mi Mix 2
49 fps -34%
Average Qualcomm Snapdragon 845 (54 - 83, n=27)
73.1 fps -1%
Average of class Smartphone (9.2 - 363, n=181, last 2 years)
137.8 fps +86%
GFXBench 3.1
on screen Manhattan ES 3.1 Onscreen (sort by value)
Xiaomi Mi Mix 2S
55 fps
Apple iPhone X
44.1 fps -20%
Huawei P20 Pro
36 fps -35%
Samsung Galaxy S9 Plus
24 fps -56%
Sony Xperia XZ2
55 fps 0%
Xiaomi Mi Mix 2
34 fps -38%
Average Qualcomm Snapdragon 845 (21 - 59, n=27)
45.3 fps -18%
Average of class Smartphone (3.7 - 158, n=181, last 2 years)
59.7 fps +9%
1920x1080 Manhattan ES 3.1 Offscreen (sort by value)
Xiaomi Mi Mix 2S
60 fps
Apple iPhone X
48.9 fps -18%
Huawei P20 Pro
39 fps -35%
Samsung Galaxy S9 Plus
47 fps -22%
Sony Xperia XZ2
60 fps 0%
Xiaomi Mi Mix 2
34 fps -43%
Average Qualcomm Snapdragon 845 (32 - 61, n=28)
53.9 fps -10%
Average of class Smartphone (6.2 - 279, n=181, last 2 years)
97.1 fps +62%
GFXBench
on screen Car Chase Onscreen (sort by value)
Xiaomi Mi Mix 2S
34 fps
Apple iPhone X
27.7 fps -19%
Huawei P20 Pro
22 fps -35%
Samsung Galaxy S9 Plus
14 fps -59%
Sony Xperia XZ2
33 fps -3%
Xiaomi Mi Mix 2
23 fps -32%
Average Qualcomm Snapdragon 845 (13 - 37, n=27)
27.7 fps -19%
Average of class Smartphone (5 - 117, n=181, last 2 years)
42.7 fps +26%
1920x1080 Car Chase Offscreen (sort by value)
Xiaomi Mi Mix 2S
35 fps
Apple iPhone X
31.8 fps -9%
Huawei P20 Pro
23 fps -34%
Samsung Galaxy S9 Plus
28 fps -20%
Sony Xperia XZ2
35 fps 0%
Xiaomi Mi Mix 2
24 fps -31%
Average Qualcomm Snapdragon 845 (25 - 35, n=27)
33.4 fps -5%
Average of class Smartphone (2.9 - 166, n=181, last 2 years)
58.6 fps +67%

Legend

 
Xiaomi Mi Mix 2S Qualcomm Snapdragon 845, Qualcomm Adreno 630, 128 GB UFS 2.1 Flash
 
Apple iPhone X Apple A11 Bionic, Apple A11 Bionic GPU, 64 GB eMMC Flash
 
Huawei P20 Pro HiSilicon Kirin 970, ARM Mali-G72 MP12, 128 GB UFS 2.1 Flash
 
Samsung Galaxy S9 Plus Samsung Exynos 9810, ARM Mali-G72 MP18, 64 GB UFS 2.1 Flash
 
Sony Xperia XZ2 Qualcomm Snapdragon 845, Qualcomm Adreno 630, 64 GB UFS 2.1 Flash
 
Xiaomi Mi Mix 2 Qualcomm Snapdragon 835 (8998), Qualcomm Adreno 540, 64 GB eMMC Flash
JetStream 1.1 - Total Score
Apple iPhone X (IOS 11.1.1)
224 Points +221%
Sony Xperia XZ2 (Chrome 65)
89.5 Points +28%
Average of class Smartphone (66.1 - 104.3, n=2, last 2 years)
85.2 Points +22%
Average Qualcomm Snapdragon 845 (22.5 - 90.9, n=25)
80.3 Points +15%
Xiaomi Mi Mix 2S (Chrome 66.0.3359.158)
69.8 Points
Samsung Galaxy S9 Plus (Samsung Browser 7.0)
69.6 Points 0%
Huawei P20 Pro (Chrome 65)
58.3 Points -16%
Octane V2 - Total Score
Apple iPhone X (IOS 11.1.2)
35255 Points +143%
Average of class Smartphone (4633 - 89112, n=205, last 2 years)
33314 Points +130%
Sony Xperia XZ2 (Chrome 65)
16774 Points +16%
Average Qualcomm Snapdragon 845 (3991 - 18275, n=28)
15153 Points +5%
Samsung Galaxy S9 Plus (Samsung Browser 7.0)
14760 Points +2%
Xiaomi Mi Mix 2S (Chrome 66.0.3359.158)
14491 Points
Huawei P20 Pro (Chrome 65)
11584 Points -20%
Xiaomi Mi Mix 2 (Chrome 53)
10122 Points -30%
Mozilla Kraken 1.1 - Total
Huawei P20 Pro (Chrome 65)
3852 ms * -34%
Average Qualcomm Snapdragon 845 (2154 - 11204, n=28)
2905 ms * -1%
Xiaomi Mi Mix 2S (Chrome 66.0.3359.158)
2868 ms *
Xiaomi Mi Mix 2 (Chrome 53)
2713 ms * +5%
Sony Xperia XZ2 (Chrome 65)
2394 ms * +17%
Samsung Galaxy S9 Plus (Samsung Browser 7.0)
2060 ms * +28%
Average of class Smartphone (388 - 9999, n=168, last 2 years)
1658 ms * +42%
Apple iPhone X (IOS 11.1.2)
718 ms * +75%
WebXPRT 2015 - Overall
Apple iPhone X (Safari Mobile 11.0)
354 Points +55%
Sony Xperia XZ2 (Chrome 65)
262 Points +15%
Average Qualcomm Snapdragon 845 (96 - 291, n=23)
246 Points +8%
Xiaomi Mi Mix 2S (Chrome 66.0.3359.158)
228 Points
Huawei P20 Pro (Chrome 65)
182 Points -20%
Samsung Galaxy S9 Plus (Samsung Browser 7.0)
164 Points -28%
Xiaomi Mi Mix 2 (Chrome 53)
57 Points -75%

* ... smaller is better

Xiaomi Mi Mix 2SHuawei P20 ProSamsung Galaxy S9 PlusSony Xperia XZ2Xiaomi Mi Mix 2Average 128 GB UFS 2.1 FlashAverage of class Smartphone
AndroBench 3-5
9%
-20%
-23%
-21%
15%
176%
Sequential Read 256KB
756
832
10%
819
8%
679
-10%
704
-7%
758 ?(427 - 1011, n=114)
0%
1471 ?(215 - 4512, n=213, last 2 years)
95%
Sequential Write 256KB
208.1
196.7
-5%
204.9
-2%
198.7
-5%
208.6
0%
299 ?(13.6 - 719, n=114)
44%
1084 ?(57.5 - 3678, n=213, last 2 years)
421%
Random Read 4KB
135.1
144.3
7%
129.7
-4%
149.4
11%
148.5
10%
153.3 ?(92.6 - 239, n=114)
13%
243 ?(22.2 - 543, n=213, last 2 years)
80%
Random Write 4KB
128.4
160.5
25%
22.74
-82%
17
-87%
15.75
-88%
132.4 ?(18.2 - 290, n=114)
3%
267 ?(13 - 709, n=213, last 2 years)
108%
Hög belastning
 39.2 °C39.5 °C40.3 °C 
 38.7 °C39.2 °C40.3 °C 
 38.5 °C38.2 °C40.6 °C 
Max: 40.6 °C
Medel: 39.4 °C
33.7 °C34.7 °C36.3 °C
34 °C35.3 °C36.9 °C
34.6 °C35.1 °C36.6 °C
Max: 36.9 °C
Medel: 35.2 °C
Strömförsörjning (max.)  34.1 °C | Rumstemperatur 22 °C | Voltcraft IR-260
(-) The average temperature for the upper side under maximal load is 39.4 °C / 103 F, compared to the average of 32.7 °C / 91 F for the devices in the class Smartphone.
(±) The maximum temperature on the upper side is 40.6 °C / 105 F, compared to the average of 35 °C / 95 F, ranging from 21.9 to 56 °C for the class Smartphone.
(+) The bottom heats up to a maximum of 36.9 °C / 98 F, compared to the average of 33.8 °C / 93 F
(±) In idle usage, the average temperature for the upper side is 36 °C / 97 F, compared to the device average of 32.7 °C / 91 F.
dB(A) 0102030405060708090Deep BassMiddle BassHigh BassLower RangeMidsHigher MidsLower HighsMid HighsUpper HighsSuper Highs2035.240.72532.9433137.238.14031.736.55039.632.16328.333.58027.332.410026.929.612526.731.8160243820020.945.925020.952.931519.555.440018.559.650017.562.763017.568.680015.769.9100015.870.8125016.673.9160015.871.7200015.472.2250015.571.431501671.4400015.873.450001672.3630016.369.2800016.368.21000016.263.81250016.453.51600016.453.5SPL28.683.1N1.155.1median 16.4median 68.2Delta2.29.127.727.427.727.726.427.725.430.125.430.529.930.530.924.330.923.825.723.82223.42222.923.522.927.727.427.727.221.327.24020.44048.42248.454.220.554.256.620.256.66220.76265.616.765.666.817.966.87018.47072.117.572.173.717.173.774.91574.977.115.377.178.114.578.179.514.179.575.513.975.570.713.870.768.613.968.666.213.966.261.613.861.646.713.746.786.628.686.661.71.161.7median 66.2median 17.1median 66.212.63.212.635.240.532.942.437.233.831.73039.635.128.33127.327.326.930.626.738.62446.820.951.720.955.319.554.218.556.917.561.817.565.315.769.315.872.516.675.215.869.415.471.915.573.91675.315.876.81674.516.370.616.371.316.267.216.459.716.44928.684.91.160.3median 16.4median 67.22.28.9hearing rangehide median Pink NoiseXiaomi Mi Mix 2SXiaomi Mi Mix 2Huawei P20 Pro
Frequency diagram (checkboxes can be checked and unchecked to compare devices)
Xiaomi Mi Mix 2S audio analysis

(+) | speakers can play relatively loud (83.1 dB)
Bass 100 - 315 Hz
(-) | nearly no bass - on average 26% lower than median
(±) | linearity of bass is average (9.2% delta to prev. frequency)
Mids 400 - 2000 Hz
(+) | balanced mids - only 4% away from median
(+) | mids are linear (5.1% delta to prev. frequency)
Highs 2 - 16 kHz
(+) | balanced highs - only 3% away from median
(+) | highs are linear (3.4% delta to prev. frequency)
Overall 100 - 16.000 Hz
(±) | linearity of overall sound is average (20.5% difference to median)
Compared to same class
» 28% of all tested devices in this class were better, 9% similar, 63% worse
» The best had a delta of 12%, average was 38%, worst was 134%
Compared to all devices tested
» 49% of all tested devices were better, 8% similar, 43% worse
» The best had a delta of 4%, average was 25%, worst was 134%

Xiaomi Mi Mix 2 audio analysis

(+) | speakers can play relatively loud (86.6 dB)
Bass 100 - 315 Hz
(-) | nearly no bass - on average 29.5% lower than median
(±) | linearity of bass is average (11.2% delta to prev. frequency)
Mids 400 - 2000 Hz
(±) | higher mids - on average 5.1% higher than median
(+) | mids are linear (5.3% delta to prev. frequency)
Highs 2 - 16 kHz
(±) | higher highs - on average 7.4% higher than median
(+) | highs are linear (5.2% delta to prev. frequency)
Overall 100 - 16.000 Hz
(±) | linearity of overall sound is average (26% difference to median)
Compared to same class
» 60% of all tested devices in this class were better, 7% similar, 33% worse
» The best had a delta of 12%, average was 38%, worst was 134%
Compared to all devices tested
» 76% of all tested devices were better, 5% similar, 19% worse
» The best had a delta of 4%, average was 25%, worst was 134%

Huawei P20 Pro audio analysis

(+) | speakers can play relatively loud (84.9 dB)
Bass 100 - 315 Hz
(-) | nearly no bass - on average 21% lower than median
(±) | linearity of bass is average (9.5% delta to prev. frequency)
Mids 400 - 2000 Hz
(±) | higher mids - on average 5% higher than median
(±) | linearity of mids is average (7.2% delta to prev. frequency)
Highs 2 - 16 kHz
(±) | higher highs - on average 5.6% higher than median
(+) | highs are linear (4.5% delta to prev. frequency)
Overall 100 - 16.000 Hz
(±) | linearity of overall sound is average (20.1% difference to median)
Compared to same class
» 26% of all tested devices in this class were better, 9% similar, 65% worse
» The best had a delta of 12%, average was 38%, worst was 134%
Compared to all devices tested
» 46% of all tested devices were better, 8% similar, 45% worse
» The best had a delta of 4%, average was 25%, worst was 134%

Strömförbrukning
Av/Standbydarklight 0 / 0.18 Watt
Låg belastningdarkmidlight 0.75 / 2.25 / 2.26 Watt
Hög belastning midlight 4.89 / 9.6 Watt
 color bar
Förklaring: min: dark, med: mid, max: light        Metrahit Energy
Currently we use the Metrahit Energy, a professional single phase power quality and energy measurement digital multimeter, for our measurements. Find out more about it here. All of our test methods can be found here.
Xiaomi Mi Mix 2S
3400 mAh
Apple iPhone X
2716 mAh
Huawei P20 Pro
4000 mAh
Samsung Galaxy S9 Plus
3500 mAh
Sony Xperia XZ2
3180 mAh
Xiaomi Mi Mix 2
3771 mAh
Average Qualcomm Snapdragon 845
 
Average of class Smartphone
 
Power Consumption
2%
35%
34%
3%
14%
4%
9%
Idle Minimum *
0.75
1.03
-37%
0.84
-12%
0.68
9%
0.72
4%
0.69
8%
0.862 ?(0.42 - 1.8, n=26)
-15%
0.896 ?(0.42 - 2.37, n=159, last 2 years)
-19%
Idle Average *
2.25
2.4
-7%
1.54
32%
0.95
58%
2.21
2%
2.03
10%
1.728 ?(0.67 - 2.9, n=26)
23%
1.449 ?(0.69 - 4.26, n=159, last 2 years)
36%
Idle Maximum *
2.26
2.6
-15%
1.57
31%
1.09
52%
2.22
2%
2.1
7%
2.07 ?(0.87 - 3.5, n=26)
8%
1.629 ?(0.79 - 4.45, n=159, last 2 years)
28%
Load Average *
4.89
2.96
39%
2.47
49%
4.58
6%
4.6
6%
3.18
35%
4.87 ?(3.56 - 7.41, n=26)
-0%
5.51 ?(2.3 - 16.5, n=159, last 2 years)
-13%
Load Maximum *
9.6
6.6
31%
2.49
74%
5.16
46%
9.34
3%
8.73
9%
9.27 ?(6.2 - 12.3, n=26)
3%
8.19 ?(4.32 - 20.8, n=159, last 2 years)
15%

* ... smaller is better

Batteritid
Låg belastning (utan WLAN, min. ljusstyrka)
27tim 58min
WiFi Websurfing
11tim 56min
Big Buck Bunny H.264 1080p
11tim 58min
Hög belastning (maximal ljusstyrka)
3tim 59min
Xiaomi Mi Mix 2S
3400 mAh
Apple iPhone X
2716 mAh
Huawei P20 Pro
4000 mAh
Samsung Galaxy S9 Plus
3500 mAh
Sony Xperia XZ2
3180 mAh
Xiaomi Mi Mix 2
3771 mAh
Battery Runtime
-20%
15%
-14%
-13%
-16%
Reader / Idle
1678
1292
-23%
1727
3%
1343
-20%
1402
-16%
H.264
718
634
-12%
784
9%
674
-6%
722
1%
WiFi v1.3
716
564
-21%
744
4%
521
-27%
679
-5%
600
-16%
Load
239
180
-25%
345
44%
237
-1%
159
-33%

För

+ väldigt snabb SoC
+ hölje av hög kvalitet
+ dual-SIM
+ USB-C
+ Android 8.0 med intuitivt MIUI 9.5-gränssnitt
+ ljusstark skärm
+ väldigt bra dual-kameror
+ låg värmeutveckling
+ bra batteritid
+ skyddsfodral ingår

Emot

- USB C bara med 2.0-hastighet
- ingen IP-certifiering
- ingen microSD-plats
- 3.5 mm ljudanslutning bara genom USB C-adapter
Recenseras: Xiaomi Mi Mix 2S. Testenhet från Trading Shenzen Shop.

Läs den fullständiga versionen av den här recensionen på engelska här.

Precis som med Xiaomi Mi Mix 2, så har Xiaomi Mi Mix 2S inga svagheter värda att nämna. Konstruktionskvaliteten hos denna enhet på 5.99 tum är i toppklass, skärmen visar en rakbladsskarp bild av innehållet, dual-kameran hör till dom bästa smartphone-kamerorna som finns och kommunikationsmodulerna lämnar heller knappt något att önska. Dessutom har den en blixtsnabb SoC i form av en Snapdragon 845, vilket gör det fantastiskt smidigt att använda Mi Mix 2S. Även om Android 8.0 har piffats upp med MIUI 9.5 och därmed har ett lite annorlunda upplägg jämfört med grundläggande Android så kan den navigeras precis lika intuitivt och lägger dessutom till några praktiska tillägg.

Det finns bara ett fåtal negativa saker med Xiaomis senaste flaggskepp: USB C-porten kan bara hantera USB 2.0-hastighet och det finns ingen microSD-plats. Du kan byta ut den saknade ljudanslutningen på 3.5 mm med hjälp av den inkluderade USB-adaptern. Till skillnad från många andra toppskikts-rivaler så har Mi Mix 2S ingen IP-certifiering, så den är inte skyddad från damm eller vatten. Skaffar man Xiaomi genom import från Kina, som vi gjorde, behöver man själv installera Google Play, men det är inte riktigt ett problem då det går fort att göra.

En framgångsrik bedrift: Med sin sammantaget kraftfulla prestanda rekommenderar Xiaomi Mi Mix 2S sig själv som ett bra alternativ till toppskikts-telefoner såsom Apple iPhone X, Huawei P20 Pro eller Samsung Galaxy S9+.

Xiaomi Mi Mix 2S - 05/22/2018 v6(old)
Manuel Masiero

Design
86%
Tangentbord
69 / 75 → 92%
Mus
92%
Anslutningar
47 / 60 → 78%
Vikt
89%
Batteri
94%
Skärm
86%
Spelprestanda
68 / 63 → 100%
Programprestanda
73 / 70 → 100%
Temperatur
86%
Ljudnivå
100%
Audio
77 / 91 → 85%
Camera
84%
Medel
81%
88%
Smartphone - Vägt medel

Pricecompare

Please share our article, every link counts!
> Bärbara datorer, laptops - tester och nyheter > Tester > Test: Xiaomi Mi Mix 2S Smartphone (Sammanfattning)
Manuel Masiero, 2018-05-29 (Update: 2018-05-29)