Test: Xiaomi Mi Max 3 Smartphone (Sammanfattning)


| Networking | |
| iperf3 transmit AX12 | |
| Sony Xperia XA2 Plus | |
| Asus Zenfone 5 ZE620KL | |
| Xiaomi Mi Max 3 | |
| JVC J20 | |
| Honor Play | |
| iperf3 receive AX12 | |
| Xiaomi Mi Max 3 | |
| Asus Zenfone 5 ZE620KL | |
| Sony Xperia XA2 Plus | |
| JVC J20 | |
| Honor Play | |


| |||||||||||||||||||||||||
Distribution av ljusstyrkan: 91 %
Mitt på batteriet: 508 cd/m²
Kontrast: 1814:1 (Svärta: 0.28 cd/m²)
ΔE ColorChecker Calman: 2.85 | ∀{0.5-29.43 Ø4.71}
ΔE Greyscale Calman: 1.7 | ∀{0.09-98 Ø4.96}
99.7% sRGB (Calman 2D)
Gamma: 2.226
CCT: 6860 K
| Xiaomi Mi Max 3 IPS, 2160x1080, 6.9" | Sony Xperia XA2 Plus IPS, 2160x1080, 6" | Honor Play IPS, 2340x1080, 6.3" | JVC J20 IPS, 2160x1080, 5.7" | Asus Zenfone 5 ZE620KL IPS, 2246x1080, 6.2" | |
|---|---|---|---|---|---|
| Screen | -6% | -31% | -134% | -41% | |
| Brightness middle (cd/m²) | 508 | 597 18% | 435 -14% | 411 -19% | 595 17% |
| Brightness (cd/m²) | 505 | 592 17% | 426 -16% | 426 -16% | 561 11% |
| Brightness Distribution (%) | 91 | 92 1% | 89 -2% | 82 -10% | 87 -4% |
| Black Level * (cd/m²) | 0.28 | 0.32 -14% | 0.39 -39% | 0.53 -89% | 0.54 -93% |
| Contrast (:1) | 1814 | 1866 3% | 1115 -39% | 775 -57% | 1102 -39% |
| Colorchecker dE 2000 * | 2.85 | 2.4 16% | 2.89 -1% | 8.84 -210% | 4.2 -47% |
| Colorchecker dE 2000 max. * | 6.21 | 5.3 15% | 6.03 3% | 15.08 -143% | 6 3% |
| Greyscale dE 2000 * | 1.7 | 3.4 -100% | 4.1 -141% | 10.7 -529% | 4.7 -176% |
| Gamma | 2.226 99% | 2.2 100% | 2.251 98% | 2.433 90% | 2.12 104% |
| CCT | 6860 95% | 7172 91% | 7408 88% | 10717 61% | 7577 86% |
* ... mindre är bättre
Skärmflimmer / PWM (Puls-Width Modulation)
| Skärmflimmer / PWM upptäckt | 2358 Hz | ≤ 10 % ljusstyrka inställning | 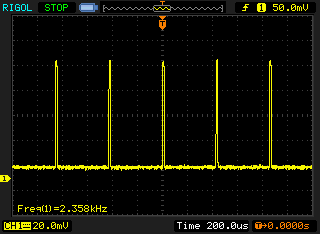 |
Displayens bakgrundsbelysning flimrar vid 2358 Hz (i värsta fall, t.ex. med PWM) Flimrande upptäckt vid en ljusstyrkeinställning på 10 % och lägre. Det ska inte finnas något flimmer eller PWM över denna ljusstyrkeinställning. Frekvensen för 2358 Hz är ganska hög, så de flesta användare som är känsliga för PWM bör inte märka något flimmer. Som jämförelse: 52 % av alla testade enheter använder inte PWM för att dämpa skärmen. Om PWM upptäcktes mättes ett medelvärde av 7754 (minst: 5 - maximum: 343500) Hz. | |||
Visa svarstider
| ↔ Svarstid svart till vitt | ||
|---|---|---|
| 22 ms ... stiga ↗ och falla ↘ kombinerat | ↗ 9 ms stiga | 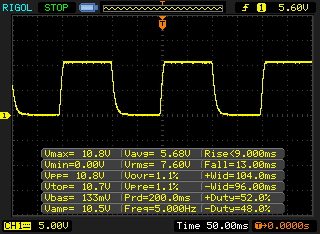 |
| ↘ 13 ms hösten | ||
| Skärmen visar bra svarsfrekvens i våra tester, men kan vara för långsam för konkurrenskraftiga spelare. I jämförelse sträcker sig alla testade enheter från 0.1 (minst) till 240 (maximalt) ms. » 49 % av alla enheter är bättre. Detta innebär att den uppmätta svarstiden är sämre än genomsnittet av alla testade enheter (19.8 ms). | ||
| ↔ Svarstid 50 % grått till 80 % grått | ||
| 45 ms ... stiga ↗ och falla ↘ kombinerat | ↗ 22 ms stiga | 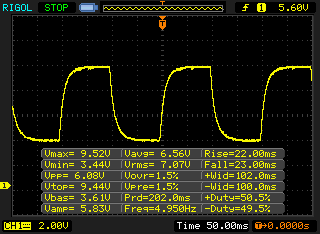 |
| ↘ 23 ms hösten | ||
| Skärmen visar långsamma svarsfrekvenser i våra tester och kommer att vara otillfredsställande för spelare. I jämförelse sträcker sig alla testade enheter från 0.165 (minst) till 636 (maximalt) ms. » 77 % av alla enheter är bättre. Detta innebär att den uppmätta svarstiden är sämre än genomsnittet av alla testade enheter (31 ms). | ||
| AnTuTu v6 - Total Score (sortera efter värde) | |
| Xiaomi Mi Max 3 | |
| Sony Xperia XA2 Plus | |
| Honor Play | |
| JVC J20 | |
| Asus Zenfone 5 ZE620KL | |
| Genomsnitt Qualcomm Snapdragon 636 (92015 - 125213, n=10) | |
| AnTuTu v7 - Total Score (sortera efter värde) | |
| Xiaomi Mi Max 3 | |
| Sony Xperia XA2 Plus | |
| Honor Play | |
| JVC J20 | |
| Asus Zenfone 5 ZE620KL | |
| Genomsnitt Qualcomm Snapdragon 636 (115565 - 138661, n=11) | |
| PCMark for Android - Work performance score (sortera efter värde) | |
| Xiaomi Mi Max 3 | |
| Sony Xperia XA2 Plus | |
| Honor Play | |
| JVC J20 | |
| Asus Zenfone 5 ZE620KL | |
| Genomsnitt Qualcomm Snapdragon 636 (6040 - 7618, n=11) | |
| GFXBench (DX / GLBenchmark) 2.7 | |
| T-Rex Onscreen (sortera efter värde) | |
| Xiaomi Mi Max 3 | |
| Sony Xperia XA2 Plus | |
| Honor Play | |
| JVC J20 | |
| Asus Zenfone 5 ZE620KL | |
| Genomsnitt Qualcomm Snapdragon 636 (30 - 40, n=12) | |
| Genomsnitt av klass Smartphone (12 - 166, n=112, senaste 2 åren) | |
| 1920x1080 T-Rex Offscreen (sortera efter värde) | |
| Xiaomi Mi Max 3 | |
| Sony Xperia XA2 Plus | |
| Honor Play | |
| JVC J20 | |
| Asus Zenfone 5 ZE620KL | |
| Genomsnitt Qualcomm Snapdragon 636 (35 - 36, n=12) | |
| Genomsnitt av klass Smartphone (22 - 954, n=112, senaste 2 åren) | |
| GFXBench 3.0 | |
| on screen Manhattan Onscreen OGL (sortera efter värde) | |
| Xiaomi Mi Max 3 | |
| Sony Xperia XA2 Plus | |
| Honor Play | |
| JVC J20 | |
| Asus Zenfone 5 ZE620KL | |
| Genomsnitt Qualcomm Snapdragon 636 (13 - 18, n=12) | |
| Genomsnitt av klass Smartphone (18 - 166, n=113, senaste 2 åren) | |
| 1920x1080 1080p Manhattan Offscreen (sortera efter värde) | |
| Xiaomi Mi Max 3 | |
| Sony Xperia XA2 Plus | |
| Honor Play | |
| JVC J20 | |
| Asus Zenfone 5 ZE620KL | |
| Genomsnitt Qualcomm Snapdragon 636 (16 - 16, n=12) | |
| Genomsnitt av klass Smartphone (14 - 606, n=112, senaste 2 åren) | |
| GFXBench 3.1 | |
| on screen Manhattan ES 3.1 Onscreen (sortera efter värde) | |
| Xiaomi Mi Max 3 | |
| Sony Xperia XA2 Plus | |
| Honor Play | |
| JVC J20 | |
| Asus Zenfone 5 ZE620KL | |
| Genomsnitt Qualcomm Snapdragon 636 (5.7 - 12, n=12) | |
| Genomsnitt av klass Smartphone (11 - 166, n=113, senaste 2 åren) | |
| 1920x1080 Manhattan ES 3.1 Offscreen (sortera efter värde) | |
| Xiaomi Mi Max 3 | |
| Sony Xperia XA2 Plus | |
| Honor Play | |
| JVC J20 | |
| Asus Zenfone 5 ZE620KL | |
| Genomsnitt Qualcomm Snapdragon 636 (6.3 - 10, n=12) | |
| Genomsnitt av klass Smartphone (8.6 - 413, n=112, senaste 2 åren) | |
| JetStream 1.1 - 1.1 Total | |
| Asus Zenfone 5 ZE620KL (Chrome 67) | |
| Genomsnitt Qualcomm Snapdragon 636 (44.2 - 51.5, n=11) | |
| Xiaomi Mi Max 3 (Chrome 69) | |
| Honor Play (Chrome 68) | |
| JVC J20 (Chrome 68) | |
| Sony Xperia XA2 Plus (Chrome 67) | |
| Octane V2 - Total Score | |
| Genomsnitt av klass Smartphone (2800 - 126661, n=142, senaste 2 åren) | |
| Asus Zenfone 5 ZE620KL (Chrome 67) | |
| Genomsnitt Qualcomm Snapdragon 636 (8163 - 9746, n=12) | |
| Xiaomi Mi Max 3 (Chrome 69) | |
| Honor Play (Chrome 68) | |
| JVC J20 (Chrome 68) | |
| Sony Xperia XA2 Plus (Chrome 67) | |
| Mozilla Kraken 1.1 - Total | |
| Sony Xperia XA2 Plus (Chrome 67) | |
| JVC J20 (Chrome 68) | |
| Honor Play (Chrome 68) | |
| Genomsnitt Qualcomm Snapdragon 636 (4105 - 5066, n=12) | |
| Xiaomi Mi Max 3 (Chrome 69) | |
| Asus Zenfone 5 ZE620KL (Chrome 67) | |
| Genomsnitt av klass Smartphone (257 - 28190, n=121, senaste 2 åren) | |
| WebXPRT 2015 - Overall | |
| Genomsnitt Qualcomm Snapdragon 636 (147 - 184, n=8) | |
| Xiaomi Mi Max 3 (Chrome 69) | |
| Honor Play (Chrome 68) | |
| Sony Xperia XA2 Plus (Chrome 67) | |
* ... mindre är bättre
| Xiaomi Mi Max 3 | Sony Xperia XA2 Plus | Honor Play | JVC J20 | Asus Zenfone 5 ZE620KL | Genomsnitt 64 GB eMMC Flash | Genomsnitt av klass Smartphone | |
|---|---|---|---|---|---|---|---|
| AndroBench 3-5 | -15% | 70% | -17% | 3% | -15% | 569% | |
| Sequential Read 256KB (MB/s) | 274.6 | 281.1 2% | 895 226% | 270.6 -1% | 286.6 4% | 278 ? 1% | 2225 ? 710% |
| Sequential Write 256KB (MB/s) | 185.4 | 146.2 -21% | 188.3 2% | 199.7 8% | 201.8 9% | 178.6 ? -4% | 1903 ? 926% |
| Random Read 4KB (MB/s) | 72.9 | 77.4 6% | 142.4 95% | 58.3 -20% | 71.2 -2% | 60.9 ? -16% | 311 ? 327% |
| Random Write 4KB (MB/s) | 87.1 | 10.5 -88% | 155.5 79% | 6.3 -93% | 83.5 -4% | 34.2 ? -61% | 358 ? 311% |
| Sequential Read 256KB SDCard (MB/s) | 83.8 ? | 86 ? 3% | 82.8 ? -1% | 82.8 ? -1% | 85.8 ? 2% | 77.4 ? -8% | |
| Sequential Write 256KB SDCard (MB/s) | 60.3 ? | 67 ? 11% | 71.9 ? 19% | 63 ? 4% | 65.2 ? 8% | 58.3 ? -3% |
(+) Den maximala temperaturen på ovansidan är 32.3 °C / 90 F, jämfört med genomsnittet av 35.3 °C / 96 F , allt från 21.9 till 247 °C för klassen Smartphone.
(+) Botten värms upp till maximalt 30.5 °C / 87 F, jämfört med genomsnittet av 34 °C / 93 F
(+) Vid tomgångsbruk är medeltemperaturen för ovansidan 27.3 °C / 81 F, jämfört med enhetsgenomsnittet på 33 °C / ### class_avg_f### F.
Xiaomi Mi Max 3 ljudanalys
(±) | högtalarljudstyrkan är genomsnittlig men bra (78.6 dB)
Bas 100 - 315 Hz
(-) | nästan ingen bas - i genomsnitt 24.7% lägre än medianen
(±) | linjäriteten för basen är genomsnittlig (12.4% delta till föregående frekvens)
Mellan 400 - 2000 Hz
(±) | högre mellan - i genomsnitt 5.9% högre än median
(+) | mids är linjära (5.9% delta till föregående frekvens)
Högsta 2 - 16 kHz
(+) | balanserade toppar - endast 3.3% från medianen
(+) | toppar är linjära (3.4% delta till föregående frekvens)
Totalt 100 - 16 000 Hz
(±) | linjäriteten för det totala ljudet är genomsnittlig (24.3% skillnad mot median)
Jämfört med samma klass
» 58% av alla testade enheter i den här klassen var bättre, 7% liknande, 35% sämre
» Den bästa hade ett delta på 11%, genomsnittet var 34%, sämst var 134%
Jämfört med alla testade enheter
» 74% av alla testade enheter var bättre, 6% liknande, 21% sämre
» Den bästa hade ett delta på 4%, genomsnittet var 23%, sämst var 134%
Sony Xperia XA2 Plus ljudanalys
(+) | högtalare kan spela relativt högt (84.7 dB)
Bas 100 - 315 Hz
(-) | nästan ingen bas - i genomsnitt 30.7% lägre än medianen
(±) | linjäriteten för basen är genomsnittlig (10.6% delta till föregående frekvens)
Mellan 400 - 2000 Hz
(+) | balanserad mellan - endast 4.8% från medianen
(+) | mids är linjära (5.7% delta till föregående frekvens)
Högsta 2 - 16 kHz
(±) | högre toppar - i genomsnitt 6.6% högre än medianen
(+) | toppar är linjära (2.2% delta till föregående frekvens)
Totalt 100 - 16 000 Hz
(±) | linjäriteten för det totala ljudet är genomsnittlig (24.5% skillnad mot median)
Jämfört med samma klass
» 59% av alla testade enheter i den här klassen var bättre, 7% liknande, 34% sämre
» Den bästa hade ett delta på 11%, genomsnittet var 34%, sämst var 134%
Jämfört med alla testade enheter
» 74% av alla testade enheter var bättre, 6% liknande, 20% sämre
» Den bästa hade ett delta på 4%, genomsnittet var 23%, sämst var 134%
| Av/Standby | |
| Låg belastning | |
| Hög belastning |
|
Förklaring:
min: | |
| Xiaomi Mi Max 3 5500 mAh | Sony Xperia XA2 Plus 3580 mAh | Honor Play 3750 mAh | JVC J20 3400 mAh | Asus Zenfone 5 ZE620KL 3300 mAh | Genomsnitt Qualcomm Snapdragon 636 | Genomsnitt av klass Smartphone | |
|---|---|---|---|---|---|---|---|
| Power Consumption | 17% | -73% | -15% | -134% | -26% | -30% | |
| Idle Minimum * (Watt) | 0.7 | 0.35 50% | 1.4 -100% | 1 -43% | 1.75 -150% | 0.944 ? -35% | 0.887 ? -27% |
| Idle Average * (Watt) | 1.5 | 1.81 -21% | 2.6 -73% | 1.6 -7% | 4.48 -199% | 2.22 ? -48% | 1.485 ? 1% |
| Idle Maximum * (Watt) | 2.2 | 1.83 17% | 4.3 -95% | 2.8 -27% | 4.5 -105% | 2.54 ? -15% | 1.672 ? 24% |
| Load Average * (Watt) | 3.8 | 3.31 13% | 6.5 -71% | 4 -5% | 7.92 -108% | 4.51 ? -19% | 6.76 ? -78% |
| Load Maximum * (Watt) | 6.5 | 4.97 24% | 8.2 -26% | 5.9 9% | 13.62 -110% | 7.37 ? -13% | 11.2 ? -72% |
* ... mindre är bättre
| Xiaomi Mi Max 3 5500 mAh | Sony Xperia XA2 Plus 3580 mAh | Honor Play 3750 mAh | JVC J20 3400 mAh | Asus Zenfone 5 ZE620KL 3300 mAh | |
|---|---|---|---|---|---|
| Batteridrifttid | |||||
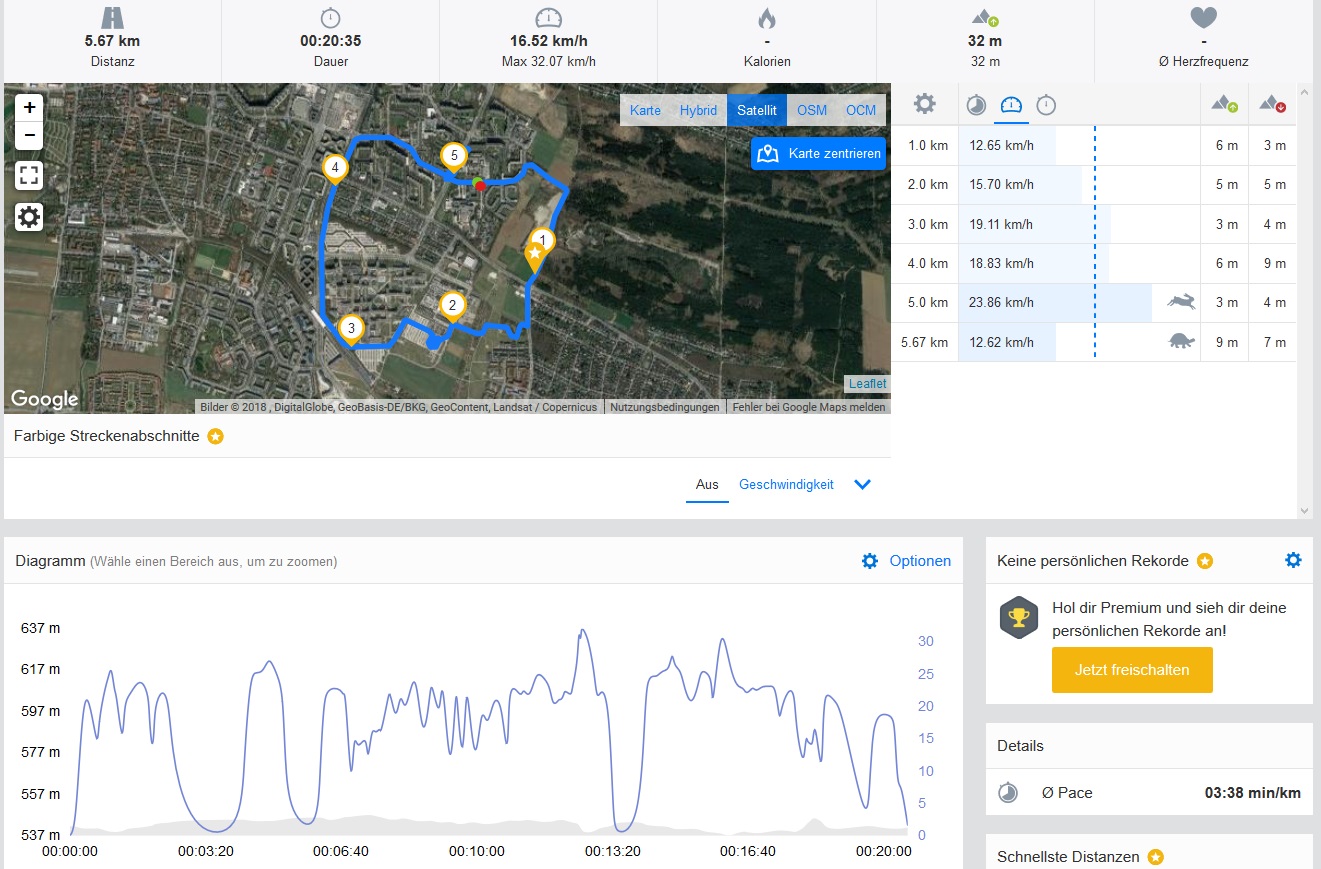
| WiFi v1.3 (h) | 21.8 | 14 -36% | 11.8 -46% | 12.1 -44% | 8.3 -62% |
För
Emot
Läs den fullständiga versionen av den här recensionen på engelska här.
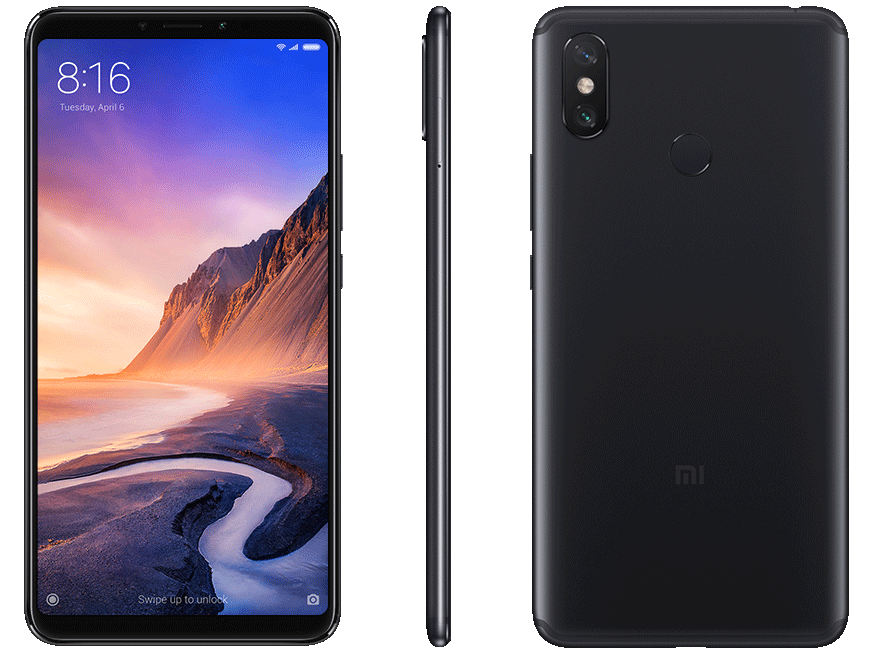
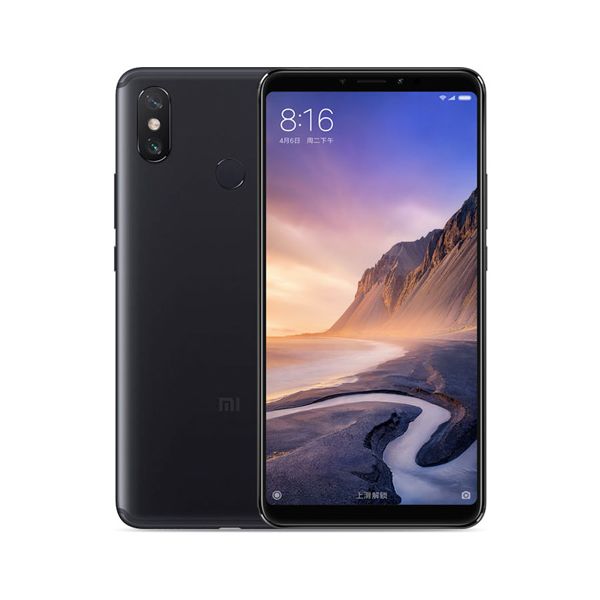
I vårt test visar sig Xiaomi Mi Max 3 vara överlägsen konkurrensen på en specifik punkt: storleken. På alla andra områden är denna Kinesiska smartphone en välfungerande mittenskiktsenhet som ligger stabilt i mitten bland jämförbara enheter. Med användbara kameror, Bluetooth 5.0 och snabbt ac-WLAN så utgör denna phablet ett totalt sett bra paket.
Xiaomi Mi Max 3 ger användaren en kraftfull smartphone som i huvudsak övertygar med sin stora skärm.
I fråga om användarvänlighet så behöver intresserade köpare inte bara hantera skärmen på 6.9 tum: då Xiaomi Mi Max 3 är en importerad enhet är den utrustad med ett justerat operativsystem, vilket till exempel innebär att man behöver installera Google Play-butiken själv. Även om detta oftast fungerar utan problem så erbjuder de engelska menyerna som här och var har justerats för den Kinesiska marknaden inte samma komfort som en modell inställd med ens modersmål.
Xiaomi Mi Max 3
- 10/16/2018 v6 (old)
Mike Wobker