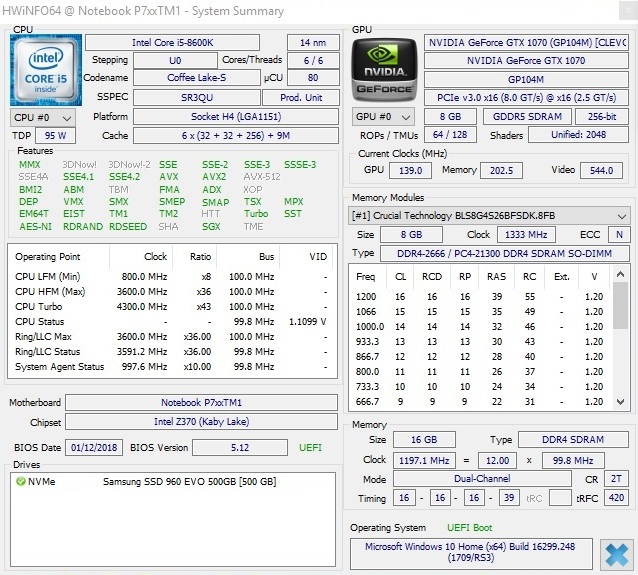
Test: Schenker XMG Ultra 15 (Clevo P751TM1-G) Laptop (Sammanfattning)
| SD Card Reader | |
| average JPG Copy Test (av. of 3 runs) | |
| Schenker XMG Ultra 15 (Toshiba Exceria Pro SDXC 64 GB UHS-II) | |
| MSI GT62VR 7RE-223 (Toshiba Exceria Pro SDXC 64 GB UHS-II) | |
| Genomsnitt av klass Gaming (20.9 - 210, n=54, senaste 2 åren) | |
| Acer Predator 15 G9-593-751X (Toshiba Exceria Pro SDXC 64 GB UHS-II) | |
| Gigabyte P56XT (Toshiba Exceria Pro SDXC 64 GB UHS-II) | |
| maximum AS SSD Seq Read Test (1GB) | |
| MSI GT62VR 7RE-223 (Toshiba Exceria Pro SDXC 64 GB UHS-II) | |
| Schenker XMG Ultra 15 (Toshiba Exceria Pro SDXC 64 GB UHS-II) | |
| Genomsnitt av klass Gaming (25.5 - 261, n=51, senaste 2 åren) | |
| Acer Predator 15 G9-593-751X (Toshiba Exceria Pro SDXC 64 GB UHS-II) | |
| Gigabyte P56XT (Toshiba Exceria Pro SDXC 64 GB UHS-II) | |
| Networking | |
| iperf3 transmit AX12 | |
| Schenker XMG Ultra 15 | |
| Acer Predator 15 G9-593-751X | |
| MSI GT62VR 7RE-223 | |
| Alienware 15 R3 | |
| Gigabyte P56XT | |
| iperf3 receive AX12 | |
| Acer Predator 15 G9-593-751X | |
| Schenker XMG Ultra 15 | |
| Alienware 15 R3 | |
| Gigabyte P56XT | |
| MSI GT62VR 7RE-223 | |
| |||||||||||||||||||||||||
Distribution av ljusstyrkan: 74 %
Mitt på batteriet: 363 cd/m²
Kontrast: 626:1 (Svärta: 0.58 cd/m²)
ΔE ColorChecker Calman: 8.7 | ∀{0.5-29.43 Ø4.71}
calibrated: 2.36
ΔE Greyscale Calman: 9.26 | ∀{0.09-98 Ø4.96}
91% sRGB (Argyll 1.6.3 3D)
59% AdobeRGB 1998 (Argyll 1.6.3 3D)
66.3% AdobeRGB 1998 (Argyll 3D)
90.7% sRGB (Argyll 3D)
66.8% Display P3 (Argyll 3D)
Gamma: 2.16
CCT: 9390 K
| Schenker XMG Ultra 15 AU Optronics B156HTN05.2 (AUO52ED), TN, 1920x1080 | Acer Predator 15 G9-593-751X LG Philips LP156WF6-SPP1 (LGD04D5), IPS, 1920x1080 | MSI GT62VR 7RE-223 LG Philips LP156WF6 (LGD046F), IPS, 1920x1080 | Gigabyte P56XT LG Philips LP156WF6 (LGD046F), IPS, 1920x1080 | Alienware 15 R3 HPJGK_B156HTN (AUO51ED), TN, 1920x1080 | |
|---|---|---|---|---|---|
| Display | -5% | -7% | -6% | -0% | |
| Display P3 Coverage (%) | 66.8 | 65.4 -2% | 63.9 -4% | 64.8 -3% | 66 -1% |
| sRGB Coverage (%) | 90.7 | 85.5 -6% | 83.1 -8% | 84.6 -7% | 90.5 0% |
| AdobeRGB 1998 Coverage (%) | 66.3 | 62.5 -6% | 60.8 -8% | 61.8 -7% | 66.2 0% |
| Response Times | -140% | -133% | -132% | -27% | |
| Response Time Grey 50% / Grey 80% * (ms) | 24.2 ? | 36 ? -49% | 37 ? -53% | 37.2 ? -54% | 25 ? -3% |
| Response Time Black / White * (ms) | 8 ? | 26.4 ? -230% | 25 ? -213% | 24.8 ? -210% | 12 ? -50% |
| PWM Frequency (Hz) | 20830 ? | 20000 ? | |||
| Screen | 17% | 20% | 14% | 7% | |
| Brightness middle (cd/m²) | 363 | 295 -19% | 310 -15% | 301 -17% | 386 6% |
| Brightness (cd/m²) | 365 | 274 -25% | 311 -15% | 280 -23% | 382 5% |
| Brightness Distribution (%) | 74 | 88 19% | 85 15% | 87 18% | 93 26% |
| Black Level * (cd/m²) | 0.58 | 0.32 45% | 0.3 48% | 0.32 45% | 0.39 33% |
| Contrast (:1) | 626 | 922 47% | 1033 65% | 941 50% | 990 58% |
| Colorchecker dE 2000 * | 8.7 | 4.59 47% | 4.82 45% | 6.21 29% | 10.2 -17% |
| Colorchecker dE 2000 max. * | 12.91 | 11 15% | 10.14 21% | 10.78 16% | 15.81 -22% |
| Colorchecker dE 2000 calibrated * | 2.36 | ||||
| Greyscale dE 2000 * | 9.26 | 4.03 56% | 3.94 57% | 6.08 34% | 11.28 -22% |
| Gamma | 2.16 102% | 2.3 96% | 2.45 90% | 2.31 95% | 2.23 99% |
| CCT | 9390 69% | 7229 90% | 6877 95% | 7375 88% | 11383 57% |
| Color Space (Percent of AdobeRGB 1998) (%) | 59 | 56 -5% | 54 -8% | 55 -7% | 59 0% |
| Color Space (Percent of sRGB) (%) | 91 | 85 -7% | 83 -9% | 84 -8% | 90 -1% |
| Totalt genomsnitt (program/inställningar) | -43% /
-8% | -40% /
-5% | -41% /
-10% | -7% /
1% |
* ... mindre är bättre
Visa svarstider
| ↔ Svarstid svart till vitt | ||
|---|---|---|
| 8 ms ... stiga ↗ och falla ↘ kombinerat | ↗ 5.6 ms stiga | 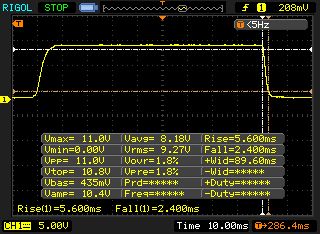 |
| ↘ 2.4 ms hösten | ||
| Skärmen visar snabba svarsfrekvenser i våra tester och bör passa för spel. I jämförelse sträcker sig alla testade enheter från 0.1 (minst) till 240 (maximalt) ms. » 22 % av alla enheter är bättre. Det betyder att den uppmätta svarstiden är bättre än genomsnittet av alla testade enheter (19.8 ms). | ||
| ↔ Svarstid 50 % grått till 80 % grått | ||
| 24.2 ms ... stiga ↗ och falla ↘ kombinerat | ↗ 13.4 ms stiga | 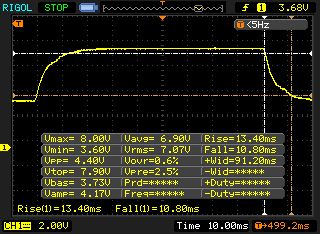 |
| ↘ 10.8 ms hösten | ||
| Skärmen visar bra svarsfrekvens i våra tester, men kan vara för långsam för konkurrenskraftiga spelare. I jämförelse sträcker sig alla testade enheter från 0.165 (minst) till 636 (maximalt) ms. » 35 % av alla enheter är bättre. Det betyder att den uppmätta svarstiden är bättre än genomsnittet av alla testade enheter (30.9 ms). | ||
Skärmflimmer / PWM (Puls-Width Modulation)
| Skärmflimmer / PWM upptäcktes inte | 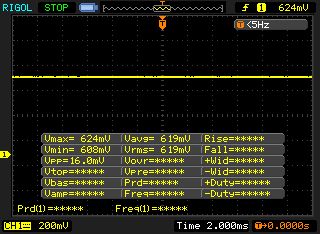 | ||
Som jämförelse: 52 % av alla testade enheter använder inte PWM för att dämpa skärmen. Om PWM upptäcktes mättes ett medelvärde av 7744 (minst: 5 - maximum: 343500) Hz. | |||
| Cinebench R15 | |
| CPU Single 64Bit | |
| Genomsnitt av klass Gaming (188.8 - 350, n=103, senaste 2 åren) | |
| Schenker XMG Ultra 15 | |
| Genomsnitt Intel Core i5-8600K (181 - 181, n=2) | |
| Alienware 15 R3 | |
| MSI GT62VR 7RE-223 | |
| Acer Predator 15 G9-593-751X | |
| Gigabyte P56XT | |
| CPU Multi 64Bit | |
| Genomsnitt av klass Gaming (1578 - 6330, n=102, senaste 2 åren) | |
| Schenker XMG Ultra 15 | |
| Genomsnitt Intel Core i5-8600K (988 - 991, n=2) | |
| Acer Predator 15 G9-593-751X | |
| Gigabyte P56XT | |
| Alienware 15 R3 | |
| MSI GT62VR 7RE-223 | |
| Cinebench R11.5 | |
| CPU Single 64Bit | |
| Genomsnitt av klass Gaming (3.3 - 4.16, n=9, senaste 2 åren) | |
| Schenker XMG Ultra 15 | |
| Genomsnitt Intel Core i5-8600K (n=1) | |
| Gigabyte P56XT | |
| Alienware 15 R3 | |
| Acer Predator 15 G9-593-751X | |
| MSI GT62VR 7RE-223 | |
| CPU Multi 64Bit | |
| Genomsnitt av klass Gaming (29.8 - 76.7, n=9, senaste 2 åren) | |
| Genomsnitt Intel Core i5-8600K (n=1) | |
| Schenker XMG Ultra 15 | |
| Gigabyte P56XT | |
| Alienware 15 R3 | |
| MSI GT62VR 7RE-223 | |
| Acer Predator 15 G9-593-751X | |
| PCMark 8 | |
| Home Score Accelerated v2 | |
| Genomsnitt av klass Gaming (n=1senaste 2 åren) | |
| Schenker XMG Ultra 15 | |
| Genomsnitt Intel Core i5-8600K, NVIDIA GeForce GTX 1070 Mobile (n=1) | |
| Acer Predator 15 G9-593-751X | |
| MSI GT62VR 7RE-223 | |
| Alienware 15 R3 | |
| Gigabyte P56XT | |
| Work Score Accelerated v2 | |
| Schenker XMG Ultra 15 | |
| Genomsnitt Intel Core i5-8600K, NVIDIA GeForce GTX 1070 Mobile (n=1) | |
| Acer Predator 15 G9-593-751X | |
| MSI GT62VR 7RE-223 | |
| Alienware 15 R3 | |
| Gigabyte P56XT | |
| Genomsnitt av klass Gaming (n=1senaste 2 åren) | |
| PCMark 10 - Score | |
| Genomsnitt av klass Gaming (5828 - 12414, n=93, senaste 2 åren) | |
| Schenker XMG Ultra 15 | |
| Genomsnitt Intel Core i5-8600K, NVIDIA GeForce GTX 1070 Mobile (n=1) | |
| Gigabyte P56XT | |
| PCMark 8 Home Score Accelerated v2 | 5512 poäng | |
| PCMark 8 Work Score Accelerated v2 | 5618 poäng | |
| PCMark 10 Score | 5779 poäng | |
Hjälp | ||
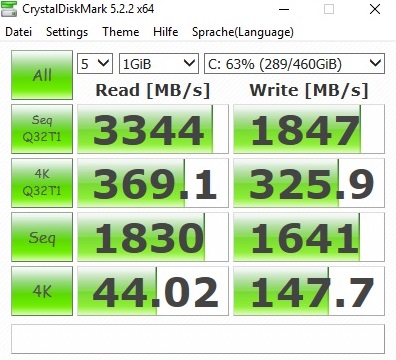
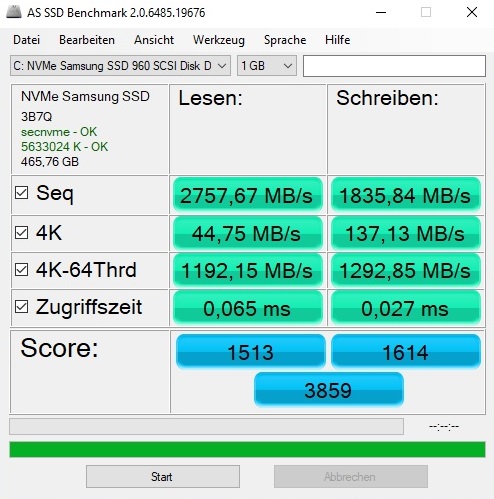
| Schenker XMG Ultra 15 Samsung SSD 960 Evo 500GB m.2 NVMe | Acer Predator 15 G9-593-751X Samsung SM951 MZVPV256HDGL m.2 PCI-e | MSI GT62VR 7RE-223 Samsung SSD PM871a MZNLN256HMHQ | Gigabyte P56XT LiteOn CX2-8B256 | Alienware 15 R3 | Genomsnitt Samsung SSD 960 Evo 500GB m.2 NVMe | |
|---|---|---|---|---|---|---|
| AS SSD | -27% | -62% | -1% | |||
| Seq Read (MB/s) | 2758 | 1941 -30% | 510 -82% | 2433 ? -12% | ||
| Seq Write (MB/s) | 1836 | 1067 -42% | 288.2 -84% | 1647 ? -10% | ||
| 4K Read (MB/s) | 44.75 | 46.35 4% | 37.2 -17% | 45.5 ? 2% | ||
| 4K Write (MB/s) | 137.1 | 117.3 -14% | 104 -24% | 142.4 ? 4% | ||
| Score Read (Points) | 1513 | 1350 -11% | 472 -69% | 1645 ? 9% | ||
| Score Write (Points) | 1614 | 570 -65% | 304 -81% | 1518 ? -6% | ||
| Score Total (Points) | 3859 | 2574 -33% | 1019 -74% | 3968 ? 3% |

| 3DMark - 1920x1080 Fire Strike Graphics | |
| Genomsnitt av klass Gaming (18629 - 62849, n=112, senaste 2 åren) | |
| Schenker XMG Ultra 15 | |
| Alienware 15 R3 | |
| MSI GT62VR 7RE-223 | |
| Genomsnitt NVIDIA GeForce GTX 1070 Mobile (15718 - 19059, n=56) | |
| Acer Predator 15 G9-593-751X | |
| Gigabyte P56XT | |
| 3DMark 11 - 1280x720 Performance GPU | |
| Genomsnitt av klass Gaming (21841 - 80022, n=103, senaste 2 åren) | |
| Schenker XMG Ultra 15 | |
| Alienware 15 R3 | |
| MSI GT62VR 7RE-223 | |
| Genomsnitt NVIDIA GeForce GTX 1070 Mobile (13760 - 25604, n=58) | |
| Acer Predator 15 G9-593-751X | |
| Gigabyte P56XT | |
| 3DMark 06 Standard Score | 32601 poäng | |
| 3DMark 11 Performance | 18972 poäng | |
| 3DMark Cloud Gate Standard Score | 30865 poäng | |
| 3DMark Fire Strike Score | 15777 poäng | |
Hjälp | ||
| The Witcher 3 | |
| 1920x1080 Ultra Graphics & Postprocessing (HBAO+) | |
| Genomsnitt av klass Gaming (104.7 - 240, n=7, senaste 2 åren) | |
| Schenker XMG Ultra 15 | |
| Acer Predator 15 G9-593-751X | |
| Genomsnitt NVIDIA GeForce GTX 1070 Mobile (48.2 - 68.4, n=41) | |
| Gigabyte P56XT | |
| 1920x1080 High Graphics & Postprocessing (Nvidia HairWorks Off) | |
| Genomsnitt av klass Gaming (341 - 404, n=2, senaste 2 åren) | |
| Schenker XMG Ultra 15 | |
| Acer Predator 15 G9-593-751X | |
| Genomsnitt NVIDIA GeForce GTX 1070 Mobile (83 - 123, n=30) | |
| Gigabyte P56XT | |
| låg | med. | hög | ultra | |
|---|---|---|---|---|
| The Witcher 3 (2015) | 123 | 65.3 | ||
| F1 2017 (2017) | 137 | 102 | ||
| FIFA 18 (2017) | 349 | 345 | ||
| Middle-earth: Shadow of War (2017) | 108 | 84 | ||
| The Evil Within 2 (2017) | 67.5 | 65.4 | ||
| ELEX (2017) | 113 | 89.1 | ||
| Wolfenstein II: The New Colossus (2017) | 125 | 117 | ||
| Assassin´s Creed Origins (2017) | 87 | 72 | ||
| Call of Duty WWII (2017) | 146 | 122 | ||
| Need for Speed Payback (2017) | 129 | 122 | ||
| Star Wars Battlefront 2 (2017) | 135 | 104 | ||
| Fortnite (2018) | 181 | 131 | ||
| Final Fantasy XV Benchmark (2018) | 65 | |||
| Kingdom Come: Deliverance (2018) | 87.4 | 66.5 |
Ljudnivå
| Låg belastning |
| 32 / 33 / 35 dB(A) |
| Hög belastning |
| 46 / 62 dB(A) |
 | ||
30 dB tyst 40 dB(A) hörbar 50 dB(A) högt ljud |
||
min: | ||
| Schenker XMG Ultra 15 GeForce GTX 1070 Mobile, i5-8600K | Acer Predator 15 G9-593-751X GeForce GTX 1070 Mobile, i7-7700HQ | MSI GT62VR 7RE-223 GeForce GTX 1070 Mobile, i7-7700HQ | Gigabyte P56XT GeForce GTX 1070 Mobile, i7-7700HQ | Alienware 15 R3 GeForce GTX 1070 Mobile, i7-7700HQ | |
|---|---|---|---|---|---|
| Noise | 3% | 4% | 3% | -0% | |
| av / miljö * (dB) | 30 | 32 -7% | 30 -0% | 30 -0% | 30 -0% |
| Idle Minimum * (dB) | 32 | 34 -6% | 34 -6% | 34 -6% | 31 3% |
| Idle Average * (dB) | 33 | 36 -9% | 35 -6% | 35 -6% | 32 3% |
| Idle Maximum * (dB) | 35 | 38 -9% | 36 -3% | 39 -11% | 42 -20% |
| Load Average * (dB) | 46 | 41 11% | 40 13% | 39 15% | 49 -7% |
| Witcher 3 ultra * (dB) | 54 | 42 22% | 48 11% | ||
| Load Maximum * (dB) | 62 | 50 19% | 46 26% | 49 21% | 50 19% |
* ... mindre är bättre
(±) Den maximala temperaturen på ovansidan är 42 °C / 108 F, jämfört med genomsnittet av 40.4 °C / 105 F , allt från 21.2 till 68.8 °C för klassen Gaming.
(-) Botten värms upp till maximalt 50 °C / 122 F, jämfört med genomsnittet av 43.2 °C / 110 F
(+) Vid tomgångsbruk är medeltemperaturen för ovansidan 27.6 °C / 82 F, jämfört med enhetsgenomsnittet på 33.9 °C / ### class_avg_f### F.
(±) När du spelar The Witcher 3 är medeltemperaturen för ovansidan 35.4 °C / 96 F, jämfört med enhetsgenomsnittet på 33.9 °C / ## #class_avg_f### F.
(+) Handledsstöden och pekplattan når maximal hudtemperatur (32 °C / 89.6 F) och är därför inte varma.
(-) Medeltemperaturen för handledsstödsområdet på liknande enheter var 28.8 °C / 83.8 F (-3.2 °C / -5.8 F).
| Schenker XMG Ultra 15 GeForce GTX 1070 Mobile, i5-8600K | Acer Predator 15 G9-593-751X GeForce GTX 1070 Mobile, i7-7700HQ | MSI GT62VR 7RE-223 GeForce GTX 1070 Mobile, i7-7700HQ | Gigabyte P56XT GeForce GTX 1070 Mobile, i7-7700HQ | Alienware 15 R3 GeForce GTX 1070 Mobile, i7-7700HQ | |
|---|---|---|---|---|---|
| Heat | 8% | 6% | -30% | -18% | |
| Maximum Upper Side * (°C) | 42 | 42.3 -1% | 40.6 3% | 65 -55% | 46 -10% |
| Maximum Bottom * (°C) | 50 | 40.9 18% | 48.4 3% | 71 -42% | 51.8 -4% |
| Idle Upper Side * (°C) | 29 | 28.4 2% | 26.8 8% | 35 -21% | 36.5 -26% |
| Idle Bottom * (°C) | 29 | 25.2 13% | 26.4 9% | 30 -3% | 38.2 -32% |
* ... mindre är bättre
Schenker XMG Ultra 15 ljudanalys
(±) | högtalarljudstyrkan är genomsnittlig men bra (76 dB)
Bas 100 - 315 Hz
(±) | reducerad bas - i genomsnitt 10.7% lägre än medianen
(±) | linjäriteten för basen är genomsnittlig (12.1% delta till föregående frekvens)
Mellan 400 - 2000 Hz
(+) | balanserad mellan - endast 1.5% från medianen
(+) | mids är linjära (3.2% delta till föregående frekvens)
Högsta 2 - 16 kHz
(+) | balanserade toppar - endast 2.2% från medianen
(+) | toppar är linjära (3.1% delta till föregående frekvens)
Totalt 100 - 16 000 Hz
(+) | det totala ljudet är linjärt (13.3% skillnad mot median)
Jämfört med samma klass
» 19% av alla testade enheter i den här klassen var bättre, 5% liknande, 76% sämre
» Den bästa hade ett delta på 6%, genomsnittet var 18%, sämst var 132%
Jämfört med alla testade enheter
» 14% av alla testade enheter var bättre, 3% liknande, 83% sämre
» Den bästa hade ett delta på 4%, genomsnittet var 23%, sämst var 134%
Acer Predator 15 G9-593-751X ljudanalys
(+) | högtalare kan spela relativt högt (91 dB)
Bas 100 - 315 Hz
(±) | reducerad bas - i genomsnitt 14.1% lägre än medianen
(±) | linjäriteten för basen är genomsnittlig (10.6% delta till föregående frekvens)
Mellan 400 - 2000 Hz
(+) | balanserad mellan - endast 3.2% från medianen
(+) | mids är linjära (4.9% delta till föregående frekvens)
Högsta 2 - 16 kHz
(+) | balanserade toppar - endast 3.7% från medianen
(+) | toppar är linjära (5.3% delta till föregående frekvens)
Totalt 100 - 16 000 Hz
(+) | det totala ljudet är linjärt (14.1% skillnad mot median)
Jämfört med samma klass
» 24% av alla testade enheter i den här klassen var bättre, 8% liknande, 68% sämre
» Den bästa hade ett delta på 6%, genomsnittet var 18%, sämst var 132%
Jämfört med alla testade enheter
» 17% av alla testade enheter var bättre, 4% liknande, 79% sämre
» Den bästa hade ett delta på 4%, genomsnittet var 23%, sämst var 134%
| Av/Standby | |
| Låg belastning | |
| Hög belastning |
|
Förklaring:
min: | |
| Schenker XMG Ultra 15 GeForce GTX 1070 Mobile, i5-8600K | Acer Predator 15 G9-593-751X GeForce GTX 1070 Mobile, i7-7700HQ | MSI GT62VR 7RE-223 GeForce GTX 1070 Mobile, i7-7700HQ | Gigabyte P56XT GeForce GTX 1070 Mobile, i7-7700HQ | Alienware 15 R3 GeForce GTX 1070 Mobile, i7-7700HQ | |
|---|---|---|---|---|---|
| Power Consumption | 24% | 26% | 36% | 27% | |
| Idle Minimum * (Watt) | 28 | 18 36% | 20 29% | 13 54% | 19 32% |
| Idle Average * (Watt) | 31 | 23 26% | 24 23% | 17 45% | 23 26% |
| Idle Maximum * (Watt) | 38 | 30 21% | 29 24% | 22 42% | 29 24% |
| Load Average * (Watt) | 100 | 89 11% | 82 18% | 85 15% | 85 15% |
| Witcher 3 ultra * (Watt) | 206 | 168 18% | 154 25% | ||
| Load Maximum * (Watt) | 309 | 213 31% | 193 38% | 208 33% | 192 38% |
* ... mindre är bättre
| Schenker XMG Ultra 15 GeForce GTX 1070 Mobile, i5-8600K, 82 Wh | Acer Predator 15 G9-593-751X GeForce GTX 1070 Mobile, i7-7700HQ, 90 Wh | MSI GT62VR 7RE-223 GeForce GTX 1070 Mobile, i7-7700HQ, 75 Wh | Gigabyte P56XT GeForce GTX 1070 Mobile, i7-7700HQ, 91.2 Wh | Alienware 15 R3 GeForce GTX 1070 Mobile, i7-7700HQ, 99 Wh | Genomsnitt av klass Gaming | |
|---|---|---|---|---|---|---|
| Batteridrifttid | 64% | 28% | 89% | 35% | 94% | |
| Reader / Idle (h) | 3.7 | 8.4 127% | 6.3 70% | 9.5 157% | 6.4 73% | 7.84 ? 112% |
| H.264 (h) | 3.1 | 4.9 58% | 4.2 35% | 6.2 100% | 4.4 42% | 8.27 ? 167% |
| WiFi v1.3 (h) | 3.2 | 5.5 72% | 4.1 28% | 6.4 100% | 4.4 38% | 7.08 ? 121% |
| Load (h) | 2 | 2 0% | 1.6 -20% | 2 0% | 1.7 -15% | 1.496 ? -25% |
För
Emot
Läs den fullständiga versionen av den här recensionen på engelska här.
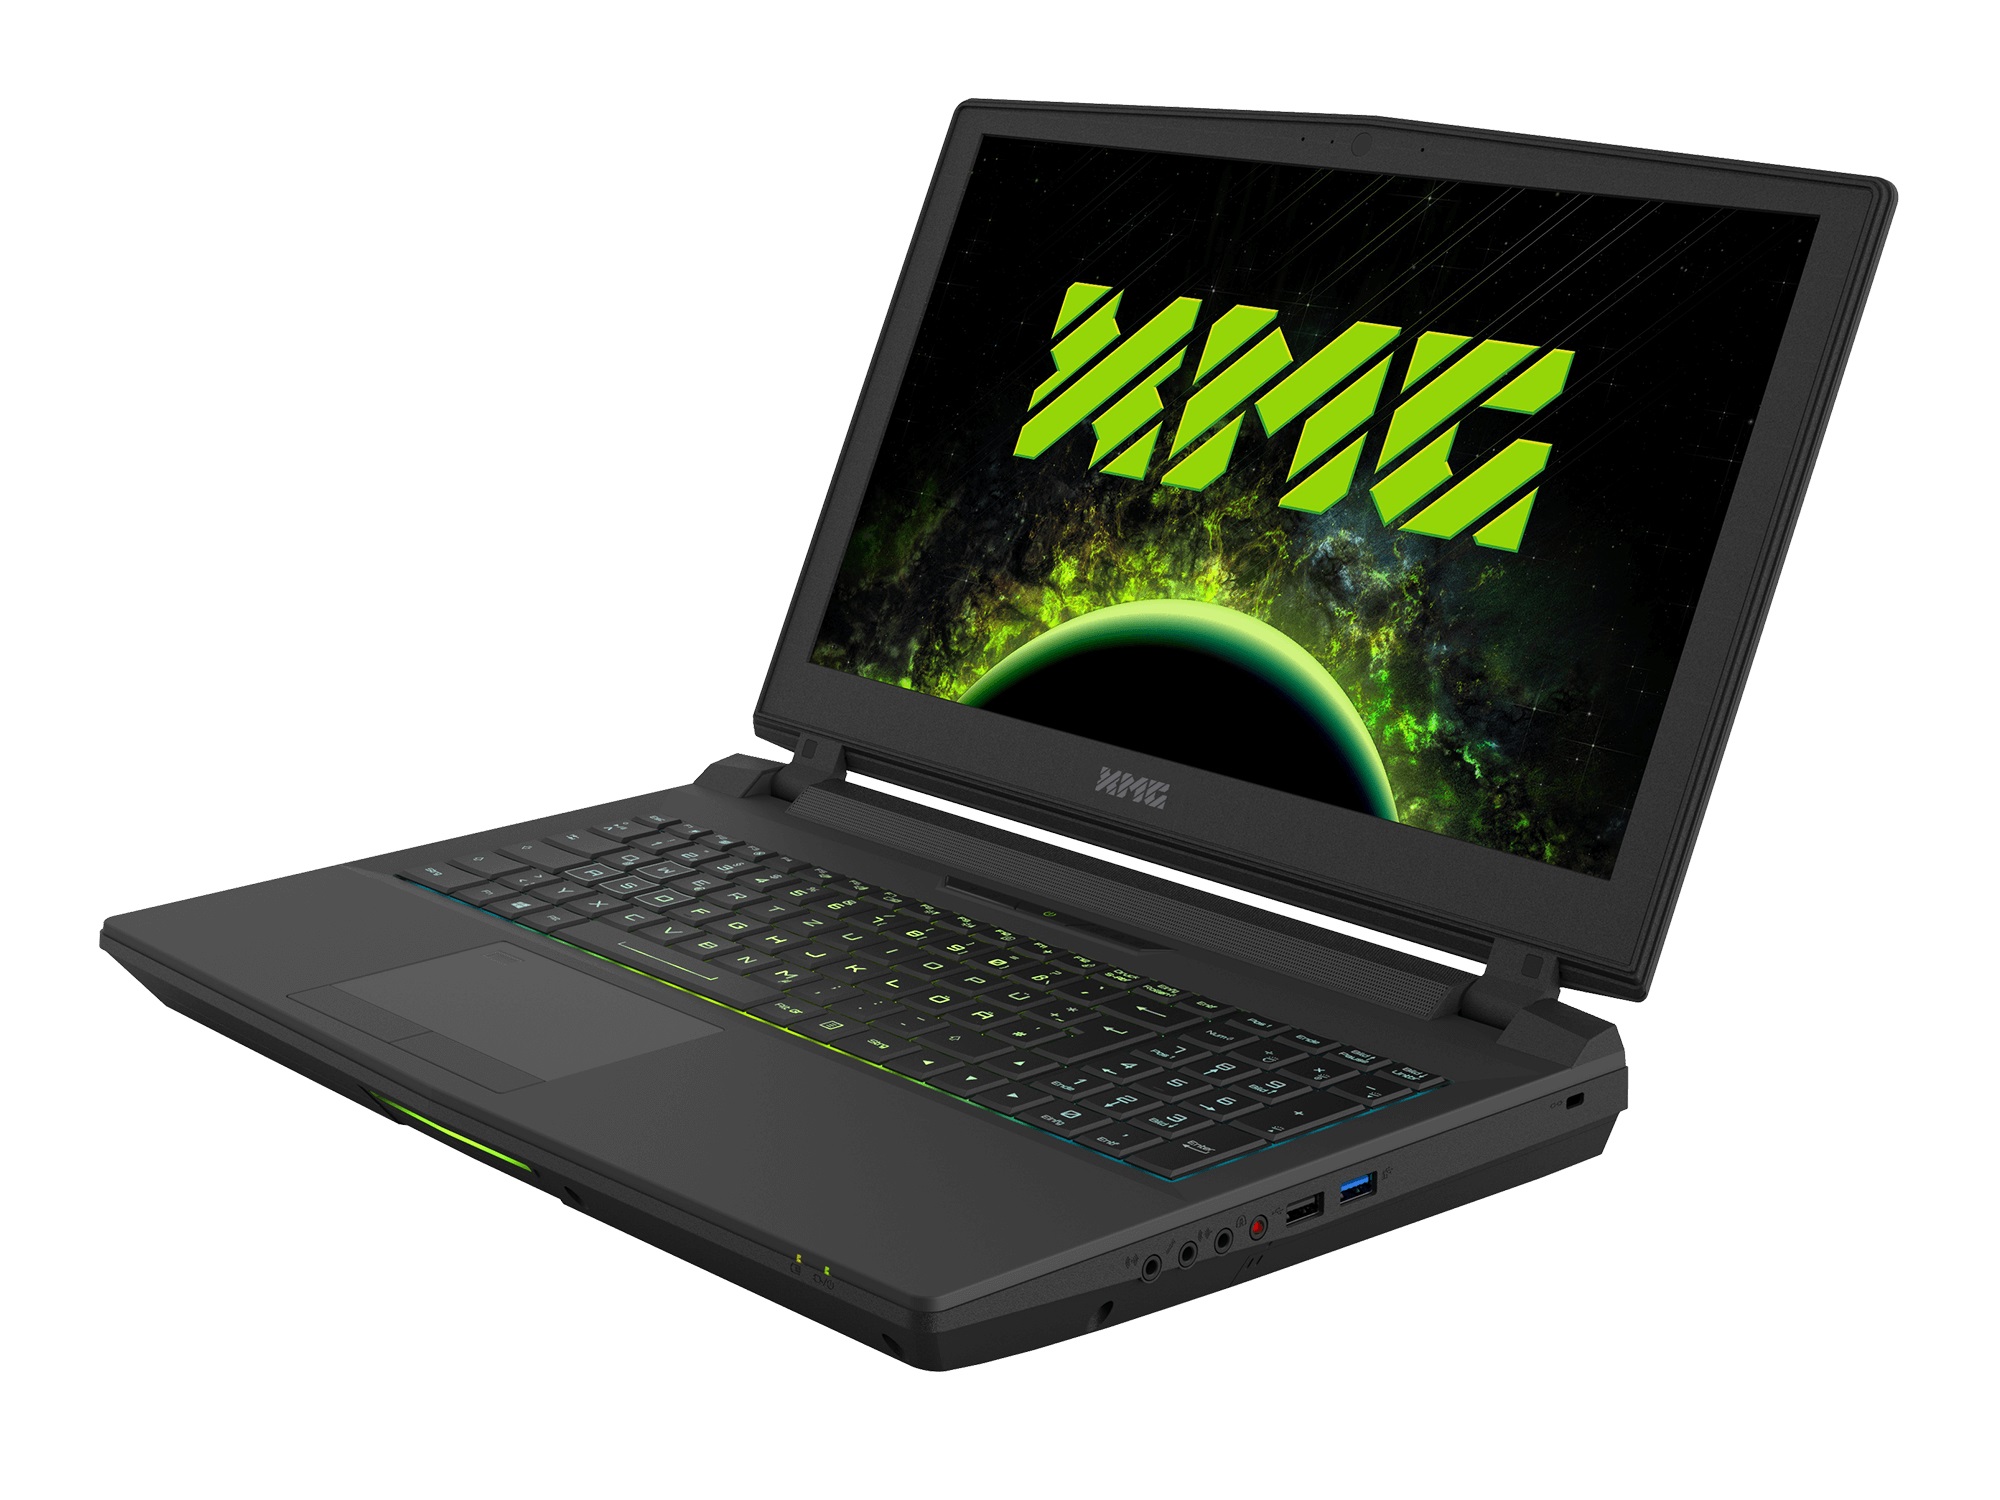
Schenker XMG Ultra 15 ärver styrkorna och svagheterna hos sitt syskon på 17 tum, XMG Ultra 17. I vårt tycke förtjänar detta lättservade hölje mycket beröm (både CPU och GPU kan i teorin bytas ut!). Den kan ställas in utförligt vid beställning med Schenkers onlineverktyg för konfigurering. Inmatningsenheterna, ljudkvaliteten och portarna (Thunderbolt 3) lever alla upp till XMG:s prislapp.
Men den G-Sync kapabla 120 Hz-skärmen lämnar ett ganska blandat intryck. Bra ljusstyrka och kort responstid kan knappast tvätta bort känslan av besvikelse som lämnas kvar av den dåliga färgnoggrannheten, bakgrundsbelysningens mediokra enhetlighet, dom dåliga betraktningsvinklarna och den aningen höga svärtan.
Den största punkten för kritik vi har rör fläktljudet. Trots det tjocka höljet så producerar denna 15-tummare mycket ljud under spelsessioner. Den tenderar också att producera en hel del onödigt ljud när den arbetar på mindre uppgifter. Eftersom processorn eller grafikkortet aldrig når kritiska temperaturer så finns det en del svängrum för en tystare kyllösning. För att uppnå det kan man förstås justera fläkthastigheten manuellt via Control Center-verktyget. Den blygsamma batteritiden är en annan anledning till att XMG Ultra 15 inte får ett "A" från oss.
Men om man tar alla aspekter i beaktande så ser man att XMG Ultra 15 står sig ganska bra mot konkurrenter såsom Acer Predator 15, MSI GT62VR 7RE och Alienware 15 R3.
Schenker XMG Ultra 15
- 03/05/2018 v6 (old)
Florian Glaser
Price comparison