Test: Acer Predator Helios 300 - En modern spellaptop med en Turing GPU (Sammanfattning)
Gradering | Datum | Modell | Vikt | Höjd | Storlek | Upplösning | Pris |
|---|---|---|---|---|---|---|---|
| 82.1 % v7 (old) | 11/2019 | Acer Predator Helios 300 PH315-52-79TY i7-9750H, GeForce GTX 1660 Ti Mobile | 2.3 kg | 23.2 mm | 15.60" | 1920x1080 | |
| 83.9 % v7 (old) | 08/2019 | HP Gaming Pavilion 15-dk0009ng i7-9750H, GeForce GTX 1660 Ti Max-Q | 2.4 kg | 23.4 mm | 15.60" | 1920x1080 | |
| 82.3 % v7 (old) | 08/2019 | Lenovo Legion Y540-15IRH-81SX00B2GE i7-9750H, GeForce GTX 1660 Ti Mobile | 2.2 kg | 26 mm | 15.60" | 1920x1080 | |
| 83 % v7 (old) | 06/2019 | Dell G5 15 5590 i7-8750H, GeForce RTX 2060 Mobile | 2.7 kg | 23.7 mm | 15.60" | 1920x1080 | |
| 84.8 % v7 (old) | Lenovo Legion Y740-15ICHg i7-9750H, GeForce RTX 2070 Max-Q | 2.3 kg | 25 mm | 15.60" | 1920x1080 | ||
| 82 % v6 (old) | 06/2018 | Acer Predator Helios 300 PH317-52-51M6 i5-8300H, GeForce GTX 1050 Ti Mobile | 2.9 kg | 29 mm | 17.30" | 1920x1080 |

| Networking | |
| iperf3 transmit AX12 | |
| Acer Predator Helios 300 PH315-52-79TY | |
| Dell G5 15 5590 | |
| Acer Predator Helios 300 PH317-52-51M6 | |
| HP Gaming Pavilion 15-dk0009ng | |
| Lenovo Legion Y540-15IRH-81SX00B2GE | |
| Lenovo Legion Y740-15ICHg | |
| iperf3 receive AX12 | |
| Acer Predator Helios 300 PH317-52-51M6 | |
| Acer Predator Helios 300 PH315-52-79TY | |
| Dell G5 15 5590 | |
| Lenovo Legion Y540-15IRH-81SX00B2GE | |
| Lenovo Legion Y740-15ICHg | |
| HP Gaming Pavilion 15-dk0009ng | |
| |||||||||||||||||||||||||
Distribution av ljusstyrkan: 82 %
Mitt på batteriet: 326 cd/m²
Kontrast: 1275:1 (Svärta: 0.255 cd/m²)
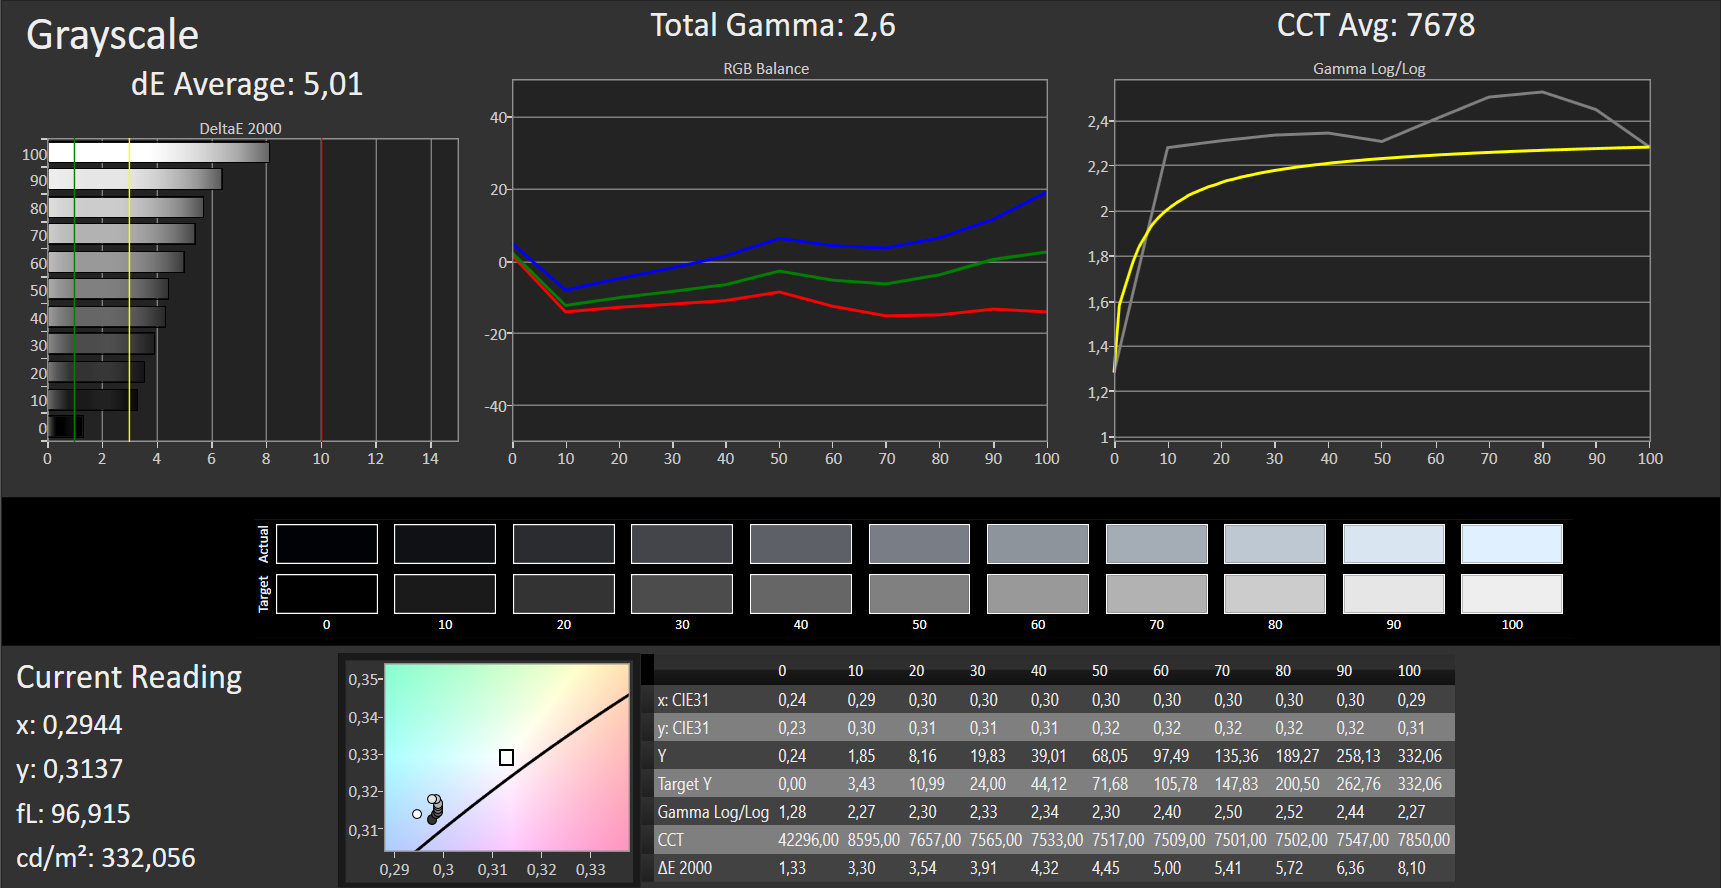
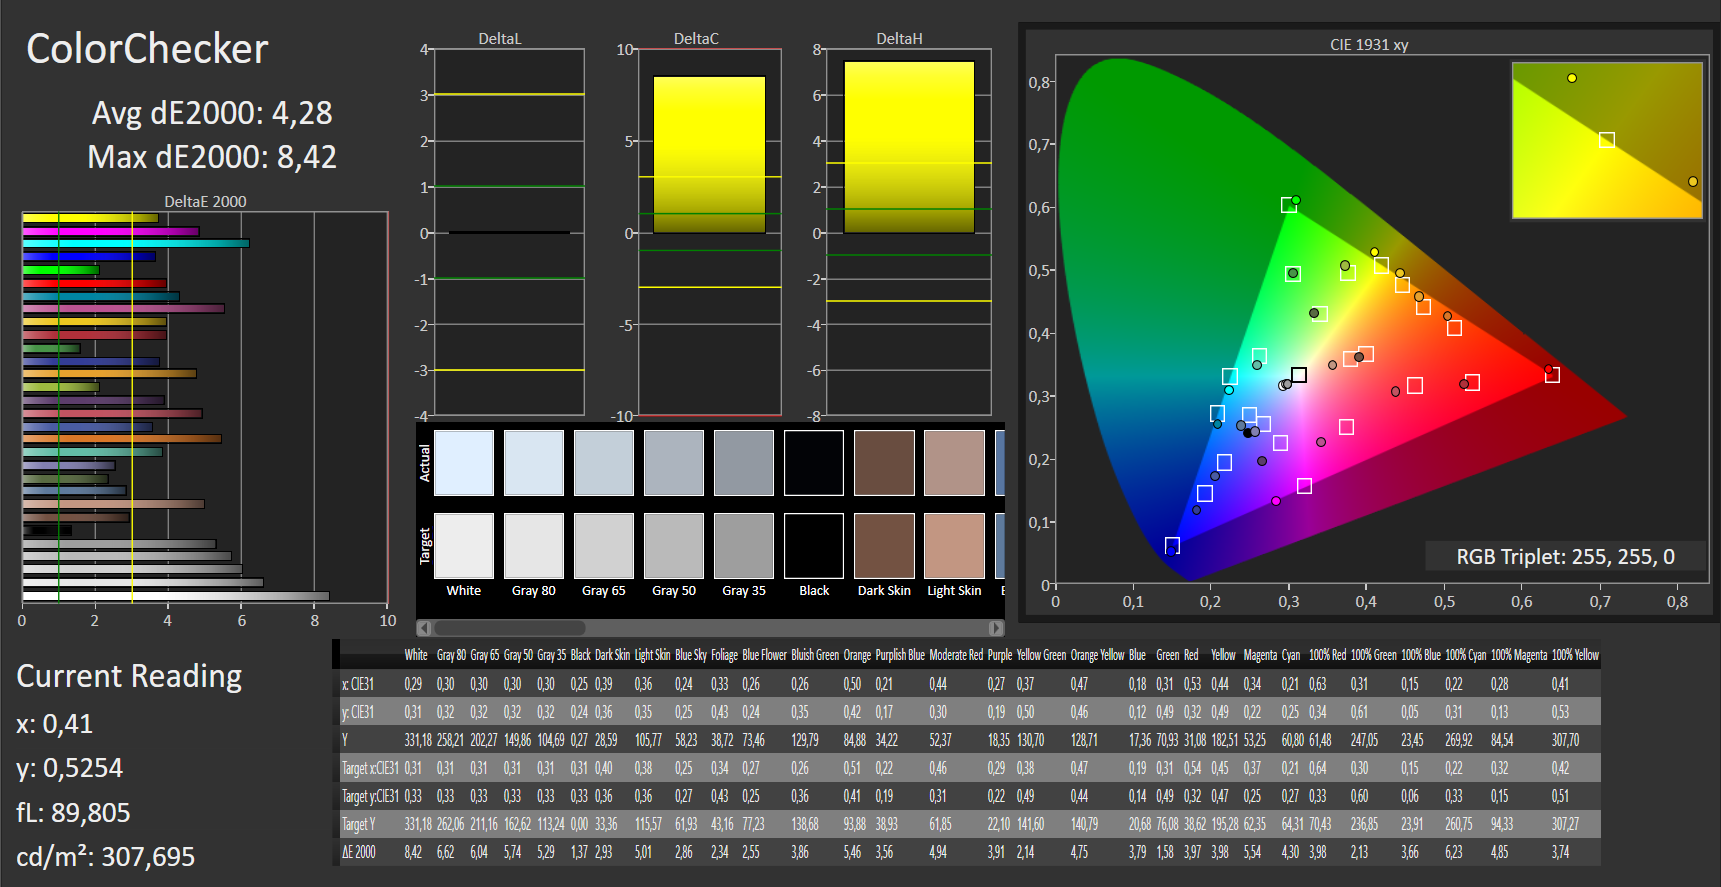
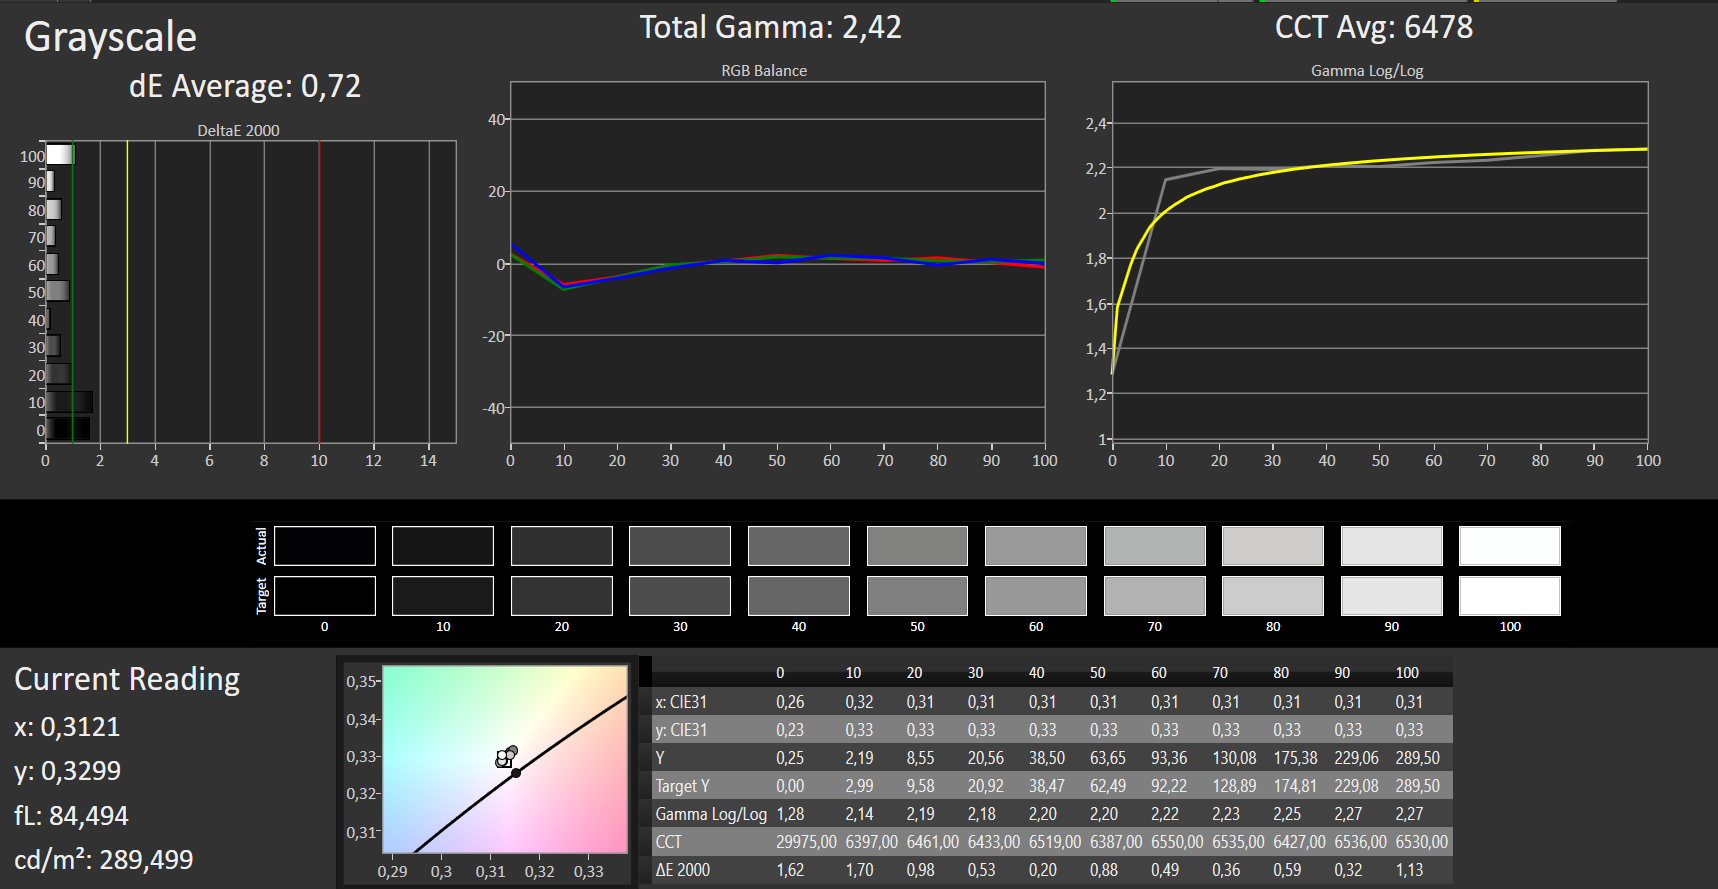
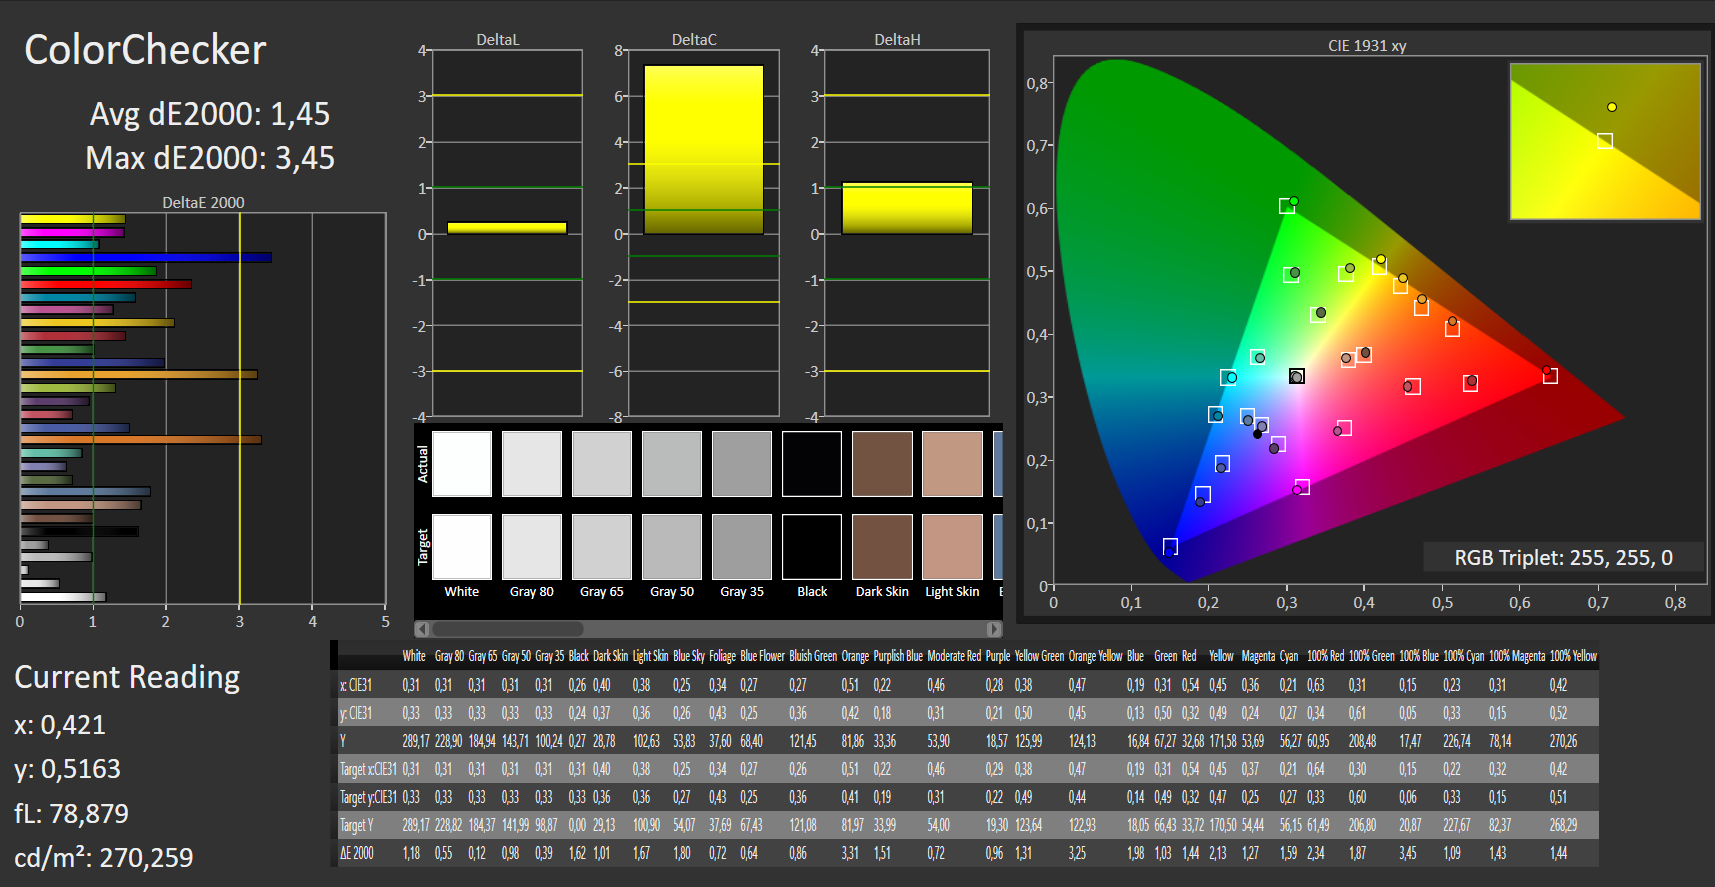
ΔE ColorChecker Calman: 4.28 | ∀{0.5-29.43 Ø4.71}
calibrated: 1.45
ΔE Greyscale Calman: 5.01 | ∀{0.09-98 Ø4.96}
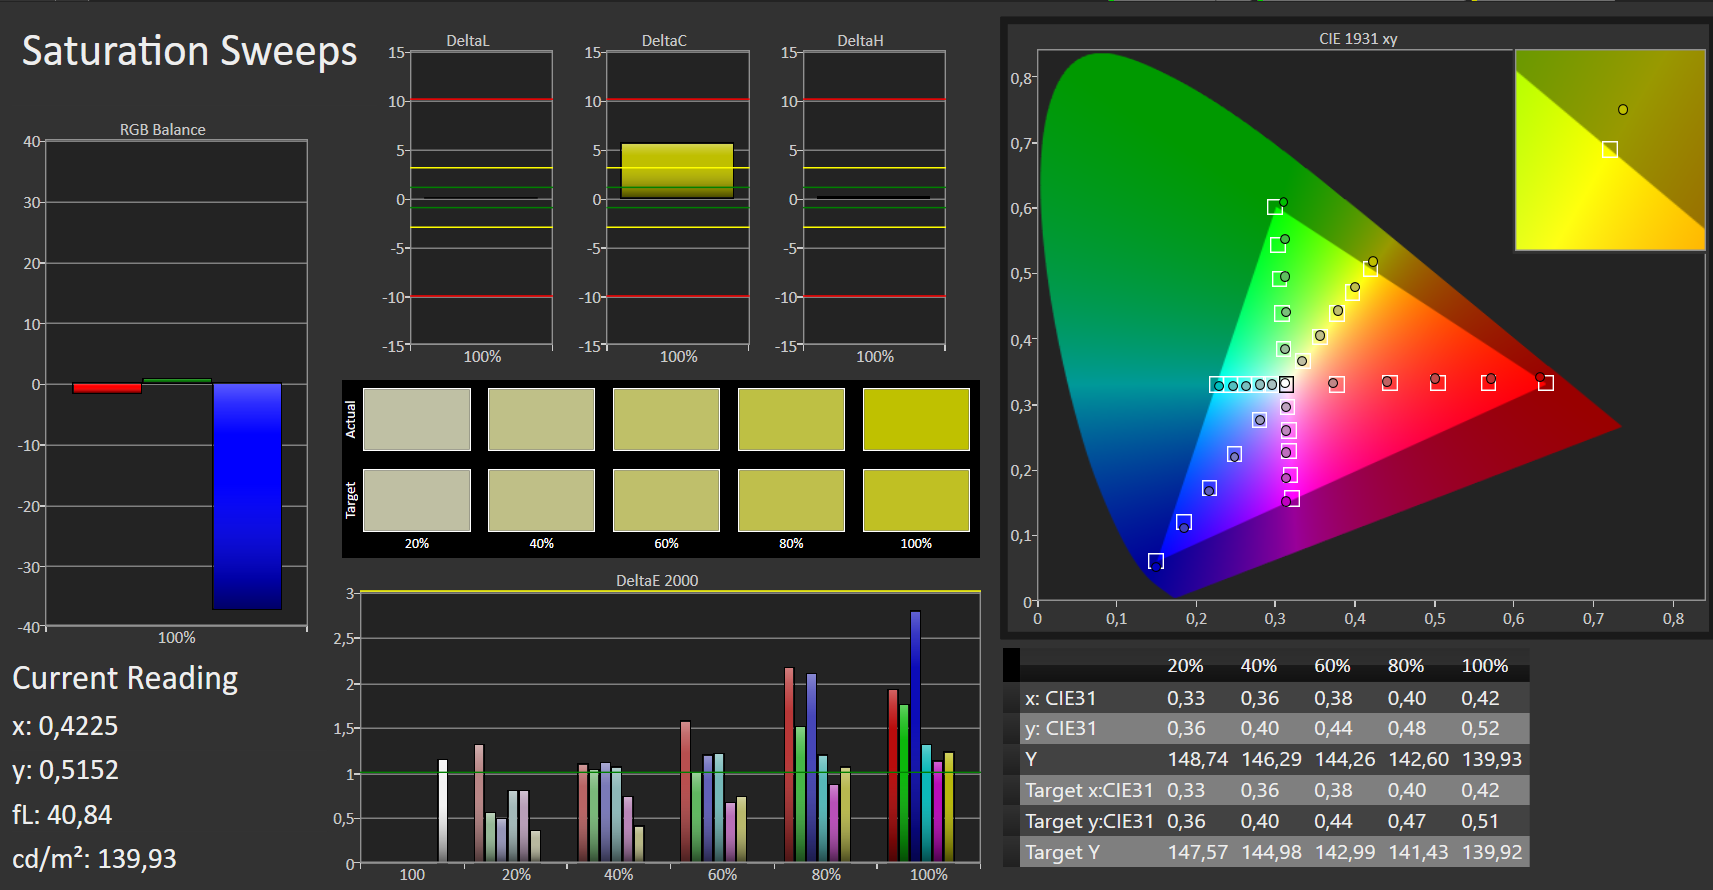
93% sRGB (Argyll 1.6.3 3D)
60% AdobeRGB 1998 (Argyll 1.6.3 3D)
65.7% AdobeRGB 1998 (Argyll 3D)
93% sRGB (Argyll 3D)
64.1% Display P3 (Argyll 3D)
Gamma: 2.6
CCT: 7678 K
| Acer Predator Helios 300 PH315-52-79TY AUO, B156HAN08.2, IPS, 1920x1080, 15.6" | HP Gaming Pavilion 15-dk0009ng LG Philips LGD05FE, IPS, 1920x1080, 15.6" | Lenovo Legion Y540-15IRH-81SX00B2GE BOE 084D, IPS, 1920x1080, 15.6" | Dell G5 15 5590 AU Optronics B156HAN, IPS, 1920x1080, 15.6" | Lenovo Legion Y740-15ICHg BOE NV156FHM-N4J, IPS, 1920x1080, 15.6" | Acer Predator Helios 300 PH317-52-51M6 LG Philips LP173WF4-SPF5 (LGD056D), IPS, 1920x1080, 17.3" | |
|---|---|---|---|---|---|---|
| Display | 1% | -1% | -38% | 2% | -2% | |
| Display P3 Coverage (%) | 64.1 | 64.2 0% | 63.6 -1% | 39.26 -39% | 67.7 6% | 67.1 5% |
| sRGB Coverage (%) | 93 | 95.1 2% | 91.7 -1% | 59.1 -36% | 91.6 -2% | 86.1 -7% |
| AdobeRGB 1998 Coverage (%) | 65.7 | 65.8 0% | 65.2 -1% | 40.56 -38% | 67.1 2% | 63 -4% |
| Response Times | -13% | 4% | -217% | -19% | -142% | |
| Response Time Grey 50% / Grey 80% * (ms) | 15 ? | 16.4 ? -9% | 8.8 ? 41% | 45 ? -200% | 19 ? -27% | 36 ? -140% |
| Response Time Black / White * (ms) | 9 ? | 10.4 ? -16% | 12 ? -33% | 30 ? -233% | 10 ? -11% | 22 ? -144% |
| PWM Frequency (Hz) | 122000 ? | |||||
| Screen | 14% | -3% | -50% | 19% | -25% | |
| Brightness middle (cd/m²) | 325 | 345 6% | 299 -8% | 234 -28% | 477 47% | 365 12% |
| Brightness (cd/m²) | 310 | 324 5% | 290 -6% | 219 -29% | 431 39% | 341 10% |
| Brightness Distribution (%) | 82 | 86 5% | 89 9% | 82 0% | 84 2% | 89 9% |
| Black Level * (cd/m²) | 0.255 | 0.42 -65% | 0.29 -14% | 0.17 33% | 0.175 31% | 0.32 -25% |
| Contrast (:1) | 1275 | 821 -36% | 1031 -19% | 1376 8% | 2726 114% | 1141 -11% |
| Colorchecker dE 2000 * | 4.28 | 1.3 70% | 3.7 14% | 8.6 -101% | 4.17 3% | 6.51 -52% |
| Colorchecker dE 2000 max. * | 8.42 | 2.8 67% | 7 17% | 17.49 -108% | 6.97 17% | 12.32 -46% |
| Colorchecker dE 2000 calibrated * | 1.45 | 1.1 24% | 2 -38% | 4.06 -180% | 2.51 -73% | 2.9 -100% |
| Greyscale dE 2000 * | 5.01 | 1.2 76% | 4.1 18% | 8.55 -71% | 3.49 30% | 7.65 -53% |
| Gamma | 2.6 85% | 2.31 95% | 2.19 100% | 3.02 73% | 2.5 88% | 2.64 83% |
| CCT | 7678 85% | 6476 100% | 7166 91% | 7802 83% | 7076 92% | 8066 81% |
| Color Space (Percent of AdobeRGB 1998) (%) | 60 | 60.5 1% | 59.3 -1% | 37 -38% | 60 0% | 56 -7% |
| Color Space (Percent of sRGB) (%) | 93 | 94.9 2% | 91.5 -2% | 59 -37% | 91 -2% | 86 -8% |
| Totalt genomsnitt (program/inställningar) | 1% /
8% | 0% /
-2% | -102% /
-69% | 1% /
11% | -56% /
-35% |
* ... mindre är bättre
Visa svarstider
| ↔ Svarstid svart till vitt | ||
|---|---|---|
| 9 ms ... stiga ↗ och falla ↘ kombinerat | ↗ 5 ms stiga | 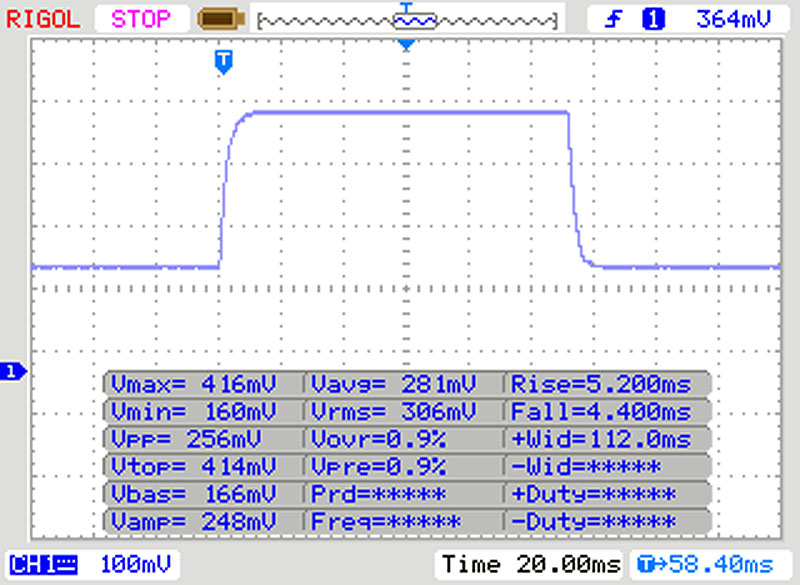 |
| ↘ 4 ms hösten | ||
| Skärmen visar snabba svarsfrekvenser i våra tester och bör passa för spel. I jämförelse sträcker sig alla testade enheter från 0.1 (minst) till 240 (maximalt) ms. » 25 % av alla enheter är bättre. Det betyder att den uppmätta svarstiden är bättre än genomsnittet av alla testade enheter (19.8 ms). | ||
| ↔ Svarstid 50 % grått till 80 % grått | ||
| 15 ms ... stiga ↗ och falla ↘ kombinerat | ↗ 8 ms stiga |  |
| ↘ 7 ms hösten | ||
| Skärmen visar bra svarsfrekvens i våra tester, men kan vara för långsam för konkurrenskraftiga spelare. I jämförelse sträcker sig alla testade enheter från 0.165 (minst) till 636 (maximalt) ms. » 29 % av alla enheter är bättre. Det betyder att den uppmätta svarstiden är bättre än genomsnittet av alla testade enheter (30.9 ms). | ||
Skärmflimmer / PWM (Puls-Width Modulation)
| Skärmflimmer / PWM upptäcktes inte |  | ||
Som jämförelse: 52 % av alla testade enheter använder inte PWM för att dämpa skärmen. Om PWM upptäcktes mättes ett medelvärde av 7741 (minst: 5 - maximum: 343500) Hz. | |||
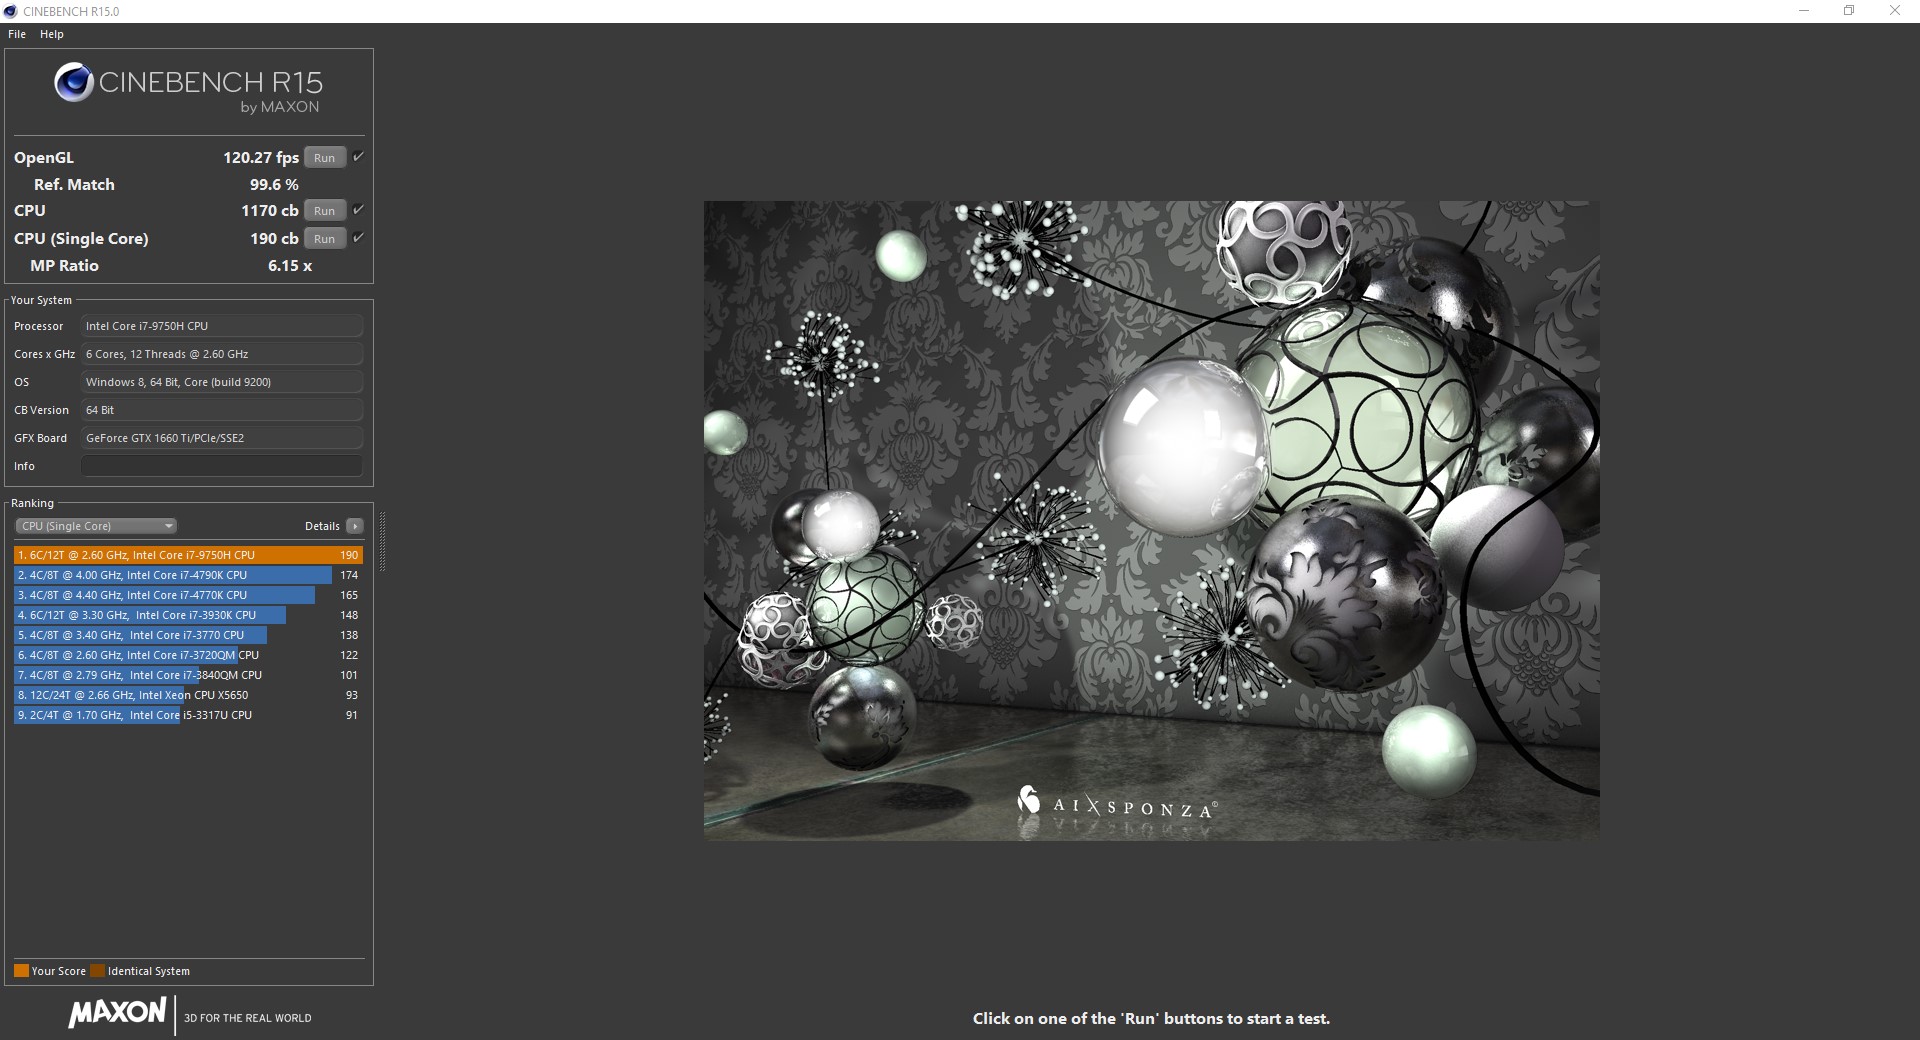
| Cinebench R15 | |
| CPU Single 64Bit | |
| Acer Predator Helios 300 PH315-52-79TY | |
| Lenovo Legion Y540-15IRH-81SX00B2GE | |
| HP Gaming Pavilion 15-dk0009ng | |
| Genomsnitt Intel Core i7-9750H (170 - 194, n=82) | |
| Lenovo Legion Y740-15ICHg | |
| Acer Predator Helios 300 PH317-52-51M6 | |
| Dell G5 15 5590 | |
| CPU Multi 64Bit | |
| Dell G5 15 5590 | |
| Lenovo Legion Y740-15ICHg | |
| Genomsnitt Intel Core i7-9750H (952 - 1306, n=85) | |
| Acer Predator Helios 300 PH315-52-79TY | |
| Lenovo Legion Y540-15IRH-81SX00B2GE | |
| HP Gaming Pavilion 15-dk0009ng | |
| Acer Predator Helios 300 PH317-52-51M6 | |
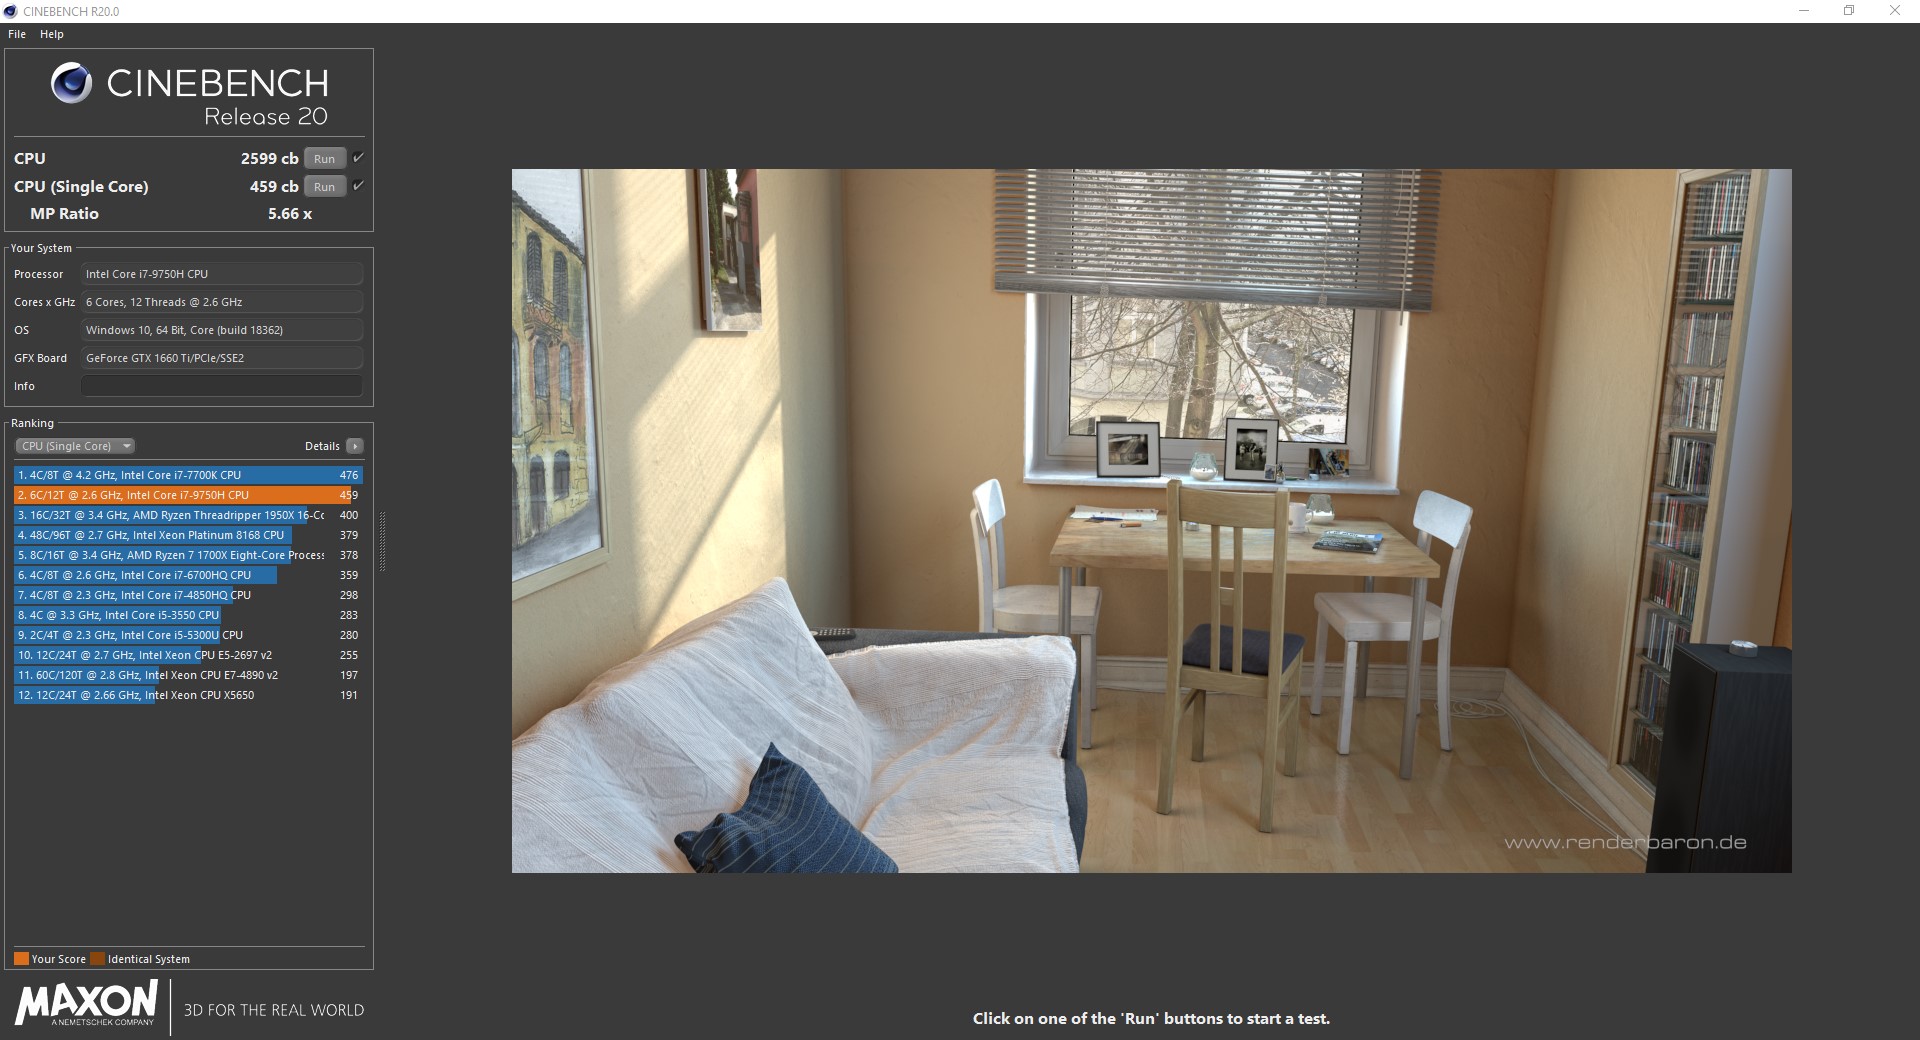
| Cinebench R20 | |
| CPU (Single Core) | |
| Acer Predator Helios 300 PH315-52-79TY | |
| Lenovo Legion Y540-15IRH-81SX00B2GE | |
| Lenovo Legion Y740-15ICHg | |
| HP Gaming Pavilion 15-dk0009ng | |
| Genomsnitt Intel Core i7-9750H (416 - 486, n=55) | |
| Dell G5 15 5590 | |
| CPU (Multi Core) | |
| Dell G5 15 5590 | |
| Lenovo Legion Y740-15ICHg | |
| Acer Predator Helios 300 PH315-52-79TY | |
| Lenovo Legion Y540-15IRH-81SX00B2GE | |
| Genomsnitt Intel Core i7-9750H (2017 - 3133, n=55) | |
| HP Gaming Pavilion 15-dk0009ng | |
| 3DMark 11 - 1280x720 Performance Physics | |
| HP Gaming Pavilion 15-dk0009ng | |
| Lenovo Legion Y540-15IRH-81SX00B2GE | |
| Lenovo Legion Y740-15ICHg | |
| Genomsnitt Intel Core i7-9750H (9704 - 14337, n=80) | |
| Acer Predator Helios 300 PH315-52-79TY | |
| Dell G5 15 5590 | |
| Acer Predator Helios 300 PH317-52-51M6 | |
| Blender - v2.79 BMW27 CPU | |
| Acer Predator Helios 300 PH315-52-79TY | |
| Genomsnitt Intel Core i7-9750H (342 - 495, n=21) | |
| Lenovo Legion Y540-15IRH-81SX00B2GE | |
| Lenovo Legion Y740-15ICHg | |
| Geekbench 4.4 | |
| 64 Bit Single-Core Score | |
| HP Gaming Pavilion 15-dk0009ng | |
| Lenovo Legion Y740-15ICHg | |
| Genomsnitt Intel Core i7-9750H (4440 - 5511, n=27) | |
| Acer Predator Helios 300 PH315-52-79TY | |
| Acer Predator Helios 300 PH315-52-79TY | |
| Dell G5 15 5590 | |
| Lenovo Legion Y540-15IRH-81SX00B2GE | |
| 64 Bit Multi-Core Score | |
| HP Gaming Pavilion 15-dk0009ng | |
| Lenovo Legion Y740-15ICHg | |
| Genomsnitt Intel Core i7-9750H (17054 - 25043, n=27) | |
| Dell G5 15 5590 | |
| Acer Predator Helios 300 PH315-52-79TY | |
| Acer Predator Helios 300 PH315-52-79TY | |
| Lenovo Legion Y540-15IRH-81SX00B2GE | |
| 7-Zip 18.03 | |
| 7z b 4 | |
| Lenovo Legion Y540-15IRH-81SX00B2GE | |
| Lenovo Legion Y740-15ICHg | |
| Genomsnitt Intel Core i7-9750H (28512 - 35174, n=21) | |
| Acer Predator Helios 300 PH315-52-79TY | |
| 7z b 4 -mmt1 | |
| Lenovo Legion Y740-15ICHg | |
| Lenovo Legion Y540-15IRH-81SX00B2GE | |
| Genomsnitt Intel Core i7-9750H (4580 - 5090, n=21) | |
| Acer Predator Helios 300 PH315-52-79TY | |
* ... mindre är bättre
| PCMark 8 Home Score Accelerated v2 | 4688 poäng | |
| PCMark 8 Creative Score Accelerated v2 | 7682 poäng | |
| PCMark 8 Work Score Accelerated v2 | 5483 poäng | |
| PCMark 10 Score | 5279 poäng | |
Hjälp | ||
| Acer Predator Helios 300 PH315-52-79TY WDC PC SN720 SDAPNTW-512G | HP Gaming Pavilion 15-dk0009ng Samsung SSD PM981 MZVLB256HAHQ | Lenovo Legion Y540-15IRH-81SX00B2GE WDC PC SN720 SDAPNTW-512G | Dell G5 15 5590 KBG30ZMS128G | Lenovo Legion Y740-15ICHg WDC PC SN520 SDAPMUW-128G | Acer Predator Helios 300 PH317-52-51M6 Hynix HFS128G39TND | Genomsnitt WDC PC SN720 SDAPNTW-512G | |
|---|---|---|---|---|---|---|---|
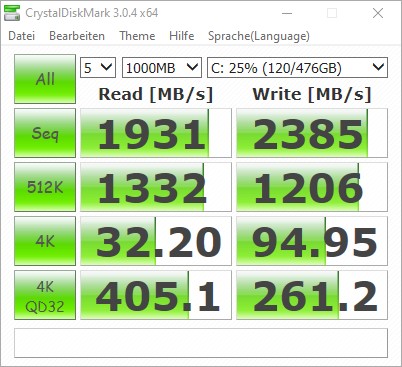
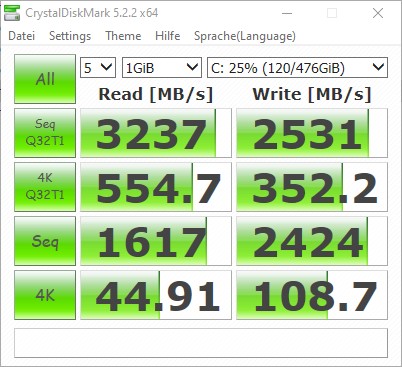
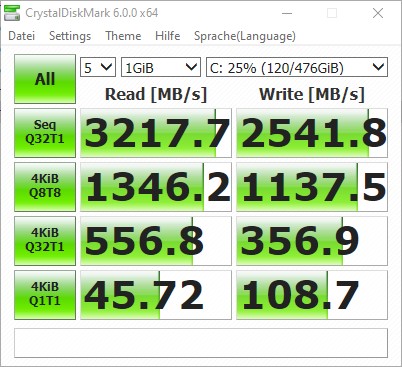
| CrystalDiskMark 5.2 / 6 | -23% | 0% | -65% | -45% | -70% | -14% | |
| Write 4K (MB/s) | 108.7 | 100 -8% | 158.8 46% | 64.3 -41% | 134.2 23% | 61.9 -43% | 110 ? 1% |
| Read 4K (MB/s) | 44.91 | 31.39 -30% | 29.11 -35% | 29.3 -35% | 37.72 -16% | 22.78 -49% | 36.9 ? -18% |
| Write Seq (MB/s) | 2424 | 1308 -46% | 1584 -35% | 131.1 -95% | 389.2 -84% | 136.1 -94% | 1976 ? -18% |
| Read Seq (MB/s) | 1617 | 1083 -33% | 1694 5% | 776 -52% | 1030 -36% | 490.1 -70% | 1710 ? 6% |
| Write 4K Q32T1 (MB/s) | 356.9 | 362.9 2% | 536 50% | 96.8 -73% | 238.9 -33% | 136.2 -62% | 339 ? -5% |
| Read 4K Q32T1 (MB/s) | 557 | 425.7 -24% | 363.9 -35% | 198.6 -64% | 343.9 -38% | 208.4 -63% | 417 ? -25% |
| Write Seq Q32T1 (MB/s) | 2542 | 1411 -44% | 2536 0% | 127.8 -95% | 789 -69% | 136 -95% | 2218 ? -13% |
| Read Seq Q32T1 (MB/s) | 3218 | 3240 1% | 3458 7% | 1044 -68% | 1502 -53% | 553 -83% | 2940 ? -9% |
| Write 4K Q8T8 (MB/s) | 1138 | 293.4 -74% | 721 ? -37% | ||||
| Read 4K Q8T8 (MB/s) | 1346 | 405.8 -70% | 993 ? -26% | ||||
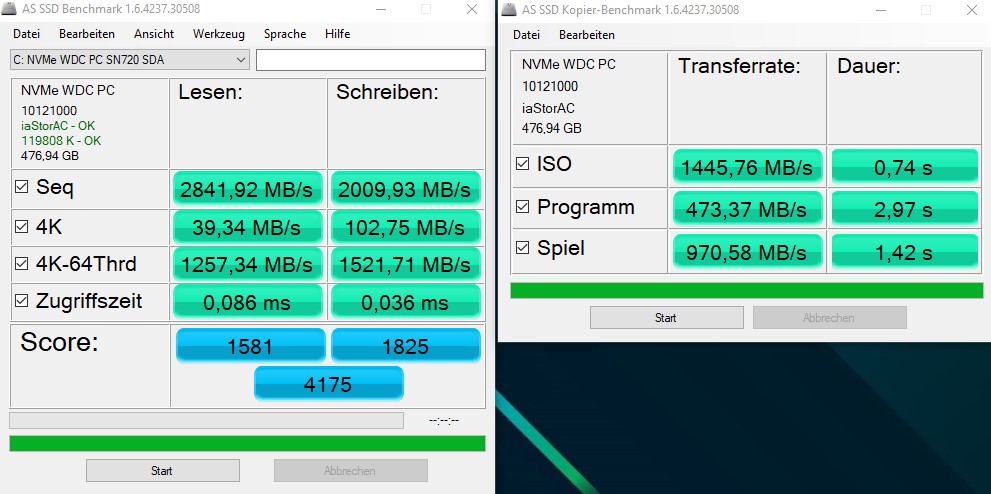
| AS SSD | -33% | 10% | -227% | -46% | -128% | -9% | |
| Seq Read (MB/s) | 2841 | 2088 -27% | 2927 3% | 1036 -64% | 1372 -52% | 513 -82% | 2544 ? -10% |
| Seq Write (MB/s) | 2009 | 1347 -33% | 2149 7% | 115.1 -94% | 746 -63% | 128.2 -94% | 2034 ? 1% |
| 4K Read (MB/s) | 39.34 | 36.14 -8% | 42.43 8% | 29.6 -25% | 35.42 -10% | 26.5 -33% | 36.5 ? -7% |
| 4K Write (MB/s) | 102.8 | 96.5 -6% | 147.1 43% | 67.8 -34% | 99.9 -3% | 62.7 -39% | 110.8 ? 8% |
| 4K-64 Read (MB/s) | 1257 | 565 -55% | 1286 2% | 184.5 -85% | 302.1 -76% | 336.6 -73% | 1112 ? -12% |
| 4K-64 Write (MB/s) | 1522 | 588 -61% | 1432 -6% | 95.2 -94% | 191.4 -87% | 120.1 -92% | 1222 ? -20% |
| Access Time Read * (ms) | 0.086 | 0.093 -8% | 0.065 24% | 1.519 -1666% | 0.132 -53% | 0.0965 ? -12% | |
| Access Time Write * (ms) | 0.036 | 0.038 -6% | 0.026 28% | 0.255 -608% | 0.037 -3% | 0.259 -619% | 0.04212 ? -17% |
| Score Read (Points) | 1581 | 810 -49% | 1621 3% | 318 -80% | 475 -70% | 414 -74% | 1403 ? -11% |
| Score Write (Points) | 1825 | 819 -55% | 1794 -2% | 174 -90% | 366 -80% | 196 -89% | 1536 ? -16% |
| Score Total (Points) | 4175 | 2014 -52% | 4208 1% | 620 -85% | 1065 -74% | 811 -81% | 3633 ? -13% |
| Copy ISO MB/s (MB/s) | 1446 | 1043 -28% | 159.2 -89% | 1062 -27% | 1506 ? 4% | ||
| Copy Program MB/s (MB/s) | 473.4 | 371.7 -21% | 94.4 -80% | 426 -10% | 410 ? -13% | ||
| Copy Game MB/s (MB/s) | 971 | 399.9 -59% | 106.3 -89% | 650 -33% | 894 ? -8% | ||
| Totalt genomsnitt (program/inställningar) | -28% /
-30% | 5% /
6% | -146% /
-168% | -46% /
-45% | -99% /
-102% | -12% /
-11% |
* ... mindre är bättre

| 3DMark | |
| 1280x720 Cloud Gate Standard Graphics | |
| Genomsnitt av klass Gaming (86886 - 223650, n=60, senaste 2 åren) | |
| Lenovo Legion Y740-15ICHg | |
| Acer Predator Helios 300 PH315-52-79TY | |
| Dell G5 15 5590 | |
| Genomsnitt NVIDIA GeForce GTX 1660 Ti Mobile (59839 - 104780, n=18) | |
| Lenovo Legion Y540-15IRH-81SX00B2GE | |
| HP Gaming Pavilion 15-dk0009ng | |
| Acer Predator Helios 300 PH317-52-51M6 | |
| 1920x1080 Fire Strike Graphics | |
| Genomsnitt av klass Gaming (18629 - 62849, n=112, senaste 2 åren) | |
| Lenovo Legion Y740-15ICHg | |
| Dell G5 15 5590 | |
| Genomsnitt NVIDIA GeForce GTX 1660 Ti Mobile (14186 - 16488, n=24) | |
| Acer Predator Helios 300 PH315-52-79TY | |
| Lenovo Legion Y540-15IRH-81SX00B2GE | |
| HP Gaming Pavilion 15-dk0009ng | |
| Acer Predator Helios 300 PH317-52-51M6 | |
| 2560x1440 Time Spy Graphics | |
| Genomsnitt av klass Gaming (6387 - 26212, n=112, senaste 2 åren) | |
| Lenovo Legion Y740-15ICHg | |
| Dell G5 15 5590 | |
| Genomsnitt NVIDIA GeForce GTX 1660 Ti Mobile (5335 - 6123, n=22) | |
| Acer Predator Helios 300 PH315-52-79TY | |
| HP Gaming Pavilion 15-dk0009ng | |
| 3DMark 11 Performance | 16344 poäng | |
| 3DMark Ice Storm Standard Score | 106089 poäng | |
| 3DMark Cloud Gate Standard Score | 35033 poäng | |
| 3DMark Fire Strike Score | 12903 poäng | |
| 3DMark Fire Strike Extreme Score | 6532 poäng | |
| 3DMark Time Spy Score | 5615 poäng | |
Hjälp | ||
| The Witcher 3 | |
| 1024x768 Low Graphics & Postprocessing | |
| Genomsnitt av klass Gaming (447 - 686, n=2, senaste 2 åren) | |
| Lenovo Legion Y740-15ICHg | |
| Genomsnitt NVIDIA GeForce GTX 1660 Ti Mobile (177.3 - 298, n=14) | |
| HP Gaming Pavilion 15-dk0009ng | |
| Dell G5 15 5590 | |
| Acer Predator Helios 300 PH315-52-79TY | |
| 1366x768 Medium Graphics & Postprocessing | |
| Genomsnitt av klass Gaming (428 - 517, n=2, senaste 2 åren) | |
| Lenovo Legion Y740-15ICHg | |
| Genomsnitt NVIDIA GeForce GTX 1660 Ti Mobile (148 - 200, n=14) | |
| Dell G5 15 5590 | |
| HP Gaming Pavilion 15-dk0009ng | |
| Acer Predator Helios 300 PH315-52-79TY | |
| 1920x1080 High Graphics & Postprocessing (Nvidia HairWorks Off) | |
| Genomsnitt av klass Gaming (341 - 404, n=2, senaste 2 åren) | |
| Lenovo Legion Y740-15ICHg | |
| Dell G5 15 5590 | |
| Genomsnitt NVIDIA GeForce GTX 1660 Ti Mobile (93 - 120.4, n=17) | |
| HP Gaming Pavilion 15-dk0009ng | |
| Acer Predator Helios 300 PH315-52-79TY | |
| Acer Predator Helios 300 PH317-52-51M6 | |
| låg | med. | hög | ultra | |
|---|---|---|---|---|
| BioShock Infinite (2013) | 283 | 241 | 237 | 128 |
| The Witcher 3 (2015) | 204 | 151 | 93 | 54.6 |
| Dota 2 Reborn (2015) | 119.4 | 110.4 | 103.3 | 94.6 |
| Rise of the Tomb Raider (2016) | 118 | 116 | 86 | 74 |
| X-Plane 11.11 (2018) | 83 | 76 | 64 |
Ljudnivå
| Låg belastning |
| 31 / 31 / 31 dB(A) |
| Hög belastning |
| 41.5 / 46.9 dB(A) |
 | ||
30 dB tyst 40 dB(A) hörbar 50 dB(A) högt ljud |
||
min: | ||
| Acer Predator Helios 300 PH315-52-79TY GeForce GTX 1660 Ti Mobile, i7-9750H, WDC PC SN720 SDAPNTW-512G | HP Gaming Pavilion 15-dk0009ng GeForce GTX 1660 Ti Max-Q, i7-9750H, Samsung SSD PM981 MZVLB256HAHQ | Lenovo Legion Y540-15IRH-81SX00B2GE GeForce GTX 1660 Ti Mobile, i7-9750H, WDC PC SN720 SDAPNTW-512G | Dell G5 15 5590 GeForce RTX 2060 Mobile, i7-8750H, KBG30ZMS128G | Lenovo Legion Y740-15ICHg GeForce RTX 2070 Max-Q, i7-9750H, WDC PC SN520 SDAPMUW-128G | Acer Predator Helios 300 PH317-52-51M6 GeForce GTX 1050 Ti Mobile, i5-8300H, Hynix HFS128G39TND | |
|---|---|---|---|---|---|---|
| Noise | 12% | 6% | -2% | 1% | -1% | |
| av / miljö * (dB) | 30.2 | 28.2 7% | 29.3 3% | 30.4 -1% | 30 1% | 29 4% |
| Idle Minimum * (dB) | 31 | 29.3 5% | 29.3 5% | 30.4 2% | 31.3 -1% | 29 6% |
| Idle Average * (dB) | 31 | 29.3 5% | 29.3 5% | 30.4 2% | 31.3 -1% | 31 -0% |
| Idle Maximum * (dB) | 31 | 29.3 5% | 29.3 5% | 33.4 -8% | 31.3 -1% | 33 -6% |
| Load Average * (dB) | 41.5 | 32.3 22% | 35.7 14% | 42 -1% | 42 -1% | 45 -8% |
| Witcher 3 ultra * (dB) | 46.7 | 34 27% | 44.2 5% | 42.1 10% | 45 4% | |
| Load Maximum * (dB) | 46.9 | 41.2 12% | 45.6 3% | 48.7 -4% | 46.5 1% | 51 -9% |
* ... mindre är bättre
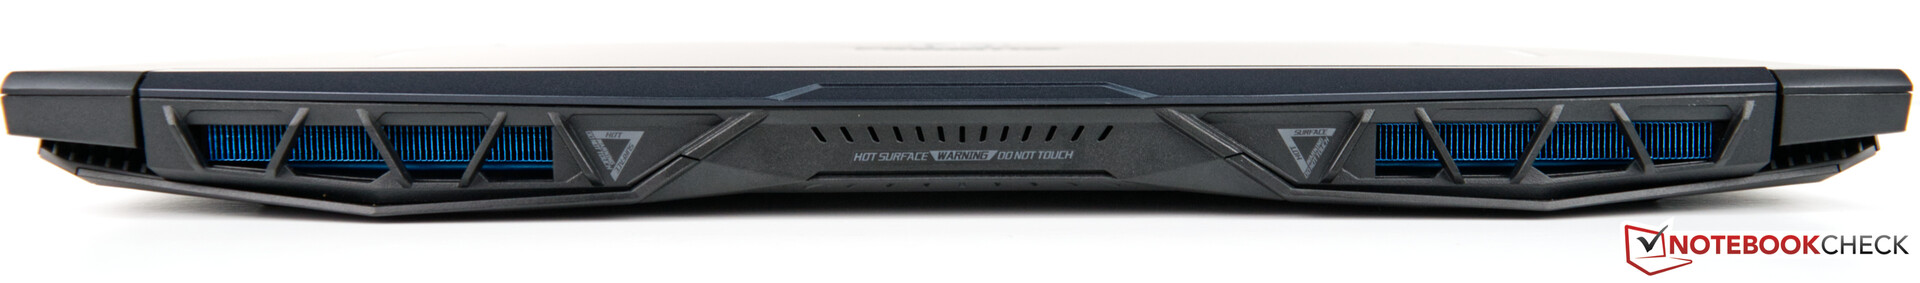
(-) Den maximala temperaturen på ovansidan är 52 °C / 126 F, jämfört med genomsnittet av 40.4 °C / 105 F , allt från 21.2 till 68.8 °C för klassen Gaming.
(-) Botten värms upp till maximalt 46.3 °C / 115 F, jämfört med genomsnittet av 43.2 °C / 110 F
(+) Vid tomgångsbruk är medeltemperaturen för ovansidan 24.1 °C / 75 F, jämfört med enhetsgenomsnittet på 33.9 °C / ### class_avg_f### F.
(±) När du spelar The Witcher 3 är medeltemperaturen för ovansidan 38 °C / 100 F, jämfört med enhetsgenomsnittet på 33.9 °C / ## #class_avg_f### F.
(+) Handledsstöden och pekplattan når maximal hudtemperatur (33 °C / 91.4 F) och är därför inte varma.
(-) Medeltemperaturen för handledsstödsområdet på liknande enheter var 28.8 °C / 83.8 F (-4.2 °C / -7.6 F).
| Acer Predator Helios 300 PH315-52-79TY GeForce GTX 1660 Ti Mobile, i7-9750H, WDC PC SN720 SDAPNTW-512G | HP Gaming Pavilion 15-dk0009ng GeForce GTX 1660 Ti Max-Q, i7-9750H, Samsung SSD PM981 MZVLB256HAHQ | Lenovo Legion Y540-15IRH-81SX00B2GE GeForce GTX 1660 Ti Mobile, i7-9750H, WDC PC SN720 SDAPNTW-512G | Dell G5 15 5590 GeForce RTX 2060 Mobile, i7-8750H, KBG30ZMS128G | Lenovo Legion Y740-15ICHg GeForce RTX 2070 Max-Q, i7-9750H, WDC PC SN520 SDAPMUW-128G | Acer Predator Helios 300 PH317-52-51M6 GeForce GTX 1050 Ti Mobile, i5-8300H, Hynix HFS128G39TND | |
|---|---|---|---|---|---|---|
| Heat | 1% | -23% | -5% | -26% | -15% | |
| Maximum Upper Side * (°C) | 52 | 46.7 10% | 42.7 18% | 51.5 1% | 43.9 16% | 50 4% |
| Maximum Bottom * (°C) | 46.3 | 53.7 -16% | 52.7 -14% | 48.3 -4% | 47.6 -3% | 52 -12% |
| Idle Upper Side * (°C) | 24.8 | 23.8 4% | 33.1 -33% | 27.2 -10% | 38.6 -56% | 33 -33% |
| Idle Bottom * (°C) | 25.4 | 23.7 7% | 41 -61% | 27.4 -8% | 40.8 -61% | 30 -18% |
* ... mindre är bättre
Acer Predator Helios 300 PH315-52-79TY ljudanalys
(-) | inte särskilt höga högtalare (69.2 dB)
Bas 100 - 315 Hz
(-) | nästan ingen bas - i genomsnitt 22.4% lägre än medianen
(±) | linjäriteten för basen är genomsnittlig (12.4% delta till föregående frekvens)
Mellan 400 - 2000 Hz
(+) | balanserad mellan - endast 3.8% från medianen
(±) | linjäriteten för mids är genomsnittlig (9.8% delta till föregående frekvens)
Högsta 2 - 16 kHz
(+) | balanserade toppar - endast 2% från medianen
(+) | toppar är linjära (6.9% delta till föregående frekvens)
Totalt 100 - 16 000 Hz
(±) | linjäriteten för det totala ljudet är genomsnittlig (21.4% skillnad mot median)
Jämfört med samma klass
» 77% av alla testade enheter i den här klassen var bättre, 5% liknande, 18% sämre
» Den bästa hade ett delta på 6%, genomsnittet var 18%, sämst var 132%
Jämfört med alla testade enheter
» 60% av alla testade enheter var bättre, 7% liknande, 33% sämre
» Den bästa hade ett delta på 4%, genomsnittet var 23%, sämst var 134%
Lenovo Legion Y540-15IRH-81SX00B2GE ljudanalys
(±) | högtalarljudstyrkan är genomsnittlig men bra (77.4 dB)
Bas 100 - 315 Hz
(-) | nästan ingen bas - i genomsnitt 17.7% lägre än medianen
(±) | linjäriteten för basen är genomsnittlig (11.6% delta till föregående frekvens)
Mellan 400 - 2000 Hz
(+) | balanserad mellan - endast 3.7% från medianen
(+) | mids är linjära (4.5% delta till föregående frekvens)
Högsta 2 - 16 kHz
(+) | balanserade toppar - endast 3.3% från medianen
(+) | toppar är linjära (5.9% delta till föregående frekvens)
Totalt 100 - 16 000 Hz
(±) | linjäriteten för det totala ljudet är genomsnittlig (18.1% skillnad mot median)
Jämfört med samma klass
» 57% av alla testade enheter i den här klassen var bättre, 8% liknande, 35% sämre
» Den bästa hade ett delta på 6%, genomsnittet var 18%, sämst var 132%
Jämfört med alla testade enheter
» 39% av alla testade enheter var bättre, 8% liknande, 54% sämre
» Den bästa hade ett delta på 4%, genomsnittet var 23%, sämst var 134%
| Av/Standby | |
| Låg belastning | |
| Hög belastning |
|
Förklaring:
min: | |
| Acer Predator Helios 300 PH315-52-79TY i7-9750H, GeForce GTX 1660 Ti Mobile, WDC PC SN720 SDAPNTW-512G, IPS, 1920x1080, 15.6" | HP Gaming Pavilion 15-dk0009ng i7-9750H, GeForce GTX 1660 Ti Max-Q, Samsung SSD PM981 MZVLB256HAHQ, IPS, 1920x1080, 15.6" | Lenovo Legion Y540-15IRH-81SX00B2GE i7-9750H, GeForce GTX 1660 Ti Mobile, WDC PC SN720 SDAPNTW-512G, IPS, 1920x1080, 15.6" | Dell G5 15 5590 i7-8750H, GeForce RTX 2060 Mobile, KBG30ZMS128G, IPS, 1920x1080, 15.6" | Lenovo Legion Y740-15ICHg i7-9750H, GeForce RTX 2070 Max-Q, WDC PC SN520 SDAPMUW-128G, IPS, 1920x1080, 15.6" | Acer Predator Helios 300 PH317-52-51M6 i5-8300H, GeForce GTX 1050 Ti Mobile, Hynix HFS128G39TND, IPS, 1920x1080, 17.3" | Genomsnitt NVIDIA GeForce GTX 1660 Ti Mobile | Genomsnitt av klass Gaming | |
|---|---|---|---|---|---|---|---|---|
| Power Consumption | 31% | 9% | 34% | -16% | 38% | 7% | -6% | |
| Idle Minimum * (Watt) | 17.2 | 6.8 60% | 14.5 16% | 3.5 80% | 22.2 -29% | 6 65% | 12.4 ? 28% | 13.1 ? 24% |
| Idle Average * (Watt) | 22.6 | 10.7 53% | 18.5 18% | 6.9 69% | 24.9 -10% | 9 60% | 18 ? 20% | 19 ? 16% |
| Idle Maximum * (Watt) | 25.5 | 12.5 51% | 20 22% | 8.5 67% | 30.6 -20% | 13 49% | 25.3 ? 1% | 24.6 ? 4% |
| Load Average * (Watt) | 88 | 87.2 1% | 81.6 7% | 127 -44% | 101 -15% | 95 -8% | 93.5 ? -6% | 111.3 ? -26% |
| Load Maximum * (Watt) | 177 | 191.4 -8% | 208.1 -18% | 179 -1% | 186 -5% | 134 24% | 191.9 ? -8% | 260 ? -47% |
| Witcher 3 ultra * (Watt) | 121 | 132 | 143 | 102 |
* ... mindre är bättre


| Acer Predator Helios 300 PH315-52-79TY i7-9750H, GeForce GTX 1660 Ti Mobile, 58.75 Wh | HP Gaming Pavilion 15-dk0009ng i7-9750H, GeForce GTX 1660 Ti Max-Q, 52.5 Wh | Lenovo Legion Y540-15IRH-81SX00B2GE i7-9750H, GeForce GTX 1660 Ti Mobile, 57 Wh | Dell G5 15 5590 i7-8750H, GeForce RTX 2060 Mobile, 60 Wh | Lenovo Legion Y740-15ICHg i7-9750H, GeForce RTX 2070 Max-Q, 57 Wh | Acer Predator Helios 300 PH317-52-51M6 i5-8300H, GeForce GTX 1050 Ti Mobile, 48 Wh | Genomsnitt av klass Gaming | |
|---|---|---|---|---|---|---|---|
| Batteridrifttid | 44% | -14% | 149% | -14% | 82% | 82% | |
| Reader / Idle (h) | 5 | 8.7 74% | 4 -20% | 14.8 196% | 11.8 136% | 7.84 ? 57% | |
| H.264 (h) | 3.4 | 5.3 56% | 8.4 147% | 8.27 ? 143% | |||
| WiFi v1.3 (h) | 3.5 | 4.8 37% | 2.4 -31% | 7.7 120% | 3 -14% | 5.9 69% | 7.08 ? 102% |
| Load (h) | 1.2 | 1.3 8% | 1.3 8% | 2.8 133% | 1.7 42% | 1.496 ? 25% | |
| Witcher 3 ultra (h) | 1 |
För
Emot
Omdöme - En kraftfull 1080p-spellaptop med brister
Läs den fullständiga versionen av den här recensionen på engelska här.
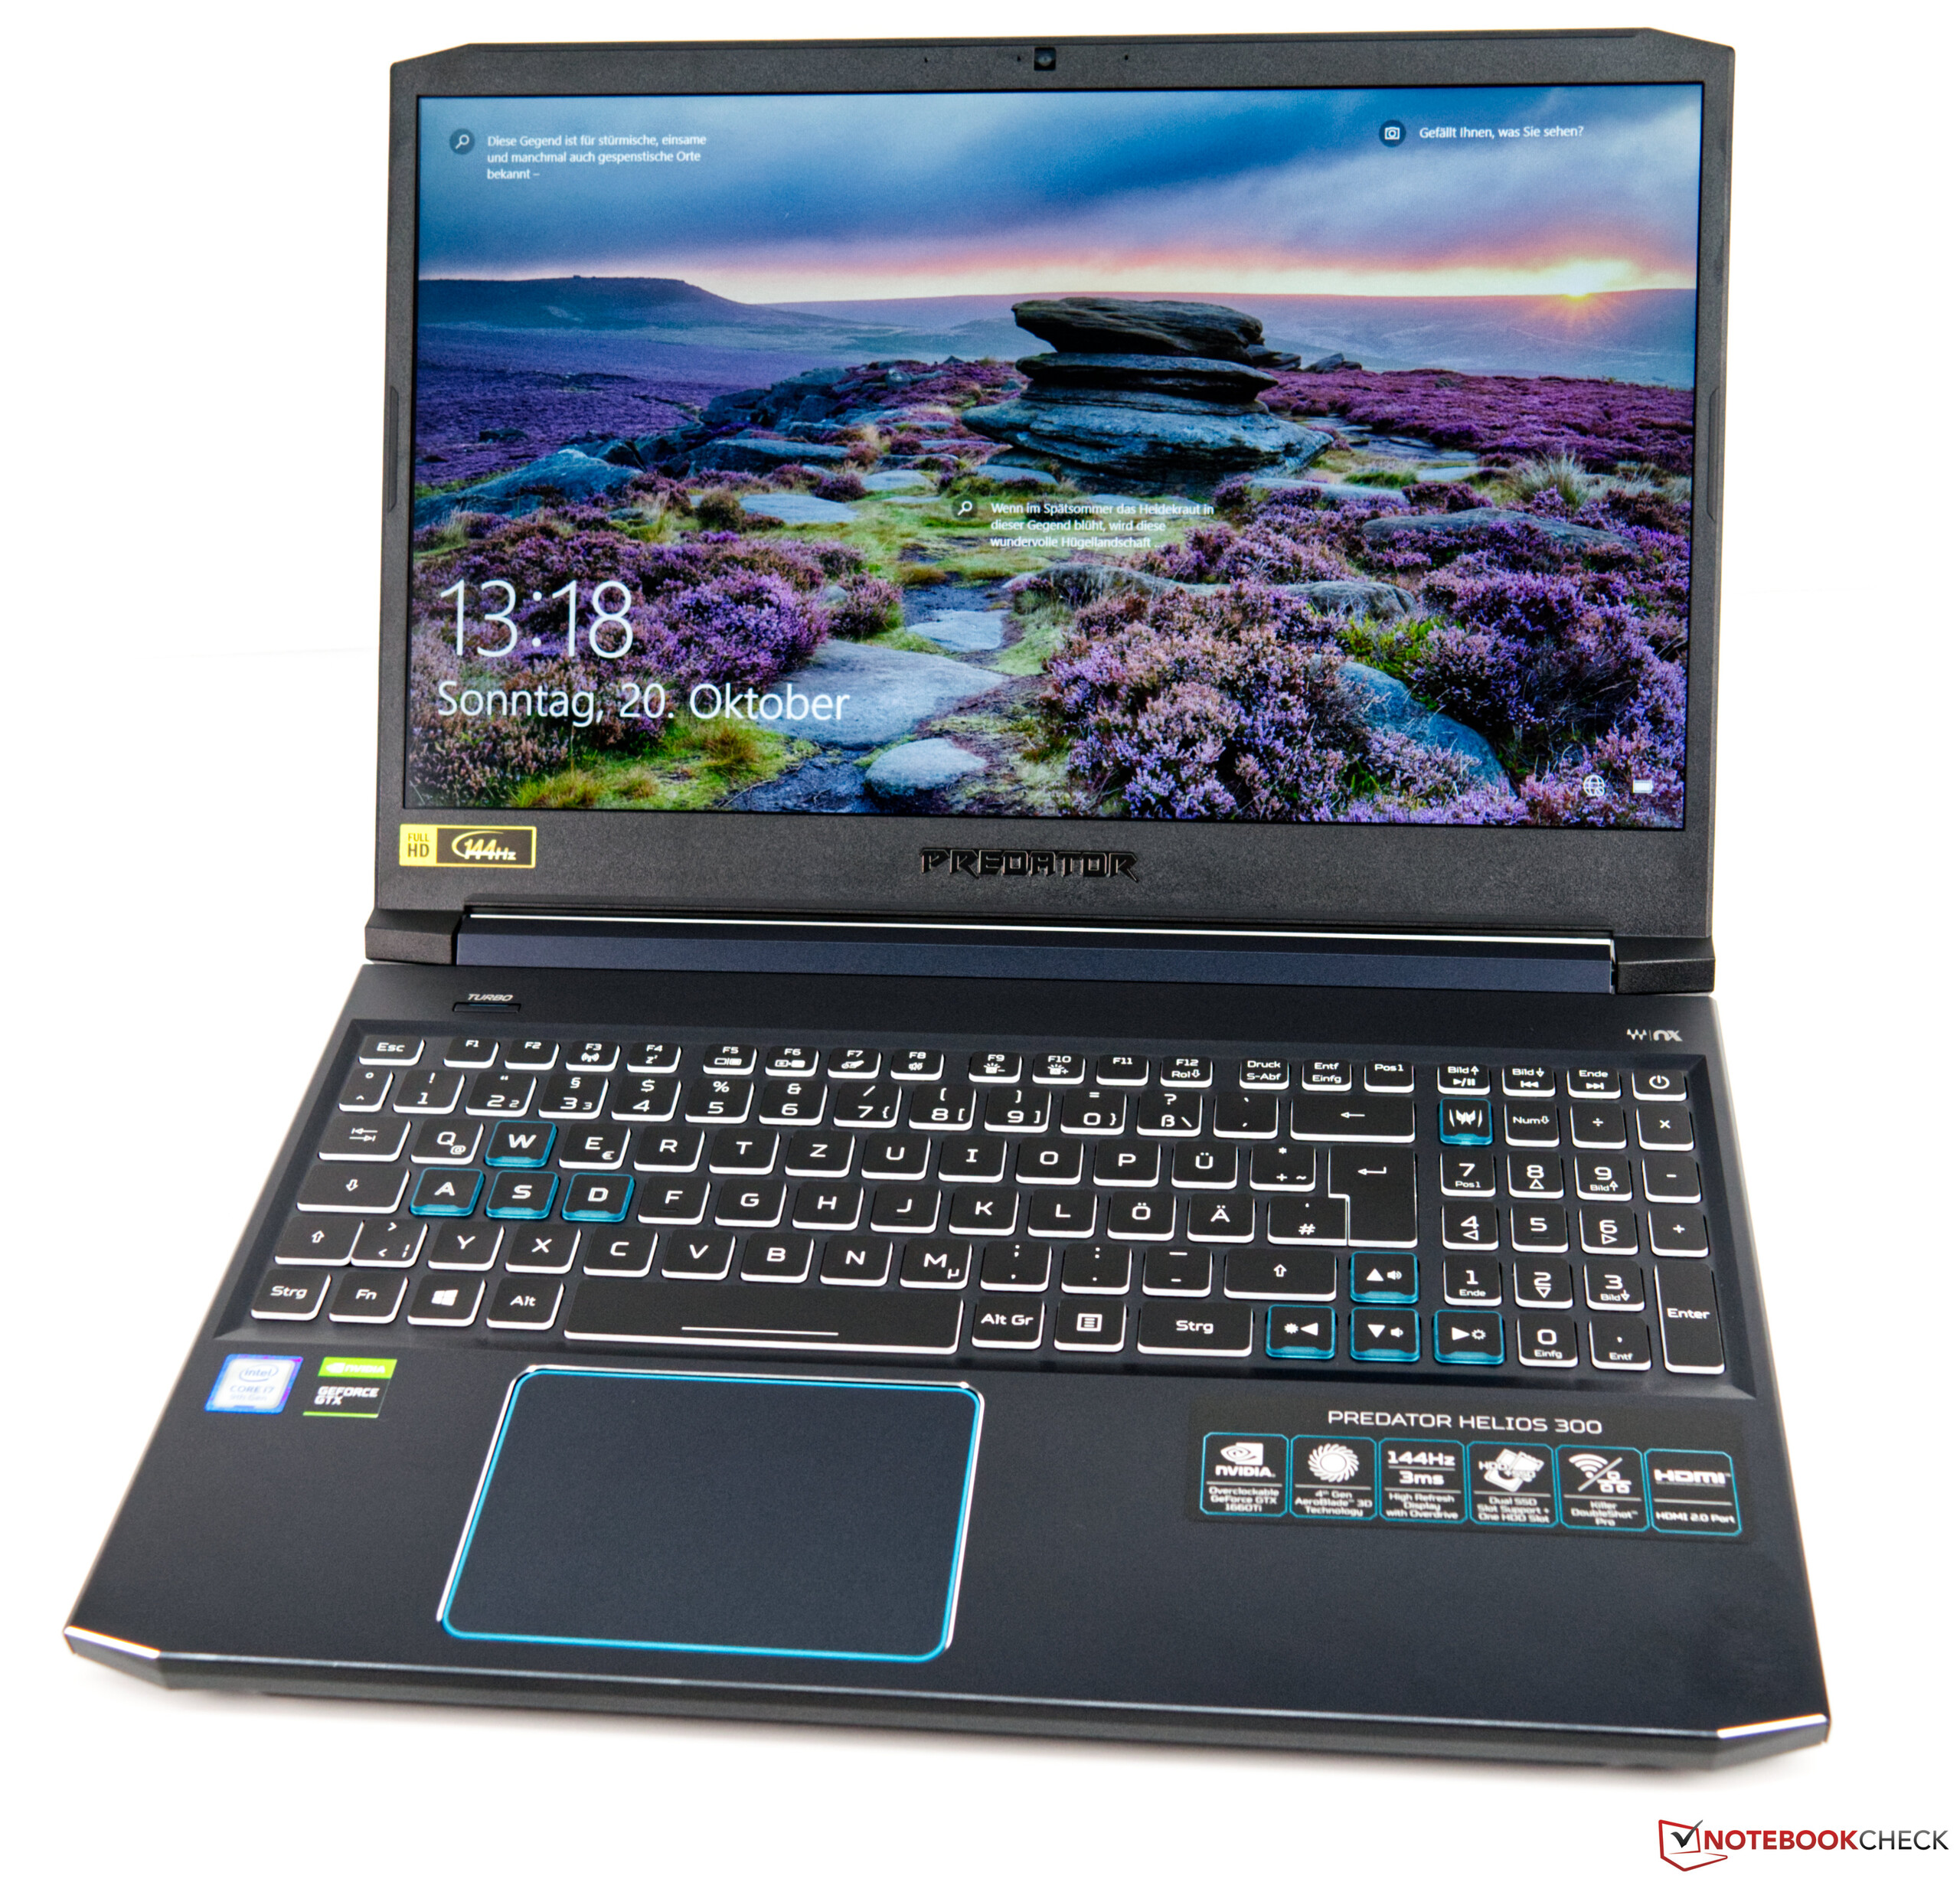
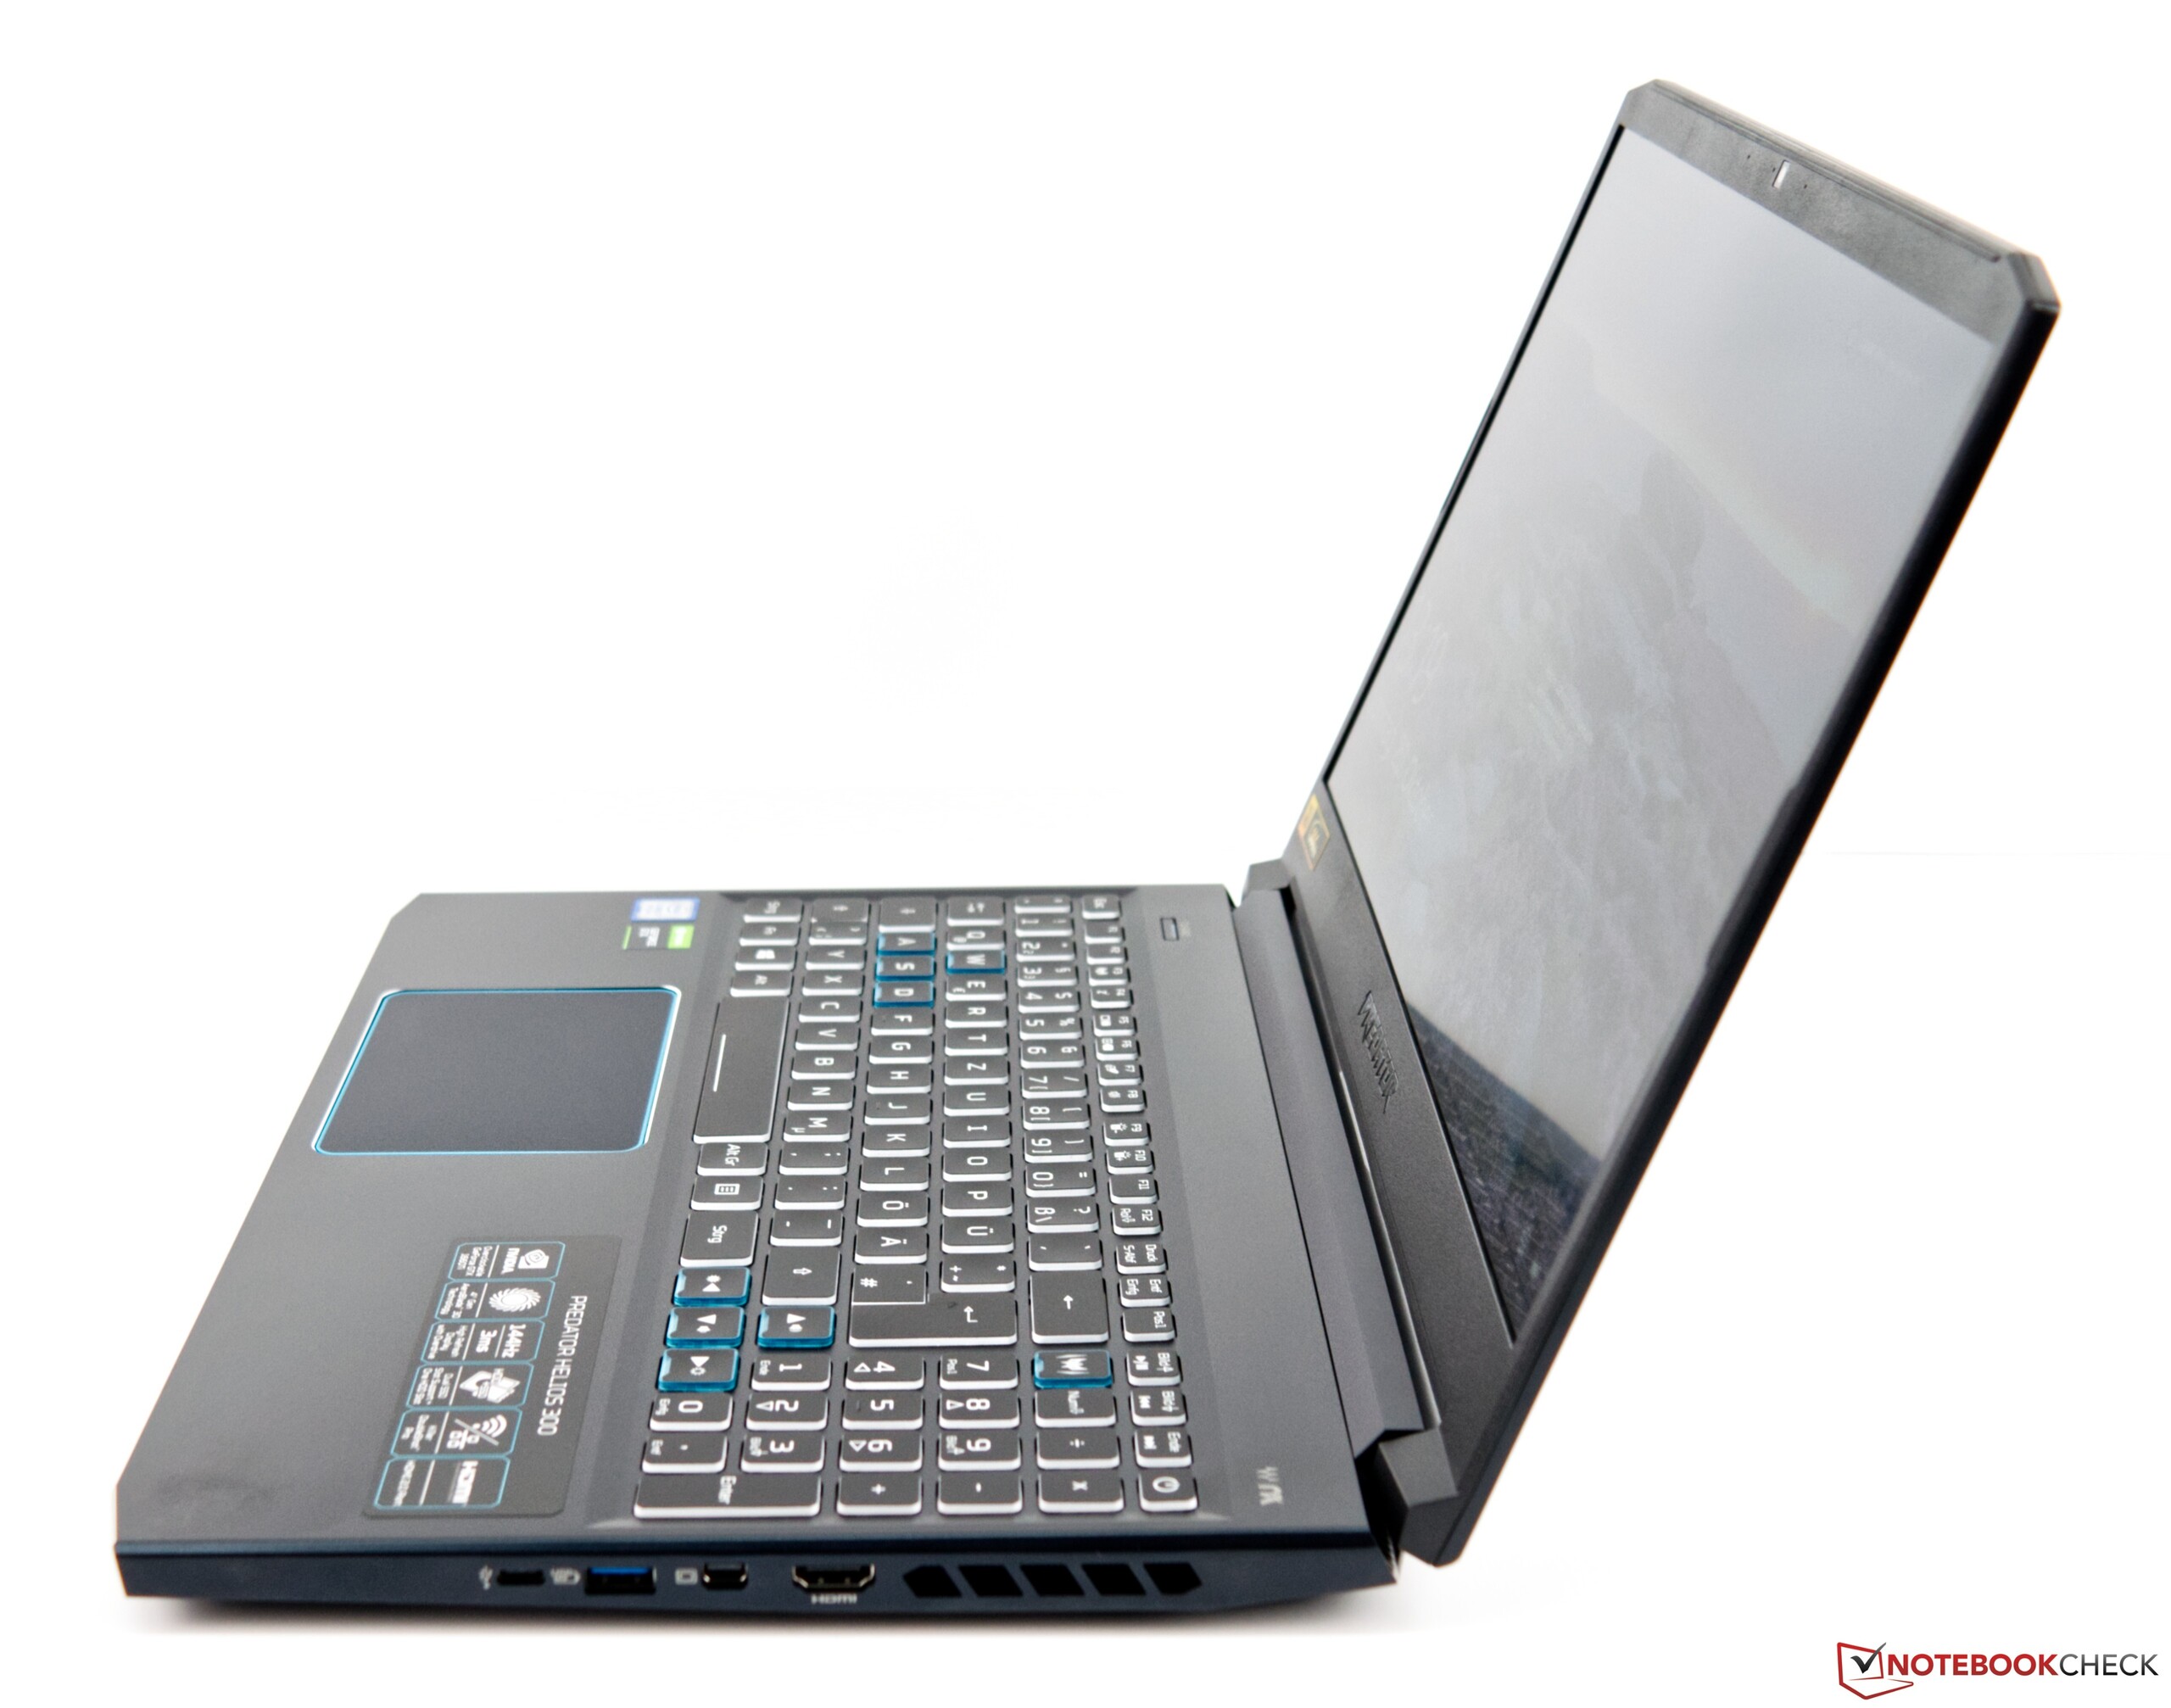
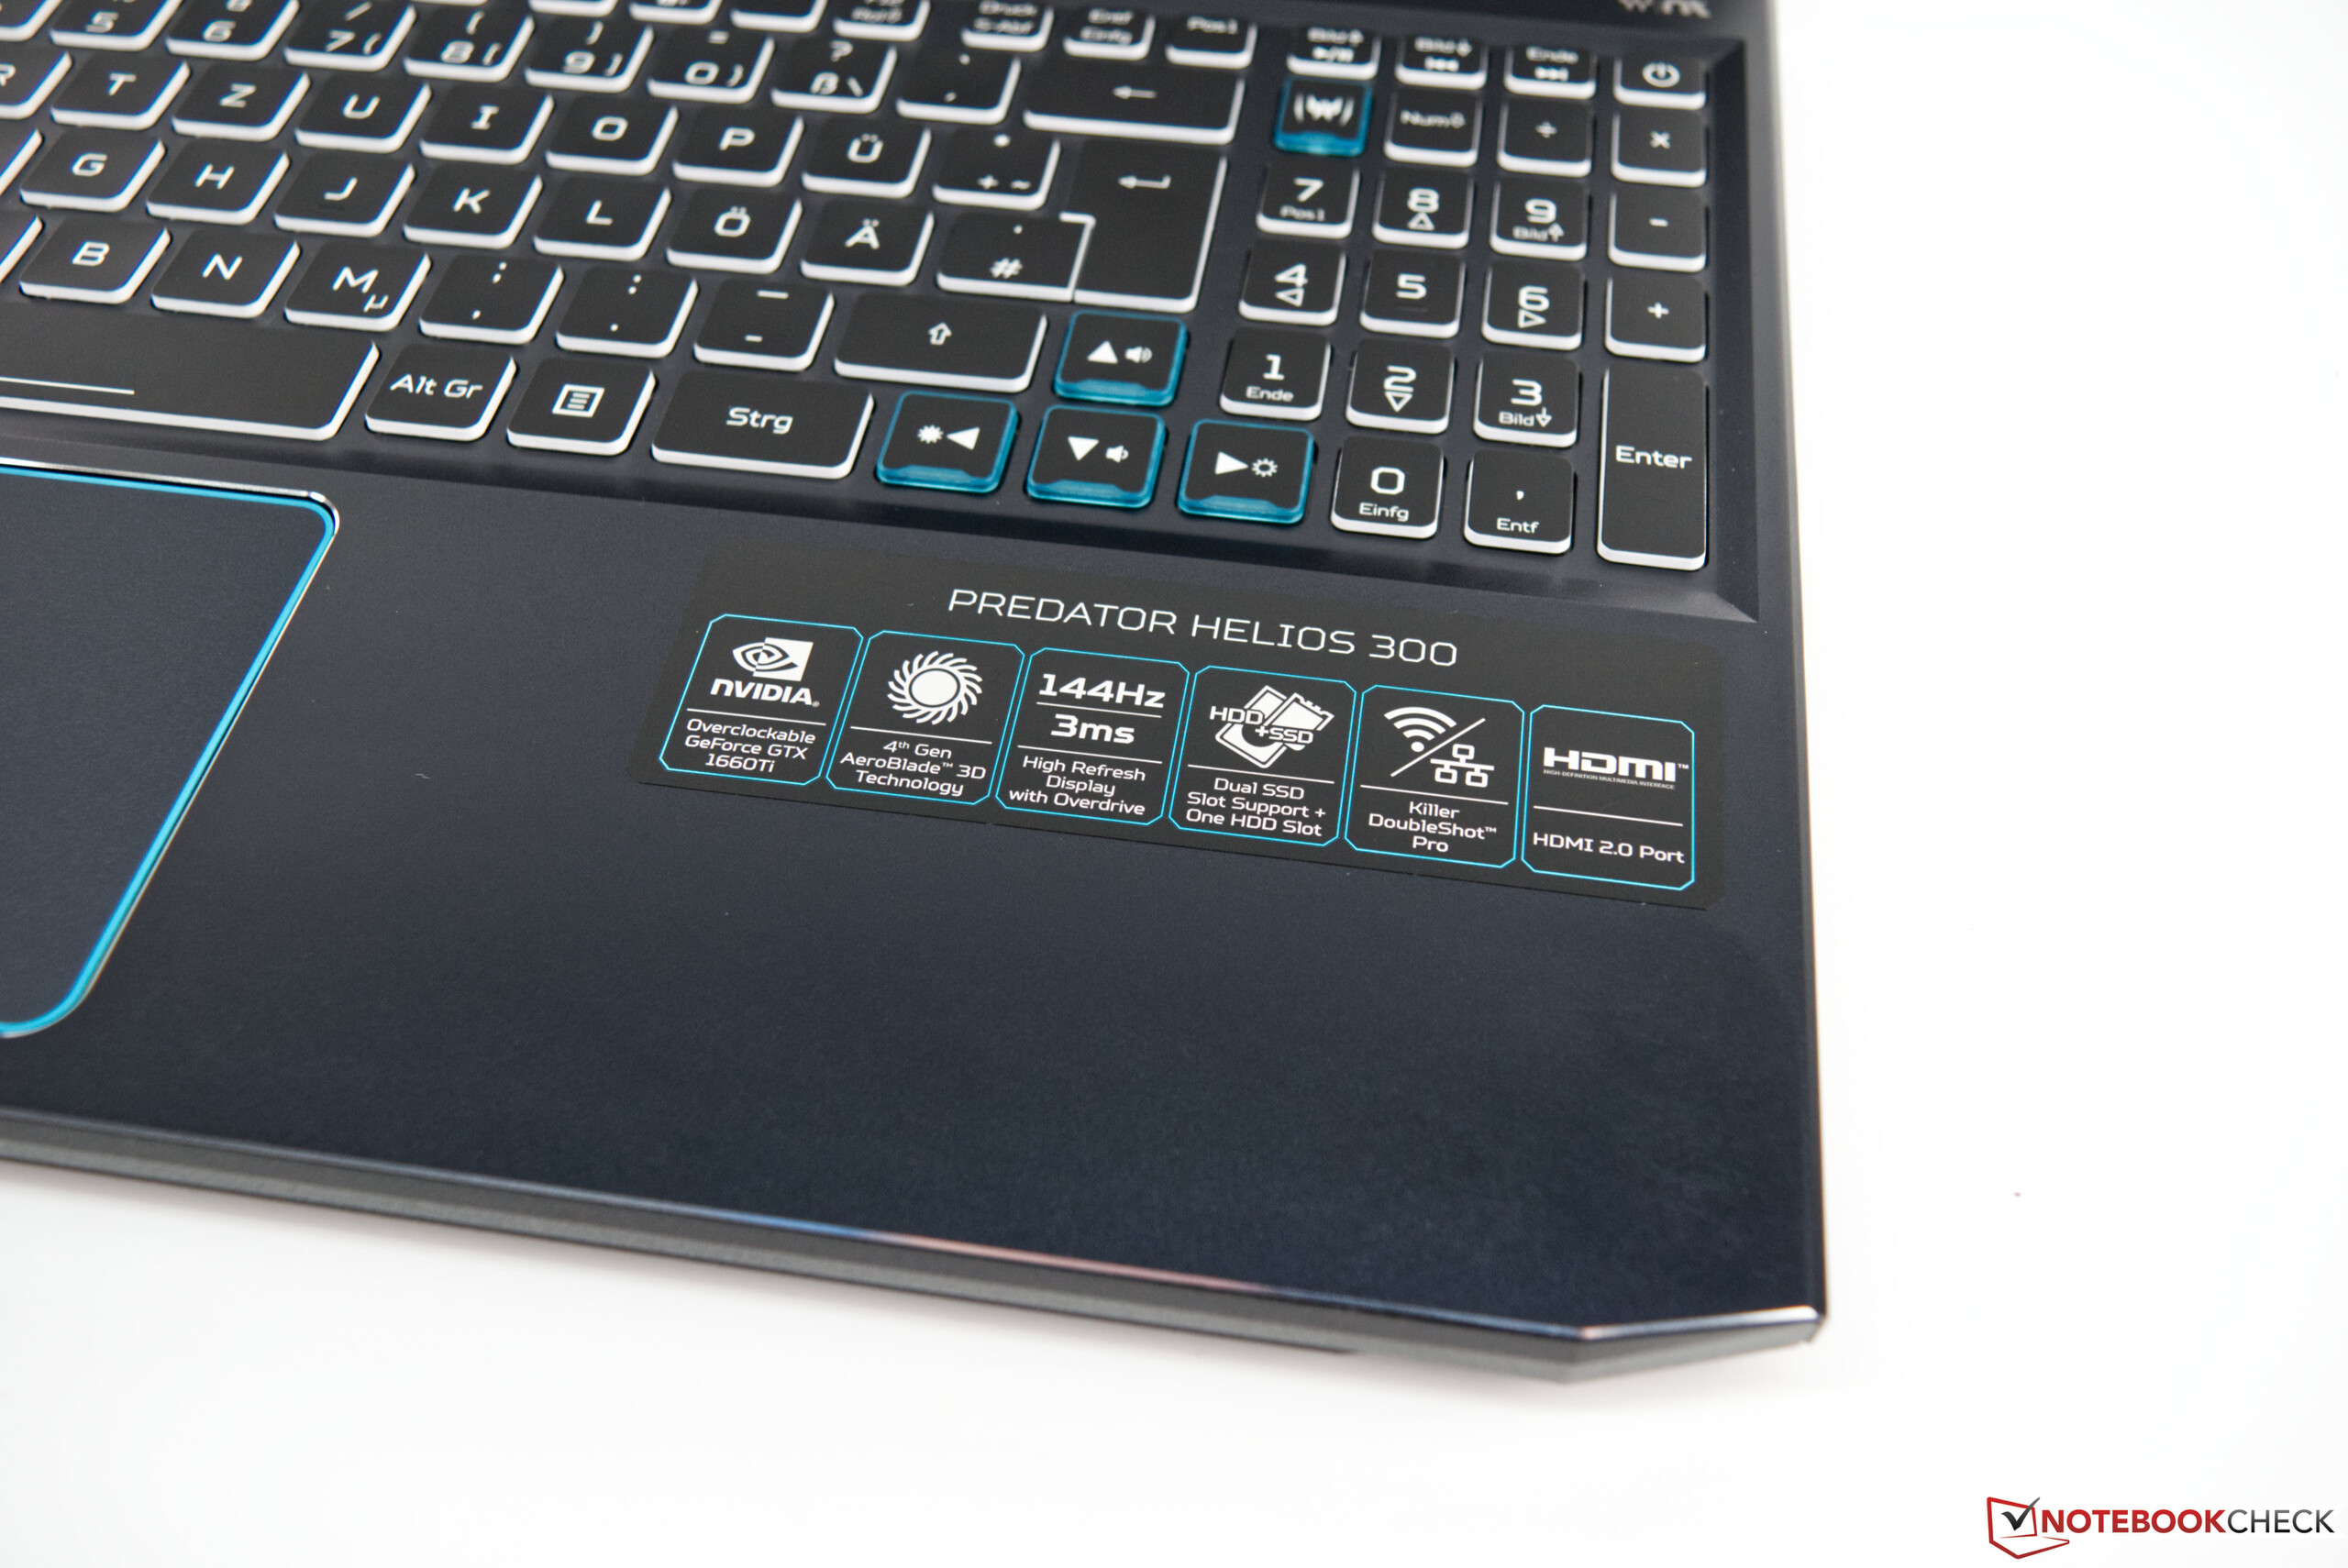
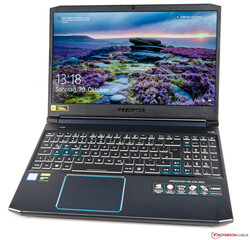
Acer Predator Helios 300 PH315 är en modern spellaptop med godtagbar spelprestanda. För 14.000 kronor är instegsmodellen inte direkt konkurrensmässigt prissatt. Men denna omgjorda 15-tumslaptop är väldesignad och har hårdvara som kan hantera alla aktuella AAA-spel i 1080p.
Även om vi alltid gillar när tillverkare använder 144 Hz-paneler i sina spellaptops är skärmar med snabb bilduppdatering numera norm. Skärmen i vår recensionsenhet lämnade oss dock med en dålig eftersmak. Å ena sidan är den ljusstark och har god färgprecision, vilket är kvaliteter värda att hylla. Men å andra sidan lider bakgrundsbelysningen av rejäl bleeding, något vi inte hade förväntat oss på en såpass dyr laptop. Dessutom känns 512 GB lagring på en spellaptop lite snålt, så vi rekommenderar att välja alternativet på 1 TB om möjligt, annars kan det hända att du snart behöver sätta i en extra enhet, särskilt då en del spel nu kräver över 100 GB lagringsutrymme.
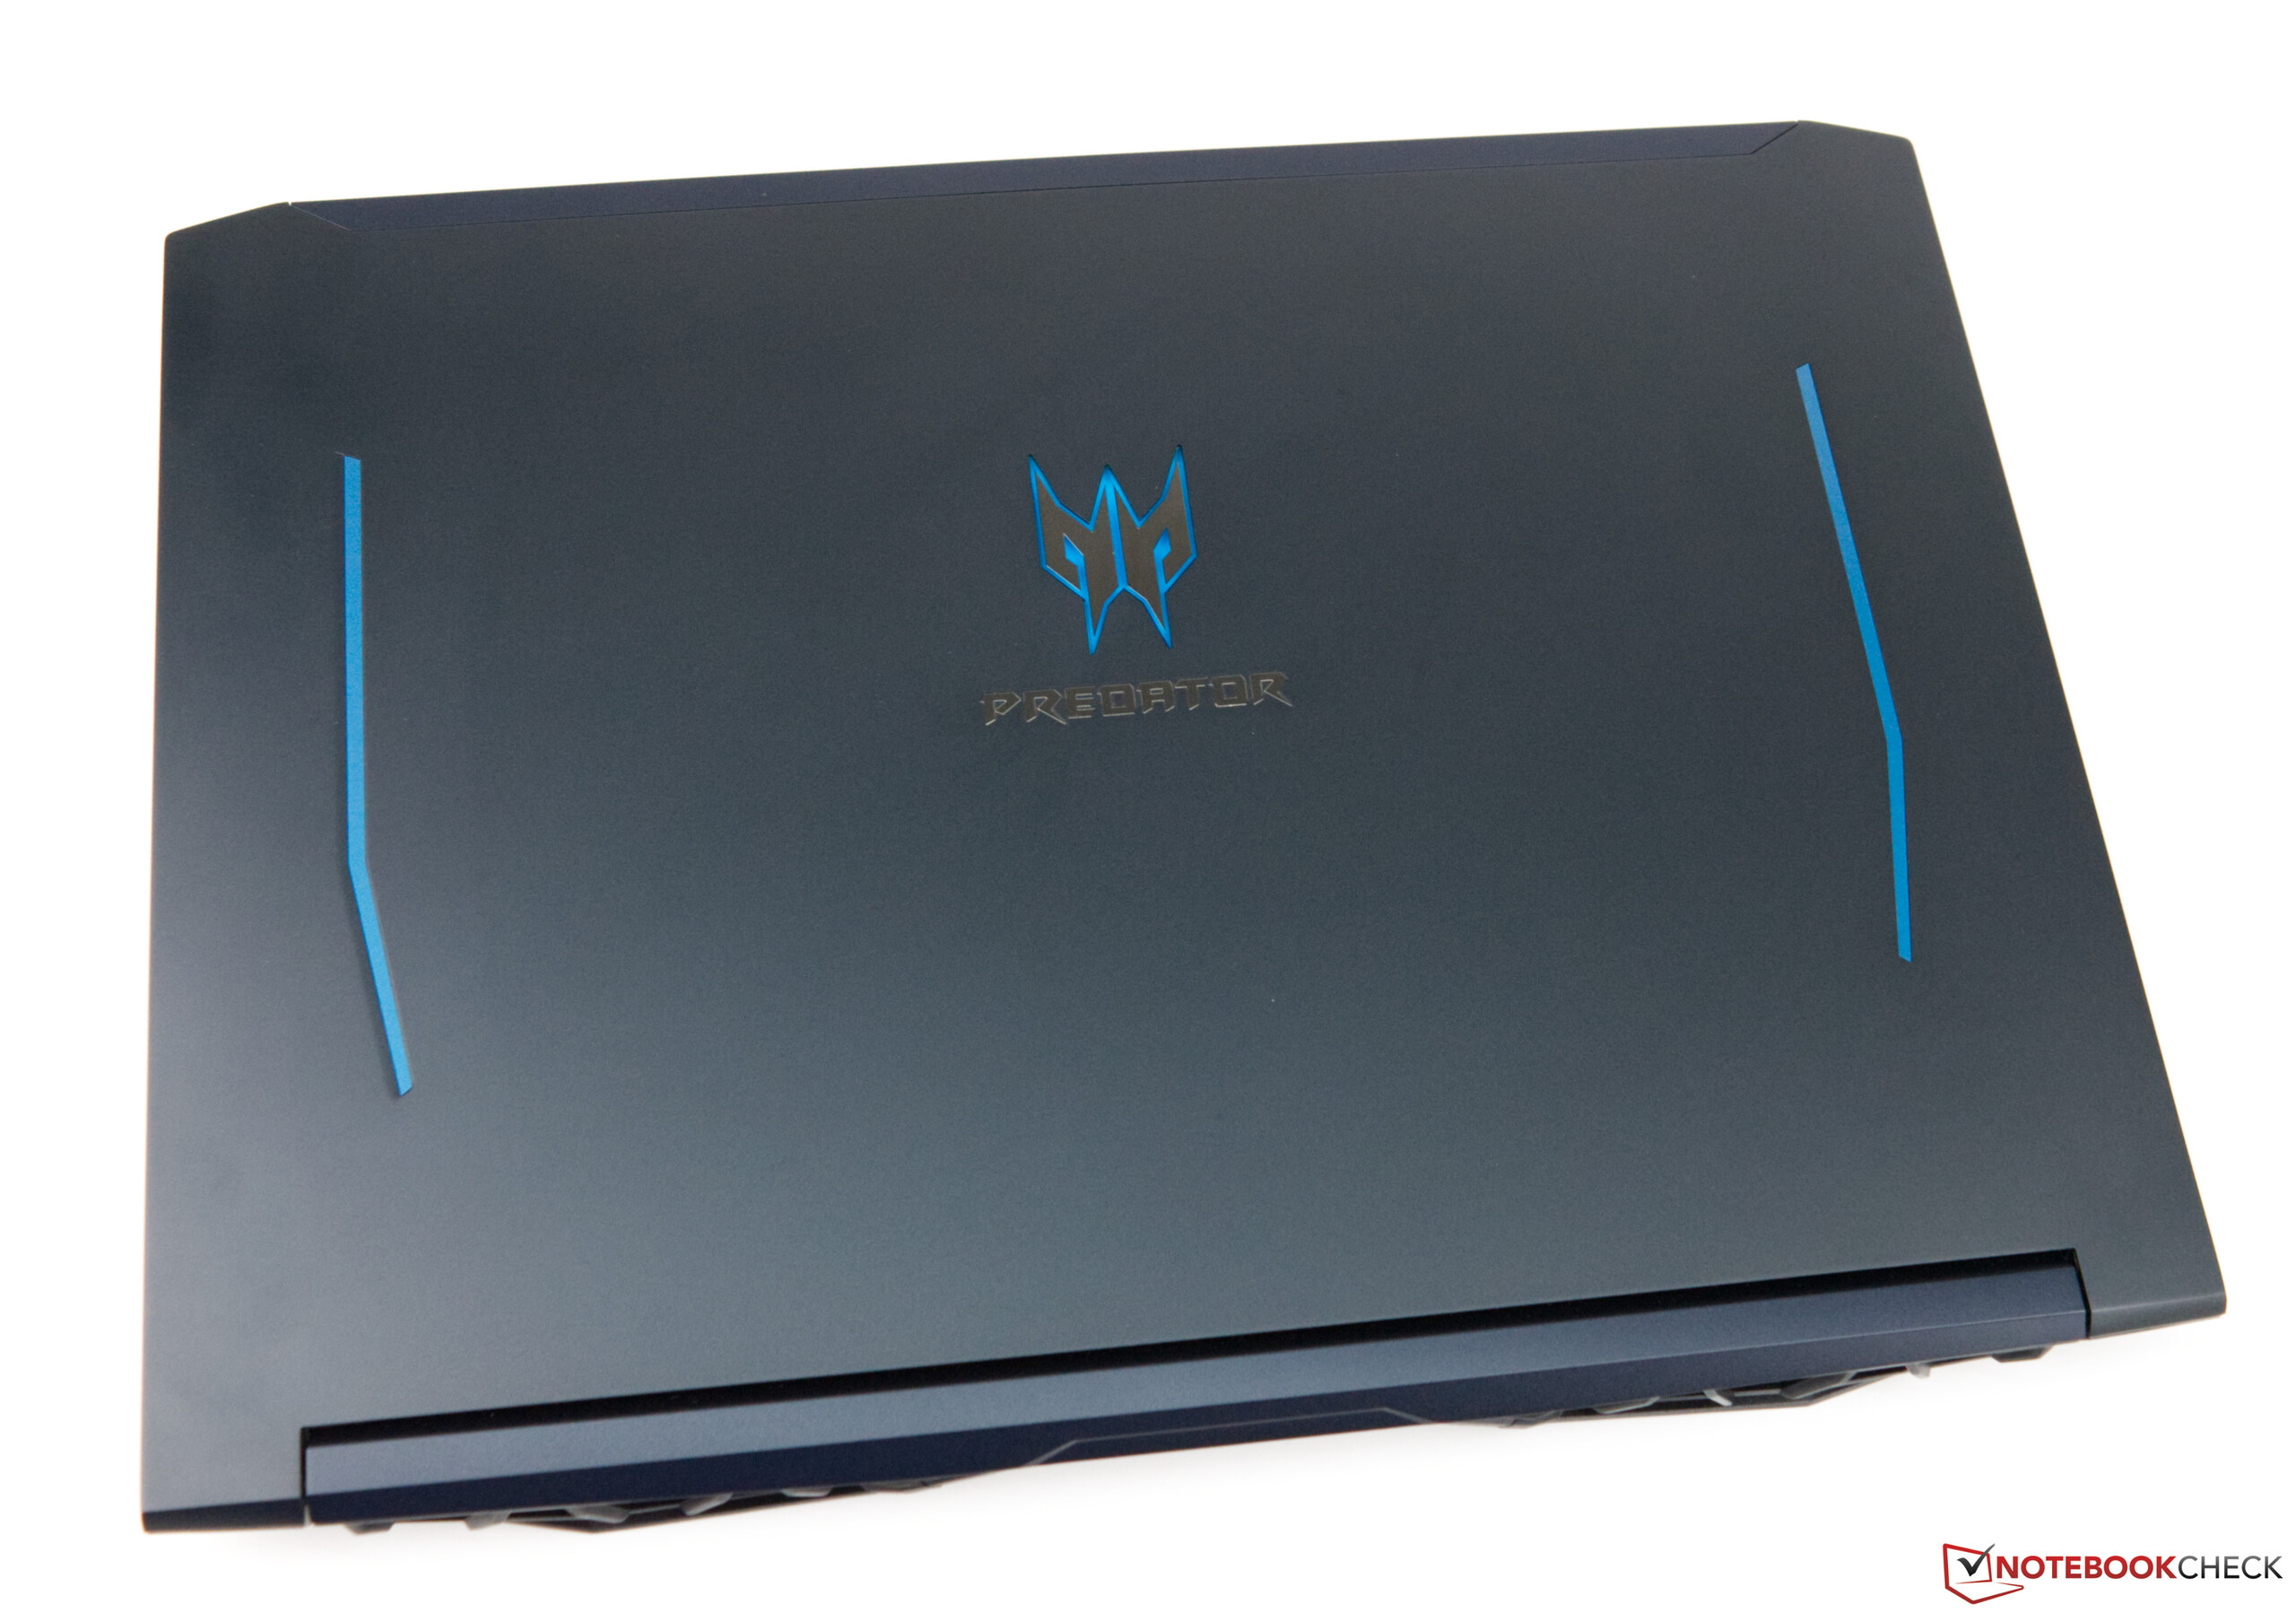
Acer Predator Helios 300 PH315 är en gedigen instegslaptop i ny skrud. En del brister återstår dock.
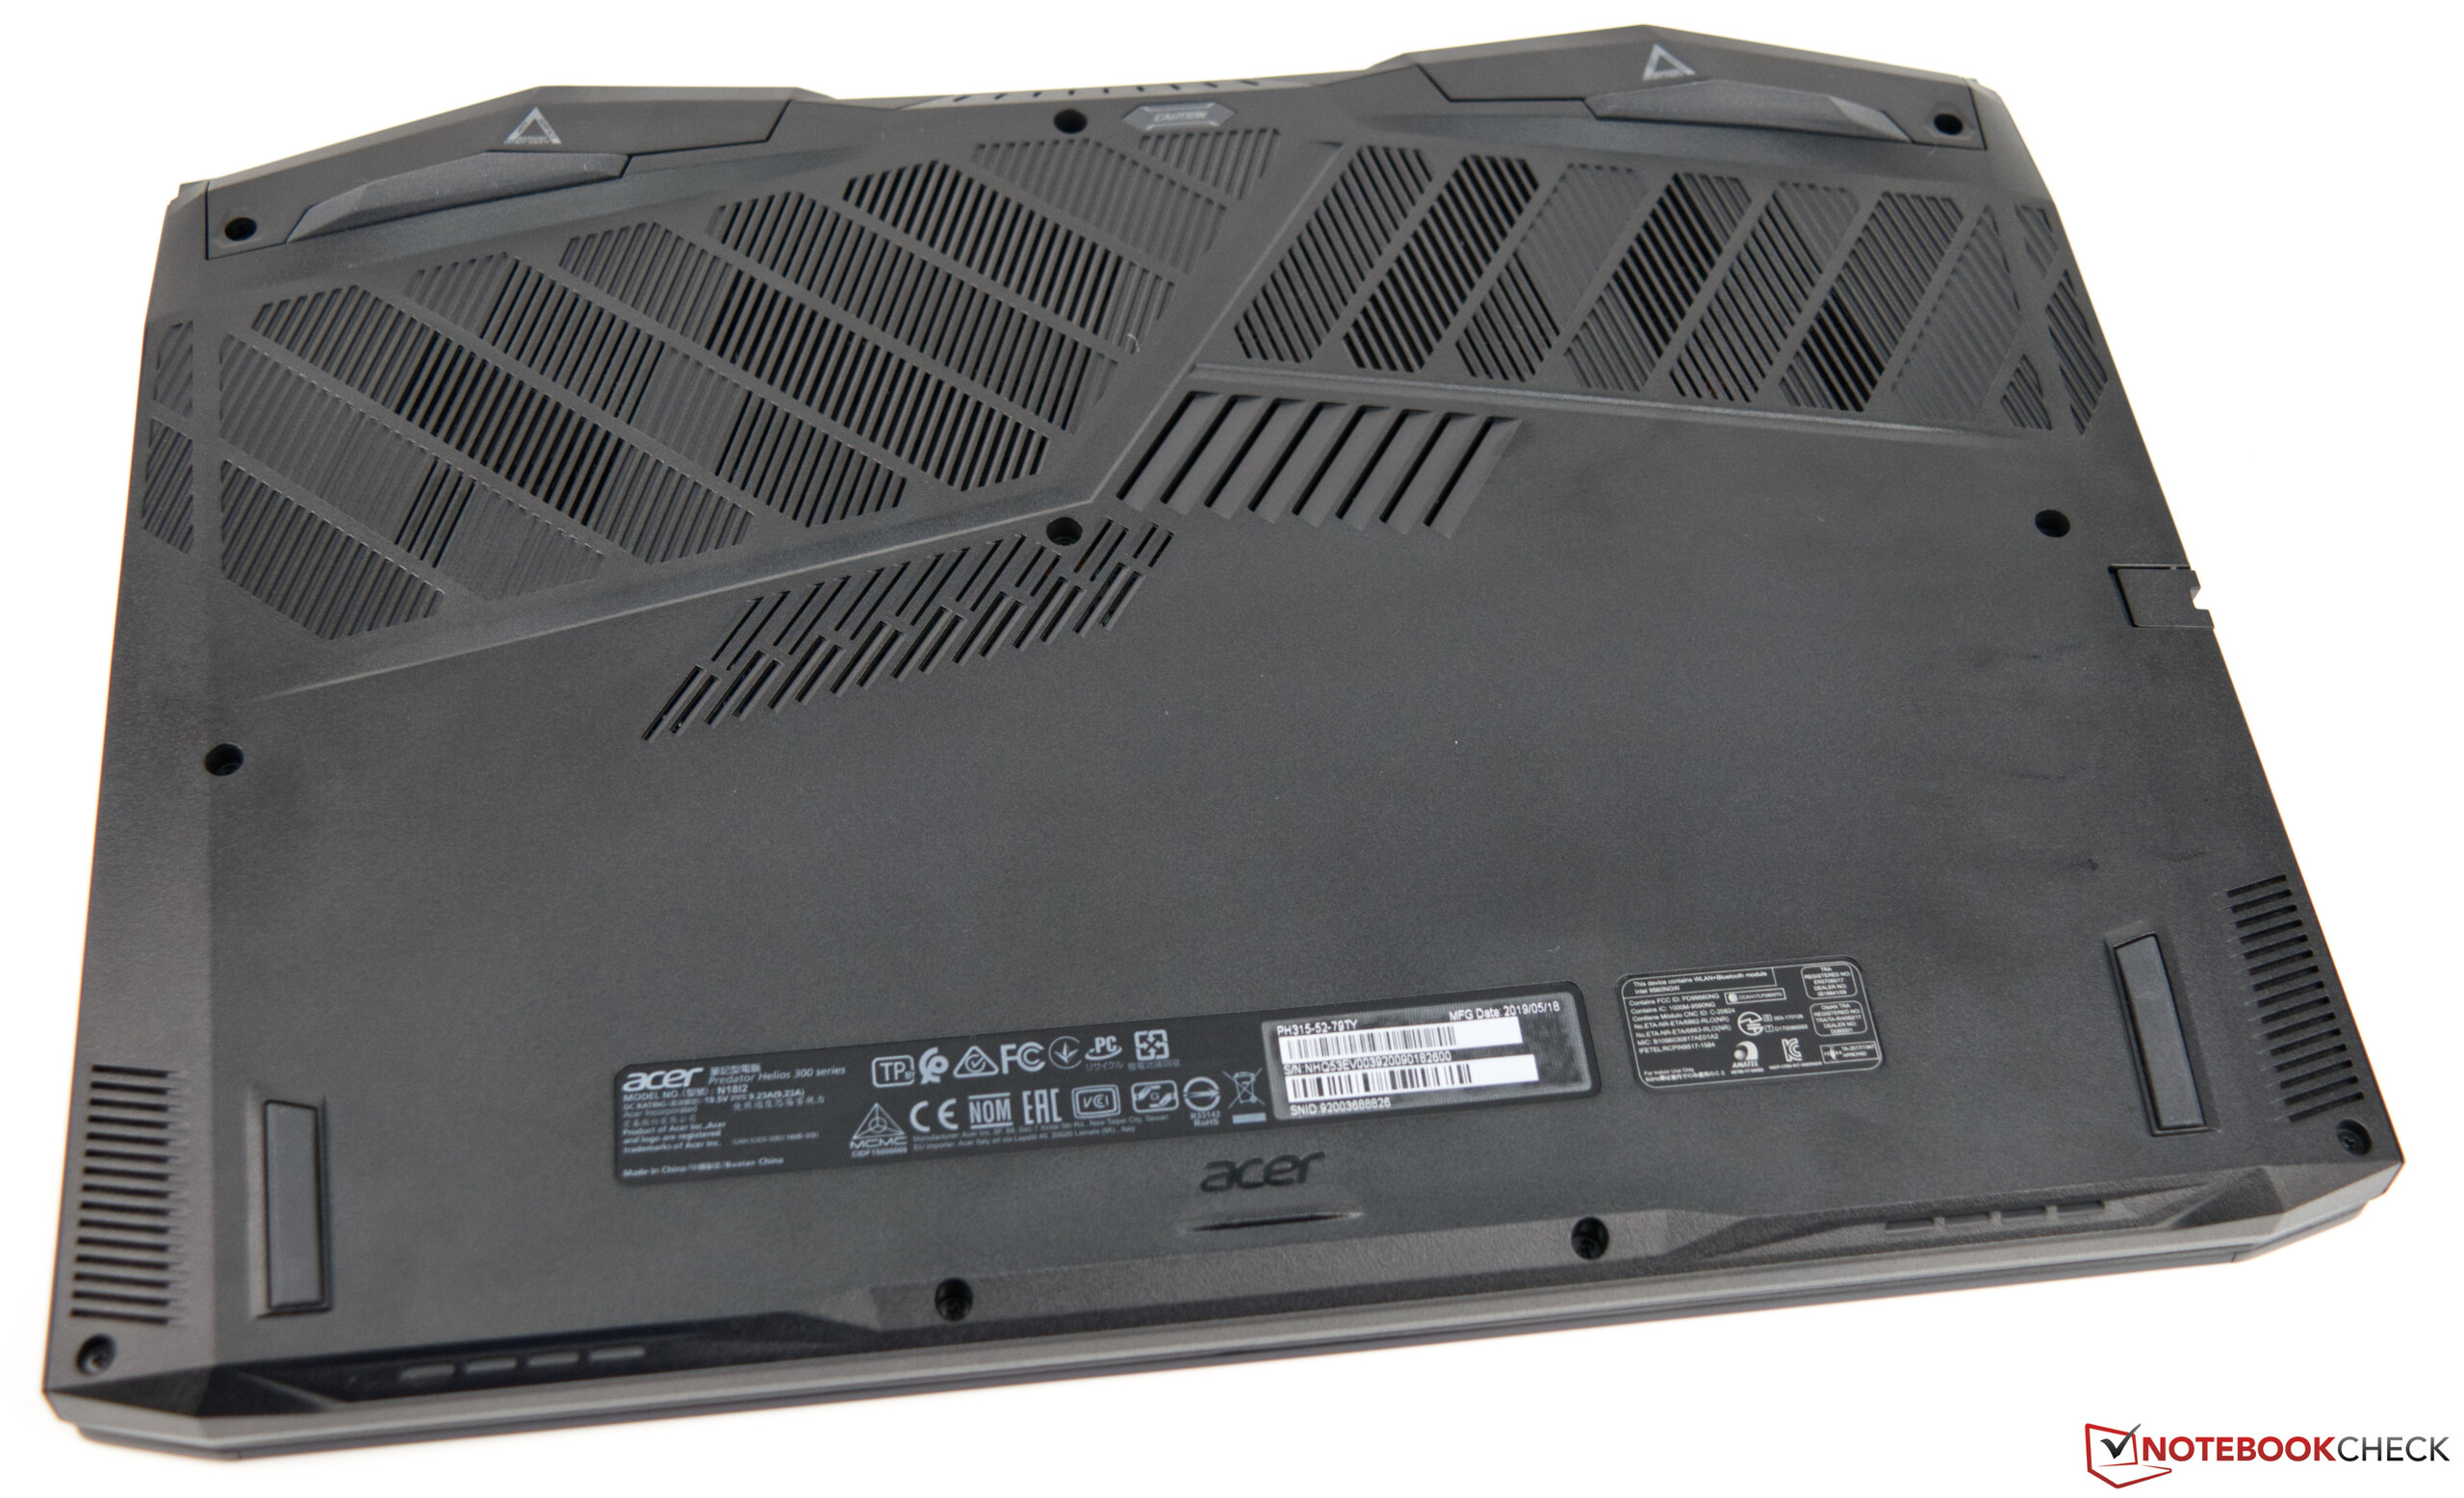
Att sätta in fler enheter är ganska enkelt att göra då enhetsplatserna gömmer sig bakom en bottenplatta som är lätt att ta bort. Även om vi knappt har något att kritisera när det kommer till konstruktionens kvalitet drar Helios 300 PH315 i vårt tycke mer energi än den borde. För att sammanfatta så är detta en skaplig spellaptop även om den har några brister såsom kort batteritid och undermåliga högtalare.
Acer Predator Helios 300 PH315-52-79TY
- 05/15/2020 v7 (old)
Sebastian Bade
Price comparison
