Test: Medion Erazer X6805 (Core i7-8750H, GTX 1060, FHD) Laptop (Sammanfattning)
| SD Card Reader | |
| average JPG Copy Test (av. of 3 runs) | |
| Genomsnitt av klass Gaming (20.9 - 210, n=54, senaste 2 åren) | |
| Acer Nitro 5 AN515-52-74DR (Toshiba Exceria Pro SDXC 64 GB UHS-II) | |
| HP Omen 15-dc0001ng (Toshiba Exceria Pro SDXC 64 GB UHS-II) | |
| Xiaomi Mi Gaming Laptop 7300HQ 1060 (Toshiba Exceria Pro SDXC 64 GB UHS-II) | |
| Dell G7 15-7588 (Toshiba Exceria Pro SDXC 64 GB UHS-II) | |
| Medion Erazer X6805-MD61085 (Toshiba Exceria Pro SDXC 64 GB UHS-II) | |
| maximum AS SSD Seq Read Test (1GB) | |
| Genomsnitt av klass Gaming (25.5 - 261, n=51, senaste 2 åren) | |
| HP Omen 15-dc0001ng (Toshiba Exceria Pro SDXC 64 GB UHS-II) | |
| Acer Nitro 5 AN515-52-74DR (Toshiba Exceria Pro SDXC 64 GB UHS-II) | |
| Dell G7 15-7588 (Toshiba Exceria Pro SDXC 64 GB UHS-II) | |
| Medion Erazer X6805-MD61085 (Toshiba Exceria Pro SDXC 64 GB UHS-II) | |
| Xiaomi Mi Gaming Laptop 7300HQ 1060 (Toshiba Exceria Pro SDXC 64 GB UHS-II) | |
| |||||||||||||||||||||||||
Distribution av ljusstyrkan: 86 %
Mitt på batteriet: 270 cd/m²
Kontrast: 844:1 (Svärta: 0.32 cd/m²)
ΔE ColorChecker Calman: 5.1 | ∀{0.5-29.43 Ø4.71}
calibrated: 3.25
ΔE Greyscale Calman: 4.16 | ∀{0.09-98 Ø4.96}
82% sRGB (Argyll 1.6.3 3D)
54% AdobeRGB 1998 (Argyll 1.6.3 3D)
60.3% AdobeRGB 1998 (Argyll 3D)
82.4% sRGB (Argyll 3D)
63.8% Display P3 (Argyll 3D)
Gamma: 2.53
CCT: 6860 K
| Medion Erazer X6805-MD61085 LG Philips LP156WF6 (LGD046F), IPS, 1920x1080 | Xiaomi Mi Gaming Laptop 7300HQ 1060 BOEhydis NV156FHM-N61 (BOE0747), IPS, 1920x1080 | Dell G7 15-7588 LG Philips LGD053F, IPS, 1920x1080 | Acer Nitro 5 AN515-52-74DR LG Philips LP156WF6-SPK6 (LGD0590), IPS, 1920x1080 | HP Omen 15-dc0001ng BOE07A1, IPS, 1920x1080 | Lenovo Legion Y530-15ICH B156HAN02.1, IPS, 1920x1080 | |
|---|---|---|---|---|---|---|
| Display | 5% | -36% | -33% | -33% | -35% | |
| Display P3 Coverage (%) | 63.8 | 66.6 4% | 37.82 -41% | 39.59 -38% | 39.64 -38% | 38.31 -40% |
| sRGB Coverage (%) | 82.4 | 87.3 6% | 56.2 -32% | 59.5 -28% | 59 -28% | 57.3 -30% |
| AdobeRGB 1998 Coverage (%) | 60.3 | 63.8 6% | 39.2 -35% | 40.92 -32% | 40.95 -32% | 39.58 -34% |
| Response Times | -41% | 4% | 13% | -17% | -13% | |
| Response Time Grey 50% / Grey 80% * (ms) | 38.4 ? | 53.2 ? -39% | 38.8 ? -1% | 38 ? 1% | 47.2 ? -23% | 43.6 ? -14% |
| Response Time Black / White * (ms) | 29.2 ? | 41.6 ? -42% | 26.8 ? 8% | 22 ? 25% | 32.4 ? -11% | 32.4 ? -11% |
| PWM Frequency (Hz) | 20490 ? | 21550 ? | 200 ? | |||
| Screen | 12% | -41% | 4% | -1% | -19% | |
| Brightness middle (cd/m²) | 270 | 283 5% | 250.9 -7% | 252 -7% | 275 2% | 282.8 5% |
| Brightness (cd/m²) | 269 | 269 0% | 246 -9% | 237 -12% | 254 -6% | 264 -2% |
| Brightness Distribution (%) | 86 | 87 1% | 89 3% | 86 0% | 90 5% | 88 2% |
| Black Level * (cd/m²) | 0.32 | 0.23 28% | 0.34 -6% | 0.21 34% | 0.27 16% | 0.42 -31% |
| Contrast (:1) | 844 | 1230 46% | 738 -13% | 1200 42% | 1019 21% | 673 -20% |
| Colorchecker dE 2000 * | 5.1 | 4.68 8% | 7.34 -44% | 4.42 13% | 4.62 9% | 4.93 3% |
| Colorchecker dE 2000 max. * | 9.25 | 8 14% | 28.66 -210% | 7.21 22% | 8.05 13% | 17.65 -91% |
| Colorchecker dE 2000 calibrated * | 3.25 | 2.5 23% | 4.42 -36% | 3.08 5% | 3.59 -10% | 4.07 -25% |
| Greyscale dE 2000 * | 4.16 | 4.32 -4% | 6.8 -63% | 3.74 10% | 4.31 -4% | 3.8 9% |
| Gamma | 2.53 87% | 2.36 93% | 2.164 102% | 2.34 94% | 2.49 88% | 2.449 90% |
| CCT | 6860 95% | 7612 85% | 6780 96% | 7291 89% | 7000 93% | 6112 106% |
| Color Space (Percent of AdobeRGB 1998) (%) | 54 | 57 6% | 36 -33% | 38 -30% | 38 -30% | 36 -33% |
| Color Space (Percent of sRGB) (%) | 82 | 87 6% | 56 -32% | 59 -28% | 59 -28% | 57 -30% |
| Totalt genomsnitt (program/inställningar) | -8% /
4% | -24% /
-34% | -5% /
-1% | -17% /
-9% | -22% /
-21% |
* ... mindre är bättre
Visa svarstider
| ↔ Svarstid svart till vitt | ||
|---|---|---|
| 29.2 ms ... stiga ↗ och falla ↘ kombinerat | ↗ 16.8 ms stiga | 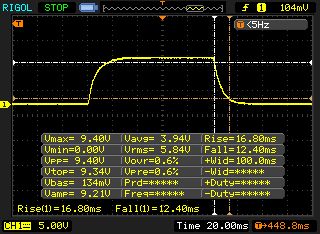 |
| ↘ 12.4 ms hösten | ||
| Skärmen visar relativt långsamma svarsfrekvenser i våra tester och kan vara för långsam för spelare. I jämförelse sträcker sig alla testade enheter från 0.1 (minst) till 240 (maximalt) ms. » 78 % av alla enheter är bättre. Detta innebär att den uppmätta svarstiden är sämre än genomsnittet av alla testade enheter (19.8 ms). | ||
| ↔ Svarstid 50 % grått till 80 % grått | ||
| 38.4 ms ... stiga ↗ och falla ↘ kombinerat | ↗ 18.8 ms stiga | 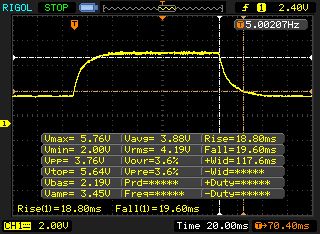 |
| ↘ 19.6 ms hösten | ||
| Skärmen visar långsamma svarsfrekvenser i våra tester och kommer att vara otillfredsställande för spelare. I jämförelse sträcker sig alla testade enheter från 0.165 (minst) till 636 (maximalt) ms. » 58 % av alla enheter är bättre. Detta innebär att den uppmätta svarstiden är sämre än genomsnittet av alla testade enheter (30.9 ms). | ||
Skärmflimmer / PWM (Puls-Width Modulation)
| Skärmflimmer / PWM upptäckt | 20490 Hz | ≤ 99 % ljusstyrka inställning | 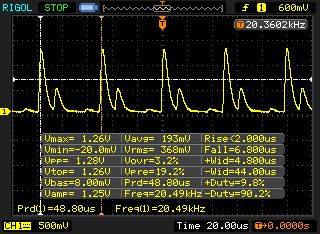 |
Displayens bakgrundsbelysning flimrar vid 20490 Hz (i värsta fall, t.ex. med PWM) Flimrande upptäckt vid en ljusstyrkeinställning på 99 % och lägre. Det ska inte finnas något flimmer eller PWM över denna ljusstyrkeinställning. Frekvensen för 20490 Hz är ganska hög, så de flesta användare som är känsliga för PWM bör inte märka något flimmer. Som jämförelse: 52 % av alla testade enheter använder inte PWM för att dämpa skärmen. Om PWM upptäcktes mättes ett medelvärde av 7744 (minst: 5 - maximum: 343500) Hz. | |||
| PCMark 8 Home Score Accelerated v2 | 4404 poäng | |
| PCMark 8 Work Score Accelerated v2 | 5379 poäng | |
| PCMark 10 Score | 5234 poäng | |
Hjälp | ||
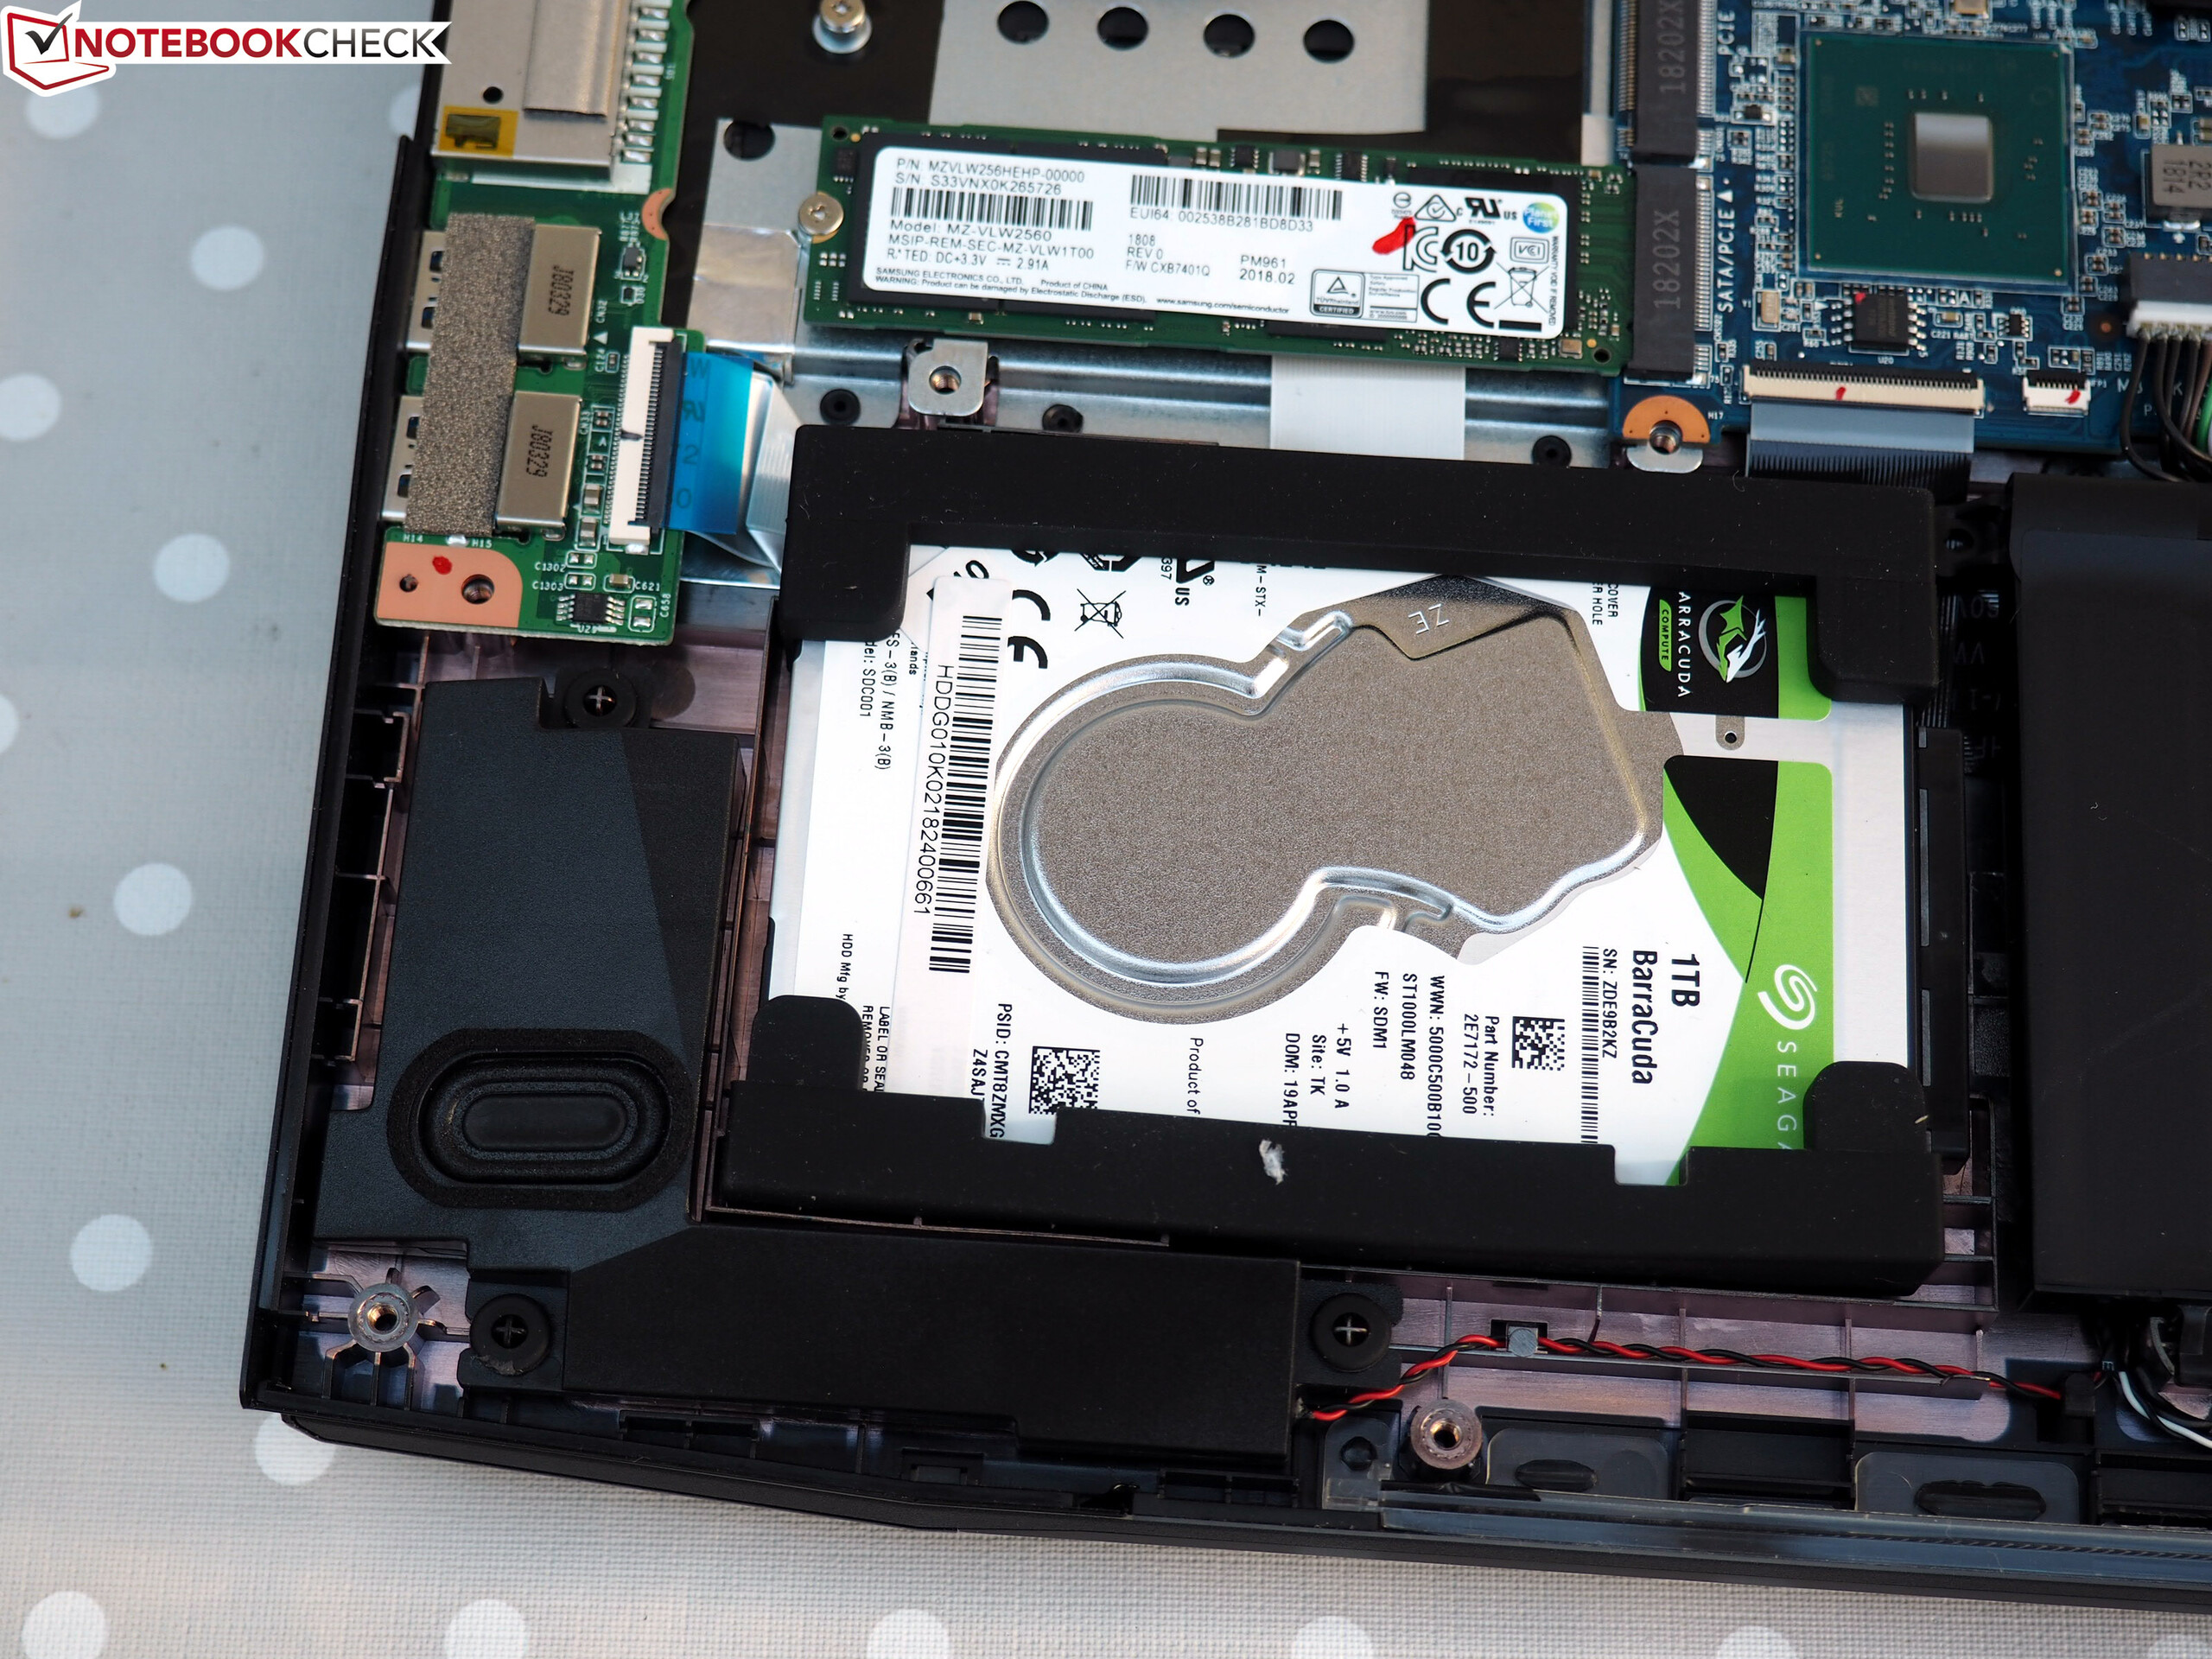
| Medion Erazer X6805-MD61085 Samsung PM961 MZVLW256HEHP | Xiaomi Mi Gaming Laptop 7300HQ 1060 Samsung PM871b MZNLN128HAHQ | Dell G7 15-7588 SK hynix SC311 SATA | Acer Nitro 5 AN515-52-74DR Intel SSD 600p SSDPEKKW512G7 | HP Omen 15-dc0001ng Toshiba KBG30ZMV128G | Lenovo Legion Y530-15ICH Toshiba KBG30ZMT128G | |
|---|---|---|---|---|---|---|
| AS SSD | -51% | -69% | -32% | -56% | -60% | |
| Seq Read (MB/s) | 1653 | 502 -70% | 506 -69% | 1321 -20% | 1238 -25% | 1231 -26% |
| Seq Write (MB/s) | 1262 | 450.1 -64% | 220.3 -83% | 554 -56% | 123.5 -90% | 131.6 -90% |
| 4K Read (MB/s) | 44.29 | 38.11 -14% | 23.66 -47% | 32.38 -27% | 31.48 -29% | 38.71 -13% |
| 4K Write (MB/s) | 100.9 | 104.1 3% | 59.8 -41% | 94.5 -6% | 79.3 -21% | 35.74 -65% |
| Score Read (Points) | 1565 | 343 -78% | 233 -85% | 670 -57% | 343 -78% | 497 -68% |
| Score Write (Points) | 762 | 302 -60% | 181 -76% | 661 -13% | 195 -74% | 128 -83% |
| Score Total (Points) | 3113 | 834 -73% | 528 -83% | 1643 -47% | 670 -78% | 838 -73% |

| 3DMark 11 Performance | 13648 poäng | |
| 3DMark Cloud Gate Standard Score | 33333 poäng | |
| 3DMark Fire Strike Score | 10351 poäng | |
Hjälp | ||
| The Witcher 3 | |
| 1920x1080 Ultra Graphics & Postprocessing (HBAO+) | |
| Genomsnitt av klass Gaming (104.7 - 240, n=7, senaste 2 åren) | |
| Xiaomi Mi Gaming Laptop 7300HQ 1060 | |
| Medion Erazer X6805-MD61085 | |
| Lenovo Legion Y530-15ICH | |
| Dell G7 15-7588 | |
| Acer Nitro 5 AN515-52-74DR | |
| HP Omen 15-dc0001ng | |
| 1920x1080 High Graphics & Postprocessing (Nvidia HairWorks Off) | |
| Genomsnitt av klass Gaming (341 - 404, n=2, senaste 2 åren) | |
| Xiaomi Mi Gaming Laptop 7300HQ 1060 | |
| Medion Erazer X6805-MD61085 | |
| Dell G7 15-7588 | |
| Acer Nitro 5 AN515-52-74DR | |
| HP Omen 15-dc0001ng | |
| låg | med. | hög | ultra | |
|---|---|---|---|---|
| The Witcher 3 (2015) | 72.1 | 39.5 | ||
| Destiny 2 (2017) | 93.8 | 81.3 | ||
| Wolfenstein II: The New Colossus (2017) | 85.2 | 78.7 | ||
| Call of Duty WWII (2017) | 94.5 | 68.2 | ||
| The Crew 2 (2018) | 60 | 59.9 | ||
| Monster Hunter World (2018) | 56.5 | 44.9 | ||
| F1 2018 (2018) | 97 | 60 | ||
| Shadow of the Tomb Raider (2018) | 56 | 49 |
Ljudnivå
| Låg belastning |
| 29 / 32 / 35 dB(A) |
| Hårddisk |
| 32 dB(A) |
| Hög belastning |
| 45 / 56 dB(A) |
 | ||
30 dB tyst 40 dB(A) hörbar 50 dB(A) högt ljud |
||
min: | ||
| Medion Erazer X6805-MD61085 GeForce GTX 1060 Mobile, i7-8750H | Xiaomi Mi Gaming Laptop 7300HQ 1060 GeForce GTX 1060 Mobile, i5-7300HQ | Dell G7 15-7588 GeForce GTX 1060 Max-Q, i7-8750H | Acer Nitro 5 AN515-52-74DR GeForce GTX 1050 Ti Mobile, i7-8750H | HP Omen 15-dc0001ng GeForce GTX 1050 Ti Mobile, i5-8300H | Lenovo Legion Y530-15ICH GeForce GTX 1050 Ti Mobile, i5-8300H | Genomsnitt av klass Gaming | |
|---|---|---|---|---|---|---|---|
| Noise | -3% | 6% | 3% | -1% | 12% | 10% | |
| av / miljö * (dB) | 29 | 30 -3% | 28.1 3% | 30 -3% | 29 -0% | 28 3% | 24.1 ? 17% |
| Idle Minimum * (dB) | 29 | 30 -3% | 29 -0% | 30 -3% | 29 -0% | 28 3% | 25.9 ? 11% |
| Idle Average * (dB) | 32 | 34 -6% | 29 9% | 32 -0% | 33 -3% | 28 12% | 27.4 ? 14% |
| Idle Maximum * (dB) | 35 | 38 -9% | 29.2 17% | 33 6% | 41 -17% | 28.5 19% | 30.1 ? 14% |
| Load Average * (dB) | 45 | 44 2% | 40.6 10% | 42 7% | 44 2% | 34.9 22% | 43.7 ? 3% |
| Witcher 3 ultra * (dB) | 47 | 50 -6% | 49.8 -6% | 46 2% | 47 -0% | 40 15% | |
| Load Maximum * (dB) | 56 | 55 2% | 49.8 11% | 49 12% | 49 12% | 49.6 11% | 54.3 ? 3% |
* ... mindre är bättre
(±) Den maximala temperaturen på ovansidan är 43 °C / 109 F, jämfört med genomsnittet av 40.4 °C / 105 F , allt från 21.2 till 68.8 °C för klassen Gaming.
(-) Botten värms upp till maximalt 55 °C / 131 F, jämfört med genomsnittet av 43.2 °C / 110 F
(+) Vid tomgångsbruk är medeltemperaturen för ovansidan 26 °C / 79 F, jämfört med enhetsgenomsnittet på 33.9 °C / ### class_avg_f### F.
(±) När du spelar The Witcher 3 är medeltemperaturen för ovansidan 37.1 °C / 99 F, jämfört med enhetsgenomsnittet på 33.9 °C / ## #class_avg_f### F.
(+) Handledsstöden och pekplattan når maximal hudtemperatur (32 °C / 89.6 F) och är därför inte varma.
(-) Medeltemperaturen för handledsstödsområdet på liknande enheter var 28.8 °C / 83.8 F (-3.2 °C / -5.8 F).
| Medion Erazer X6805-MD61085 GeForce GTX 1060 Mobile, i7-8750H | Xiaomi Mi Gaming Laptop 7300HQ 1060 GeForce GTX 1060 Mobile, i5-7300HQ | Dell G7 15-7588 GeForce GTX 1060 Max-Q, i7-8750H | Acer Nitro 5 AN515-52-74DR GeForce GTX 1050 Ti Mobile, i7-8750H | HP Omen 15-dc0001ng GeForce GTX 1050 Ti Mobile, i5-8300H | Lenovo Legion Y530-15ICH GeForce GTX 1050 Ti Mobile, i5-8300H | Genomsnitt av klass Gaming | |
|---|---|---|---|---|---|---|---|
| Heat | -6% | 5% | -14% | -17% | -10% | -4% | |
| Maximum Upper Side * (°C) | 43 | 46 -7% | 48.6 -13% | 52 -21% | 51 -19% | 42.8 -0% | 45.1 ? -5% |
| Maximum Bottom * (°C) | 55 | 52 5% | 51.4 7% | 55 -0% | 58 -5% | 52 5% | 48.1 ? 13% |
| Idle Upper Side * (°C) | 28 | 32 -14% | 24 14% | 36 -29% | 35 -25% | 32 -14% | 31 ? -11% |
| Idle Bottom * (°C) | 30 | 32 -7% | 26.8 11% | 32 -7% | 35 -17% | 39.4 -31% | 34.2 ? -14% |
* ... mindre är bättre
Medion Erazer X6805-MD61085 ljudanalys
(+) | högtalare kan spela relativt högt (82 dB)
Bas 100 - 315 Hz
(±) | reducerad bas - i genomsnitt 11.2% lägre än medianen
(±) | linjäriteten för basen är genomsnittlig (9.6% delta till föregående frekvens)
Mellan 400 - 2000 Hz
(+) | balanserad mellan - endast 4.9% från medianen
(±) | linjäriteten för mids är genomsnittlig (8.2% delta till föregående frekvens)
Högsta 2 - 16 kHz
(+) | balanserade toppar - endast 2.9% från medianen
(±) | linjäriteten för toppar är genomsnittlig (7.8% delta till föregående frekvens)
Totalt 100 - 16 000 Hz
(+) | det totala ljudet är linjärt (13.5% skillnad mot median)
Jämfört med samma klass
» 20% av alla testade enheter i den här klassen var bättre, 7% liknande, 73% sämre
» Den bästa hade ett delta på 6%, genomsnittet var 18%, sämst var 132%
Jämfört med alla testade enheter
» 14% av alla testade enheter var bättre, 4% liknande, 82% sämre
» Den bästa hade ett delta på 4%, genomsnittet var 23%, sämst var 134%
Xiaomi Mi Gaming Laptop 7300HQ 1060 ljudanalys
(+) | högtalare kan spela relativt högt (88 dB)
Bas 100 - 315 Hz
(±) | reducerad bas - i genomsnitt 13.5% lägre än medianen
(±) | linjäriteten för basen är genomsnittlig (8.5% delta till föregående frekvens)
Mellan 400 - 2000 Hz
(+) | balanserad mellan - endast 4.6% från medianen
(+) | mids är linjära (5% delta till föregående frekvens)
Högsta 2 - 16 kHz
(+) | balanserade toppar - endast 2.6% från medianen
(+) | toppar är linjära (4.4% delta till föregående frekvens)
Totalt 100 - 16 000 Hz
(+) | det totala ljudet är linjärt (13.2% skillnad mot median)
Jämfört med samma klass
» 19% av alla testade enheter i den här klassen var bättre, 4% liknande, 77% sämre
» Den bästa hade ett delta på 6%, genomsnittet var 18%, sämst var 132%
Jämfört med alla testade enheter
» 14% av alla testade enheter var bättre, 3% liknande, 84% sämre
» Den bästa hade ett delta på 4%, genomsnittet var 23%, sämst var 134%
| Av/Standby | |
| Låg belastning | |
| Hög belastning |
|
Förklaring:
min: | |
| Medion Erazer X6805-MD61085 GeForce GTX 1060 Mobile, i7-8750H | Xiaomi Mi Gaming Laptop 7300HQ 1060 GeForce GTX 1060 Mobile, i5-7300HQ | Dell G7 15-7588 GeForce GTX 1060 Max-Q, i7-8750H | Acer Nitro 5 AN515-52-74DR GeForce GTX 1050 Ti Mobile, i7-8750H | HP Omen 15-dc0001ng GeForce GTX 1050 Ti Mobile, i5-8300H | Lenovo Legion Y530-15ICH GeForce GTX 1050 Ti Mobile, i5-8300H | Genomsnitt av klass Gaming | |
|---|---|---|---|---|---|---|---|
| Power Consumption | 13% | 29% | 33% | 6% | 27% | -30% | |
| Idle Minimum * (Watt) | 10 | 10 -0% | 5.5 45% | 5 50% | 12 -20% | 4.5 55% | 13.1 ? -31% |
| Idle Average * (Watt) | 13 | 13 -0% | 7.6 42% | 7 46% | 14 -8% | 10 23% | 19 ? -46% |
| Idle Maximum * (Watt) | 21 | 19 10% | 9 57% | 11 48% | 18 14% | 13.8 34% | 24.6 ? -17% |
| Load Average * (Watt) | 101 | 68 33% | 94 7% | 91 10% | 92 9% | 92.5 8% | 111.3 ? -10% |
| Witcher 3 ultra * (Watt) | 126 | 110 13% | 116.3 8% | 97 23% | 100 21% | 108.1 14% | |
| Load Maximum * (Watt) | 176 | 136 23% | 154.4 12% | 137 22% | 142 19% | 123.2 30% | 260 ? -48% |
* ... mindre är bättre
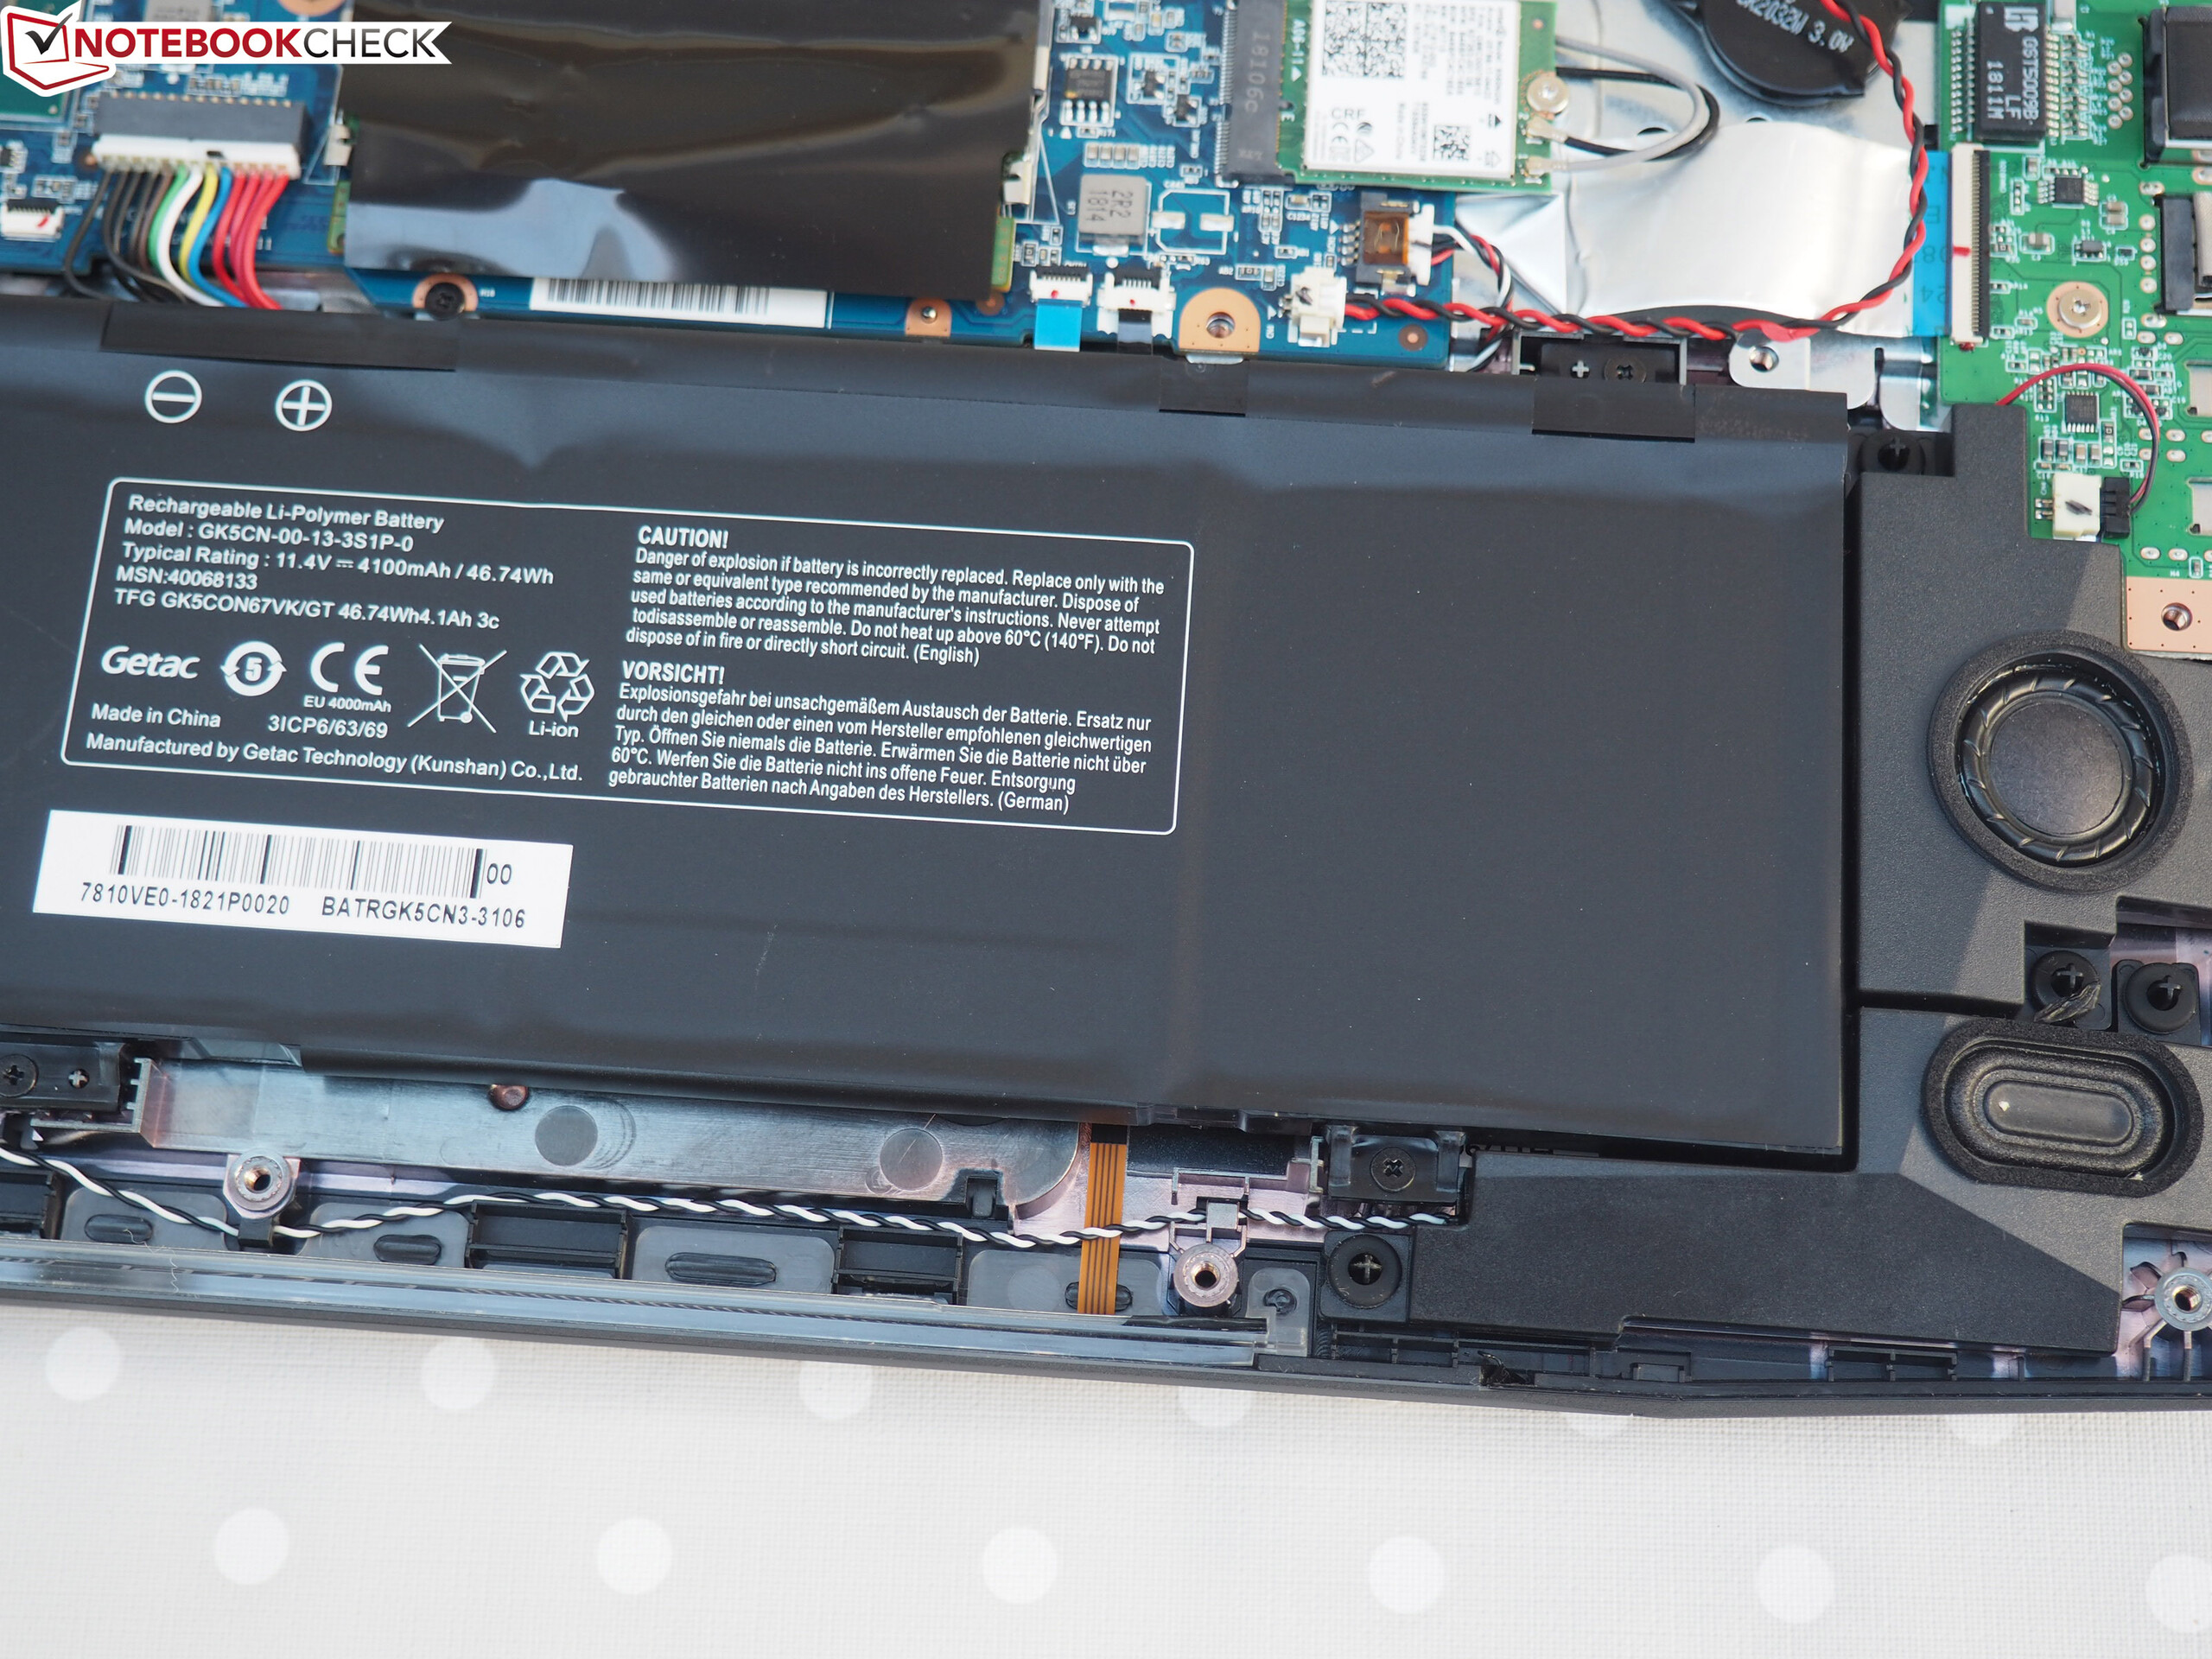
| Medion Erazer X6805-MD61085 GeForce GTX 1060 Mobile, i7-8750H, 46.7 Wh | Xiaomi Mi Gaming Laptop 7300HQ 1060 GeForce GTX 1060 Mobile, i5-7300HQ, 55 Wh | Dell G7 15-7588 GeForce GTX 1060 Max-Q, i7-8750H, 56 Wh | Acer Nitro 5 AN515-52-74DR GeForce GTX 1050 Ti Mobile, i7-8750H, 48 Wh | HP Omen 15-dc0001ng GeForce GTX 1050 Ti Mobile, i5-8300H, 70 Wh | Lenovo Legion Y530-15ICH GeForce GTX 1050 Ti Mobile, i5-8300H, 52.5 Wh | Genomsnitt av klass Gaming | |
|---|---|---|---|---|---|---|---|
| Batteridrifttid | -14% | 45% | 33% | 43% | -9% | 15% | |
| Reader / Idle (h) | 8.4 | 6.4 -24% | 10.9 30% | 12.5 49% | 10.4 24% | 7.84 ? -7% | |
| WiFi v1.3 (h) | 4.5 | 4.6 2% | 7.5 67% | 7 56% | 8.6 91% | 4.1 -9% | 7.08 ? 57% |
| Load (h) | 1.6 | 1.3 -19% | 2.2 38% | 1.5 -6% | 1.8 13% | 1.496 ? -6% | |
| H.264 (h) | 4.4 | 7.1 | 8.4 | 8.27 ? |
För
Emot
Läs den fullständiga versionen av den här recensionen på engelska här.
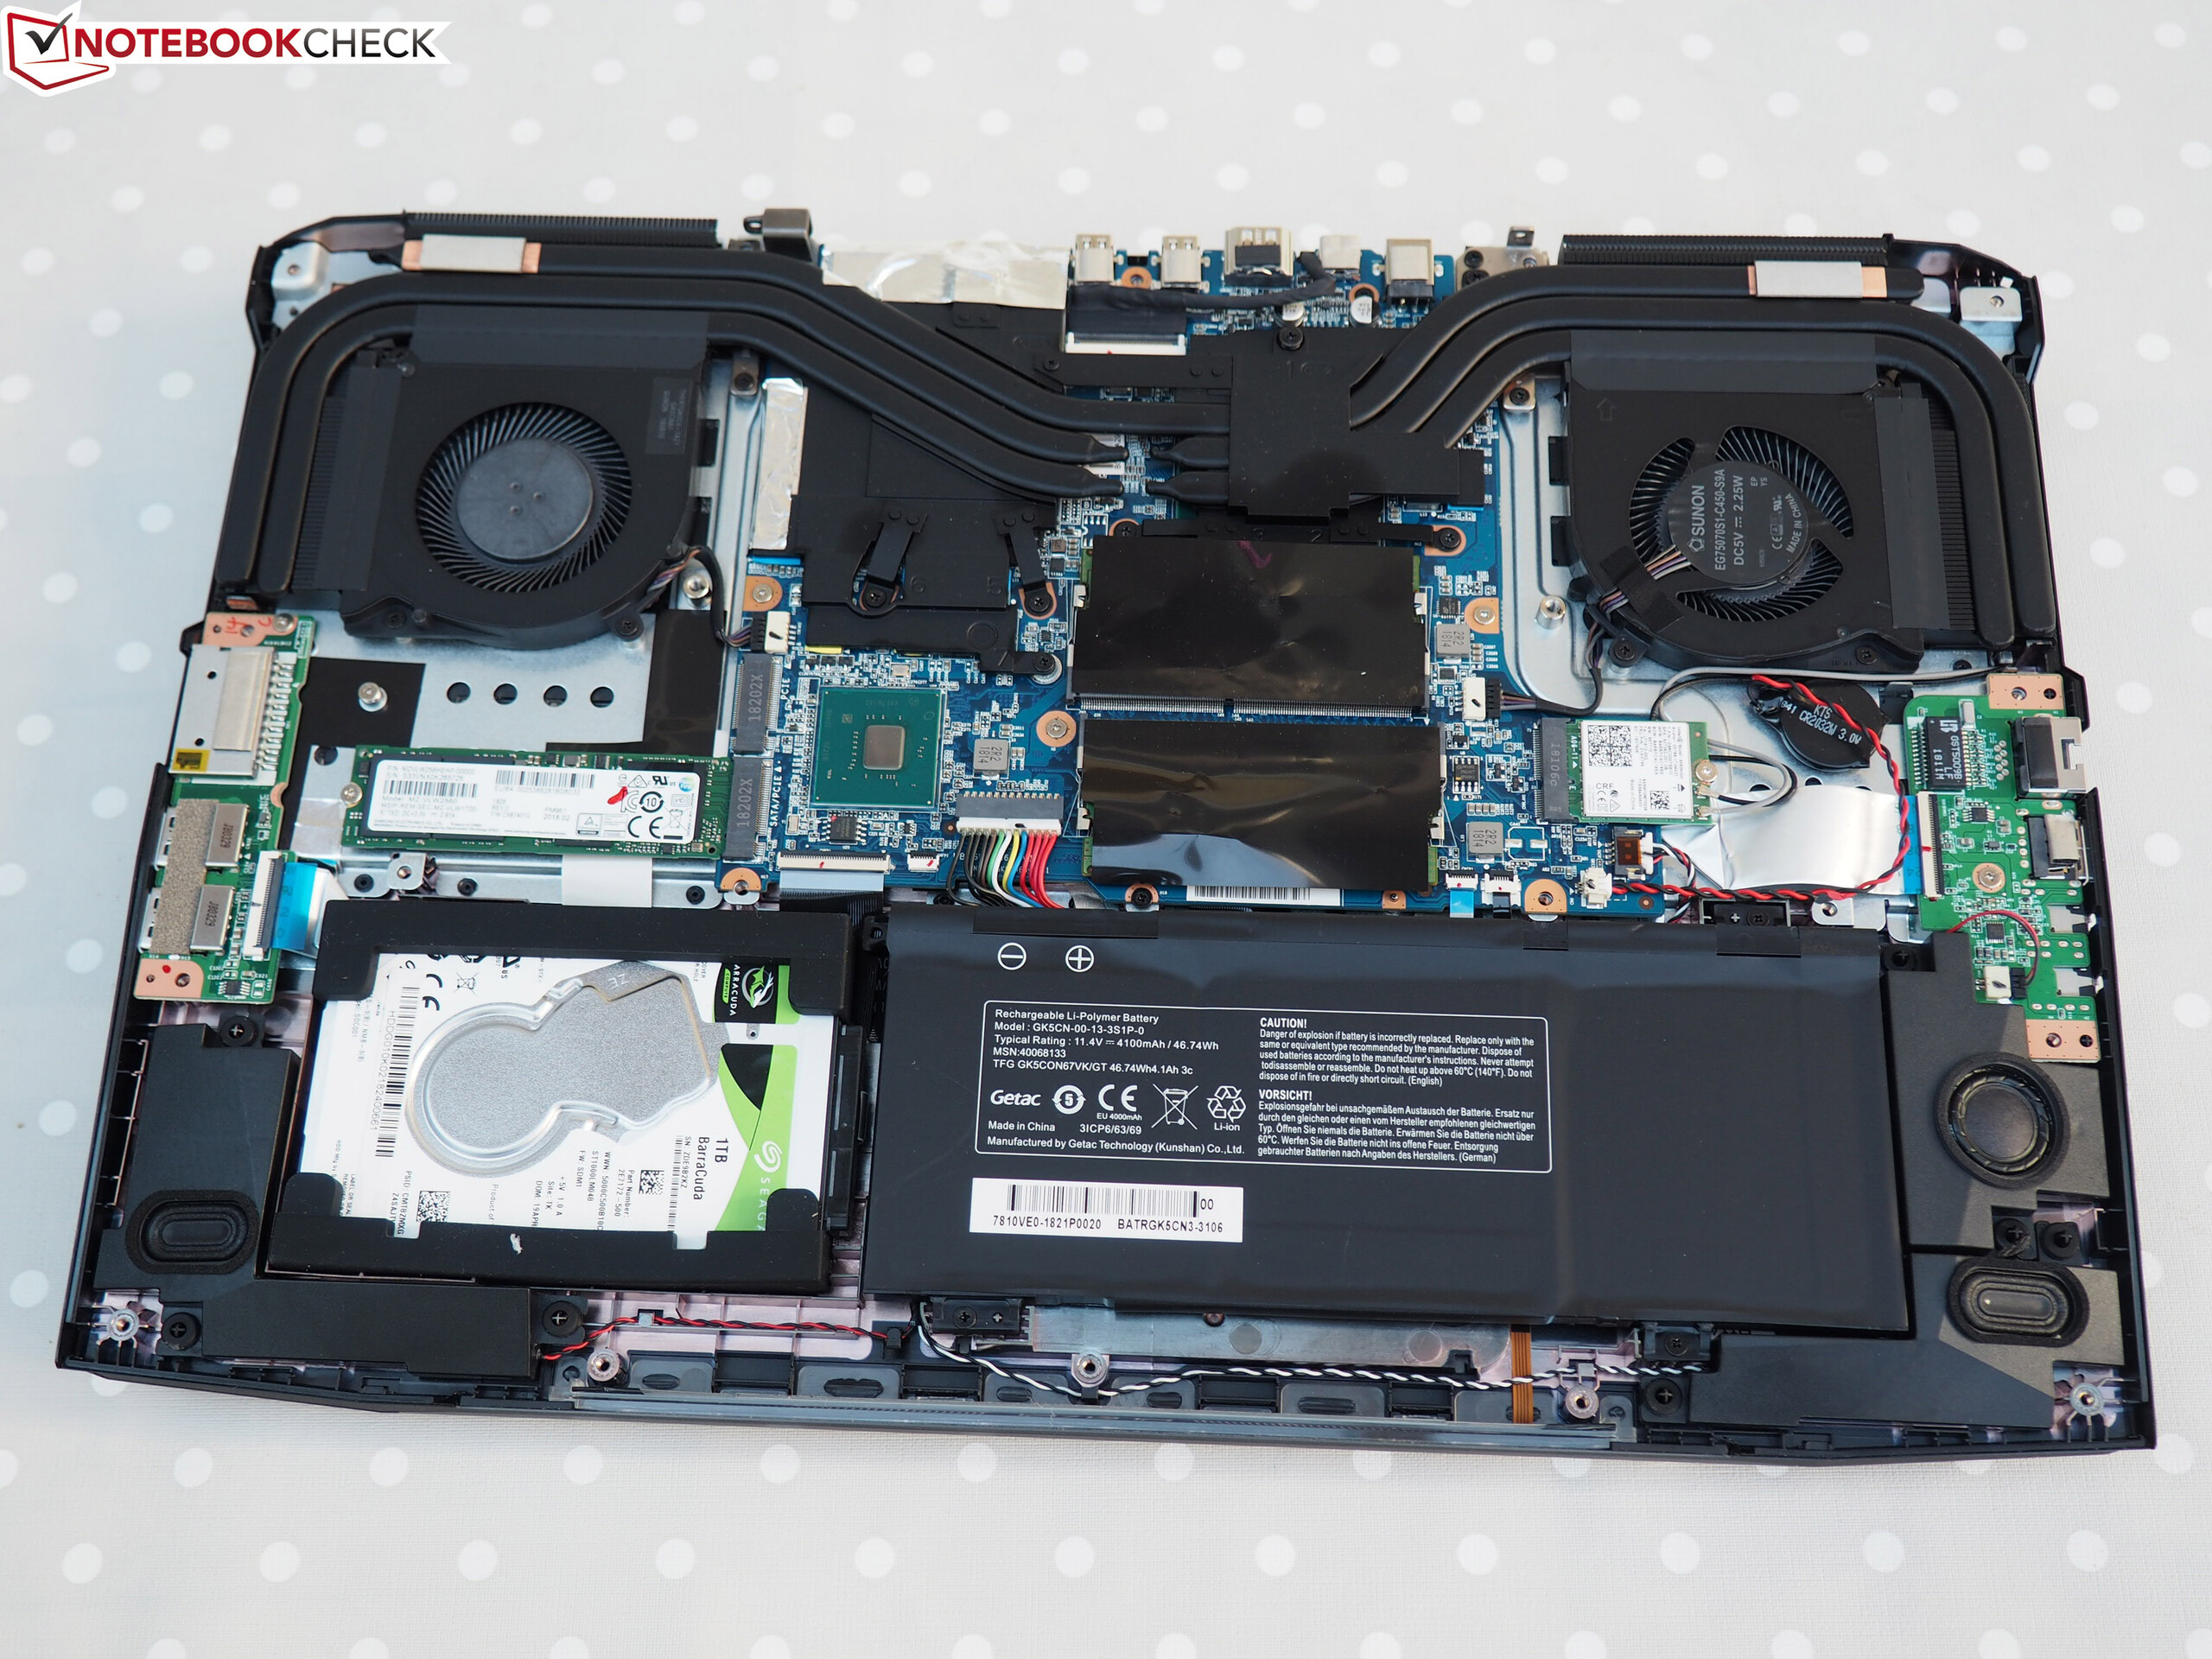
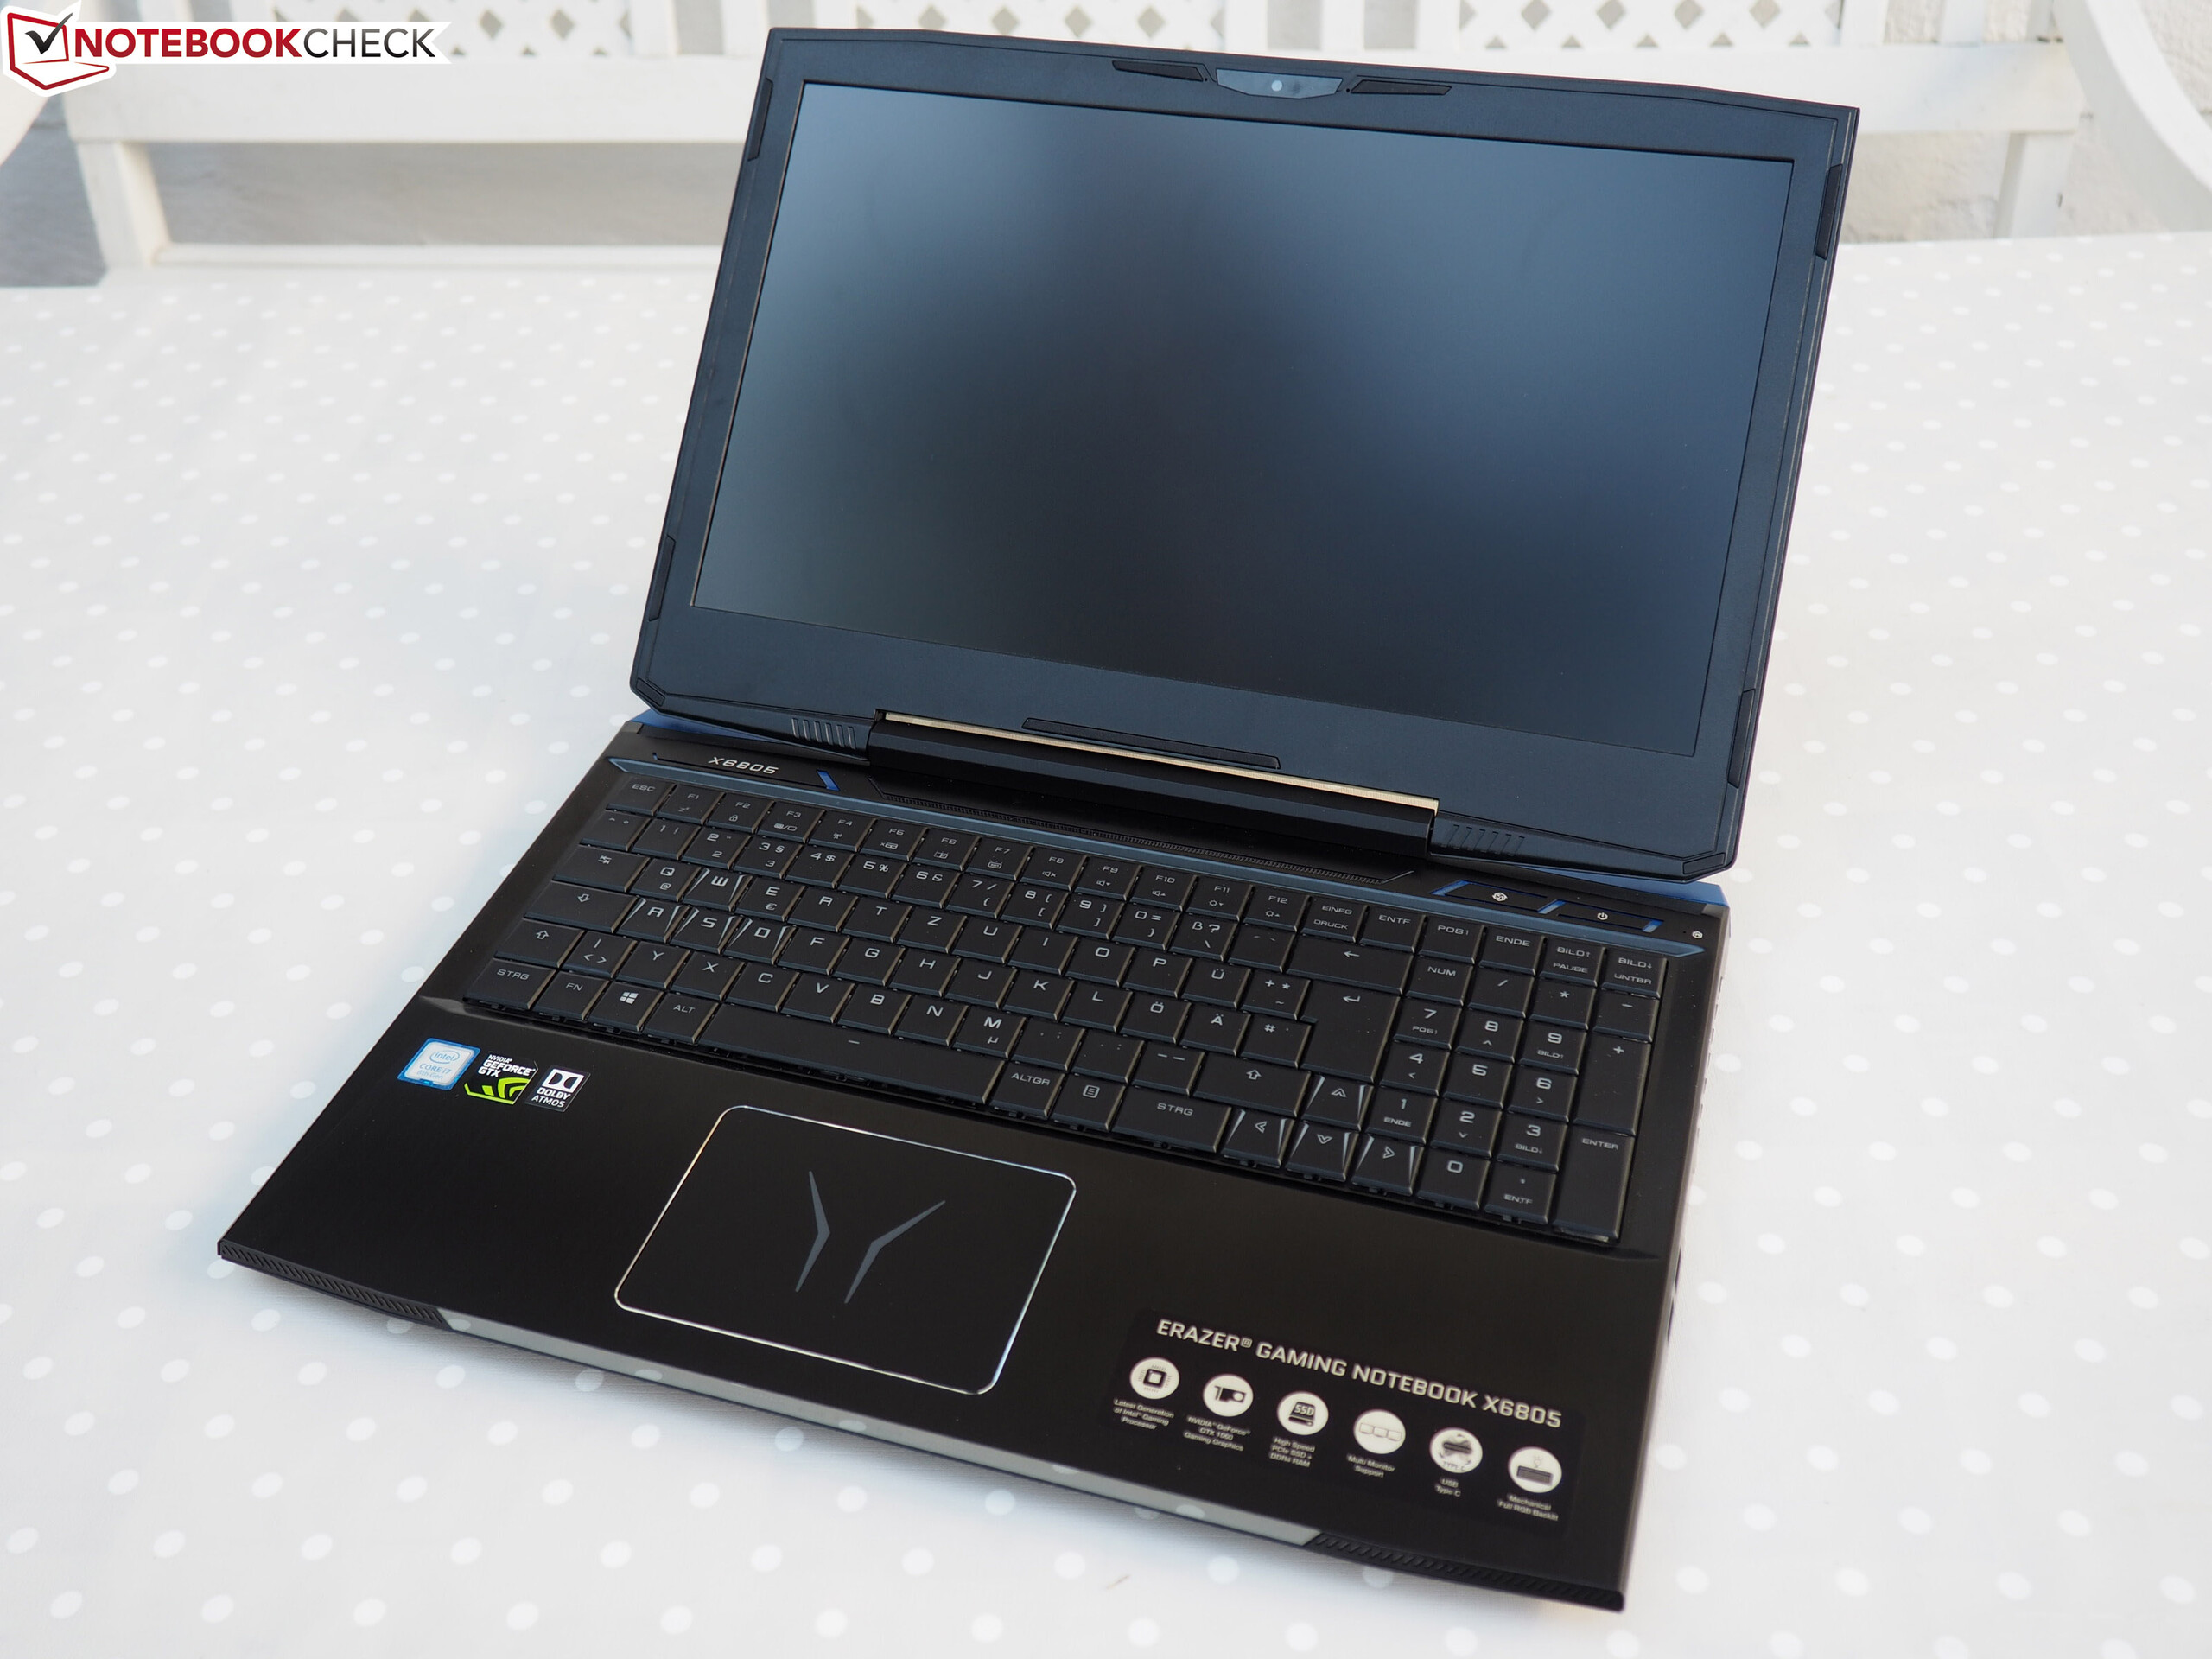
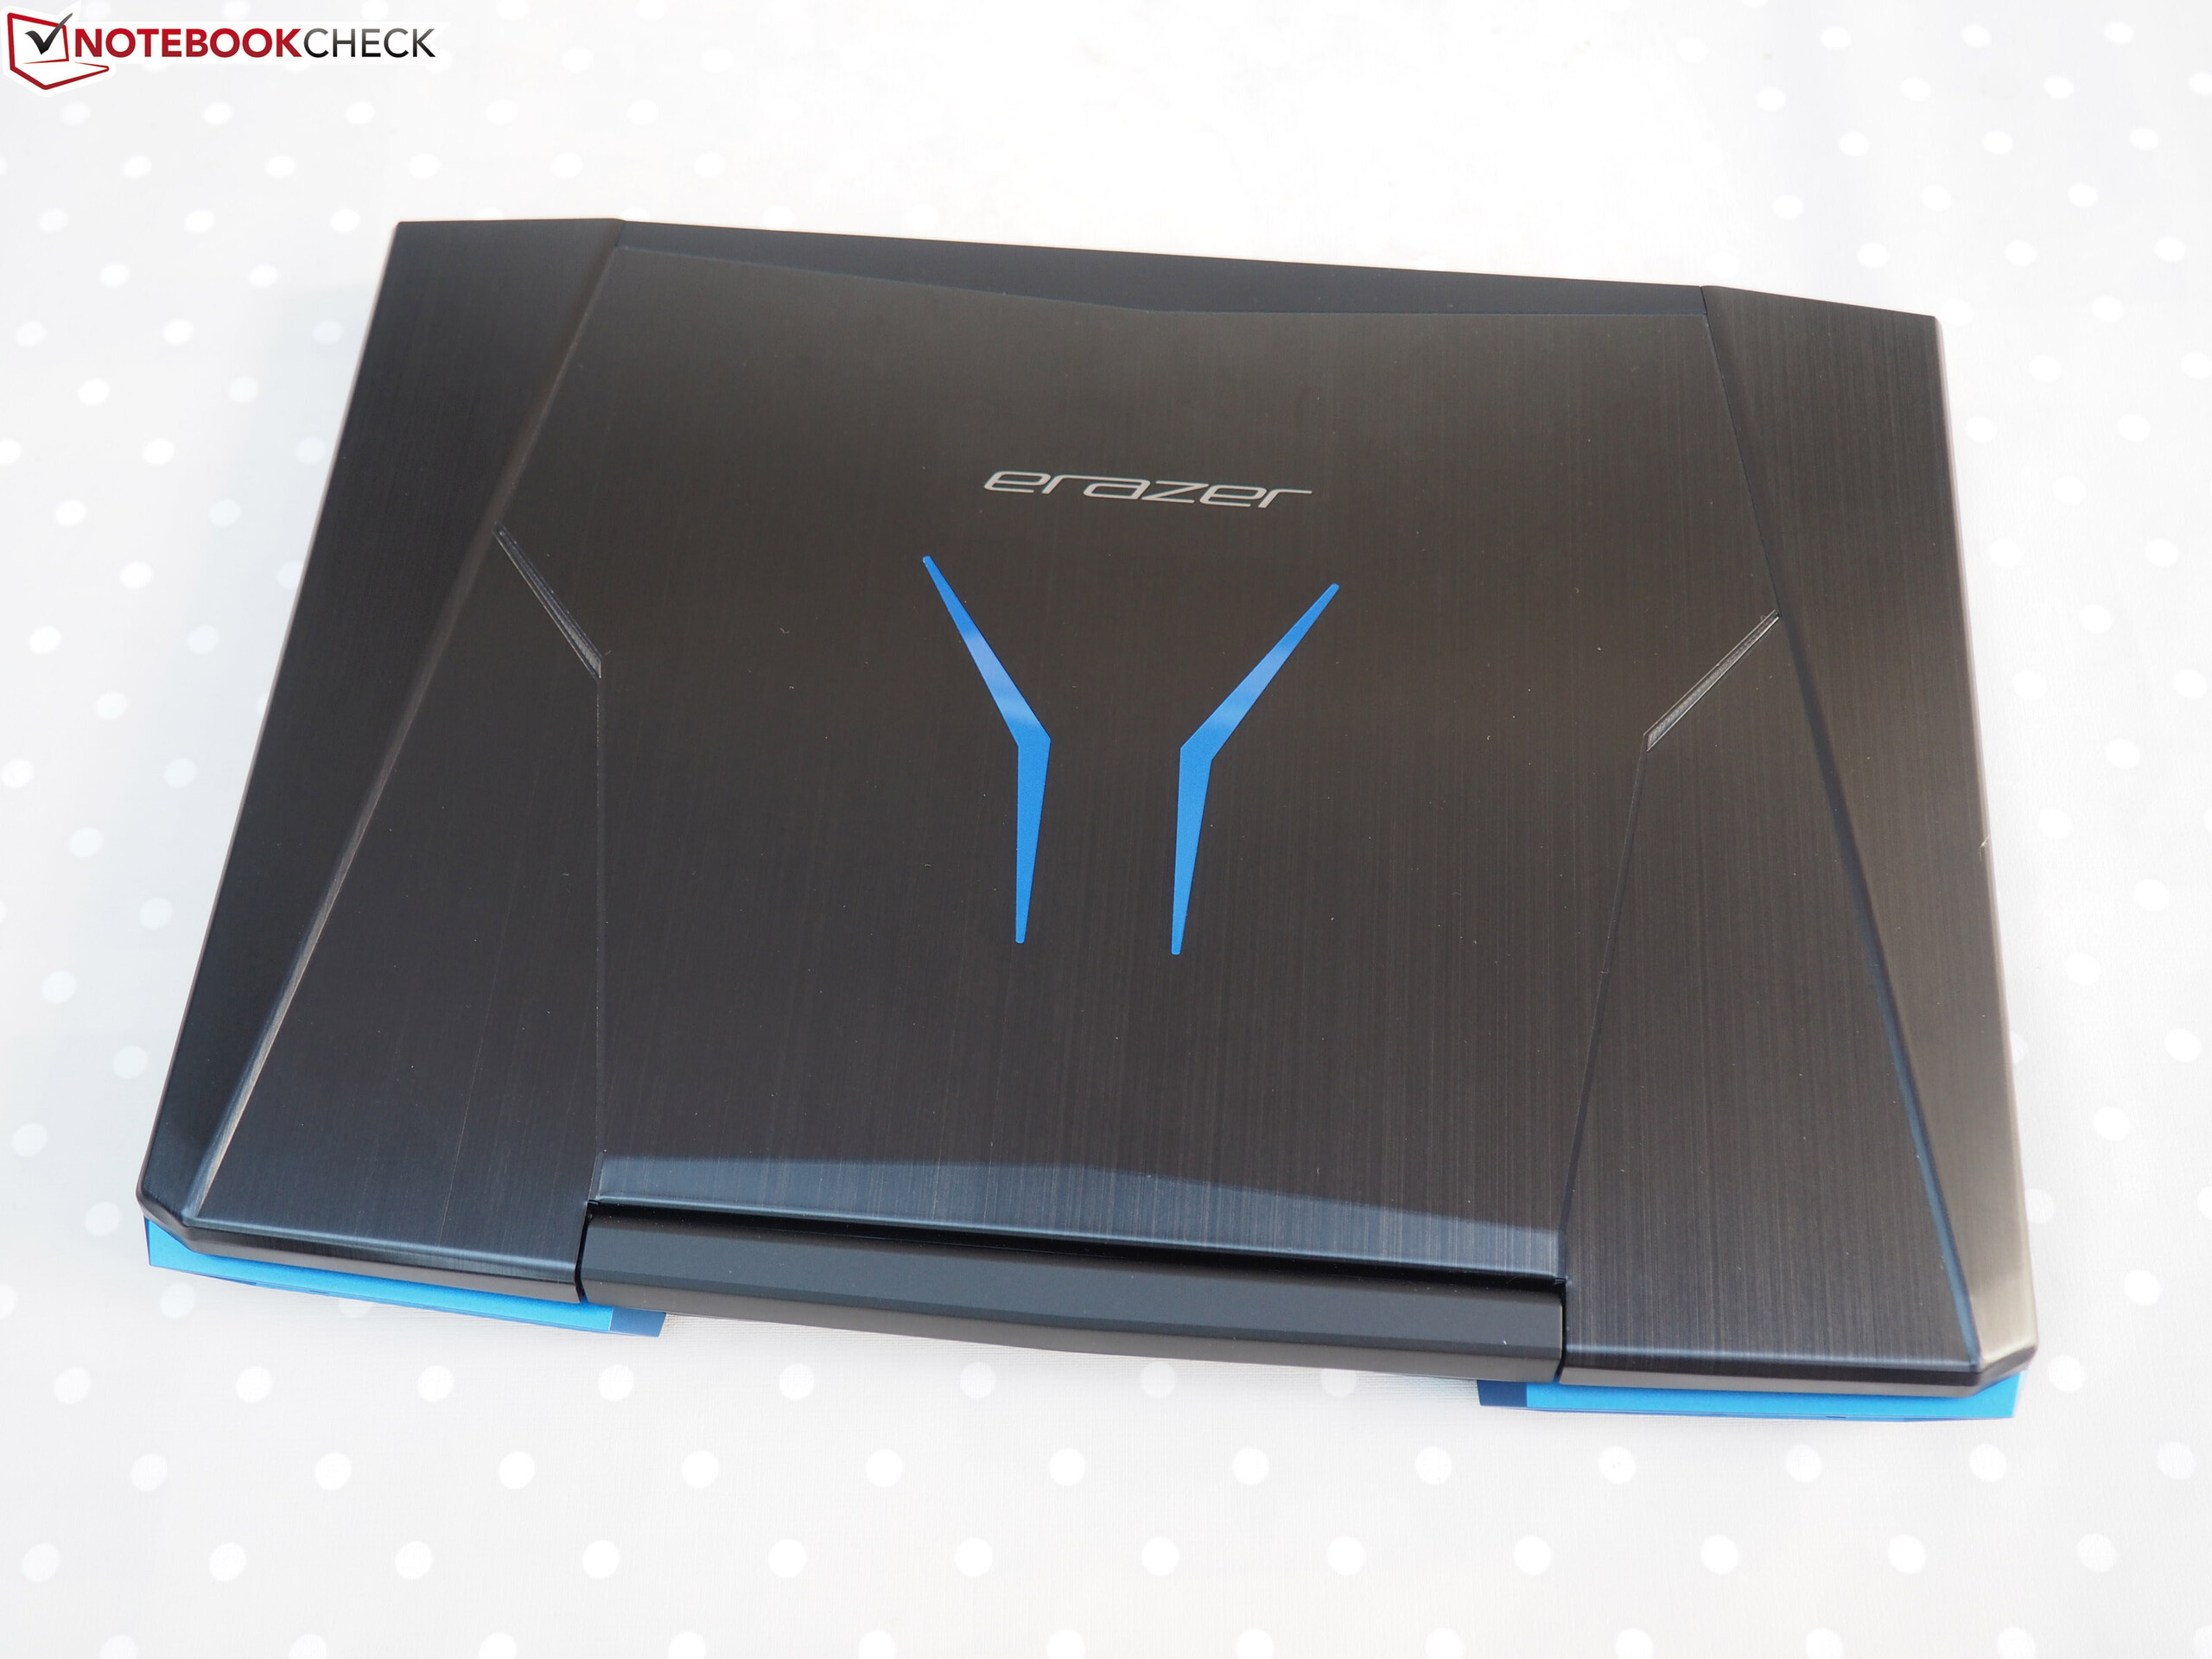
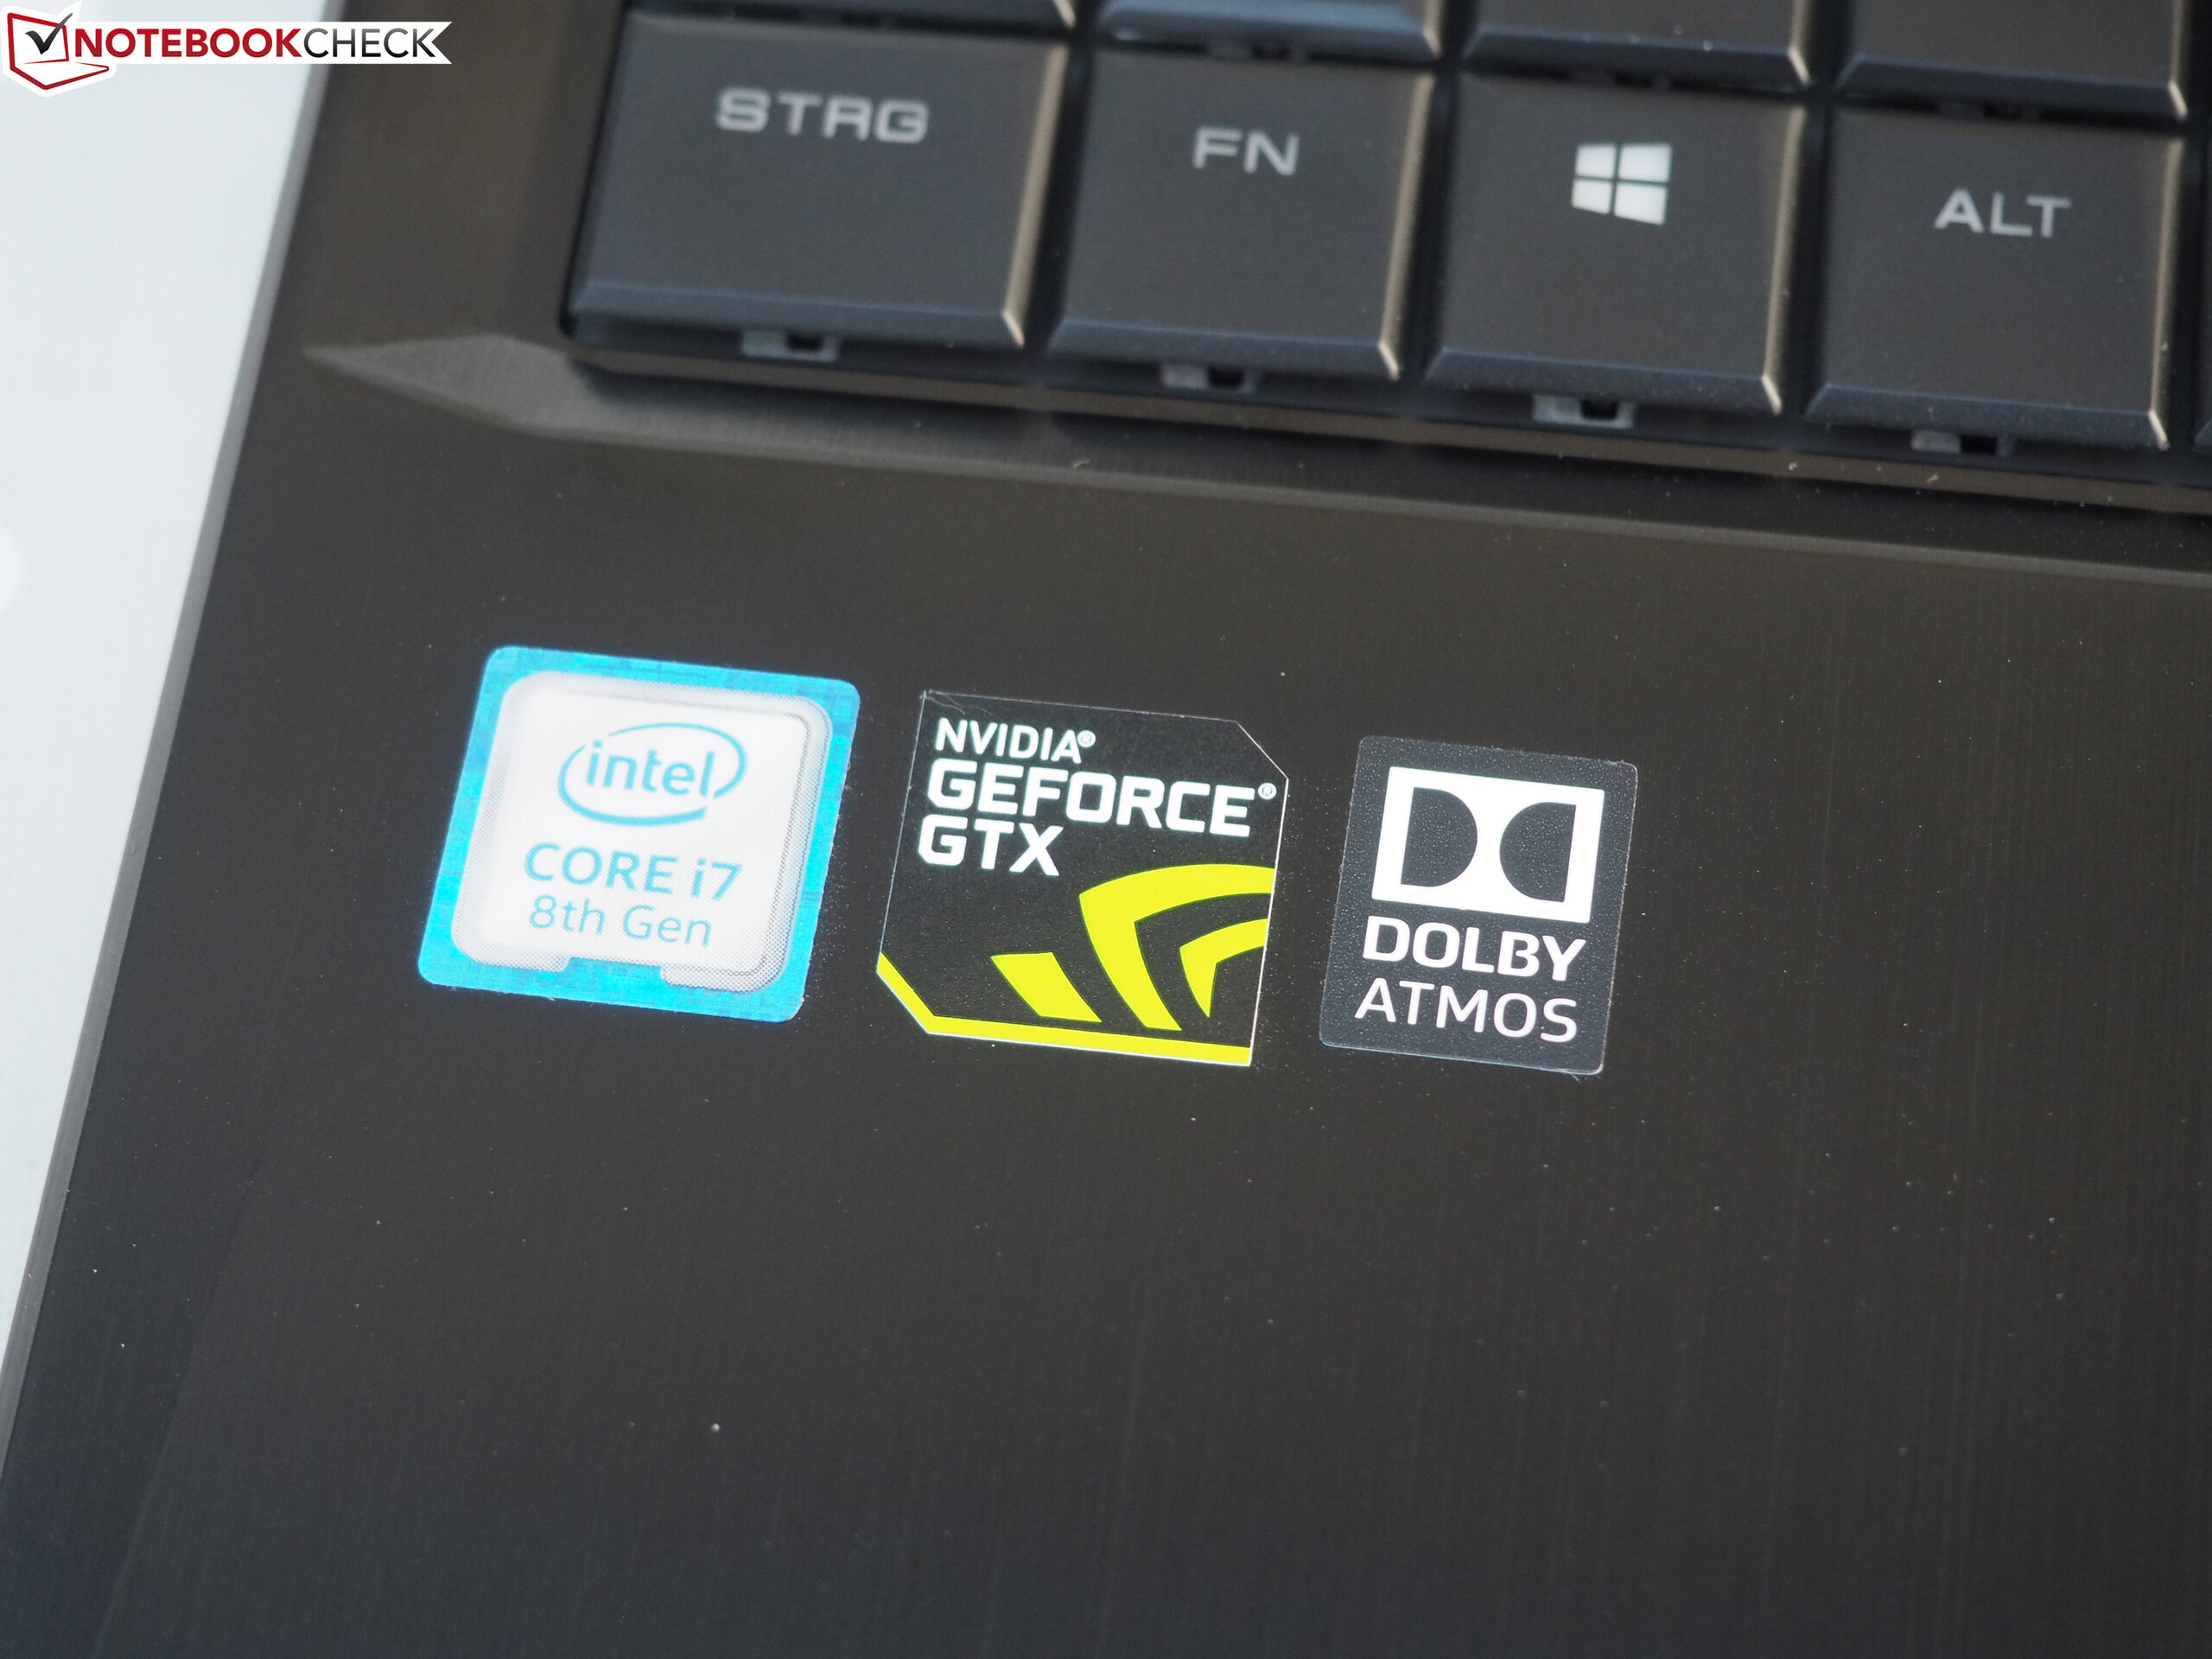
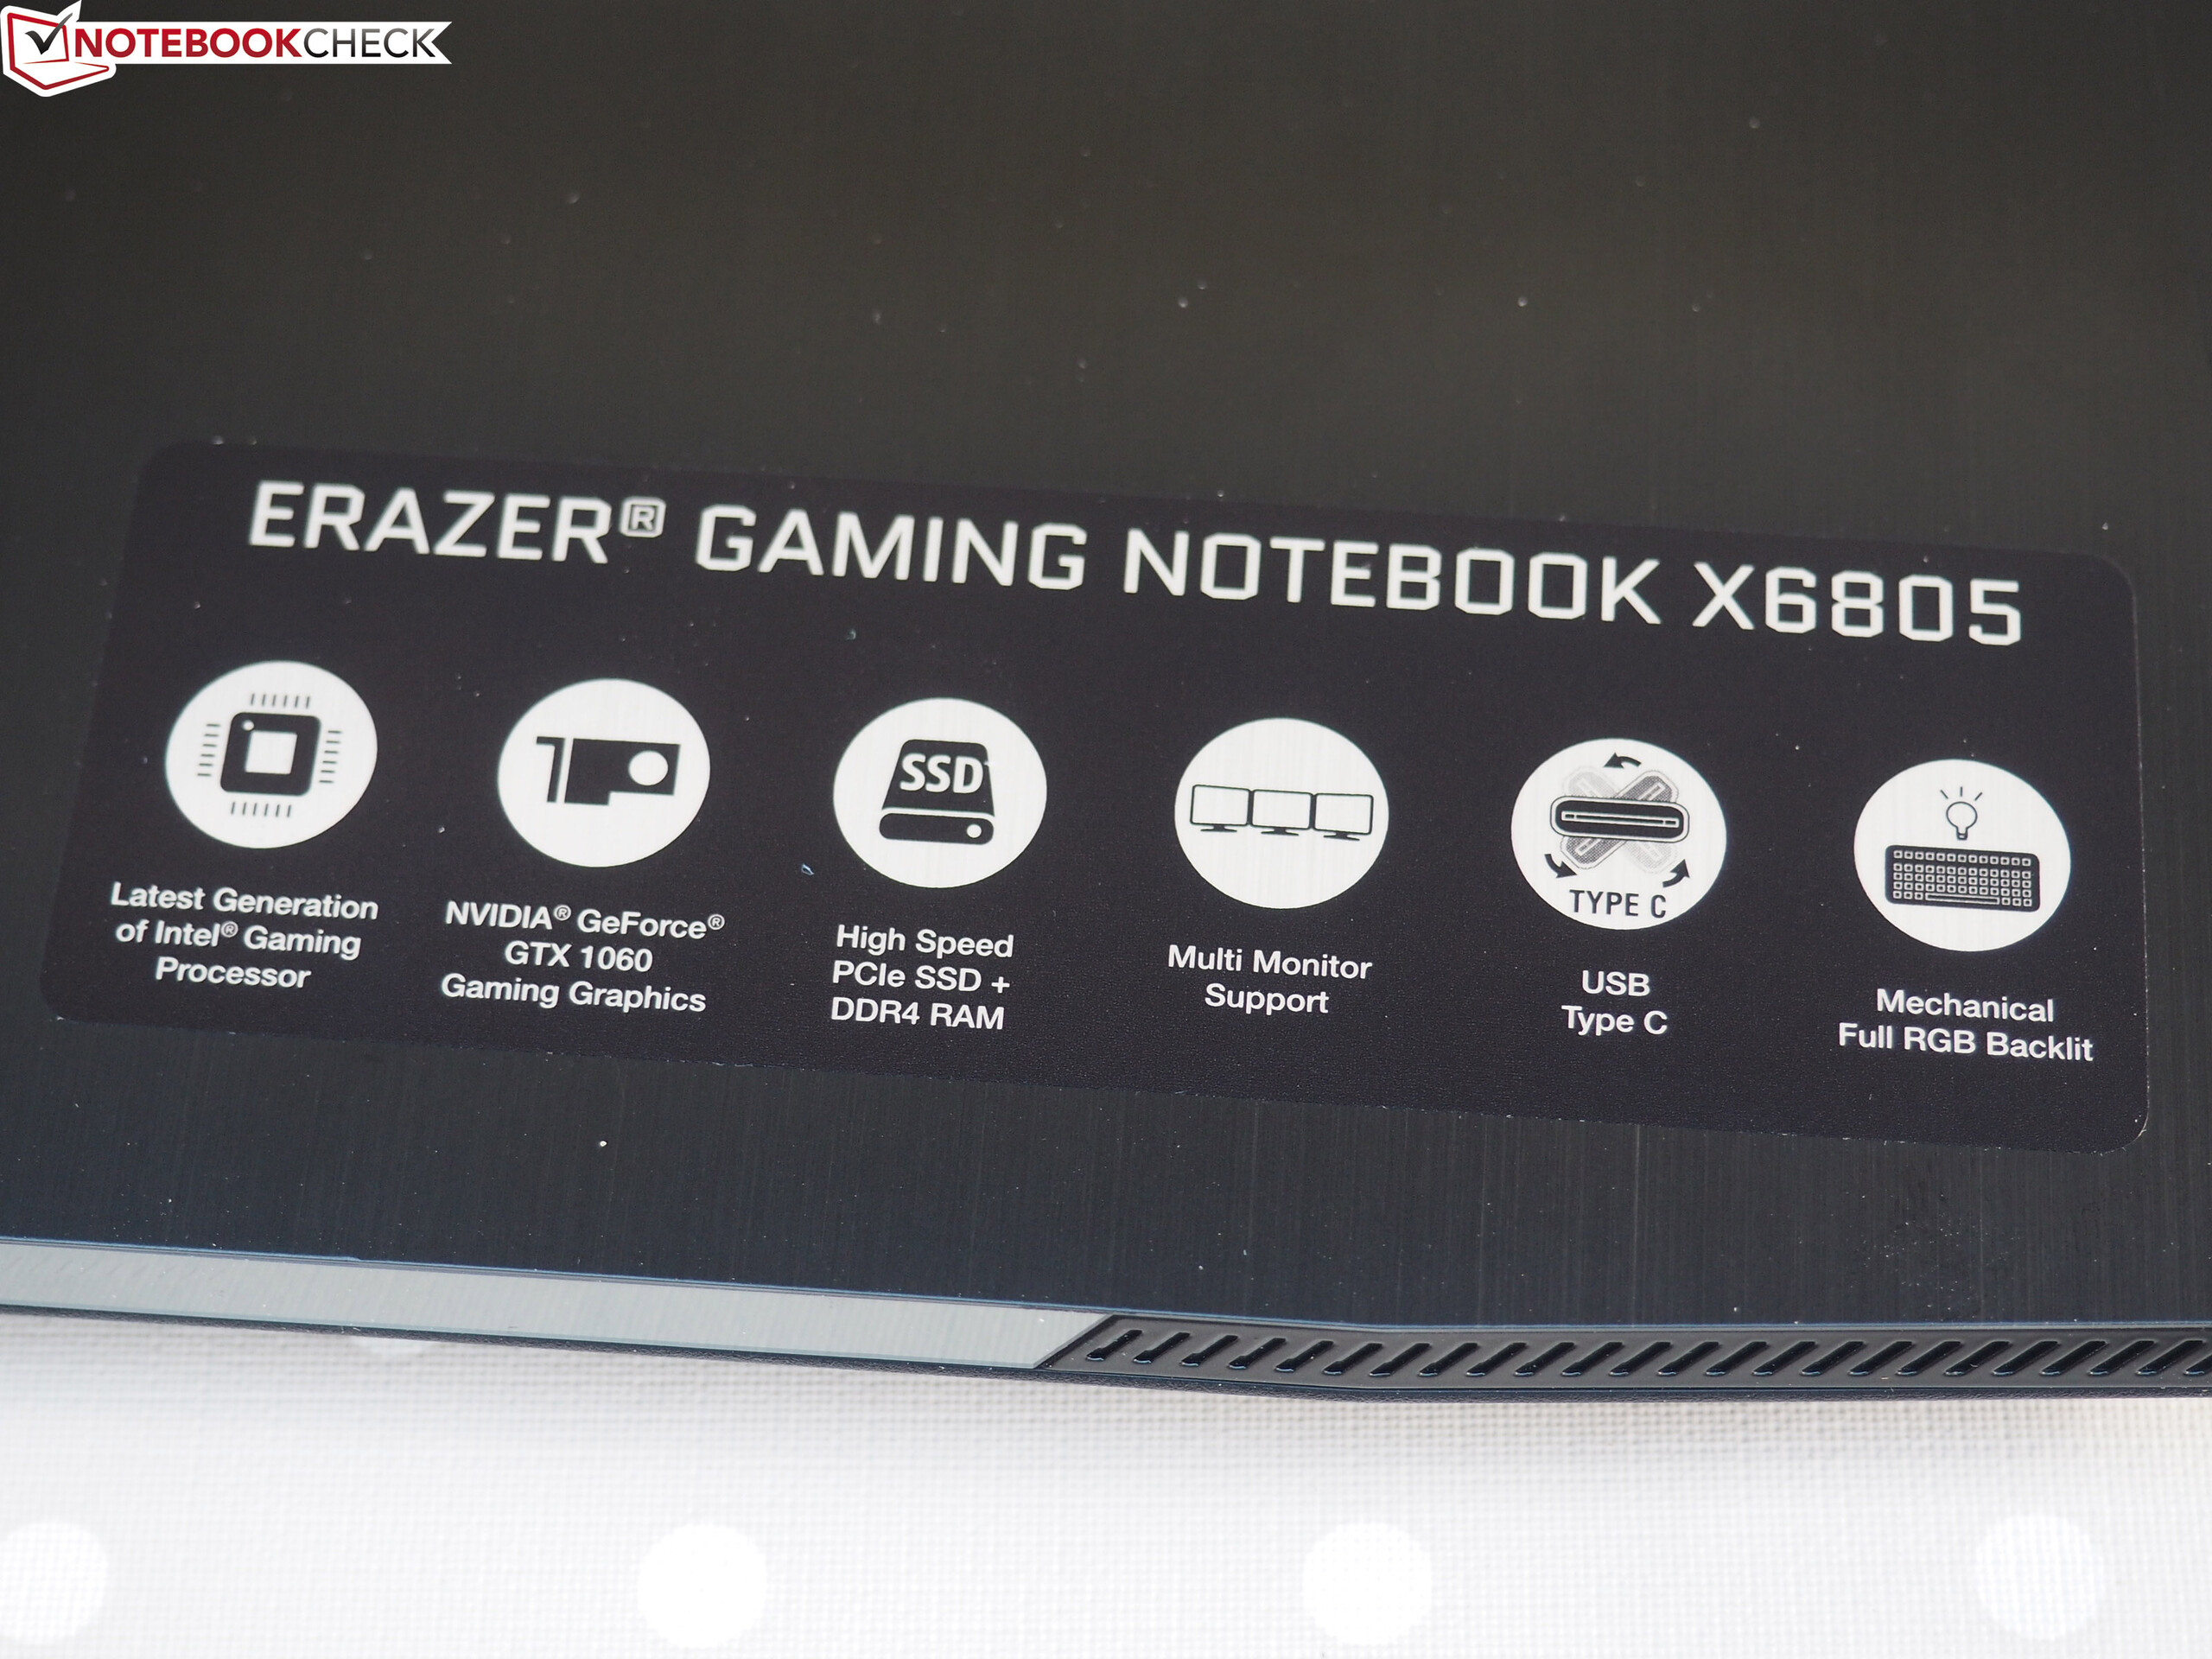
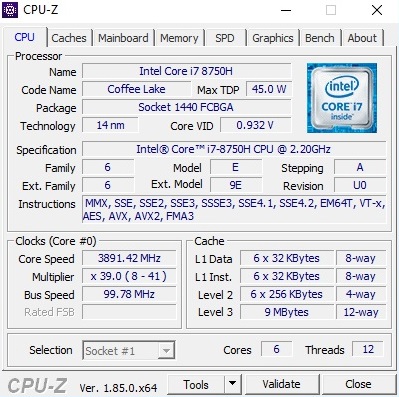
Medion Erazer X6805 är riktigt prisvärd. De flesta billiga bärbara speldatorerna kommer med en Core i5-8300H CPU, ett GeForce GTX 1050 Ti, 8 GB RAM och en SSD-enhet på 128 GB. Medion har gått ytterligare ett steg och beväpnat sin X6805 med en Core i7-8750H CPU, en GeForce GTX 1060 GPU, 16 GB RAM och en PCIe SSD-enhet på 256 GB.
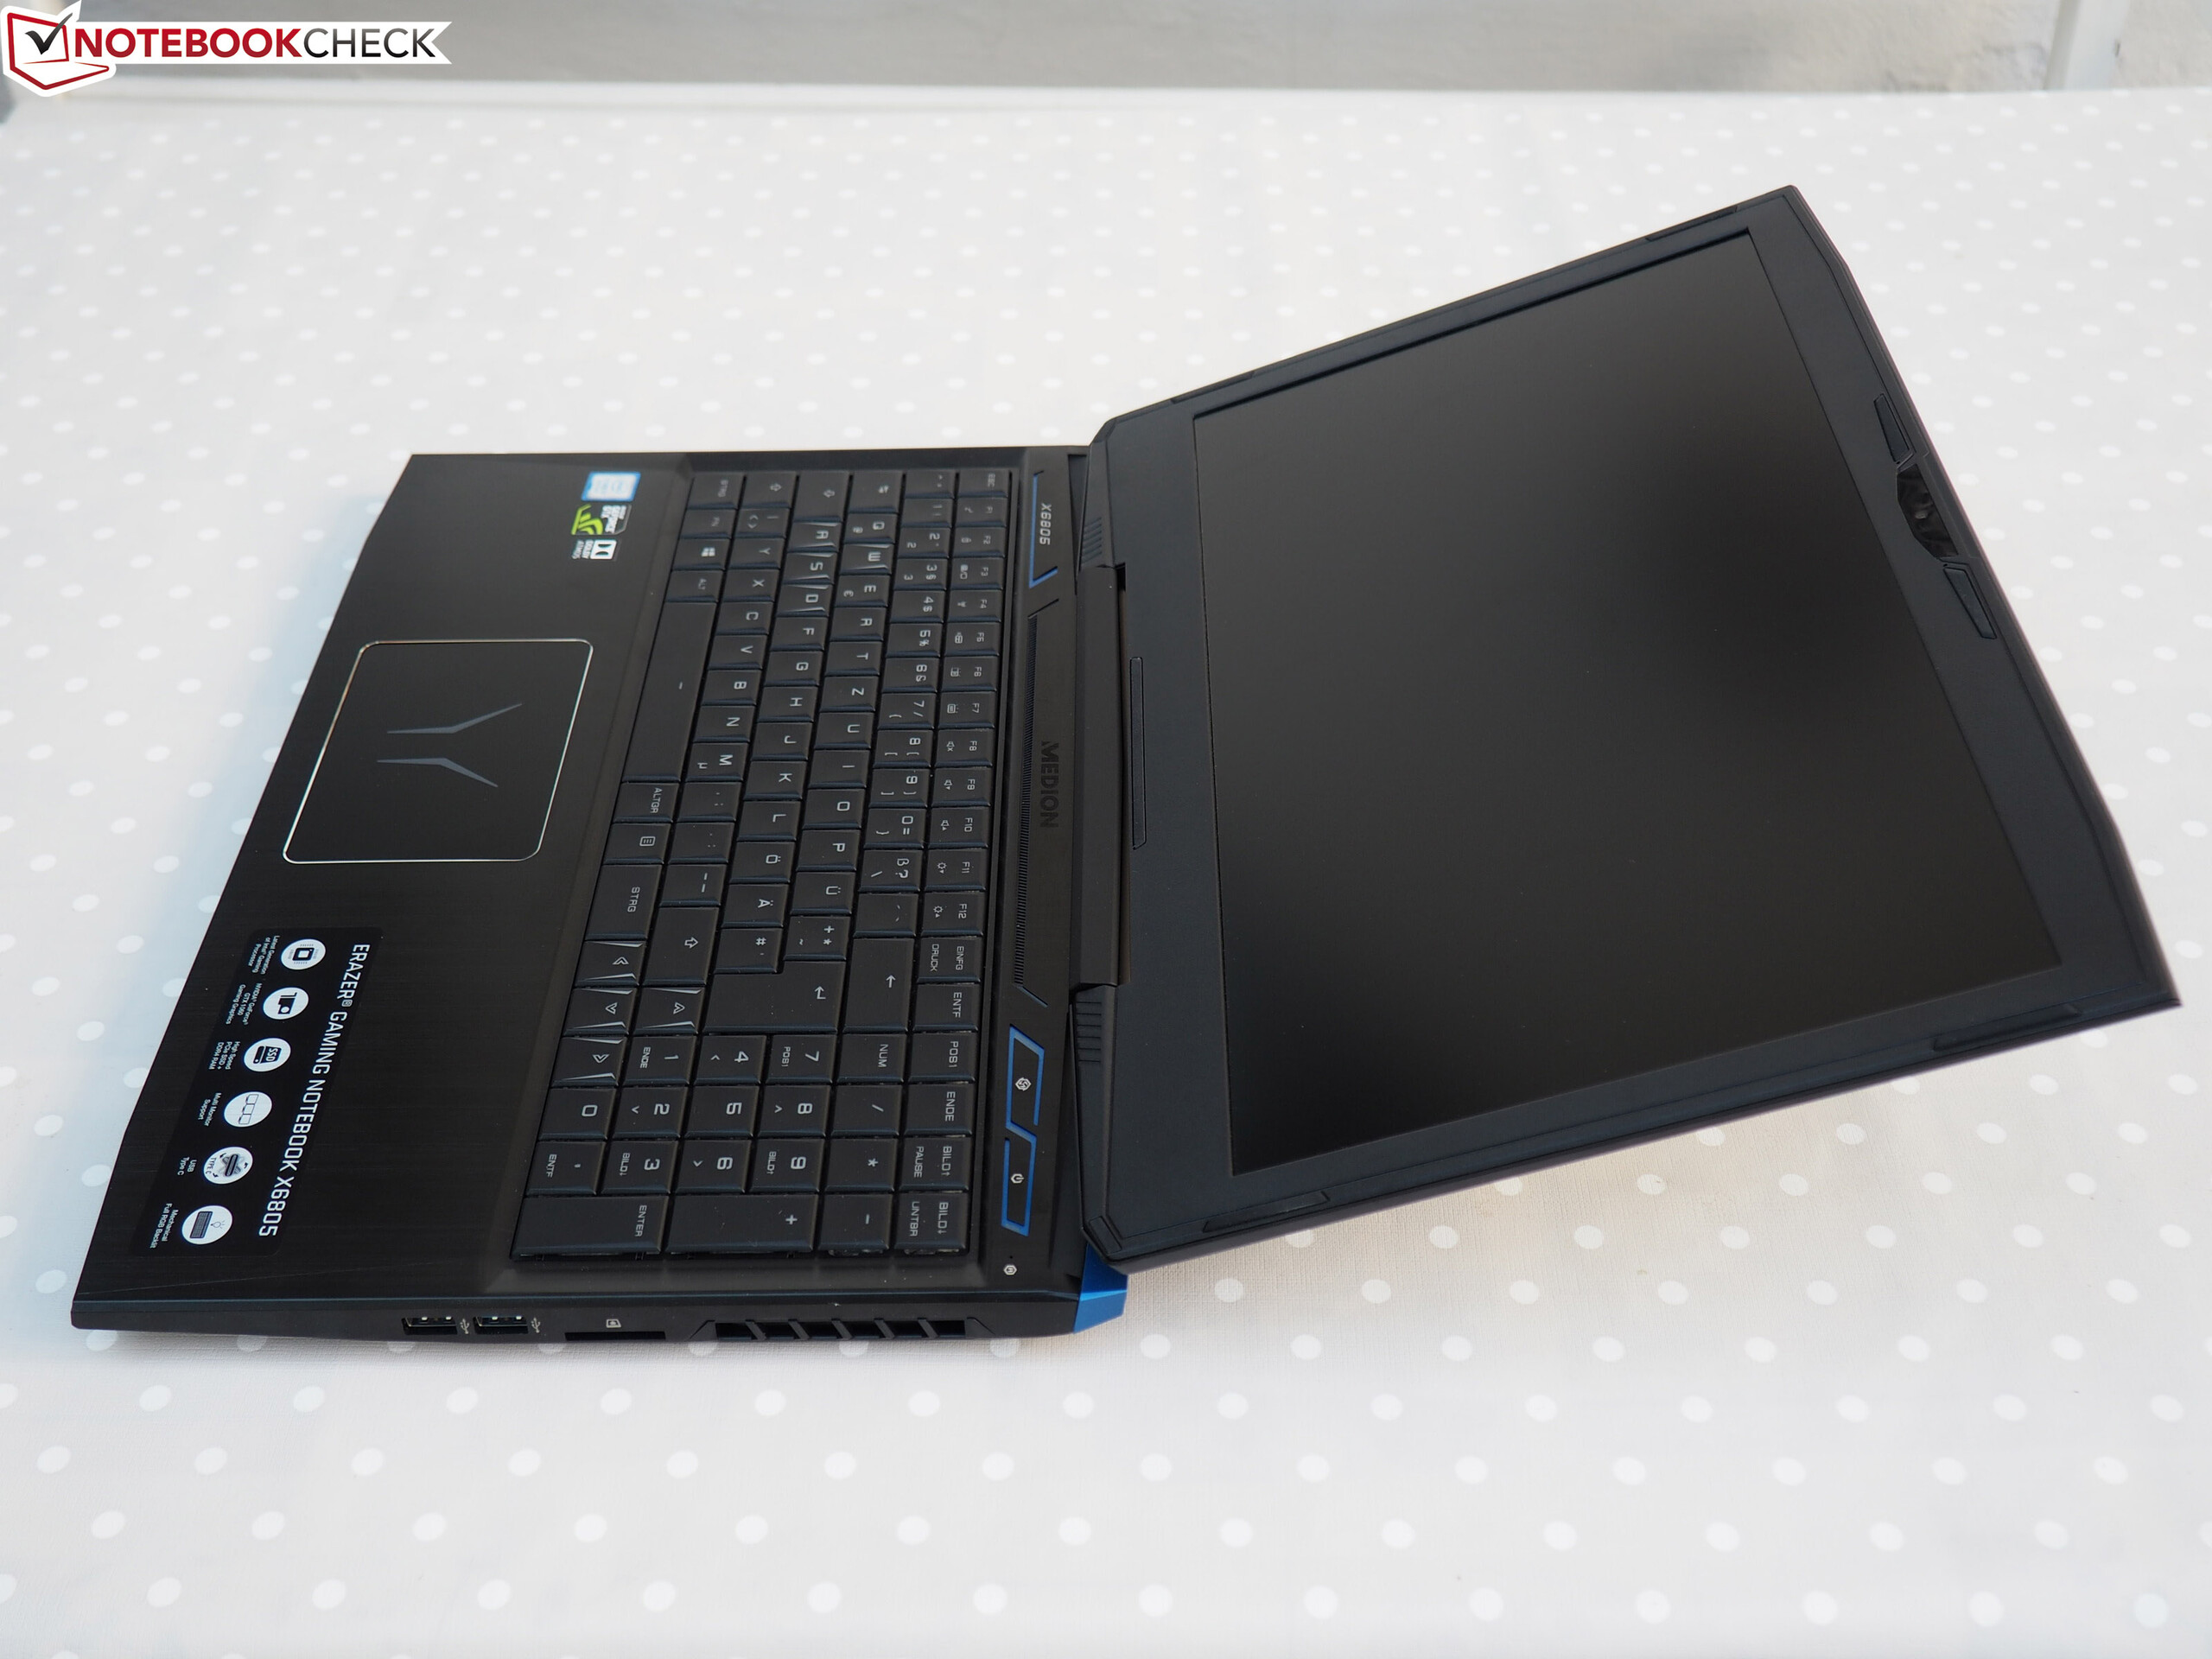
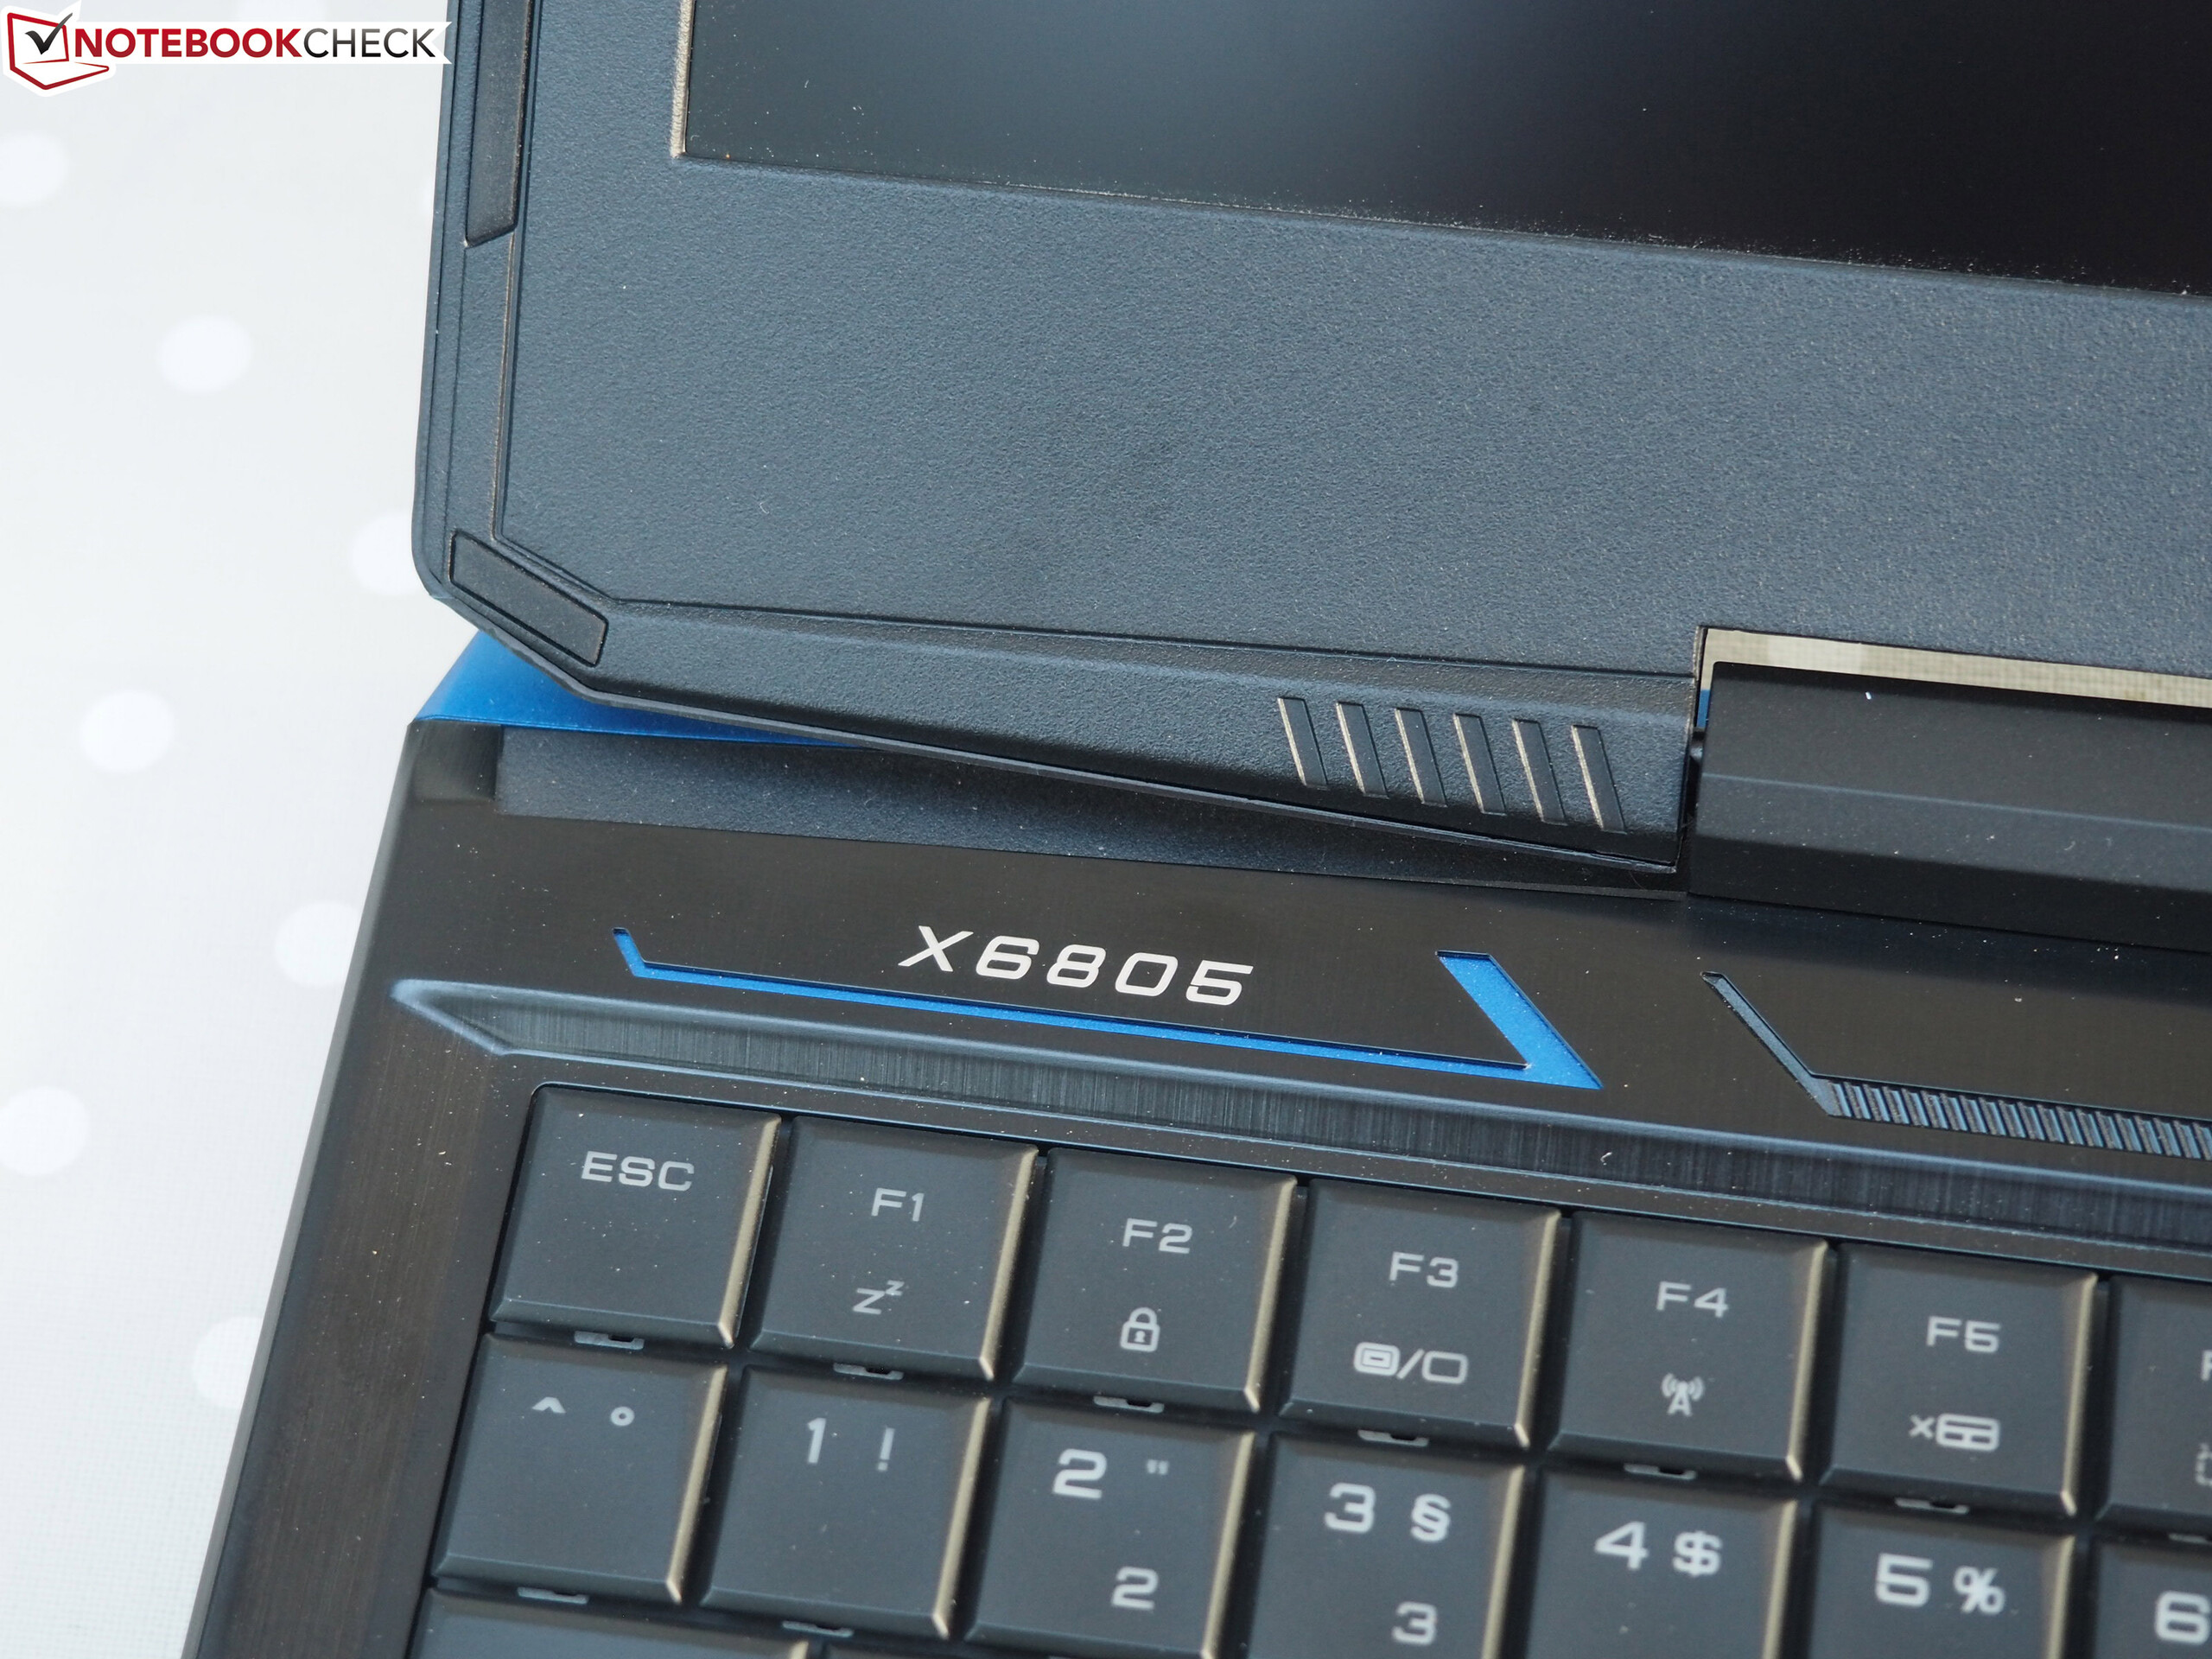
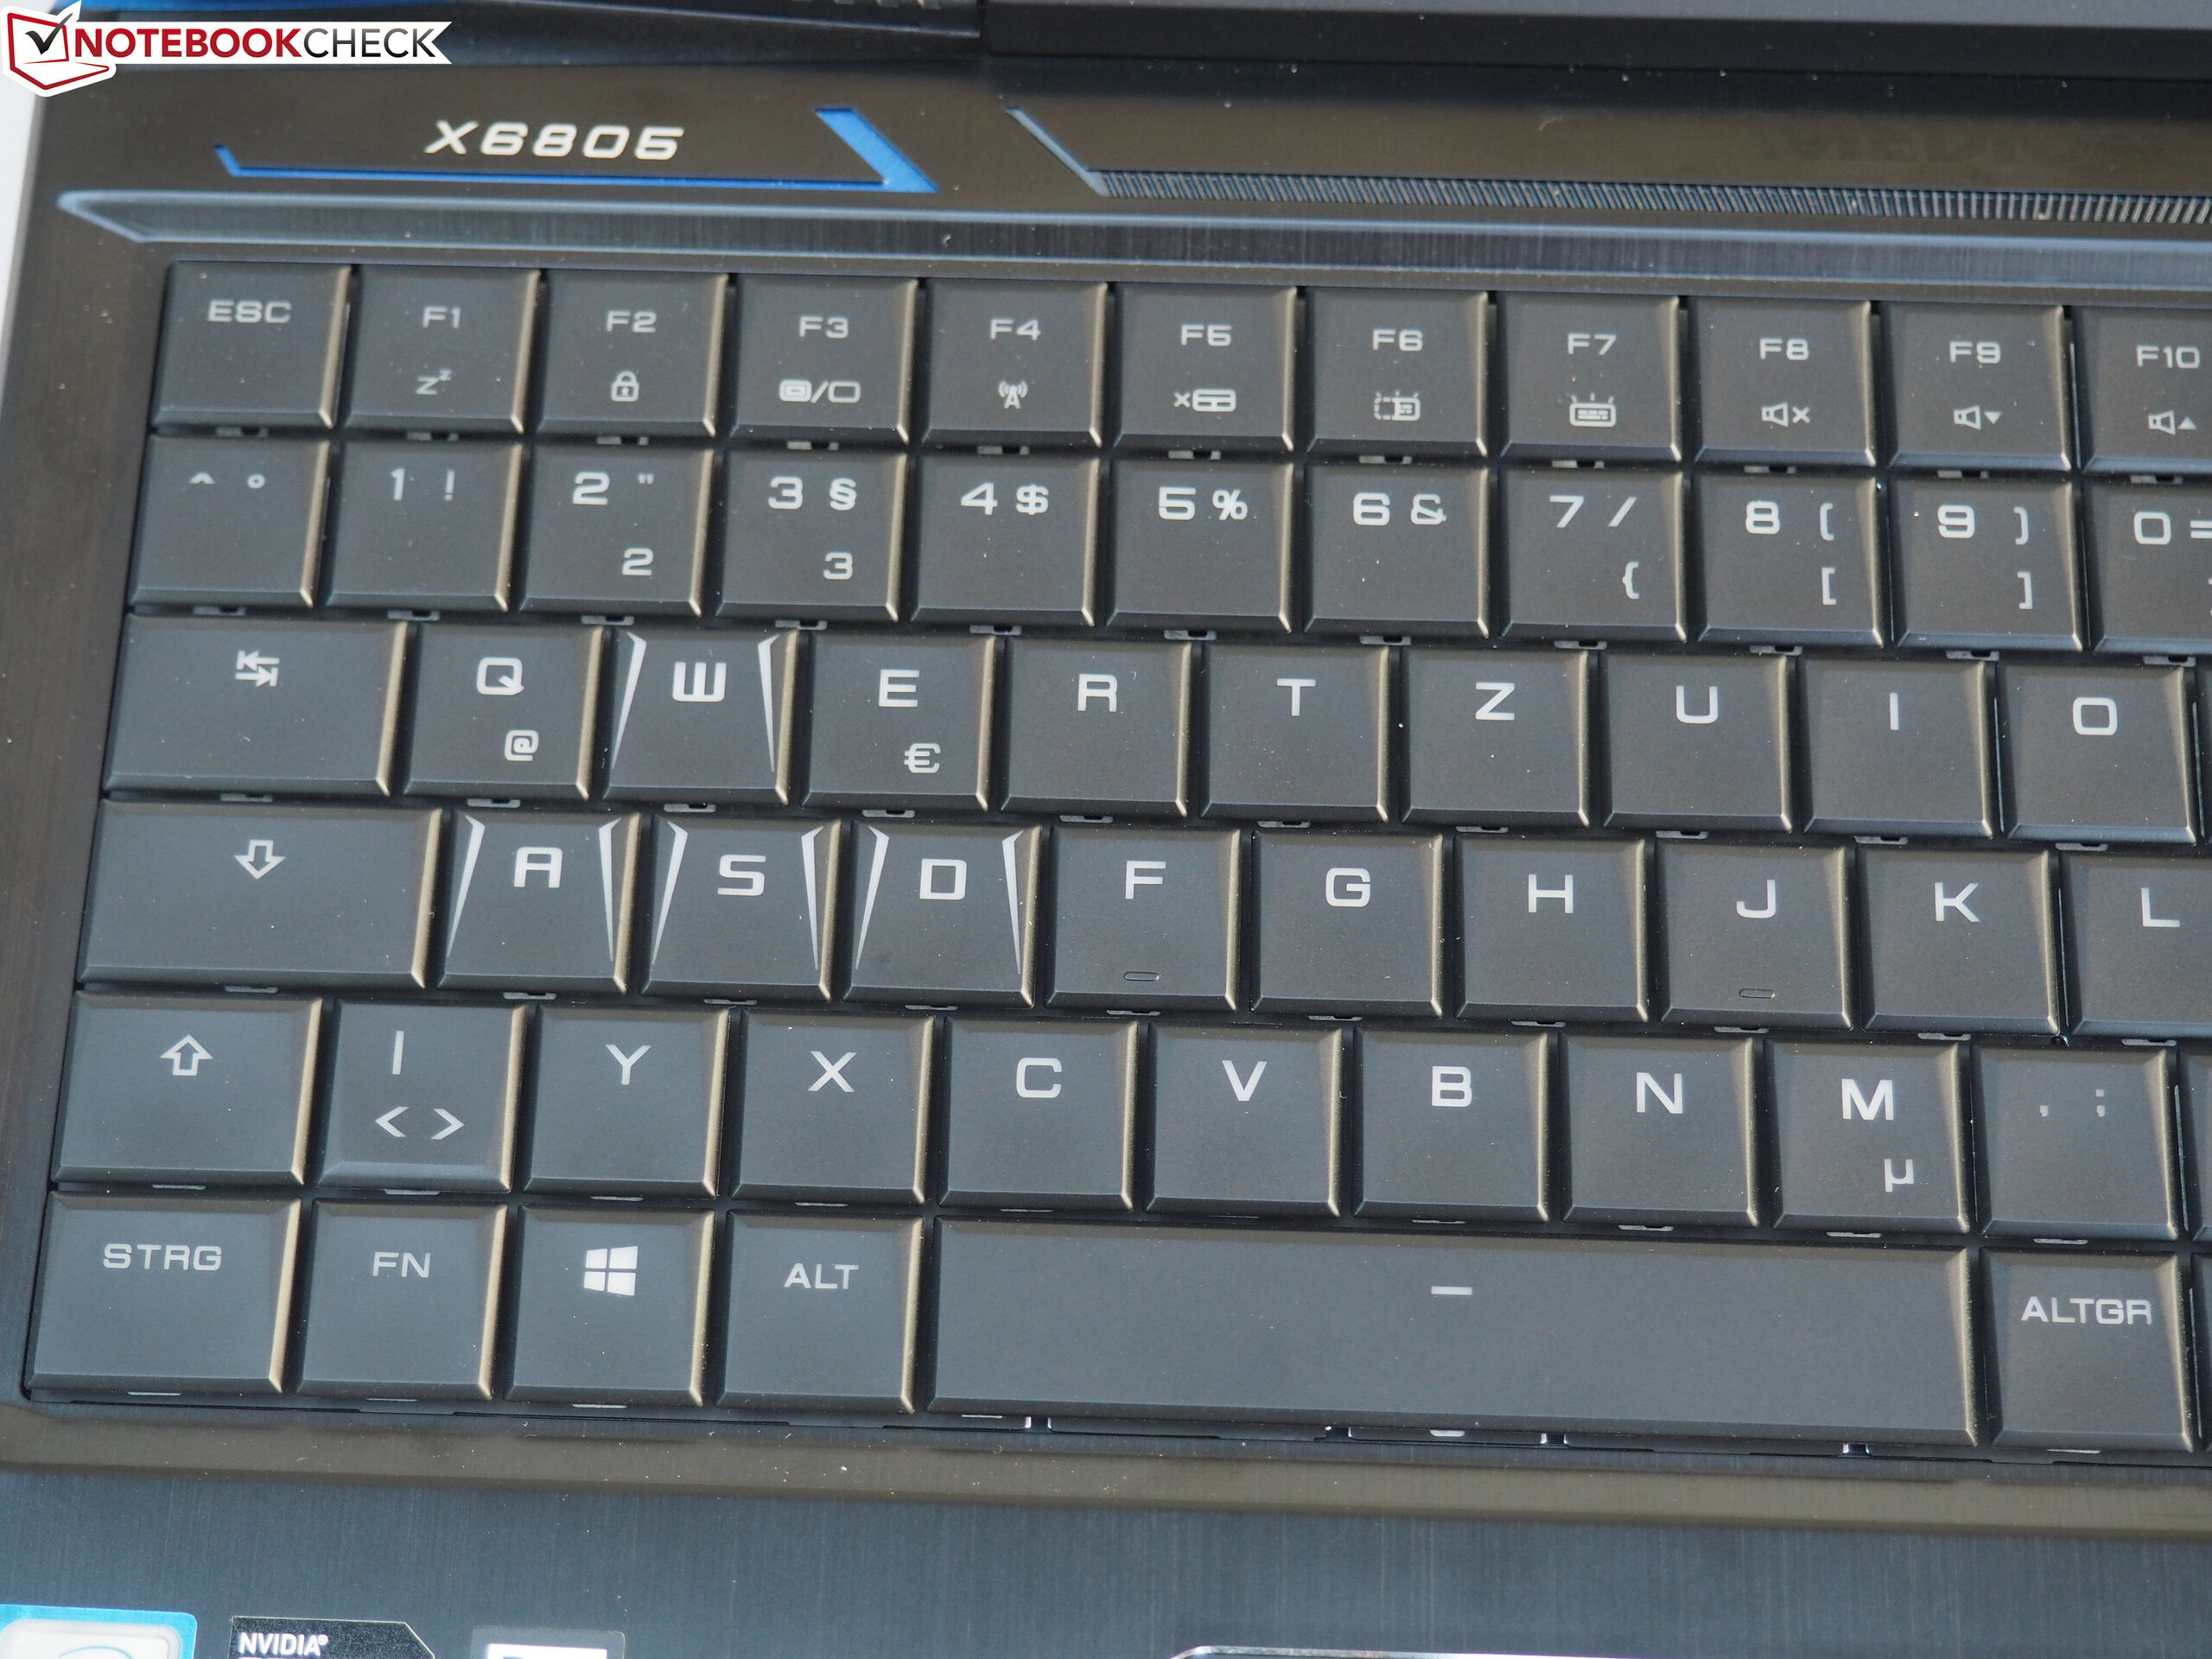
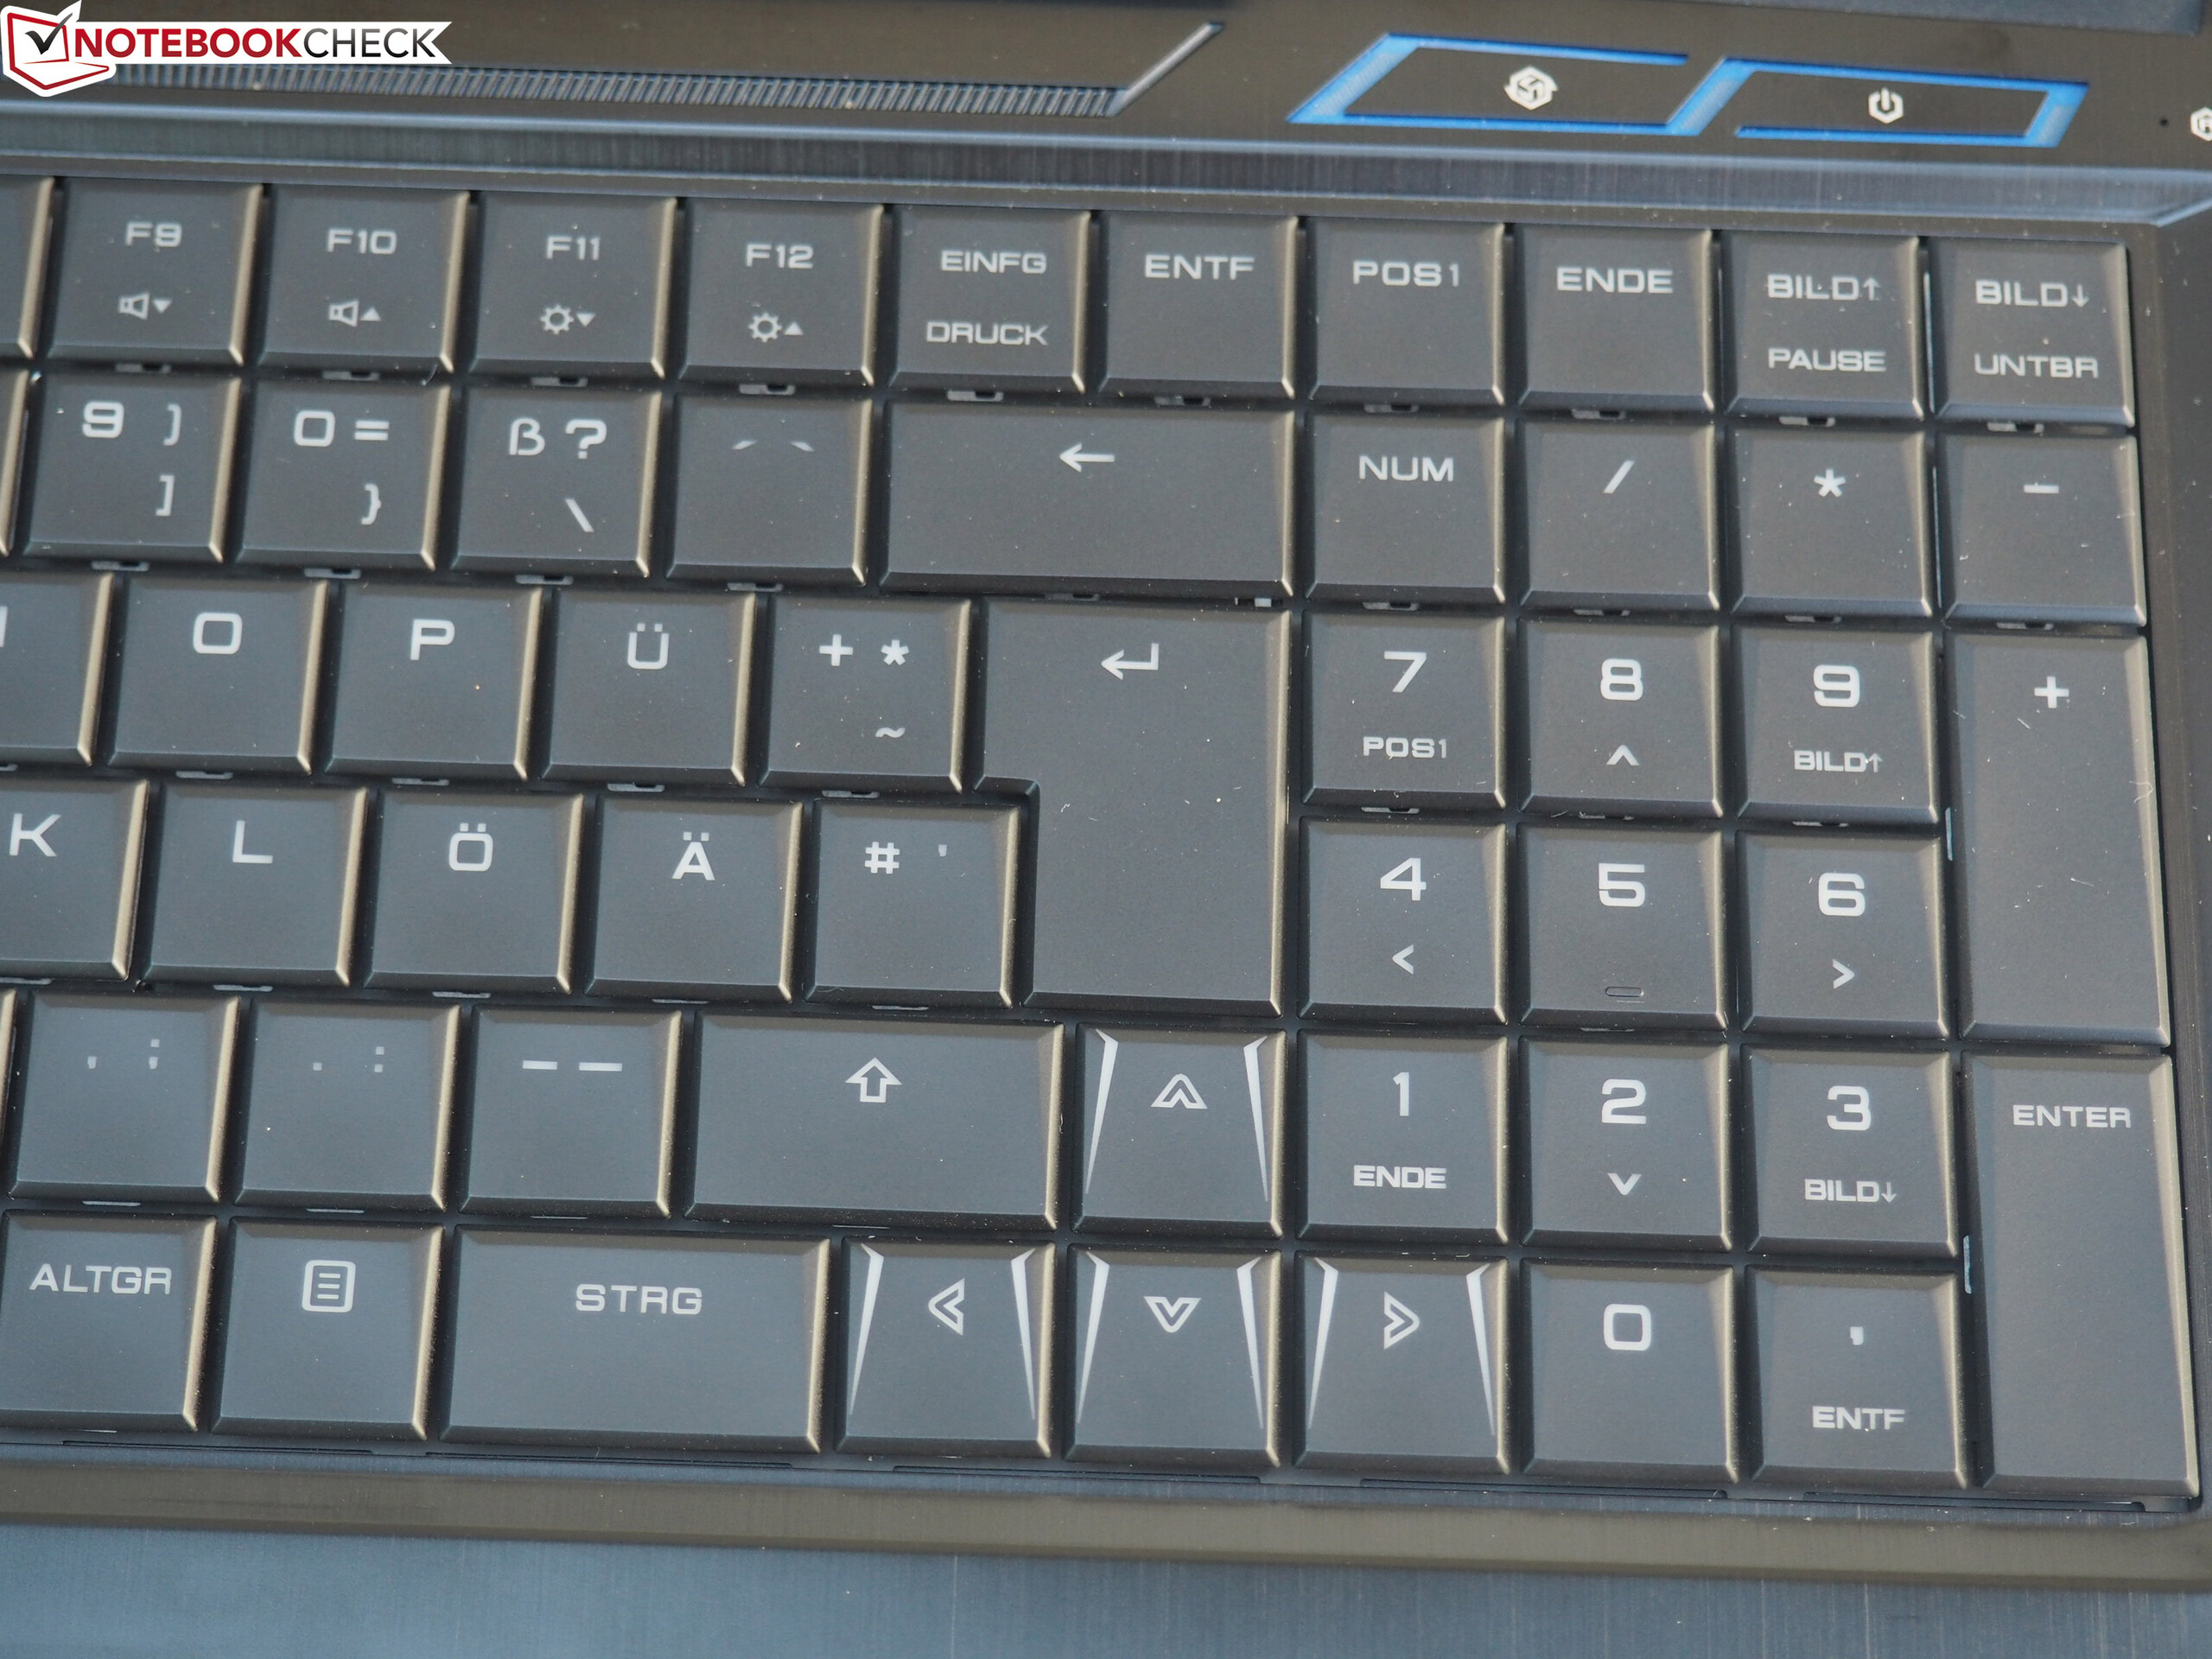
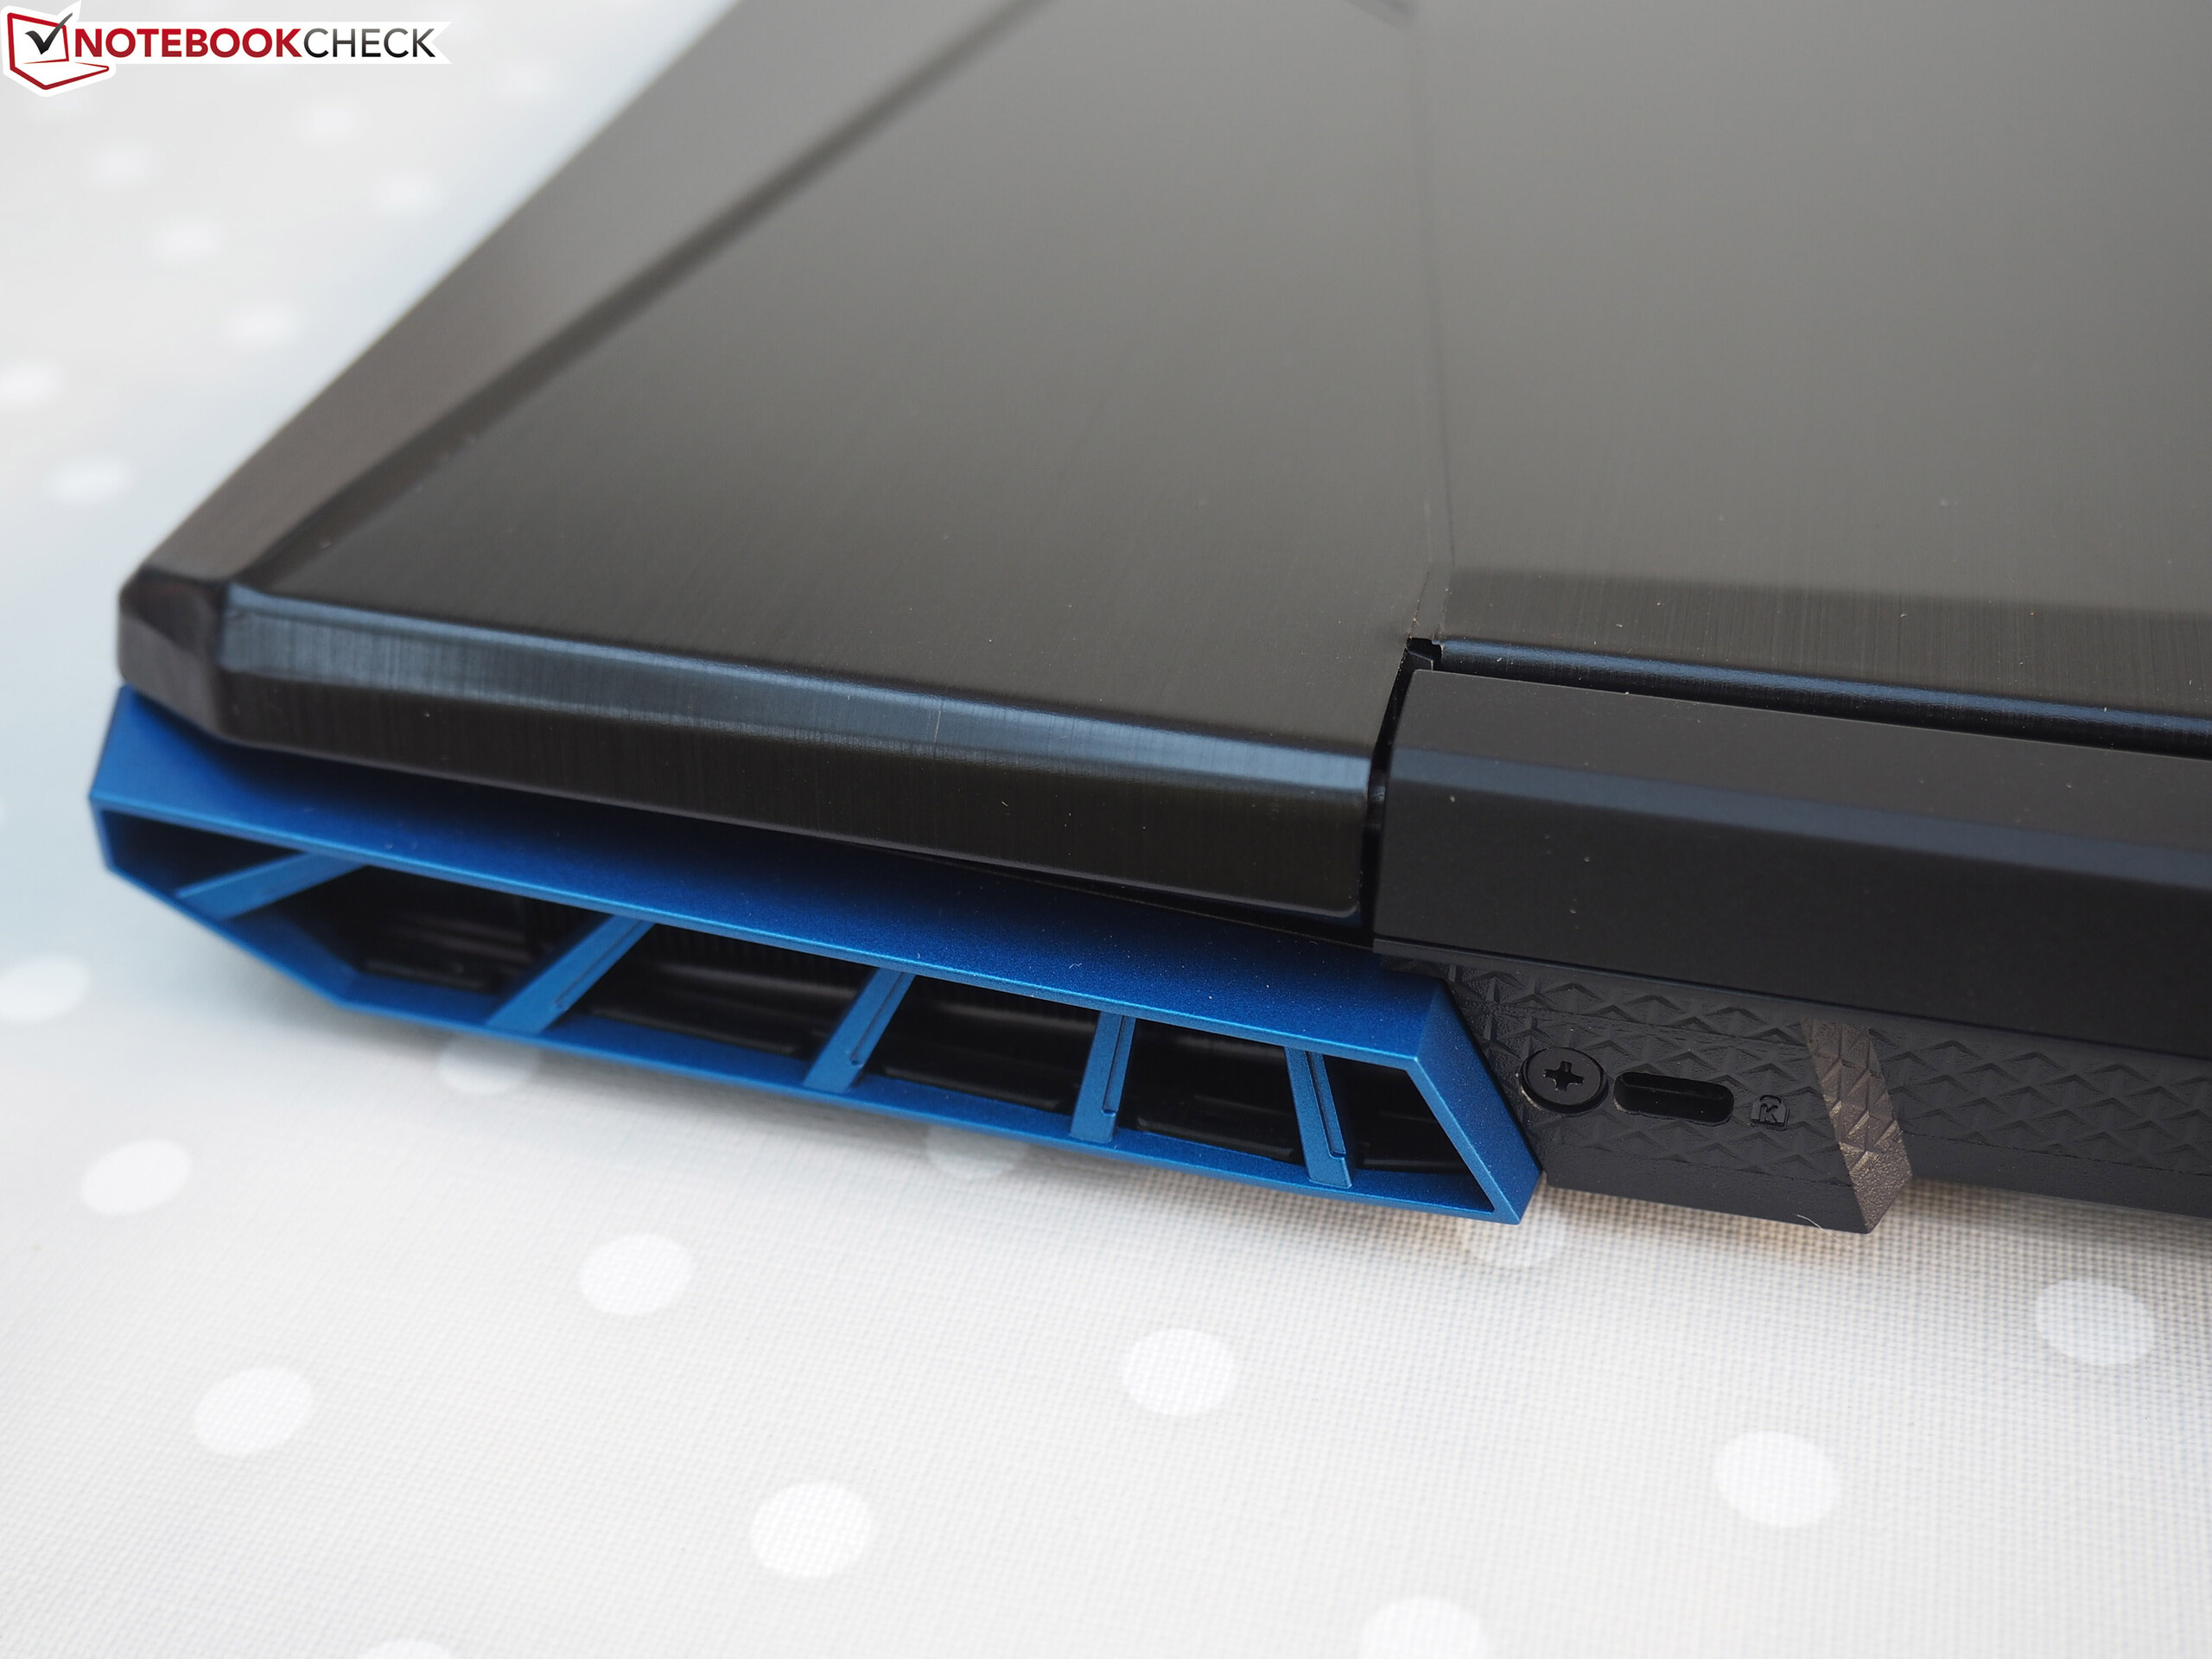
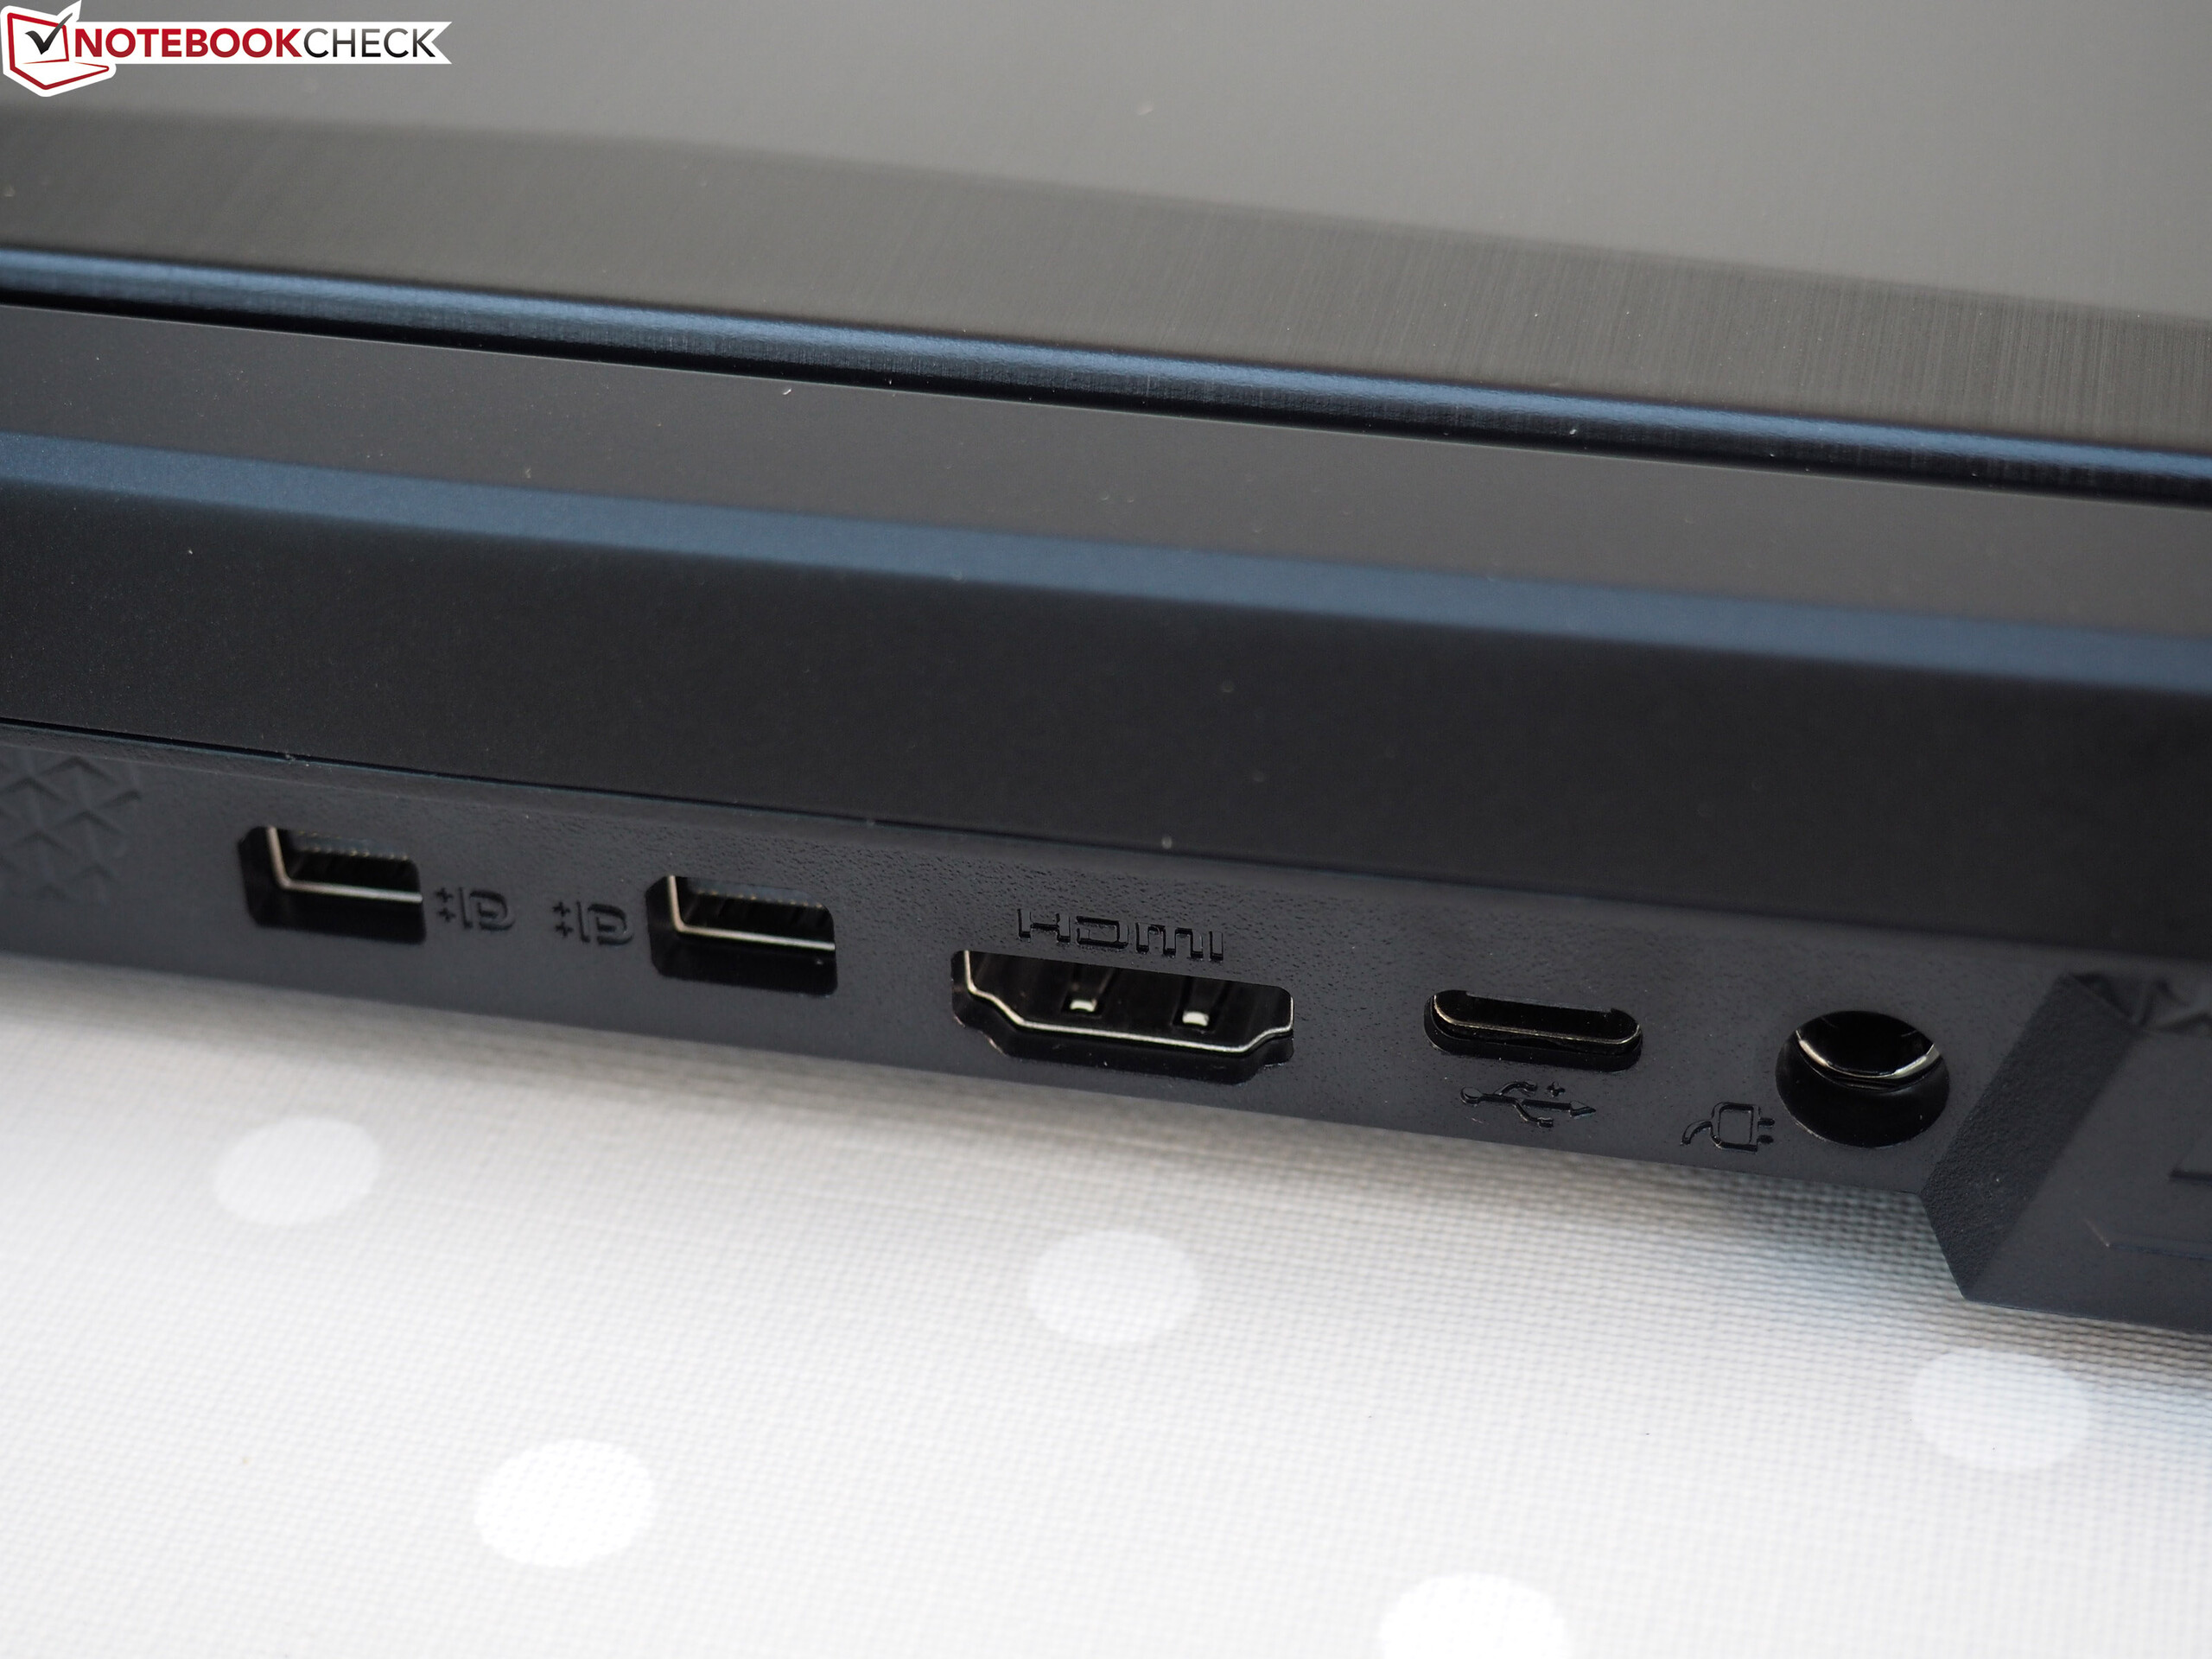
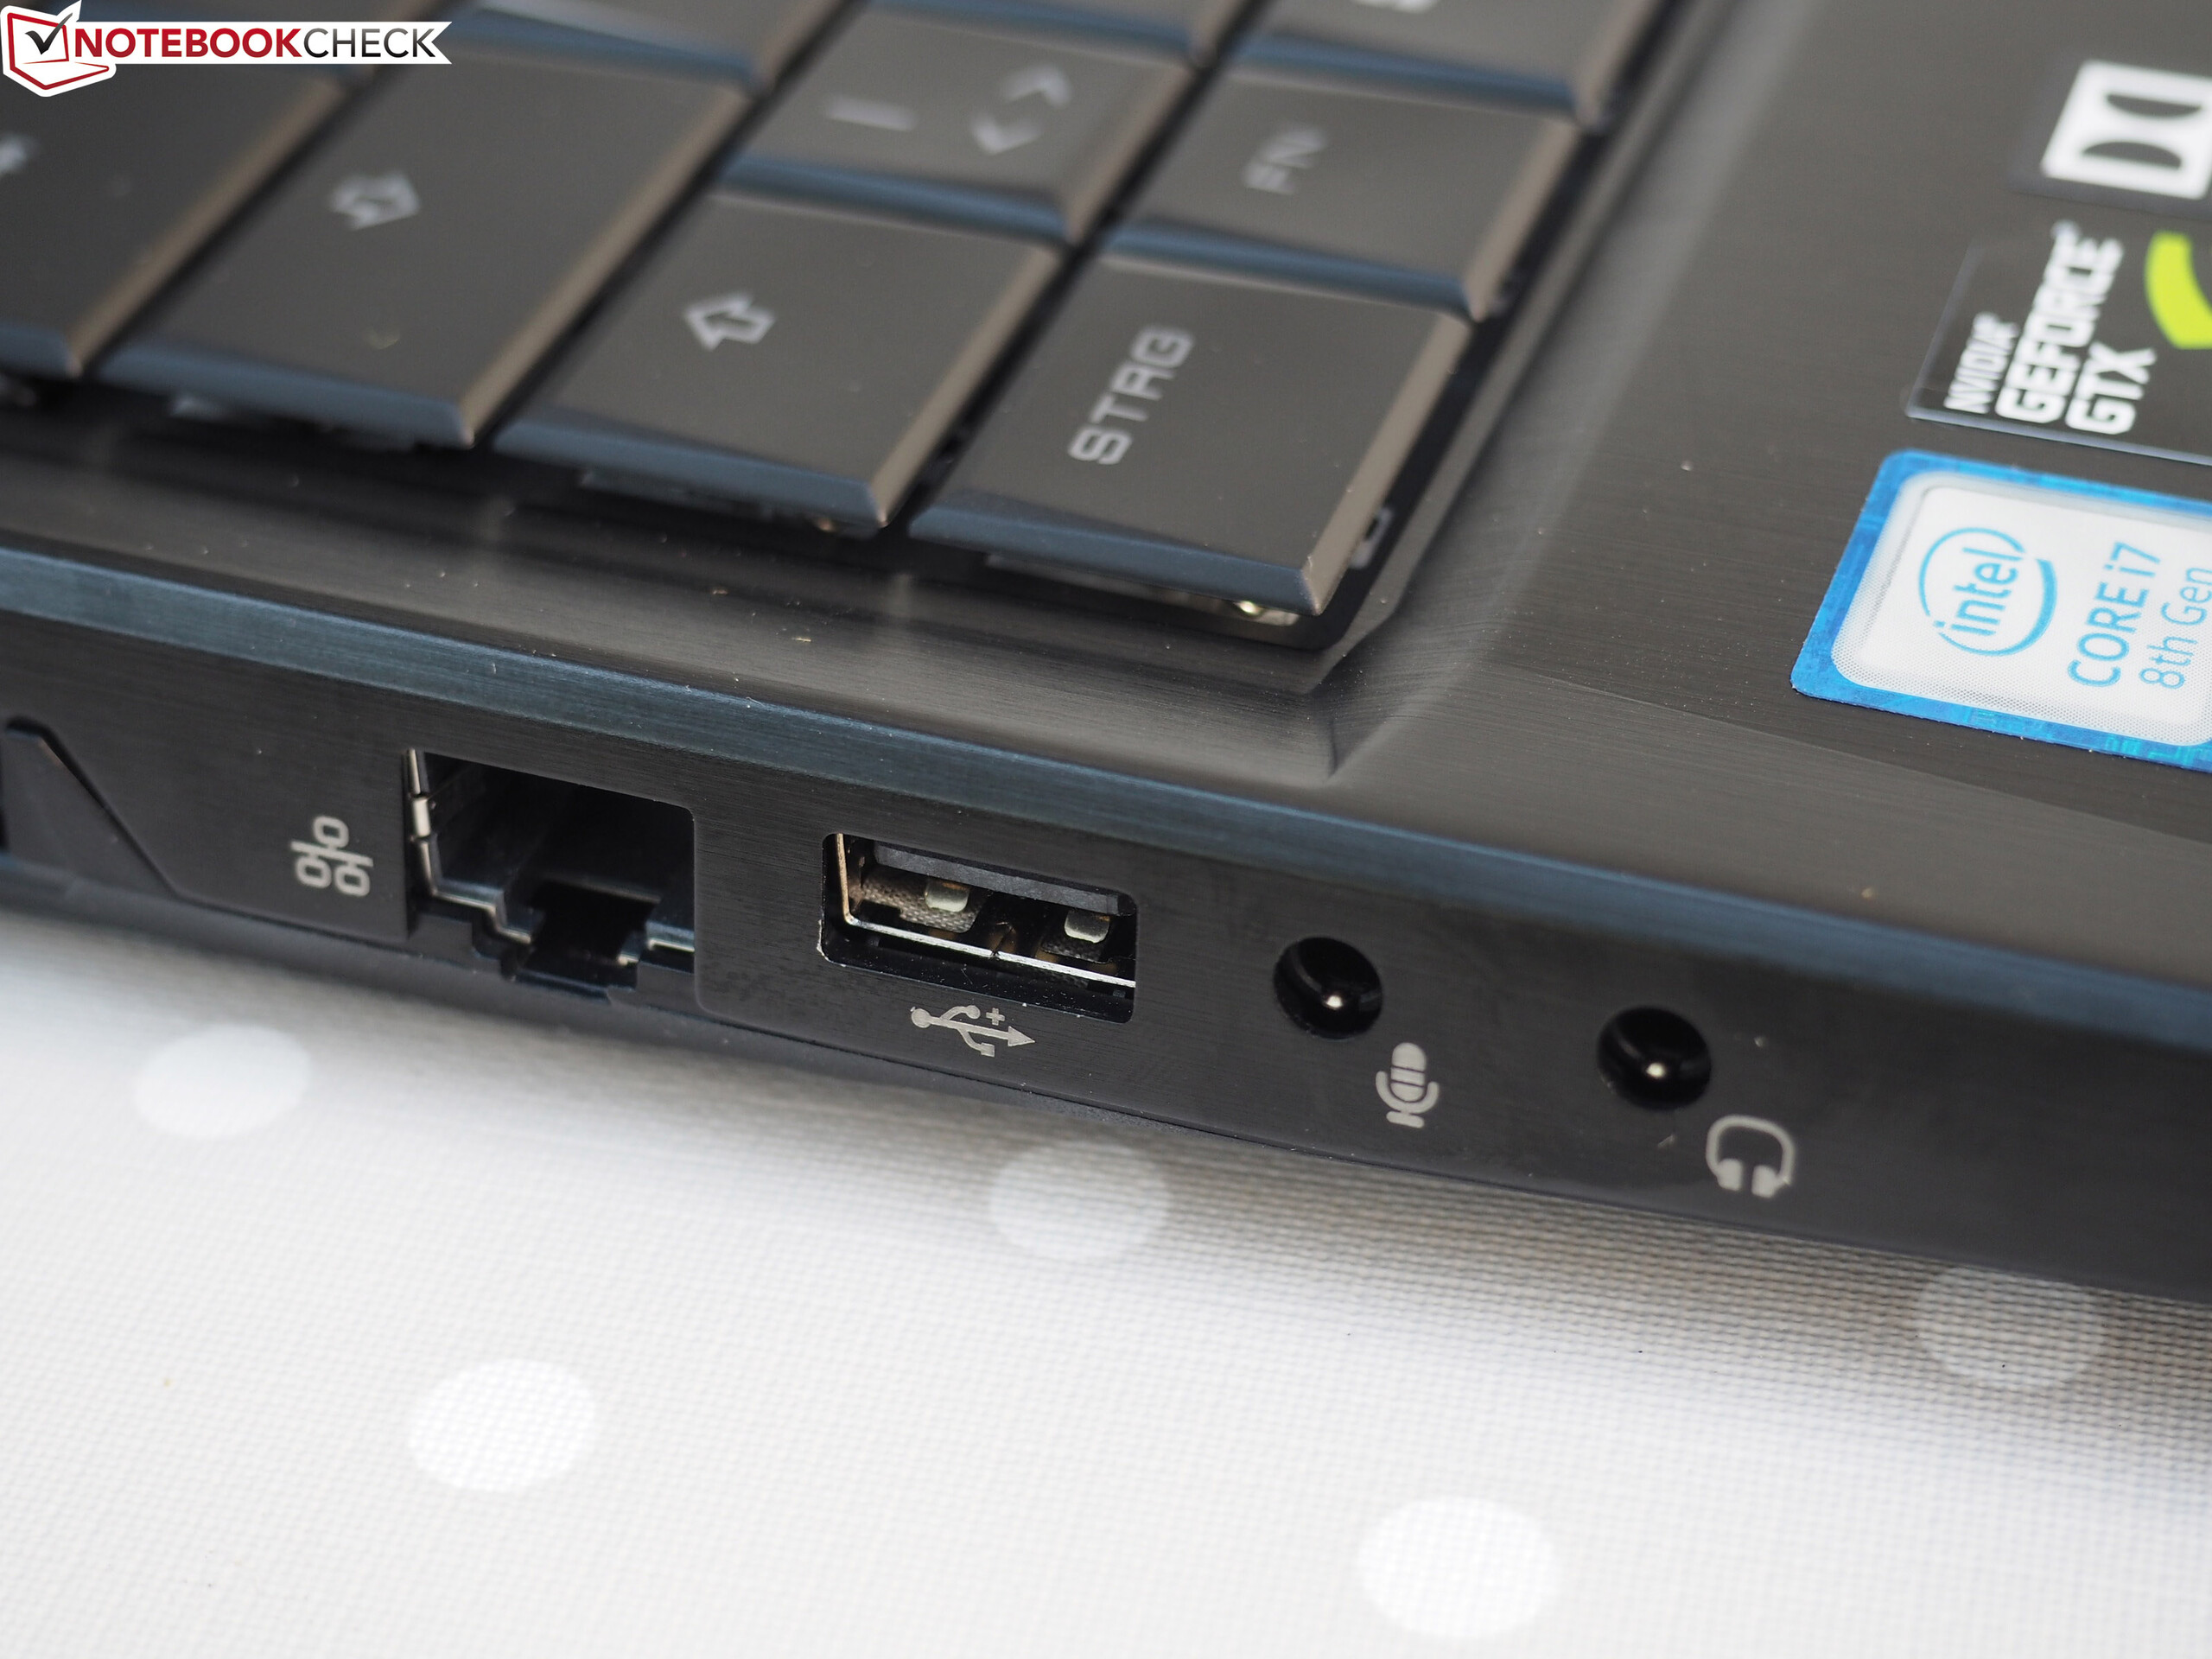
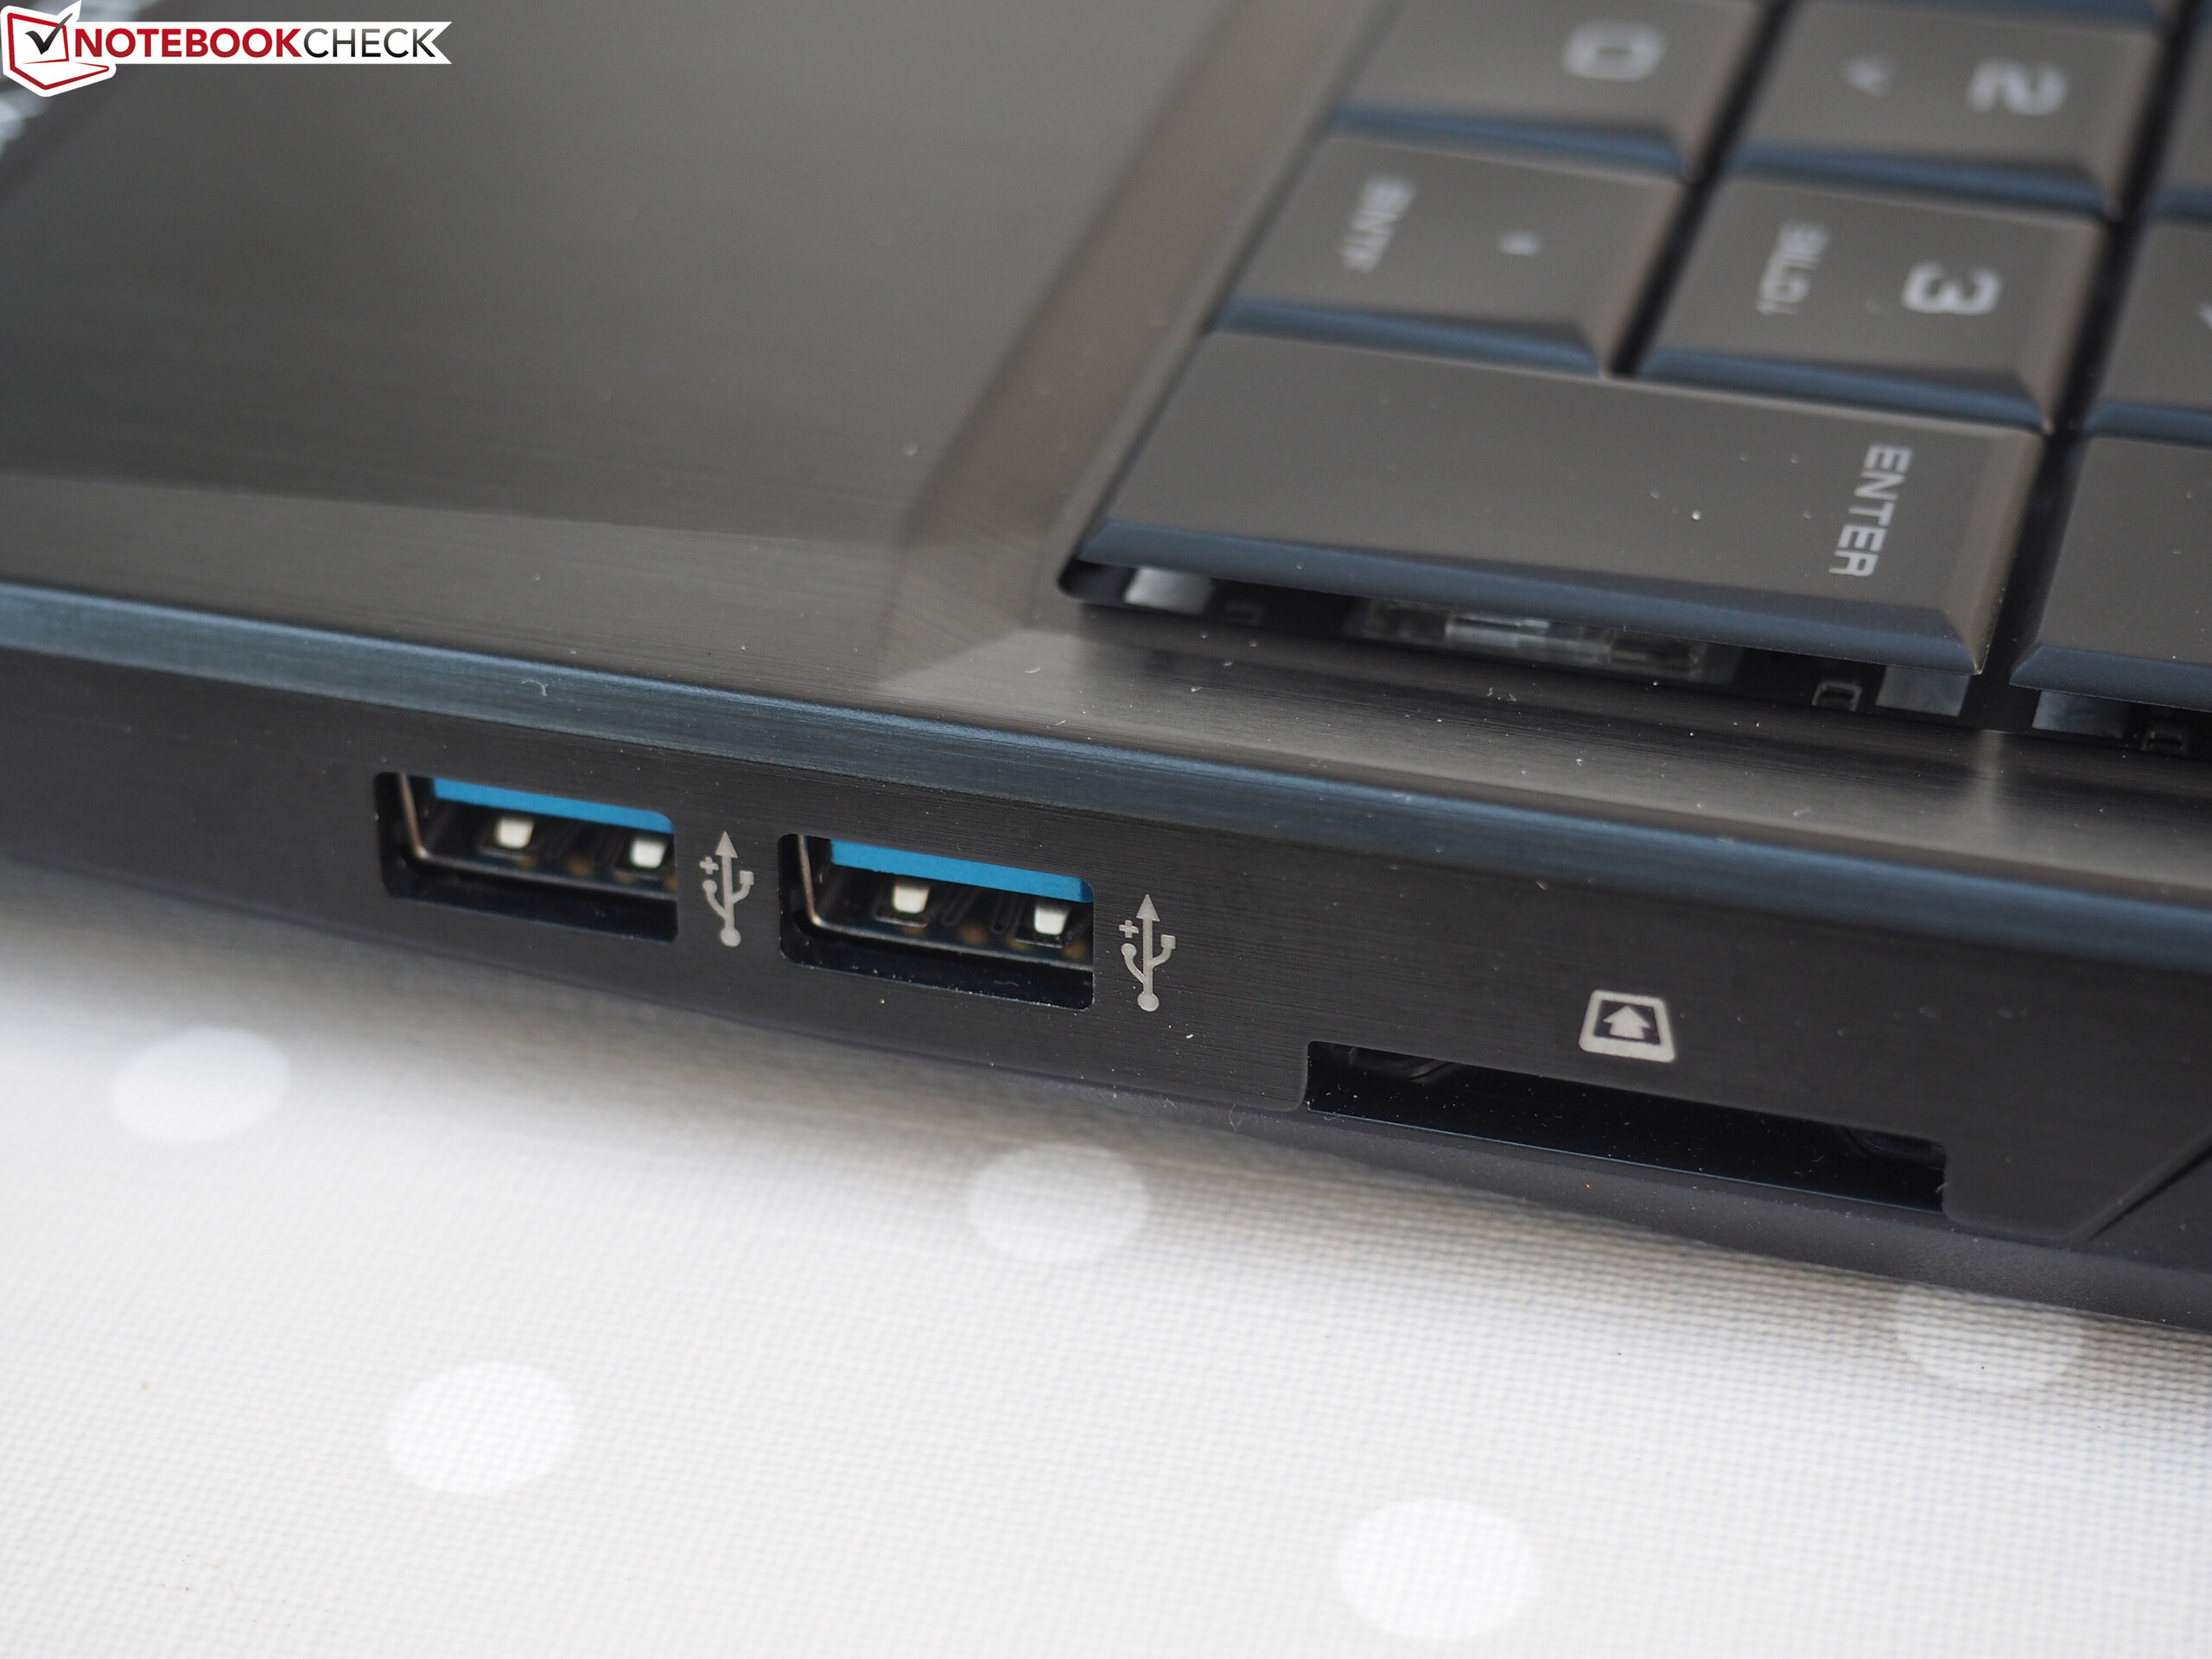
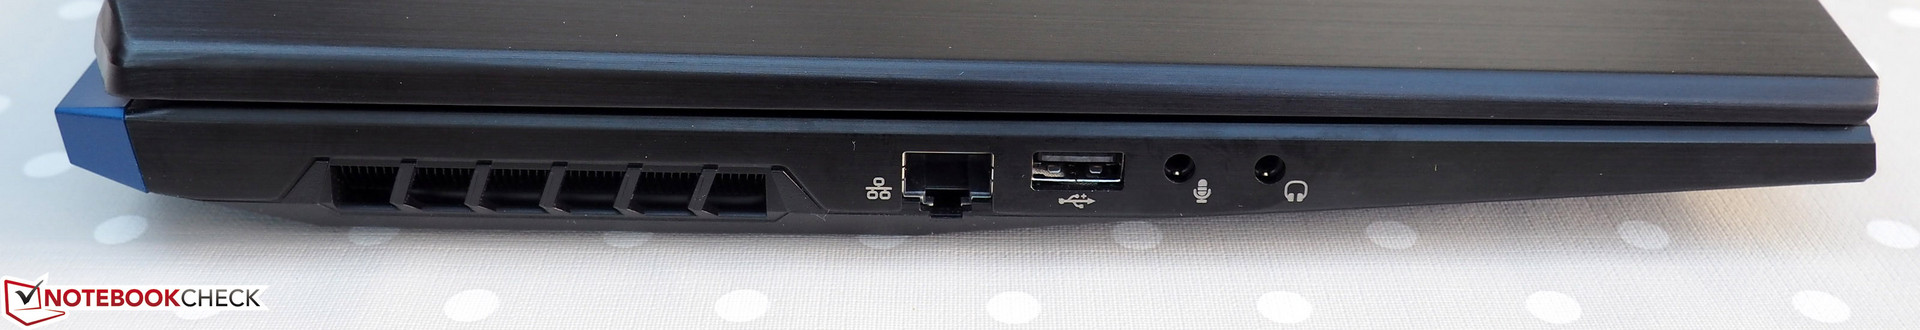
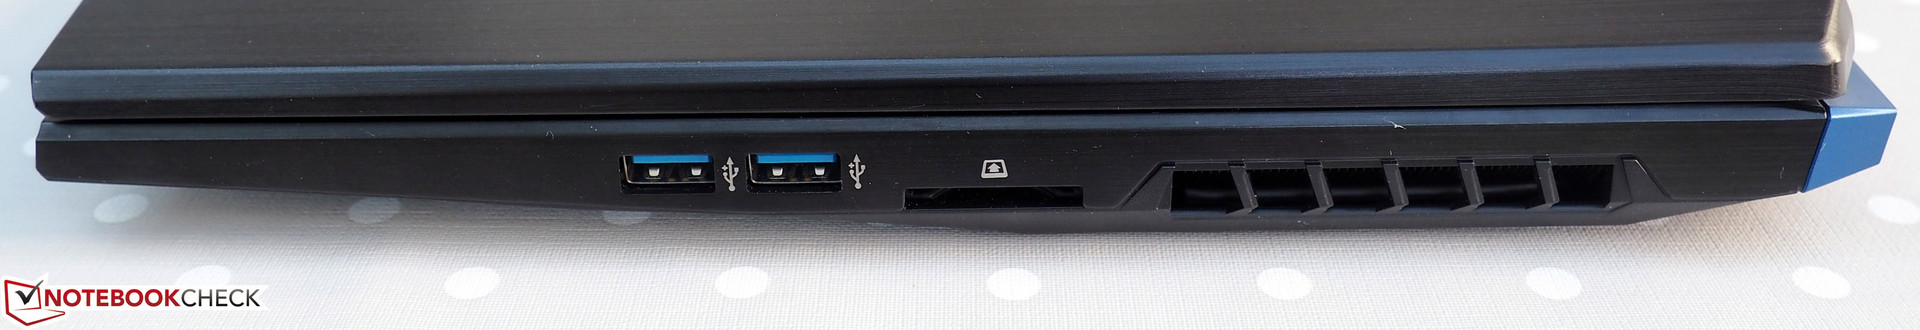
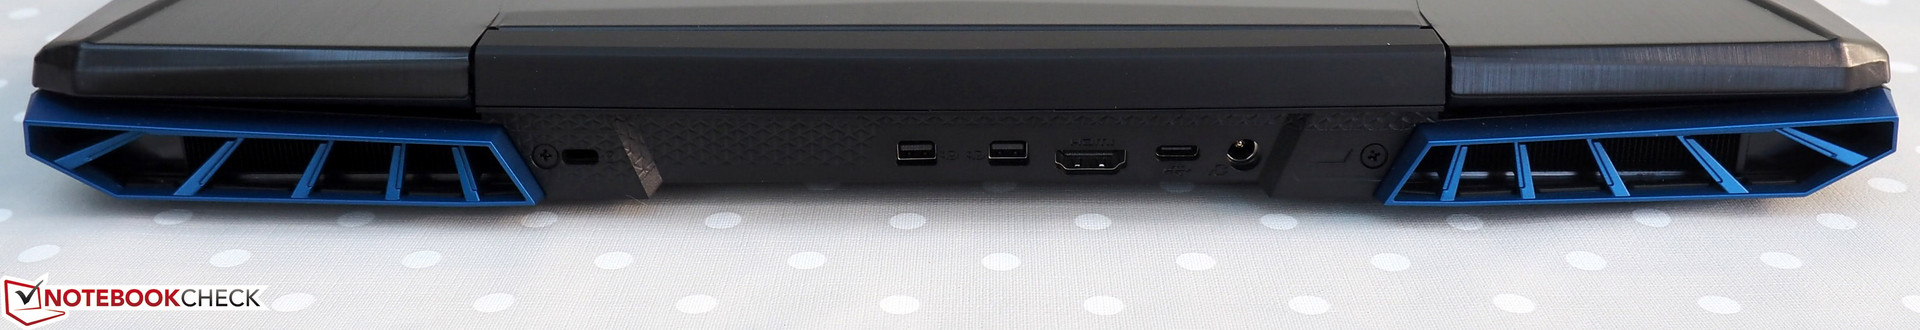
Att den har ett mekaniskt tangentbord är ett ovanligt men smart drag för det här priset. Vidare bör RGB-belysningen och det robusta höljet tilltala gamers. Högtalare och portutbud är dessutom skapliga, även om vi gärna hade sett Thunderbolt 3 eller åtminstone en USB 3.1 Gen 2-port.
Medion Erazer X6805 är en kraftfull och väldesignad budgetlaptop för spel som inte hålls tillbaka av sina tillkortakommanden.
Medion kunde också ha utrustat X6805 med en snabbare SD-kortläsare och justerat den förinställda fläktkurvan. Vidare kunde enheten dragit nytta av ett större batteri som ett alternativ istället för en HDD-enhet. Trots detta rekommenderar vi Medion Erazer X6805 helhjärtat då det är en av de bästa billiga bärbara speldatorerna som finns att få tag på.
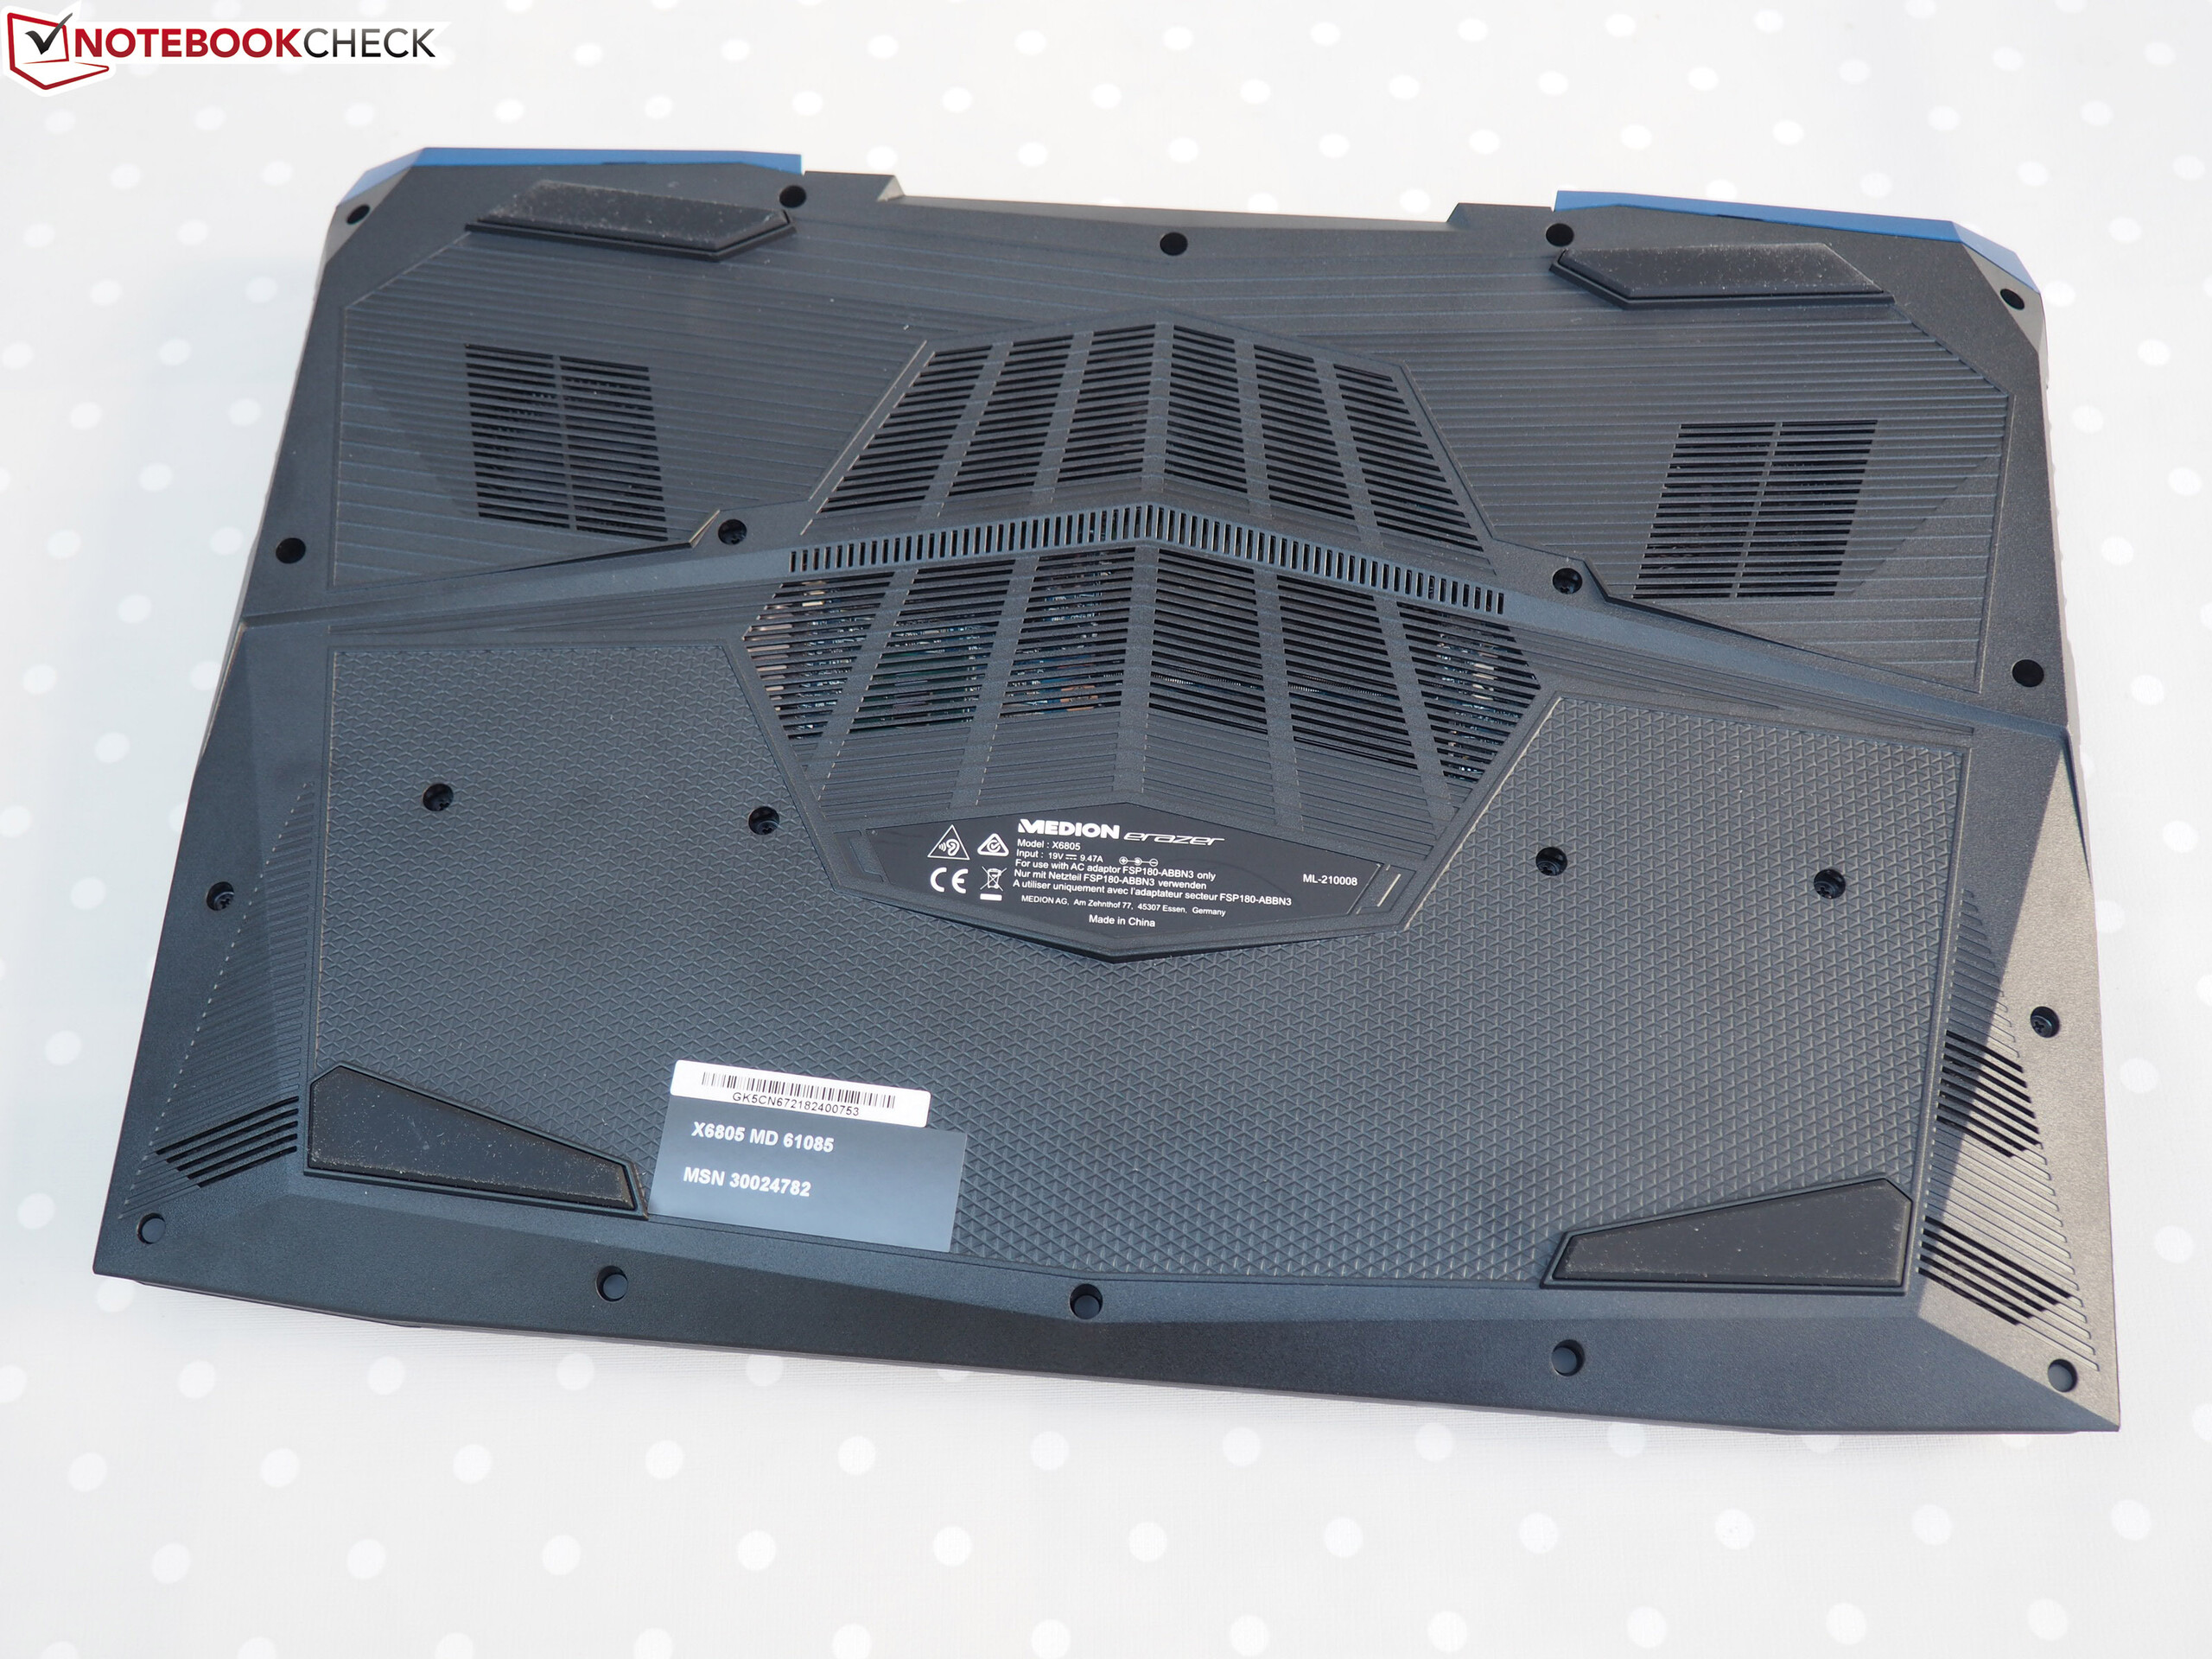
Medion Erazer X6805-MD61085
- 09/28/2018 v6 (old)
Florian Glaser
Price comparison