Test: Lenovo ThinkPad X1 Nano - Under 1 kg för en kontorsfokuserad subnotebook med LTE (Sammanfattning)
Testgrupp
Gradering | Datum | Modell | Vikt | Höjd | Storlek | Upplösning | Pris |
|---|---|---|---|---|---|---|---|
| 89.8 % v7 (old) | 02/2021 | Lenovo ThinkPad X1 Nano-20UN002UGE i7-1160G7, Iris Xe G7 96EUs | 946 g | 16 mm | 13.00" | 2160x1350 | |
| 88.1 % v7 (old) | 12/2020 | Dell XPS 13 9310 Core i7 FHD i7-1165G7, Iris Xe G7 96EUs | 1.3 kg | 14.8 mm | 13.40" | 1920x1200 | |
| 86.2 % v7 (old) | 01/2021 | Fujitsu LifeBook U9310X i5-10210U, UHD Graphics 620 | 1 kg | 17 mm | 13.30" | 1920x1080 | |
| 90.3 % v7 (old) | 04/2020 | HP Elite Dragonfly-8MK79EA i5-8265U, UHD Graphics 620 | 1.1 kg | 16.1 mm | 13.30" | 1920x1080 | |
| 91.1 % v7 (old) | 12/2020 | Apple MacBook Air Late 2020 (M1, 8 Core GPU, 8 GB RAM) M1, M1 8-Core GPU | 1.3 kg | 16.1 mm | 13.30" | 2560x1600 | |
| 89.5 % v7 (old) | Lenovo ThinkPad X13-20UGS00800 R7 PRO 4750U, Vega 7 | 1.3 kg | 16.9 mm | 13.30" | 1920x1080 |
| Networking | |
| iperf3 transmit AX12 | |
| HP Elite Dragonfly-8MK79EA | |
| Lenovo ThinkPad X1 Nano-20UN002UGE | |
| Genomsnitt Intel Wi-Fi 6 AX201 (49.8 - 1775, n=324) | |
| Dell XPS 13 9310 Core i7 FHD | |
| Lenovo ThinkPad X13-20UGS00800 | |
| Fujitsu LifeBook U9310X | |
| iperf3 receive AX12 | |
| HP Elite Dragonfly-8MK79EA | |
| Dell XPS 13 9310 Core i7 FHD | |
| Lenovo ThinkPad X13-20UGS00800 | |
| Genomsnitt Intel Wi-Fi 6 AX201 (136 - 1743, n=324) | |
| Lenovo ThinkPad X1 Nano-20UN002UGE | |
| Fujitsu LifeBook U9310X | |


| |||||||||||||||||||||||||
Distribution av ljusstyrkan: 92 %
Mitt på batteriet: 462 cd/m²
Kontrast: 1704:1 (Svärta: 0.27 cd/m²)
ΔE ColorChecker Calman: 1.1 | ∀{0.5-29.43 Ø4.73}
calibrated: 1
ΔE Greyscale Calman: 1.6 | ∀{0.09-98 Ø4.97}
99.9% sRGB (Argyll 1.6.3 3D)
65.7% AdobeRGB 1998 (Argyll 1.6.3 3D)
72% AdobeRGB 1998 (Argyll 3D)
99.9% sRGB (Argyll 3D)
70.4% Display P3 (Argyll 3D)
Gamma: 2.2
CCT: 6475 K
| Lenovo ThinkPad X1 Nano-20UN002UGE MND007ZA1-2, IPS, 2160x1350, 13" | Dell XPS 13 9310 Core i7 FHD Sharp LQ134N1, IPS, 1920x1200, 13.4" | Fujitsu LifeBook U9310X LQ133M1JW48, IPS, 1920x1080, 13.3" | HP Elite Dragonfly-8MK79EA AUO5E2D, IPS, 1920x1080, 13.3" | Apple MacBook Air 2020 M1 Entry IPS, 2560x1600, 13.3" | Lenovo ThinkPad X13-20UGS00800 B133HAK01.1, IPS LED, 1920x1080, 13.3" | |
|---|---|---|---|---|---|---|
| Display | 0% | -5% | -2% | 20% | -7% | |
| Display P3 Coverage (%) | 70.4 | 70.9 1% | 66.4 -6% | 69 -2% | 98.6 40% | 64.8 -8% |
| sRGB Coverage (%) | 99.9 | 99.1 -1% | 96.9 -3% | 99.4 -1% | 100 0% | 95.6 -4% |
| AdobeRGB 1998 Coverage (%) | 72 | 72.9 1% | 67.4 -6% | 70.9 -2% | 85.9 19% | 65.7 -9% |
| Response Times | -15% | -28% | -26% | 21% | -14% | |
| Response Time Grey 50% / Grey 80% * (ms) | 46.8 ? | 52 ? -11% | 62.4 ? -33% | 60.8 ? -30% | 31 ? 34% | 56.8 ? -21% |
| Response Time Black / White * (ms) | 28 ? | 33.2 ? -19% | 34.4 ? -23% | 33.8 ? -21% | 26.1 ? 7% | 30 ? -7% |
| PWM Frequency (Hz) | 2475 ? | 211.9 ? | 118000 ? | |||
| Screen | -45% | -29% | -10% | -5% | -86% | |
| Brightness middle (cd/m²) | 460 | 543.3 18% | 345 -25% | 411 -11% | 417 -9% | 331 -28% |
| Brightness (cd/m²) | 434 | 524 21% | 317 -27% | 388 -11% | 395 -9% | 315 -27% |
| Brightness Distribution (%) | 92 | 92 0% | 86 -7% | 87 -5% | 91 -1% | 90 -2% |
| Black Level * (cd/m²) | 0.27 | 0.38 -41% | 0.24 11% | 0.22 19% | 0.39 -44% | 0.21 22% |
| Contrast (:1) | 1704 | 1430 -16% | 1438 -16% | 1868 10% | 1069 -37% | 1576 -8% |
| Colorchecker dE 2000 * | 1.1 | 3.02 -175% | 2.7 -145% | 1.8 -64% | 1.12 -2% | 6.1 -455% |
| Colorchecker dE 2000 max. * | 4.5 | 7.61 -69% | 4.2 7% | 4.1 9% | 2.71 40% | 10 -122% |
| Colorchecker dE 2000 calibrated * | 1 | 1.23 -23% | 1 -0% | 1 -0% | 0.77 23% | 1.2 -20% |
| Greyscale dE 2000 * | 1.6 | 5 -213% | 3.3 -106% | 2.5 -56% | 1.7 -6% | 6.3 -294% |
| Gamma | 2.2 100% | 2.02 109% | 2.31 95% | 2.26 97% | 2207 0% | 2.77 79% |
| CCT | 6475 100% | 6550 99% | 7188 90% | 6448 101% | 6870 95% | 6938 94% |
| Color Space (Percent of AdobeRGB 1998) (%) | 65.7 | 66.8 2% | 62.4 -5% | 64.7 -2% | 60.7 -8% | |
| Color Space (Percent of sRGB) (%) | 99.9 | 99.6 0% | 96.9 -3% | 99.3 -1% | 95.4 -5% | |
| Totalt genomsnitt (program/inställningar) | -20% /
-33% | -21% /
-24% | -13% /
-11% | 12% /
4% | -36% /
-62% |
* ... mindre är bättre
Visa svarstider
| ↔ Svarstid svart till vitt | ||
|---|---|---|
| 28 ms ... stiga ↗ och falla ↘ kombinerat | ↗ 13.2 ms stiga | 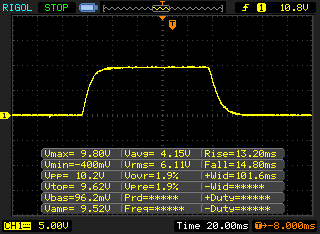 |
| ↘ 14.8 ms hösten | ||
| Skärmen visar relativt långsamma svarsfrekvenser i våra tester och kan vara för långsam för spelare. I jämförelse sträcker sig alla testade enheter från 0.1 (minst) till 240 (maximalt) ms. » 71 % av alla enheter är bättre. Detta innebär att den uppmätta svarstiden är sämre än genomsnittet av alla testade enheter (19.9 ms). | ||
| ↔ Svarstid 50 % grått till 80 % grått | ||
| 46.8 ms ... stiga ↗ och falla ↘ kombinerat | ↗ 22 ms stiga | 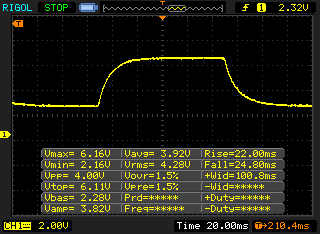 |
| ↘ 24.8 ms hösten | ||
| Skärmen visar långsamma svarsfrekvenser i våra tester och kommer att vara otillfredsställande för spelare. I jämförelse sträcker sig alla testade enheter från 0.165 (minst) till 636 (maximalt) ms. » 80 % av alla enheter är bättre. Detta innebär att den uppmätta svarstiden är sämre än genomsnittet av alla testade enheter (31.1 ms). | ||
Skärmflimmer / PWM (Puls-Width Modulation)
| Skärmflimmer / PWM upptäcktes inte | 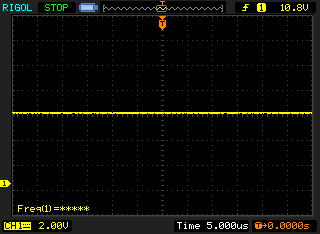 | ||
Som jämförelse: 52 % av alla testade enheter använder inte PWM för att dämpa skärmen. Om PWM upptäcktes mättes ett medelvärde av 7798 (minst: 5 - maximum: 343500) Hz. | |||
Cinebench R15: CPU Single 64Bit | CPU Multi 64Bit
Blender: v2.79 BMW27 CPU
7-Zip 18.03: 7z b 4 -mmt1 | 7z b 4
Geekbench 5.5: Single-Core | Multi-Core
HWBOT x265 Benchmark v2.2: 4k Preset
LibreOffice : 20 Documents To PDF
R Benchmark 2.5: Overall mean
| Cinebench R20 / CPU (Single Core) | |
| Genomsnitt av klass Subnotebook (128 - 832, n=57, senaste 2 åren) | |
| Dell XPS 13 9310 Core i7 FHD | |
| Lenovo ThinkPad X1 Nano-20UN002UGE | |
| Genomsnitt Intel Core i7-1160G7 (484 - 544, n=4) | |
| Lenovo ThinkPad X13-20UGS00800 | |
| Fujitsu LifeBook U9310X | |
| Apple MacBook Air 2020 M1 Entry | |
| HP Elite Dragonfly-8MK79EA | |
| Cinebench R20 / CPU (Multi Core) | |
| Genomsnitt av klass Subnotebook (579 - 8541, n=57, senaste 2 åren) | |
| Lenovo ThinkPad X13-20UGS00800 | |
| Dell XPS 13 9310 Core i7 FHD | |
| Apple MacBook Air 2020 M1 Entry | |
| Lenovo ThinkPad X1 Nano-20UN002UGE | |
| Genomsnitt Intel Core i7-1160G7 (1224 - 2068, n=4) | |
| Fujitsu LifeBook U9310X | |
| HP Elite Dragonfly-8MK79EA | |
| Cinebench R15 / CPU Single 64Bit | |
| Genomsnitt av klass Subnotebook (72.4 - 322, n=57, senaste 2 åren) | |
| Dell XPS 13 9310 Core i7 FHD | |
| Apple MacBook Air 2020 M1 Entry | |
| Lenovo ThinkPad X1 Nano-20UN002UGE | |
| Genomsnitt Intel Core i7-1160G7 (170 - 208, n=4) | |
| Lenovo ThinkPad X13-20UGS00800 | |
| Fujitsu LifeBook U9310X | |
| HP Elite Dragonfly-8MK79EA | |
| Cinebench R15 / CPU Multi 64Bit | |
| Genomsnitt av klass Subnotebook (327 - 3345, n=57, senaste 2 åren) | |
| Lenovo ThinkPad X13-20UGS00800 | |
| Apple MacBook Air 2020 M1 Entry | |
| Dell XPS 13 9310 Core i7 FHD | |
| Lenovo ThinkPad X1 Nano-20UN002UGE | |
| Genomsnitt Intel Core i7-1160G7 (753 - 864, n=4) | |
| Fujitsu LifeBook U9310X | |
| HP Elite Dragonfly-8MK79EA | |
| Blender / v2.79 BMW27 CPU | |
| HP Elite Dragonfly-8MK79EA | |
| Genomsnitt Intel Core i7-1160G7 (625 - 1115, n=4) | |
| Fujitsu LifeBook U9310X | |
| Apple MacBook Air 2020 M1 Entry | |
| Dell XPS 13 9310 Core i7 FHD | |
| Lenovo ThinkPad X1 Nano-20UN002UGE | |
| Lenovo ThinkPad X13-20UGS00800 | |
| Genomsnitt av klass Subnotebook (159 - 2271, n=58, senaste 2 åren) | |
| 7-Zip 18.03 / 7z b 4 -mmt1 | |
| Genomsnitt av klass Subnotebook (2643 - 6699, n=59, senaste 2 åren) | |
| Apple MacBook Air 2020 M1 Entry | |
| Dell XPS 13 9310 Core i7 FHD | |
| Lenovo ThinkPad X1 Nano-20UN002UGE | |
| Genomsnitt Intel Core i7-1160G7 (4448 - 4621, n=3) | |
| Lenovo ThinkPad X13-20UGS00800 | |
| Fujitsu LifeBook U9310X | |
| HP Elite Dragonfly-8MK79EA | |
| 7-Zip 18.03 / 7z b 4 | |
| Genomsnitt av klass Subnotebook (11668 - 77867, n=57, senaste 2 åren) | |
| Lenovo ThinkPad X13-20UGS00800 | |
| Apple MacBook Air 2020 M1 Entry | |
| Lenovo ThinkPad X1 Nano-20UN002UGE | |
| Dell XPS 13 9310 Core i7 FHD | |
| Genomsnitt Intel Core i7-1160G7 (15740 - 22305, n=4) | |
| Fujitsu LifeBook U9310X | |
| HP Elite Dragonfly-8MK79EA | |
| Geekbench 5.5 / Single-Core | |
| Genomsnitt av klass Subnotebook (726 - 2224, n=48, senaste 2 åren) | |
| Apple MacBook Air Late 2020 (M1, 8 Core GPU, 8 GB RAM) | |
| Apple MacBook Air 2020 M1 Entry | |
| Dell XPS 13 9310 Core i7 FHD | |
| Genomsnitt Intel Core i7-1160G7 (1406 - 1484, n=4) | |
| Lenovo ThinkPad X1 Nano-20UN002UGE | |
| Lenovo ThinkPad X13-20UGS00800 | |
| Fujitsu LifeBook U9310X | |
| Geekbench 5.5 / Multi-Core | |
| Genomsnitt av klass Subnotebook (2557 - 17218, n=48, senaste 2 åren) | |
| Apple MacBook Air 2020 M1 Entry | |
| Apple MacBook Air Late 2020 (M1, 8 Core GPU, 8 GB RAM) | |
| Dell XPS 13 9310 Core i7 FHD | |
| Lenovo ThinkPad X13-20UGS00800 | |
| Genomsnitt Intel Core i7-1160G7 (4660 - 5258, n=4) | |
| Lenovo ThinkPad X1 Nano-20UN002UGE | |
| Fujitsu LifeBook U9310X | |
| HWBOT x265 Benchmark v2.2 / 4k Preset | |
| Genomsnitt av klass Subnotebook (0.97 - 25.1, n=57, senaste 2 åren) | |
| Lenovo ThinkPad X13-20UGS00800 | |
| Lenovo ThinkPad X1 Nano-20UN002UGE | |
| Dell XPS 13 9310 Core i7 FHD | |
| Genomsnitt Intel Core i7-1160G7 (3.75 - 6.06, n=4) | |
| Fujitsu LifeBook U9310X | |
| HP Elite Dragonfly-8MK79EA | |
| LibreOffice / 20 Documents To PDF | |
| Lenovo ThinkPad X13-20UGS00800 | |
| Genomsnitt av klass Subnotebook (39.9 - 220, n=56, senaste 2 åren) | |
| Fujitsu LifeBook U9310X | |
| Genomsnitt Intel Core i7-1160G7 (49.8 - 61.3, n=4) | |
| Lenovo ThinkPad X1 Nano-20UN002UGE | |
| Dell XPS 13 9310 Core i7 FHD | |
| Apple MacBook Air 2020 M1 Entry | |
| R Benchmark 2.5 / Overall mean | |
| Apple MacBook Air 2020 M1 Entry | |
| Fujitsu LifeBook U9310X | |
| Genomsnitt Intel Core i7-1160G7 (0.64 - 0.76, n=4) | |
| Lenovo ThinkPad X1 Nano-20UN002UGE | |
| Lenovo ThinkPad X13-20UGS00800 | |
| Dell XPS 13 9310 Core i7 FHD | |
| Genomsnitt av klass Subnotebook (0.4024 - 1.456, n=58, senaste 2 åren) | |
* ... mindre är bättre
| PCMark 10 Score | 4615 poäng | |
Hjälp | ||
| DPC Latencies / LatencyMon - interrupt to process latency (max), Web, Youtube, Prime95 | |
| Fujitsu LifeBook U9310X | |
| Lenovo ThinkPad X13-20UGS00800 | |
| Lenovo ThinkPad X1 Nano-20UN002UGE | |
| Dell XPS 13 9310 Core i7 FHD | |
* ... mindre är bättre
| Lenovo ThinkPad X1 Nano-20UN002UGE WDC PC SN530 SDBPNPZ-512G | Dell XPS 13 9310 Core i7 FHD Micron 2300 512GB MTFDHBA512TDV | Fujitsu LifeBook U9310X Toshiba KBG40ZNS512G NVMe | HP Elite Dragonfly-8MK79EA Intel Optane Memory H10 with Solid State Storage 32GB + 512GB HBRPEKNX0202A(L/H) | Lenovo ThinkPad X13-20UGS00800 Samsung SSD PM981a MZVLB512HBJQ | Genomsnitt WDC PC SN530 SDBPNPZ-512G | |
|---|---|---|---|---|---|---|
| CrystalDiskMark 5.2 / 6 | -4% | -26% | -21% | 1% | -14% | |
| Write 4K (MB/s) | 269.4 | 97.5 -64% | 134.2 -50% | 88 -67% | 95.7 -64% | 170.1 ? -37% |
| Read 4K (MB/s) | 54.1 | 50.9 -6% | 53.4 -1% | 132.1 144% | 37.47 -31% | 49.4 ? -9% |
| Write Seq (MB/s) | 1739 | 1811 4% | 1216 -30% | 503 -71% | 2032 17% | 1731 ? 0% |
| Read Seq (MB/s) | 1671 | 1836 10% | 1291 -23% | 1306 -22% | 2207 32% | 1643 ? -2% |
| Write 4K Q32T1 (MB/s) | 580 | 521 -10% | 401.5 -31% | 237.3 -59% | 517 -11% | 453 ? -22% |
| Read 4K Q32T1 (MB/s) | 708 | 357.5 -50% | 491.4 -31% | 287.4 -59% | 387 -45% | 488 ? -31% |
| Write Seq Q32T1 (MB/s) | 1812 | 2879 59% | 1224 -32% | 1242 -31% | 2977 64% | 1791 ? -1% |
| Read Seq Q32T1 (MB/s) | 2485 | 3204 29% | 2314 -7% | 2480 0% | 3556 43% | 2272 ? -9% |
| AS SSD | -32% | -26% | -42% | 2% | -18% | |
| Seq Read (MB/s) | 2228 | 2091 -6% | 2030 -9% | 1096 -51% | 2553 15% | 1862 ? -16% |
| Seq Write (MB/s) | 1707 | 1396 -18% | 1071 -37% | 305 -82% | 1406 -18% | 1392 ? -18% |
| 4K Read (MB/s) | 47.12 | 49.29 5% | 49.16 4% | 62.3 32% | 48.53 3% | 42.1 ? -11% |
| 4K Write (MB/s) | 237.4 | 104.2 -56% | 117.3 -51% | 110.7 -53% | 119.6 -50% | 163.8 ? -31% |
| 4K-64 Read (MB/s) | 916 | 827 -10% | 1268 38% | 393.7 -57% | 808 -12% | 813 ? -11% |
| 4K-64 Write (MB/s) | 1245 | 1636 31% | 699 -44% | 438.5 -65% | 1846 48% | 876 ? -30% |
| Access Time Read * (ms) | 0.053 | 0.066 -25% | 0.067 -26% | 0.078 -47% | 0.062 -17% | 0.07875 ? -49% |
| Access Time Write * (ms) | 0.069 | 0.365 -429% | 0.168 -143% | 0.045 35% | 0.031 55% | 0.08225 ? -19% |
| Score Read (Points) | 1186 | 1086 -8% | 1520 28% | 566 -52% | 1112 -6% | 1041 ? -12% |
| Score Write (Points) | 1654 | 1880 14% | 923 -44% | 580 -65% | 2107 27% | 1179 ? -29% |
| Score Total (Points) | 3431 | 3499 2% | 3179 -7% | 1420 -59% | 3742 9% | 2738 ? -20% |
| Copy ISO MB/s (MB/s) | 1520 | 1544 2% | 1395 -8% | 1427 ? -6% | ||
| Copy Program MB/s (MB/s) | 546 | 613 12% | 491.8 -10% | 612 ? 12% | ||
| Copy Game MB/s (MB/s) | 1080 | 1451 34% | 948 -12% | 1001 ? -7% | ||
| Totalt genomsnitt (program/inställningar) | -18% /
-22% | -26% /
-26% | -32% /
-33% | 2% /
1% | -16% /
-16% |
* ... mindre är bättre

DiskSpd Read Loop, Queue Depth 8
| 3DMark 11 - 1280x720 Performance GPU | |
| Genomsnitt av klass Subnotebook (995 - 18489, n=55, senaste 2 åren) | |
| Dell XPS 13 9310 Core i7 FHD | |
| Genomsnitt Intel Iris Xe Graphics G7 96EUs (2867 - 7676, n=209) | |
| Lenovo ThinkPad X1 Nano-20UN002UGE | |
| Lenovo ThinkPad X13-20UGS00800 | |
| Fujitsu LifeBook U9310X | |
| HP Elite Dragonfly-8MK79EA | |
| 3DMark | |
| 1920x1080 Fire Strike Graphics | |
| Genomsnitt av klass Subnotebook (832 - 16347, n=56, senaste 2 åren) | |
| Genomsnitt Intel Iris Xe Graphics G7 96EUs (2286 - 6624, n=222) | |
| Lenovo ThinkPad X1 Nano-20UN002UGE | |
| Dell XPS 13 9310 Core i7 FHD | |
| Lenovo ThinkPad X13-20UGS00800 | |
| HP Elite Dragonfly-8MK79EA | |
| Fujitsu LifeBook U9310X | |
| 2560x1440 Time Spy Graphics | |
| Genomsnitt av klass Subnotebook (804 - 6288, n=55, senaste 2 åren) | |
| Genomsnitt Intel Iris Xe Graphics G7 96EUs (707 - 1890, n=218) | |
| Lenovo ThinkPad X1 Nano-20UN002UGE | |
| Dell XPS 13 9310 Core i7 FHD | |
| Lenovo ThinkPad X13-20UGS00800 | |
| HP Elite Dragonfly-8MK79EA | |
| 3DMark 11 Performance | 5870 poäng | |
| 3DMark Fire Strike Score | 3859 poäng | |
| 3DMark Time Spy Score | 1401 poäng | |
Hjälp | ||
| låg | med. | hög | ultra | |
|---|---|---|---|---|
| The Witcher 3 (2015) | 78.5 | 45.9 | 26 | 11 |
| Dota 2 Reborn (2015) | 76.3 | 67.7 | 44 | 35.8 |
| X-Plane 11.11 (2018) | 28.8 | 28.6 | 26.7 | |
| Far Cry 5 (2018) | 47 | 23 | 20 | 17 |
| F1 2020 (2020) | 68 | 38 | 27 | 19 |
Ljudnivå
| Låg belastning |
| 24.9 / 26.3 / 31.8 dB(A) |
| Hög belastning |
| 34.3 / 37.5 dB(A) |
 | ||
30 dB tyst 40 dB(A) hörbar 50 dB(A) högt ljud |
||
min: | ||
| Lenovo ThinkPad X1 Nano-20UN002UGE Iris Xe G7 96EUs, i7-1160G7, WDC PC SN530 SDBPNPZ-512G | Dell XPS 13 9310 Core i7 FHD Iris Xe G7 96EUs, i7-1165G7, Micron 2300 512GB MTFDHBA512TDV | Fujitsu LifeBook U9310X UHD Graphics 620, i5-10210U, Toshiba KBG40ZNS512G NVMe | HP Elite Dragonfly-8MK79EA UHD Graphics 620, i5-8265U, Intel Optane Memory H10 with Solid State Storage 32GB + 512GB HBRPEKNX0202A(L/H) | Lenovo ThinkPad X13-20UGS00800 Vega 7, R7 PRO 4750U, Samsung SSD PM981a MZVLB512HBJQ | |
|---|---|---|---|---|---|
| Noise | 5% | -5% | -4% | -2% | |
| av / miljö * (dB) | 24.9 | 25.7 -3% | 29.4 -18% | 29.5 -18% | 29.1 -17% |
| Idle Minimum * (dB) | 24.9 | 25.7 -3% | 29.4 -18% | 29.5 -18% | 29.1 -17% |
| Idle Average * (dB) | 26.3 | 25.7 2% | 29.4 -12% | 30 -14% | 29.1 -11% |
| Idle Maximum * (dB) | 31.8 | 25.9 19% | 30.7 3% | 30.3 5% | 29.1 8% |
| Load Average * (dB) | 34.3 | 26.2 24% | 32.6 5% | 31.6 8% | 31.1 9% |
| Witcher 3 ultra * (dB) | 34.3 | 36.5 -6% | |||
| Load Maximum * (dB) | 37.5 | 36.6 2% | 33.7 10% | 31.6 16% | 31.8 15% |
* ... mindre är bättre
(±) Den maximala temperaturen på ovansidan är 42.2 °C / 108 F, jämfört med genomsnittet av 35.9 °C / 97 F , allt från 21.4 till 59 °C för klassen Subnotebook.
(-) Botten värms upp till maximalt 47.5 °C / 118 F, jämfört med genomsnittet av 39.2 °C / 103 F
(+) Vid tomgångsbruk är medeltemperaturen för ovansidan 23.6 °C / 74 F, jämfört med enhetsgenomsnittet på 30.8 °C / ### class_avg_f### F.
(±) När du spelar The Witcher 3 är medeltemperaturen för ovansidan 36.7 °C / 98 F, jämfört med enhetsgenomsnittet på 30.8 °C / ## #class_avg_f### F.
(+) Handledsstöden och pekplattan är kallare än hudtemperaturen med maximalt 31.2 °C / 88.2 F och är därför svala att ta på.
(-) Medeltemperaturen för handledsstödsområdet på liknande enheter var 28.2 °C / 82.8 F (-3 °C / -5.4 F).
Lenovo ThinkPad X1 Nano-20UN002UGE ljudanalys
(+) | högtalare kan spela relativt högt (86.4 dB)
Bas 100 - 315 Hz
(±) | reducerad bas - i genomsnitt 14.6% lägre än medianen
(±) | linjäriteten för basen är genomsnittlig (9.3% delta till föregående frekvens)
Mellan 400 - 2000 Hz
(+) | balanserad mellan - endast 3.8% från medianen
(+) | mids är linjära (6.4% delta till föregående frekvens)
Högsta 2 - 16 kHz
(+) | balanserade toppar - endast 2.2% från medianen
(+) | toppar är linjära (3.5% delta till föregående frekvens)
Totalt 100 - 16 000 Hz
(+) | det totala ljudet är linjärt (11.9% skillnad mot median)
Jämfört med samma klass
» 13% av alla testade enheter i den här klassen var bättre, 5% liknande, 82% sämre
» Den bästa hade ett delta på 5%, genomsnittet var 18%, sämst var 53%
Jämfört med alla testade enheter
» 9% av alla testade enheter var bättre, 2% liknande, 89% sämre
» Den bästa hade ett delta på 4%, genomsnittet var 24%, sämst var 134%
Dell XPS 13 9310 Core i7 FHD ljudanalys
(+) | högtalare kan spela relativt högt (84.6 dB)
Bas 100 - 315 Hz
(-) | nästan ingen bas - i genomsnitt 16.1% lägre än medianen
(±) | linjäriteten för basen är genomsnittlig (13.1% delta till föregående frekvens)
Mellan 400 - 2000 Hz
(+) | balanserad mellan - endast 2.6% från medianen
(+) | mids är linjära (4.6% delta till föregående frekvens)
Högsta 2 - 16 kHz
(+) | balanserade toppar - endast 1.3% från medianen
(+) | toppar är linjära (4% delta till föregående frekvens)
Totalt 100 - 16 000 Hz
(+) | det totala ljudet är linjärt (10.7% skillnad mot median)
Jämfört med samma klass
» 9% av alla testade enheter i den här klassen var bättre, 3% liknande, 88% sämre
» Den bästa hade ett delta på 5%, genomsnittet var 18%, sämst var 53%
Jämfört med alla testade enheter
» 6% av alla testade enheter var bättre, 2% liknande, 93% sämre
» Den bästa hade ett delta på 4%, genomsnittet var 24%, sämst var 134%
Apple MacBook Air 2020 M1 Entry ljudanalys
(±) | högtalarljudstyrkan är genomsnittlig men bra (79.6 dB)
Bas 100 - 315 Hz
(±) | reducerad bas - i genomsnitt 7.1% lägre än medianen
(±) | linjäriteten för basen är genomsnittlig (9.5% delta till föregående frekvens)
Mellan 400 - 2000 Hz
(+) | balanserad mellan - endast 2.2% från medianen
(+) | mids är linjära (5.3% delta till föregående frekvens)
Högsta 2 - 16 kHz
(+) | balanserade toppar - endast 2.3% från medianen
(+) | toppar är linjära (4% delta till föregående frekvens)
Totalt 100 - 16 000 Hz
(+) | det totala ljudet är linjärt (8.7% skillnad mot median)
Jämfört med samma klass
» 3% av alla testade enheter i den här klassen var bättre, 1% liknande, 96% sämre
» Den bästa hade ett delta på 5%, genomsnittet var 18%, sämst var 53%
Jämfört med alla testade enheter
» 3% av alla testade enheter var bättre, 1% liknande, 97% sämre
» Den bästa hade ett delta på 4%, genomsnittet var 24%, sämst var 134%
| Av/Standby | |
| Låg belastning | |
| Hög belastning |
|
Förklaring:
min: | |
| Lenovo ThinkPad X1 Nano-20UN002UGE i7-1160G7, Iris Xe G7 96EUs, WDC PC SN530 SDBPNPZ-512G, IPS, 2160x1350, 13" | Dell XPS 13 9310 Core i7 FHD i7-1165G7, Iris Xe G7 96EUs, Micron 2300 512GB MTFDHBA512TDV, IPS, 1920x1200, 13.4" | Fujitsu LifeBook U9310X i5-10210U, UHD Graphics 620, Toshiba KBG40ZNS512G NVMe, IPS, 1920x1080, 13.3" | HP Elite Dragonfly-8MK79EA i5-8265U, UHD Graphics 620, Intel Optane Memory H10 with Solid State Storage 32GB + 512GB HBRPEKNX0202A(L/H), IPS, 1920x1080, 13.3" | Apple MacBook Air 2020 M1 Entry M1, M1 7-Core GPU, Apple SSD AP0256Q, IPS, 2560x1600, 13.3" | Lenovo ThinkPad X13-20UGS00800 R7 PRO 4750U, Vega 7, Samsung SSD PM981a MZVLB512HBJQ, IPS LED, 1920x1080, 13.3" | Genomsnitt Intel Iris Xe Graphics G7 96EUs | Genomsnitt av klass Subnotebook | |
|---|---|---|---|---|---|---|---|---|
| Power Consumption | -6% | -1% | 3% | 23% | -29% | -43% | -16% | |
| Idle Minimum * (Watt) | 3.3 | 3.9 -18% | 2.9 12% | 3.5 -6% | 1.9 42% | 6 -82% | 5.51 ? -67% | 3.82 ? -16% |
| Idle Average * (Watt) | 5.7 | 5.9 -4% | 5.8 -2% | 5.1 11% | 6.4 -12% | 8.9 -56% | 8.66 ? -52% | 6.61 ? -16% |
| Idle Maximum * (Watt) | 9.1 | 6.3 31% | 9.6 -5% | 8.1 11% | 7 23% | 11.3 -24% | 10.9 ? -20% | 7.99 ? 12% |
| Load Average * (Watt) | 29.6 | 39.7 -34% | 34.6 -17% | 35.6 -20% | 25 16% | 34.2 -16% | 45.6 ? -54% | 41.9 ? -42% |
| Witcher 3 ultra * (Watt) | 27.7 | 34.8 -26% | ||||||
| Load Maximum * (Watt) | 55.1 | 47.5 14% | 50.7 8% | 44.7 19% | 30.3 45% | 37.2 32% | 67.8 ? -23% | 64.1 ? -16% |
* ... mindre är bättre
| Lenovo ThinkPad X1 Nano-20UN002UGE i7-1160G7, Iris Xe G7 96EUs, 48.2 Wh | Dell XPS 13 9310 Core i7 FHD i7-1165G7, Iris Xe G7 96EUs, 52 Wh | Fujitsu LifeBook U9310X i5-10210U, UHD Graphics 620, 50 Wh | HP Elite Dragonfly-8MK79EA i5-8265U, UHD Graphics 620, 56.2 Wh | Apple MacBook Air 2020 M1 Entry M1, M1 7-Core GPU, 49.9 Wh | Lenovo ThinkPad X13-20UGS00800 R7 PRO 4750U, Vega 7, 48 Wh | Genomsnitt av klass Subnotebook | |
|---|---|---|---|---|---|---|---|
| Batteridrifttid | 56% | 56% | 18% | 62% | -21% | 21% | |
| H.264 (h) | 15.4 | 12 -22% | 8.3 -46% | 15.6 ? 1% | |||
| WiFi v1.3 (h) | 9.9 | 11 11% | 11.6 17% | 10.1 2% | 16 62% | 8.7 -12% | 14 ? 41% |
| Load (h) | 1.6 | 3.2 100% | 3.1 94% | 2.8 75% | 1.5 -6% | 1.946 ? 22% |
För
Emot
Omdöme - X1 Nano övertygar på många sätt
Läs den fullständiga versionen av den här recensionen på engelska här.
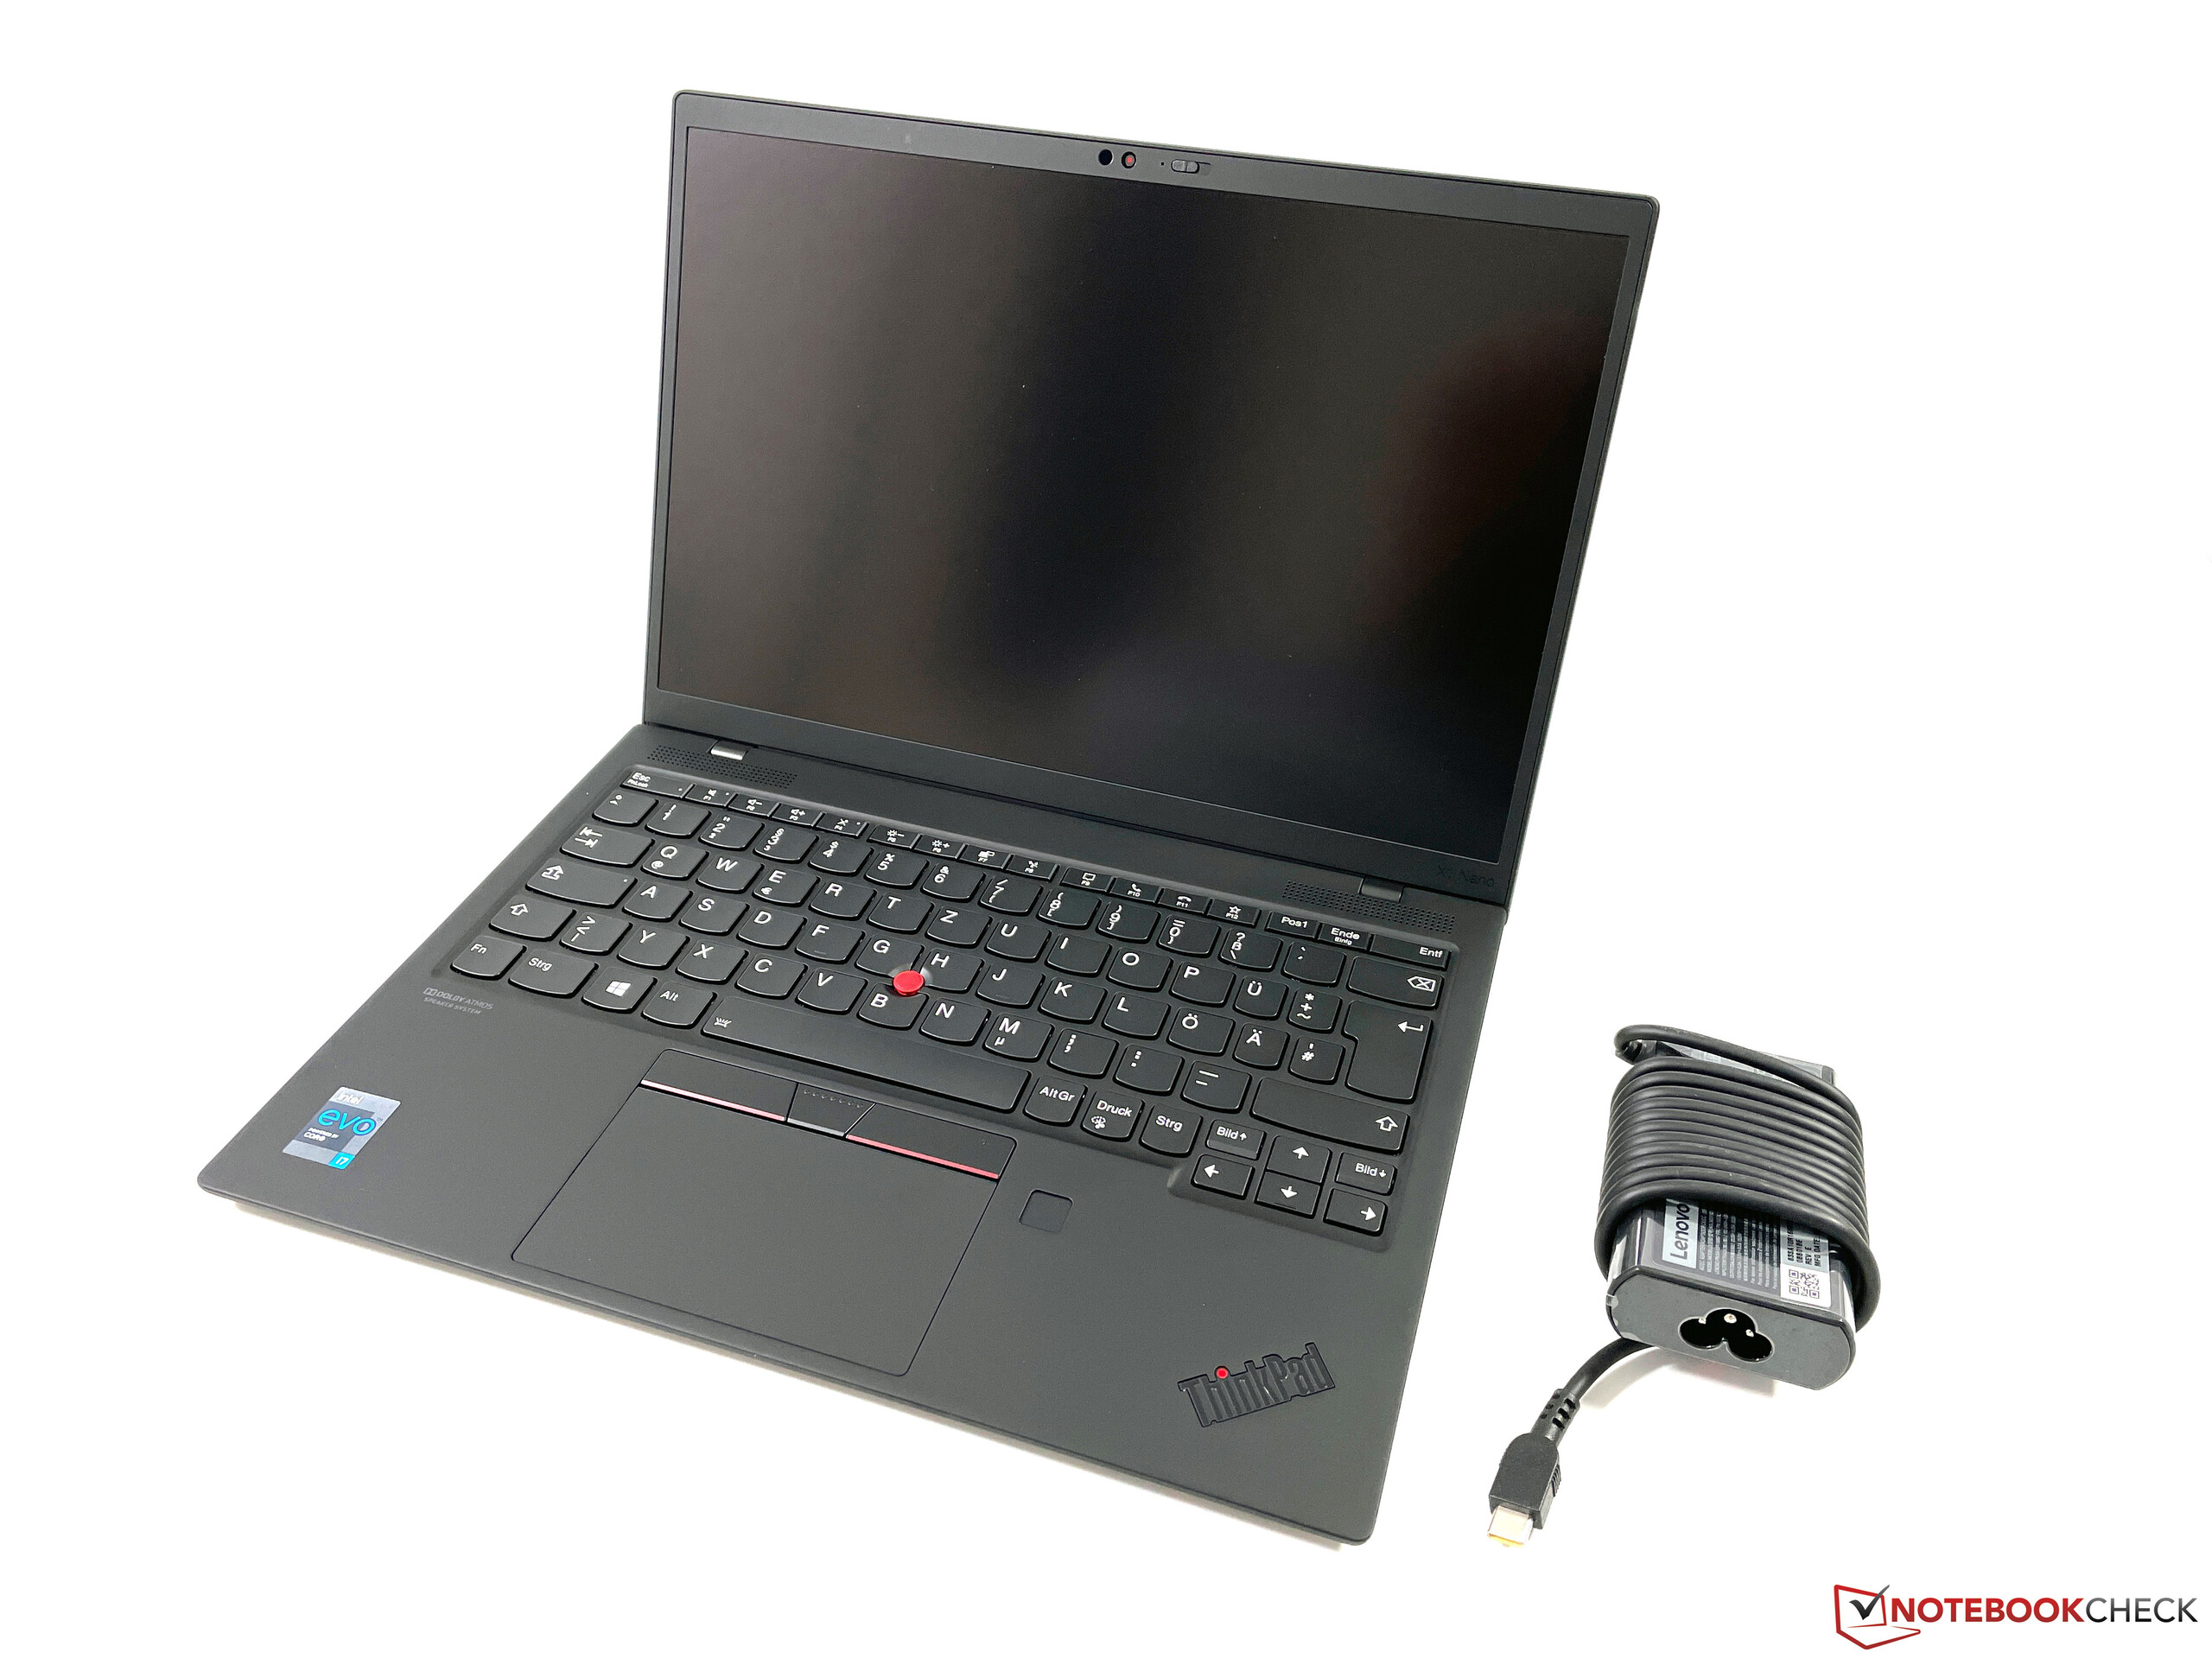
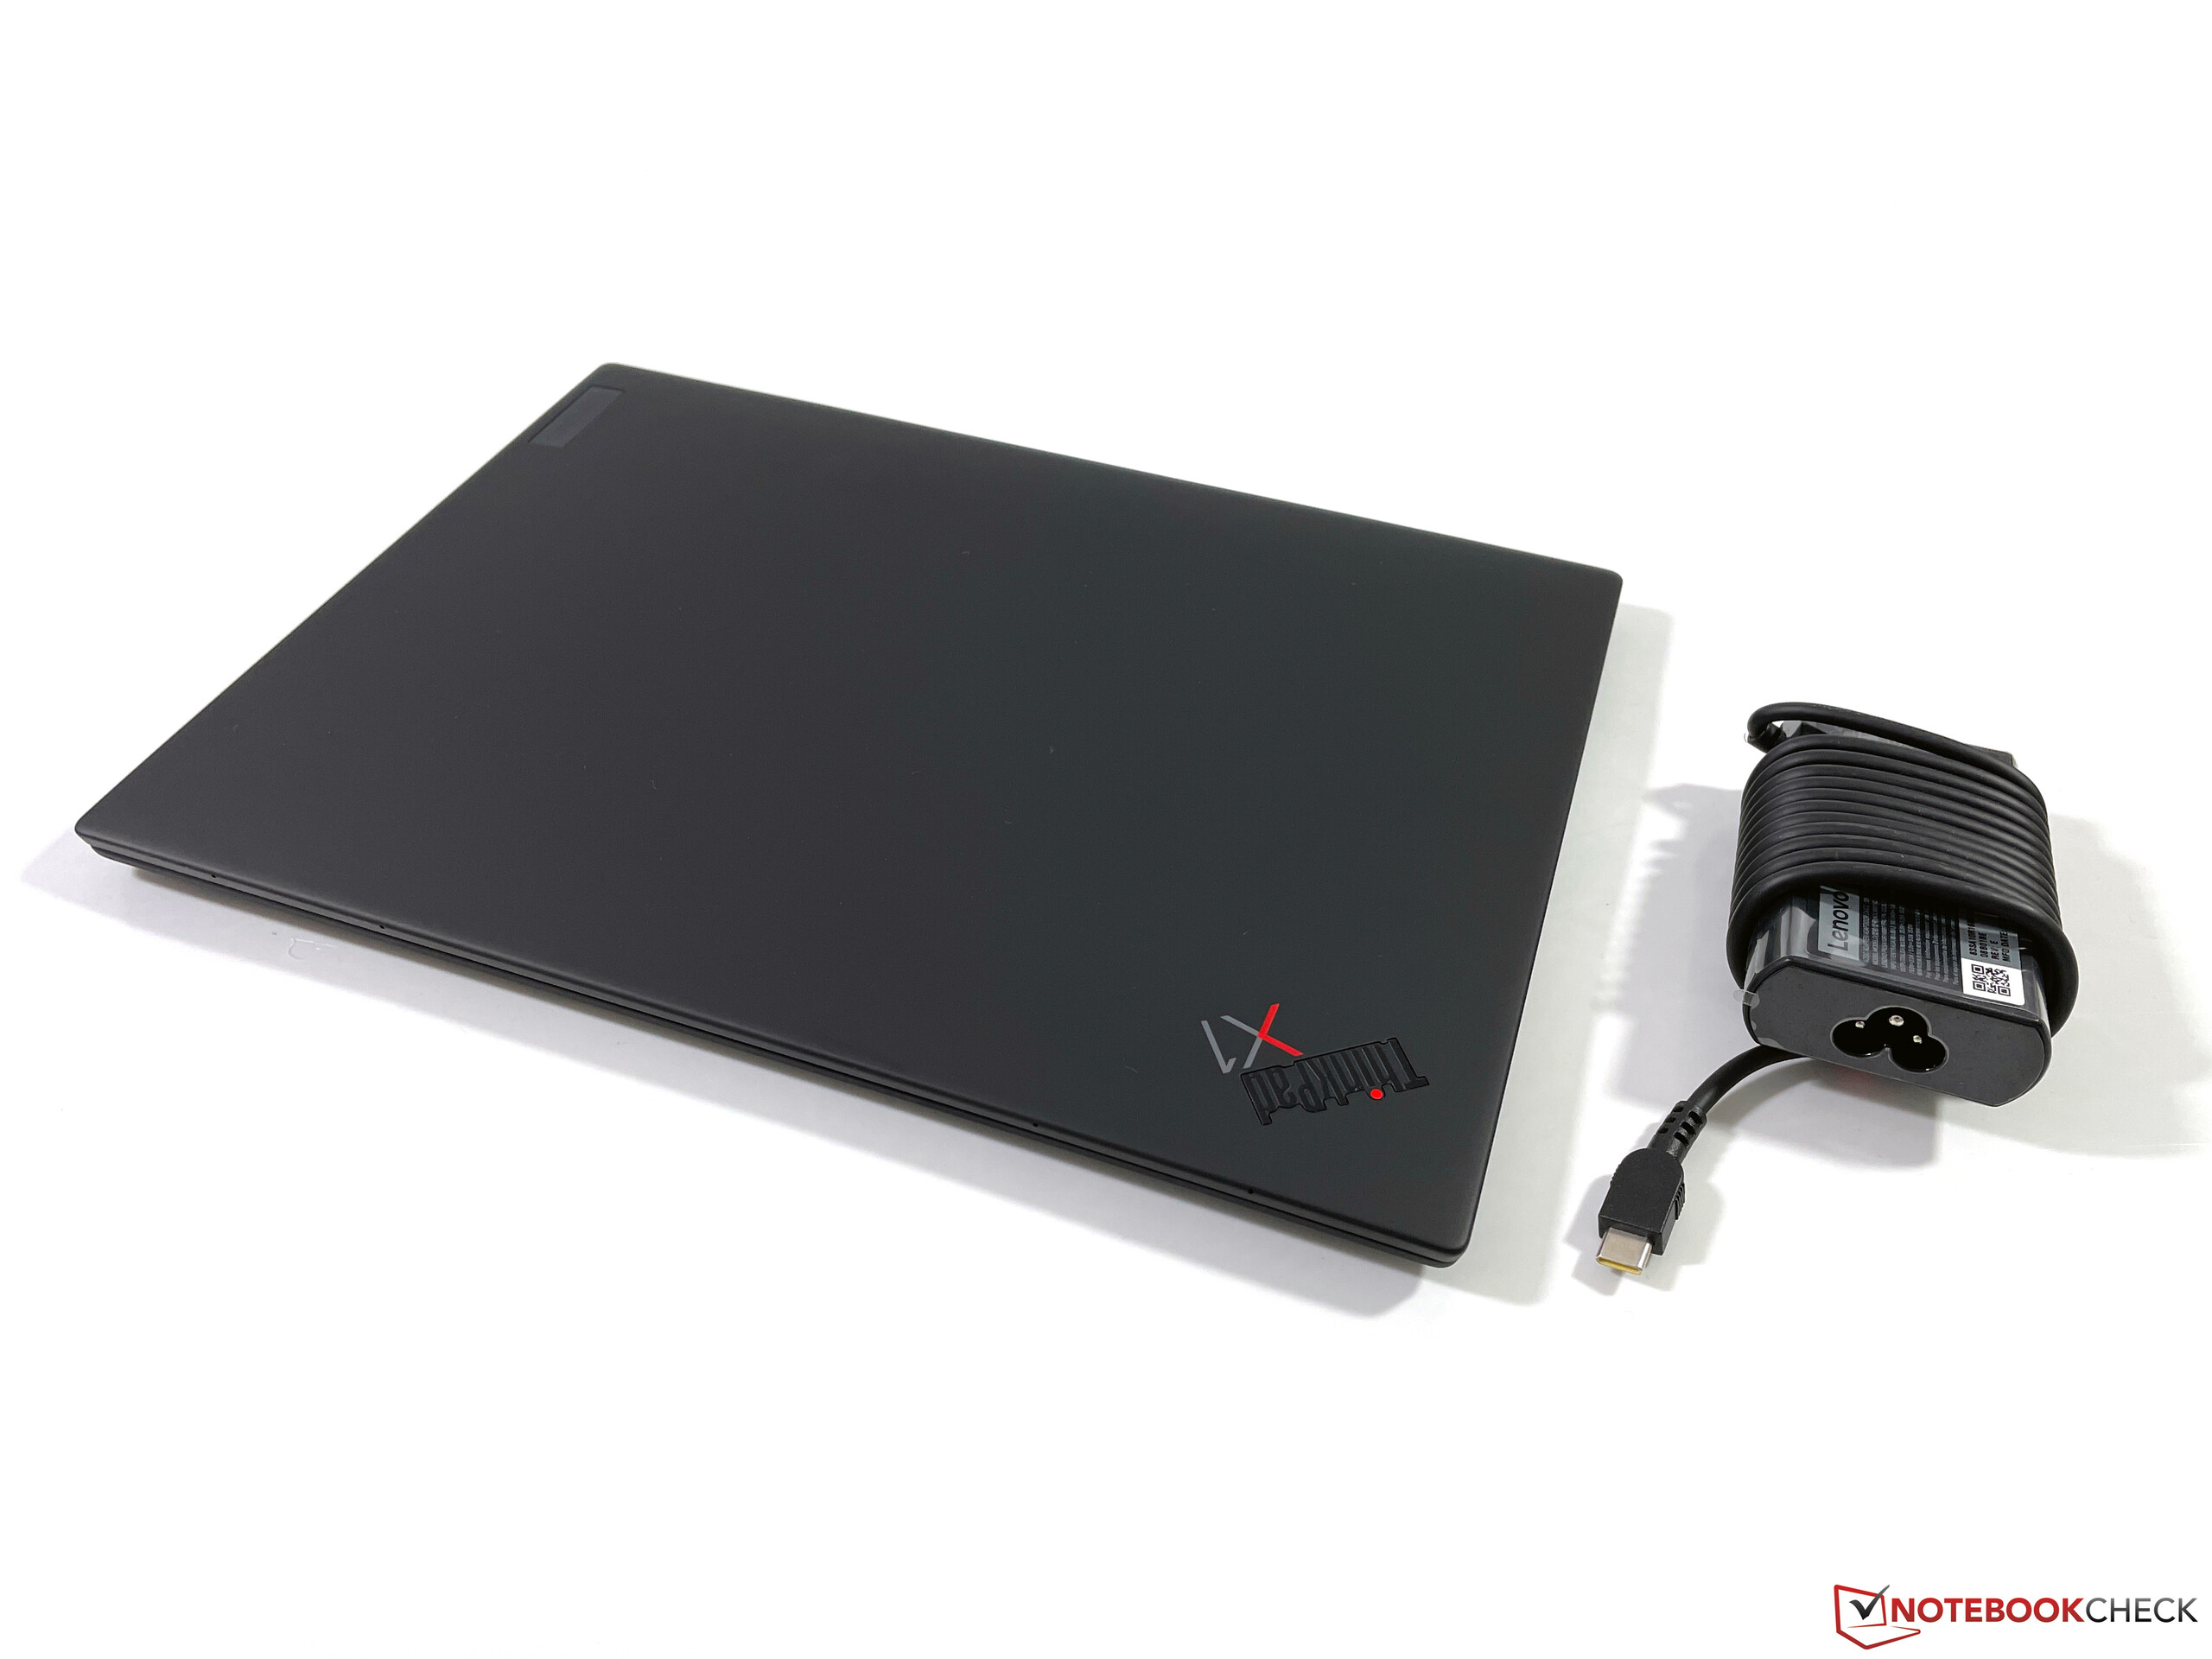
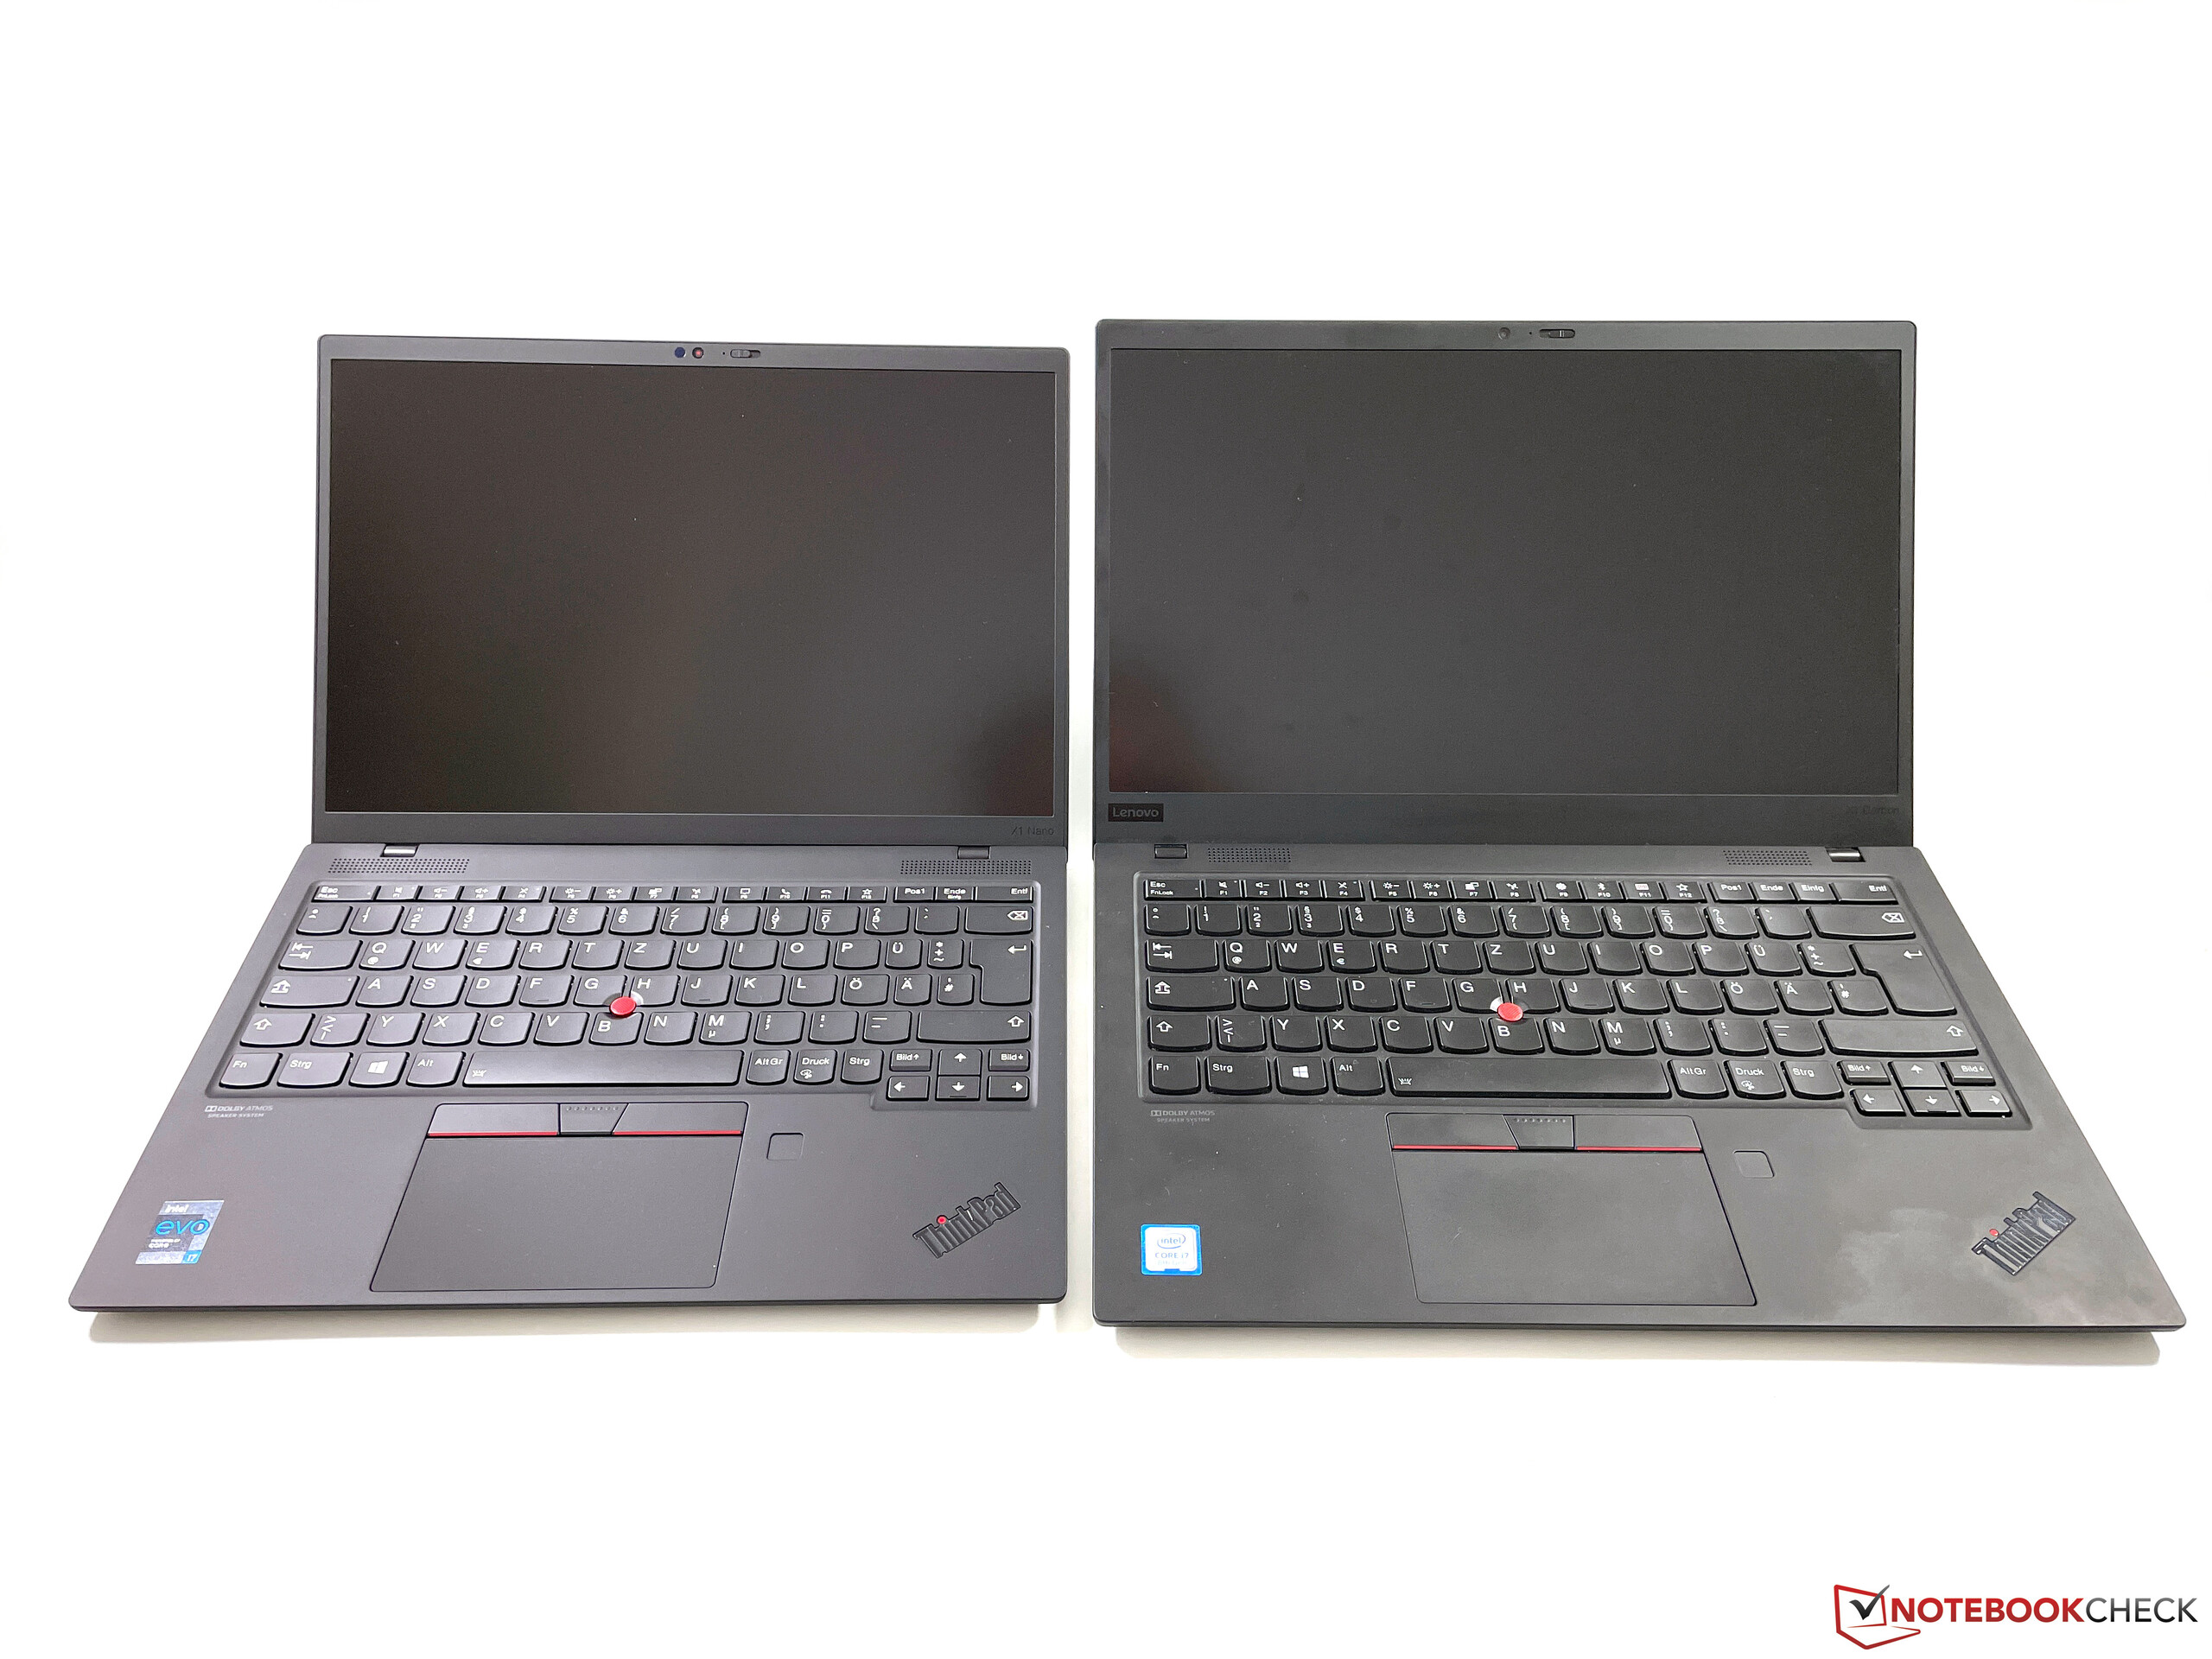
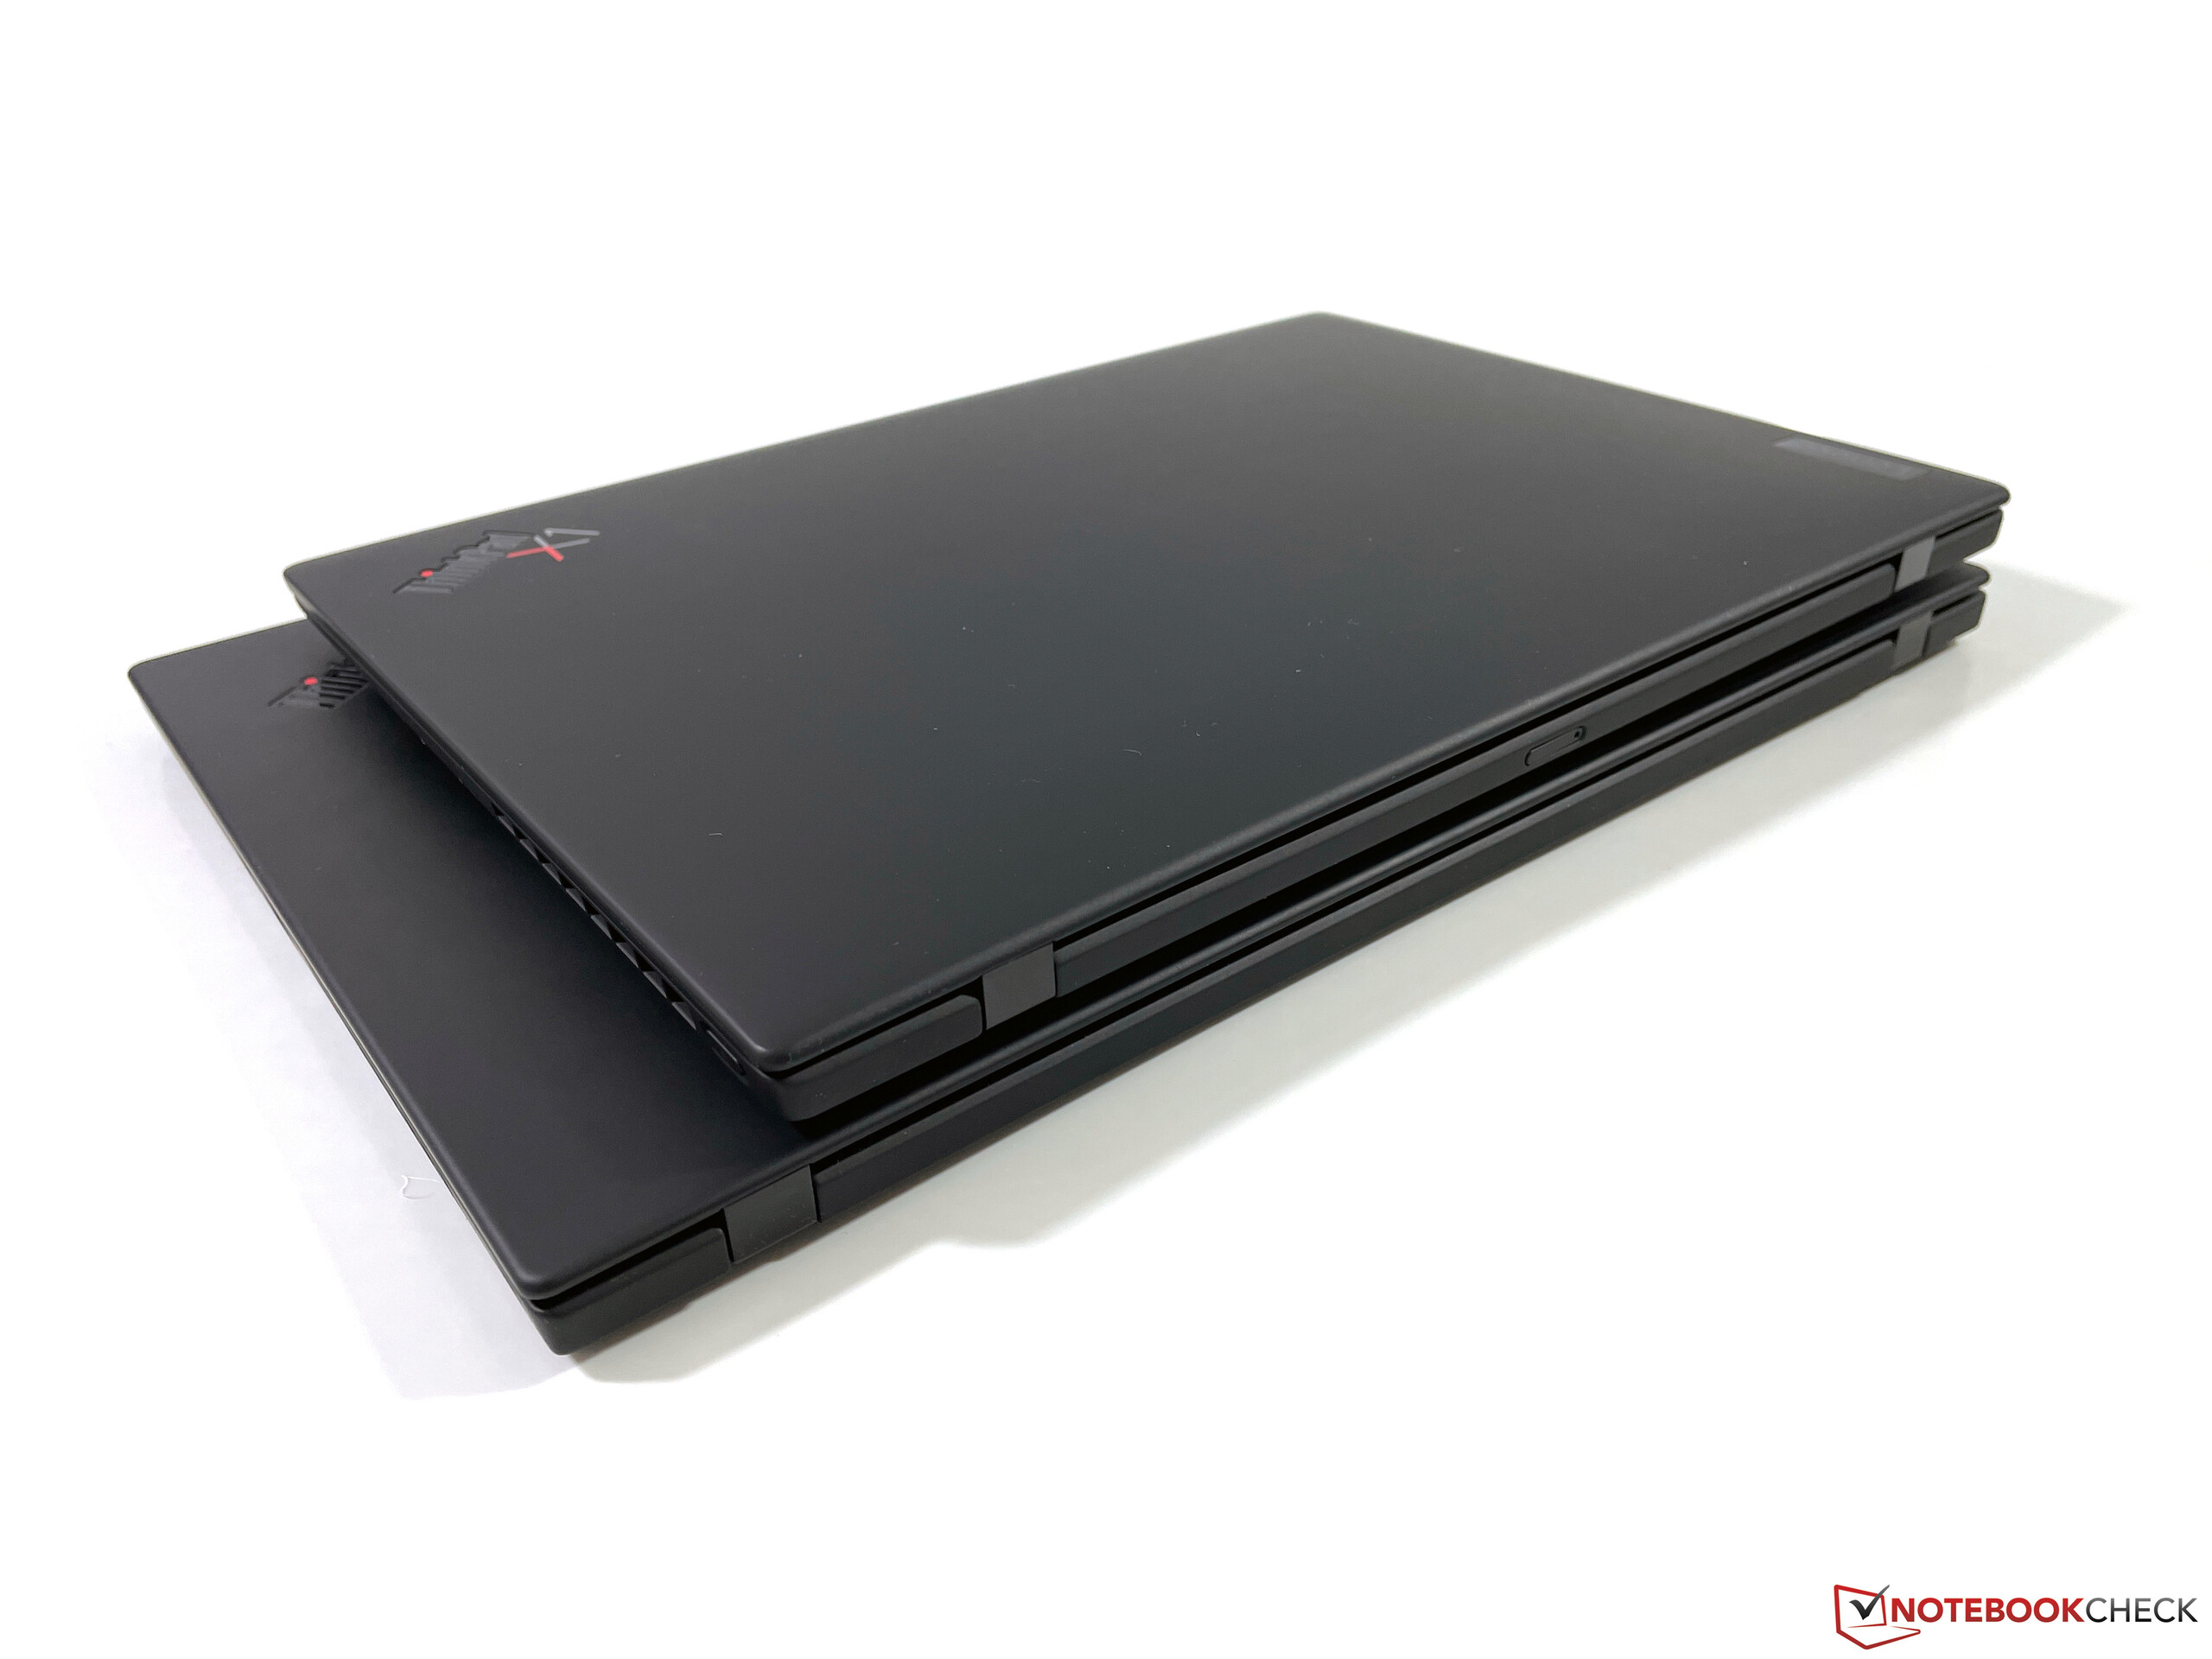
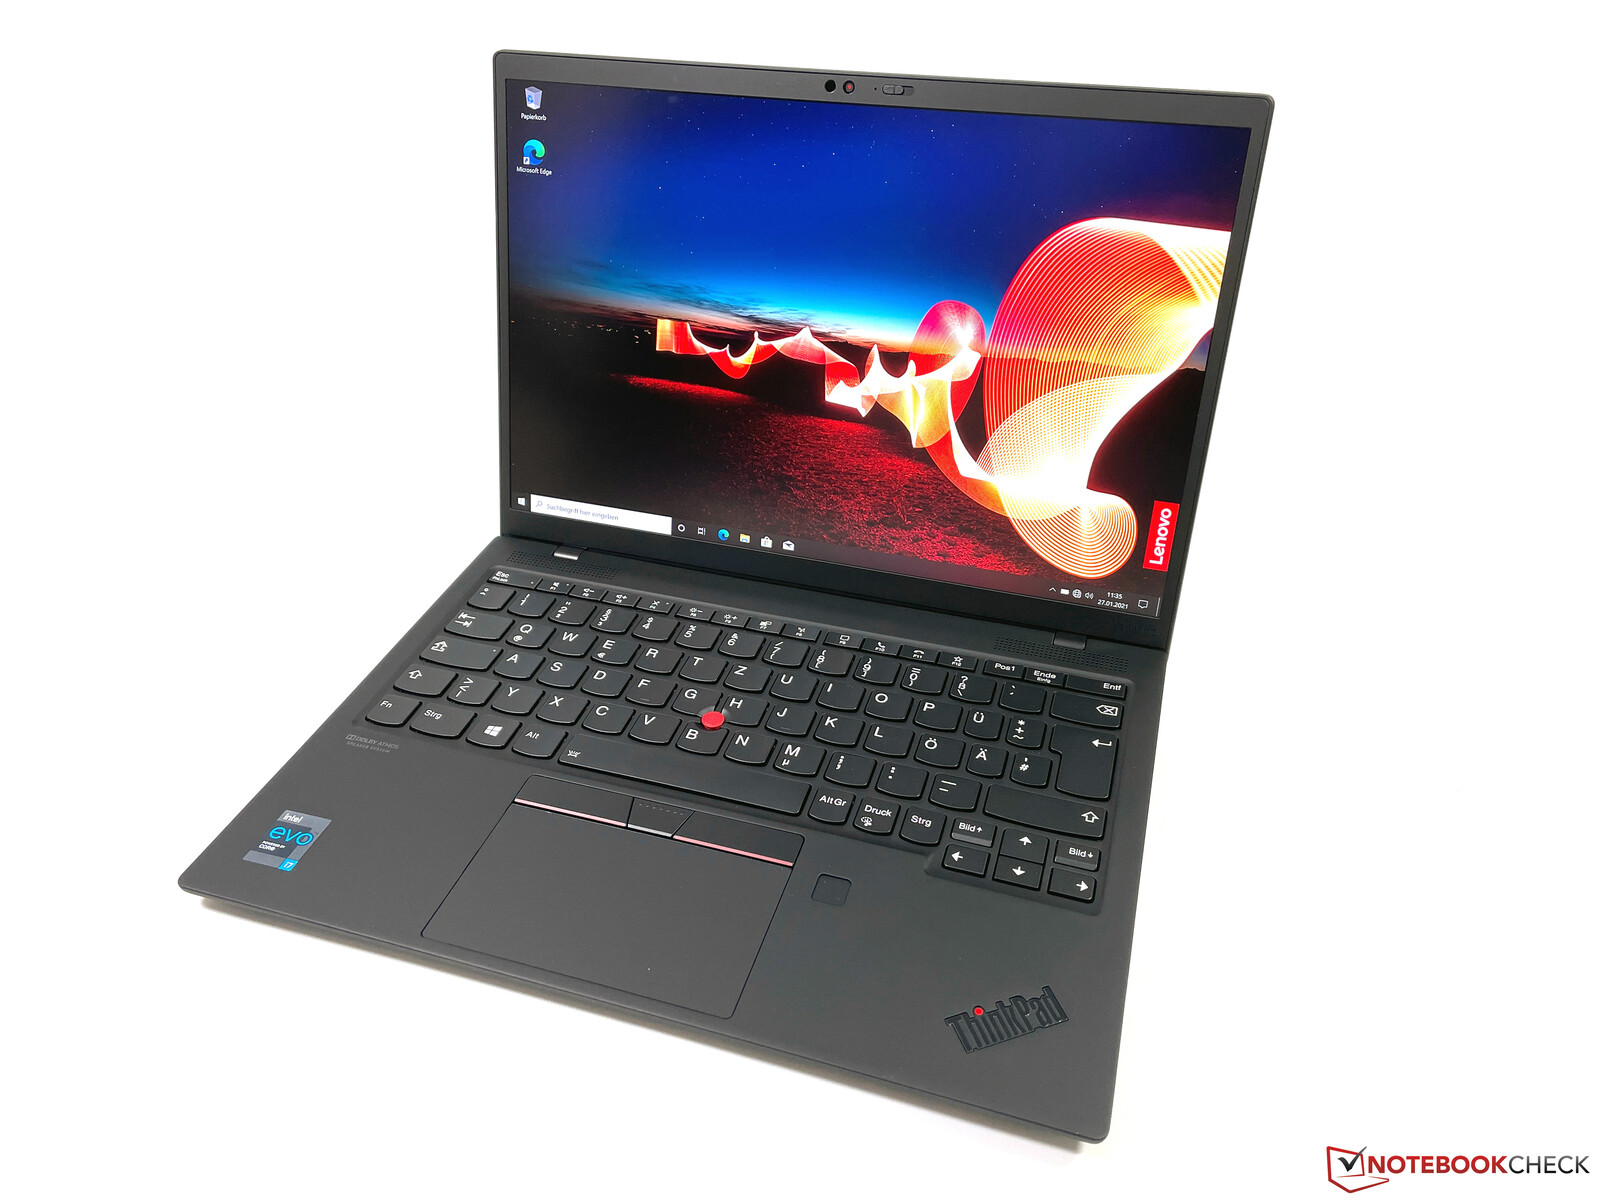
På många sätt levererar Lenovo riktigt bra prestanda. X1 Nano är en intressant ny medlem i X1-familjen och är en ultramobil subnotebook för kontoret med en vikt på under 1 kg. Lenovo återvänder också till rötterna från X300 och X1 och utrustar enheten med en 13-tumsskärm. X1 Nano är dessutom den första moderna ThinkPad-modellen med en 16:10-skärm och resultatet är riktigt bra: matt skärm, ljusstyrka över 400 nits, hög kontrast, ingen PWM, exakta färger och den täcker hela sRGB.
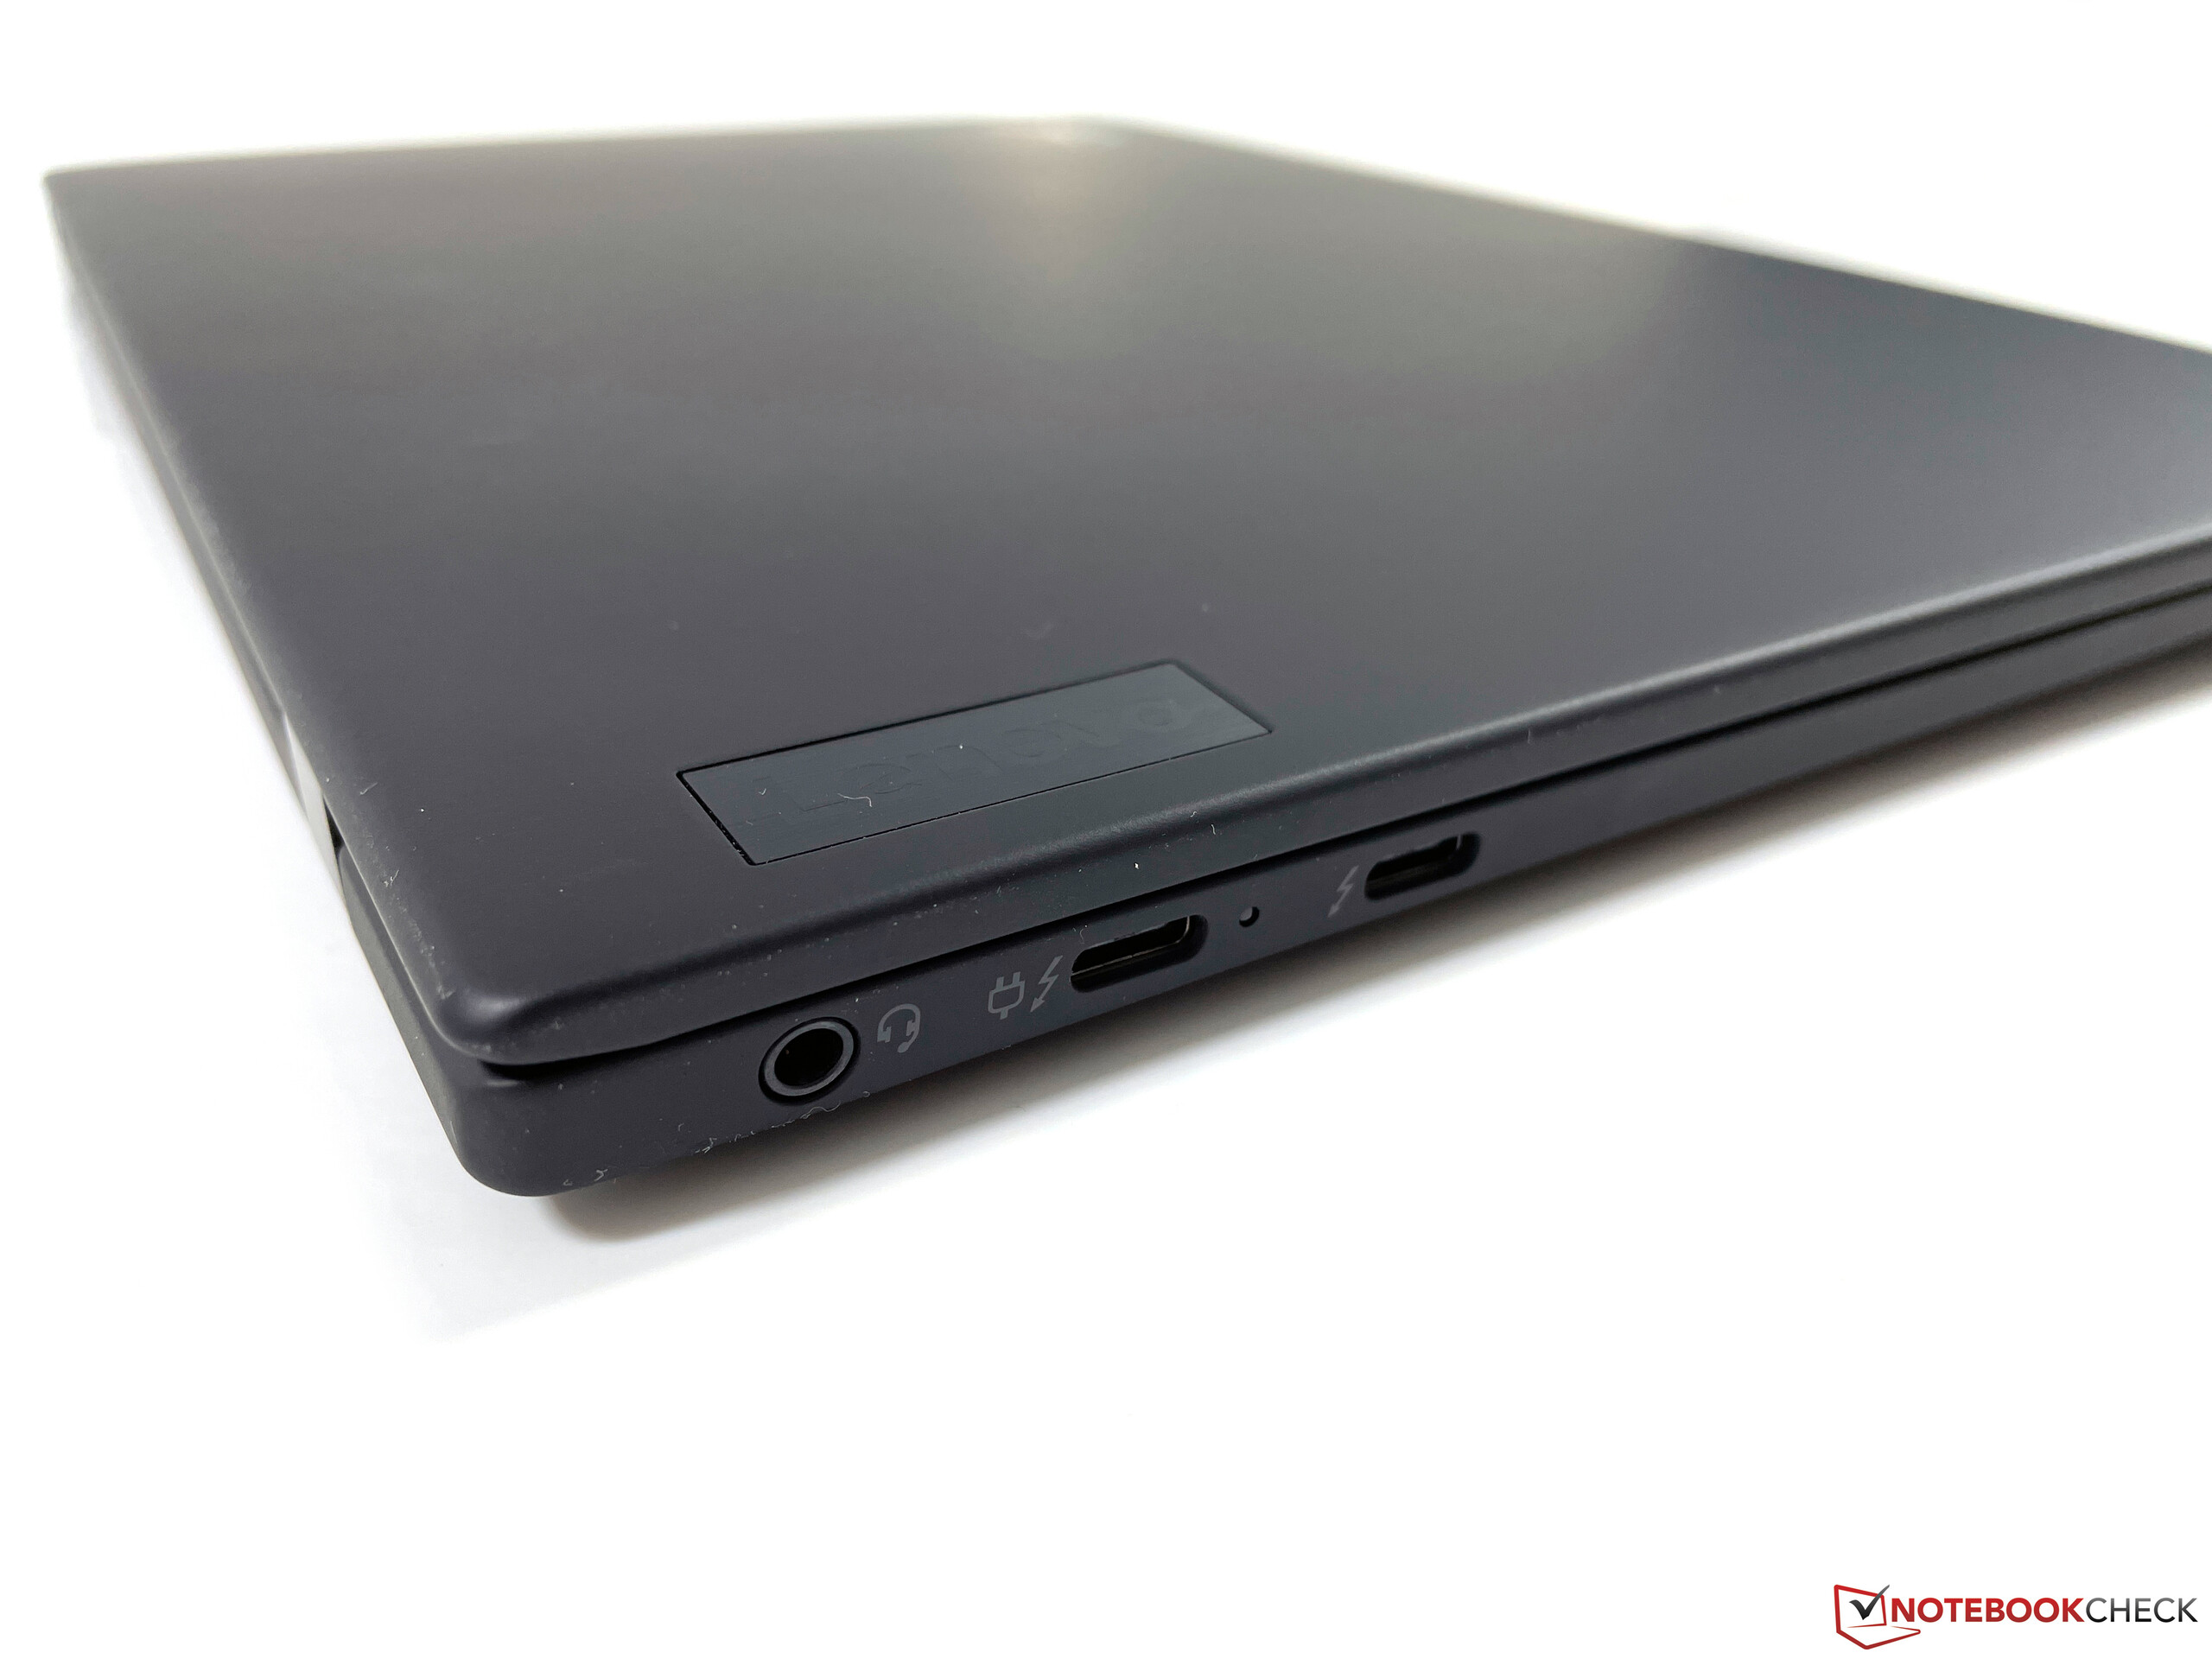
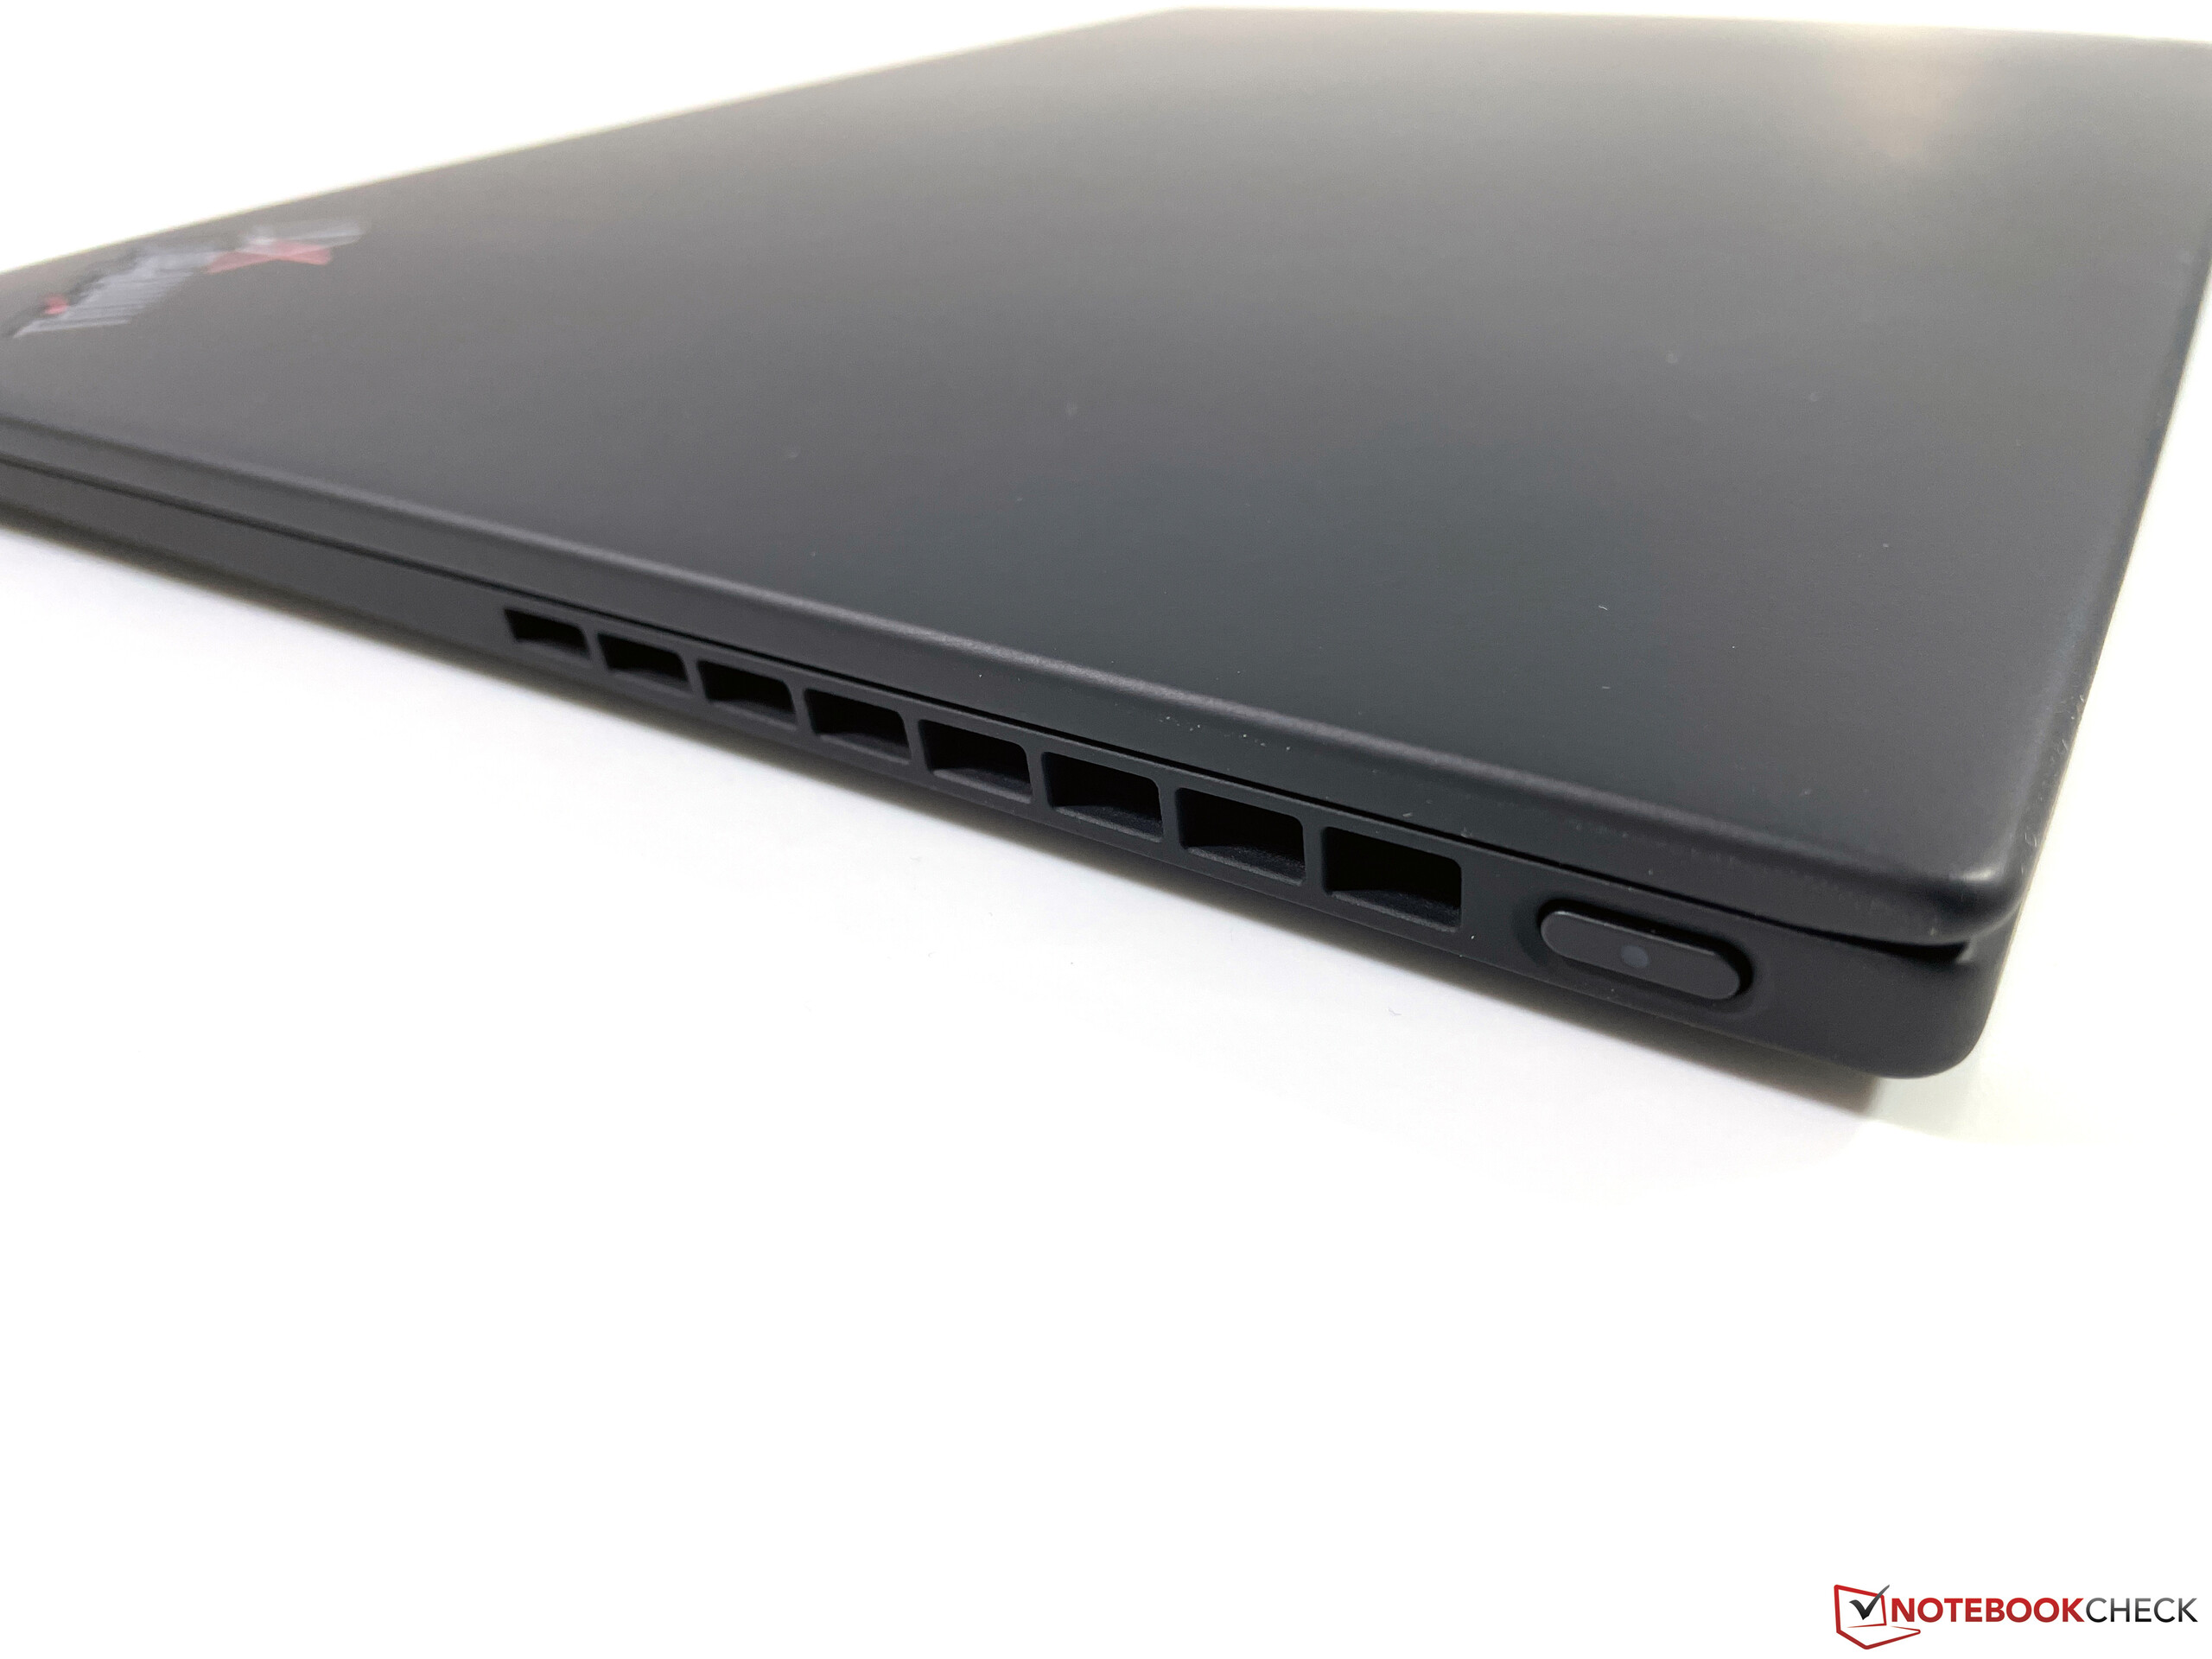
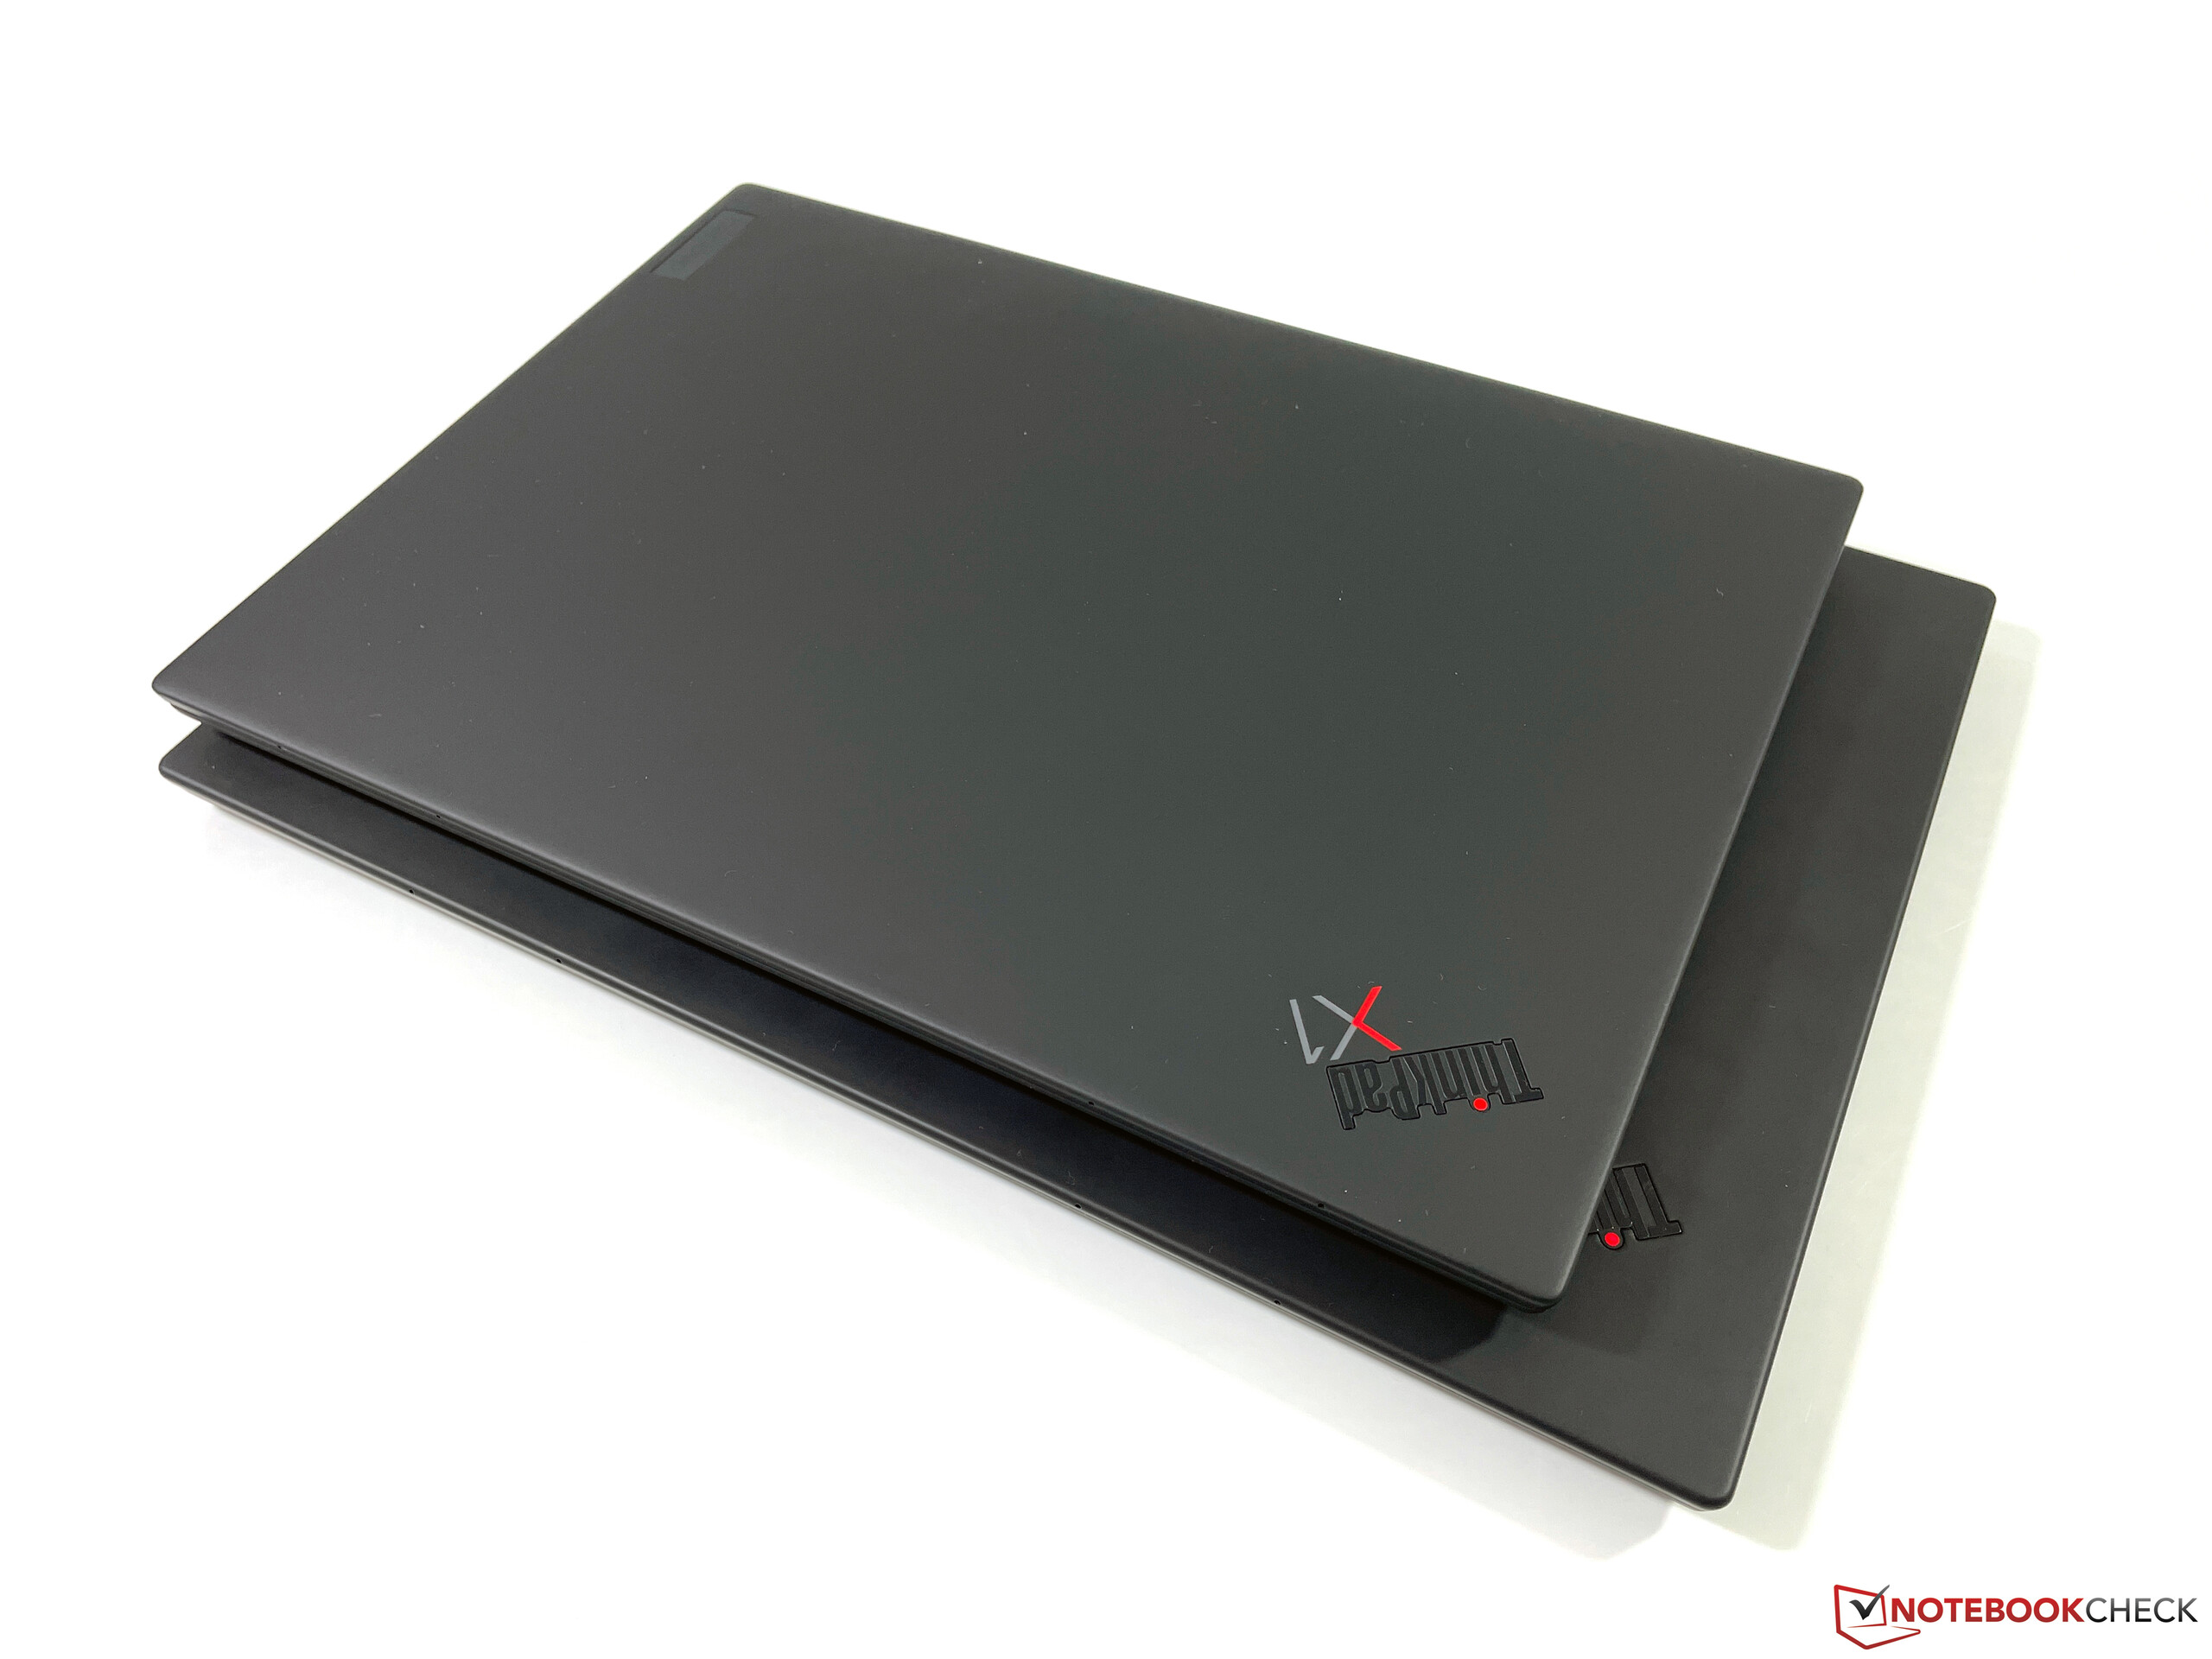
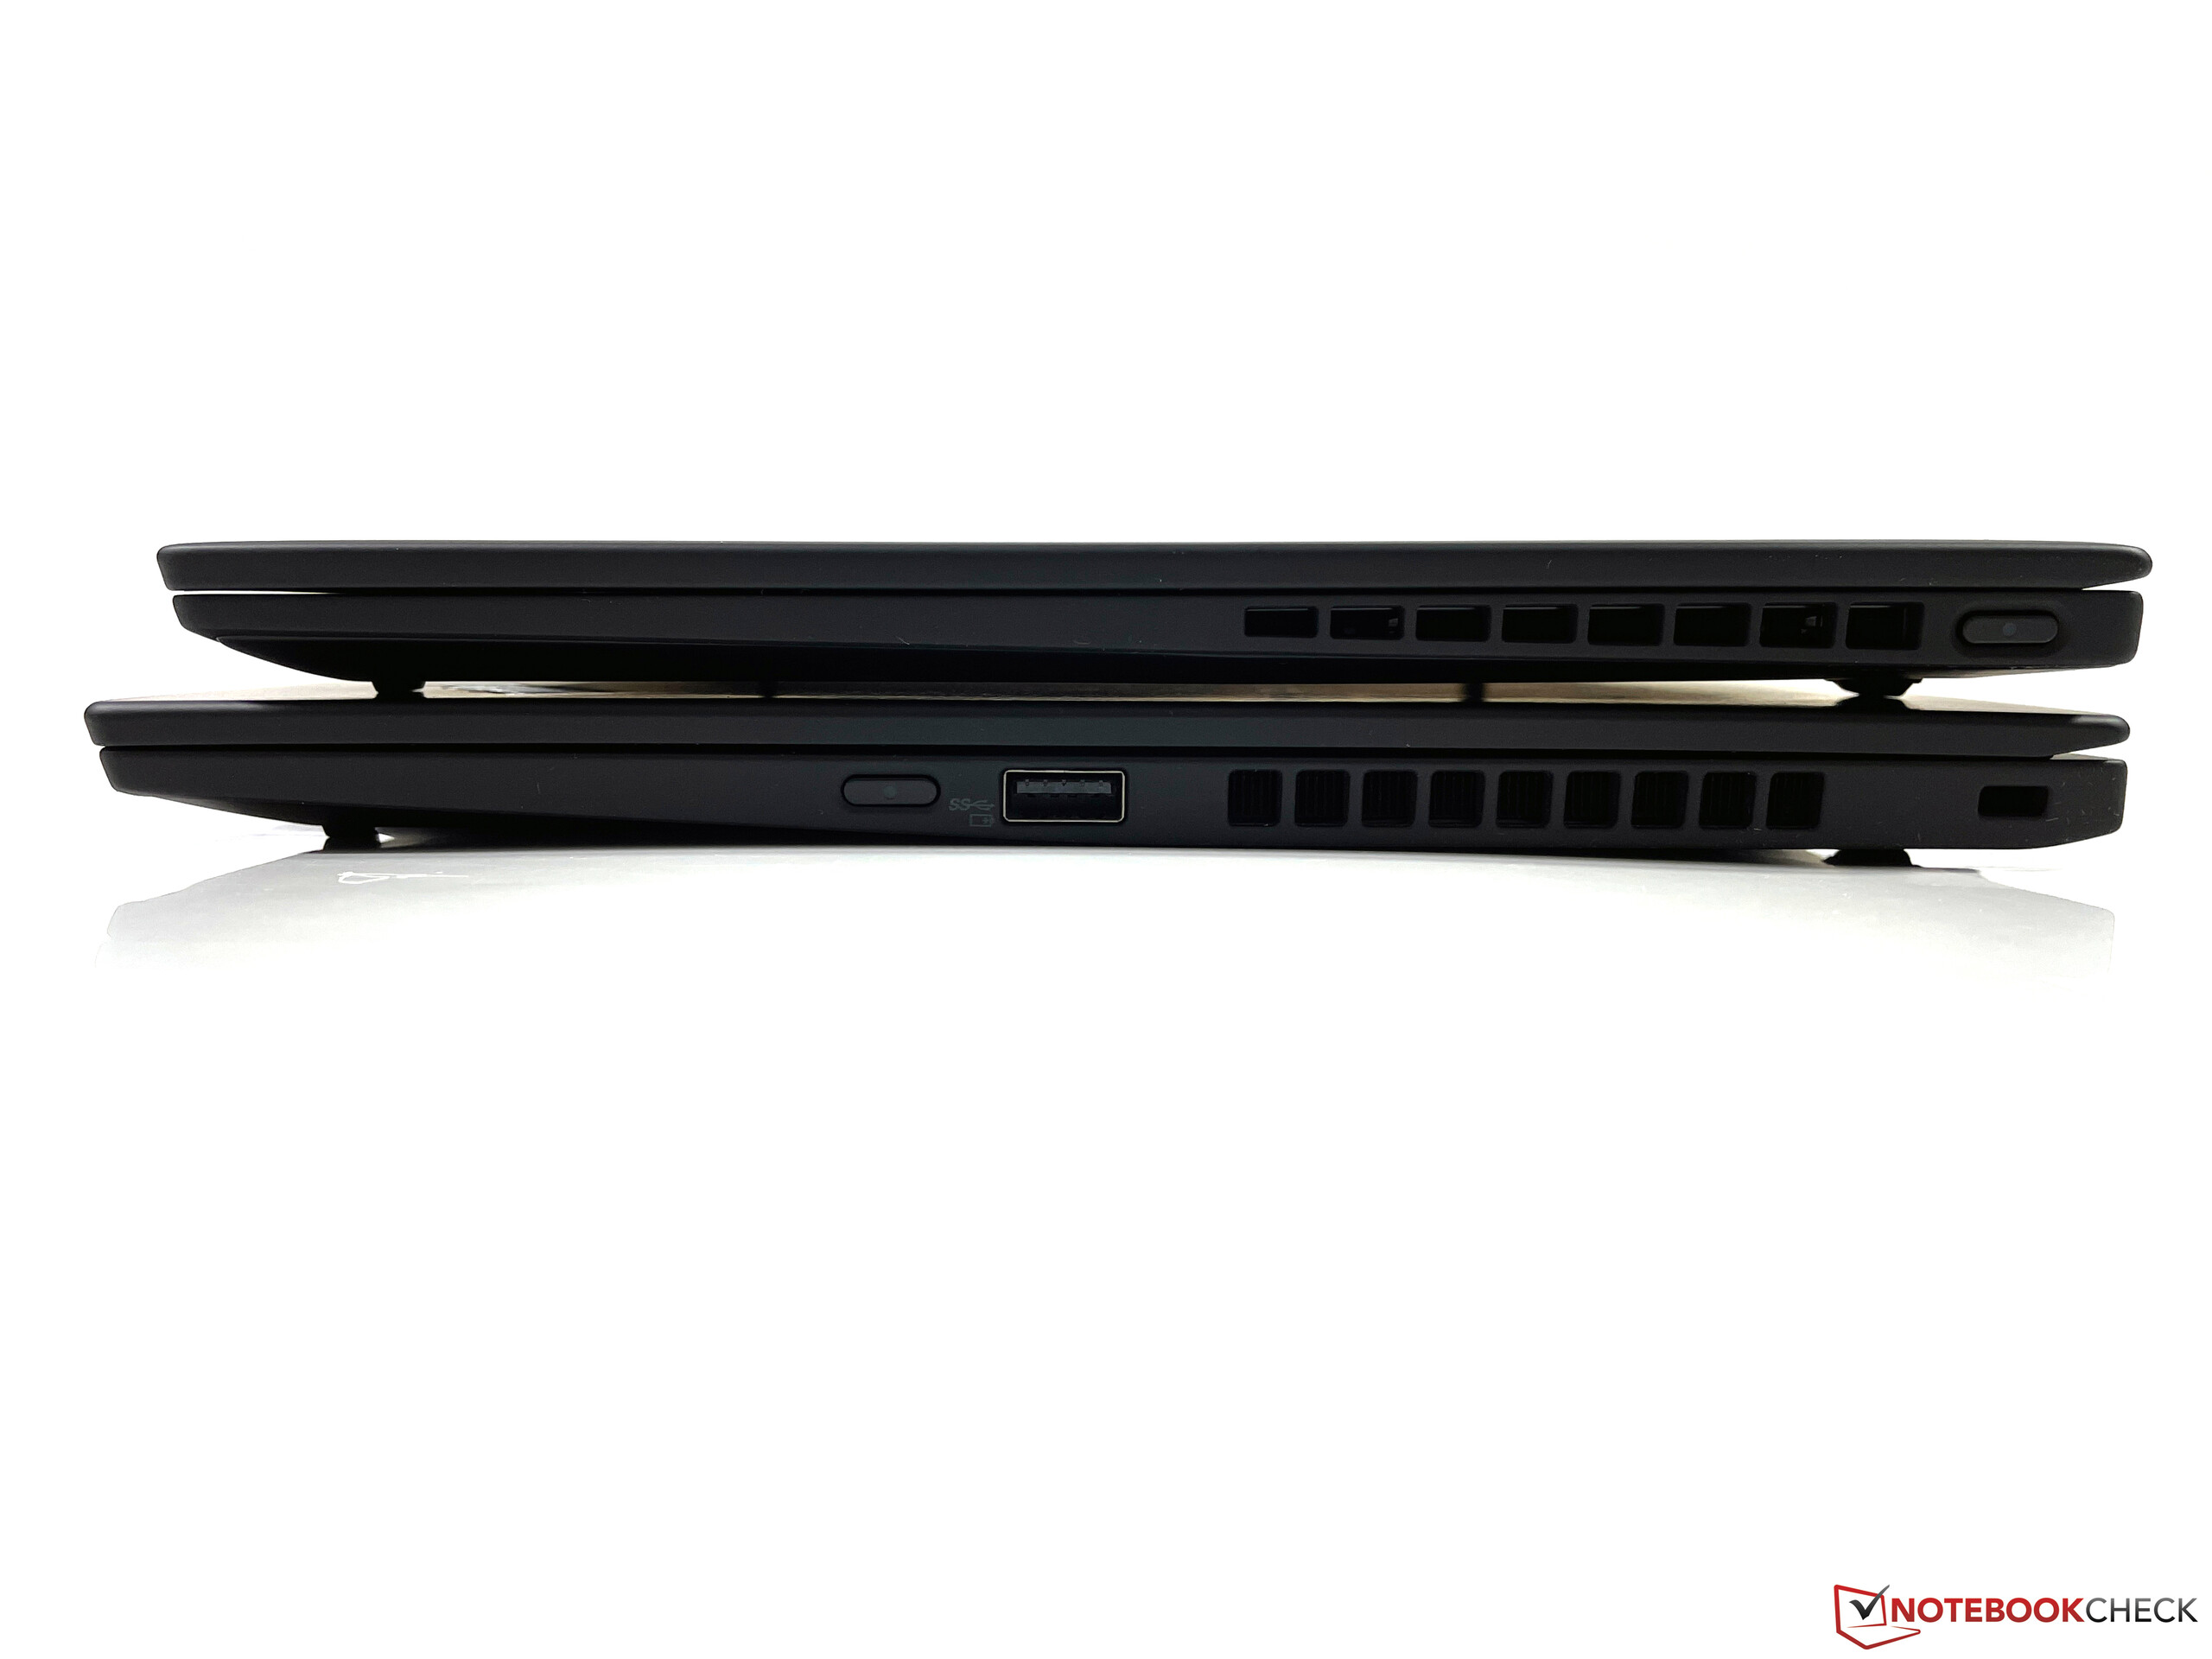
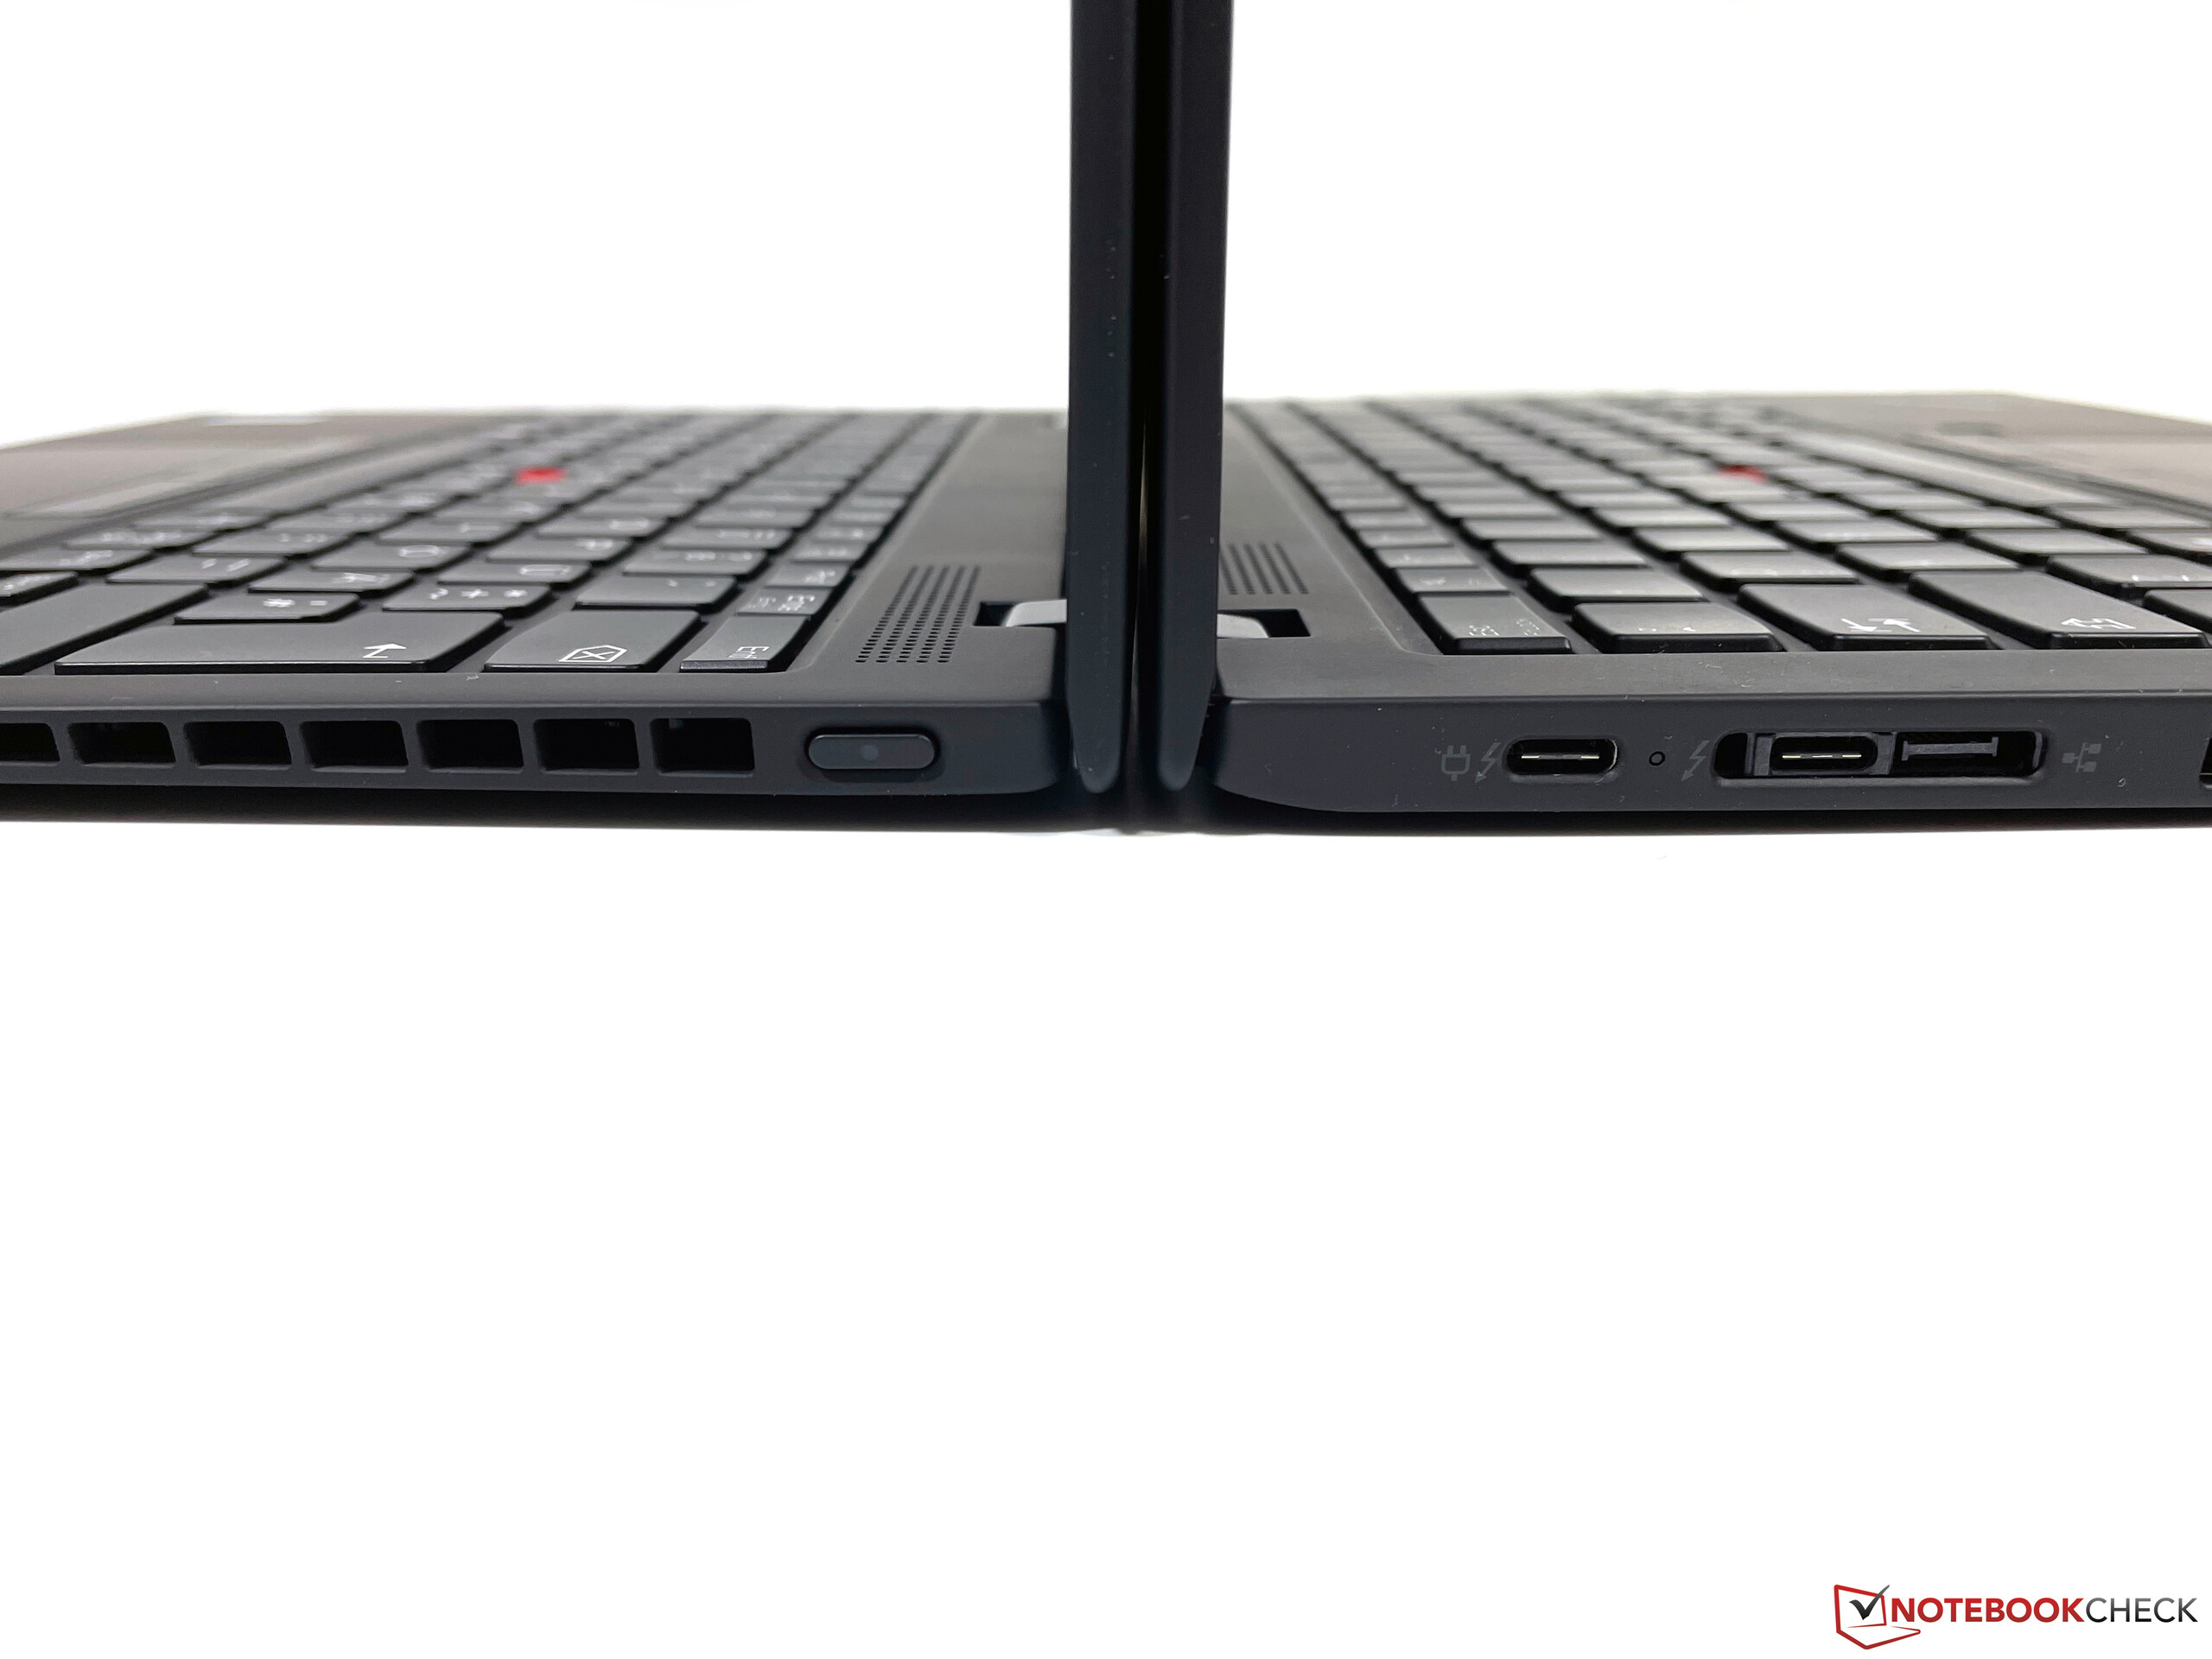
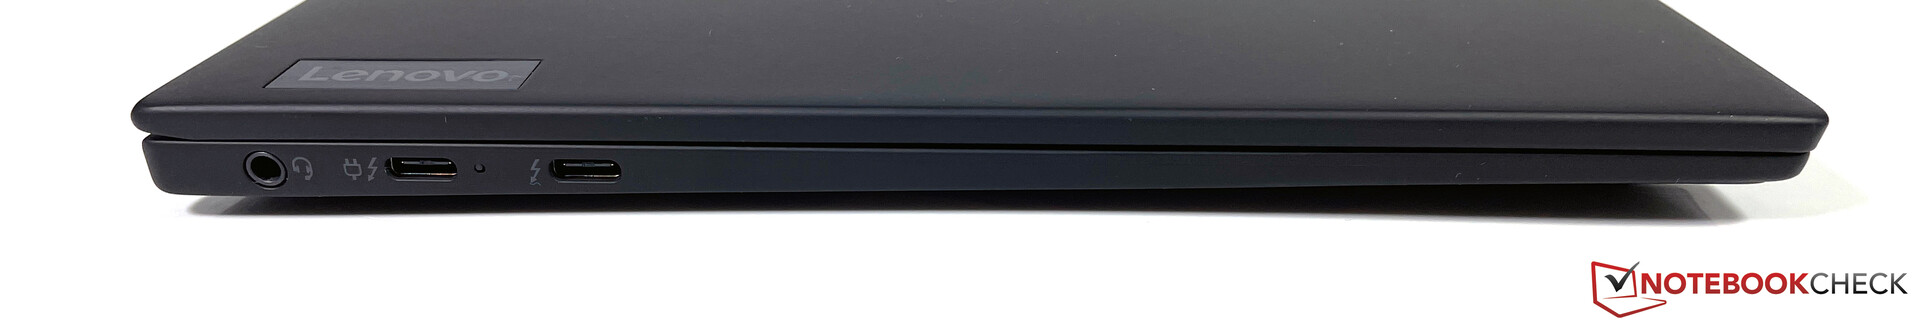
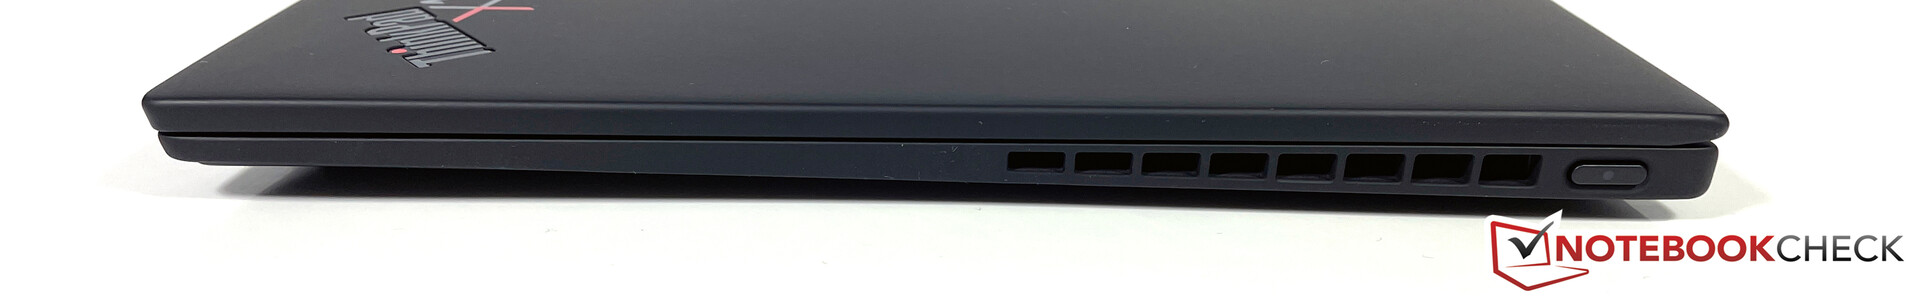
Chassit lämnade också ett riktigt gott intryck. Den låga vikten påverkar inte stabiliteten och X1 Nano borde få plats i alla väskor tack vare den kompakta storleken. Men man får kompromissa i fråga om portar då den bara har två USB-C, vilket ofta gör att man behöver adaptrar. Det är synd att Lenovo inte flyttade startknappen från den högra sidan till toppen av basenheten (som på kommande X1 Carbon G9) och istället satte dit en vanlig USB-A port. Datorn har inte ens plats för ett Kensington-lås.
Lenovos nya ThinkPad X1 Nano är en extremt lätt laptop på 13 tum som har en riktigt bra 16:10-skärm. Den är skaplig på att utnyttja sin prestanda och vi kan inte kritisera batteritiden något nämnvärt. Däremot är X1 Nano tyvärr lite av en besvikelse när det kommer till tangentbordet, vilket kan vara skäl nog för långvariga ThinkPad-användare att undvika den.
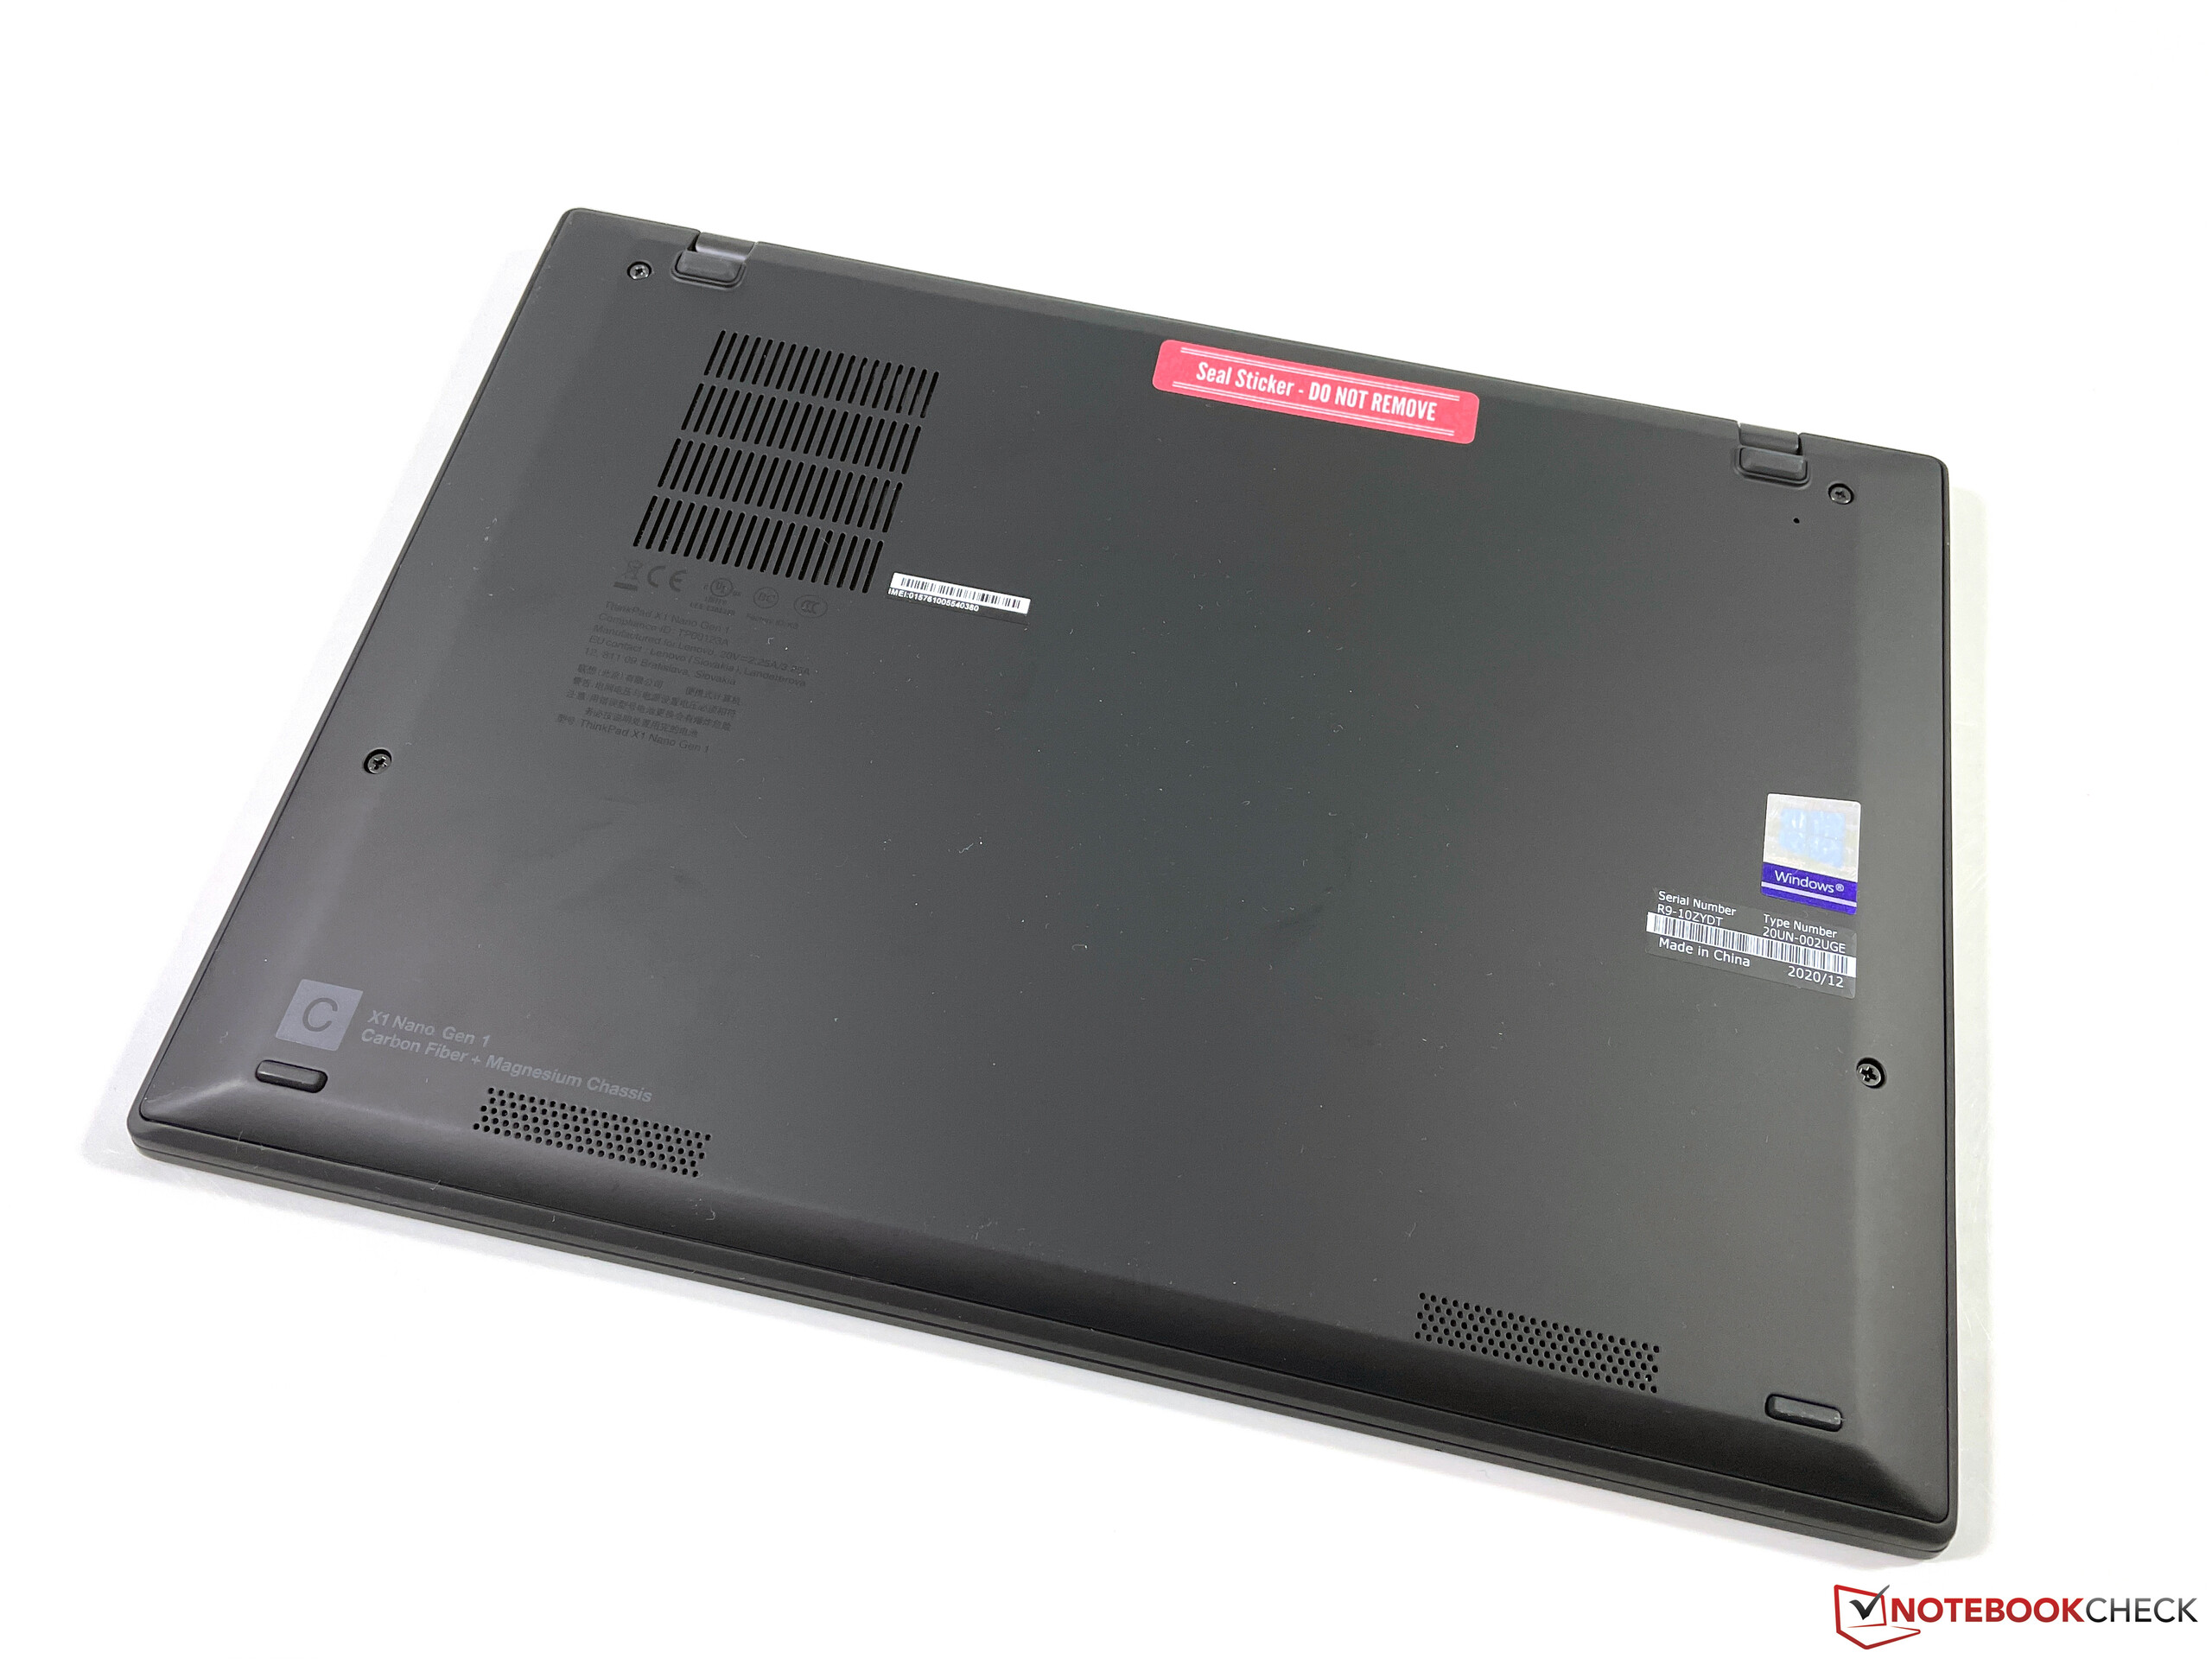
Det finns några mindre brister, som den onödiga begränsningen av WWAN-modulen (kan inte uppgraderas), att den har en M.2-2242 SSD utan PCIe 4.0 eller faktum att den i princip helt saknar servicemöjligheter. Det sistnämnda är dock en nödvändig kompromiss om du vill ha en riktigt tunn enhet.
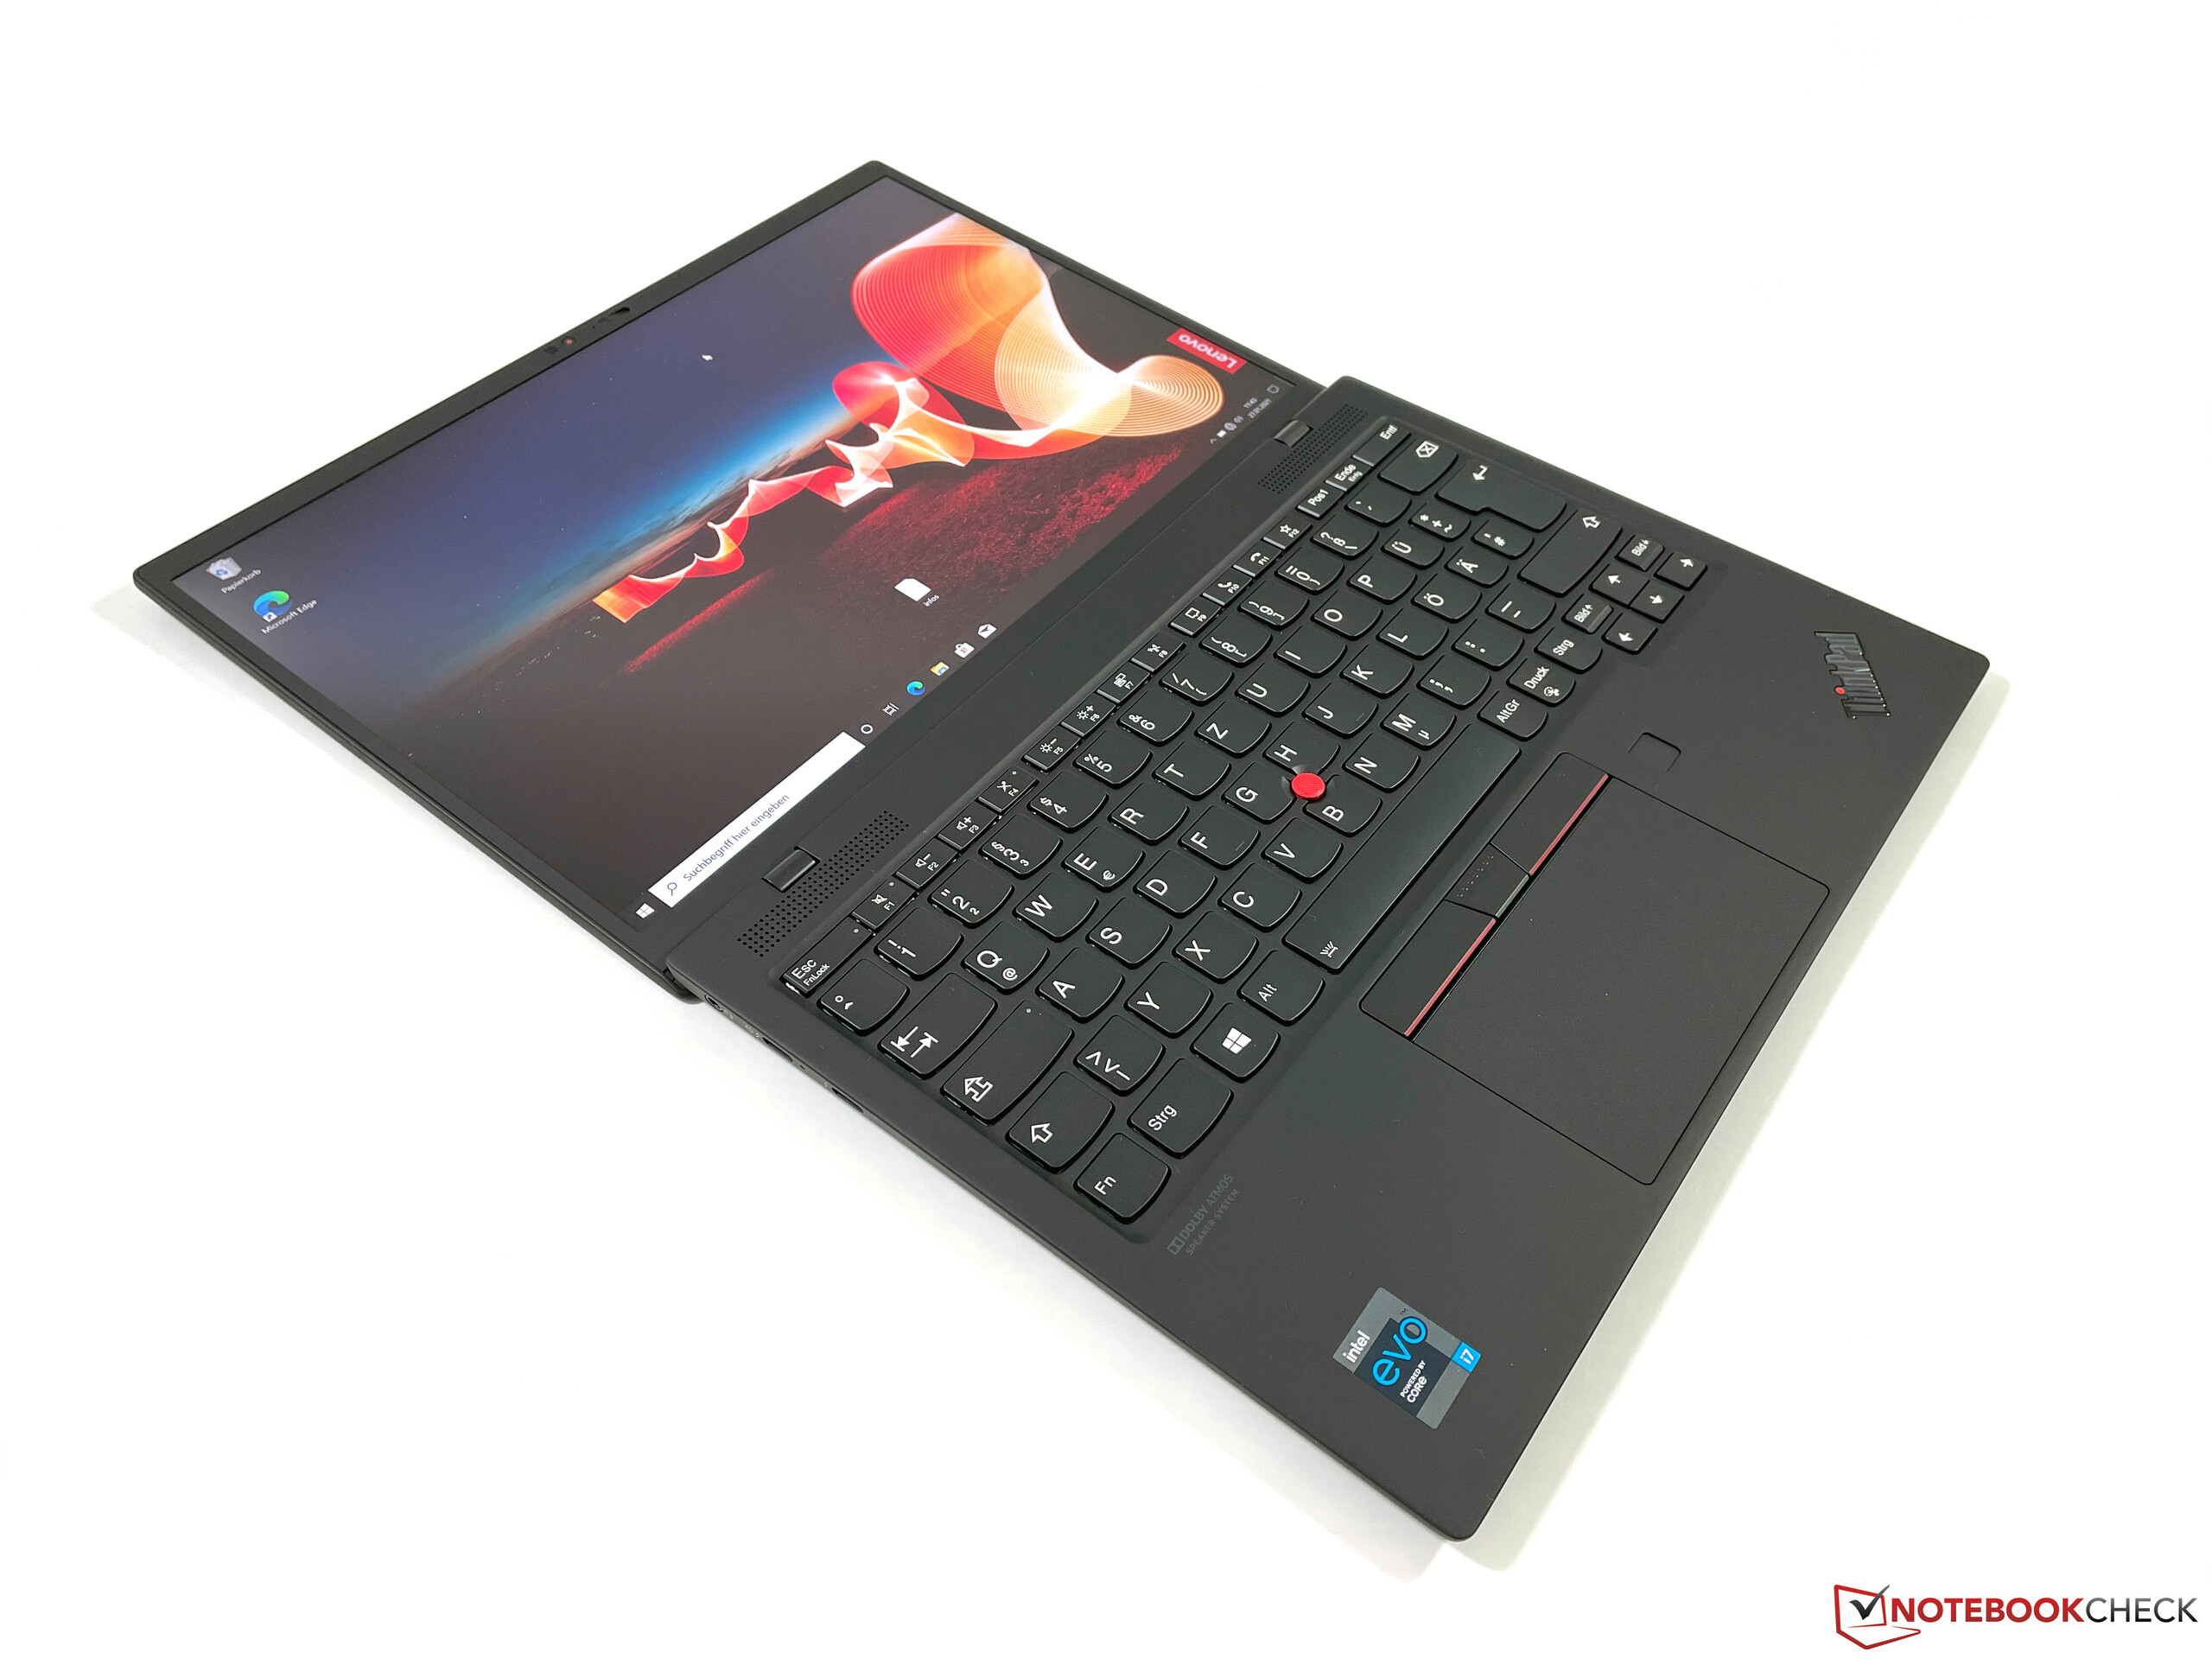
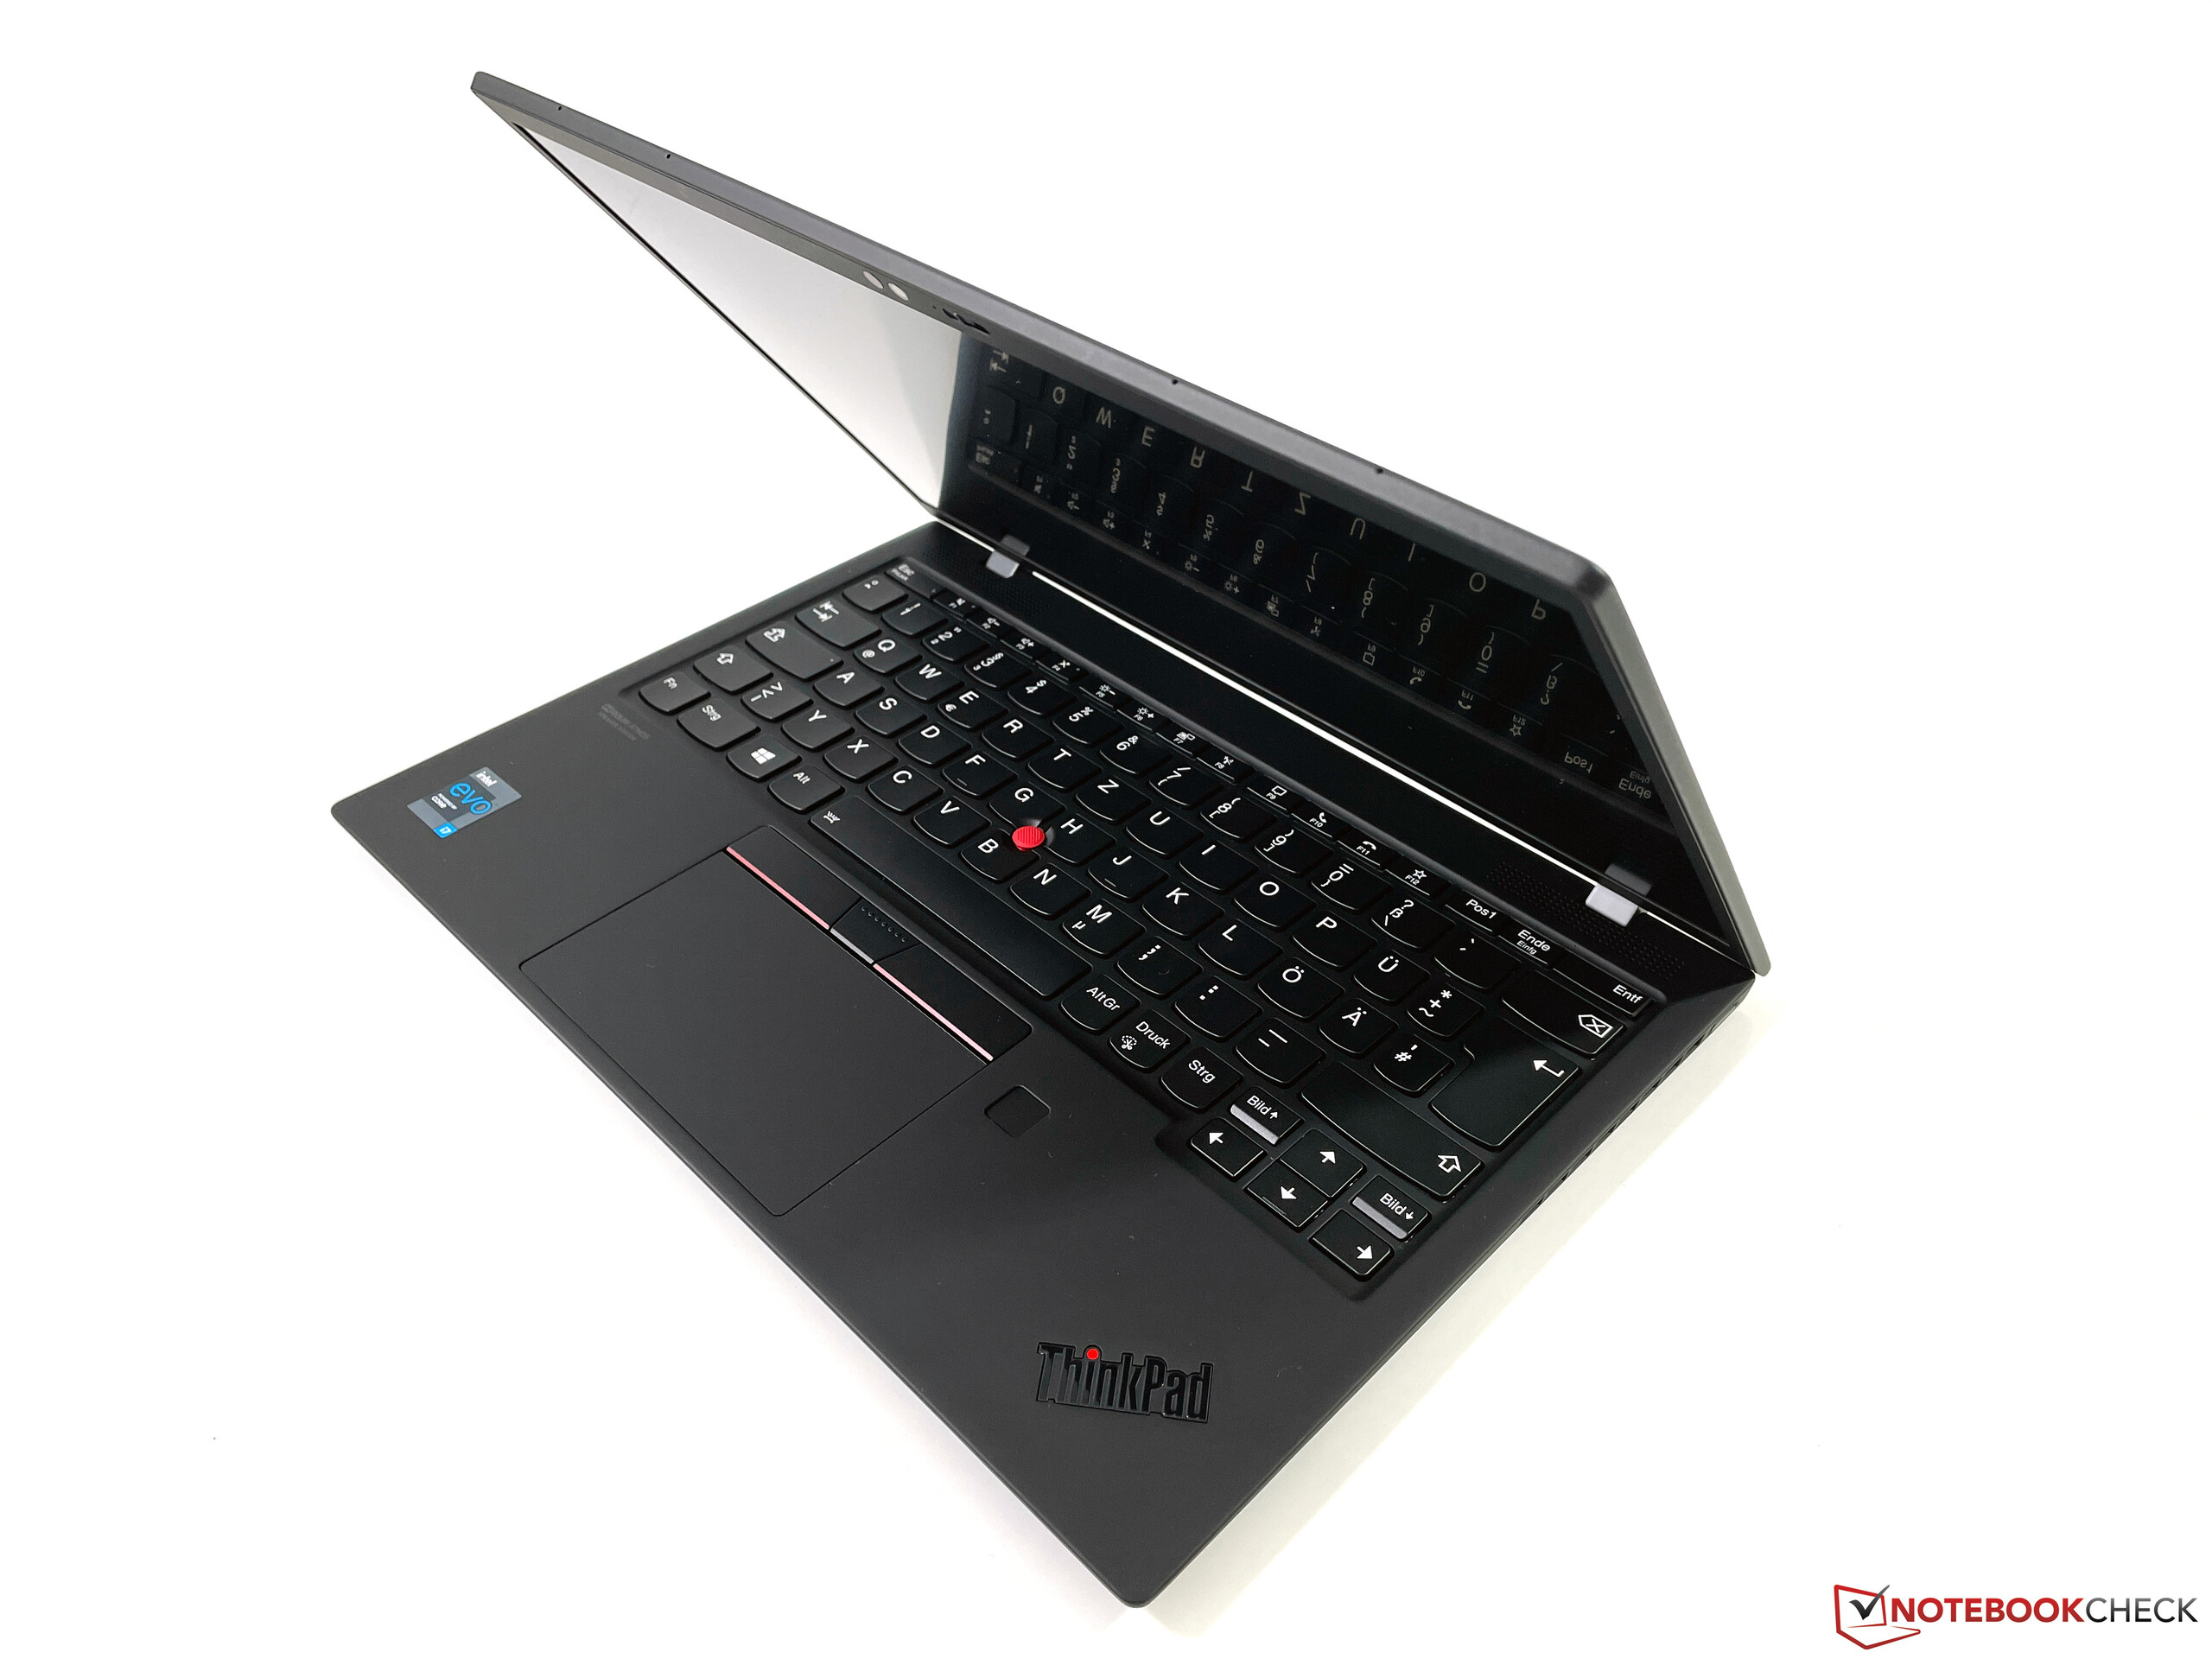
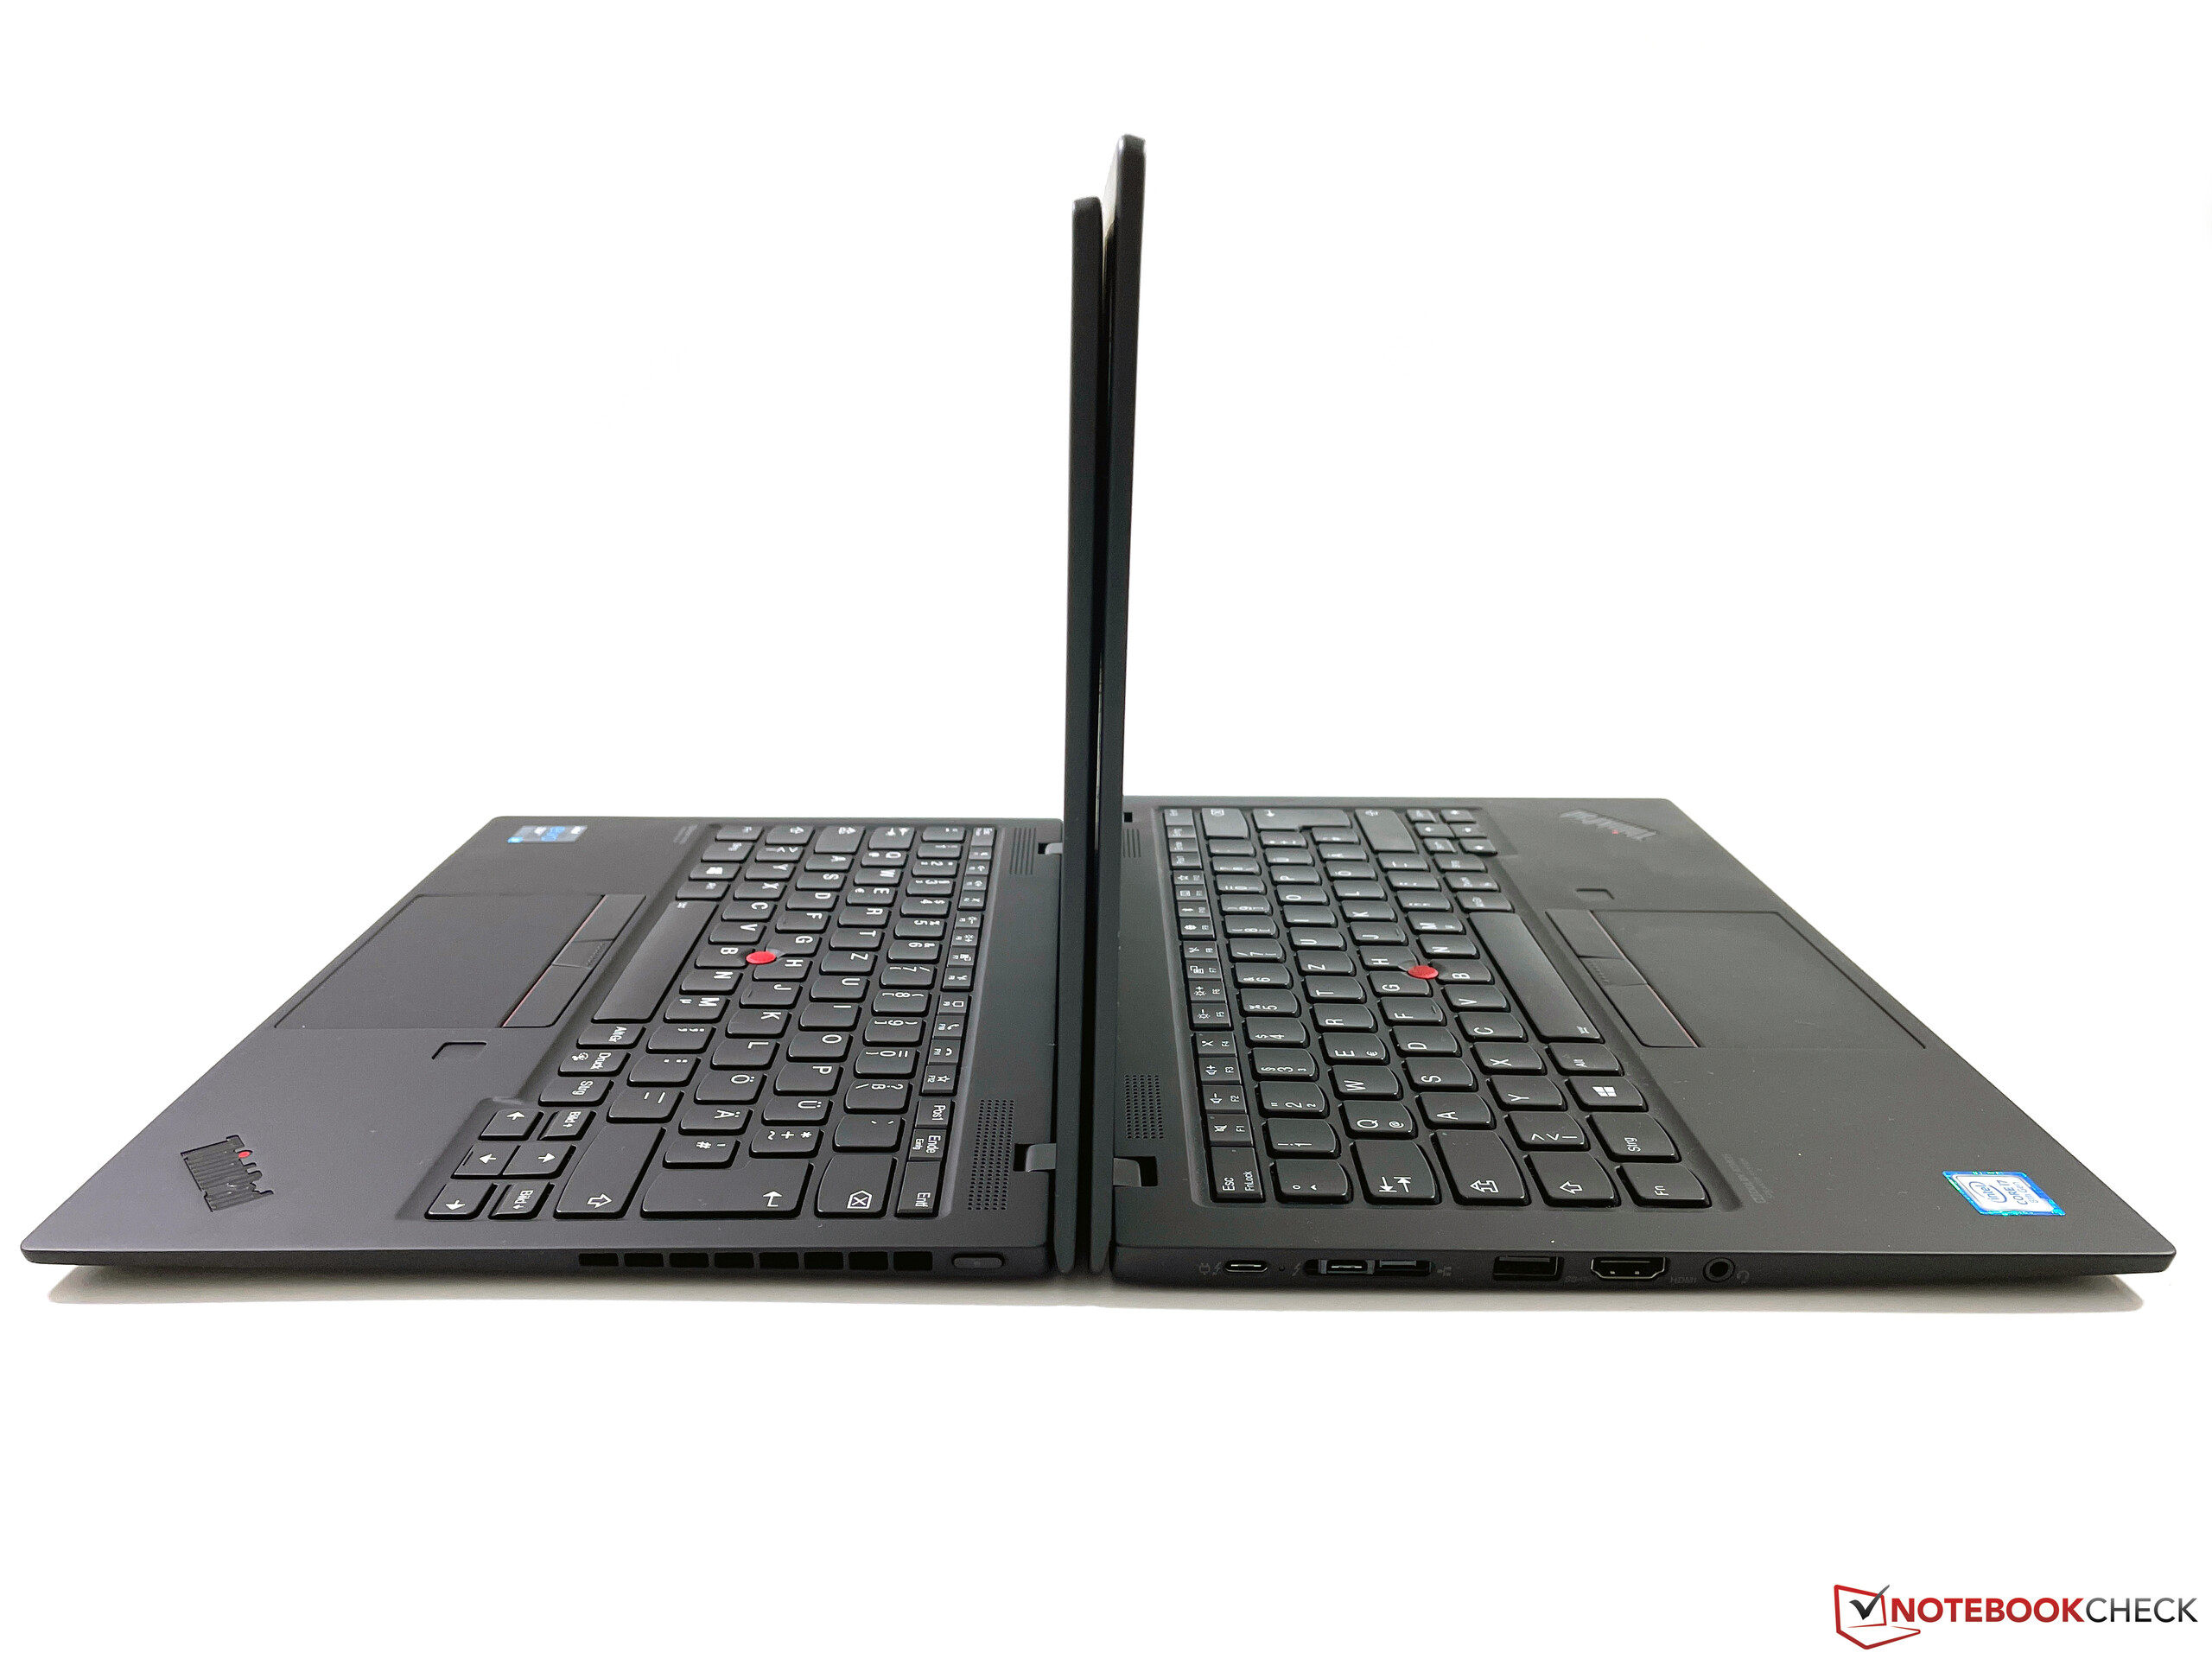
Ett större problem är däremot tangentbordet. Det är mindre än vanligt och har kortare färdväg. Tangentbordet är fortfarande bra och har exakta tangentnedslag, men skrivupplevelsen är sämre jämfört med någon annan ThinkPad. Tangentbordet brukade vara en höjdpunkt med tidigare ThinkPad-modeller, men så är inte fallet här. Kanske kommer du inte ens märka något om du byter från en annan tillverkare, men långvariga ThinkPad-användare kommer märka skillnaden direkt.
X1 Nano är fortfarande en riktigt bra kontorslaptop om du kan leva med ett lite sämre tangentbord i utbyte mot en riktigt lätt och kompakt enhet. Men om du vill ha en ThinkPad på grund av den höga tangentbordskvaliteten rekommenderar vi istället att du väljer en modell från T- eller X-serierna, som troligen också kommer få en 16:10-uppdatering i år.
Lenovo ThinkPad X1 Nano-20UN002UGE
- 02/01/2021 v7 (old)
Andreas Osthoff
Price comparison
