Test: Lenovo ThinkPad L480 (i5-8250U, UHD 620, IPS, SSD) Laptop (Sammanfattning)
| SD Card Reader | |
| average JPG Copy Test (av. of 3 runs) | |
| Dell Latitude 5490-TD70X (Toshiba Exceria Pro SDXC 64 GB UHS-II) | |
| HP ProBook 440 G5-3KX87ES (Toshiba Exceria Pro SDXC 64 GB UHS-II) | |
| Lenovo ThinkPad E480-20KQS00000 (Toshiba Exceria Pro M501) | |
| Lenovo ThinkPad E480-20KNCTO1WW (Toshiba Exceria Pro M501) | |
| Lenovo ThinkPad L470-20J5S00C00 (Toshiba Exceria Pro SDXC 64 GB UHS-II) | |
| Lenovo ThinkPad L480-20LS001AGE (Toshiba Exceria Pro M501 microSDXC 64GB) | |
| Genomsnitt av klass Office (19.8 - 198.5, n=22, senaste 2 åren) | |
| maximum AS SSD Seq Read Test (1GB) | |
| Dell Latitude 5490-TD70X (Toshiba Exceria Pro SDXC 64 GB UHS-II) | |
| HP ProBook 440 G5-3KX87ES (Toshiba Exceria Pro SDXC 64 GB UHS-II) | |
| Lenovo ThinkPad E480-20KNCTO1WW (Toshiba Exceria Pro M501) | |
| Lenovo ThinkPad L480-20LS001AGE (Toshiba Exceria Pro M501 microSDXC 64GB) | |
| Lenovo ThinkPad L470-20J5S00C00 (Toshiba Exceria Pro SDXC 64 GB UHS-II) | |
| Lenovo ThinkPad E480-20KQS00000 (Toshiba Exceria Pro M501) | |
| Genomsnitt av klass Office (27.4 - 249, n=21, senaste 2 åren) | |
| |||||||||||||||||||||||||
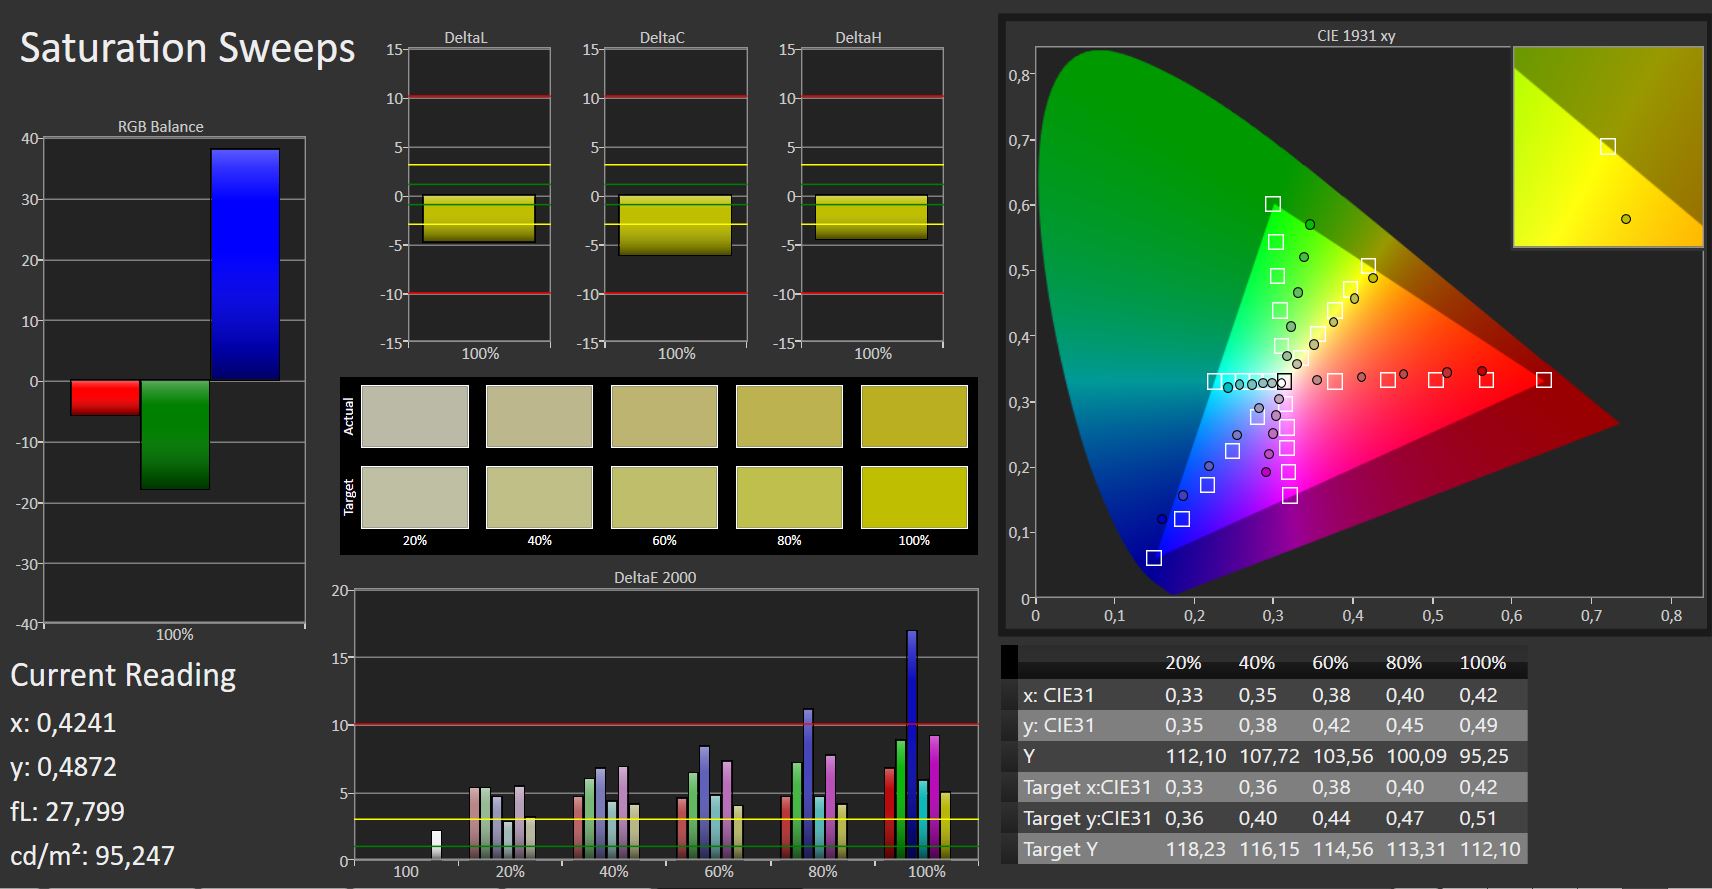
Distribution av ljusstyrkan: 73 %
Mitt på batteriet: 2.3 cd/m²
Kontrast: 1306:1 (Svärta: 0.17 cd/m²)
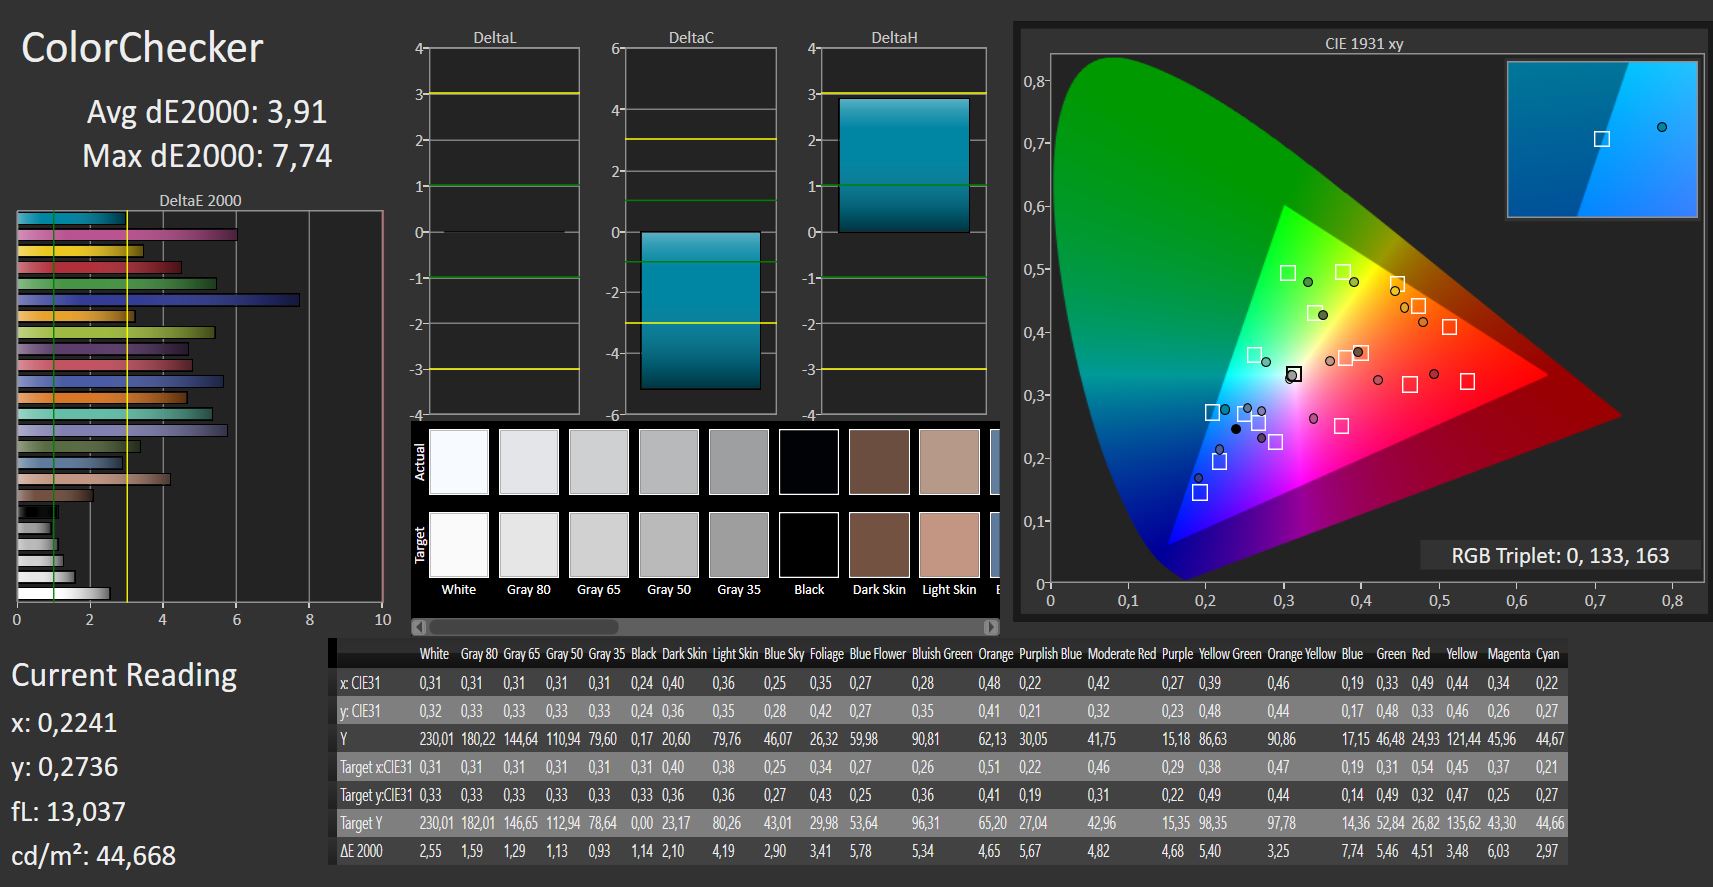
ΔE ColorChecker Calman: 3.91 | ∀{0.5-29.43 Ø4.73}
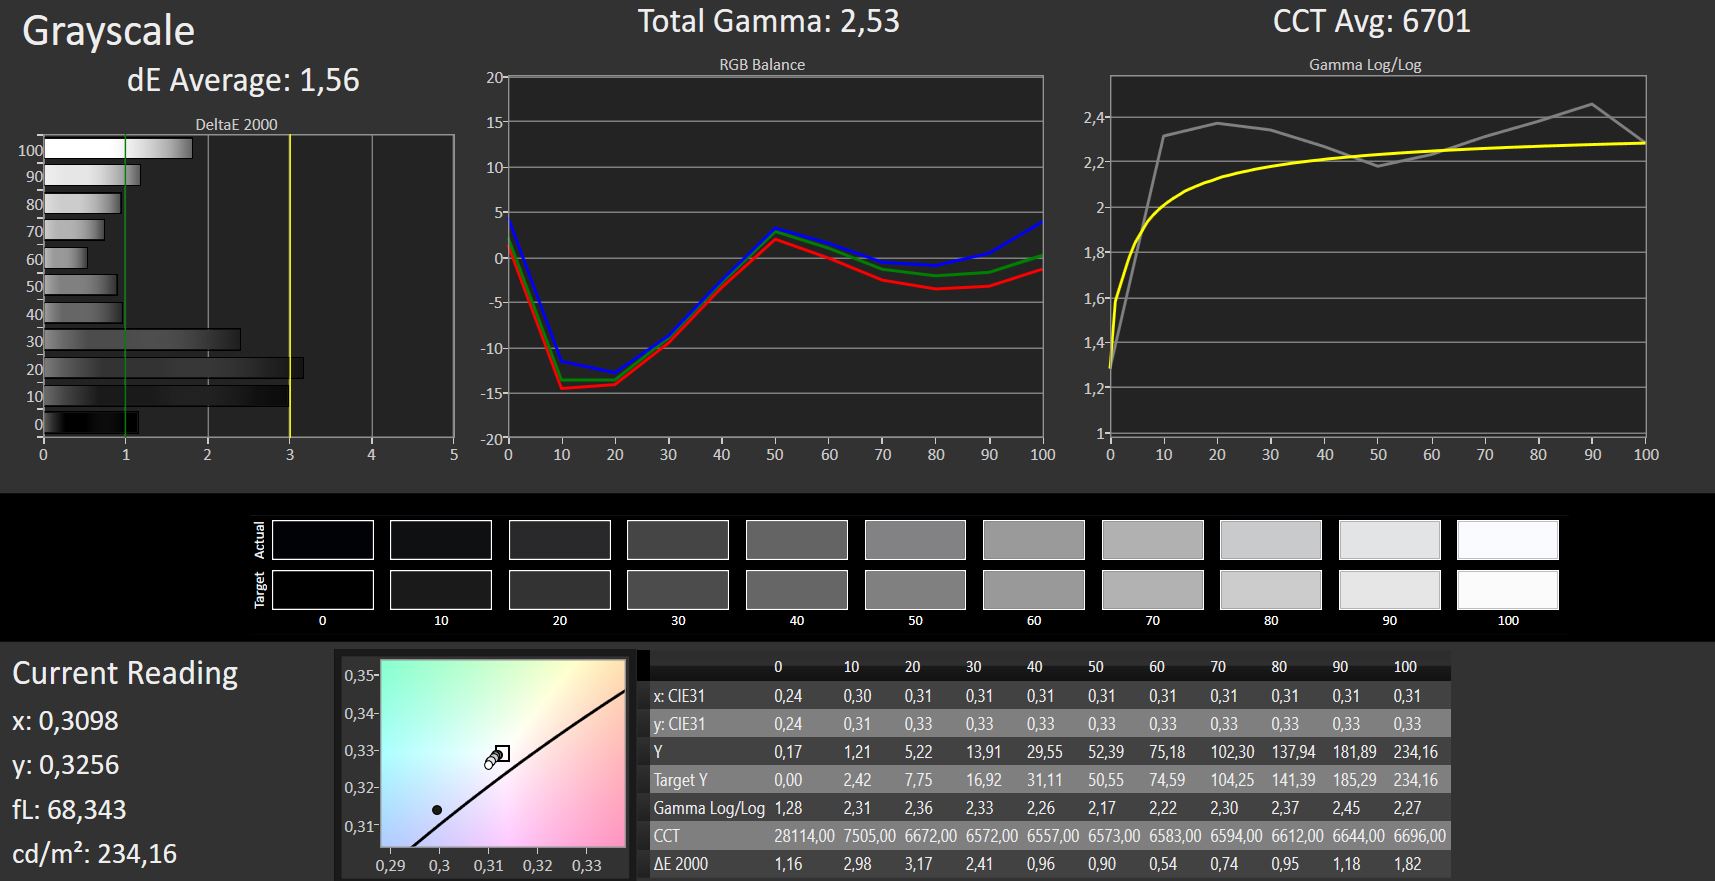
ΔE Greyscale Calman: 1.56 | ∀{0.09-98 Ø4.97}
55% sRGB (Argyll 1.6.3 3D)
35% AdobeRGB 1998 (Argyll 1.6.3 3D)
37.57% AdobeRGB 1998 (Argyll 3D)
54.7% sRGB (Argyll 3D)
36.37% Display P3 (Argyll 3D)
Gamma: 2.53
CCT: 6701 K
| Lenovo ThinkPad L480-20LS001AGE B140HAN02.4, 1920x1080, 14" | Lenovo ThinkPad L470-20J5S00C00 N140HCA-EAB, 1920x1080, 14" | Lenovo ThinkPad E480-20KNCTO1WW Innolux N140HCA-EAC, 1920x1080, 14" | Lenovo ThinkPad E480-20KQS00000 Innolux N140HCA-EAC, 1920x1080, 14" | HP ProBook 440 G5-3KX87ES LGD04B2, 1920x1080, 14" | Dell Latitude 5490-TD70X AU Optronics AUO263D, 1920x1080, 14" | |
|---|---|---|---|---|---|---|
| Display | 16% | 14% | 15% | 9% | 0% | |
| Display P3 Coverage (%) | 36.37 | 42.21 16% | 41.56 14% | 41.88 15% | 39.56 9% | 36.28 0% |
| sRGB Coverage (%) | 54.7 | 62.7 15% | 62.2 14% | 62.8 15% | 59.3 8% | 54.6 0% |
| AdobeRGB 1998 Coverage (%) | 37.57 | 43.71 16% | 42.96 14% | 43.29 15% | 40.88 9% | 37.48 0% |
| Response Times | 19% | 22% | 23% | 29% | 21% | |
| Response Time Grey 50% / Grey 80% * (ms) | 73 ? | 50.4 ? 31% | 44.8 ? 39% | 44 ? 40% | 40 ? 45% | 46.9 ? 36% |
| Response Time Black / White * (ms) | 33 ? | 30.8 ? 7% | 31.2 ? 5% | 31.2 ? 5% | 28.8 ? 13% | 31.2 ? 5% |
| PWM Frequency (Hz) | 25000 ? | 24880 ? | ||||
| Screen | -46% | -53% | -20% | -41% | -28% | |
| Brightness middle (cd/m²) | 222 | 274 23% | 262 18% | 251 13% | 236 6% | 227 2% |
| Brightness (cd/m²) | 209 | 256 22% | 245 17% | 231 11% | 221 6% | 211 1% |
| Brightness Distribution (%) | 73 | 85 16% | 83 14% | 80 10% | 88 21% | 88 21% |
| Black Level * (cd/m²) | 0.17 | 0.35 -106% | 0.19 -12% | 0.19 -12% | 0.26 -53% | 0.19 -12% |
| Contrast (:1) | 1306 | 783 -40% | 1379 6% | 1321 1% | 908 -30% | 1195 -8% |
| Colorchecker dE 2000 * | 3.91 | 6.1 -56% | 7 -79% | 5.1 -30% | 5.7 -46% | 5.6 -43% |
| Colorchecker dE 2000 max. * | 7.74 | 13.8 -78% | 23.6 -205% | 10.6 -37% | 22 -184% | 22.4 -189% |
| Greyscale dE 2000 * | 1.56 | 5.7 -265% | 6.4 -310% | 4.5 -188% | 3.8 -144% | 2.4 -54% |
| Gamma | 2.53 87% | 2.11 104% | 2.14 103% | 2.18 101% | 2.1 105% | 2.44 90% |
| CCT | 6701 97% | 6419 101% | 6065 107% | 6146 106% | 7318 89% | 6506 100% |
| Color Space (Percent of AdobeRGB 1998) (%) | 35 | 40.2 15% | 39.5 13% | 39.8 14% | 37.7 8% | 34.5 -1% |
| Color Space (Percent of sRGB) (%) | 55 | 62.4 13% | 61.9 13% | 62.5 14% | 59.2 8% | 54.4 -1% |
| Totalt genomsnitt (program/inställningar) | -4% /
-25% | -6% /
-29% | 6% /
-8% | -1% /
-22% | -2% /
-16% |
* ... mindre är bättre
Visa svarstider
| ↔ Svarstid svart till vitt | ||
|---|---|---|
| 33 ms ... stiga ↗ och falla ↘ kombinerat | ↗ 19 ms stiga | 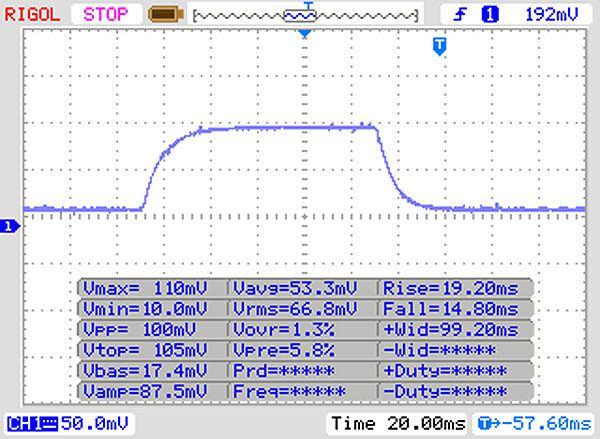 |
| ↘ 14 ms hösten | ||
| Skärmen visar långsamma svarsfrekvenser i våra tester och kommer att vara otillfredsställande för spelare. I jämförelse sträcker sig alla testade enheter från 0.1 (minst) till 240 (maximalt) ms. » 89 % av alla enheter är bättre. Detta innebär att den uppmätta svarstiden är sämre än genomsnittet av alla testade enheter (19.9 ms). | ||
| ↔ Svarstid 50 % grått till 80 % grått | ||
| 73 ms ... stiga ↗ och falla ↘ kombinerat | ↗ 36 ms stiga | 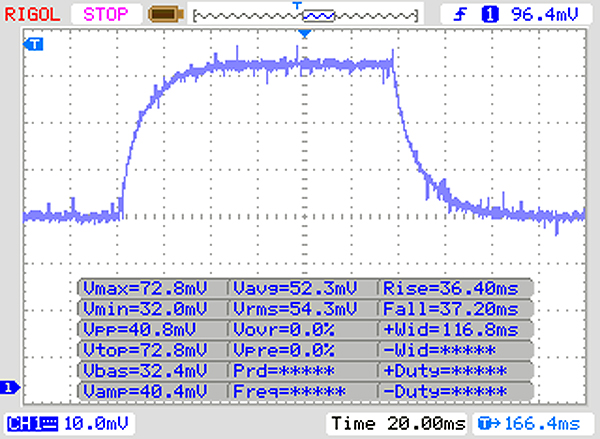 |
| ↘ 37 ms hösten | ||
| Skärmen visar långsamma svarsfrekvenser i våra tester och kommer att vara otillfredsställande för spelare. I jämförelse sträcker sig alla testade enheter från 0.165 (minst) till 636 (maximalt) ms. » 99 % av alla enheter är bättre. Detta innebär att den uppmätta svarstiden är sämre än genomsnittet av alla testade enheter (31.1 ms). | ||
Skärmflimmer / PWM (Puls-Width Modulation)
| Skärmflimmer / PWM upptäcktes inte | 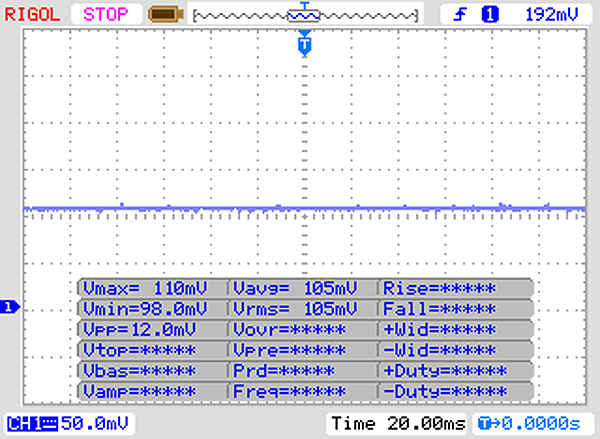 | ||
Som jämförelse: 52 % av alla testade enheter använder inte PWM för att dämpa skärmen. Om PWM upptäcktes mättes ett medelvärde av 7791 (minst: 5 - maximum: 343500) Hz. | |||
* ... mindre är bättre
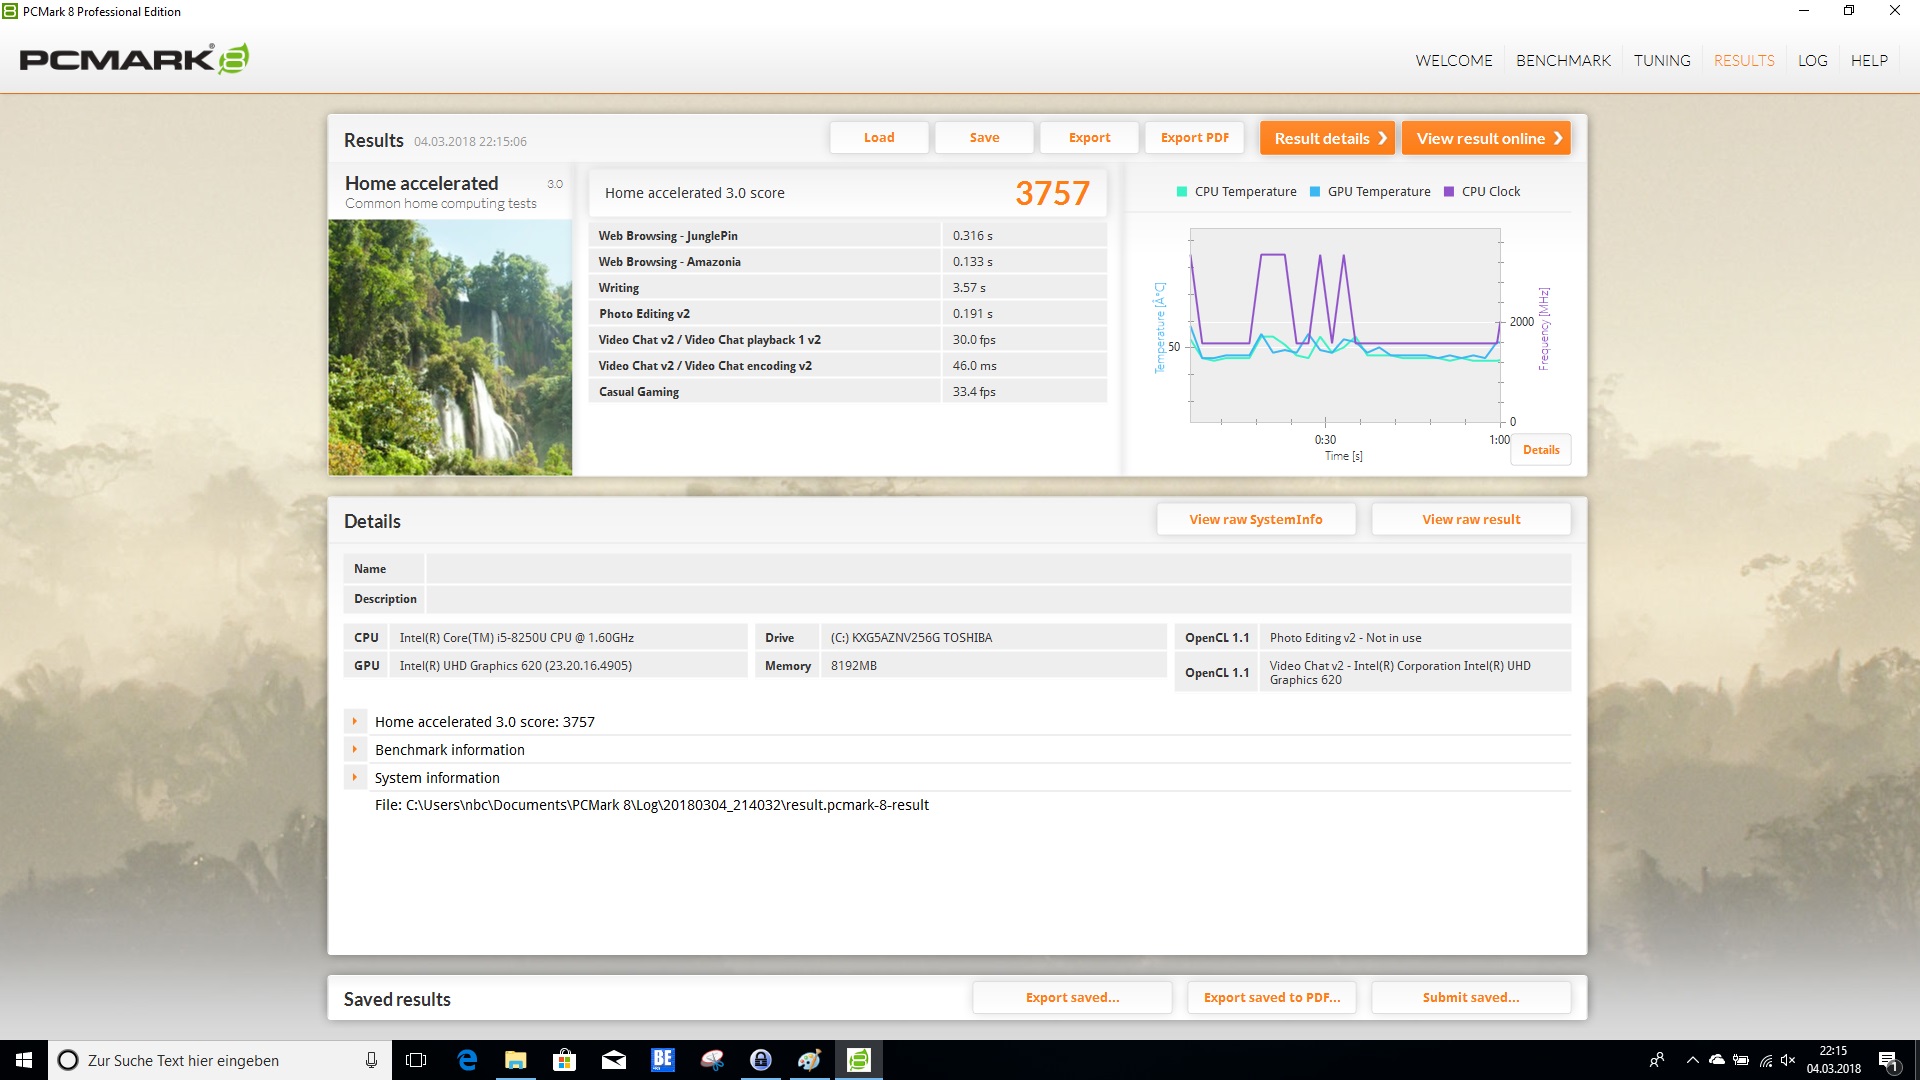
| PCMark 8 Home Score Accelerated v2 | 3757 poäng | |
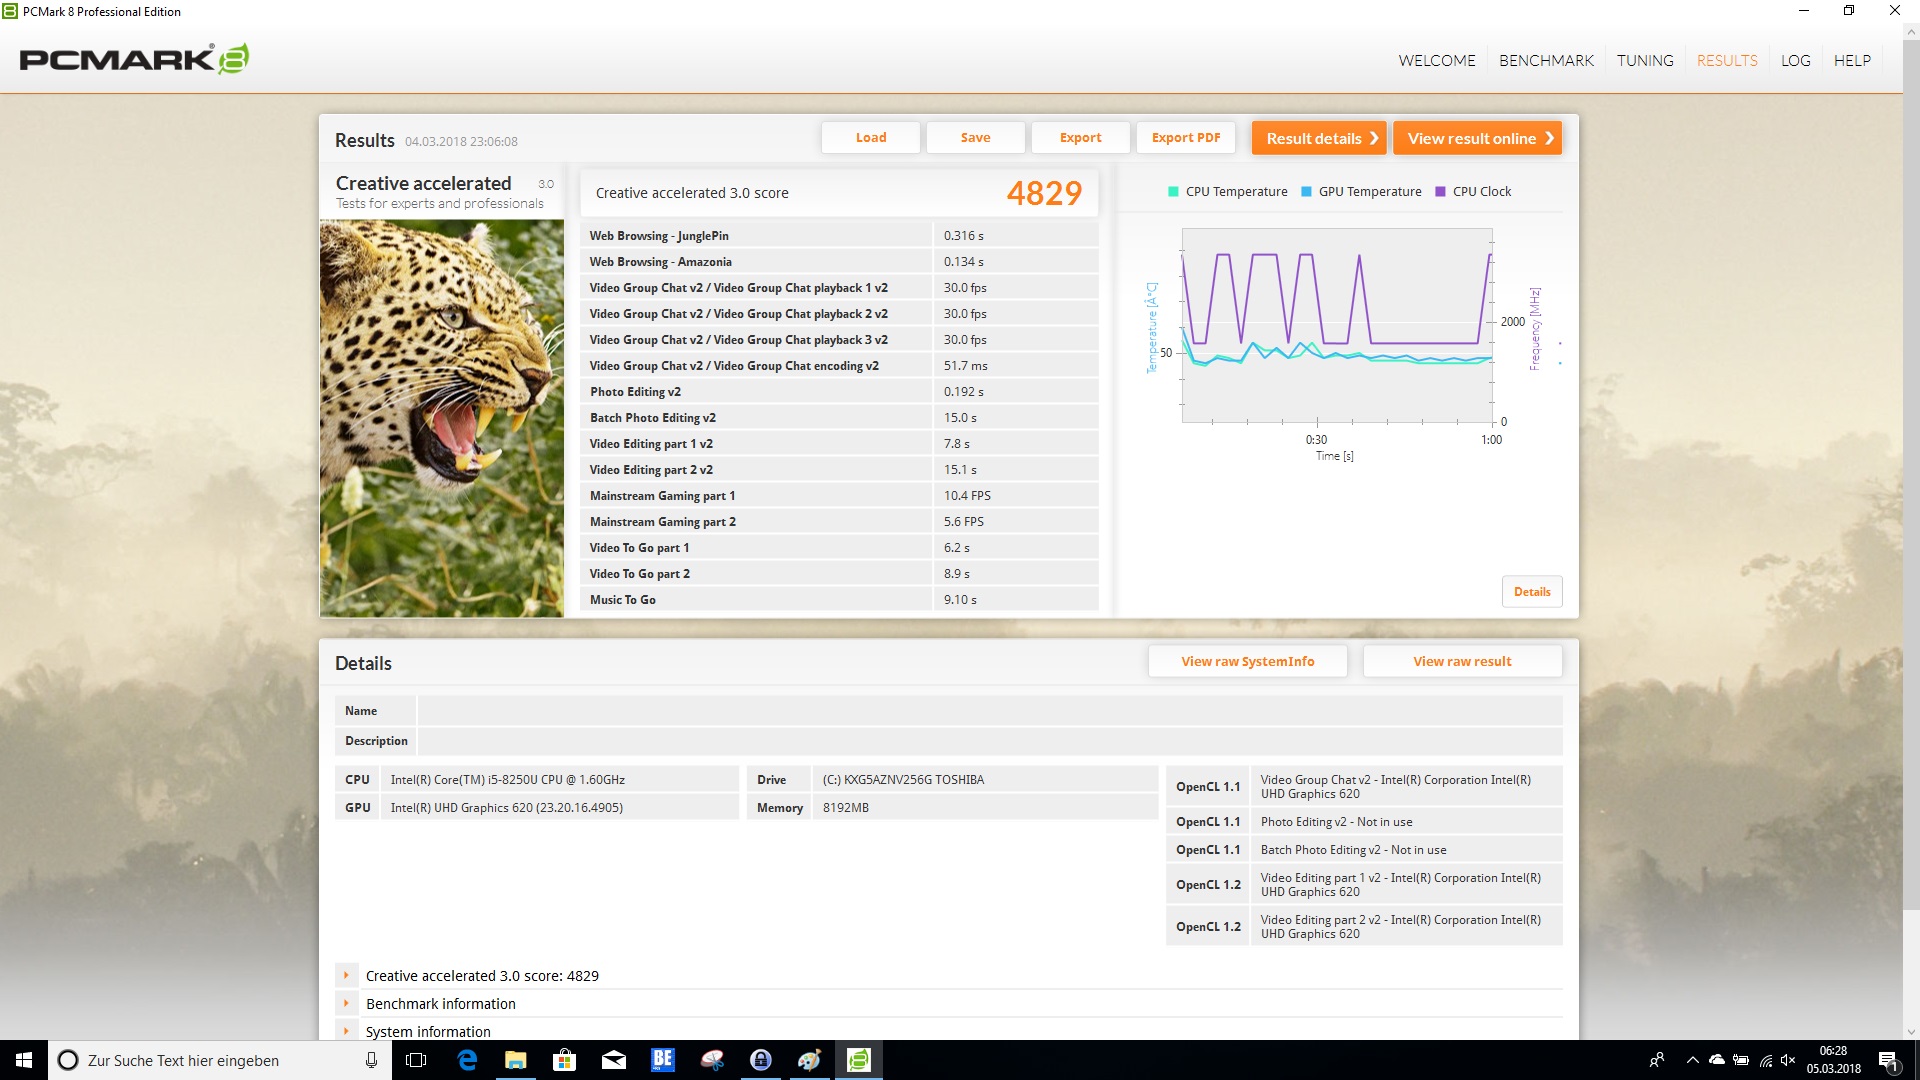
| PCMark 8 Creative Score Accelerated v2 | 4829 poäng | |
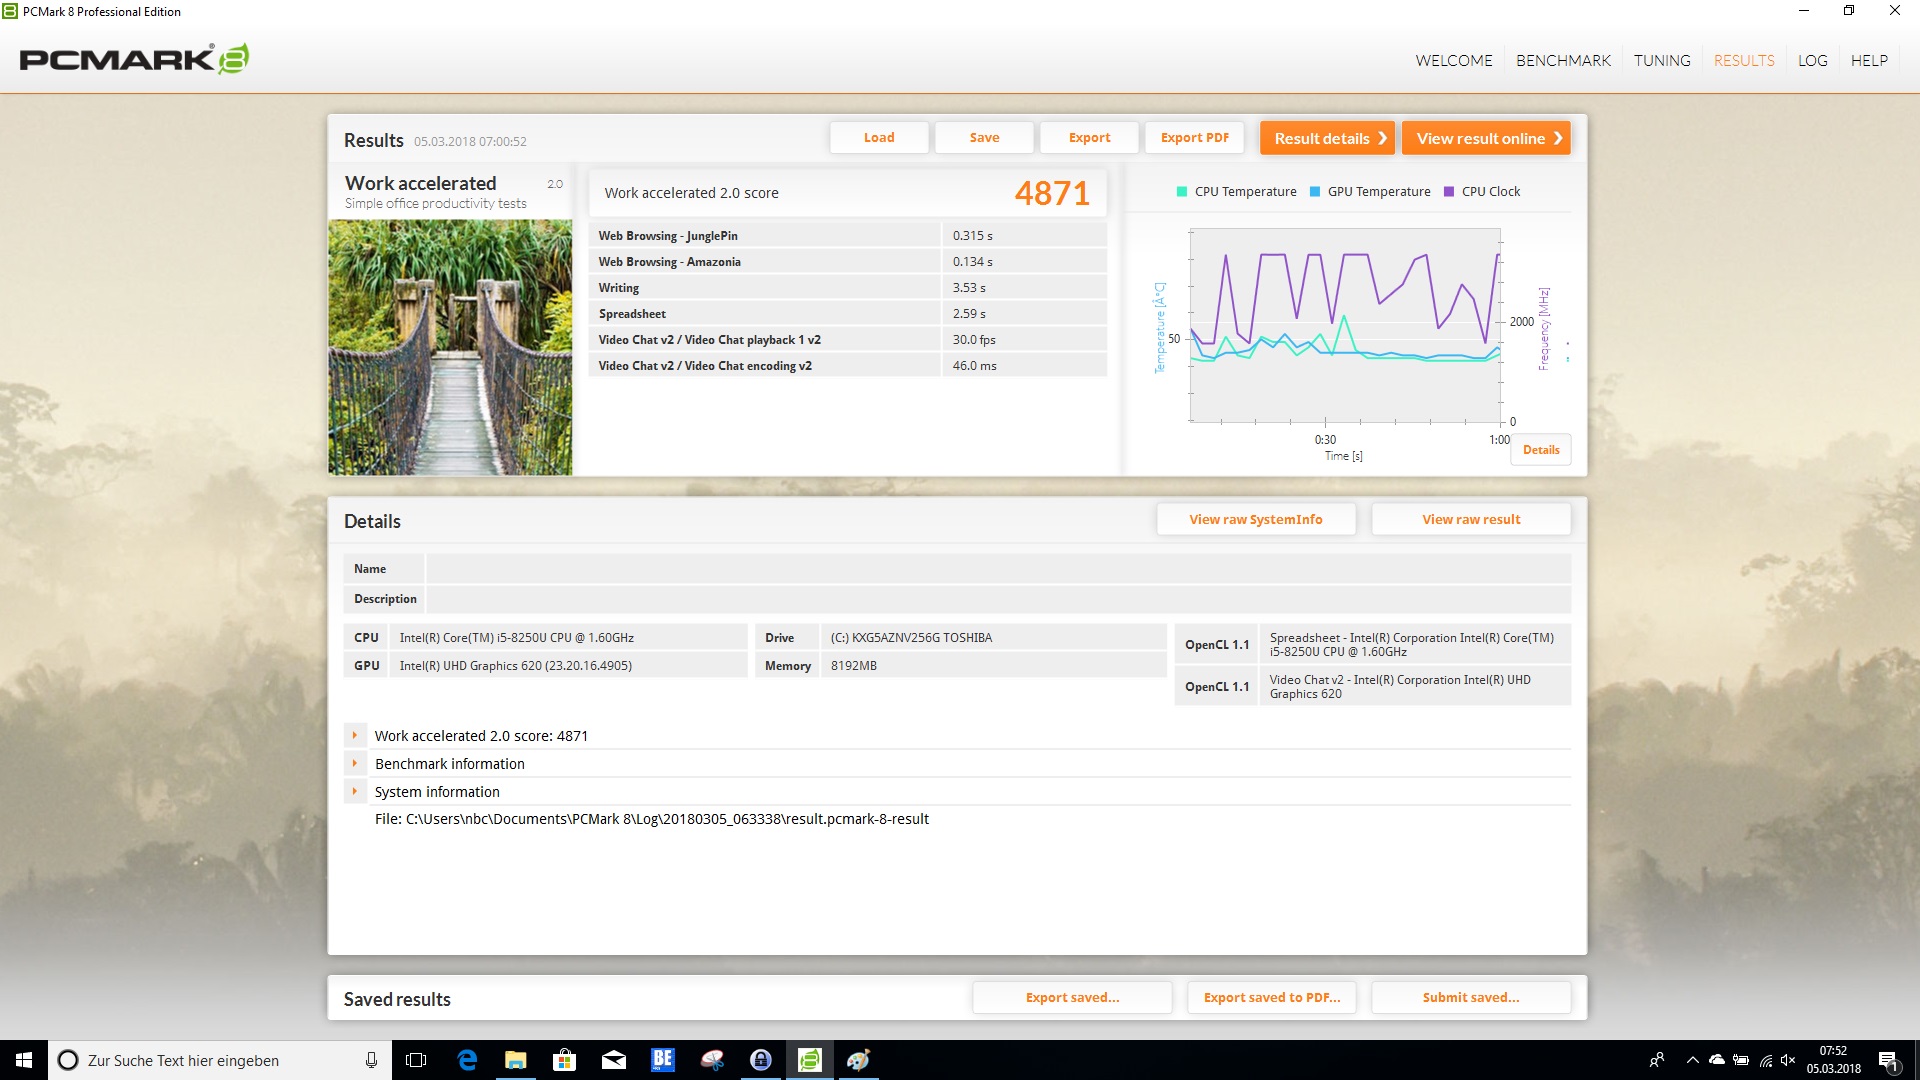
| PCMark 8 Work Score Accelerated v2 | 4871 poäng | |
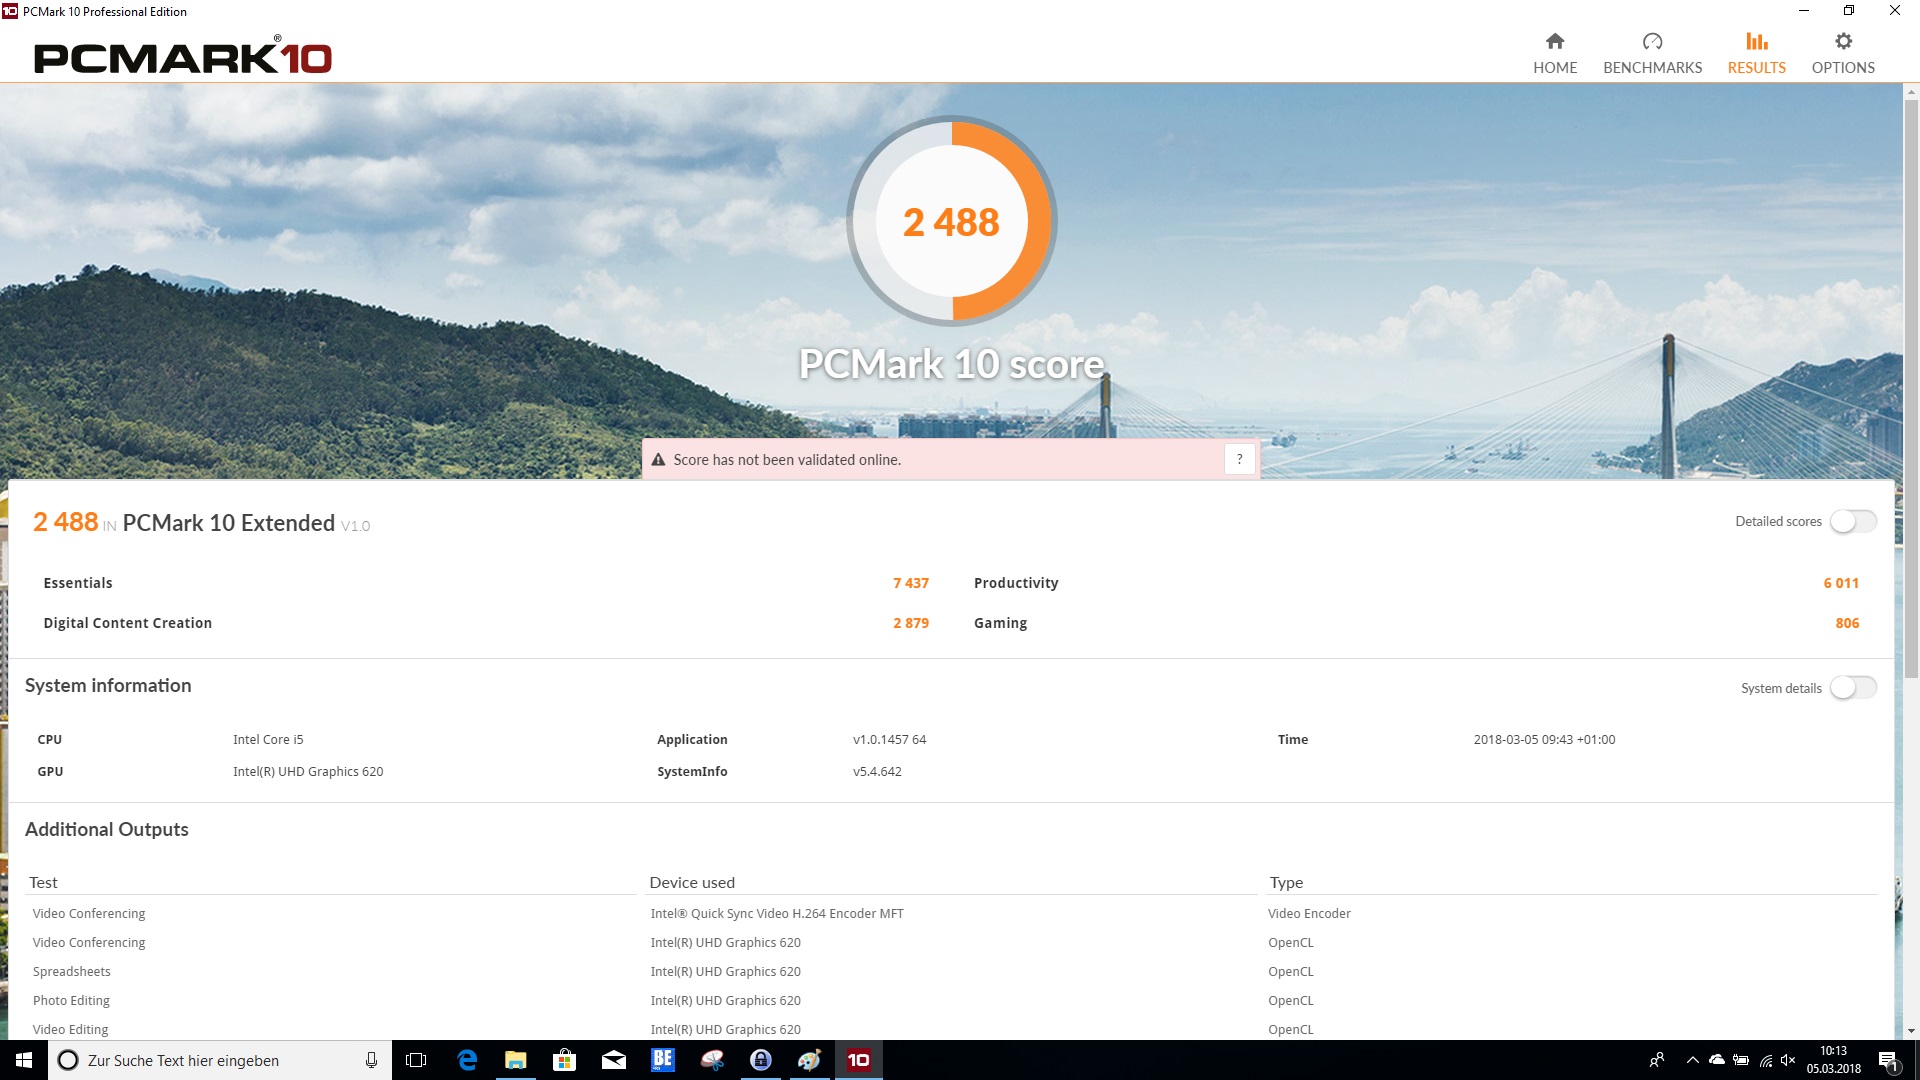
| PCMark 10 Score | 2488 poäng | |
Hjälp | ||
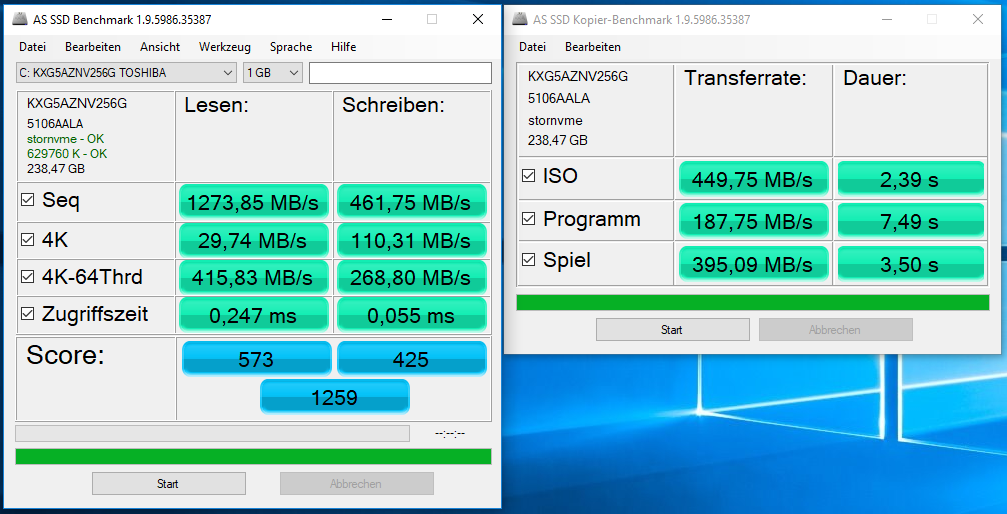
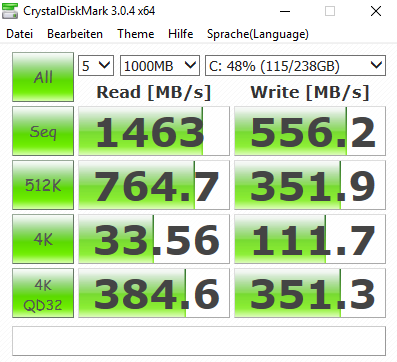
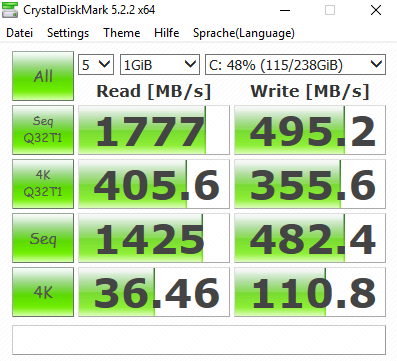
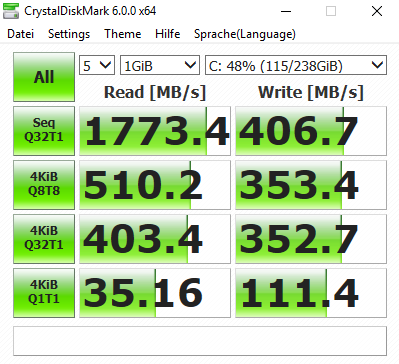
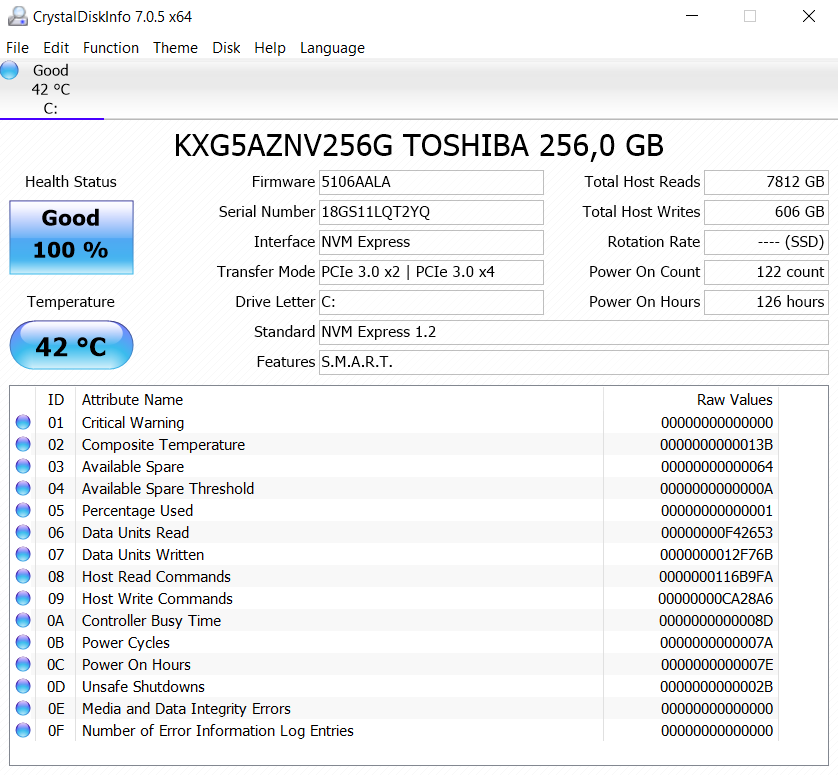
| Lenovo ThinkPad L480-20LS001AGE Toshiba KXG5AZNV256G | Lenovo ThinkPad L470-20J5S00C00 SanDisk X400 256GB, SATA (SD8SB8U-256G) | Lenovo ThinkPad E480-20KNCTO1WW Toshiba KBG30ZMT128G | Lenovo ThinkPad E480-20KQS00000 Lenovo LENSE20256GMSP34MEAT2TA | HP ProBook 440 G5-3KX87ES Intel SSD 600p SSDPEKKW256G7 | Dell Latitude 5490-TD70X Toshiba KSG60ZMV512G | |
|---|---|---|---|---|---|---|
| CrystalDiskMark 3.0 | -31% | -42% | -30% | 13% | -27% | |
| Read Seq (MB/s) | 1463 | 495.2 -66% | 909 -38% | 1295 -11% | 1181 -19% | 465.1 -68% |
| Write Seq (MB/s) | 556 | 485.7 -13% | 128.4 -77% | 160.6 -71% | 602 8% | 425 -24% |
| Read 512 (MB/s) | 765 | 323.4 -58% | 715 -7% | 872 14% | 923 21% | 410.1 -46% |
| Write 512 (MB/s) | 351.9 | 291.5 -17% | 127 -64% | 122 -65% | 600 71% | 360.7 3% |
| Read 4k (MB/s) | 33.56 | 34.2 2% | 33.35 -1% | 25.72 -23% | 35.48 6% | 27.34 -19% |
| Write 4k (MB/s) | 111.7 | 74.3 -33% | 82.3 -26% | 95.2 -15% | 139.8 25% | 89 -20% |
| Read 4k QD32 (MB/s) | 384.6 | 321.3 -16% | 197.5 -49% | 389.9 1% | 287.8 -25% | 295.6 -23% |
| Write 4k QD32 (MB/s) | 351.3 | 188 -46% | 100.2 -71% | 118.3 -66% | 417.1 19% | 300.2 -15% |

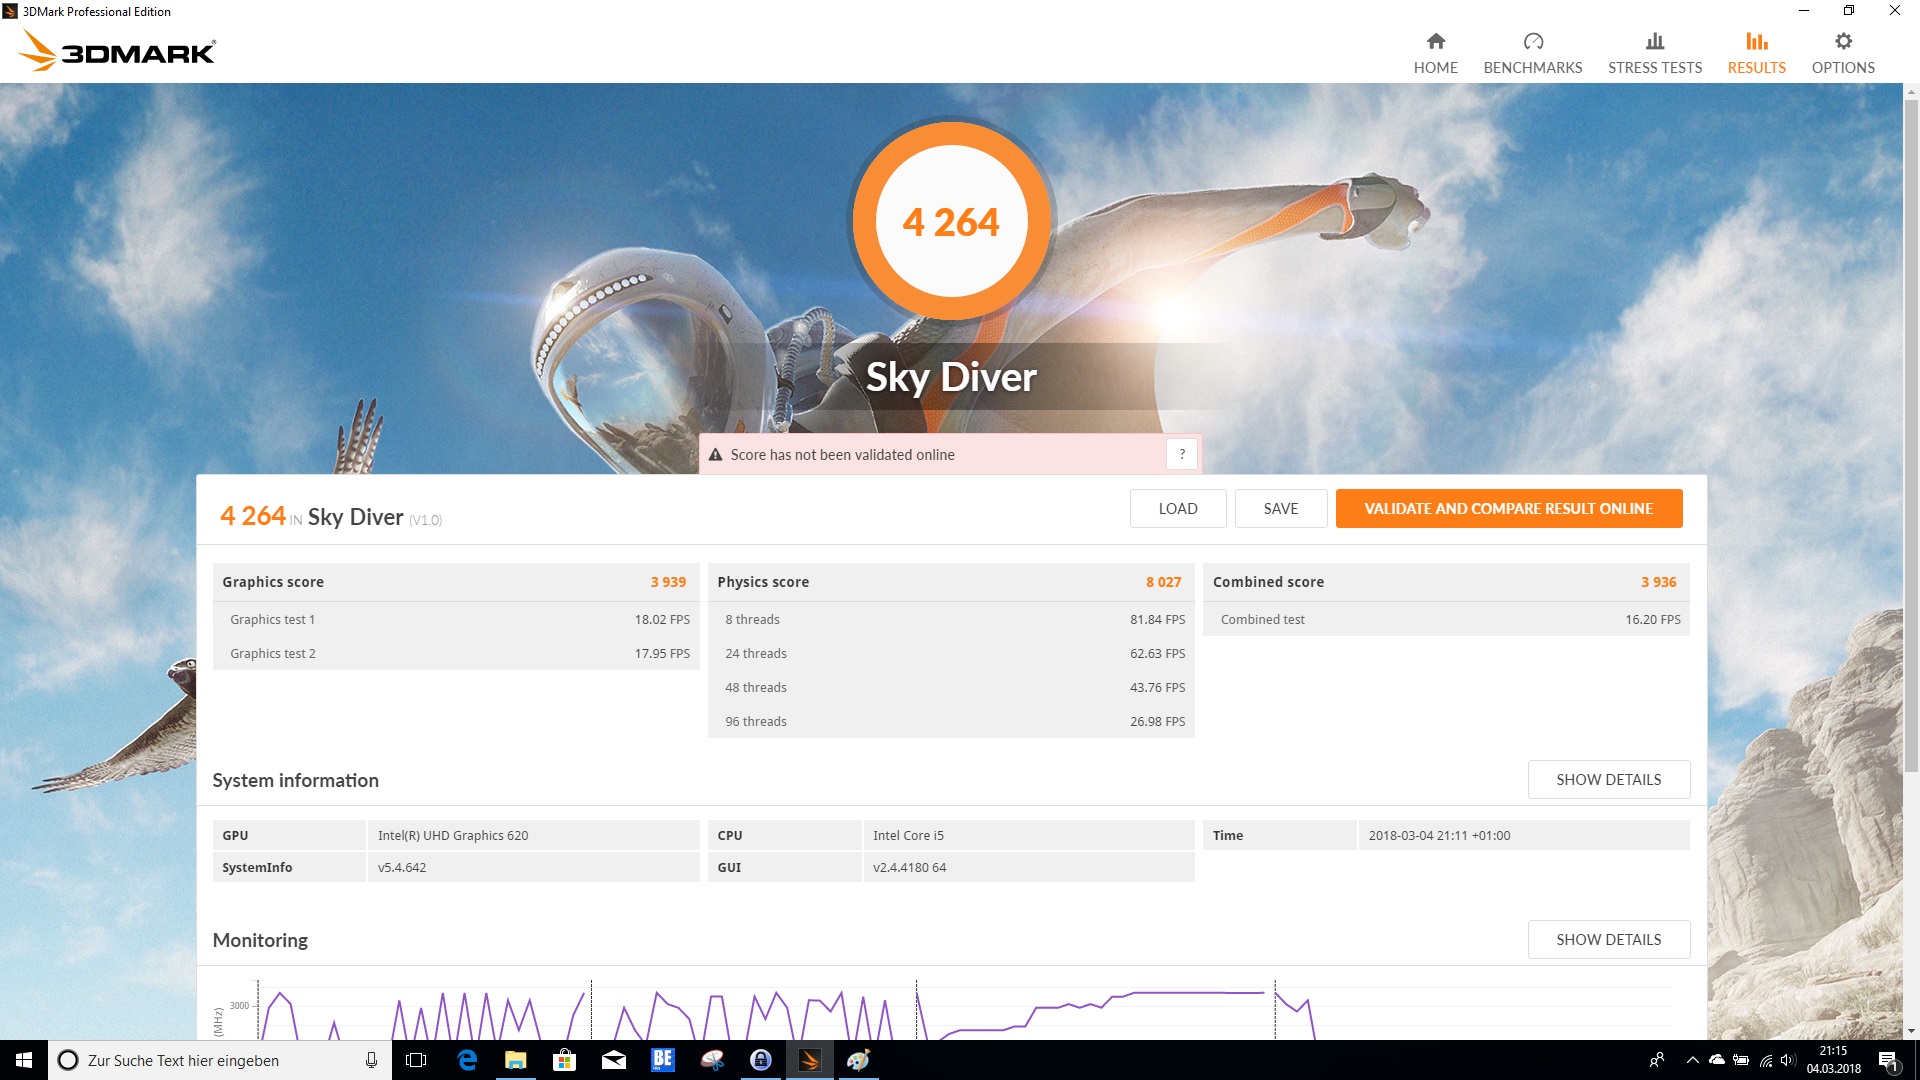
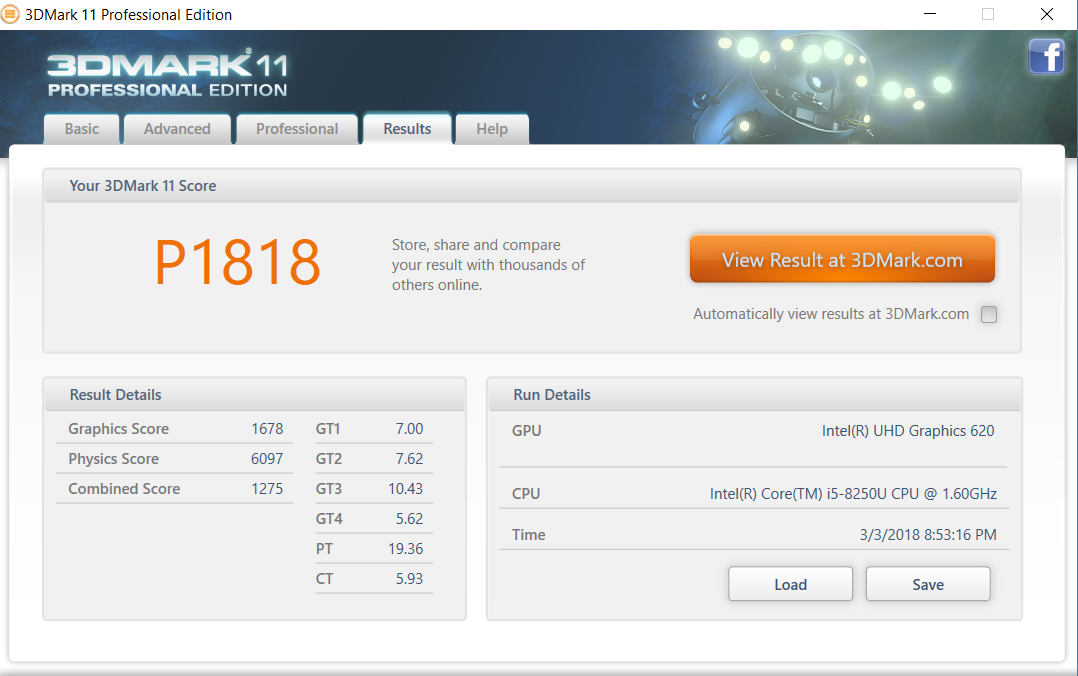
| 3DMark 11 Performance | 1818 poäng | |
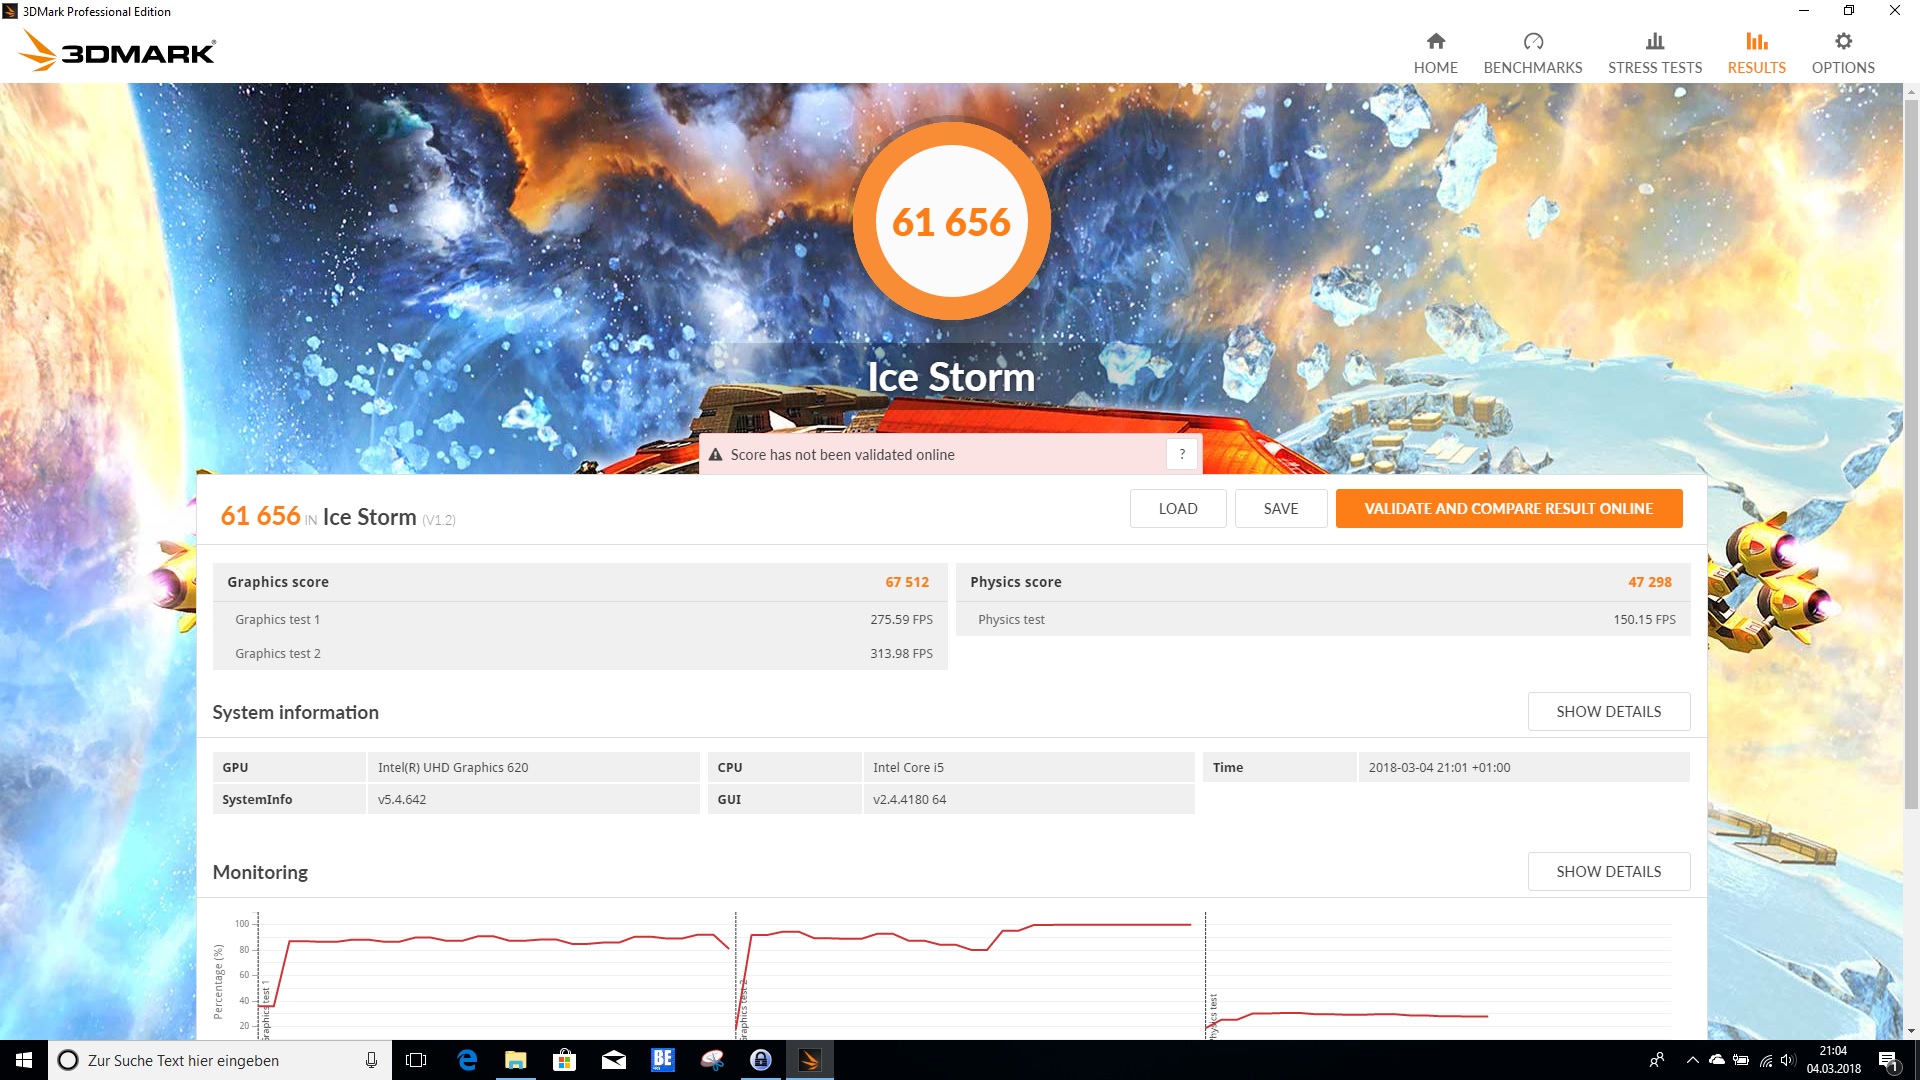
| 3DMark Ice Storm Standard Score | 61656 poäng | |
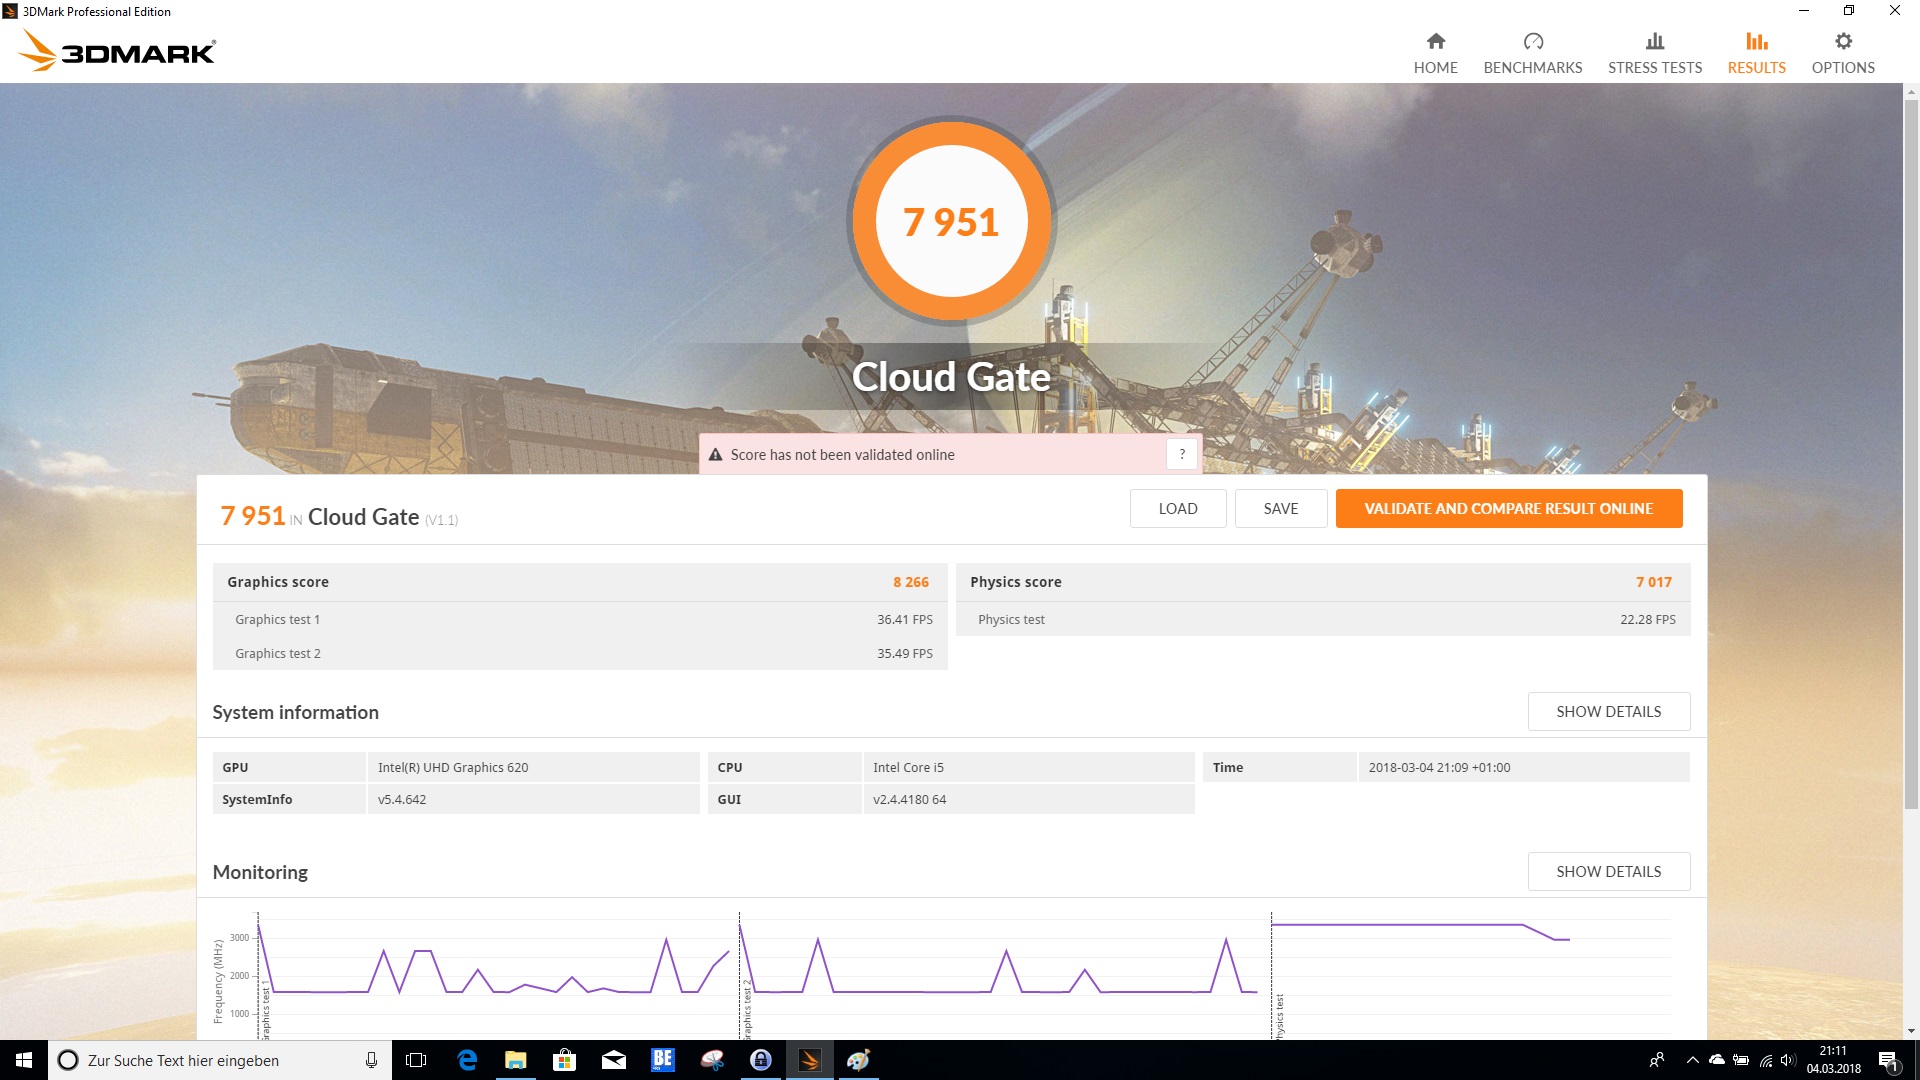
| 3DMark Cloud Gate Standard Score | 7951 poäng | |
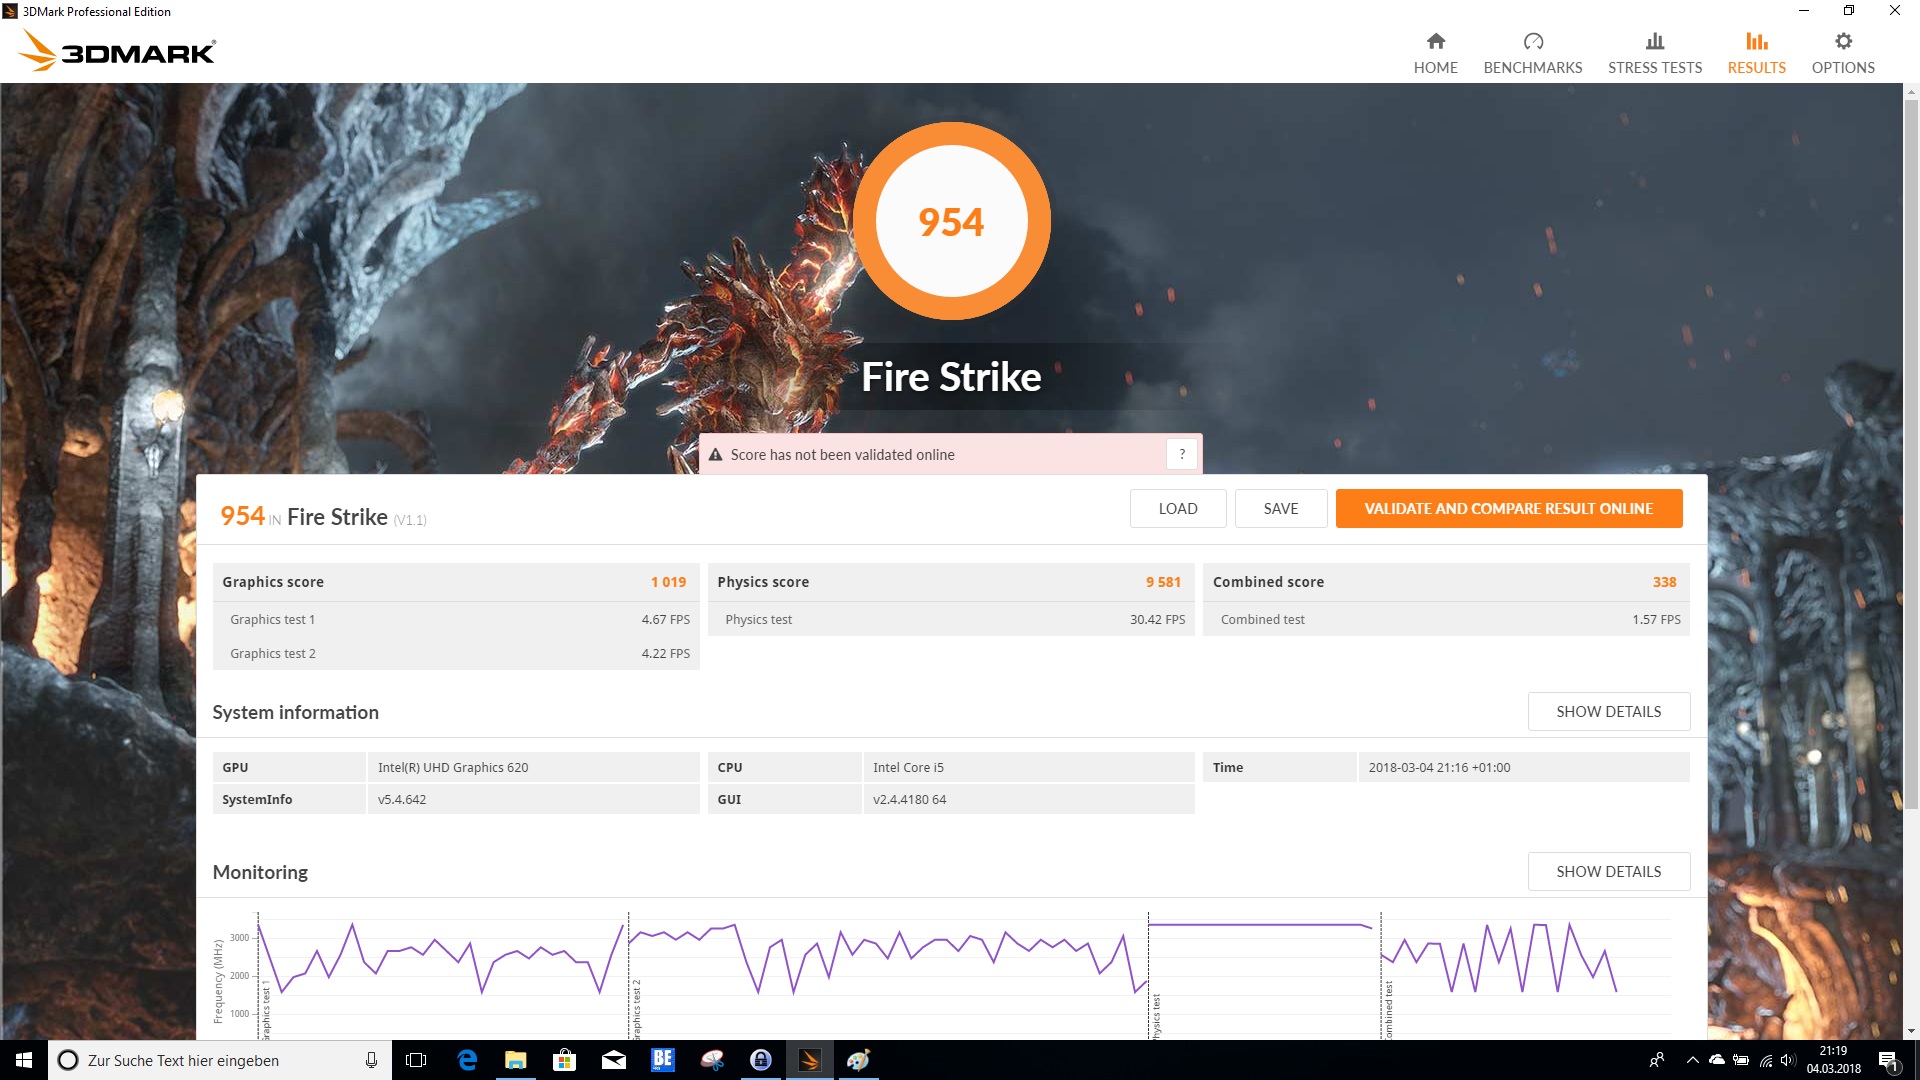
| 3DMark Fire Strike Score | 954 poäng | |
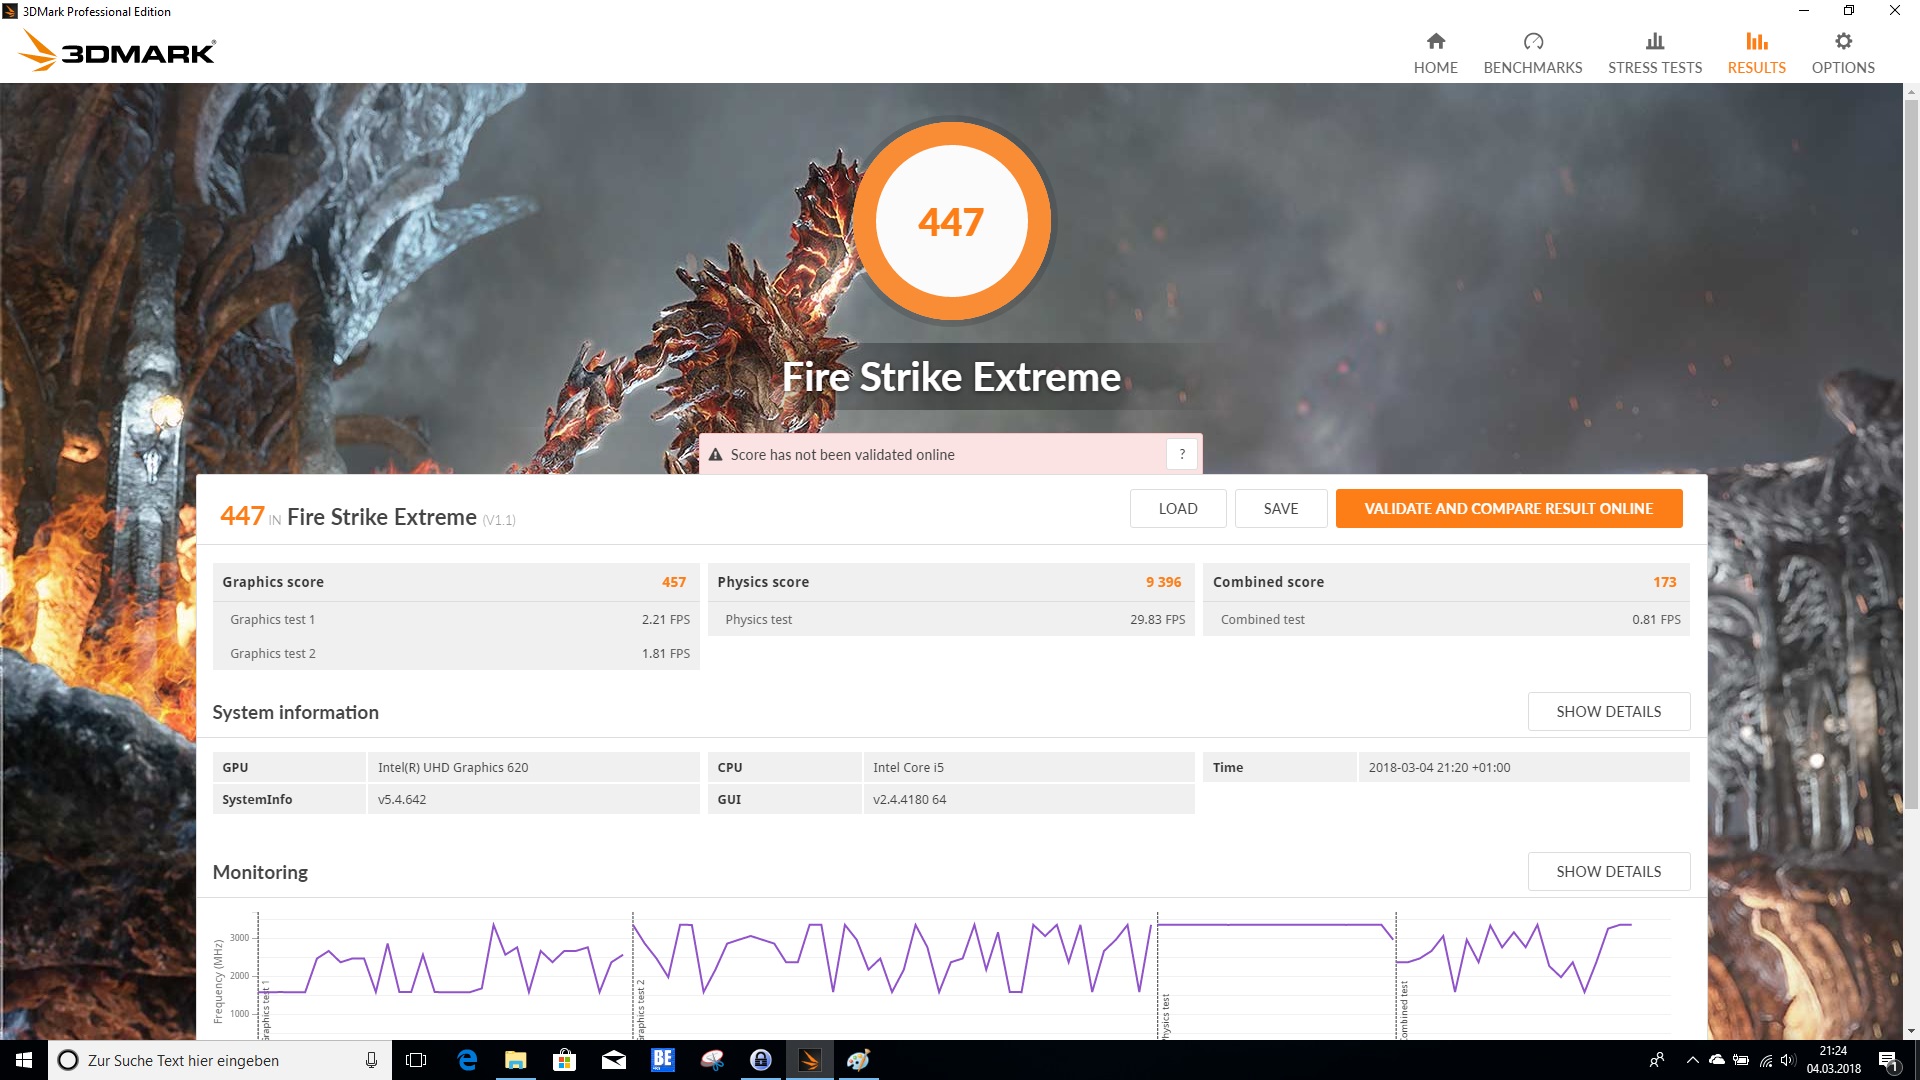
| 3DMark Fire Strike Extreme Score | 447 poäng | |
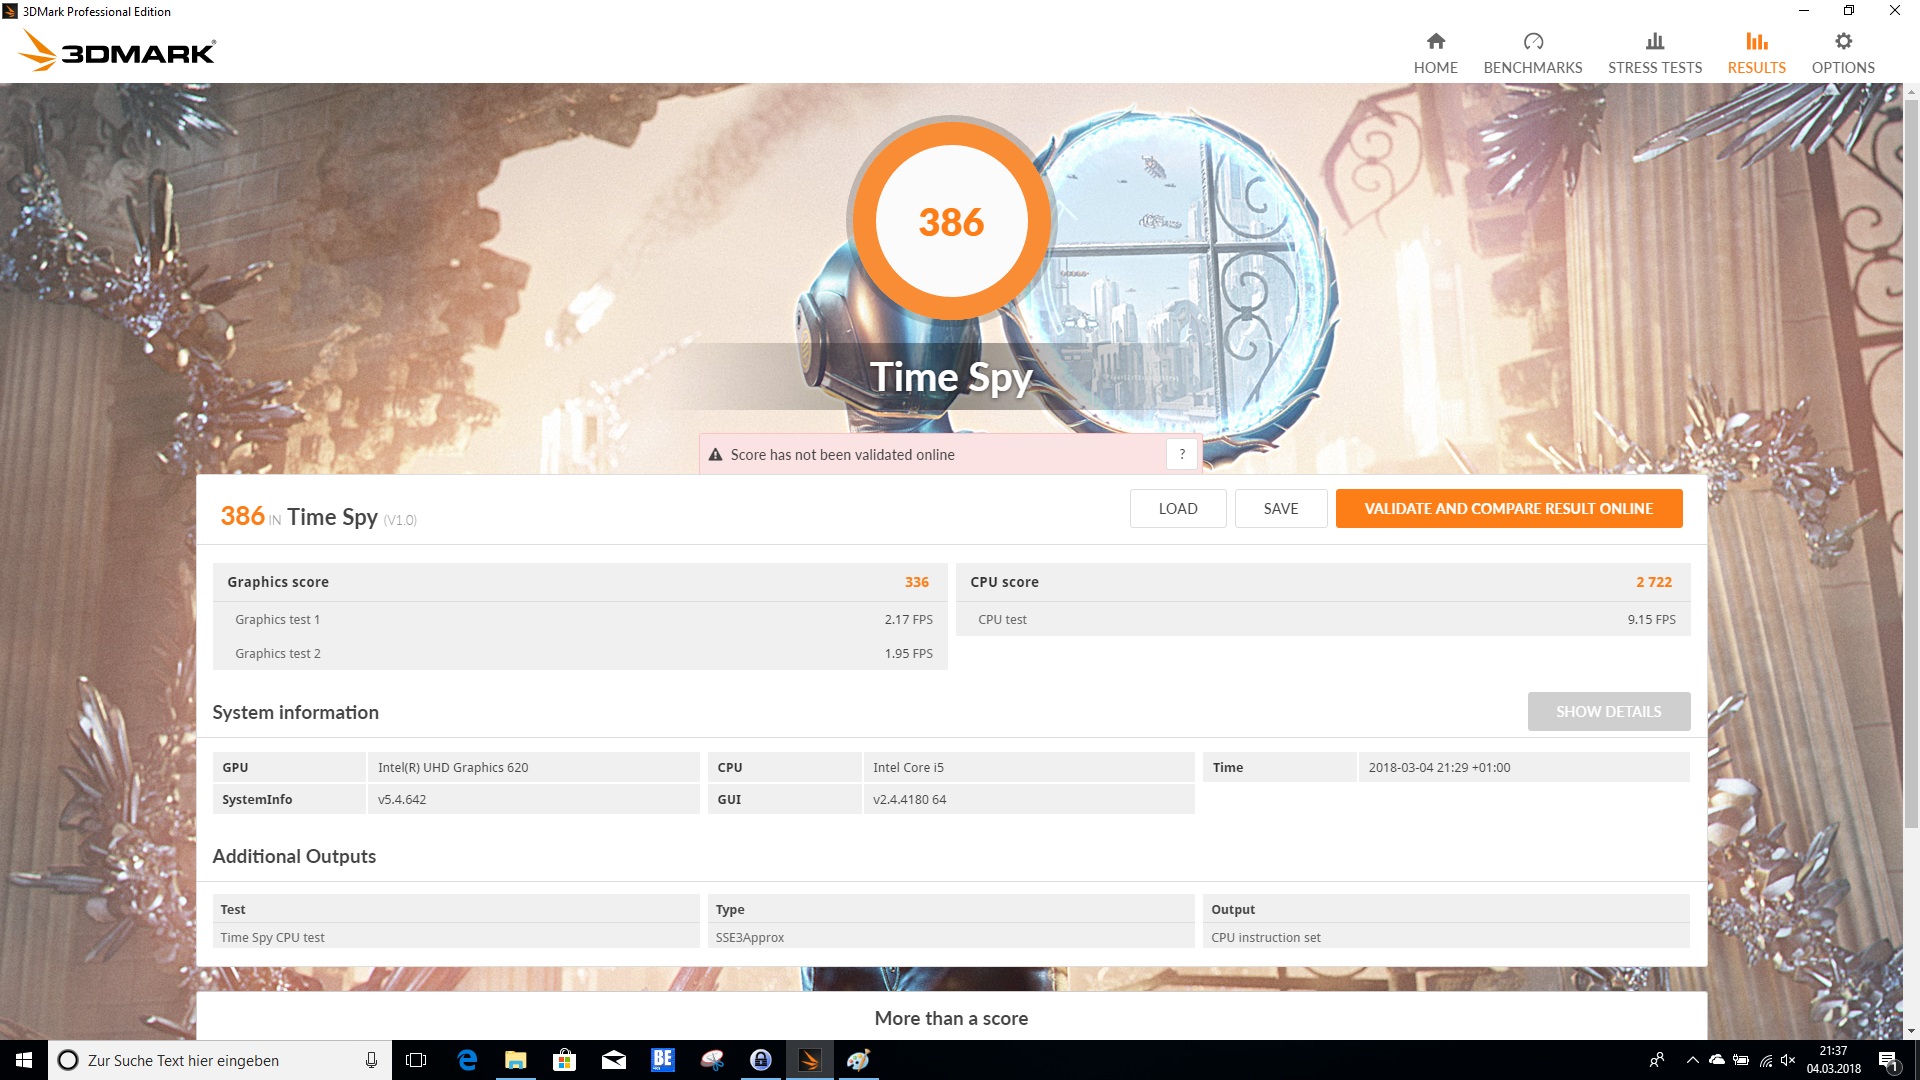
| 3DMark Time Spy Score | 386 poäng | |
Hjälp | ||
| låg | med. | hög | ultra | |
|---|---|---|---|---|
| BioShock Infinite (2013) | 47.4 | 27.8 | 23 | 7.7 |
| The Witcher 3 (2015) | 15.2 | 9.8 | 5.5 | |
| Rise of the Tomb Raider (2016) | 18.6 | 11.4 | 6.5 |
Ljudnivå
| Låg belastning |
| 30.4 / 30.4 / 30.4 dB(A) |
| Hög belastning |
| 32.3 / 37 dB(A) |
 | ||
30 dB tyst 40 dB(A) hörbar 50 dB(A) högt ljud |
||
min: | ||
| Lenovo ThinkPad L480-20LS001AGE UHD Graphics 620, i5-8250U, Toshiba KXG5AZNV256G | Lenovo ThinkPad L470-20J5S00C00 HD Graphics 620, i5-7200U, SanDisk X400 256GB, SATA (SD8SB8U-256G) | Lenovo ThinkPad E480-20KNCTO1WW UHD Graphics 620, i5-8250U, Toshiba KBG30ZMT128G | Lenovo ThinkPad E480-20KQS00000 Radeon RX 550 (Laptop), i5-8250U, Lenovo LENSE20256GMSP34MEAT2TA | HP ProBook 440 G5-3KX87ES UHD Graphics 620, i5-8250U, Intel SSD 600p SSDPEKKW256G7 | Dell Latitude 5490-TD70X UHD Graphics 620, i5-8350U, Toshiba KSG60ZMV512G | |
|---|---|---|---|---|---|---|
| Noise | 2% | 4% | -7% | 1% | -2% | |
| av / miljö * (dB) | 30.4 | 29.3 4% | 29.1 4% | 29.8 2% | 29.1 4% | 28.8 5% |
| Idle Minimum * (dB) | 30.4 | 29.3 4% | 29.1 4% | 29.8 2% | 29.1 4% | 28.8 5% |
| Idle Average * (dB) | 30.4 | 29.3 4% | 29.1 4% | 31.5 -4% | 29.1 4% | 28.8 5% |
| Idle Maximum * (dB) | 30.4 | 29.3 4% | 30.3 -0% | 33.3 -10% | 30.7 -1% | 30.9 -2% |
| Load Average * (dB) | 32.3 | 33.8 -5% | 31.8 2% | 39.1 -21% | 34.5 -7% | 35.6 -10% |
| Load Maximum * (dB) | 37 | 37.5 -1% | 33.8 9% | 40.4 -9% | 36 3% | 41.4 -12% |
| Witcher 3 ultra * (dB) | 39.1 |
* ... mindre är bättre
(±) Den maximala temperaturen på ovansidan är 43 °C / 109 F, jämfört med genomsnittet av 34.3 °C / 94 F , allt från 21.2 till 62.5 °C för klassen Office.
(±) Botten värms upp till maximalt 41.7 °C / 107 F, jämfört med genomsnittet av 36.8 °C / 98 F
(+) Vid tomgångsbruk är medeltemperaturen för ovansidan 24 °C / 75 F, jämfört med enhetsgenomsnittet på 29.5 °C / ### class_avg_f### F.
(+) Handledsstöden och pekplattan är kallare än hudtemperaturen med maximalt 24 °C / 75.2 F och är därför svala att ta på.
(+) Medeltemperaturen för handledsstödsområdet på liknande enheter var 27.5 °C / 81.5 F (+3.5 °C / 6.3 F).
| Lenovo ThinkPad L480-20LS001AGE UHD Graphics 620, i5-8250U, Toshiba KXG5AZNV256G | Lenovo ThinkPad L470-20J5S00C00 HD Graphics 620, i5-7200U, SanDisk X400 256GB, SATA (SD8SB8U-256G) | Lenovo ThinkPad E480-20KNCTO1WW UHD Graphics 620, i5-8250U, Toshiba KBG30ZMT128G | Lenovo ThinkPad E480-20KQS00000 Radeon RX 550 (Laptop), i5-8250U, Lenovo LENSE20256GMSP34MEAT2TA | HP ProBook 440 G5-3KX87ES UHD Graphics 620, i5-8250U, Intel SSD 600p SSDPEKKW256G7 | Dell Latitude 5490-TD70X UHD Graphics 620, i5-8350U, Toshiba KSG60ZMV512G | |
|---|---|---|---|---|---|---|
| Heat | 4% | 9% | -25% | 3% | 5% | |
| Maximum Upper Side * (°C) | 43 | 40.1 7% | 36.7 15% | 51.9 -21% | 39 9% | 38.3 11% |
| Maximum Bottom * (°C) | 41.7 | 51 -22% | 42.8 -3% | 71.6 -72% | 45.5 -9% | 44.7 -7% |
| Idle Upper Side * (°C) | 25.7 | 22 14% | 23.4 9% | 24.8 4% | 24.8 4% | 23.7 8% |
| Idle Bottom * (°C) | 27.1 | 22.4 17% | 22.8 16% | 30 -11% | 25 8% | 25.4 6% |
* ... mindre är bättre
Lenovo ThinkPad L480-20LS001AGE ljudanalys
(-) | inte särskilt höga högtalare (68.3 dB)
Bas 100 - 315 Hz
(-) | nästan ingen bas - i genomsnitt 21.3% lägre än medianen
(±) | linjäriteten för basen är genomsnittlig (10.9% delta till föregående frekvens)
Mellan 400 - 2000 Hz
(+) | balanserad mellan - endast 4.2% från medianen
(±) | linjäriteten för mids är genomsnittlig (14% delta till föregående frekvens)
Högsta 2 - 16 kHz
(+) | balanserade toppar - endast 2.6% från medianen
(±) | linjäriteten för toppar är genomsnittlig (9.1% delta till föregående frekvens)
Totalt 100 - 16 000 Hz
(±) | linjäriteten för det totala ljudet är genomsnittlig (24.3% skillnad mot median)
Jämfört med samma klass
» 71% av alla testade enheter i den här klassen var bättre, 8% liknande, 21% sämre
» Den bästa hade ett delta på 7%, genomsnittet var 21%, sämst var 53%
Jämfört med alla testade enheter
» 74% av alla testade enheter var bättre, 6% liknande, 21% sämre
» Den bästa hade ett delta på 4%, genomsnittet var 24%, sämst var 134%
Lenovo ThinkPad E480-20KQS00000 ljudanalys
(±) | högtalarljudstyrkan är genomsnittlig men bra (76.6 dB)
Bas 100 - 315 Hz
(±) | reducerad bas - i genomsnitt 13.2% lägre än medianen
(±) | linjäriteten för basen är genomsnittlig (12.4% delta till föregående frekvens)
Mellan 400 - 2000 Hz
(±) | högre mellan - i genomsnitt 5.2% högre än median
(±) | linjäriteten för mids är genomsnittlig (9.6% delta till föregående frekvens)
Högsta 2 - 16 kHz
(+) | balanserade toppar - endast 3.8% från medianen
(±) | linjäriteten för toppar är genomsnittlig (10.2% delta till föregående frekvens)
Totalt 100 - 16 000 Hz
(±) | linjäriteten för det totala ljudet är genomsnittlig (19.9% skillnad mot median)
Jämfört med samma klass
» 42% av alla testade enheter i den här klassen var bättre, 9% liknande, 49% sämre
» Den bästa hade ett delta på 7%, genomsnittet var 21%, sämst var 53%
Jämfört med alla testade enheter
» 51% av alla testade enheter var bättre, 7% liknande, 42% sämre
» Den bästa hade ett delta på 4%, genomsnittet var 24%, sämst var 134%
| Av/Standby | |
| Låg belastning | |
| Hög belastning |
|
Förklaring:
min: | |
| Lenovo ThinkPad L480-20LS001AGE i5-8250U, UHD Graphics 620, Toshiba KXG5AZNV256G, IPS, 1920x1080, 14" | Lenovo ThinkPad L470-20J5S00C00 i5-7200U, HD Graphics 620, SanDisk X400 256GB, SATA (SD8SB8U-256G), IPS, 1920x1080, 14" | Lenovo ThinkPad E480-20KNCTO1WW i5-8250U, UHD Graphics 620, Toshiba KBG30ZMT128G, IPS LED, 1920x1080, 14" | Lenovo ThinkPad E480-20KQS00000 i5-8250U, Radeon RX 550 (Laptop), Lenovo LENSE20256GMSP34MEAT2TA, IPS LED, 1920x1080, 14" | HP ProBook 440 G5-3KX87ES i5-8250U, UHD Graphics 620, Intel SSD 600p SSDPEKKW256G7, IPS LED, 1920x1080, 14" | Dell Latitude 5490-TD70X i5-8350U, UHD Graphics 620, Toshiba KSG60ZMV512G, IPS, 1920x1080, 14" | |
|---|---|---|---|---|---|---|
| Power Consumption | 9% | 9% | -26% | -20% | -12% | |
| Idle Minimum * (Watt) | 3.3 | 2.6 21% | 3.5 -6% | 4.1 -24% | 4.4 -33% | 3.3 -0% |
| Idle Average * (Watt) | 6.6 | 6.3 5% | 5.3 20% | 6.3 5% | 7.1 -8% | 5.54 16% |
| Idle Maximum * (Watt) | 7.3 | 7 4% | 6.1 16% | 7.1 3% | 10.2 -40% | 6.59 10% |
| Load Average * (Watt) | 40.4 | 29.1 28% | 30 26% | 54.8 -36% | 36.5 10% | 42.4 -5% |
| Load Maximum * (Watt) | 37.4 | 42.3 -13% | 42.3 -13% | 66.4 -78% | 48.7 -30% | 67.6 -81% |
| Witcher 3 ultra * (Watt) | 43.8 |
* ... mindre är bättre
| Lenovo ThinkPad L480-20LS001AGE i5-8250U, UHD Graphics 620, 45 Wh | Lenovo ThinkPad L470-20J5S00C00 i5-7200U, HD Graphics 620, 48 Wh | Lenovo ThinkPad E480-20KNCTO1WW i5-8250U, UHD Graphics 620, 45 Wh | Lenovo ThinkPad E480-20KQS00000 i5-8250U, Radeon RX 550 (Laptop), 48 Wh | HP ProBook 440 G5-3KX87ES i5-8250U, UHD Graphics 620, 48 Wh | Dell Latitude 5490-TD70X i5-8350U, UHD Graphics 620, 68 Wh | |
|---|---|---|---|---|---|---|
| Batteridrifttid | 31% | 7% | 0% | 6% | 55% | |
| Reader / Idle (h) | 16.9 | 23.3 38% | 18.4 9% | 19.4 15% | 13.7 -19% | 25.9 53% |
| H.264 (h) | 8 | 10.8 35% | 7.2 -10% | 8.9 11% | 3.7 -54% | 13.2 65% |
| WiFi v1.3 (h) | 7.7 | 8 4% | 8.3 8% | 5.7 -26% | 6.9 -10% | 15 95% |
| Load (h) | 1.5 | 2.2 47% | 1.8 20% | 1.5 0% | 3.1 107% | 1.6 7% |
För
Emot

Läs den fullständiga versionen av den här recensionen på engelska här.
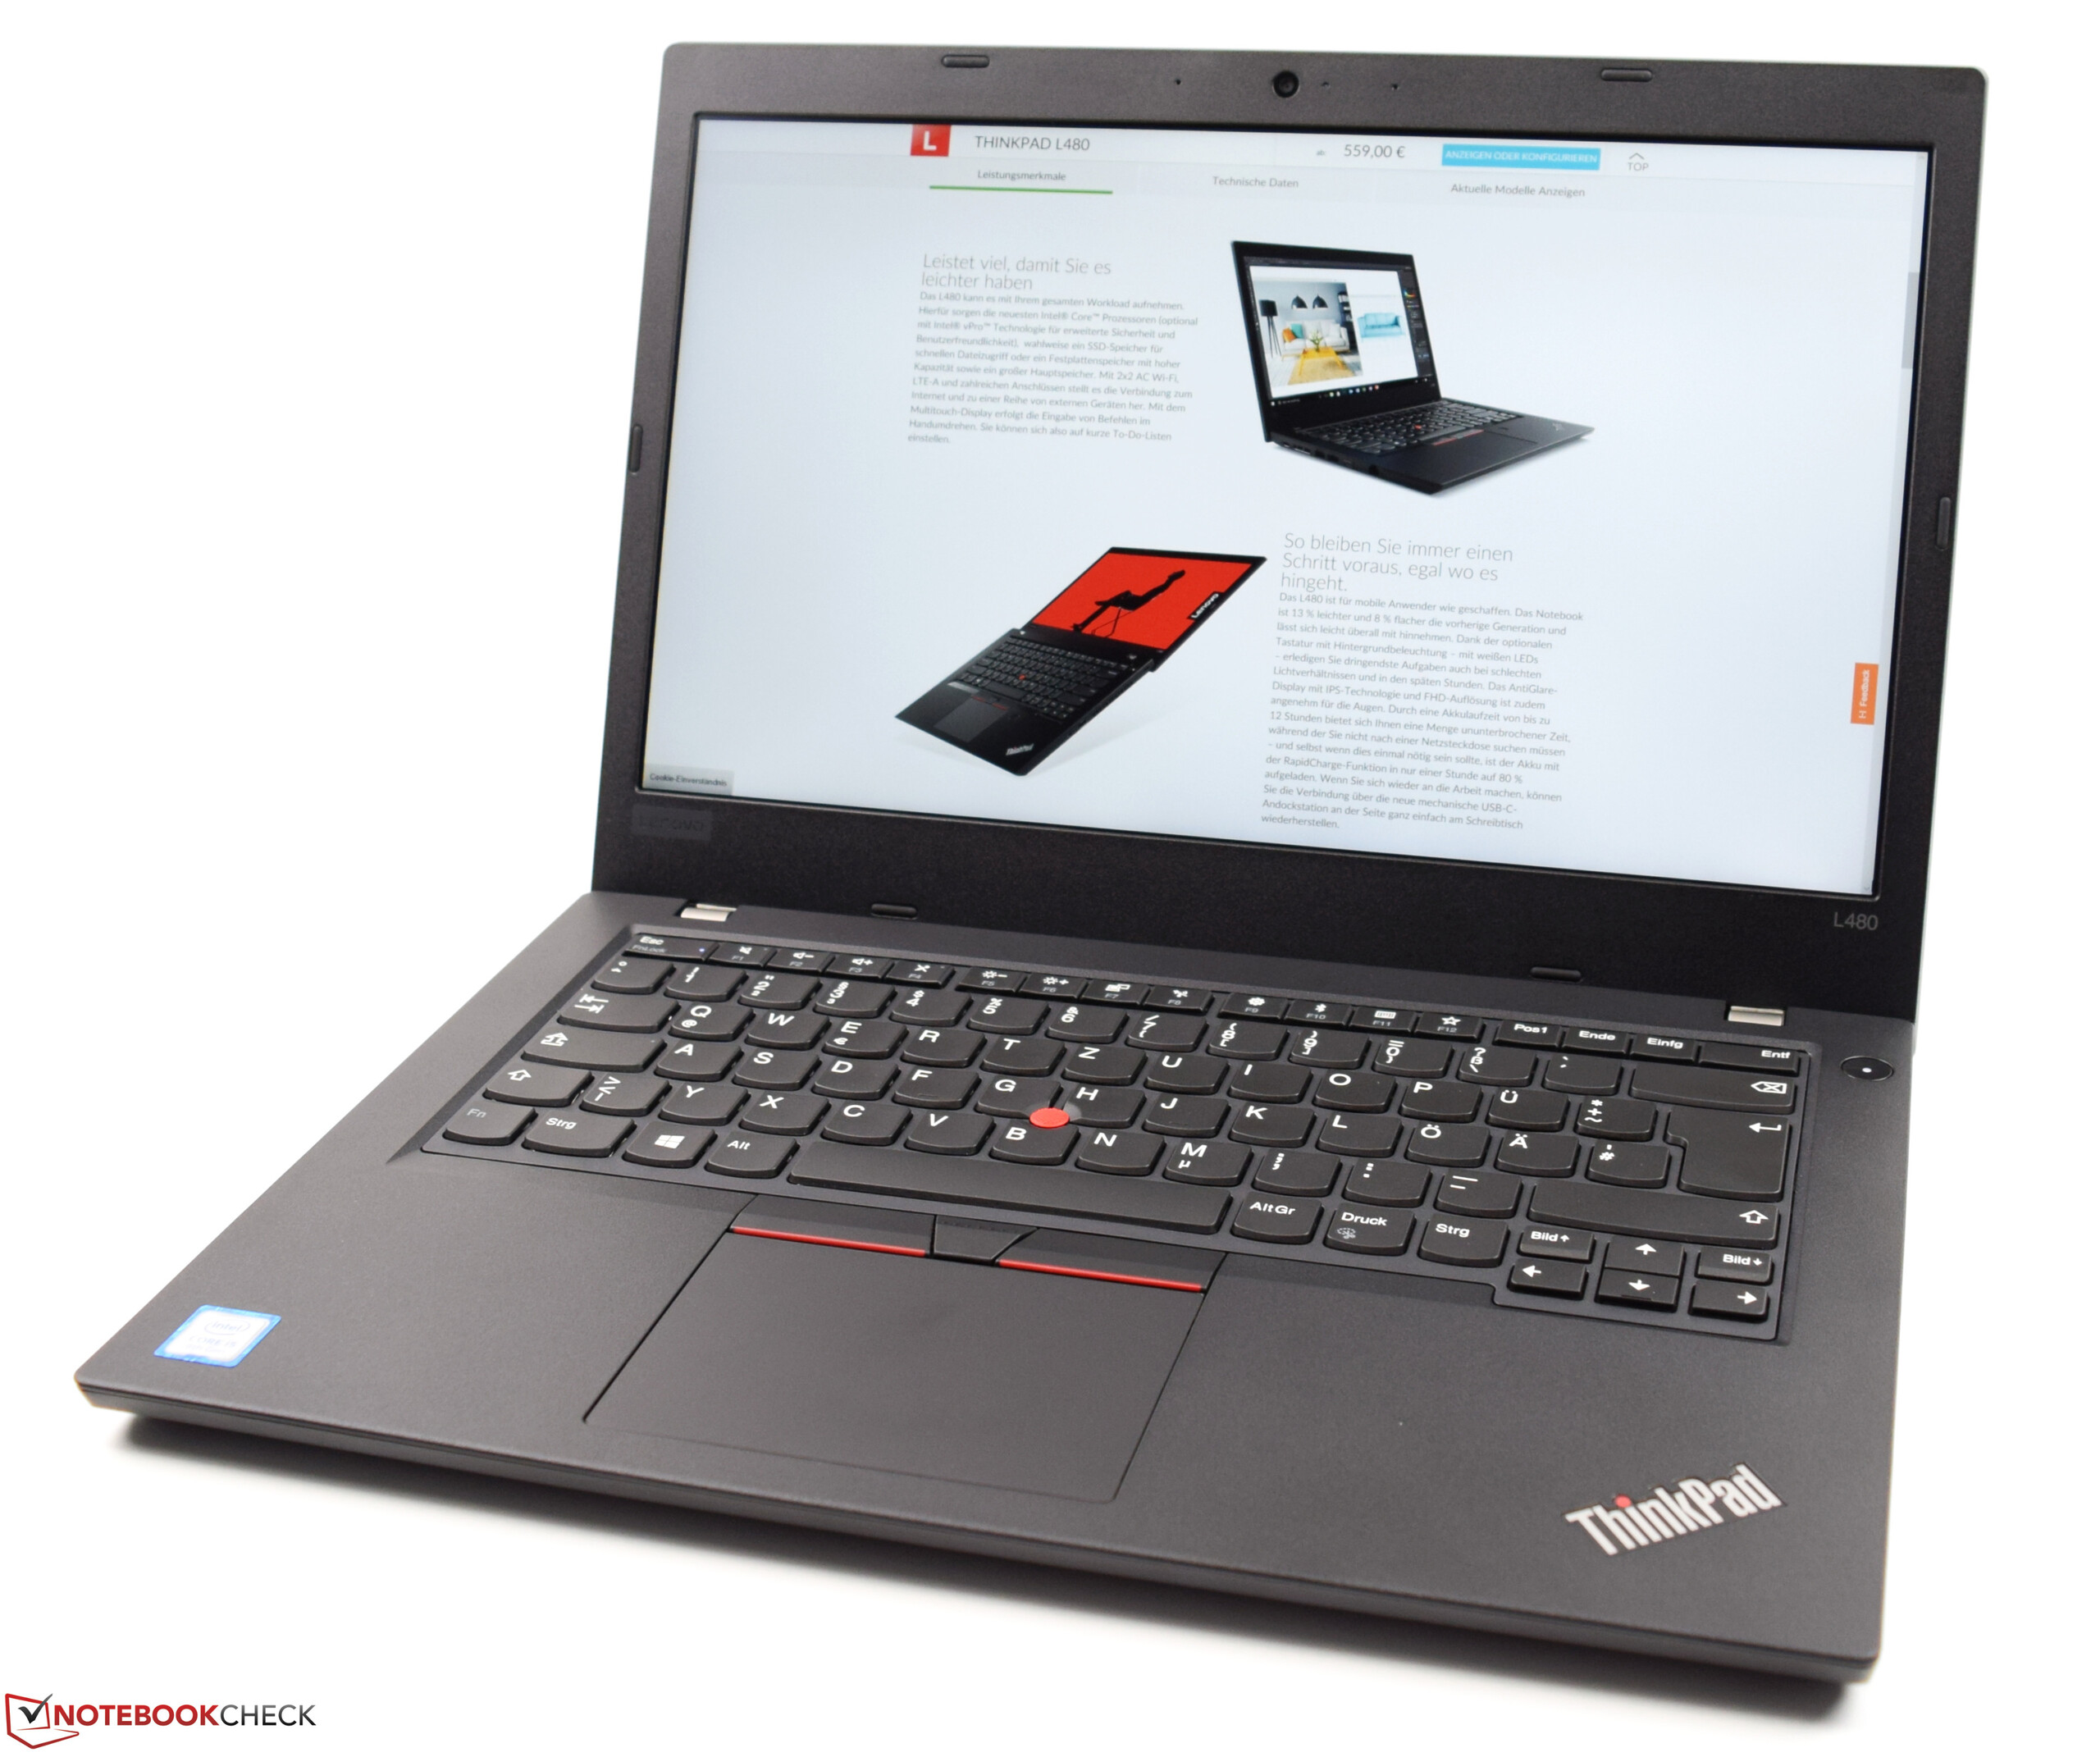
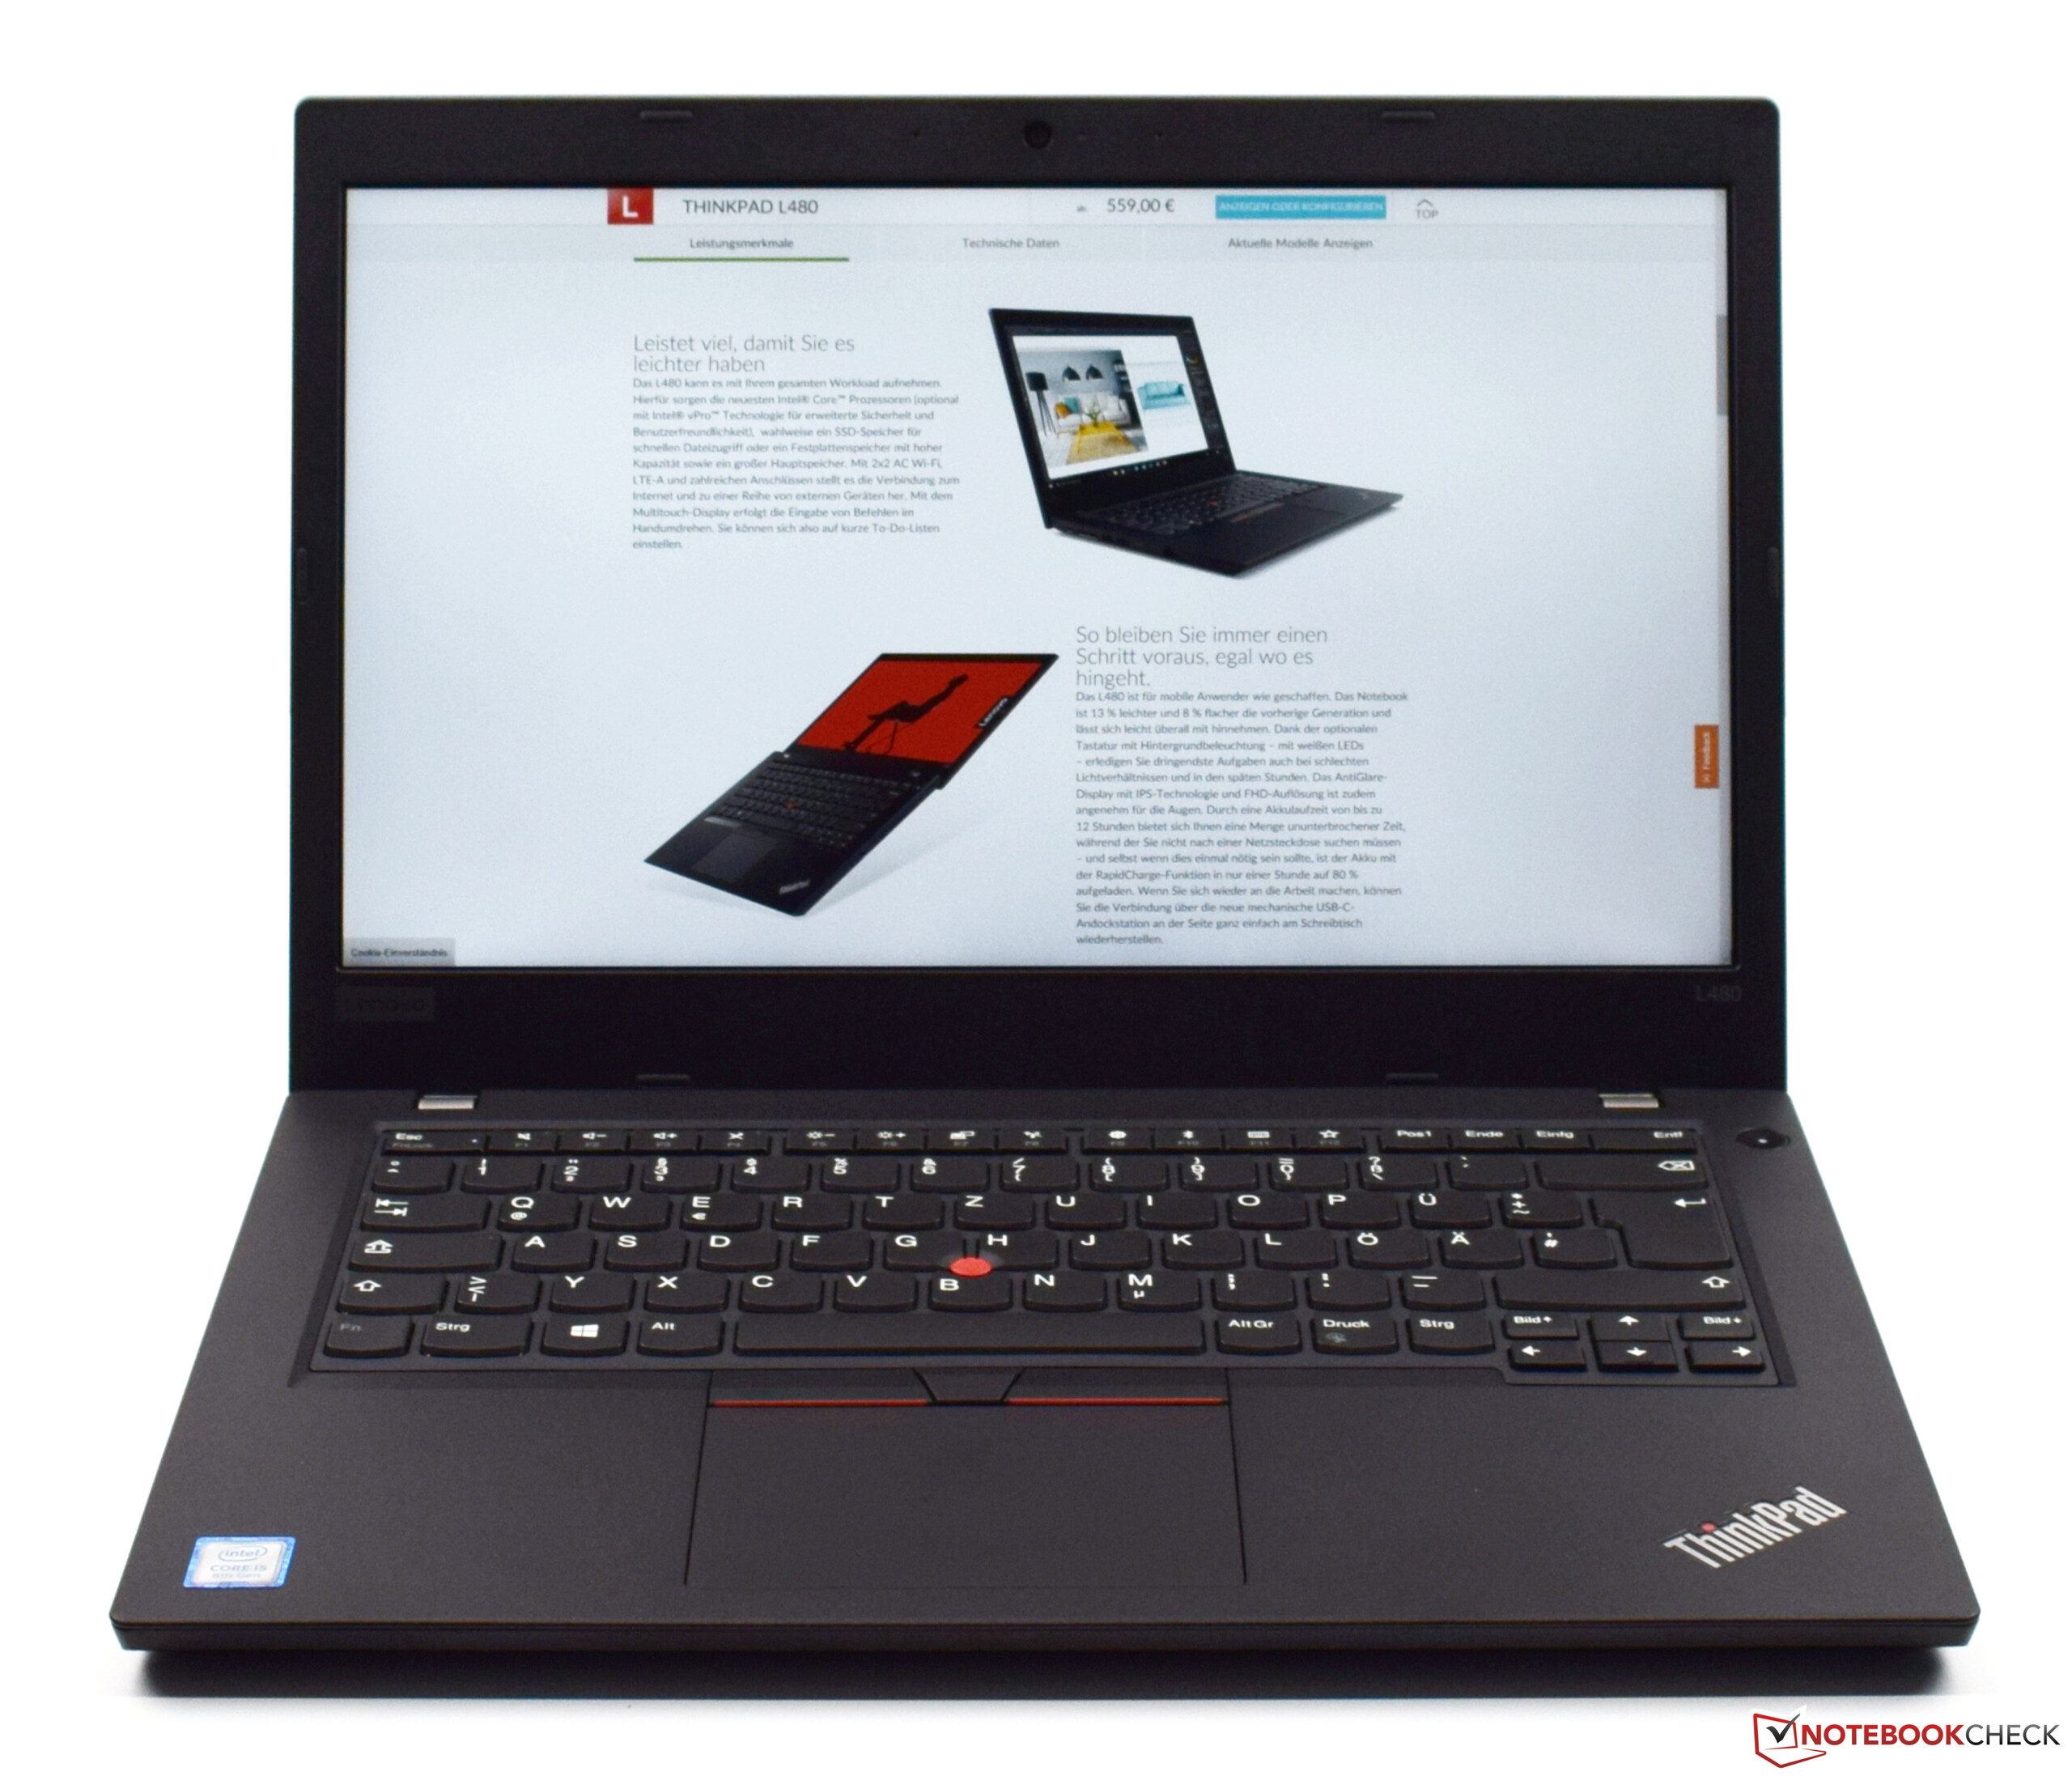
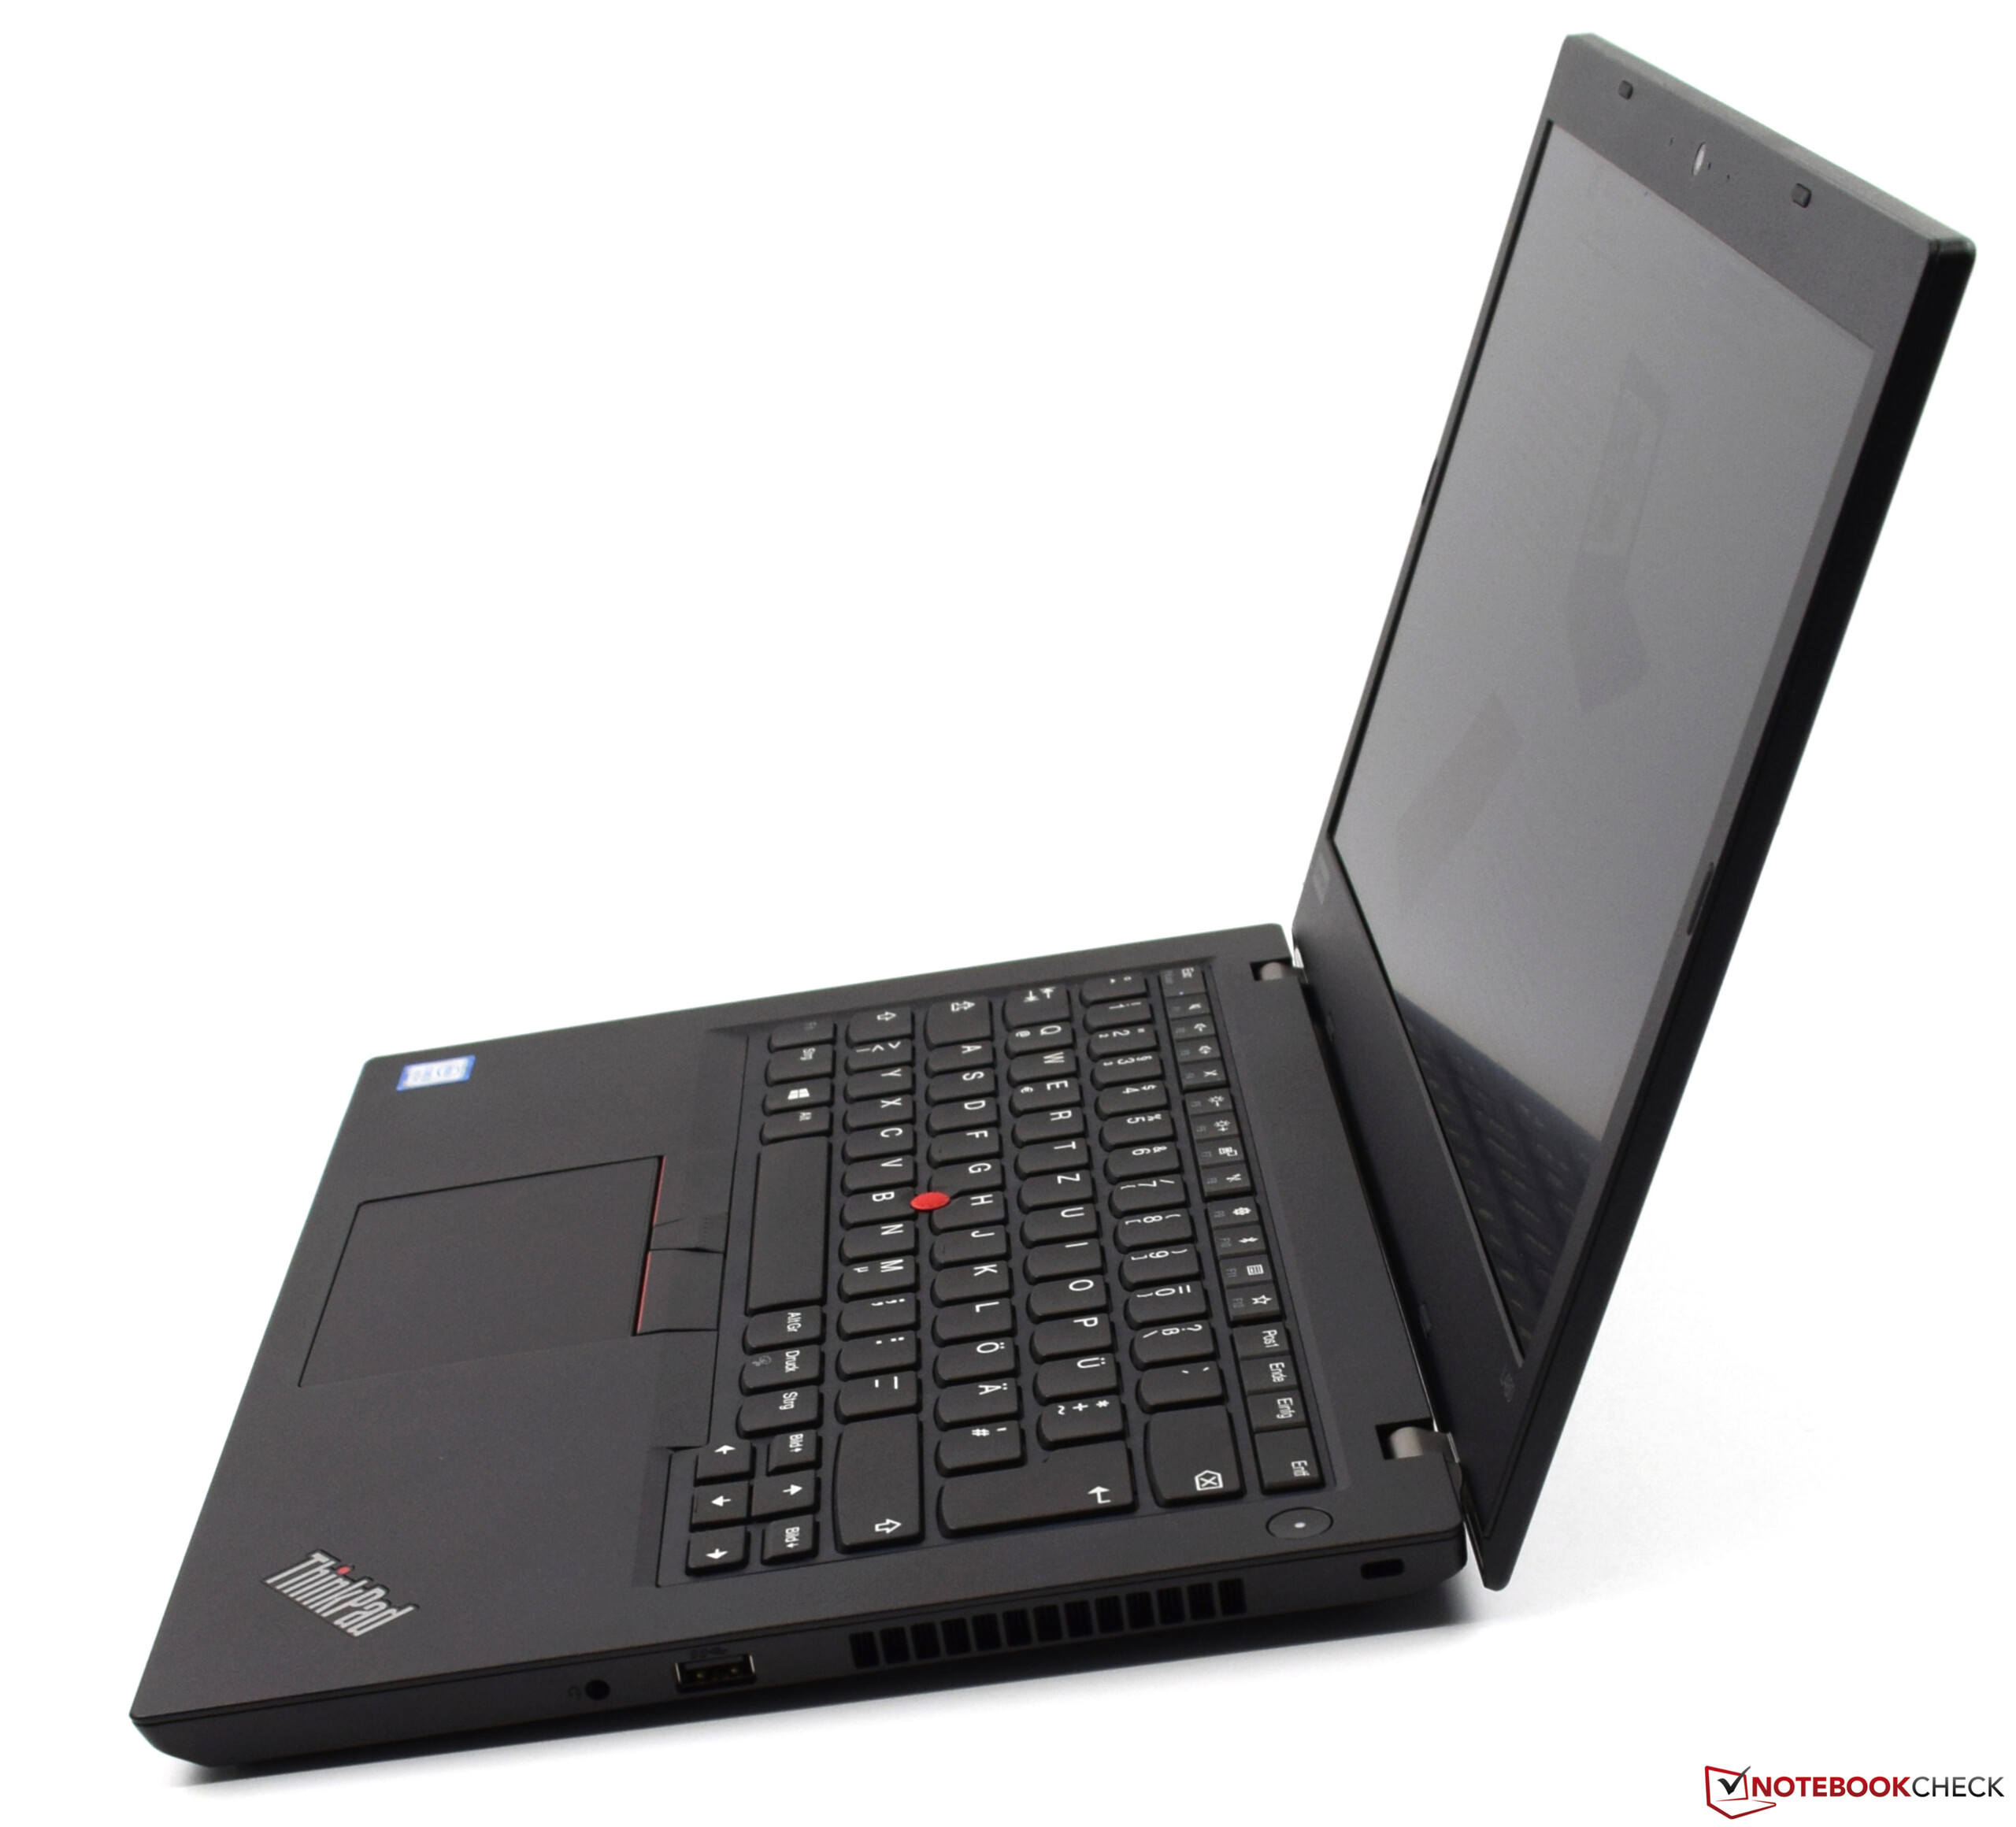
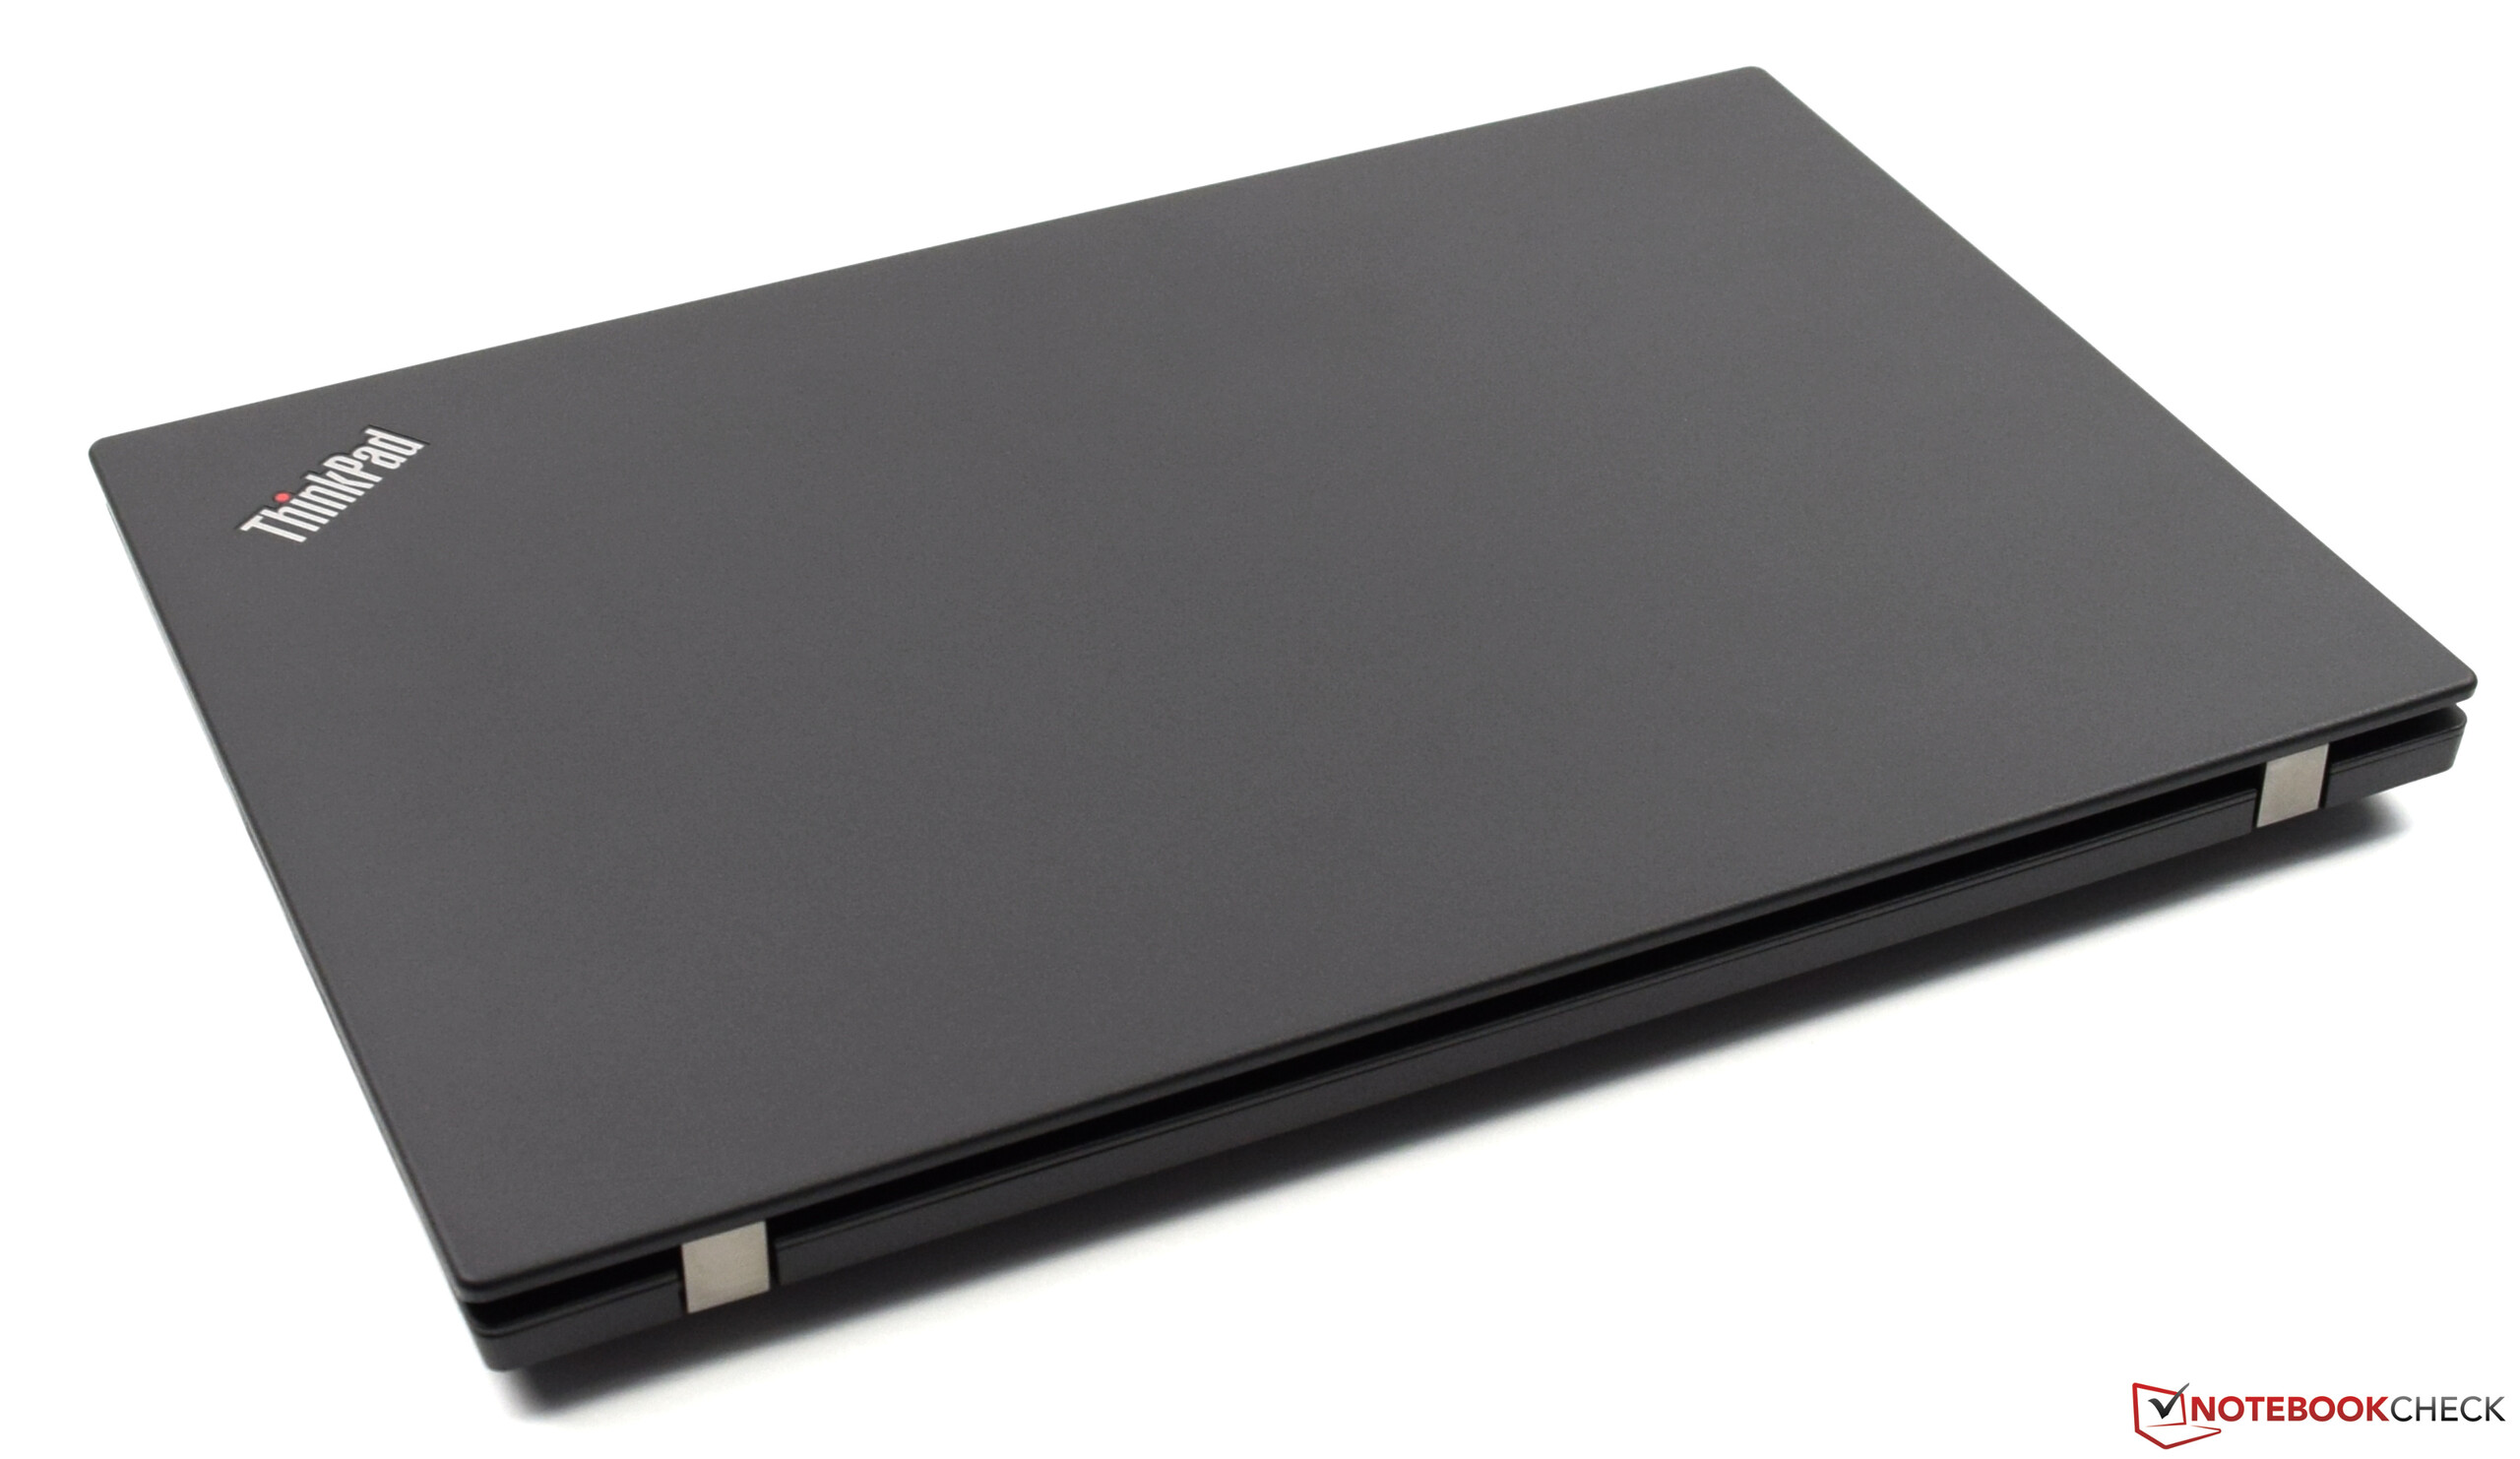
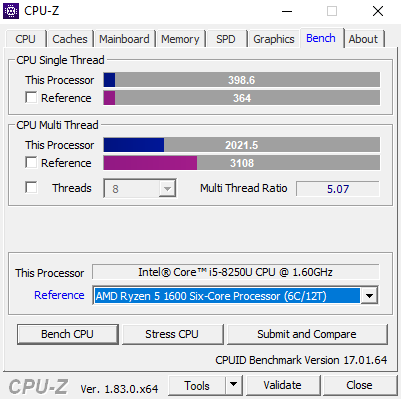
Lenovo ThinkPad L480 är definitionen av en företagslaptop på 14 tum. I vår konfiguration så erbjuder enheten en snabb men effektiv processor. Intel Core i5-8250U har tillräckligt med prestanda för dom flesta kontorsuppgifter och borde vara framtidssäkrad tack vare sin prestanda.
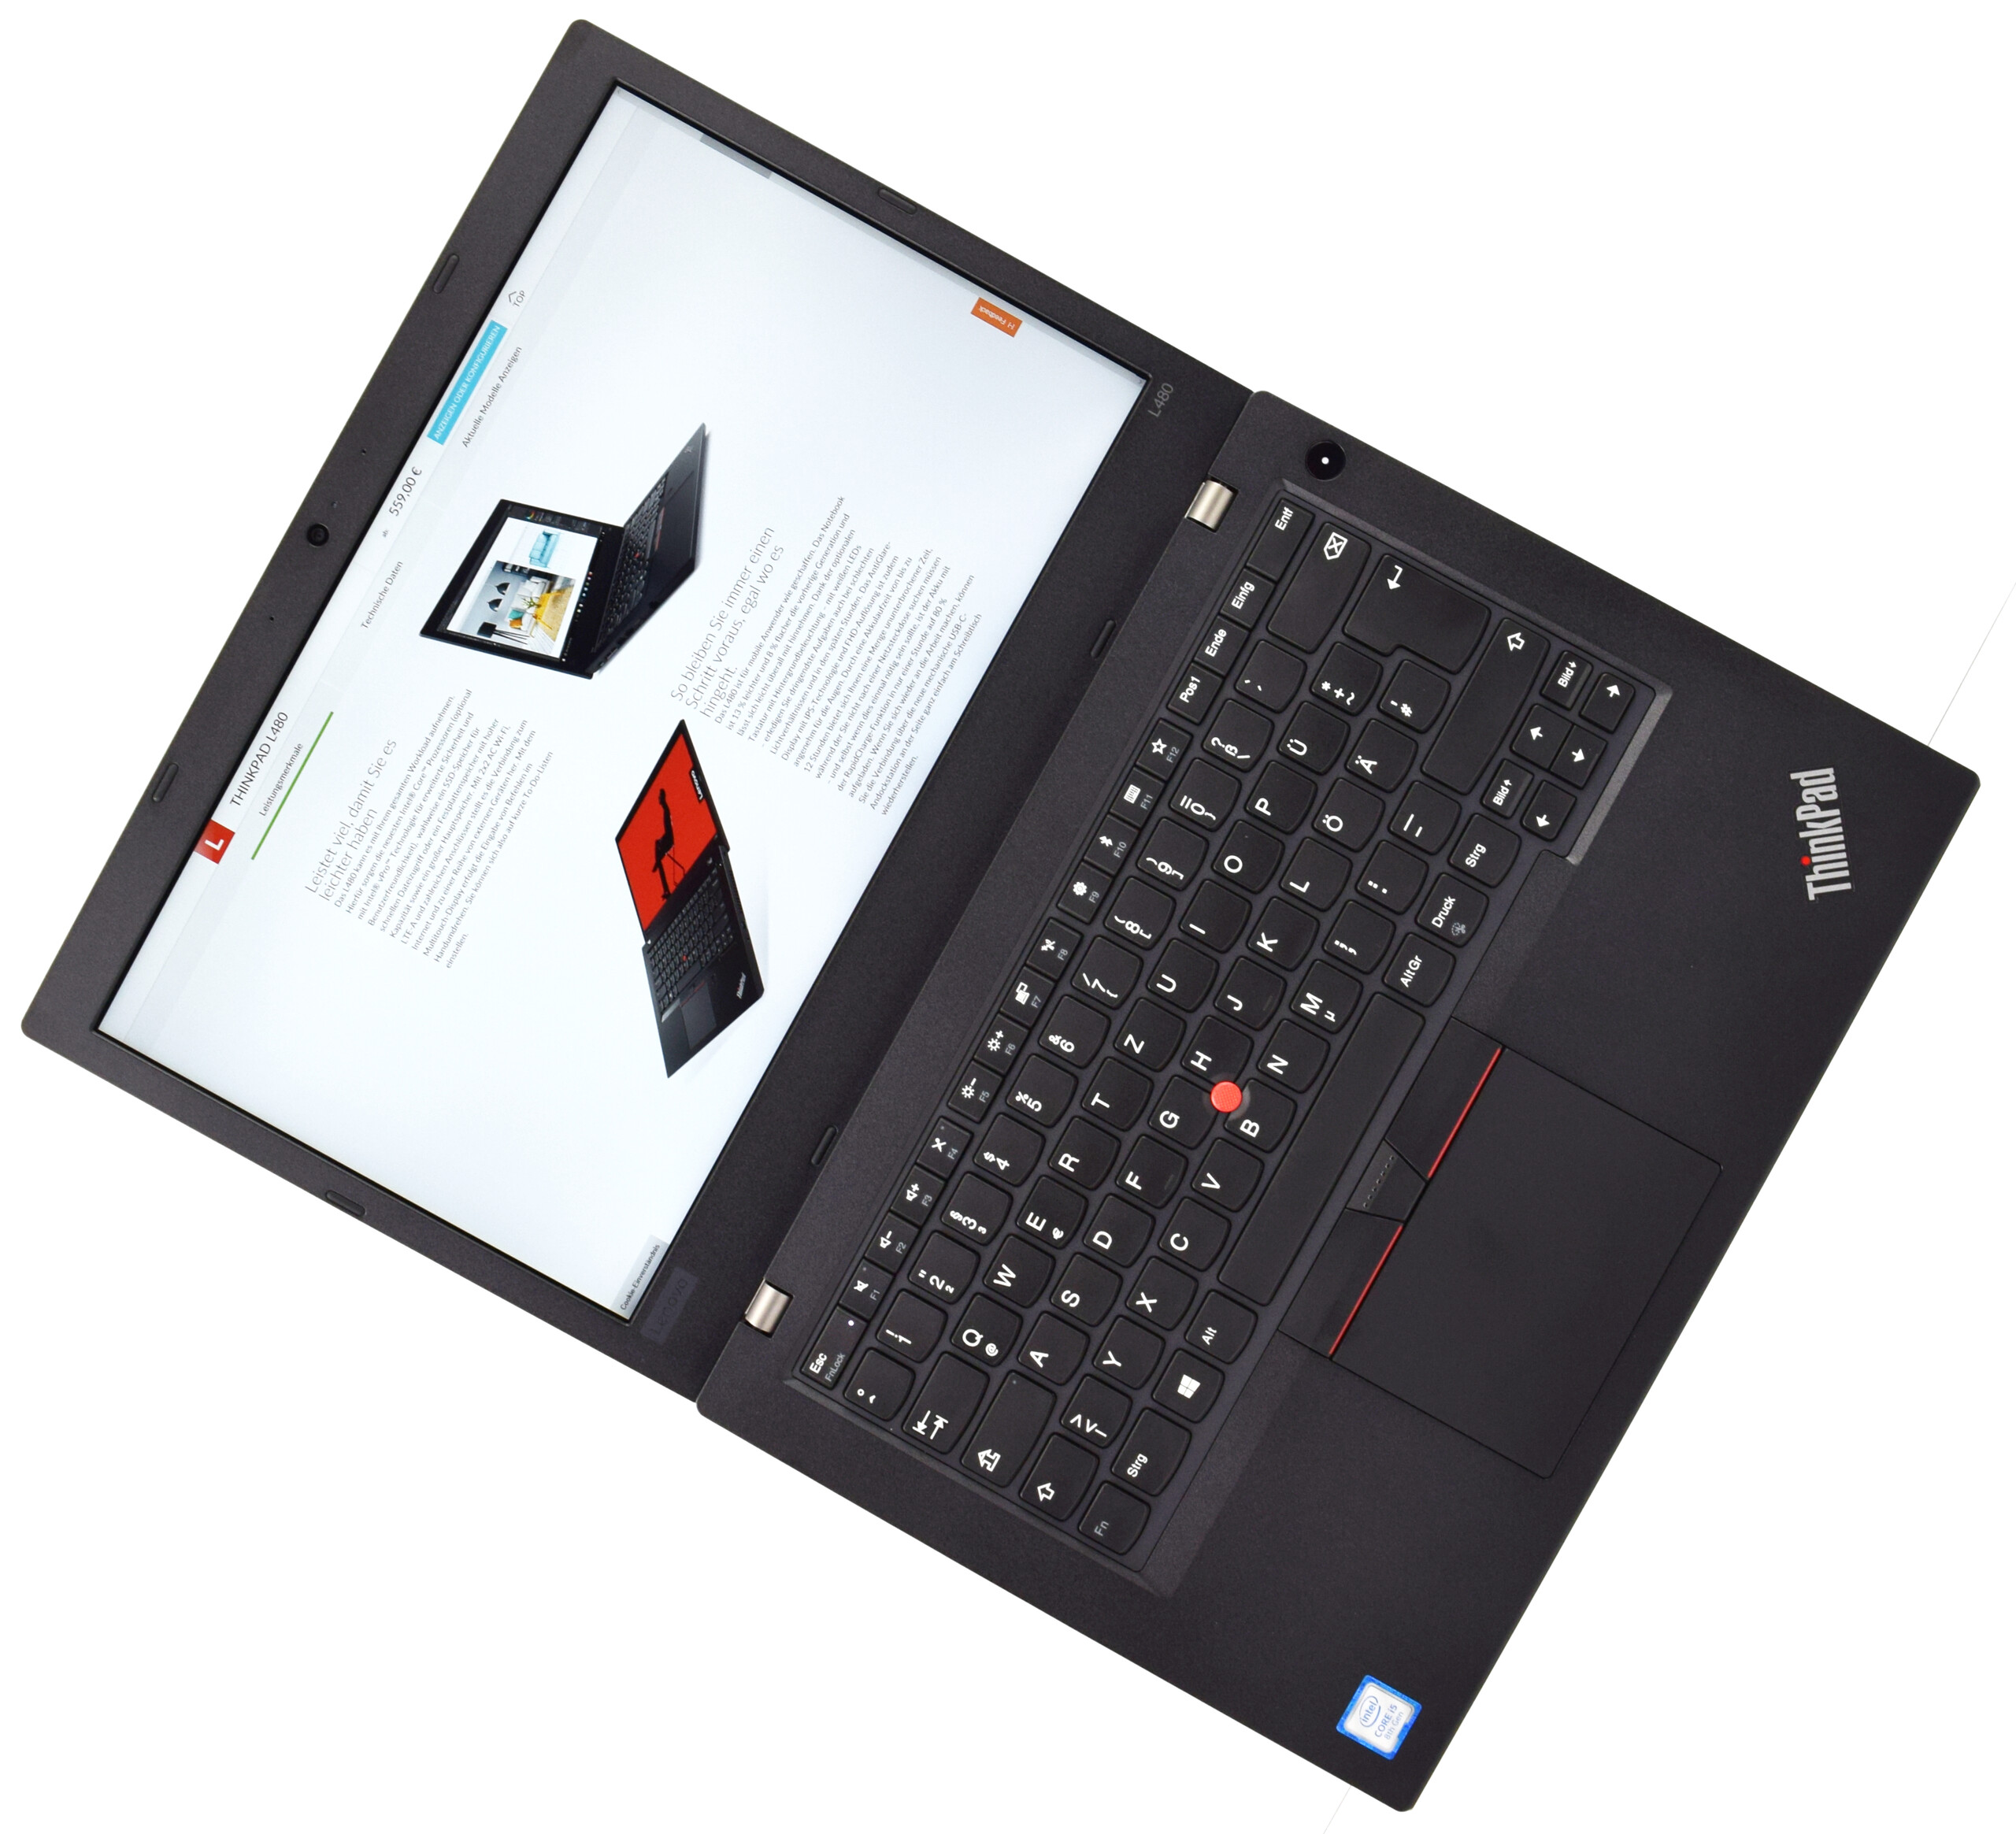
För under 10 000 kronor får köparen en välutrustad företagslaptop med dom utmärkta inmatningsenheter som ThinkPad-modellerna är kända för. Överflödet av konfigurationer gör det möjligt att ställa in den perfekta företagskompanjonen.
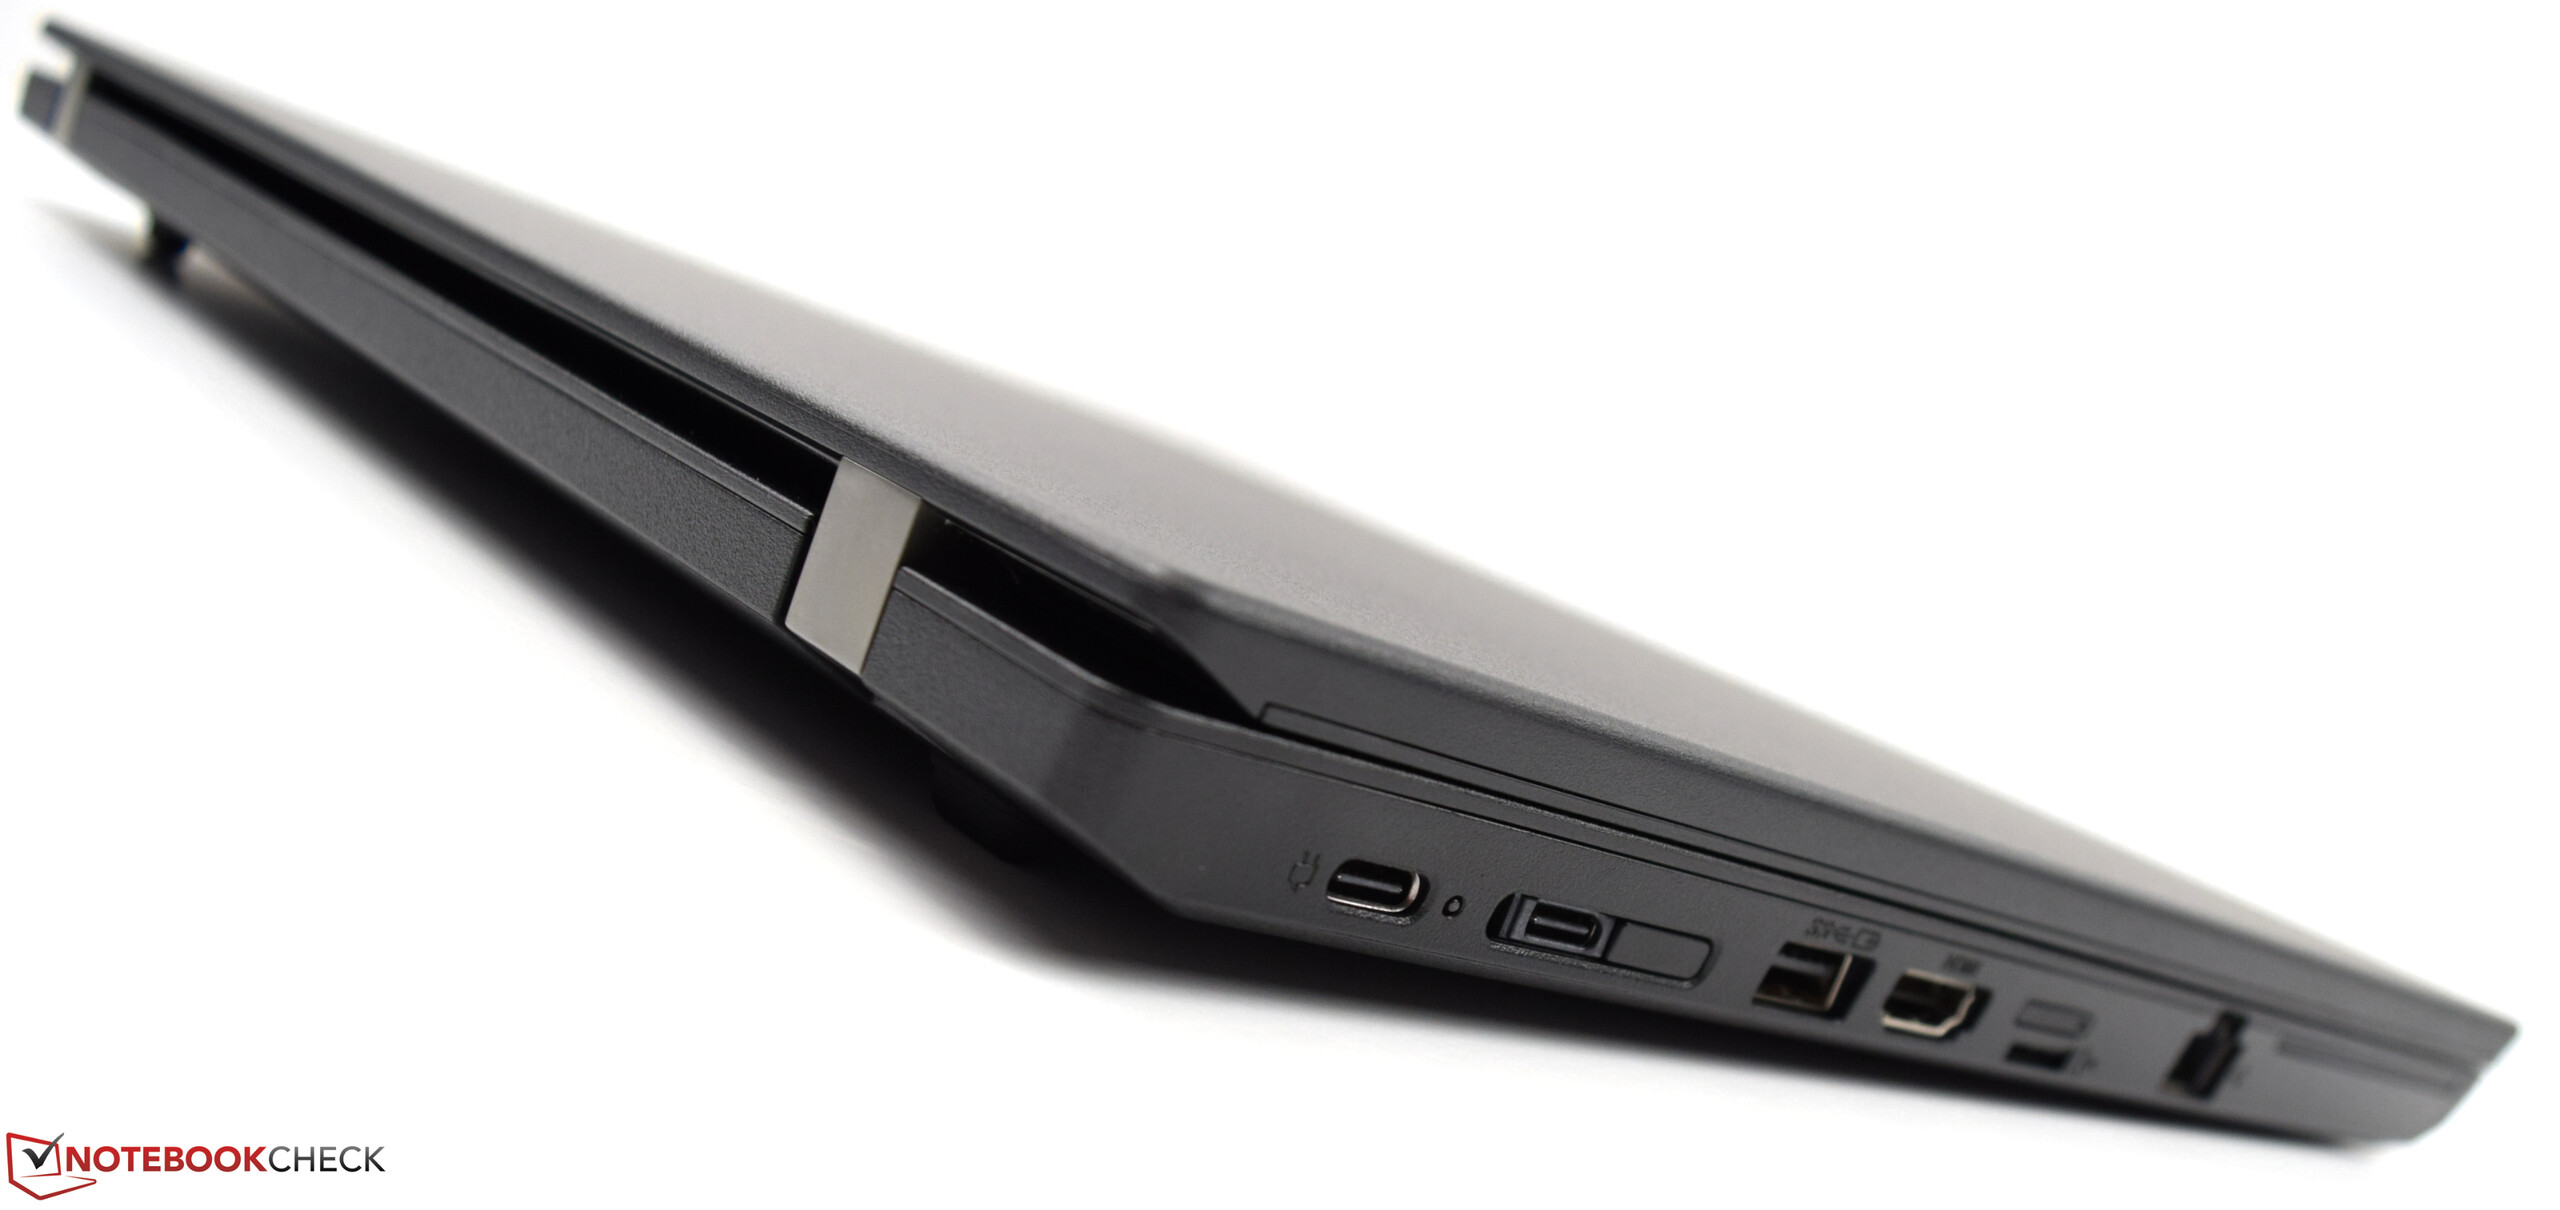
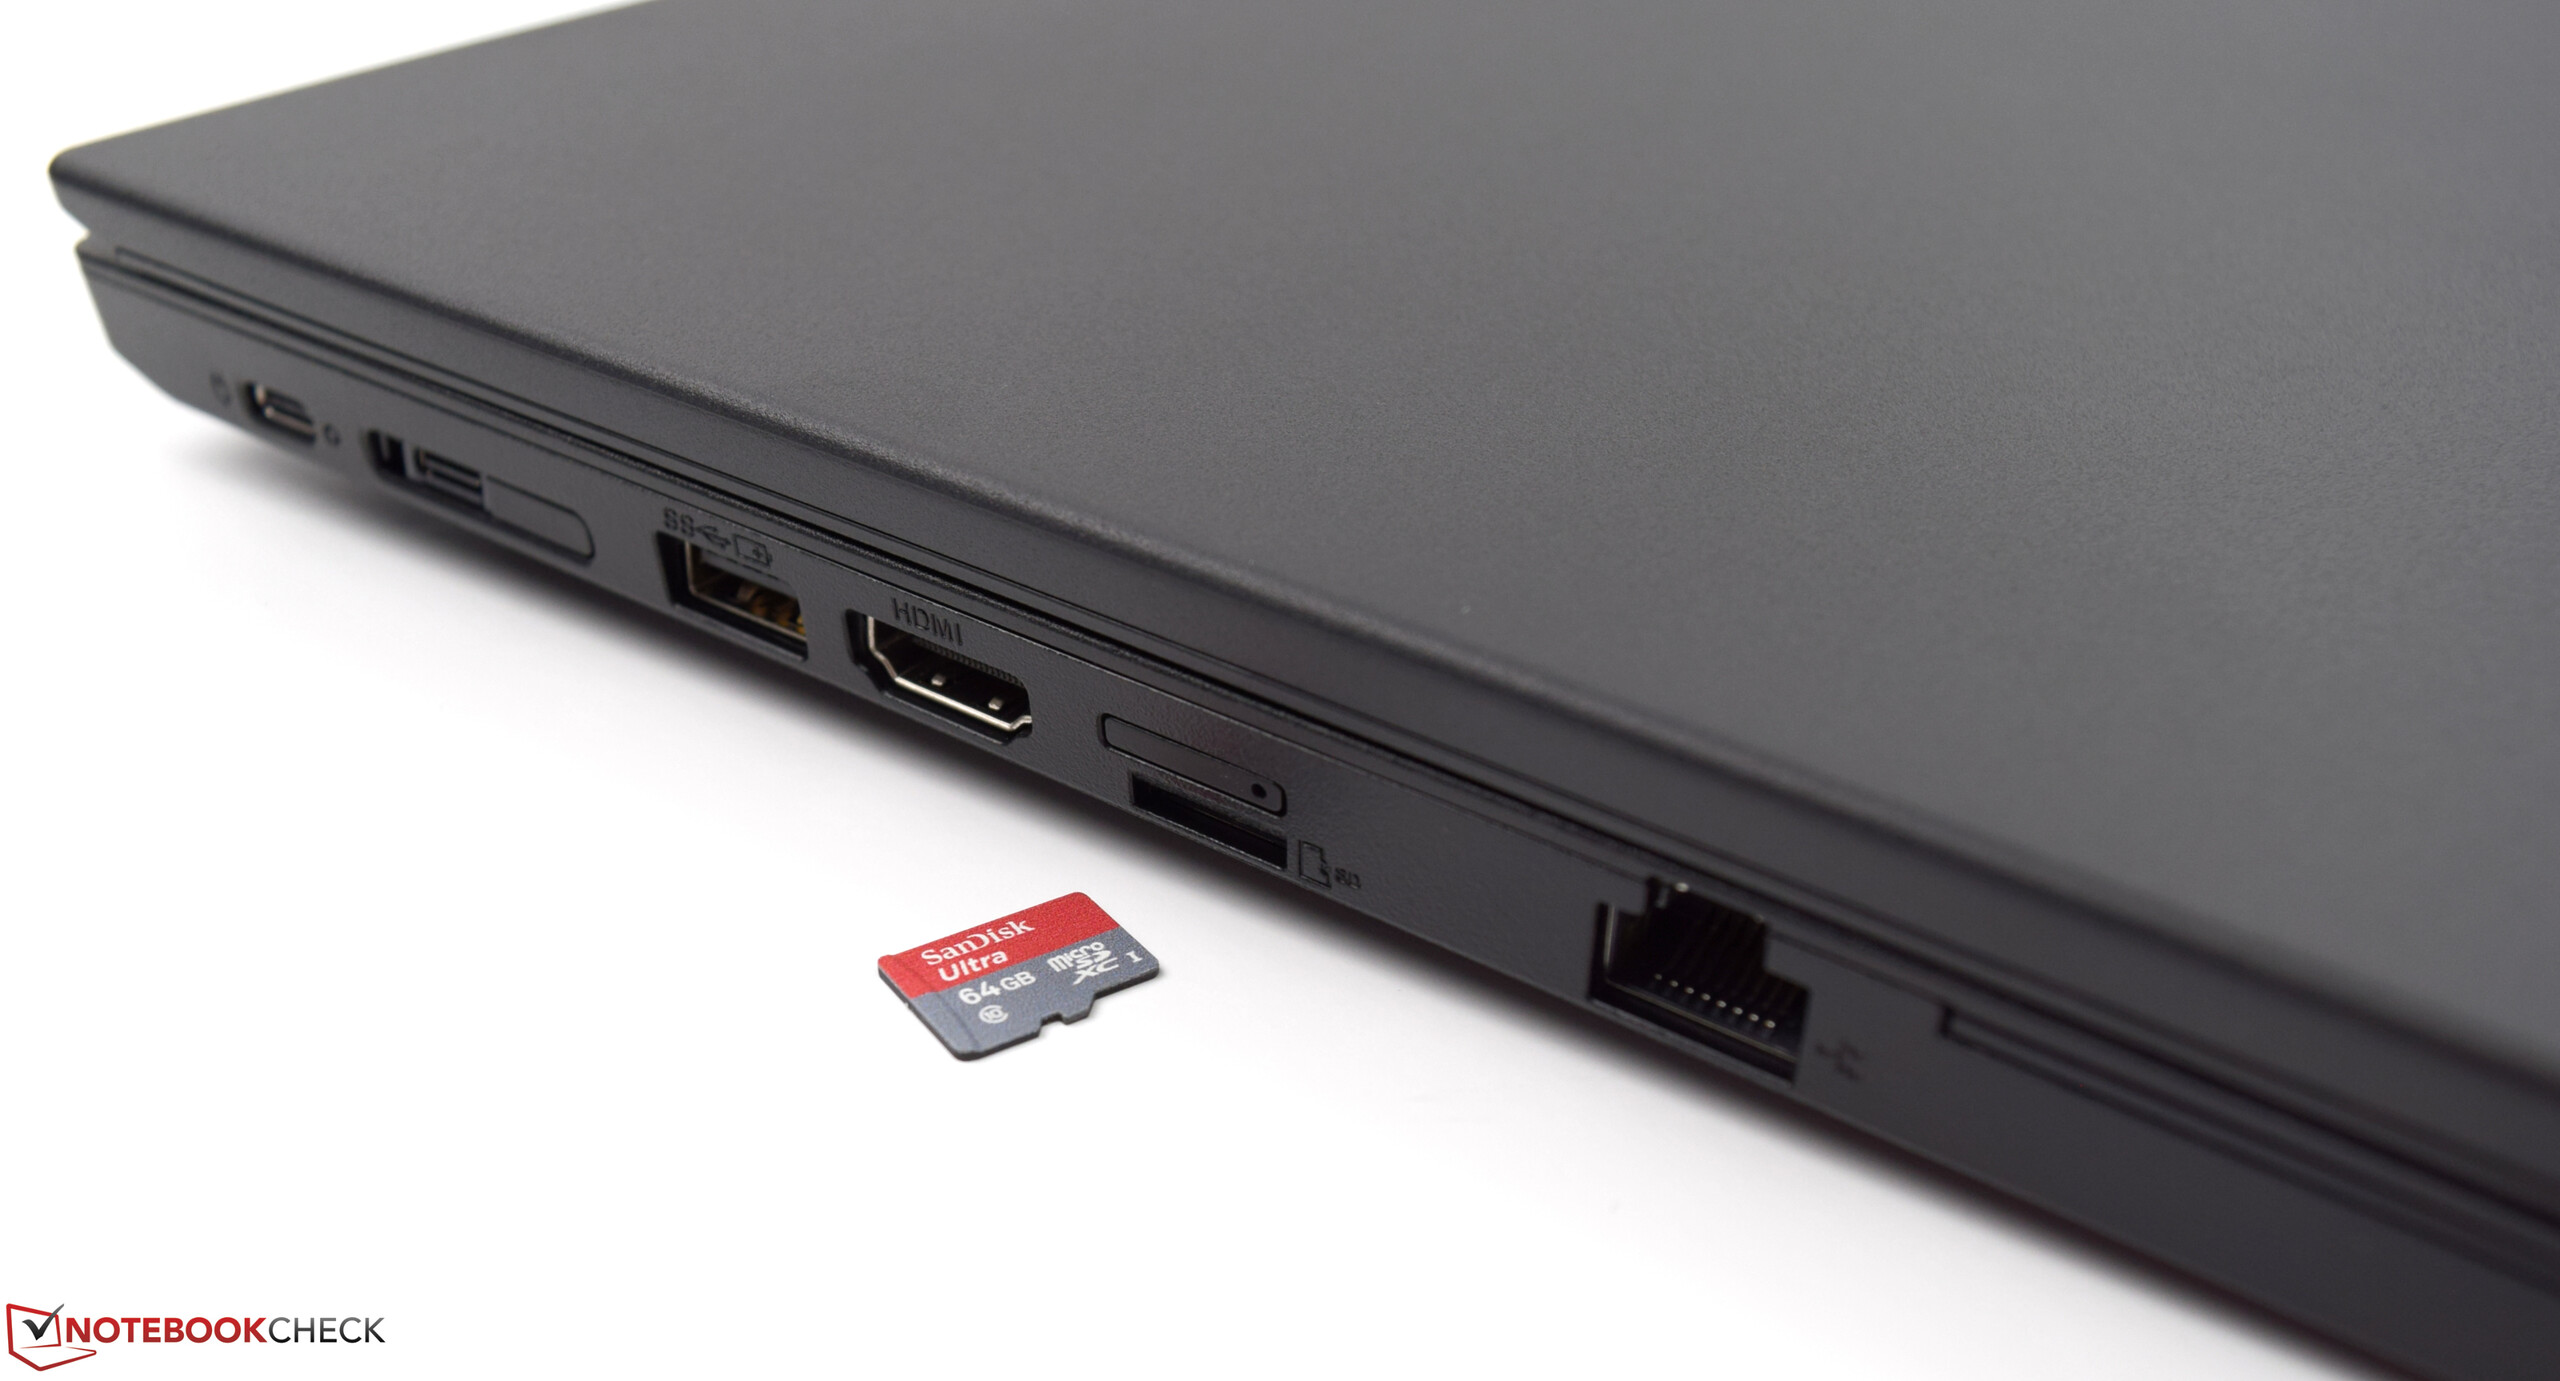
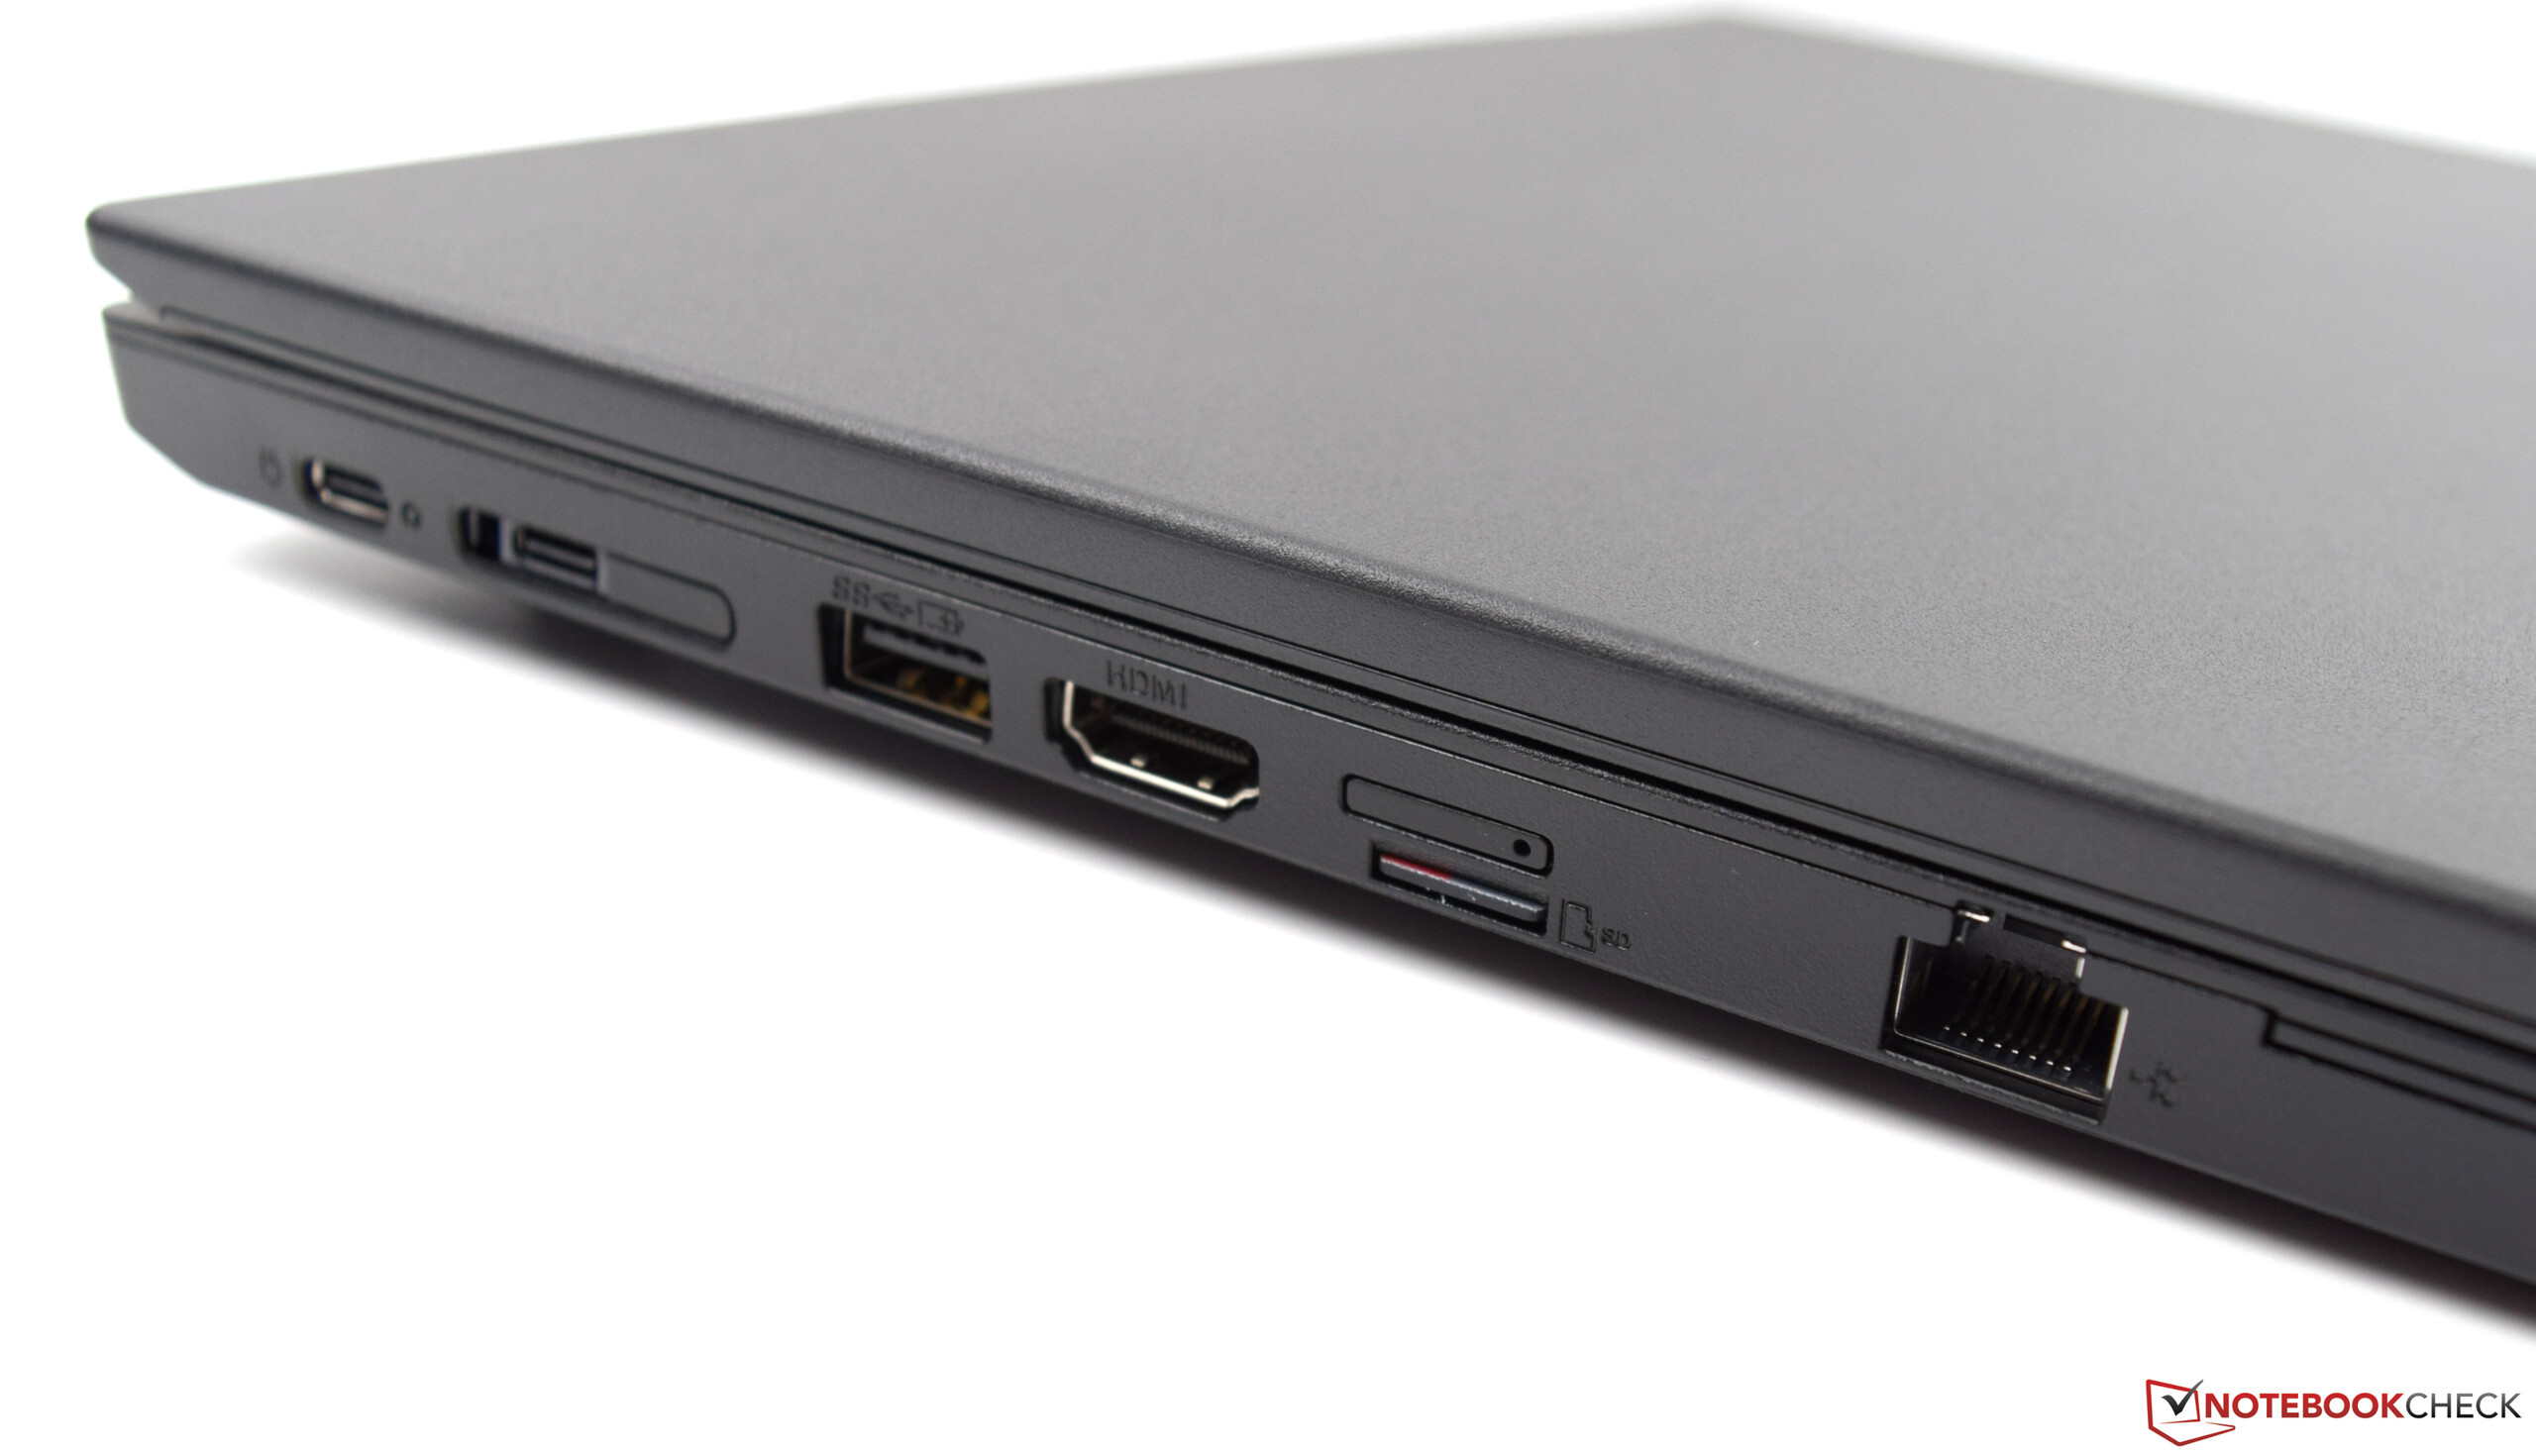
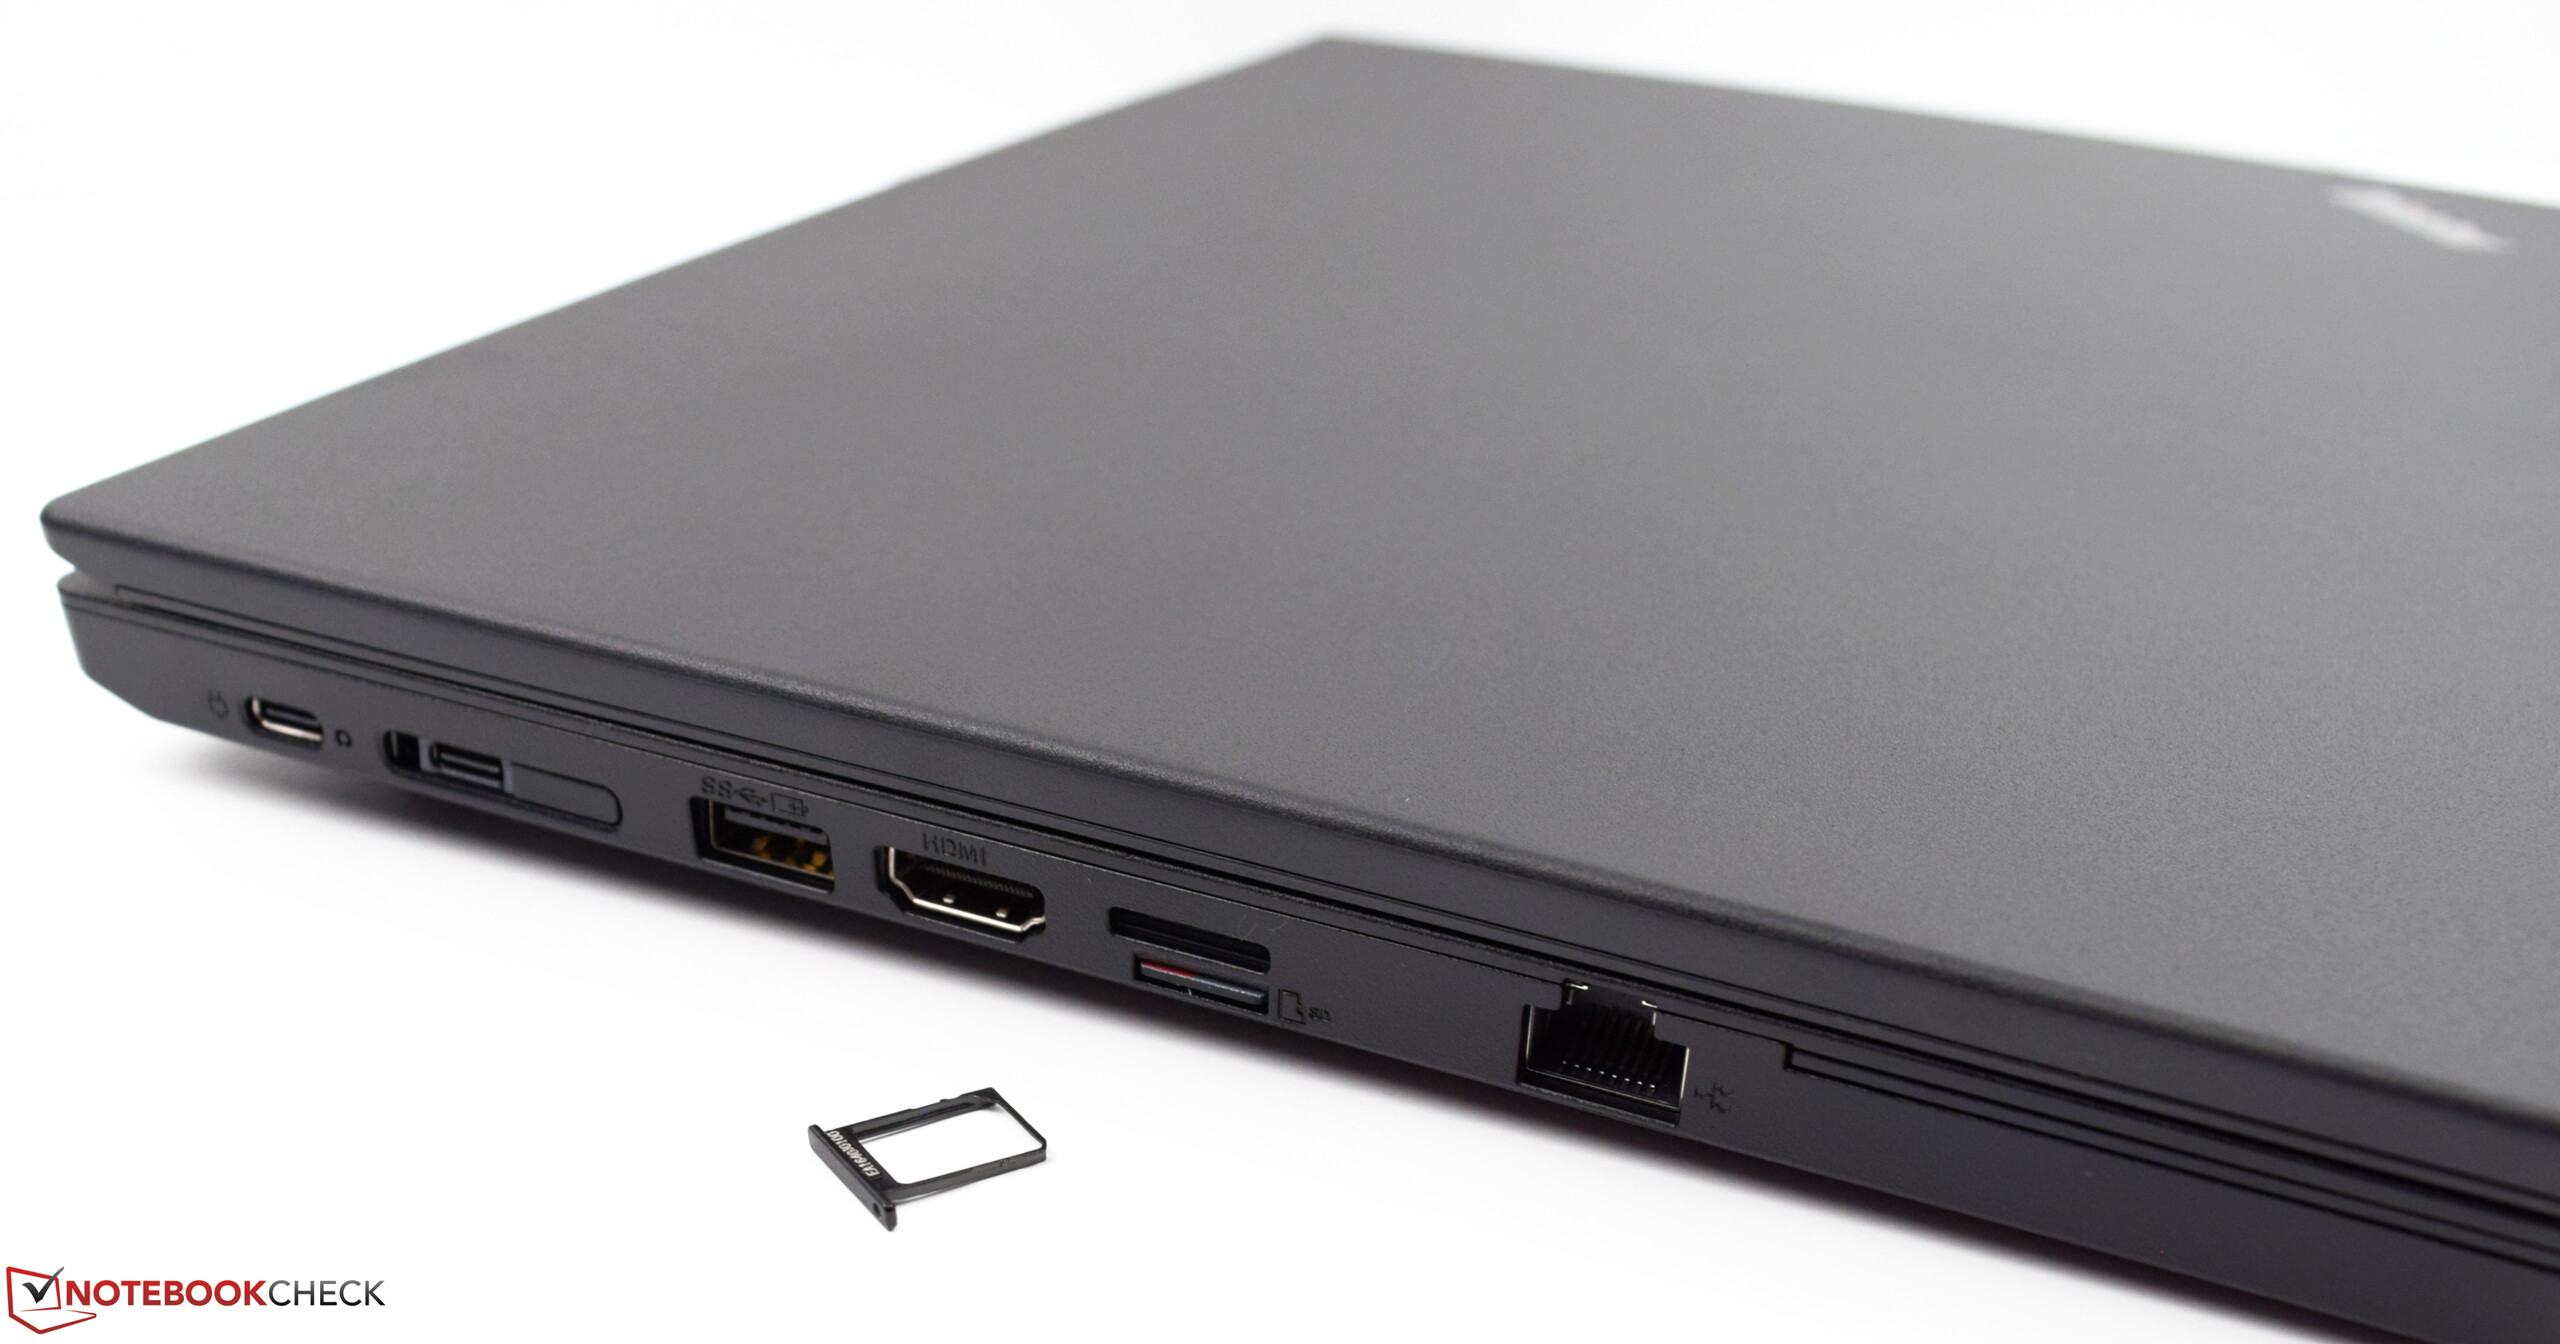
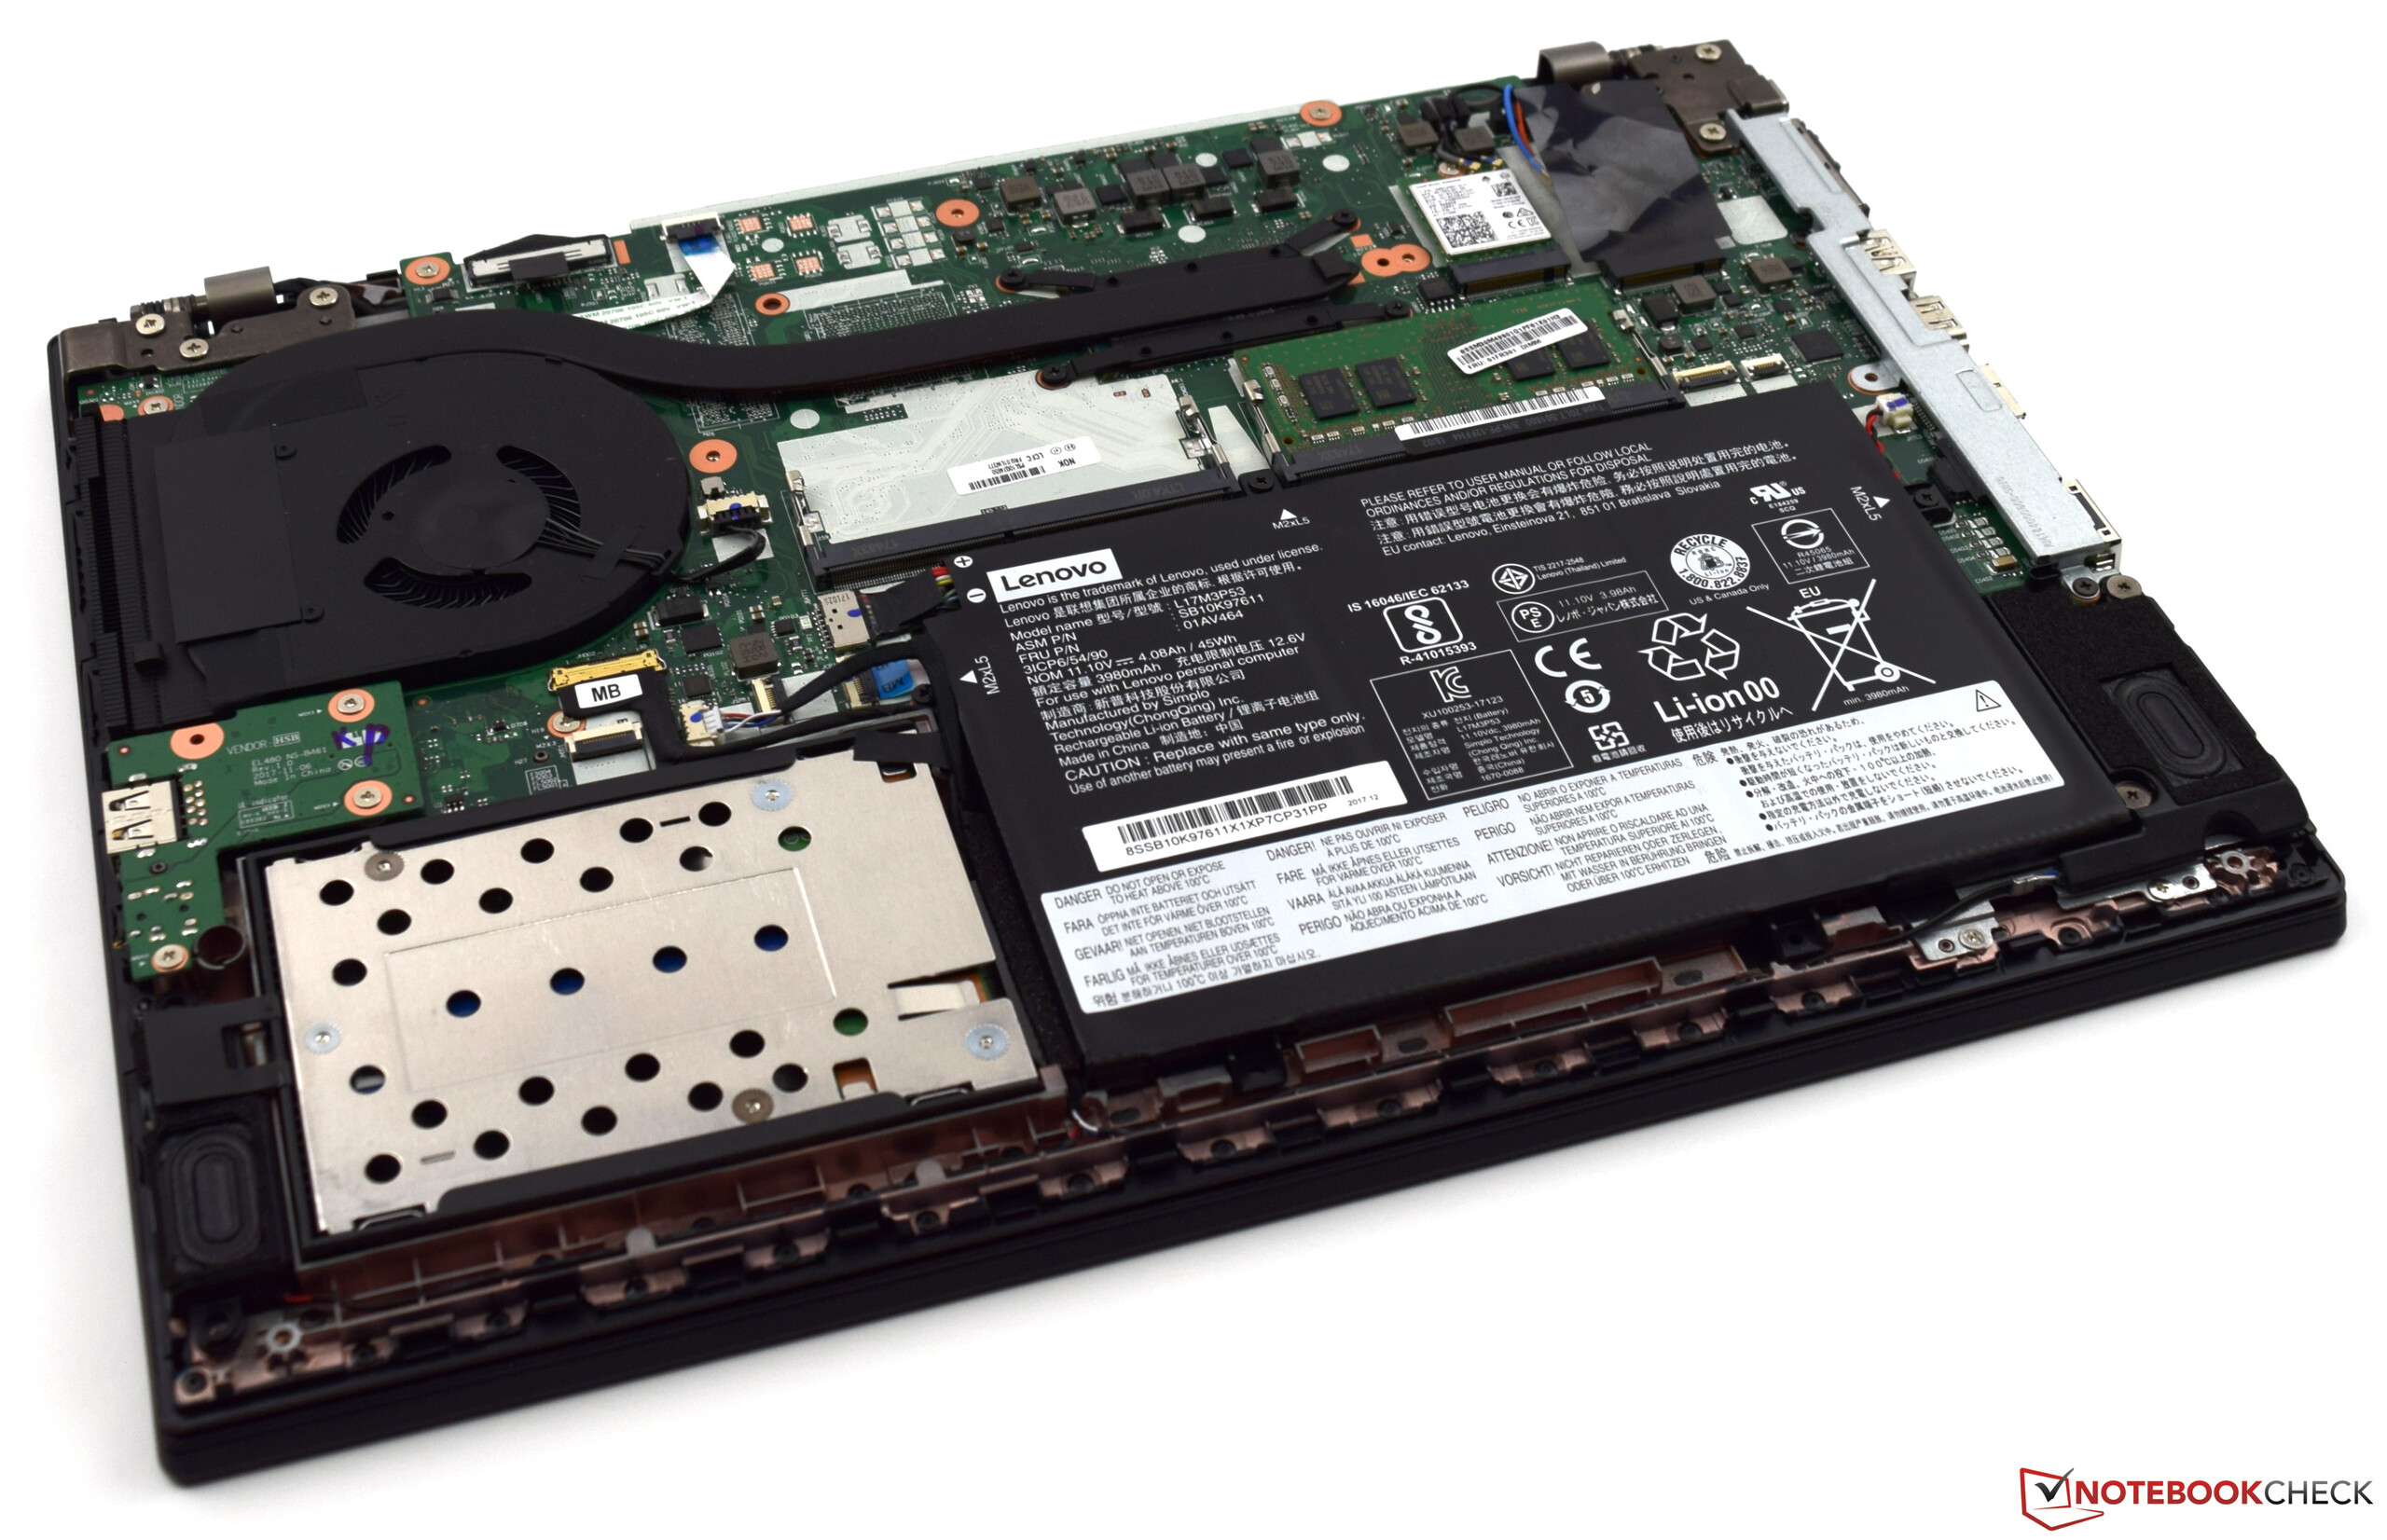
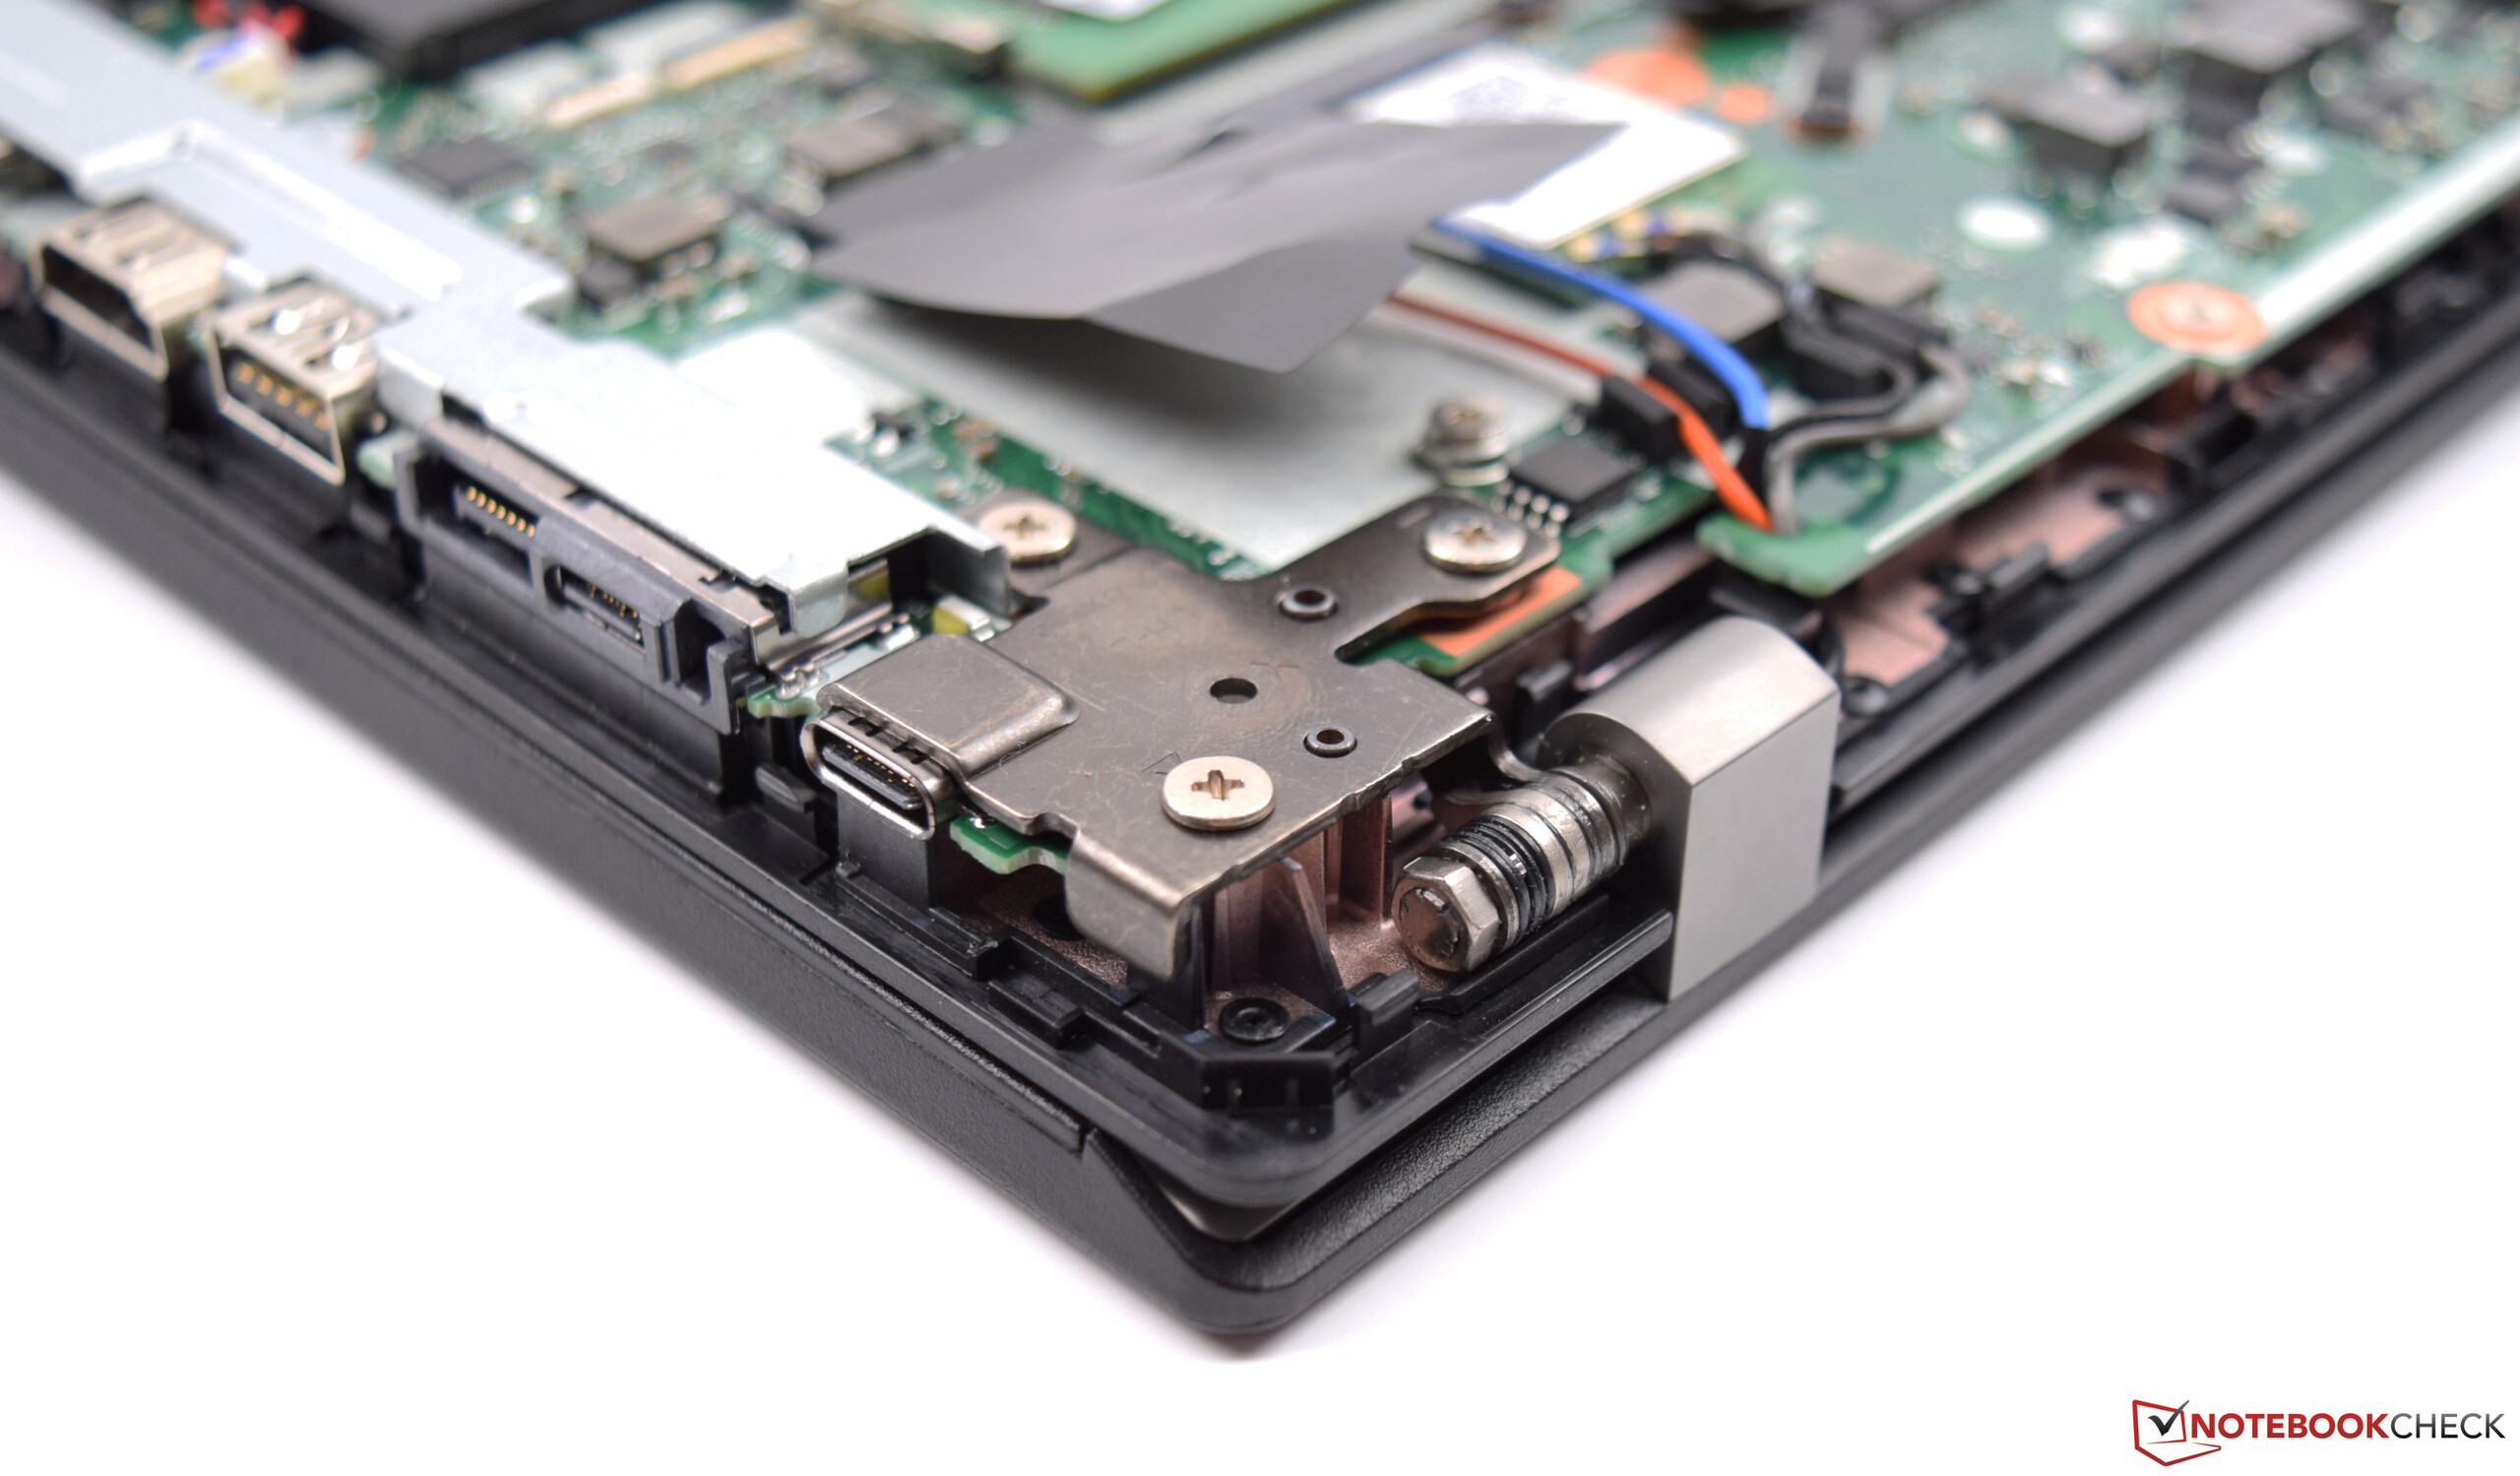
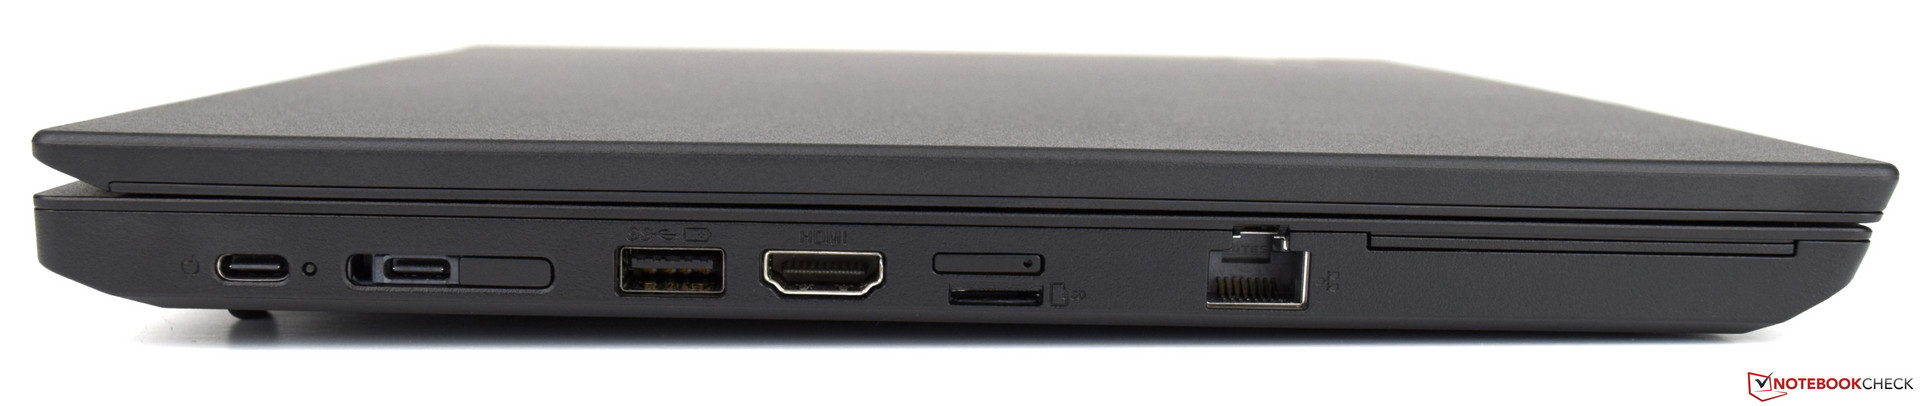
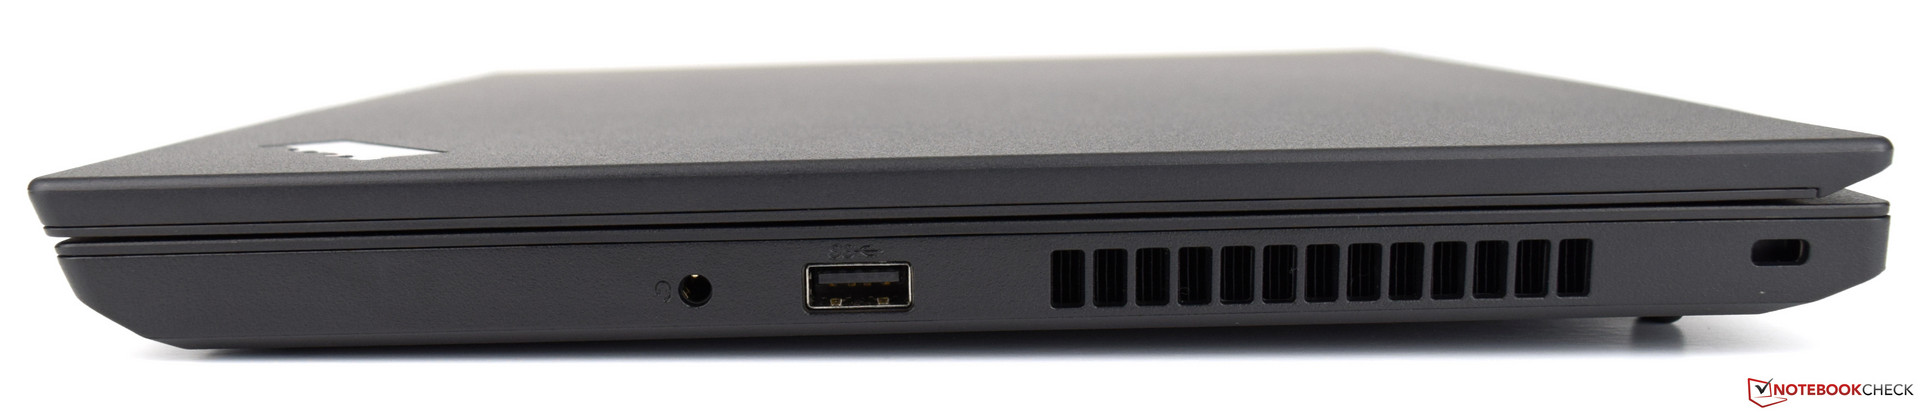
Skärmen, däremot, ger oss blandade känslor. Att den har en IPS-panel är bra, men ljusstyrkan den levererar är det däremot inte. Man kommer behöva kompromissa om man arbetar utomhus. Dessutom är batteritiden inte i en stark ställning jämfört med konkurrenterna. Prestandan och den stora mängden portar är dock bra. Bytet från en SD-kortläsare till en microSD-plats är också värd att nämna.
Lenovo ThinkPad L480-20LS001AGE
- 03/13/2018 v6 (old)
Sebastian Bade