Test: Lenovo ThinkPad E480 (i5-8250U, UHD 620, SSD) Laptop (Sammanfattning)
| SD Card Reader | |
| average JPG Copy Test (av. of 3 runs) | |
| HP ProBook 440 G5-3KX87ES (Toshiba Exceria Pro SDXC 64 GB UHS-II) | |
| Schenker Slim 14 L17 (Toshiba Exceria Pro SDXC 64 GB UHS-II) | |
| Lenovo ThinkPad E480-20KQS00000 (Toshiba Exceria Pro M501) | |
| Lenovo ThinkPad E480-20KNCTO1WW (Toshiba Exceria Pro M501) | |
| Genomsnitt av klass Office (19.8 - 198.5, n=22, senaste 2 åren) | |
| Asus VivoBook S14 S406UA-BV023T (Toshiba Exceria Pro M501 microSDXC 64GB) | |
| Acer TravelMate P449-G2-M-56CD (Toshiba Exceria Pro SDXC 64 GB UHS-II) | |
| maximum AS SSD Seq Read Test (1GB) | |
| HP ProBook 440 G5-3KX87ES (Toshiba Exceria Pro SDXC 64 GB UHS-II) | |
| Lenovo ThinkPad E480-20KNCTO1WW (Toshiba Exceria Pro M501) | |
| Schenker Slim 14 L17 (Toshiba Exceria Pro SDXC 64 GB UHS-II) | |
| Lenovo ThinkPad E480-20KQS00000 (Toshiba Exceria Pro M501) | |
| Genomsnitt av klass Office (27.4 - 249, n=21, senaste 2 åren) | |
| Asus VivoBook S14 S406UA-BV023T (Toshiba Exceria Pro M501 microSDXC 64GB) | |
| Acer TravelMate P449-G2-M-56CD (Toshiba Exceria Pro SDXC 64 GB UHS-II) | |
| Networking | |
| iperf3 transmit AX12 | |
| Lenovo ThinkPad E470 | |
| Acer TravelMate P449-G2-M-56CD | |
| HP ProBook 440 G5-3KX87ES | |
| Lenovo ThinkPad E480-20KQS00000 | |
| Schenker Slim 14 L17 | |
| Asus VivoBook S14 S406UA-BV023T | |
| Lenovo ThinkPad E480-20KNCTO1WW | |
| iperf3 receive AX12 | |
| Lenovo ThinkPad E480-20KQS00000 | |
| HP ProBook 440 G5-3KX87ES | |
| Schenker Slim 14 L17 | |
| Acer TravelMate P449-G2-M-56CD | |
| Lenovo ThinkPad E470 | |
| Asus VivoBook S14 S406UA-BV023T | |
| Lenovo ThinkPad E480-20KNCTO1WW | |
| |||||||||||||||||||||||||
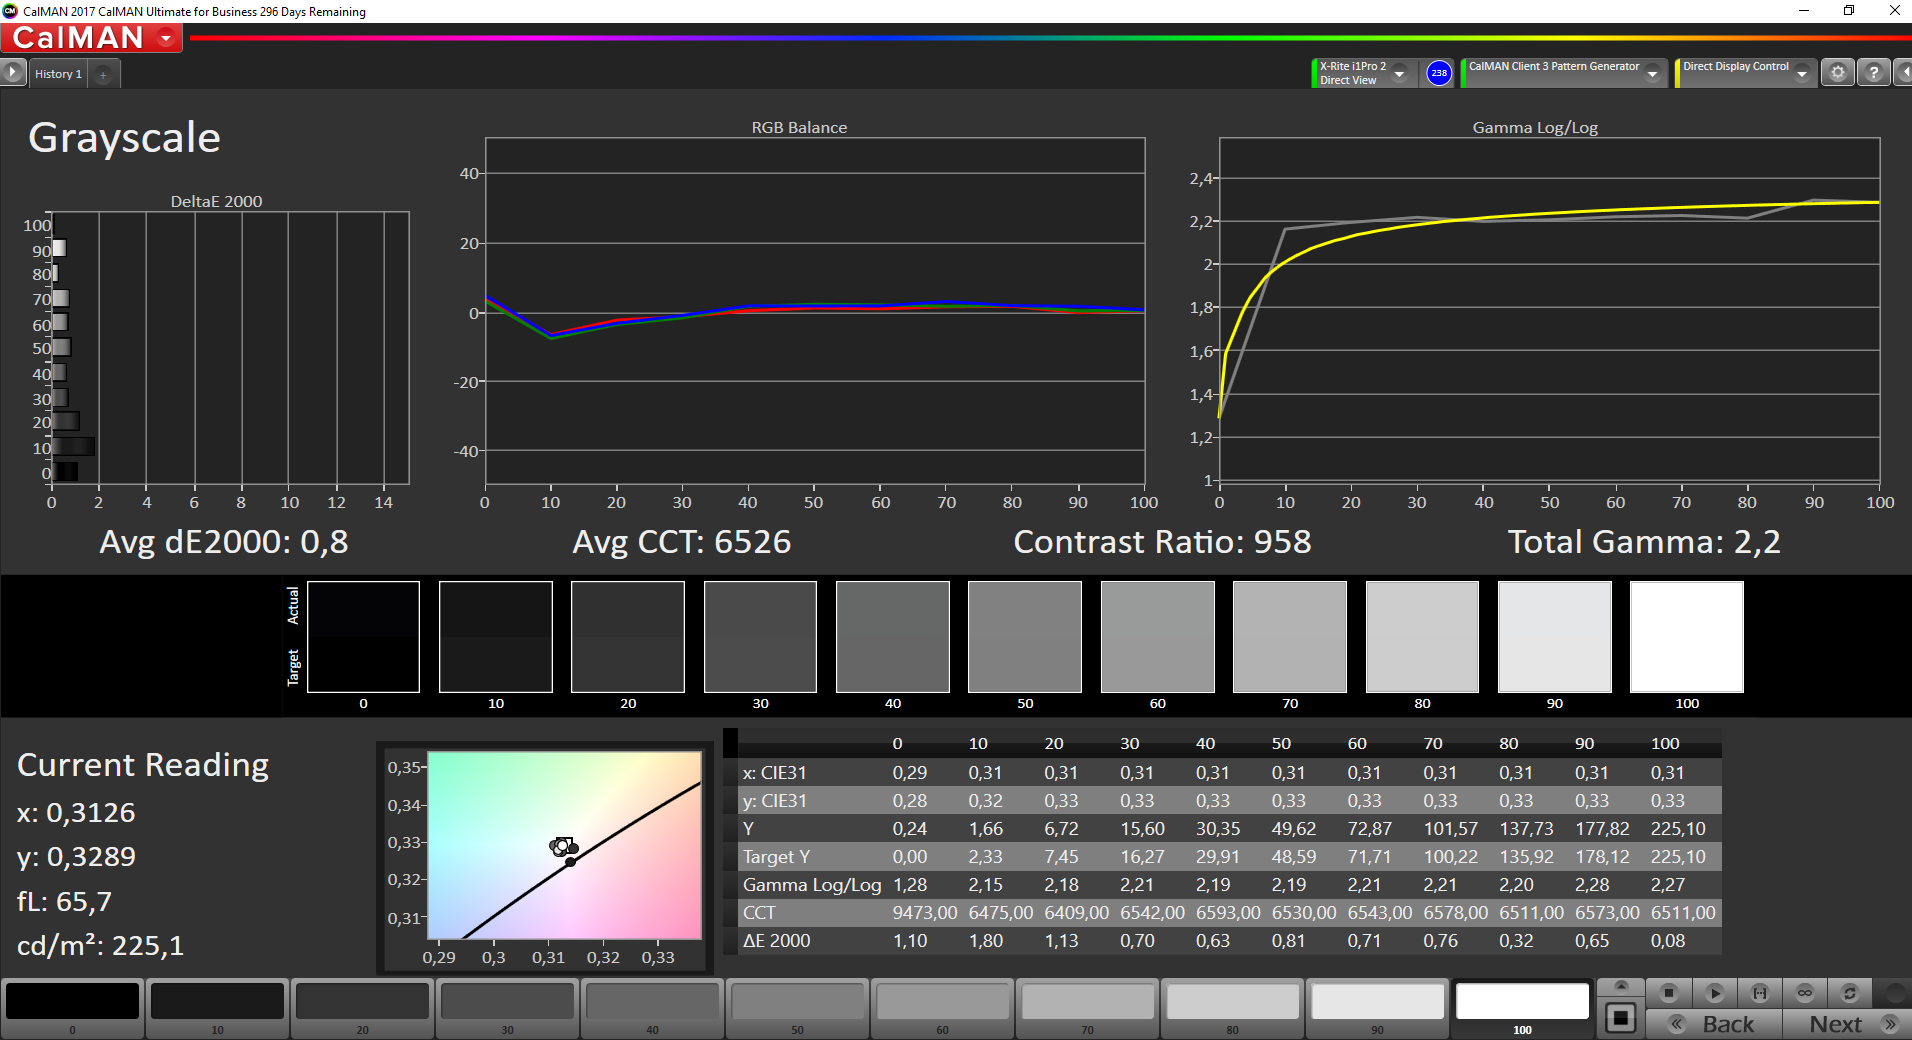
Distribution av ljusstyrkan: 83 %
Mitt på batteriet: 262 cd/m²
Kontrast: 1379:1 (Svärta: 0.19 cd/m²)
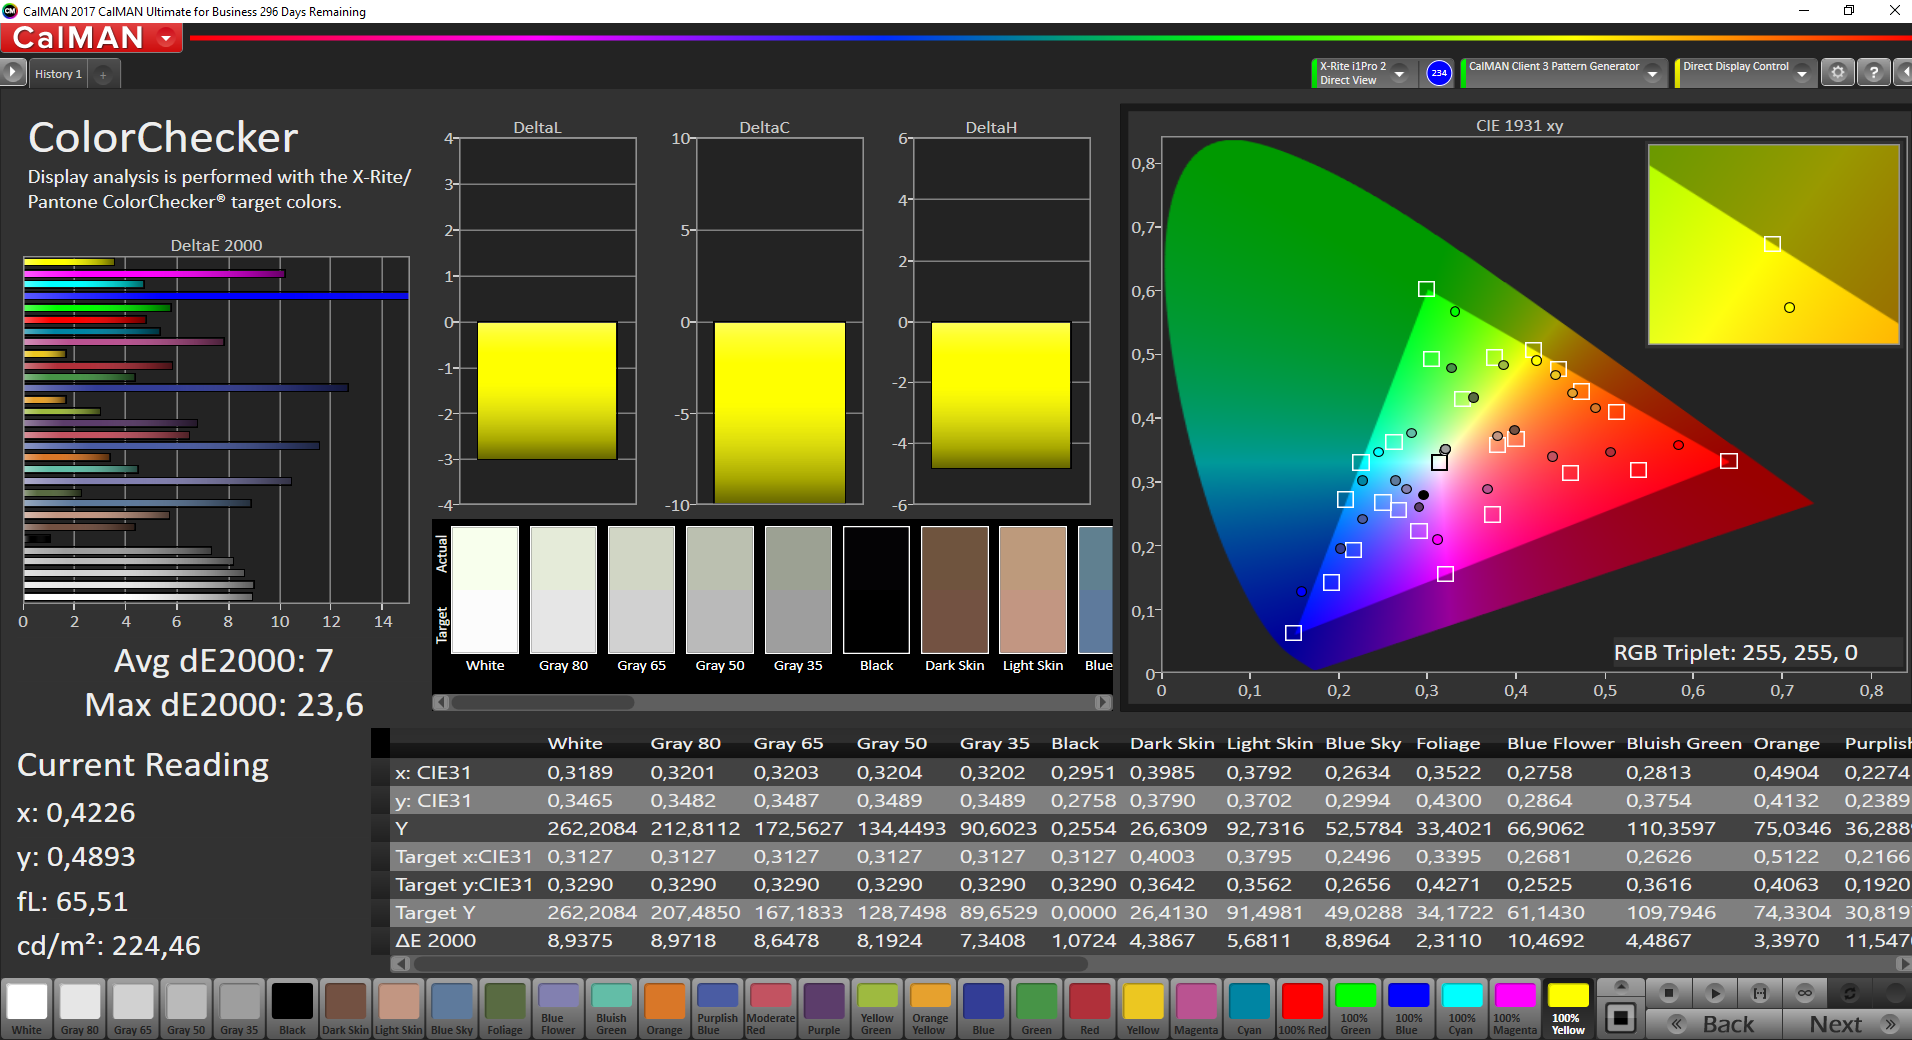
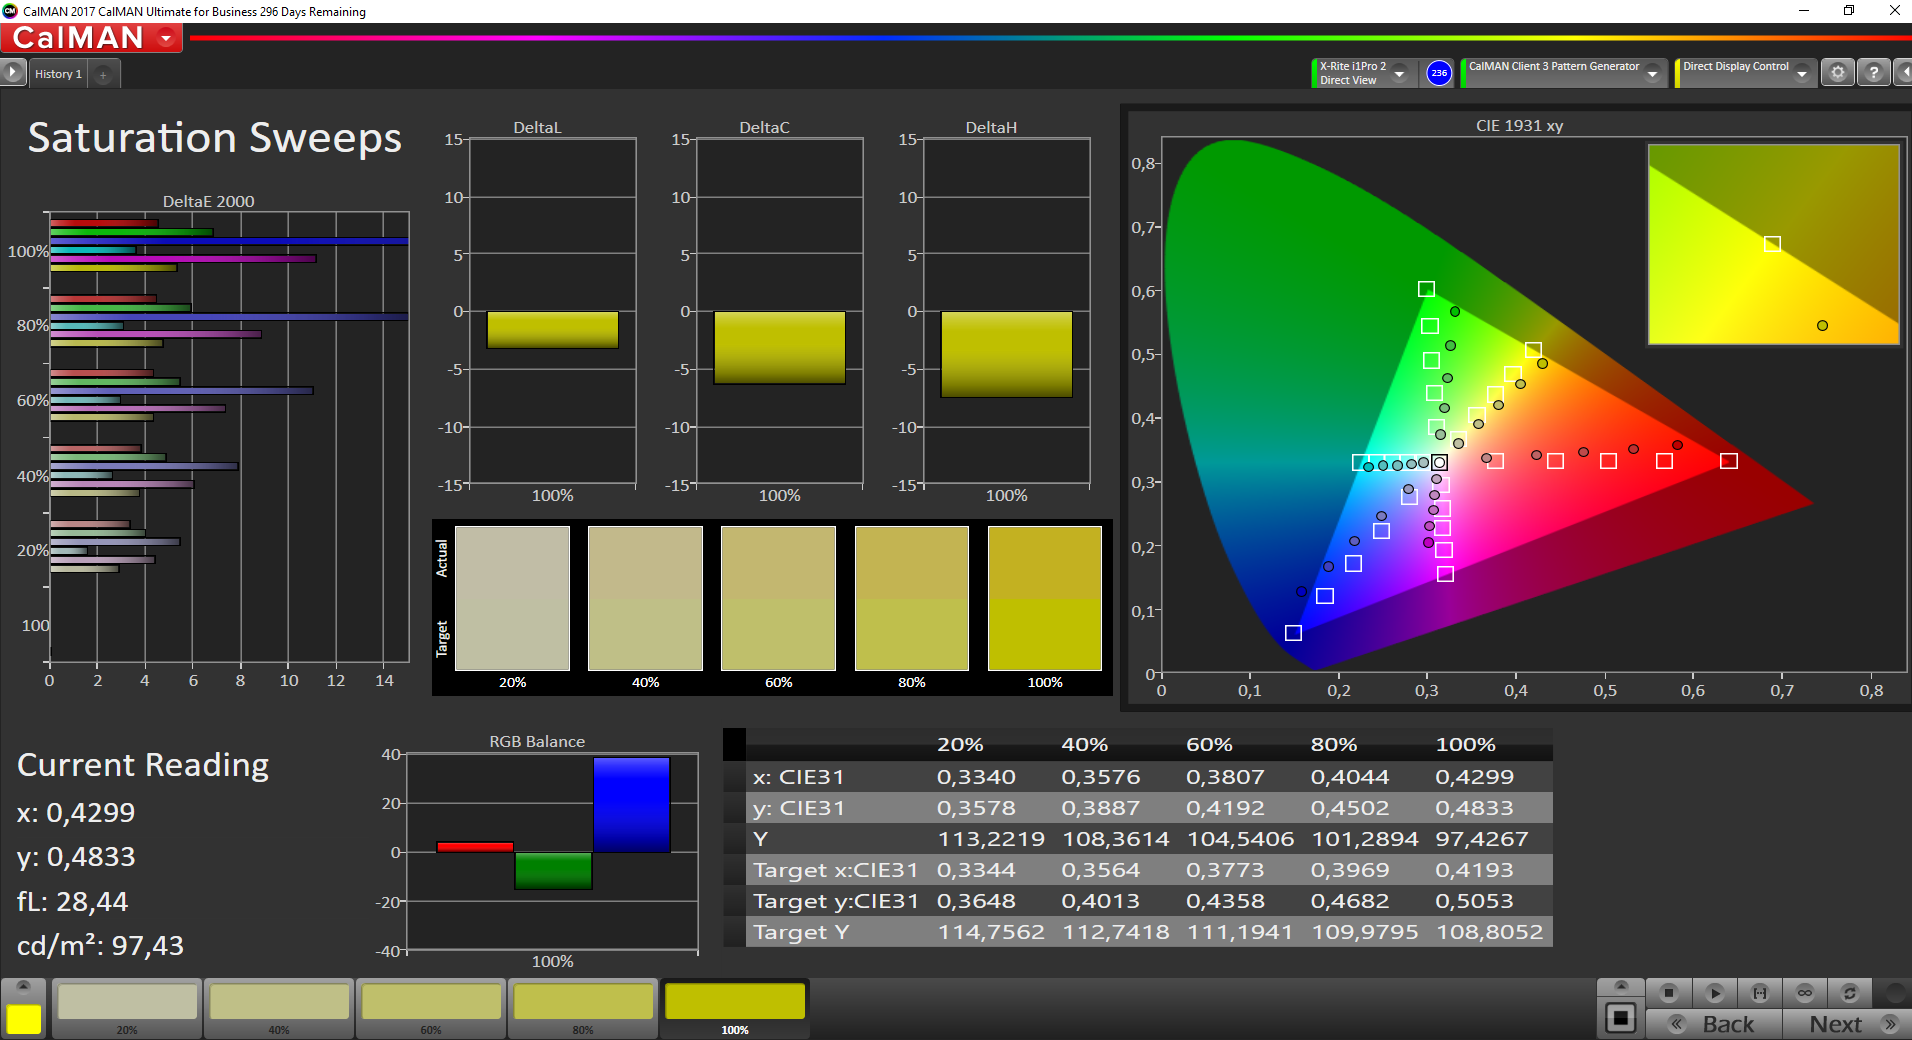
ΔE ColorChecker Calman: 7 | ∀{0.5-29.43 Ø4.72}
ΔE Greyscale Calman: 6.4 | ∀{0.09-98 Ø4.97}
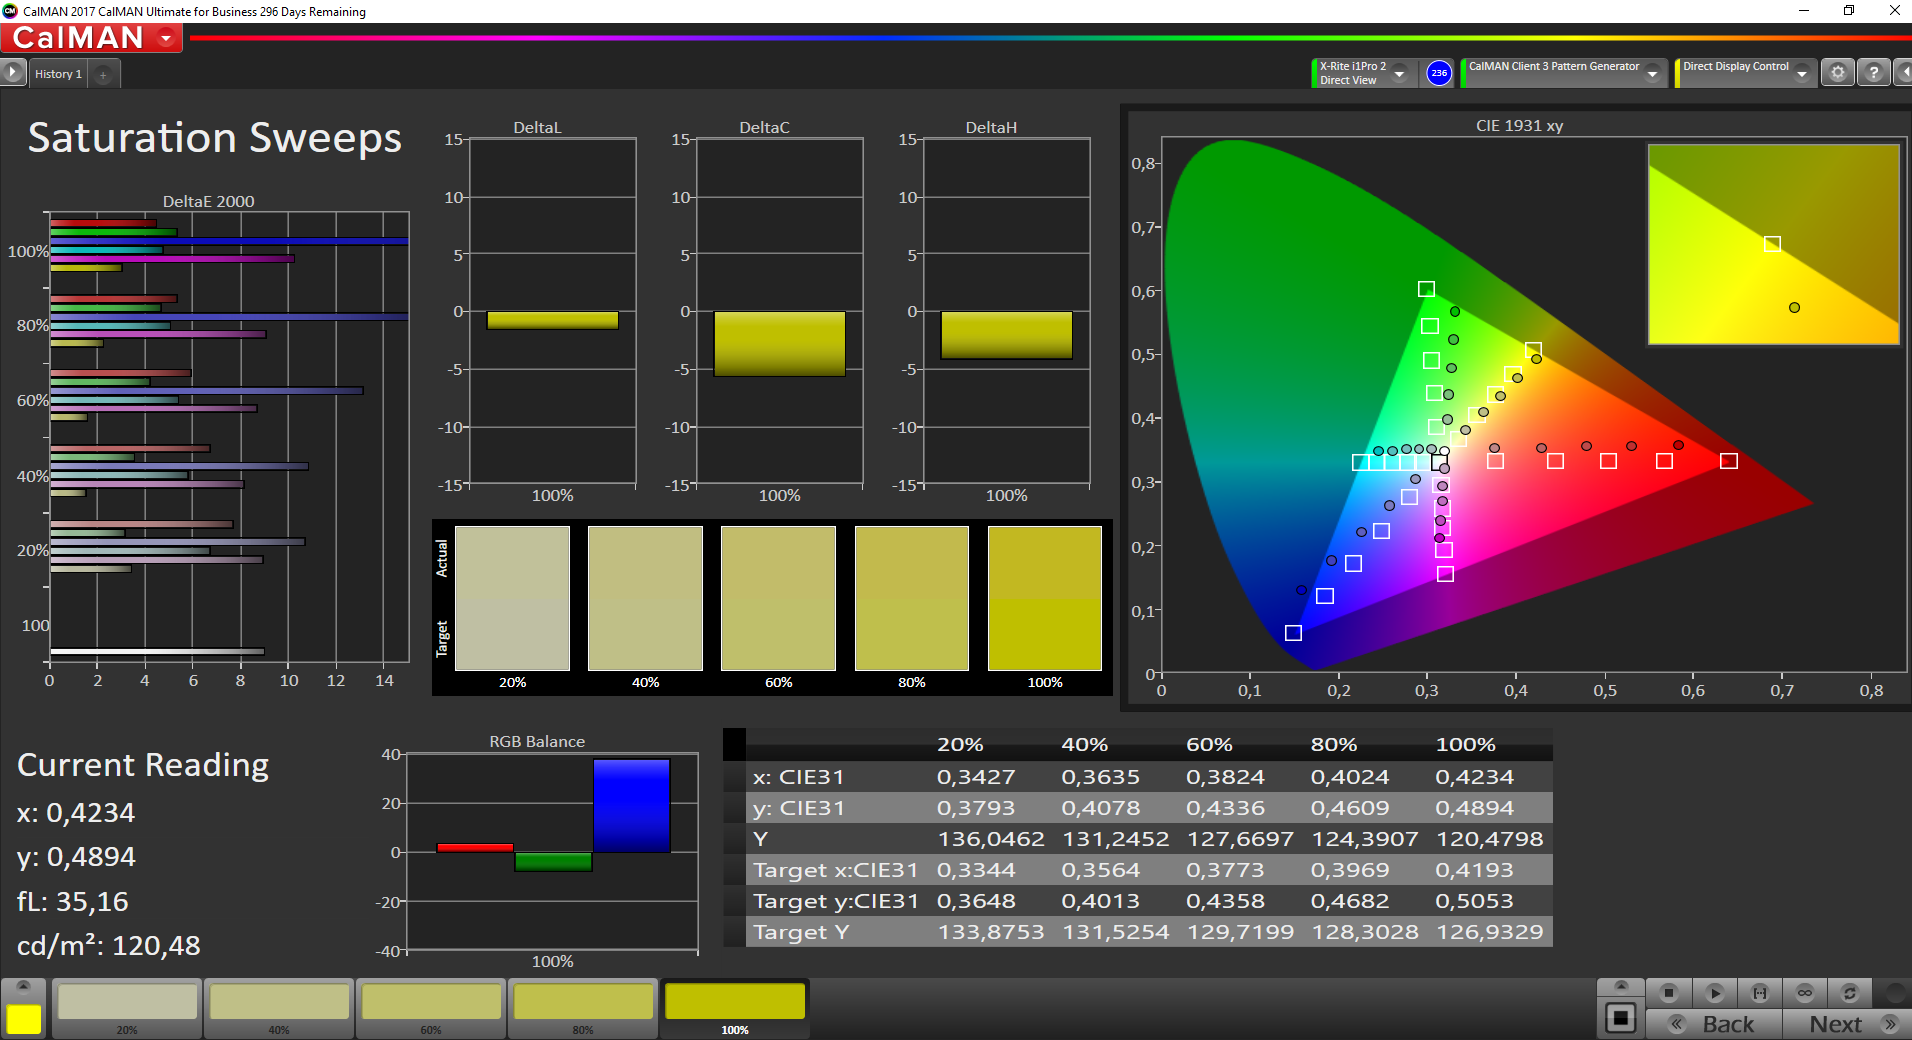
61.9% sRGB (Argyll 1.6.3 3D)
39.5% AdobeRGB 1998 (Argyll 1.6.3 3D)
42.96% AdobeRGB 1998 (Argyll 3D)
62.2% sRGB (Argyll 3D)
41.56% Display P3 (Argyll 3D)
Gamma: 2.14
CCT: 6065 K
| Lenovo ThinkPad E480-20KNCTO1WW Innolux N140HCA-EAC, 1920x1080, 14" | Lenovo ThinkPad E480-20KQS00000 Innolux N140HCA-EAC, 1920x1080, 14" | HP ProBook 440 G5-3KX87ES LGD04B2, 1920x1080, 14" | Lenovo ThinkPad E470 NT140WHM-N41, 1366x768, 14" | Acer TravelMate P449-G2-M-56CD N140HCA-EAB, 1920x1080, 14" | Schenker Slim 14 L17 LG Philips LGD046D, 1920x1080, 14" | Asus VivoBook S14 S406UA-BV023T BOE CQ NT140WHM-N44, 1366x768, 14" | |
|---|---|---|---|---|---|---|---|
| Display | 1% | -5% | -6% | -1% | 47% | -7% | |
| Display P3 Coverage (%) | 41.56 | 41.88 1% | 39.56 -5% | 39.13 -6% | 41.04 -1% | 66.1 59% | 38.82 -7% |
| sRGB Coverage (%) | 62.2 | 62.8 1% | 59.3 -5% | 58.3 -6% | 61.2 -2% | 85.2 37% | 58.2 -6% |
| AdobeRGB 1998 Coverage (%) | 42.96 | 43.29 1% | 40.88 -5% | 40.43 -6% | 42.47 -1% | 62.3 45% | 40.11 -7% |
| Response Times | 1% | 10% | 29% | 12% | 13% | 32% | |
| Response Time Grey 50% / Grey 80% * (ms) | 44.8 ? | 44 ? 2% | 40 ? 11% | 44 ? 2% | 39 ? 13% | 37.6 ? 16% | 42 ? 6% |
| Response Time Black / White * (ms) | 31.2 ? | 31.2 ? -0% | 28.8 ? 8% | 14 ? 55% | 28 ? 10% | 28 ? 10% | 13 ? 58% |
| PWM Frequency (Hz) | 25000 ? | 24880 ? | 200 ? | 25000 ? | 20490 ? | 200 ? | |
| Screen | 10% | -3% | -36% | -6% | 17% | -28% | |
| Brightness middle (cd/m²) | 262 | 251 -4% | 236 -10% | 209 -20% | 271 3% | 326 24% | 215 -18% |
| Brightness (cd/m²) | 245 | 231 -6% | 221 -10% | 208 -15% | 256 4% | 320 31% | 208 -15% |
| Brightness Distribution (%) | 83 | 80 -4% | 88 6% | 81 -2% | 85 2% | 81 -2% | 81 -2% |
| Black Level * (cd/m²) | 0.19 | 0.19 -0% | 0.26 -37% | 0.58 -205% | 0.43 -126% | 0.31 -63% | 0.4 -111% |
| Contrast (:1) | 1379 | 1321 -4% | 908 -34% | 360 -74% | 630 -54% | 1052 -24% | 538 -61% |
| Colorchecker dE 2000 * | 7 | 5.1 27% | 5.7 19% | 8.12 -16% | 5.03 28% | 4.6 34% | 9.37 -34% |
| Colorchecker dE 2000 max. * | 23.6 | 10.6 55% | 22 7% | 15.18 36% | 11.9 50% | 10.3 56% | 15.84 33% |
| Greyscale dE 2000 * | 6.4 | 4.5 30% | 3.8 41% | 9.86 -54% | 4.02 37% | 4.4 31% | 10.52 -64% |
| Gamma | 2.14 103% | 2.18 101% | 2.1 105% | 2.37 93% | 2.31 95% | 2.24 98% | 2.45 90% |
| CCT | 6065 107% | 6146 106% | 7318 89% | 10218 64% | 6659 98% | 5978 109% | 11214 58% |
| Color Space (Percent of AdobeRGB 1998) (%) | 39.5 | 39.8 1% | 37.7 -5% | 37 -6% | 39 -1% | 55.8 41% | 37 -6% |
| Color Space (Percent of sRGB) (%) | 61.9 | 62.5 1% | 59.2 -4% | 58 -6% | 61 -1% | 85.1 37% | 58 -6% |
| Totalt genomsnitt (program/inställningar) | 4% /
7% | 1% /
-2% | -4% /
-22% | 2% /
-3% | 26% /
22% | -1% /
-16% |
* ... mindre är bättre


Visa svarstider
| ↔ Svarstid svart till vitt | ||
|---|---|---|
| 31.2 ms ... stiga ↗ och falla ↘ kombinerat | ↗ 17.2 ms stiga | 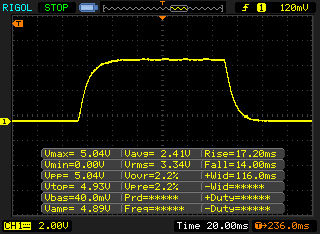 |
| ↘ 14 ms hösten | ||
| Skärmen visar långsamma svarsfrekvenser i våra tester och kommer att vara otillfredsställande för spelare. I jämförelse sträcker sig alla testade enheter från 0.1 (minst) till 240 (maximalt) ms. » 84 % av alla enheter är bättre. Detta innebär att den uppmätta svarstiden är sämre än genomsnittet av alla testade enheter (19.8 ms). | ||
| ↔ Svarstid 50 % grått till 80 % grått | ||
| 44.8 ms ... stiga ↗ och falla ↘ kombinerat | ↗ 23.6 ms stiga | 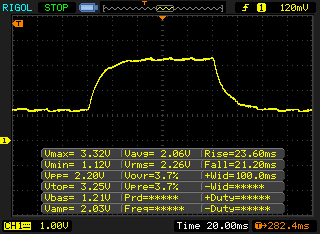 |
| ↘ 21.2 ms hösten | ||
| Skärmen visar långsamma svarsfrekvenser i våra tester och kommer att vara otillfredsställande för spelare. I jämförelse sträcker sig alla testade enheter från 0.165 (minst) till 636 (maximalt) ms. » 76 % av alla enheter är bättre. Detta innebär att den uppmätta svarstiden är sämre än genomsnittet av alla testade enheter (31 ms). | ||
Skärmflimmer / PWM (Puls-Width Modulation)
| Skärmflimmer / PWM upptäckt | 25000 Hz | ≤ 30 % ljusstyrka inställning | 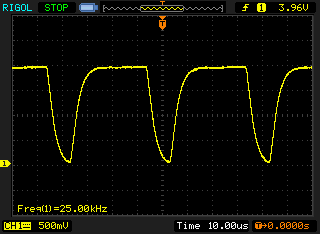 |
Displayens bakgrundsbelysning flimrar vid 25000 Hz (i värsta fall, t.ex. med PWM) Flimrande upptäckt vid en ljusstyrkeinställning på 30 % och lägre. Det ska inte finnas något flimmer eller PWM över denna ljusstyrkeinställning. Frekvensen för 25000 Hz är ganska hög, så de flesta användare som är känsliga för PWM bör inte märka något flimmer. Som jämförelse: 52 % av alla testade enheter använder inte PWM för att dämpa skärmen. Om PWM upptäcktes mättes ett medelvärde av 7772 (minst: 5 - maximum: 343500) Hz. | |||
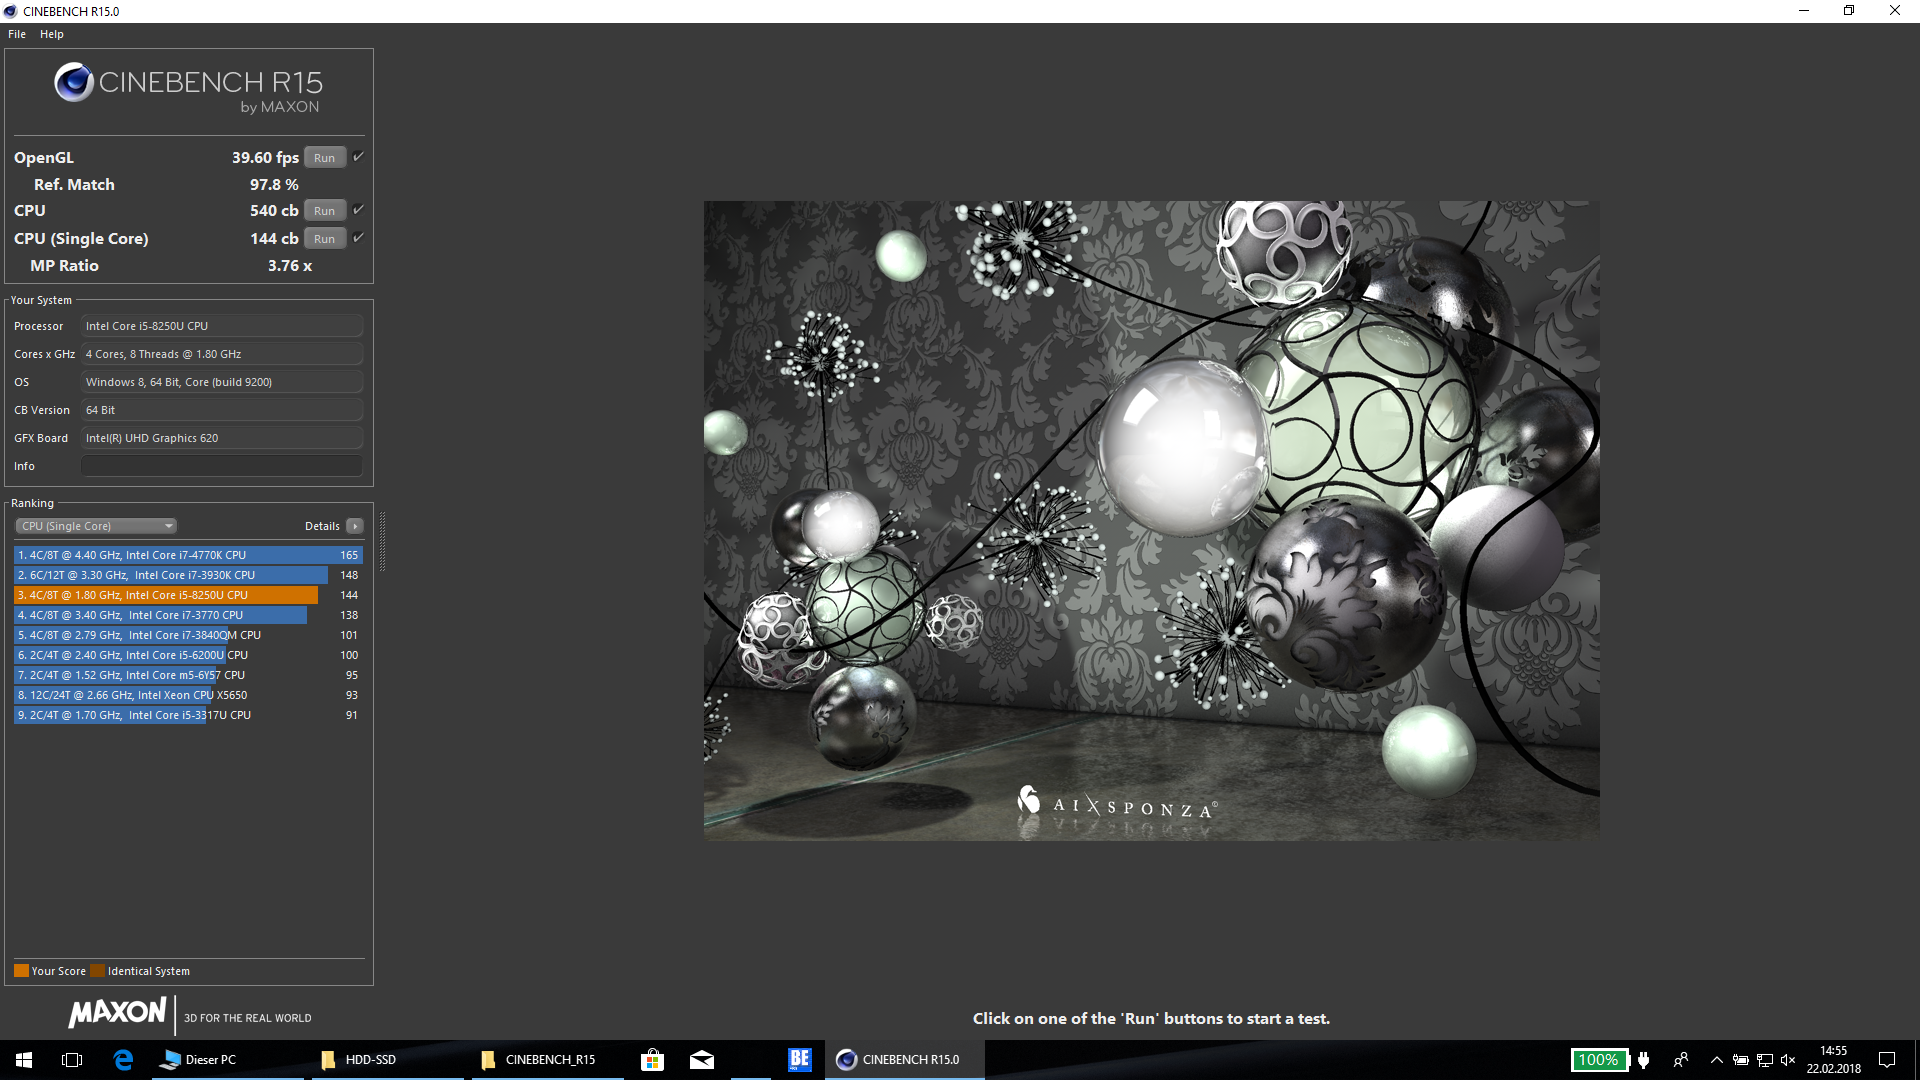
| Cinebench R15 | |
| CPU Single 64Bit | |
| Genomsnitt av klass Office (99.5 - 312, n=75, senaste 2 åren) | |
| HP ProBook 440 G5-3KX87ES | |
| Schenker Slim 14 L17 | |
| Lenovo ThinkPad E480-20KQS00000 | |
| Lenovo ThinkPad E480-20KNCTO1WW | |
| Asus VivoBook S14 S406UA-BV023T | |
| Genomsnitt Intel Core i5-8250U (81 - 147, n=97) | |
| Acer TravelMate P449-G2-M-56CD | |
| Lenovo ThinkPad E470 | |
| CPU Multi 64Bit | |
| Genomsnitt av klass Office (250 - 3380, n=75, senaste 2 åren) | |
| HP ProBook 440 G5-3KX87ES | |
| Asus VivoBook S14 S406UA-BV023T | |
| Genomsnitt Intel Core i5-8250U (320 - 730, n=101) | |
| Schenker Slim 14 L17 | |
| Lenovo ThinkPad E480-20KQS00000 | |
| Lenovo ThinkPad E480-20KNCTO1WW | |
| Acer TravelMate P449-G2-M-56CD | |
| Lenovo ThinkPad E470 | |
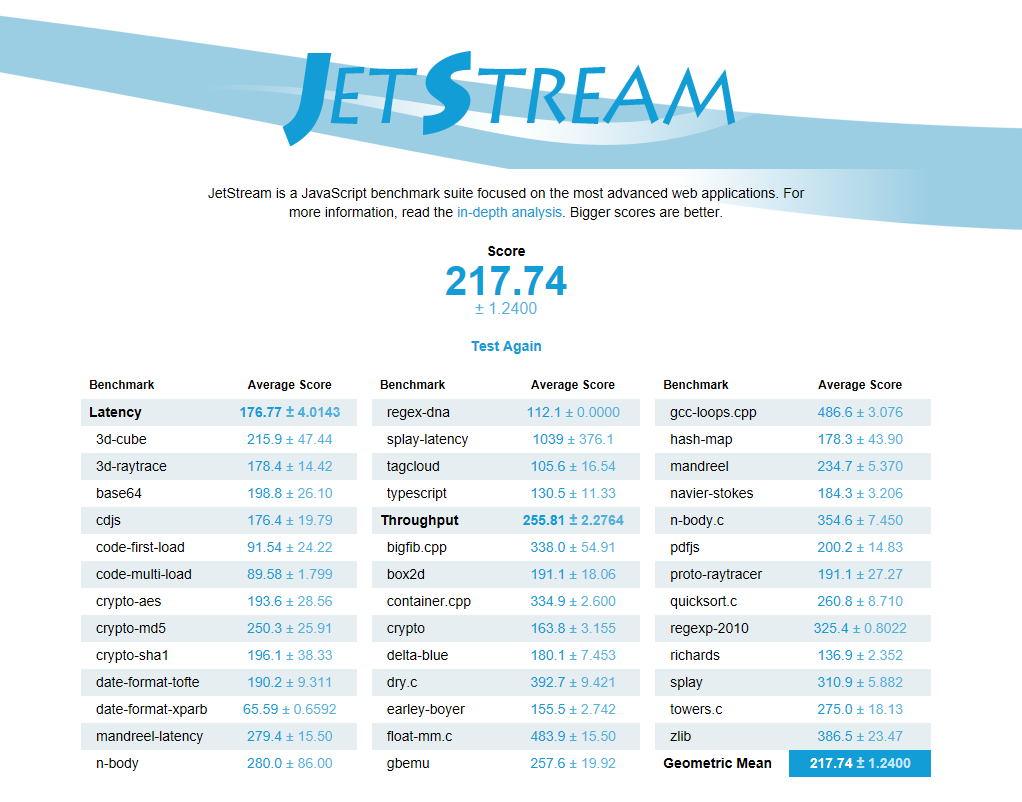
| JetStream 1.1 - 1.1 Total | |
| Asus VivoBook S14 S406UA-BV023T | |
| Lenovo ThinkPad E480-20KQS00000 | |
| HP ProBook 440 G5-3KX87ES | |
| Lenovo ThinkPad E480-20KNCTO1WW | |
| Genomsnitt Intel Core i5-8250U (151.5 - 256, n=78) | |
| Lenovo ThinkPad E470 | |
| Acer TravelMate P449-G2-M-56CD | |
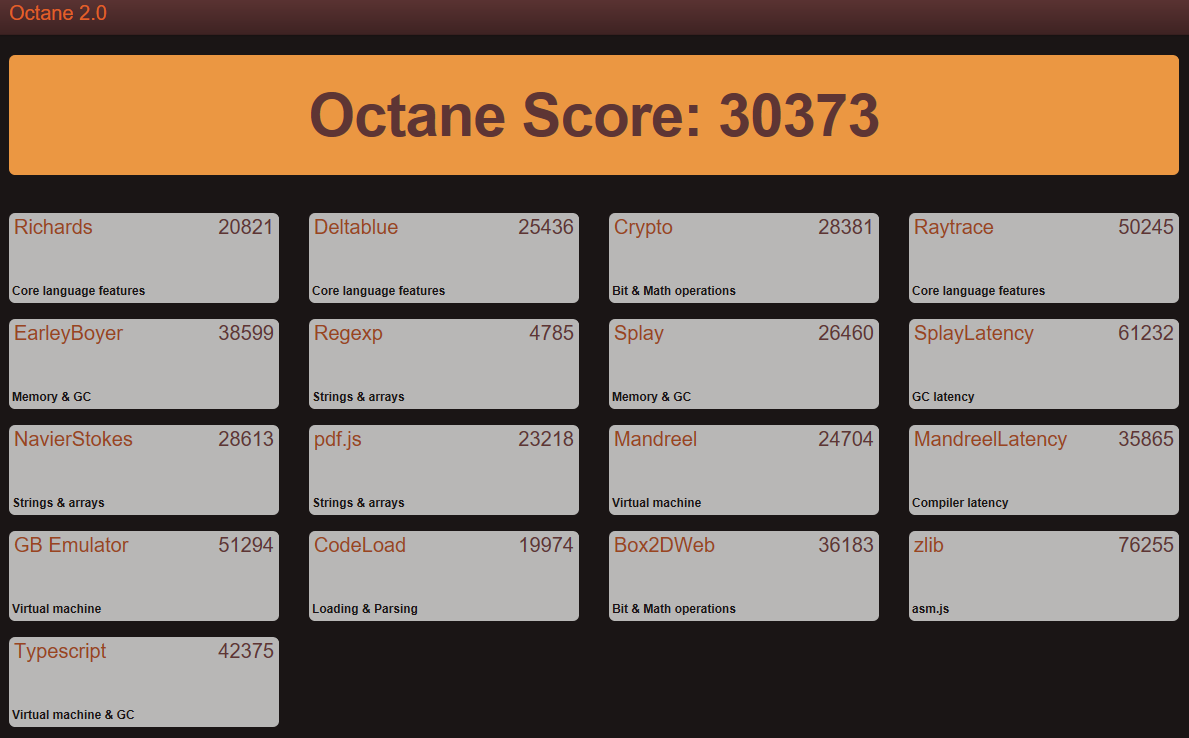
| Octane V2 - Total Score | |
| Genomsnitt av klass Office (49011 - 122119, n=19, senaste 2 åren) | |
| Lenovo ThinkPad E480-20KQS00000 | |
| HP ProBook 440 G5-3KX87ES | |
| Acer TravelMate P449-G2-M-56CD | |
| Lenovo ThinkPad E480-20KNCTO1WW | |
| Genomsnitt Intel Core i5-8250U (22772 - 35817, n=54) | |
| Lenovo ThinkPad E470 | |
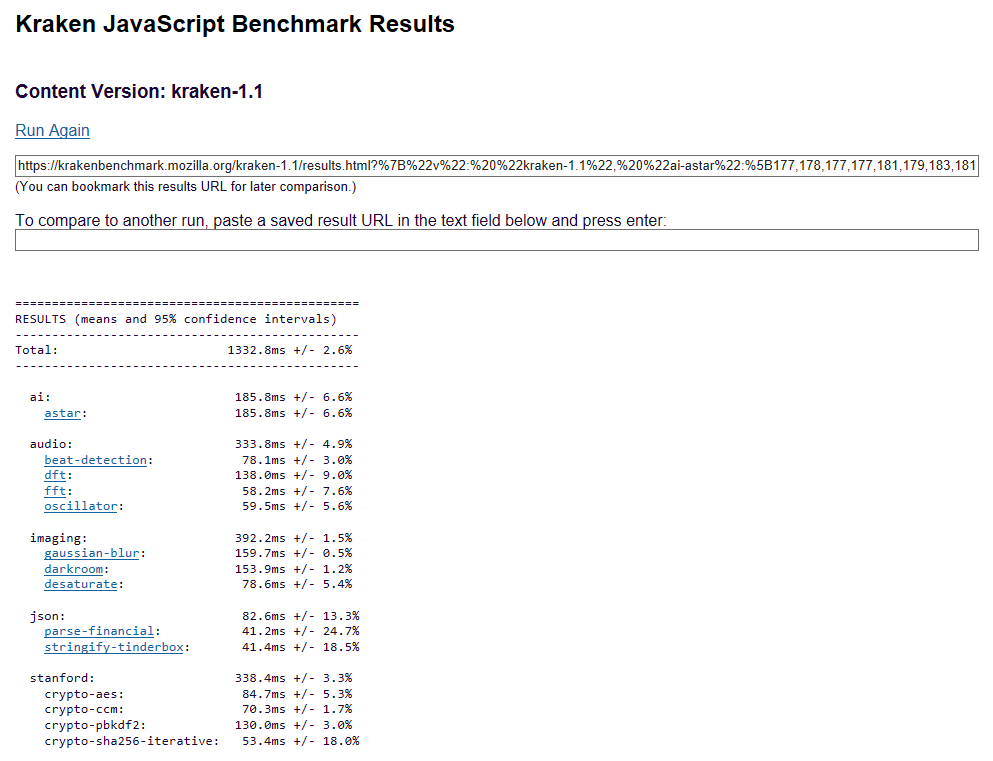
| Mozilla Kraken 1.1 - Total | |
| Lenovo ThinkPad E480-20KNCTO1WW | |
| Lenovo ThinkPad E470 | |
| Genomsnitt Intel Core i5-8250U (986 - 1532, n=59) | |
| Acer TravelMate P449-G2-M-56CD | |
| HP ProBook 440 G5-3KX87ES | |
| Lenovo ThinkPad E480-20KQS00000 | |
| Genomsnitt av klass Office (391 - 1297, n=76, senaste 2 åren) | |
* ... mindre är bättre
| Lenovo ThinkPad E480-20KNCTO1WW UHD Graphics 620, i5-8250U, Toshiba KBG30ZMT128G | Lenovo ThinkPad E480-20KQS00000 Radeon RX 550 (Laptop), i5-8250U, Lenovo LENSE20256GMSP34MEAT2TA | HP ProBook 440 G5-3KX87ES UHD Graphics 620, i5-8250U, Intel SSD 600p SSDPEKKW256G7 | Lenovo ThinkPad E470 HD Graphics 620, i5-7200U, SanDisk X400 SED 256GB, SATA (SD8TB8U-256G) | Acer TravelMate P449-G2-M-56CD HD Graphics 620, i5-7200U, Intel SSD 600p SSDPEKKW512G7 | Schenker Slim 14 L17 UHD Graphics 620, i5-8250U, Samsung SSD 960 Pro 512 GB m.2 | Asus VivoBook S14 S406UA-BV023T UHD Graphics 620, i5-8250U, SanDisk SD8SN8U256G1002 | Genomsnitt Intel Core i5-8250U, Intel UHD Graphics 620 | Genomsnitt av klass Office | |
|---|---|---|---|---|---|---|---|---|---|
| PCMark 8 | 12% | 4% | 2% | -4% | 12% | 8% | -2% | 30% | |
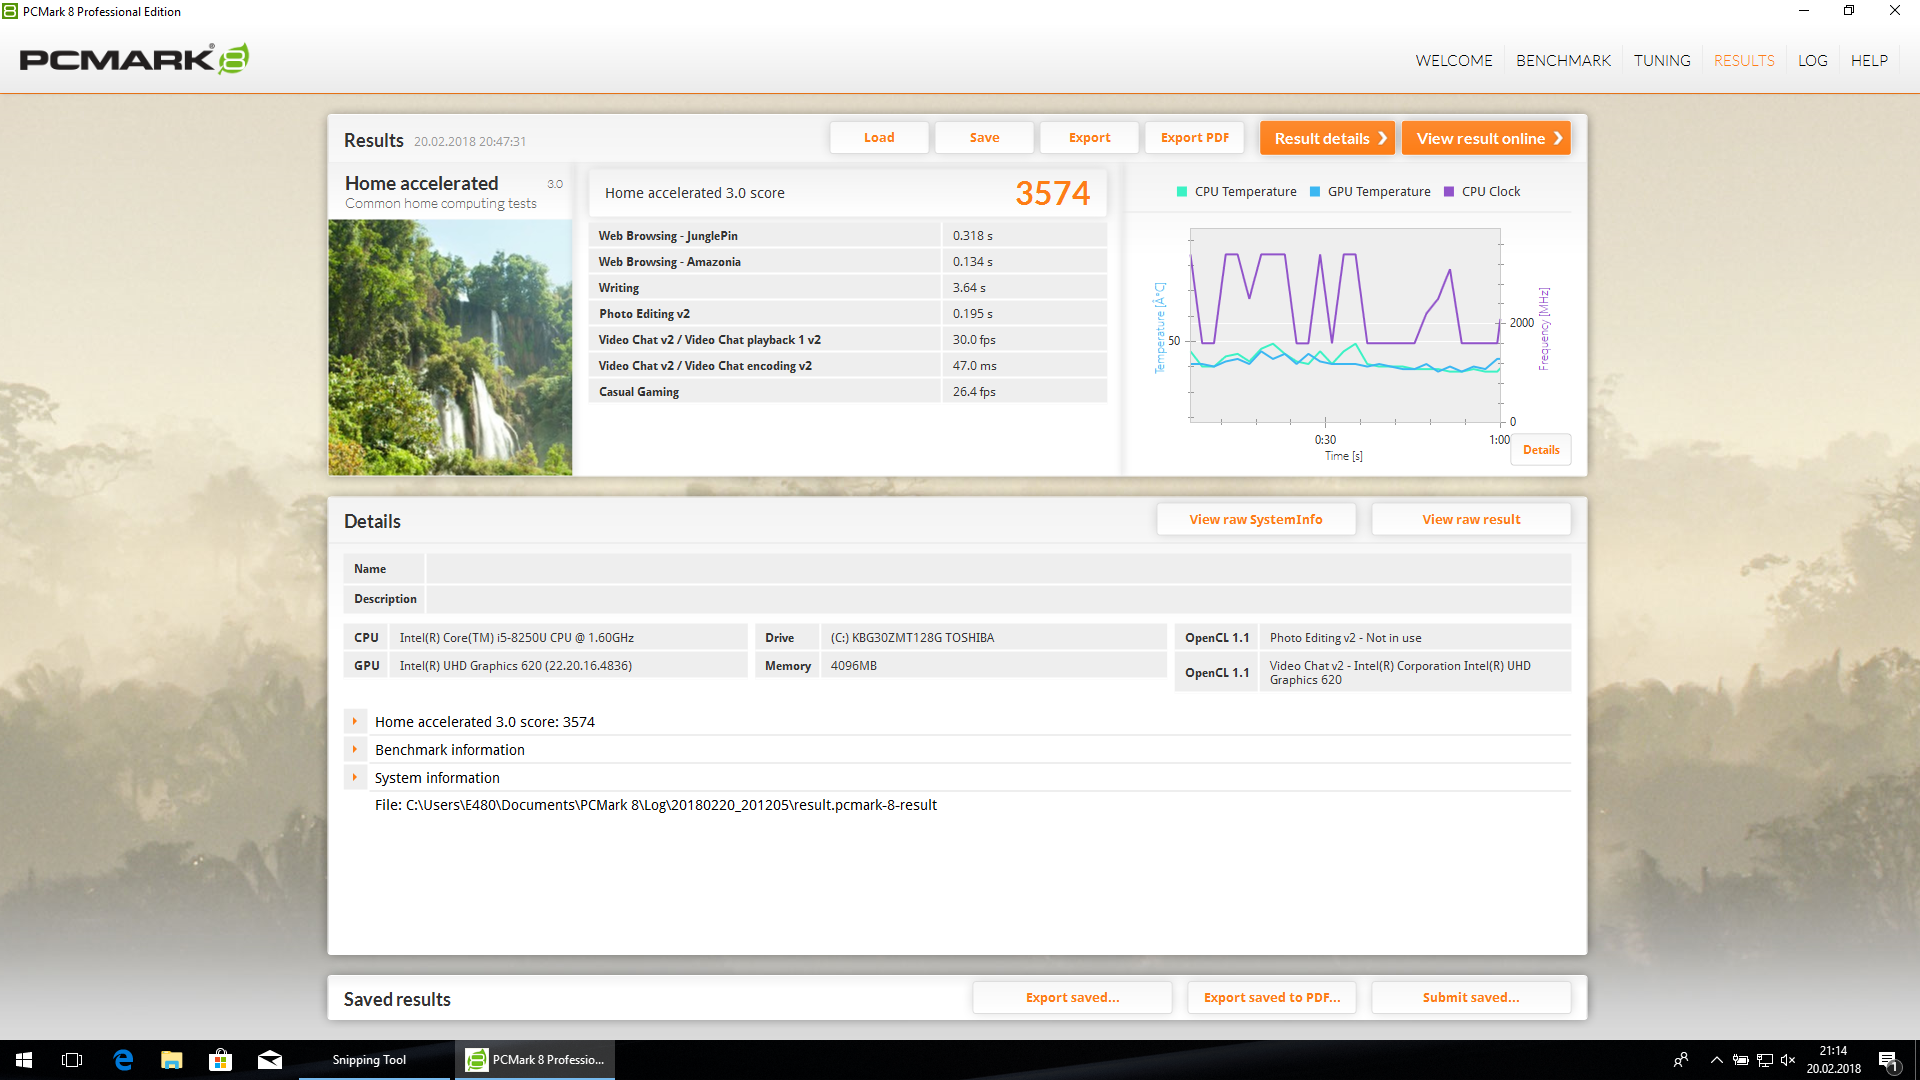
| Home Score Accelerated v2 (Points) | 3574 | 4187 17% | 3774 6% | 3674 3% | 3519 -2% | 4006 12% | 3937 10% | 3584 ? 0% | 5222 ? 46% |
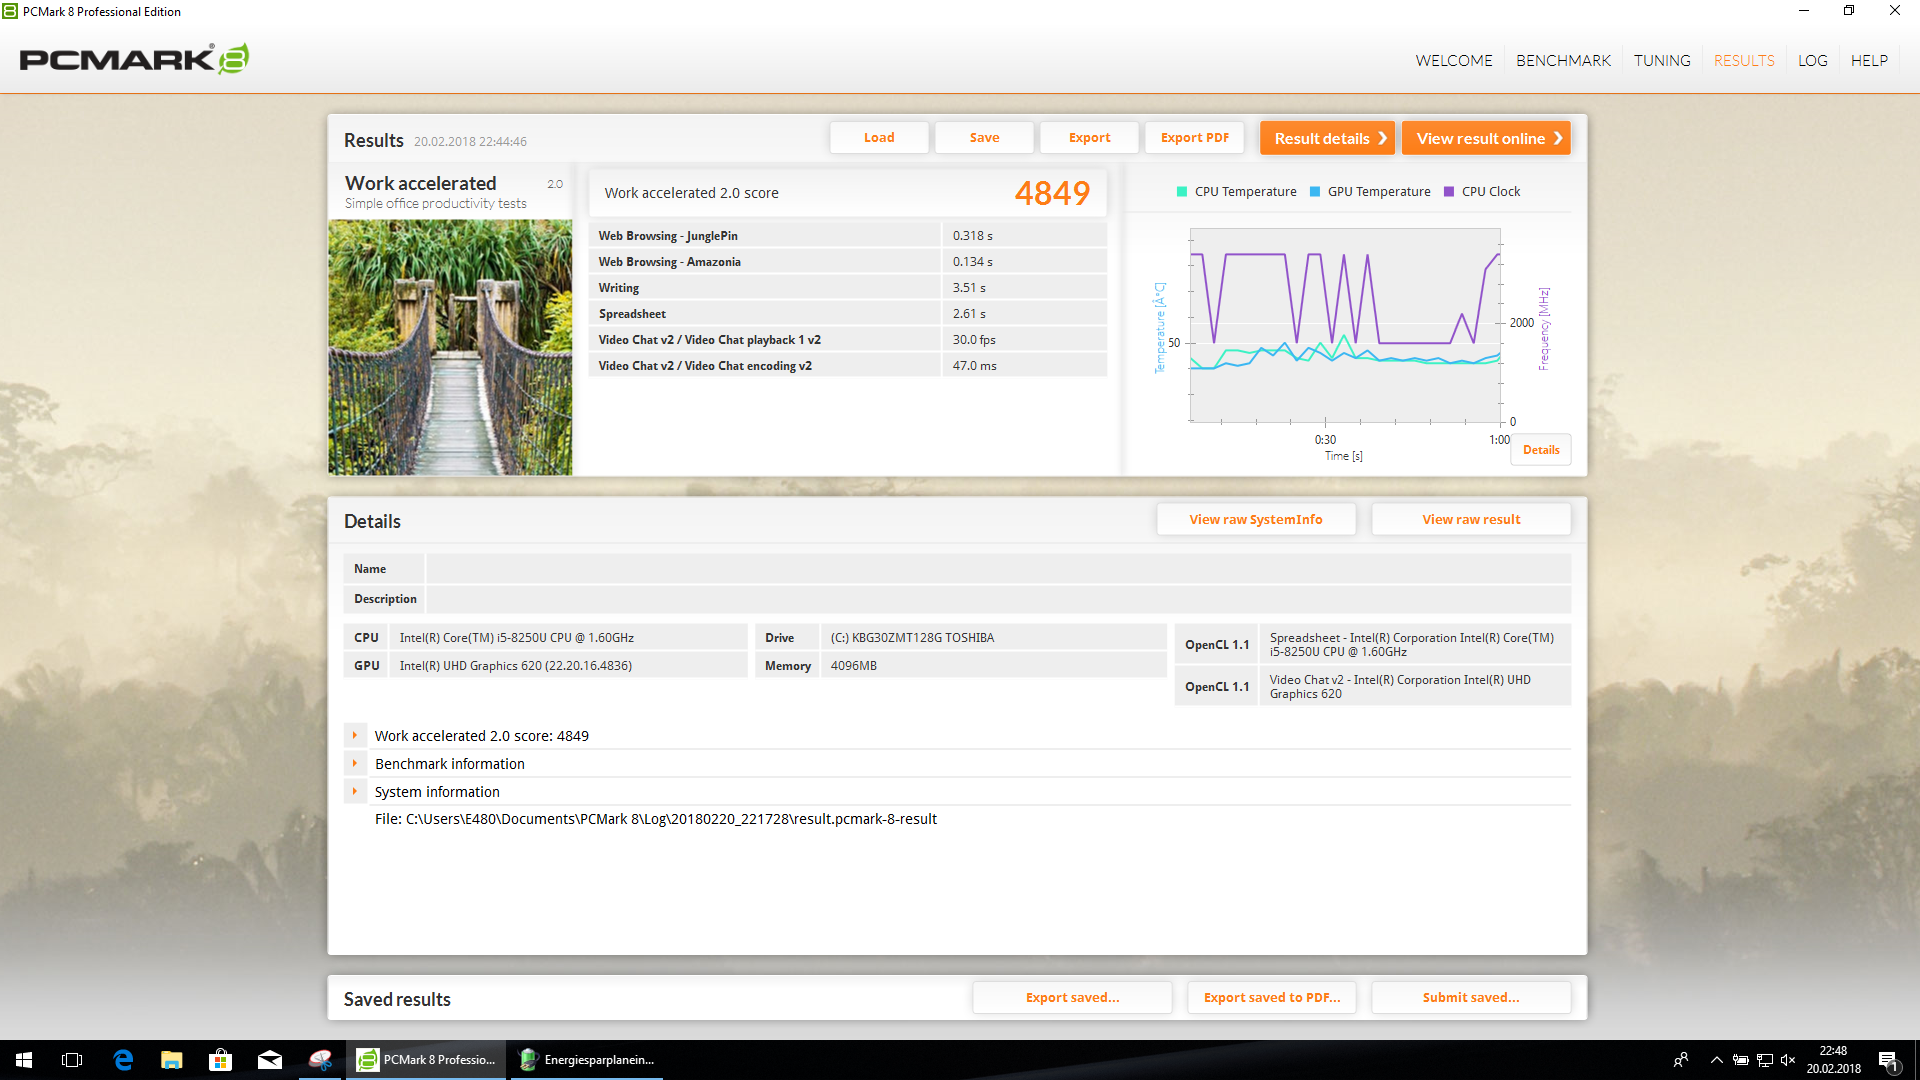
| Work Score Accelerated v2 (Points) | 4849 | 5189 7% | 4922 2% | 4834 0% | 4605 -5% | 5106 5% | 4646 ? -4% | 5491 ? 13% | |
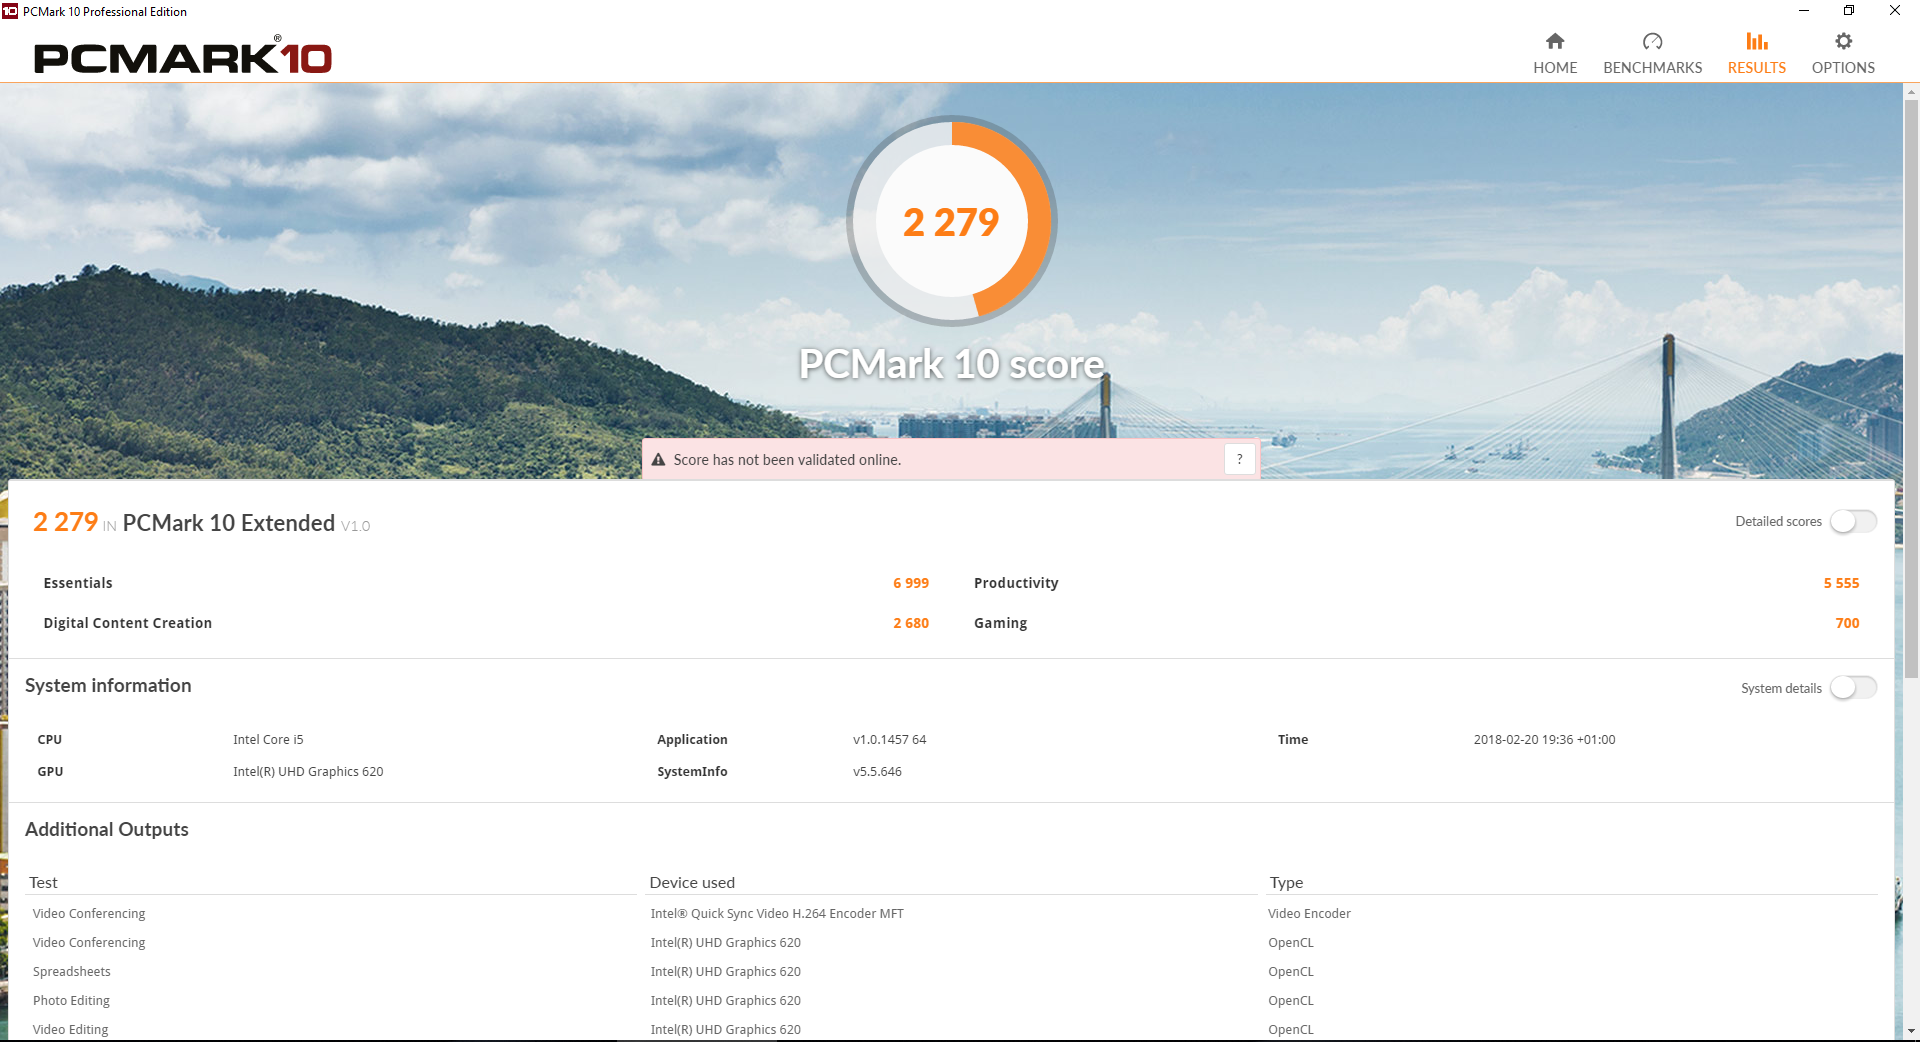
| PCMark 10 | 42% | 33% | 16% | 18% | 33% | 26% | 114% | ||
| Score (Points) | 2279 | 3954 73% | 3577 57% | 3144 38% | 3068 35% | 3612 58% | 3296 ? 45% | 6497 ? 185% | |
| Essentials (Points) | 6999 | 7722 10% | 7655 9% | 6547 -6% | 7077 1% | 7468 7% | 7398 ? 6% | 9996 ? 43% | |
| Totalt genomsnitt (program/inställningar) | 27% /
27% | 19% /
19% | 9% /
9% | 7% /
7% | 12% /
12% | 21% /
20% | 12% /
12% | 72% /
72% |
| PCMark 8 Home Score Accelerated v2 | 3574 poäng | |
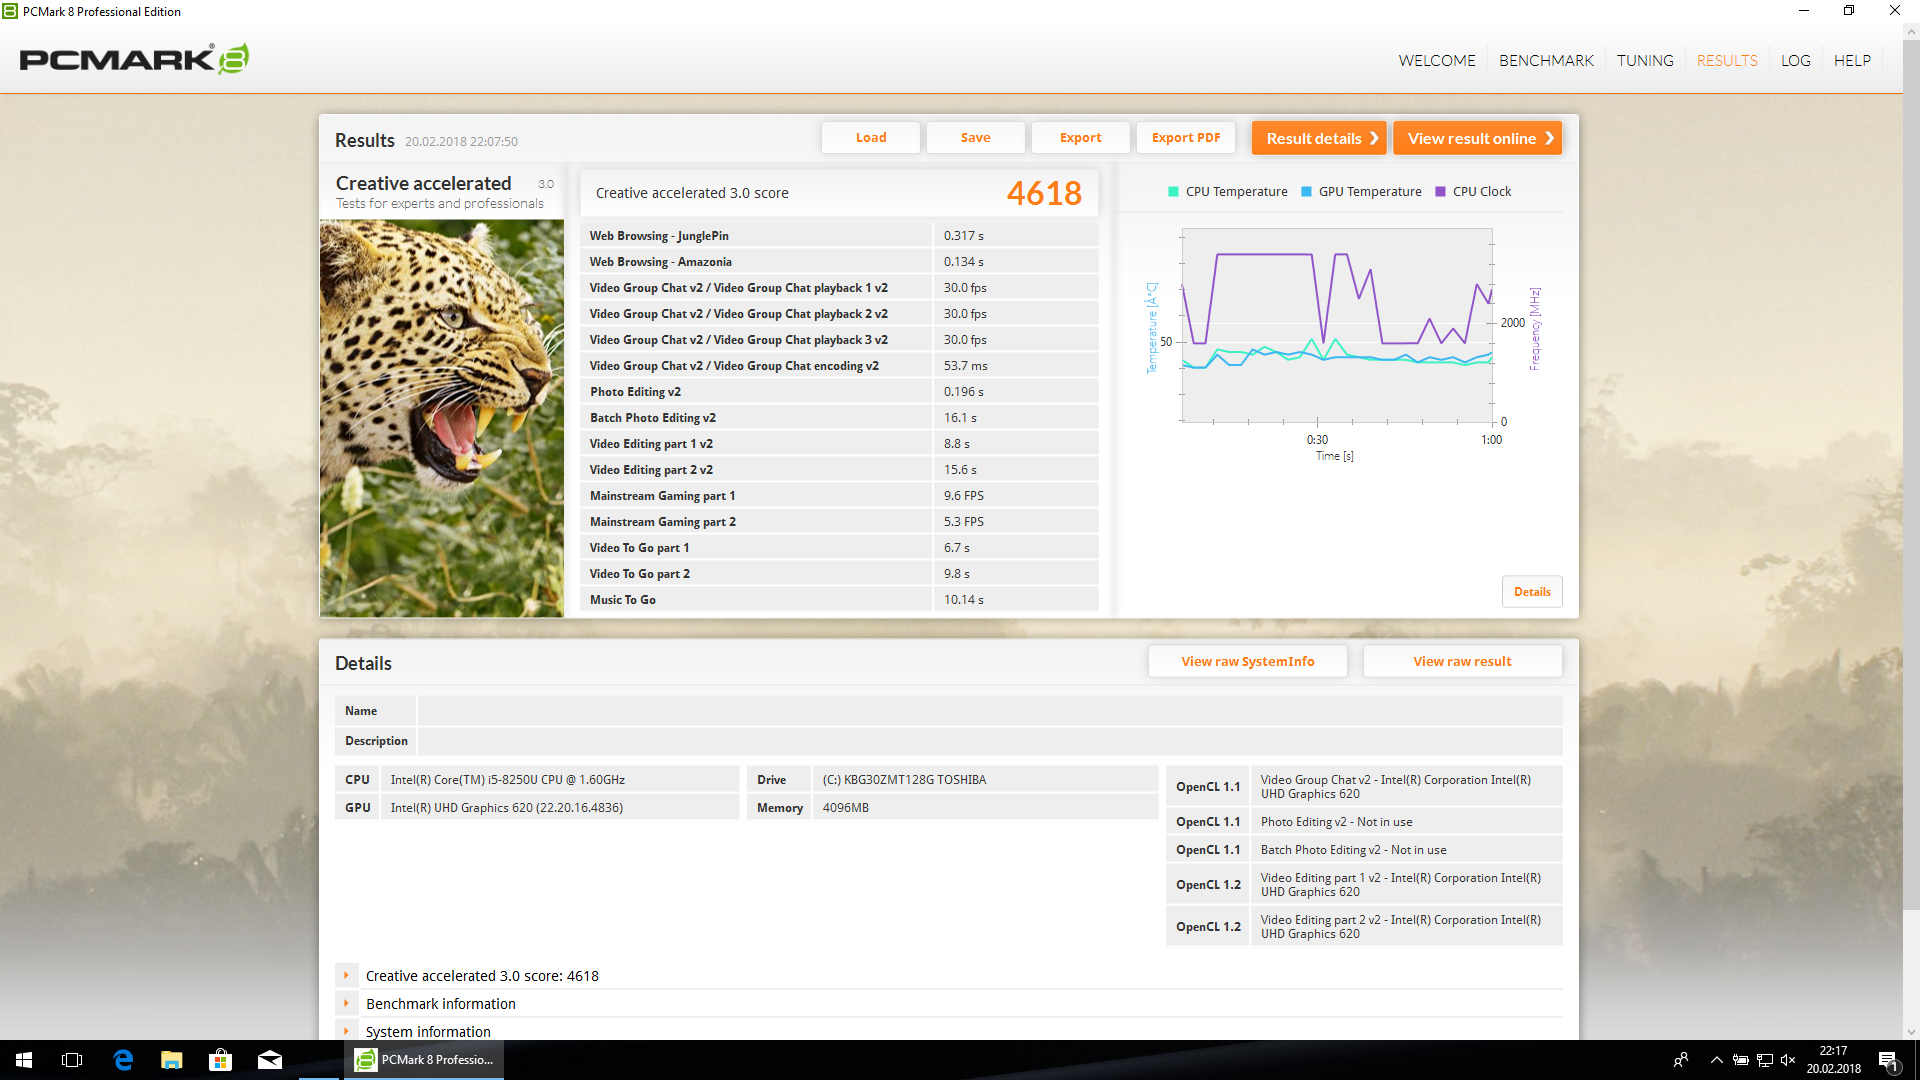
| PCMark 8 Creative Score Accelerated v2 | 4618 poäng | |
| PCMark 8 Work Score Accelerated v2 | 4849 poäng | |
| PCMark 10 Score | 2279 poäng | |
Hjälp | ||
| Lenovo ThinkPad E480-20KNCTO1WW UHD Graphics 620, i5-8250U, Toshiba KBG30ZMT128G | Lenovo ThinkPad E480-20KQS00000 Radeon RX 550 (Laptop), i5-8250U, Lenovo LENSE20256GMSP34MEAT2TA | HP ProBook 440 G5-3KX87ES UHD Graphics 620, i5-8250U, Intel SSD 600p SSDPEKKW256G7 | Lenovo ThinkPad E470 HD Graphics 620, i5-7200U, SanDisk X400 SED 256GB, SATA (SD8TB8U-256G) | Acer TravelMate P449-G2-M-56CD HD Graphics 620, i5-7200U, Intel SSD 600p SSDPEKKW512G7 | Schenker Slim 14 L17 UHD Graphics 620, i5-8250U, Samsung SSD 960 Pro 512 GB m.2 | |
|---|---|---|---|---|---|---|
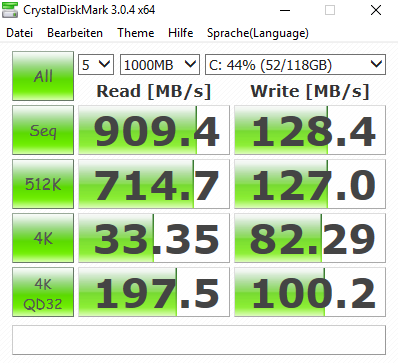
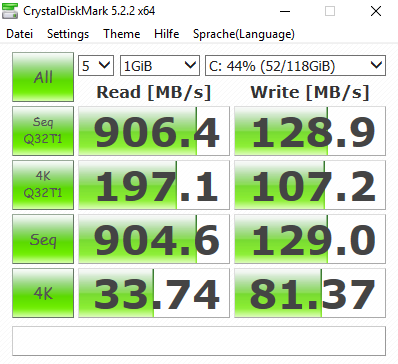
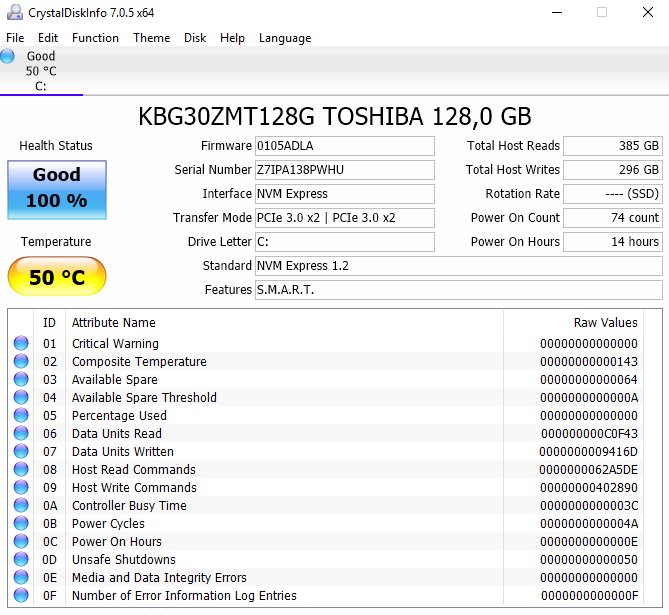
| CrystalDiskMark 3.0 | 24% | 155% | 56% | 152% | 440% | |
| Read Seq (MB/s) | 909 | 1295 42% | 1181 30% | 454.2 -50% | 1086 19% | 2860 215% |
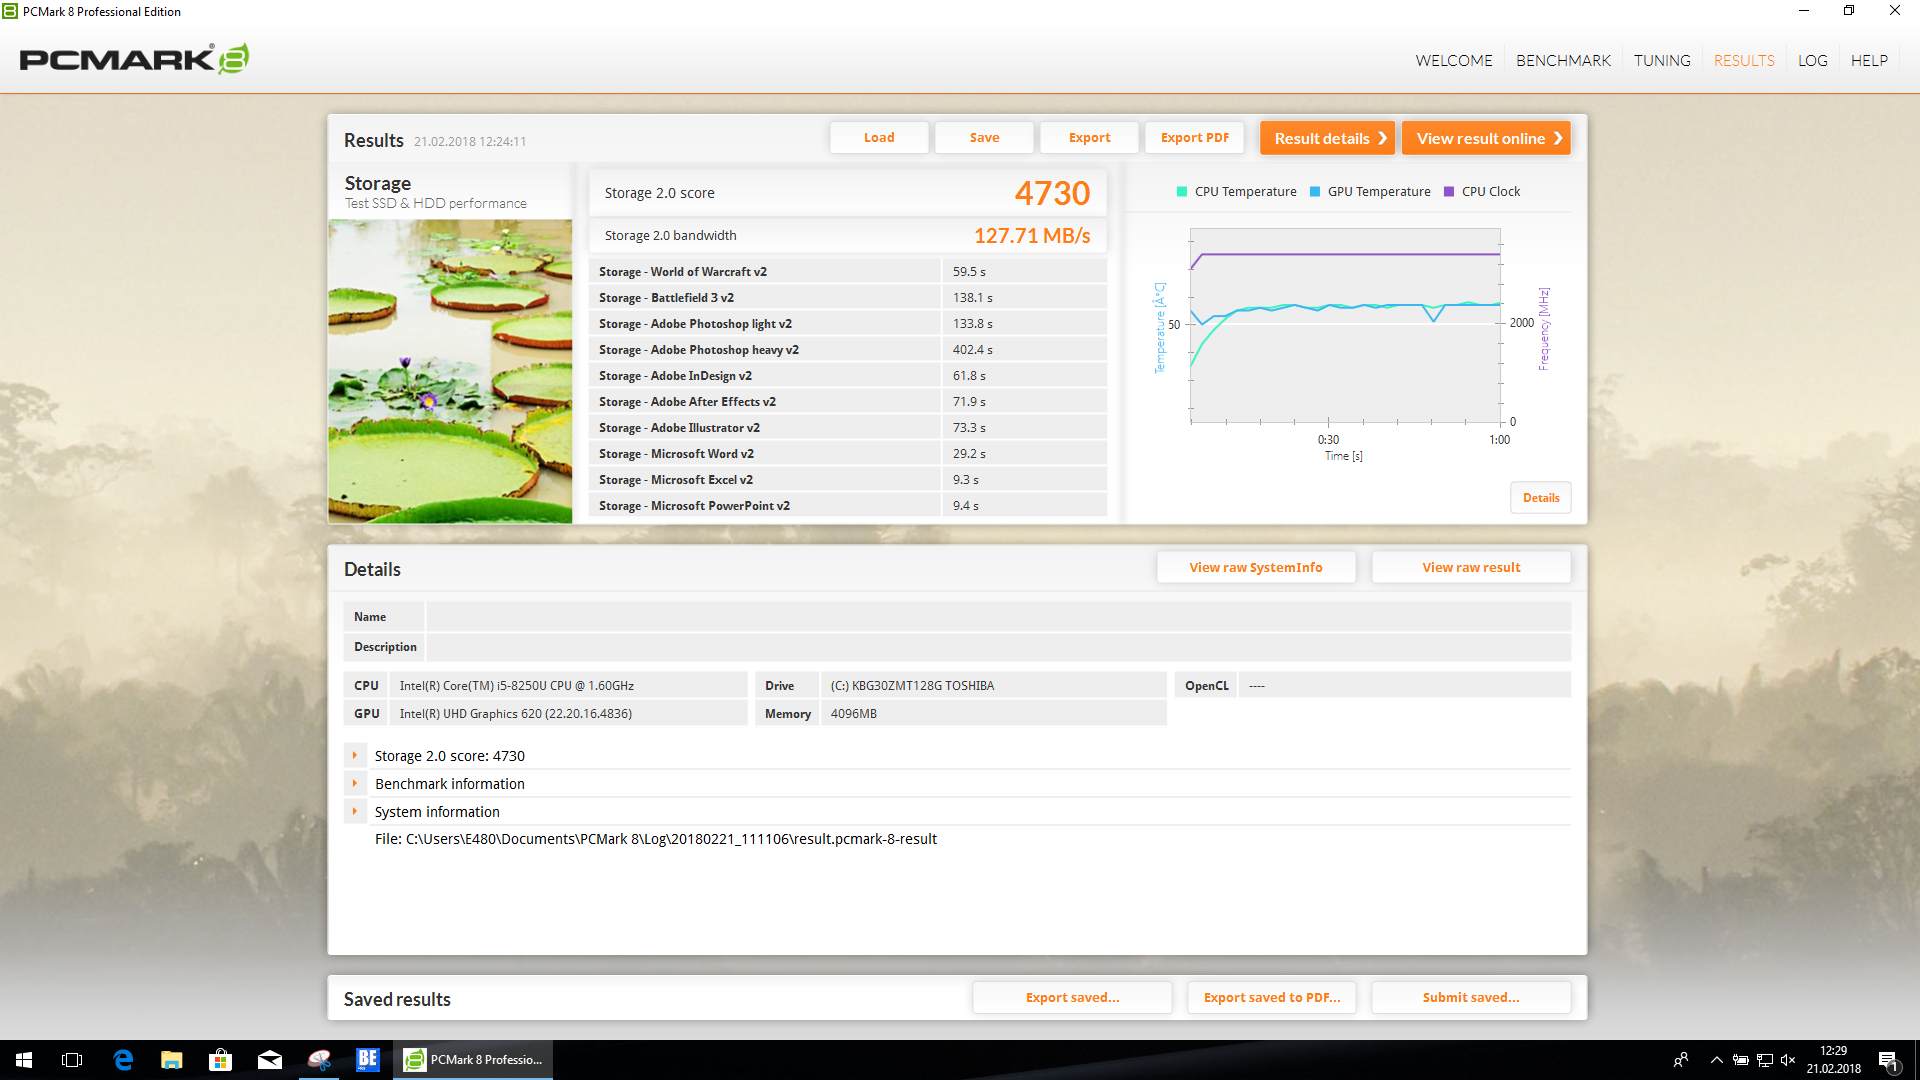
| Write Seq (MB/s) | 128.4 | 160.6 25% | 602 369% | 438.1 241% | 581 352% | 1995 1454% |
| Read 512 (MB/s) | 715 | 872 22% | 923 29% | 304.6 -57% | 869 22% | 815 14% |
| Write 512 (MB/s) | 127 | 122 -4% | 600 372% | 343.7 171% | 584 360% | 1480 1065% |
| Read 4k (MB/s) | 33.35 | 25.72 -23% | 35.48 6% | 34.15 2% | 35.89 8% | 57.7 73% |
| Write 4k (MB/s) | 82.3 | 95.2 16% | 139.8 70% | 75.1 -9% | 122.4 49% | 196.7 139% |
| Read 4k QD32 (MB/s) | 197.5 | 389.9 97% | 287.8 46% | 284.2 44% | 462.9 134% | 565 186% |
| Write 4k QD32 (MB/s) | 100.2 | 118.3 18% | 417.1 316% | 208.8 108% | 370.9 270% | 475.1 374% |

| 3DMark 11 - 1280x720 Performance GPU | |
| Genomsnitt av klass Office (2551 - 18313, n=69, senaste 2 åren) | |
| Lenovo ThinkPad E480-20KQS00000 | |
| Lenovo ThinkPad E480-20KQS00000 | |
| Genomsnitt Intel UHD Graphics 620 (1144 - 3432, n=244) | |
| Asus VivoBook S14 S406UA-BV023T | |
| Schenker Slim 14 L17 | |
| HP ProBook 440 G5-3KX87ES | |
| Lenovo ThinkPad E480-20KNCTO1WW | |
| Lenovo ThinkPad E470 | |
| Acer TravelMate P449-G2-M-56CD | |
| 3DMark | |
| 1280x720 Cloud Gate Standard Graphics | |
| Genomsnitt av klass Office (11640 - 118515, n=37, senaste 2 åren) | |
| Lenovo ThinkPad E480-20KQS00000 | |
| Asus VivoBook S14 S406UA-BV023T | |
| Genomsnitt Intel UHD Graphics 620 (6205 - 16400, n=225) | |
| HP ProBook 440 G5-3KX87ES | |
| Lenovo ThinkPad E480-20KNCTO1WW | |
| Lenovo ThinkPad E470 | |
| Acer TravelMate P449-G2-M-56CD | |
| 1920x1080 Fire Strike Graphics | |
| Genomsnitt av klass Office (736 - 21871, n=73, senaste 2 åren) | |
| Lenovo ThinkPad E480-20KQS00000 | |
| Asus VivoBook S14 S406UA-BV023T | |
| Genomsnitt Intel UHD Graphics 620 (557 - 2608, n=213) | |
| HP ProBook 440 G5-3KX87ES | |
| Lenovo ThinkPad E480-20KNCTO1WW | |
| Lenovo ThinkPad E470 | |
| Acer TravelMate P449-G2-M-56CD | |
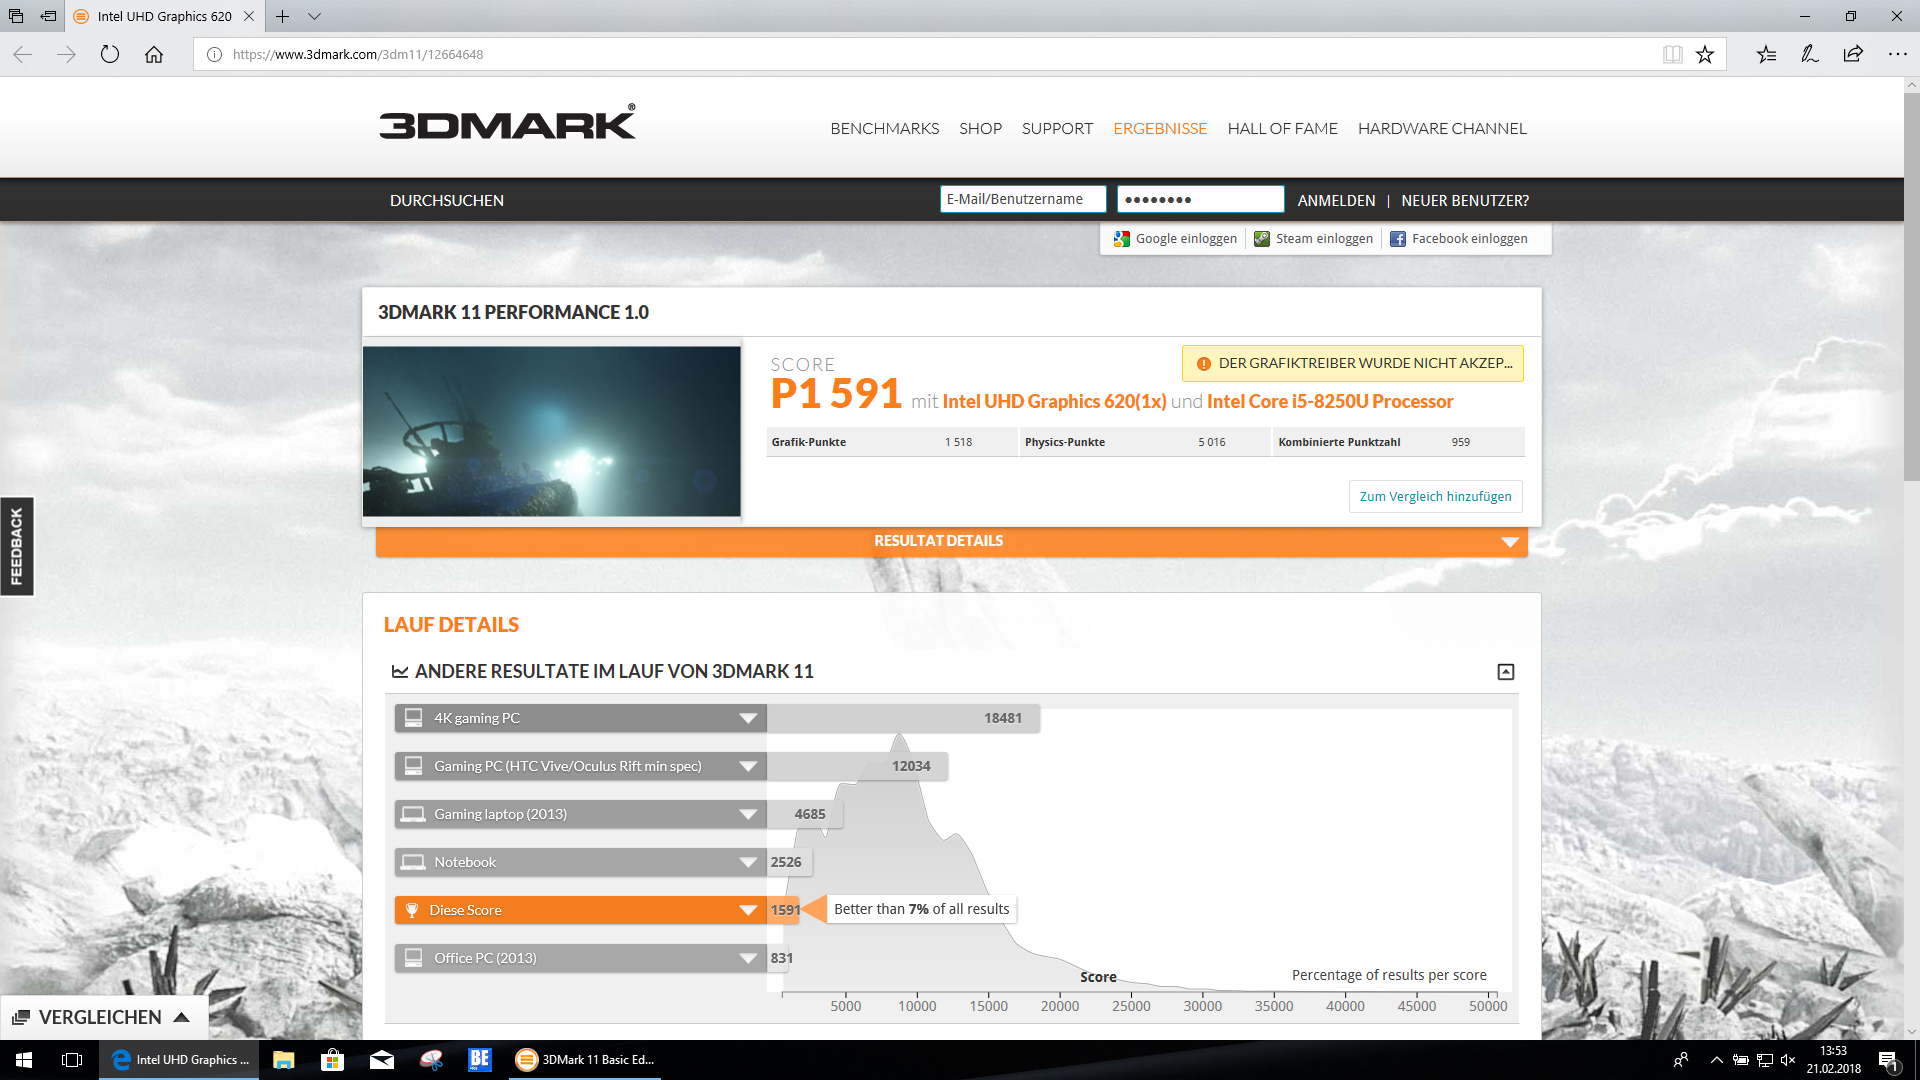
| 3DMark 11 Performance | 1591 poäng | |
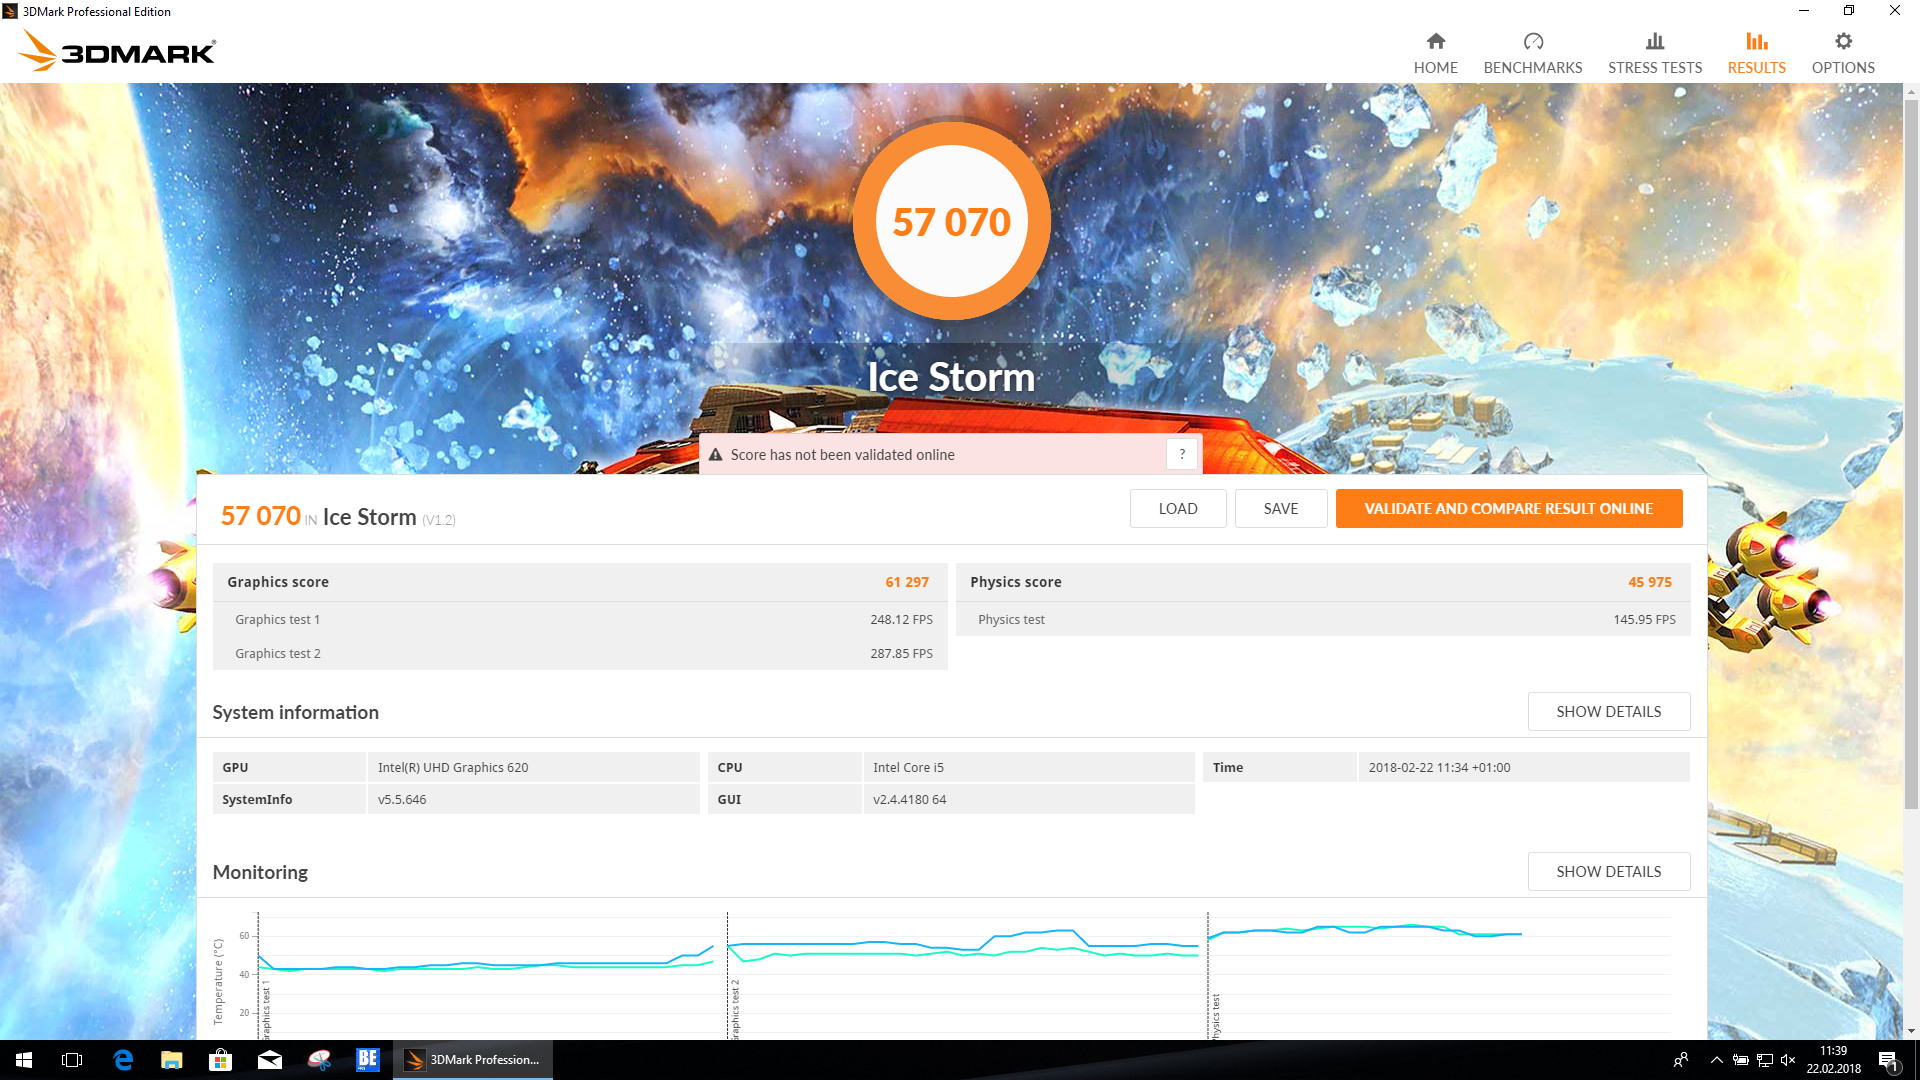
| 3DMark Ice Storm Standard Score | 57070 poäng | |
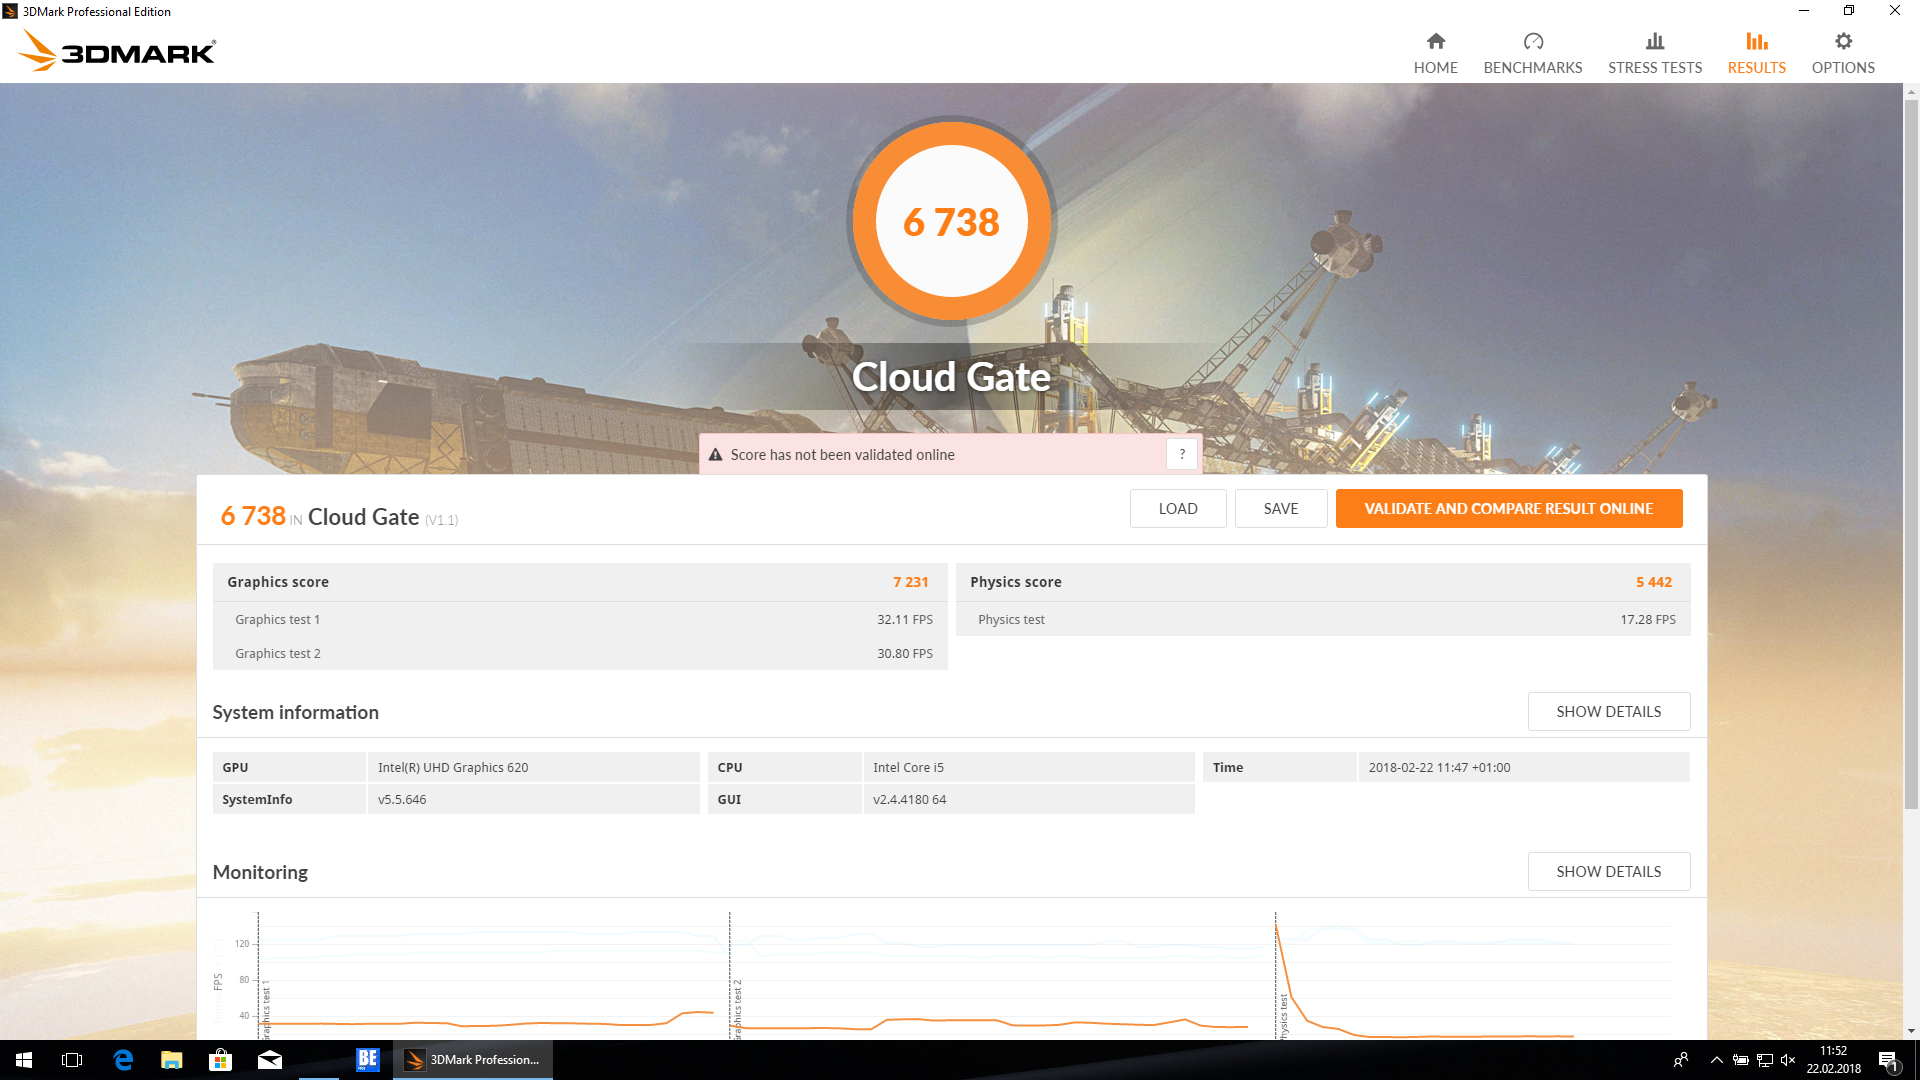
| 3DMark Cloud Gate Standard Score | 6738 poäng | |
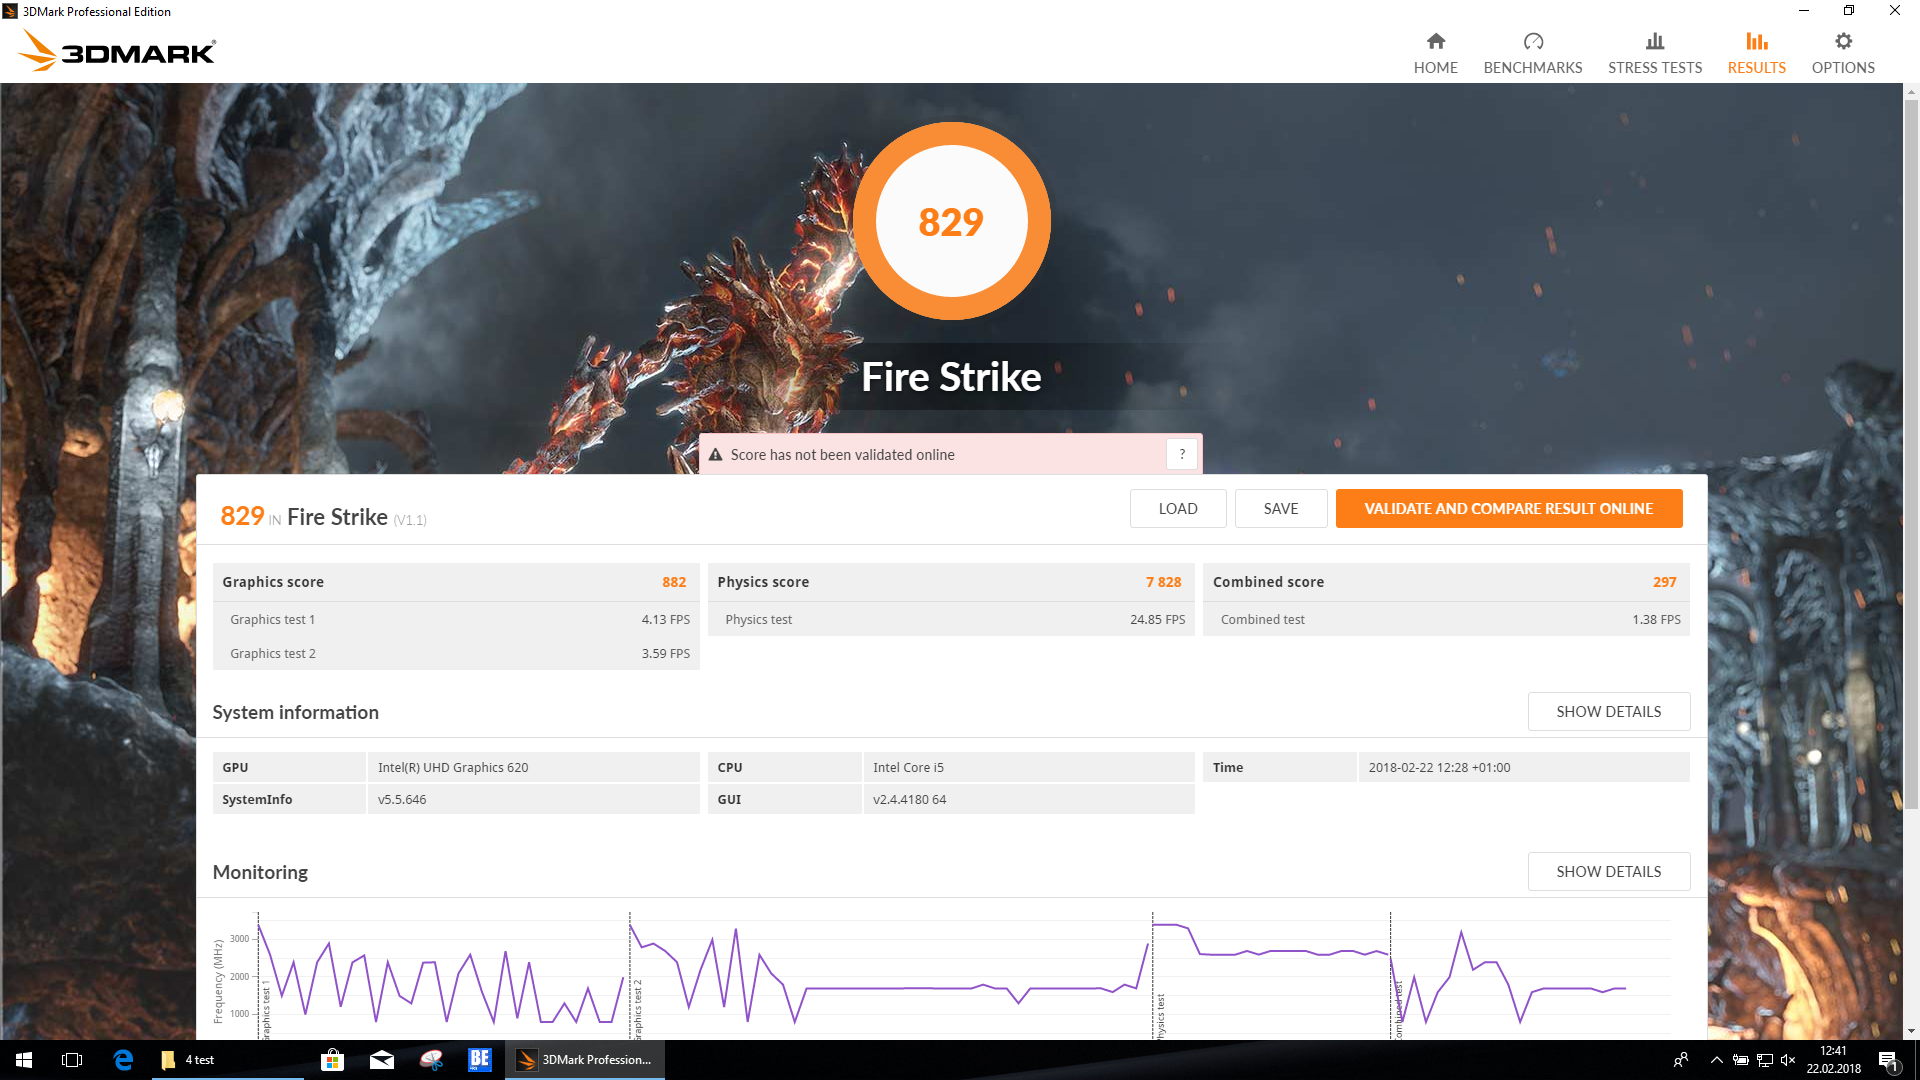
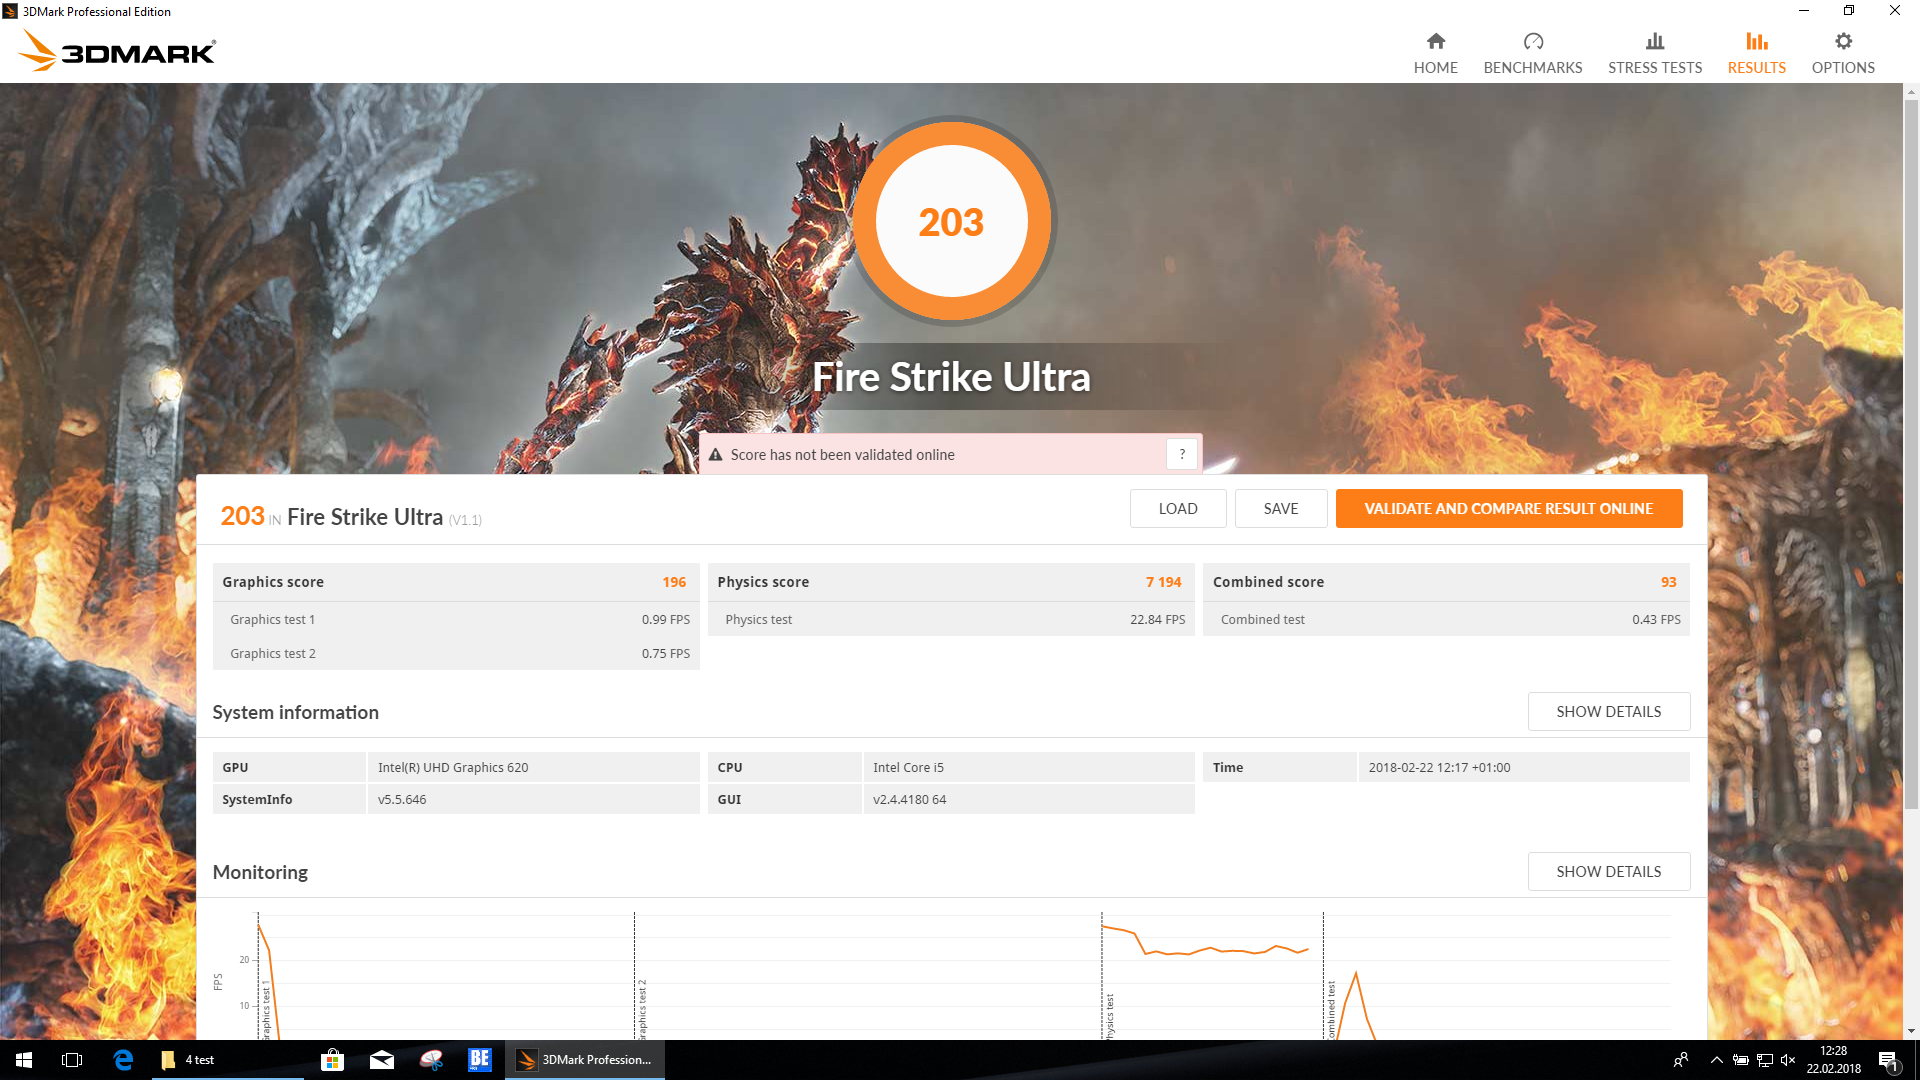
| 3DMark Fire Strike Score | 829 poäng | |
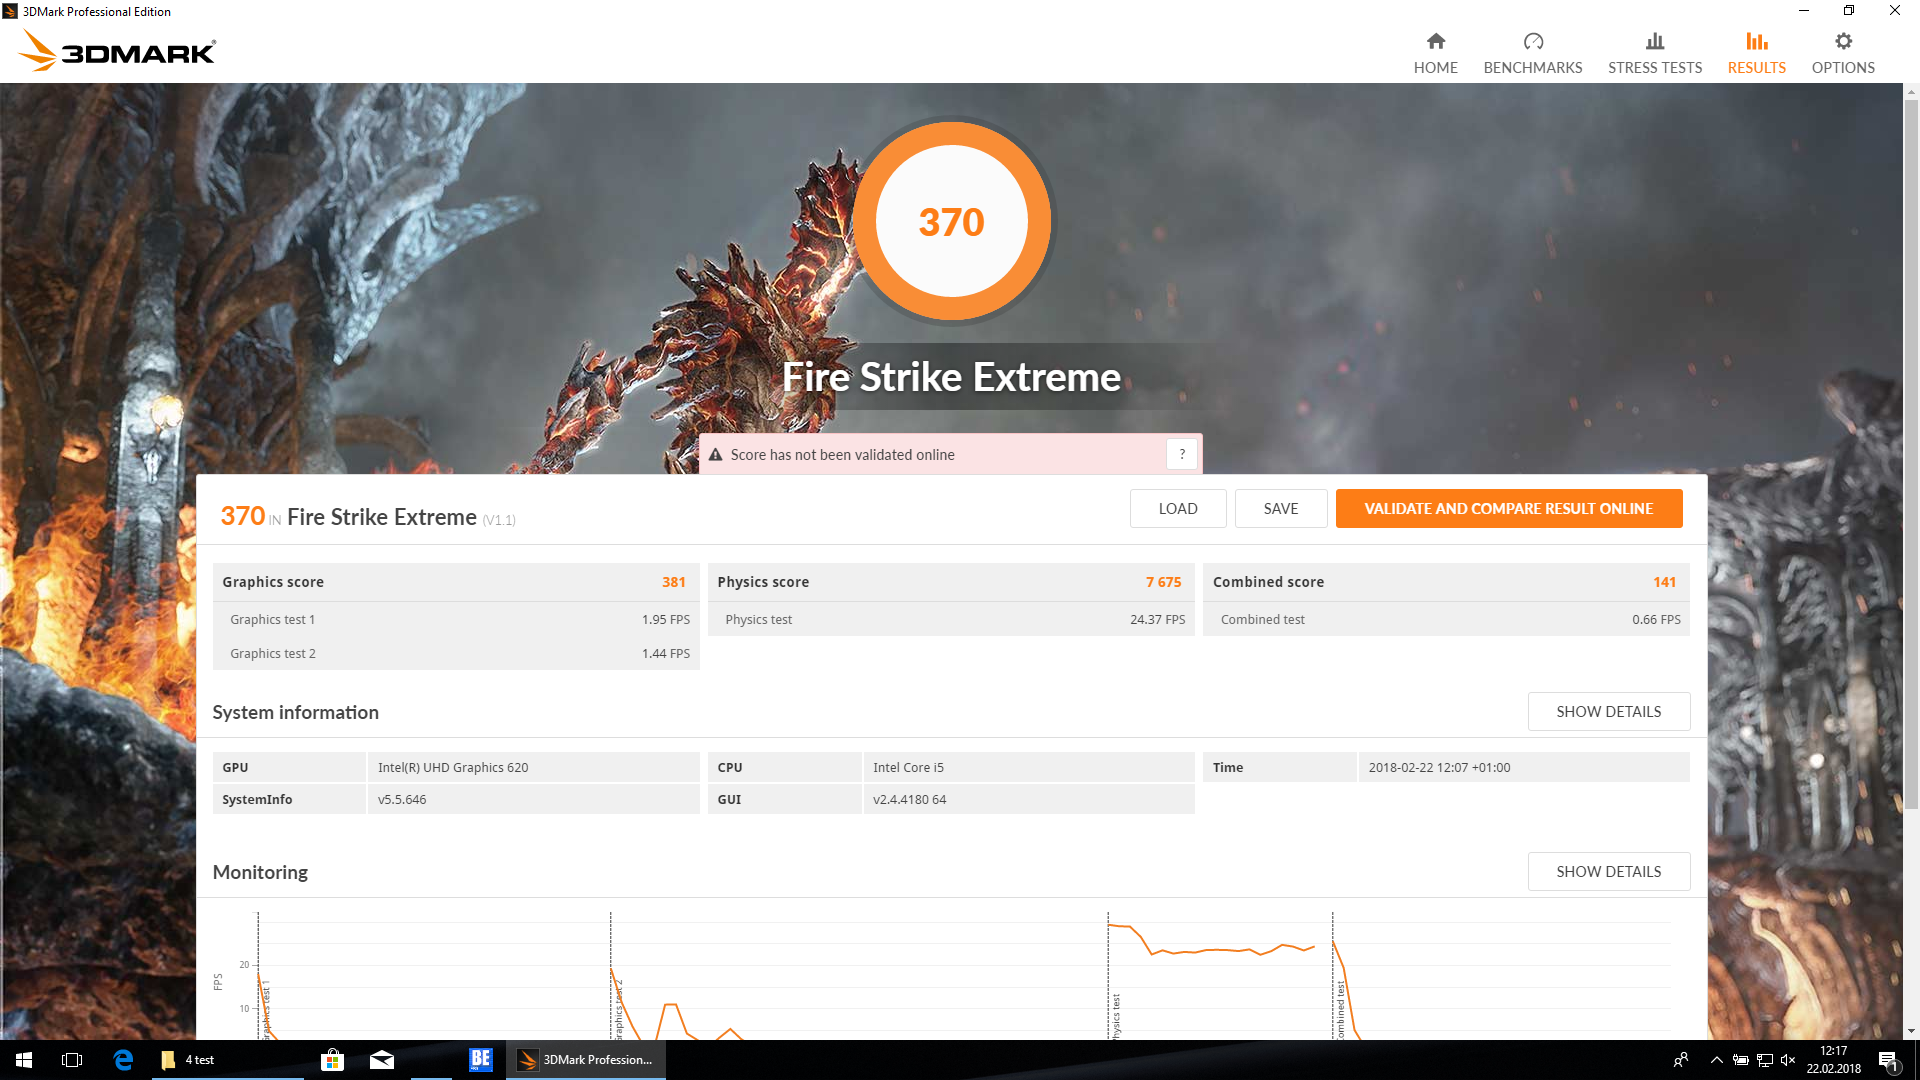
| 3DMark Fire Strike Extreme Score | 370 poäng | |
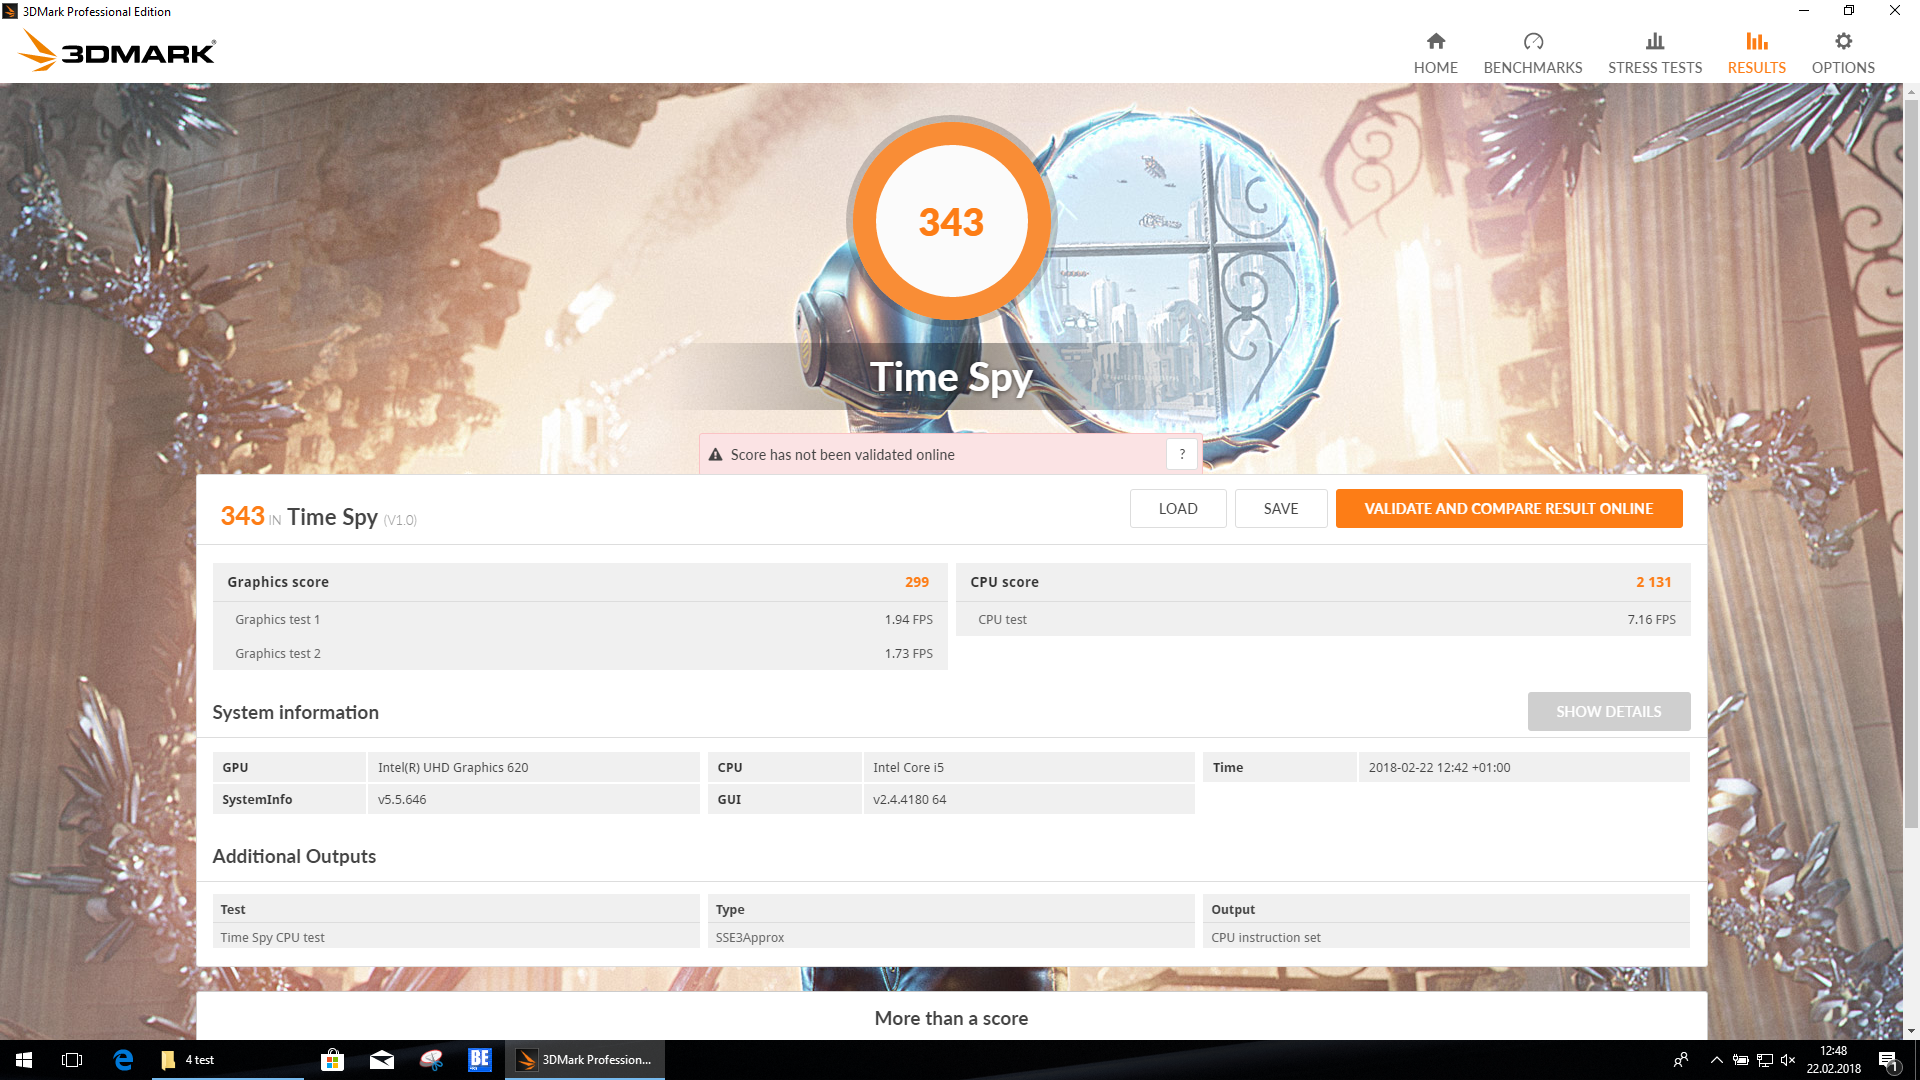
| 3DMark Time Spy Score | 343 poäng | |
Hjälp | ||
| låg | med. | hög | ultra | |
|---|---|---|---|---|
| BioShock Infinite (2013) | 37.8 | 24.4 | 19.9 | 6.8 |
| The Witcher 3 (2015) | 14.8 | 9.4 | 5.2 | |
| Rise of the Tomb Raider (2016) | 16.9 | 10.4 | 5.9 |
Ljudnivå
| Låg belastning |
| 29.1 / 29.1 / 30.3 dB(A) |
| Hög belastning |
| 31.8 / 33.8 dB(A) |
 | ||
30 dB tyst 40 dB(A) hörbar 50 dB(A) högt ljud |
||
min: | ||
| Lenovo ThinkPad E480-20KNCTO1WW | Lenovo ThinkPad E480-20KQS00000 | HP ProBook 440 G5-3KX87ES | Lenovo ThinkPad E470 | Acer TravelMate P449-G2-M-56CD | Schenker Slim 14 L17 | Asus VivoBook S14 S406UA-BV023T | |
|---|---|---|---|---|---|---|---|
| Noise | -11% | -3% | -3% | -6% | 2% | -10% | |
| av / miljö * (dB) | 29.1 | 29.8 -2% | 29.1 -0% | 30.5 -5% | 29.9 -3% | 28.7 1% | 30.2 -4% |
| Idle Minimum * (dB) | 29.1 | 29.8 -2% | 29.1 -0% | 30.5 -5% | 30.2 -4% | 28.7 1% | 30.2 -4% |
| Idle Average * (dB) | 29.1 | 31.5 -8% | 29.1 -0% | 30.5 -5% | 30.2 -4% | 29.5 -1% | 30.2 -4% |
| Idle Maximum * (dB) | 30.3 | 33.3 -10% | 30.7 -1% | 30.5 -1% | 30.2 -0% | 29.5 3% | 31.3 -3% |
| Load Average * (dB) | 31.8 | 39.1 -23% | 34.5 -8% | 32.9 -3% | 36.7 -15% | 30.5 4% | 40.1 -26% |
| Load Maximum * (dB) | 33.8 | 40.4 -20% | 36 -7% | 32.9 3% | 36.4 -8% | 33.4 1% | 40.4 -20% |
| Witcher 3 ultra * (dB) | 39.1 |
* ... mindre är bättre
(+) Den maximala temperaturen på ovansidan är 36.7 °C / 98 F, jämfört med genomsnittet av 34.3 °C / 94 F , allt från 21.2 till 62.5 °C för klassen Office.
(±) Botten värms upp till maximalt 42.8 °C / 109 F, jämfört med genomsnittet av 36.8 °C / 98 F
(+) Vid tomgångsbruk är medeltemperaturen för ovansidan 22.7 °C / 73 F, jämfört med enhetsgenomsnittet på 29.5 °C / ### class_avg_f### F.
(+) Handledsstöden och pekplattan är kallare än hudtemperaturen med maximalt 25.8 °C / 78.4 F och är därför svala att ta på.
(±) Medeltemperaturen för handledsstödsområdet på liknande enheter var 27.5 °C / 81.5 F (+1.7 °C / 3.1 F).
| Lenovo ThinkPad E480-20KNCTO1WW | Lenovo ThinkPad E480-20KQS00000 | HP ProBook 440 G5-3KX87ES | Lenovo ThinkPad E470 | Acer TravelMate P449-G2-M-56CD | Schenker Slim 14 L17 | Asus VivoBook S14 S406UA-BV023T | |
|---|---|---|---|---|---|---|---|
| Heat | -37% | -7% | 0% | -5% | -12% | -13% | |
| Maximum Upper Side * (°C) | 36.7 | 51.9 -41% | 39 -6% | 35.6 3% | 36.8 -0% | 41.9 -14% | 42.2 -15% |
| Maximum Bottom * (°C) | 42.8 | 71.6 -67% | 45.5 -6% | 37.2 13% | 31.3 27% | 43.7 -2% | 39.4 8% |
| Idle Upper Side * (°C) | 23.4 | 24.8 -6% | 24.8 -6% | 24.4 -4% | 26.7 -14% | 24.8 -6% | 28.1 -20% |
| Idle Bottom * (°C) | 22.8 | 30 -32% | 25 -10% | 25.6 -12% | 30 -32% | 28.4 -25% | 28.1 -23% |
* ... mindre är bättre
| Av/Standby | |
| Låg belastning | |
| Hög belastning |
|
Förklaring:
min: | |
| Lenovo ThinkPad E480-20KNCTO1WW i5-8250U, UHD Graphics 620, IPS LED, 1920x1080, 14" | Lenovo ThinkPad E480-20KQS00000 i5-8250U, Radeon RX 550 (Laptop), IPS LED, 1920x1080, 14" | HP ProBook 440 G5-3KX87ES i5-8250U, UHD Graphics 620, IPS LED, 1920x1080, 14" | Lenovo ThinkPad E470 i5-7200U, HD Graphics 620, TN LED, 1366x768, 14" | Acer TravelMate P449-G2-M-56CD i5-7200U, HD Graphics 620, IPS, 1920x1080, 14" | Schenker Slim 14 L17 i5-8250U, UHD Graphics 620, IPS, 1920x1080, 14" | Asus VivoBook S14 S406UA-BV023T i5-8250U, UHD Graphics 620, TN LED, 1366x768, 14" | |
|---|---|---|---|---|---|---|---|
| Power Consumption | -38% | -33% | -25% | -20% | -42% | -8% | |
| Idle Minimum * (Watt) | 3.5 | 4.1 -17% | 4.4 -26% | 5.2 -49% | 4.5 -29% | 6 -71% | 3.7 -6% |
| Idle Average * (Watt) | 5.3 | 6.3 -19% | 7.1 -34% | 7.6 -43% | 7.1 -34% | 8.46 -60% | 5.6 -6% |
| Idle Maximum * (Watt) | 6.1 | 7.1 -16% | 10.2 -67% | 9.9 -62% | 10.2 -67% | 9.48 -55% | 7.6 -25% |
| Load Average * (Watt) | 30 | 54.8 -83% | 36.5 -22% | 31 -3% | 29.8 1% | 37.4 -25% | 37.4 -25% |
| Load Maximum * (Watt) | 42.3 | 66.4 -57% | 48.7 -15% | 29.7 30% | 31 27% | 41.1 3% | 33 22% |
| Witcher 3 ultra * (Watt) | 43.8 |
* ... mindre är bättre

| Lenovo ThinkPad E480-20KNCTO1WW i5-8250U, UHD Graphics 620, 45 Wh | Lenovo ThinkPad E480-20KQS00000 i5-8250U, Radeon RX 550 (Laptop), 48 Wh | HP ProBook 440 G5-3KX87ES i5-8250U, UHD Graphics 620, 48 Wh | Lenovo ThinkPad E470 i5-7200U, HD Graphics 620, 45 Wh | Acer TravelMate P449-G2-M-56CD i5-7200U, HD Graphics 620, 48 Wh | Schenker Slim 14 L17 i5-8250U, UHD Graphics 620, 44 Wh | Asus VivoBook S14 S406UA-BV023T i5-8250U, UHD Graphics 620, 39 Wh | Genomsnitt av klass Office | |
|---|---|---|---|---|---|---|---|---|
| Batteridrifttid | -5% | -5% | 7% | -8% | -39% | -5% | 48% | |
| Reader / Idle (h) | 18.4 | 19.4 5% | 13.7 -26% | 18.5 1% | 16.3 -11% | 23.7 ? 29% | ||
| H.264 (h) | 7.2 | 8.9 24% | 3.7 -49% | 9.1 26% | 8.4 17% | 15 ? 108% | ||
| WiFi v1.3 (h) | 8.3 | 5.7 -31% | 6.9 -17% | 8 -4% | 5.7 -31% | 5.1 -39% | 7.9 -5% | 12.9 ? 55% |
| Load (h) | 1.8 | 1.5 -17% | 3.1 72% | 1.9 6% | 1.7 -6% | 1.794 ? 0% |
För
Emot
Läs den fullständiga versionen av den här recensionen på engelska här.
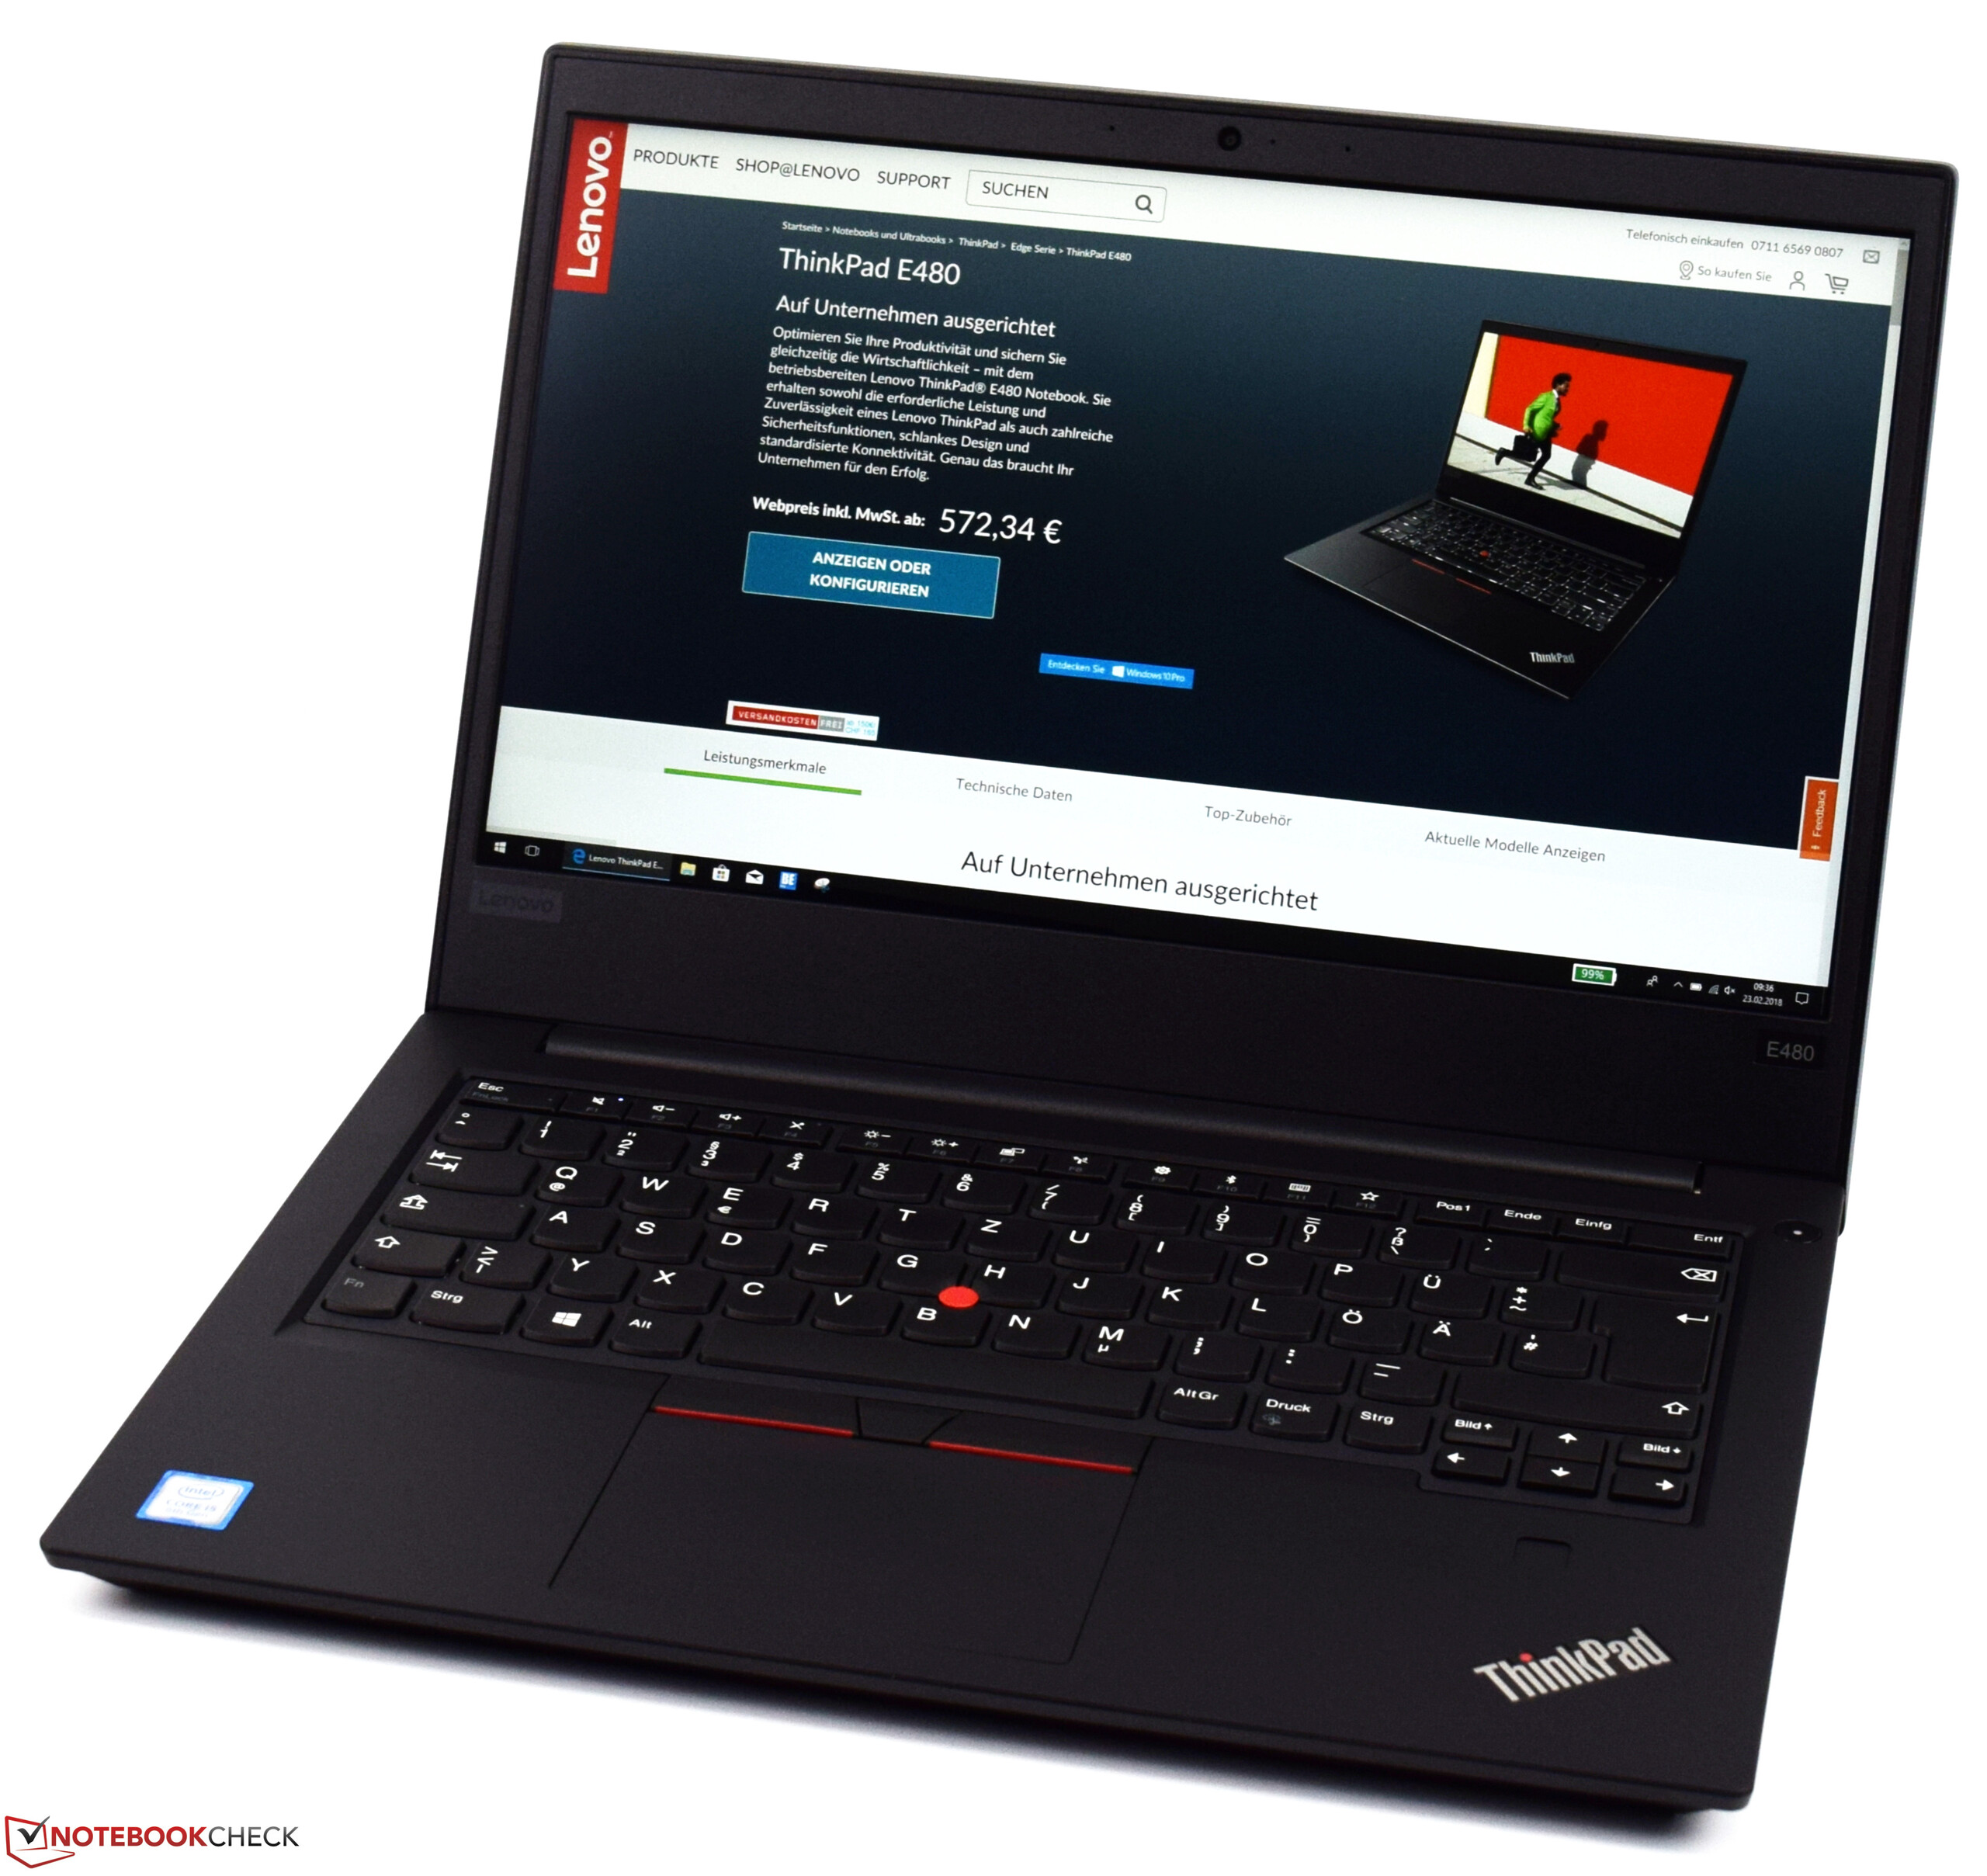
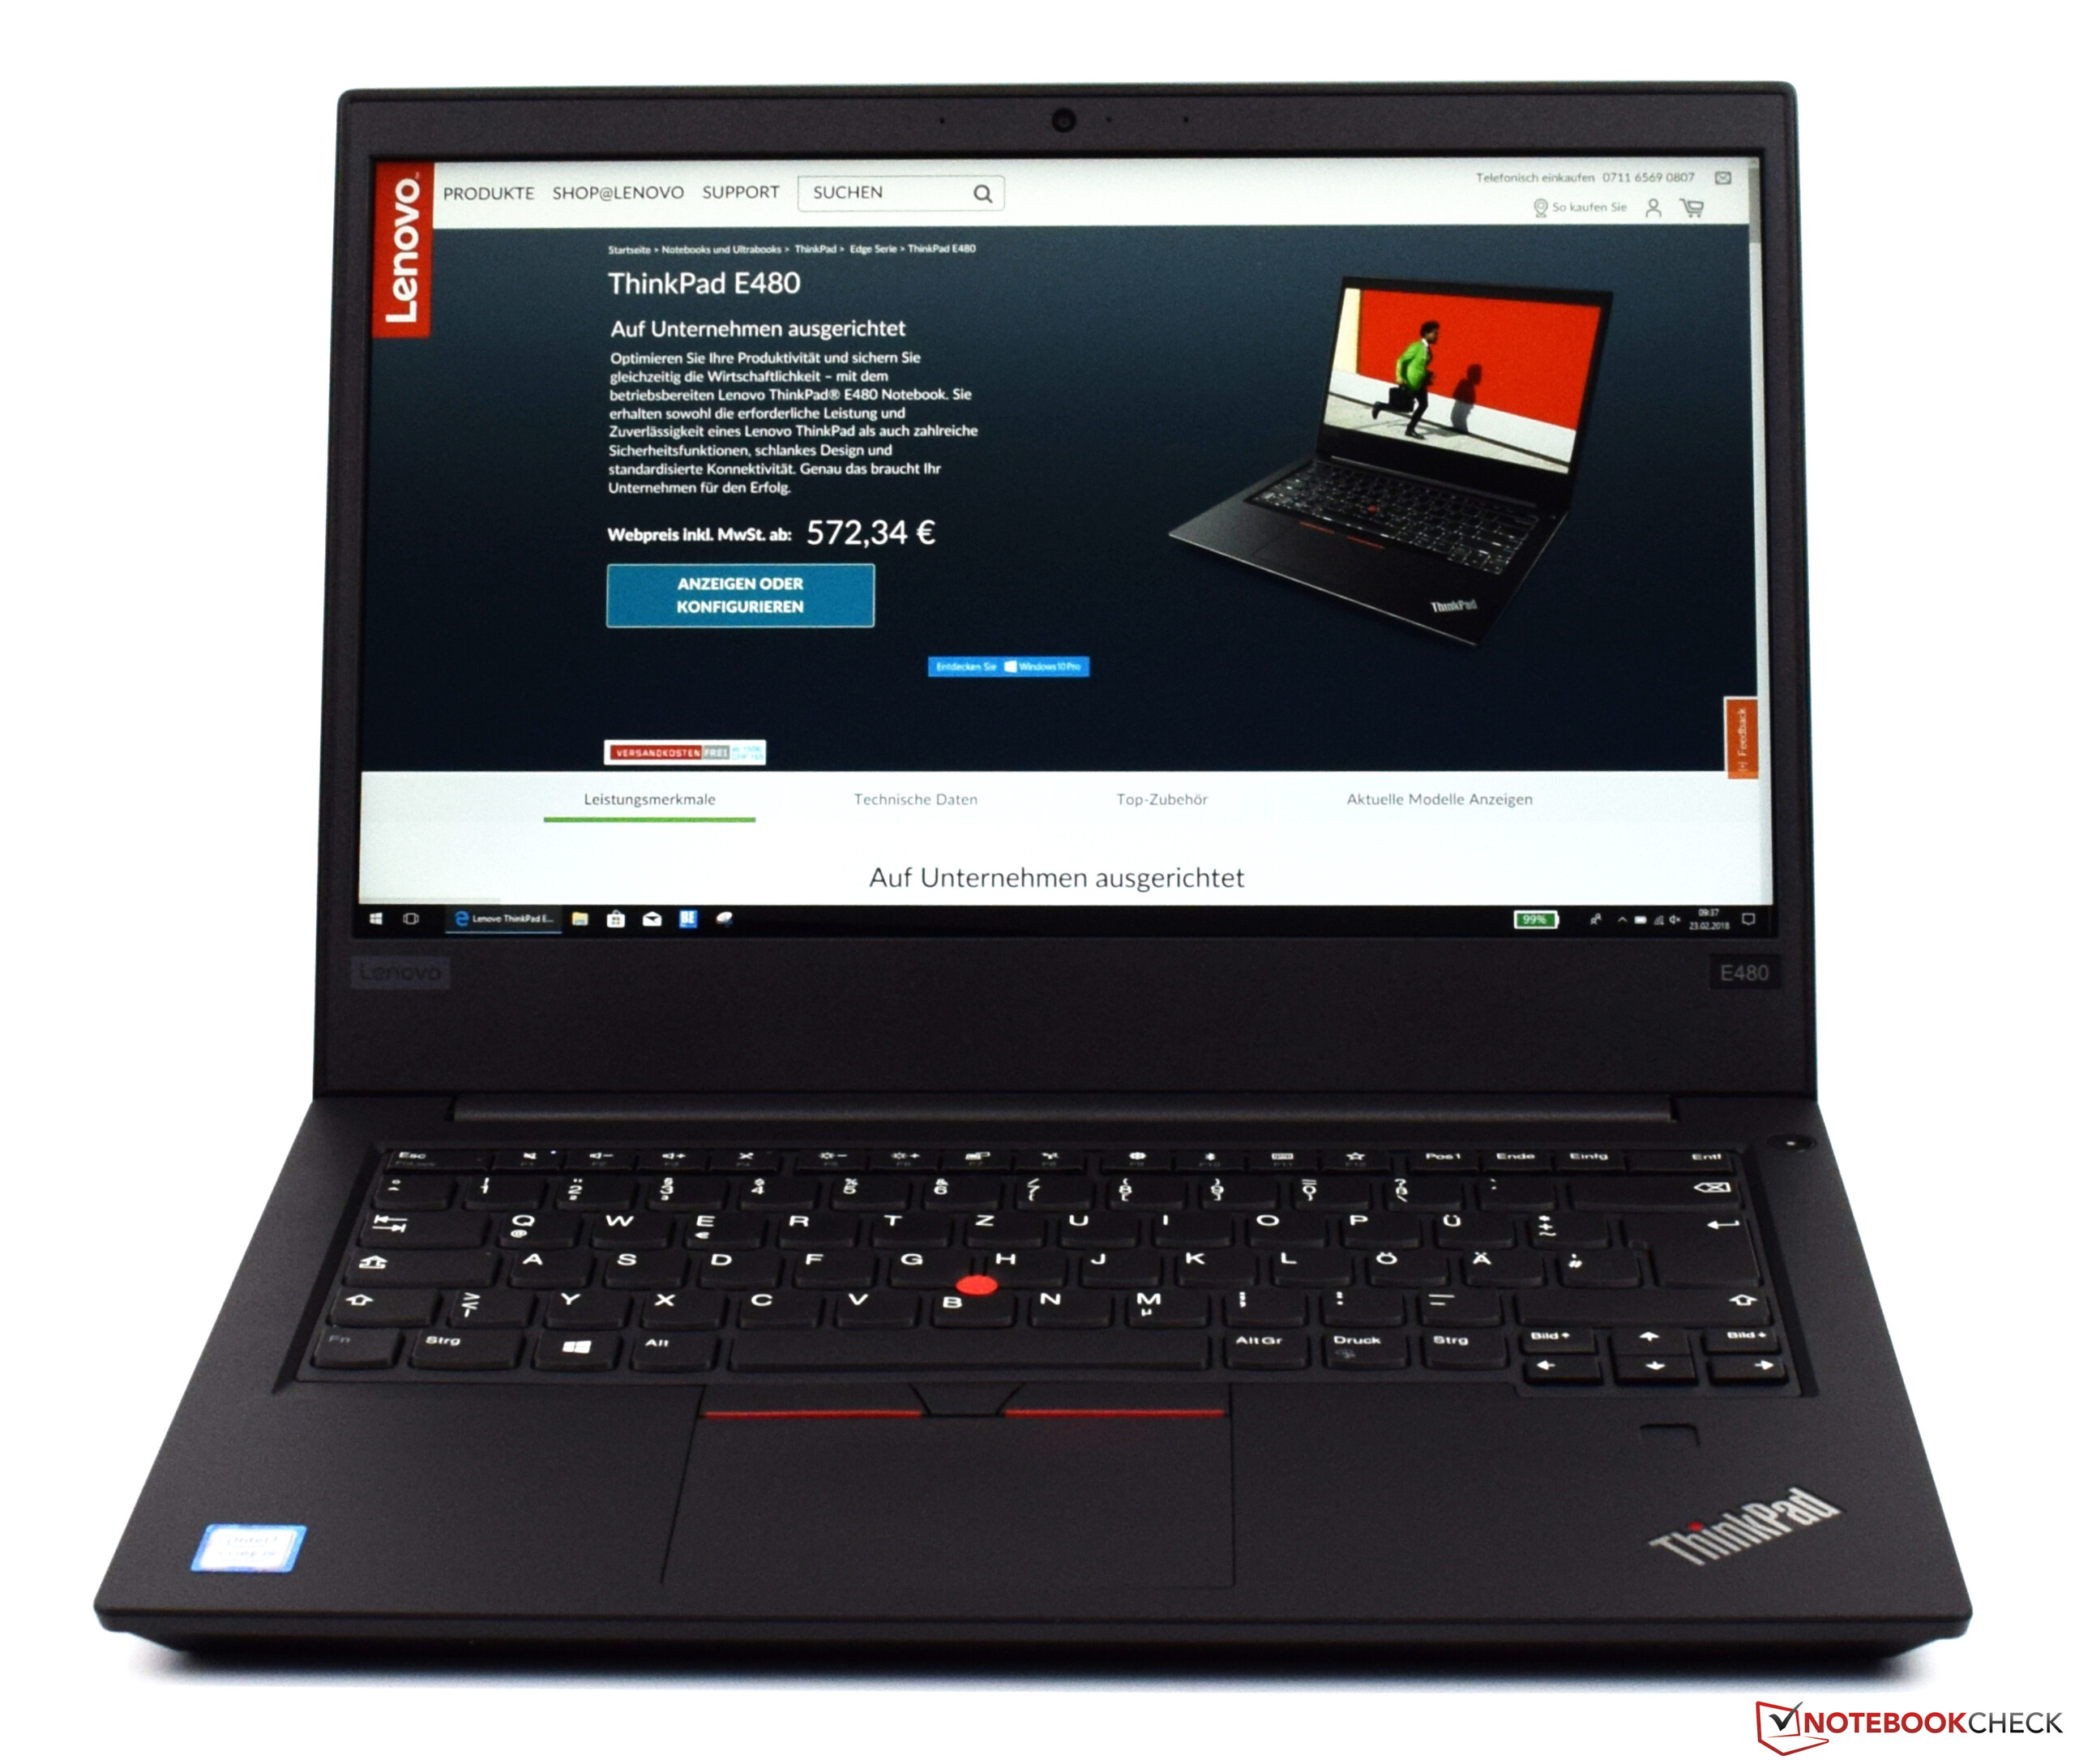
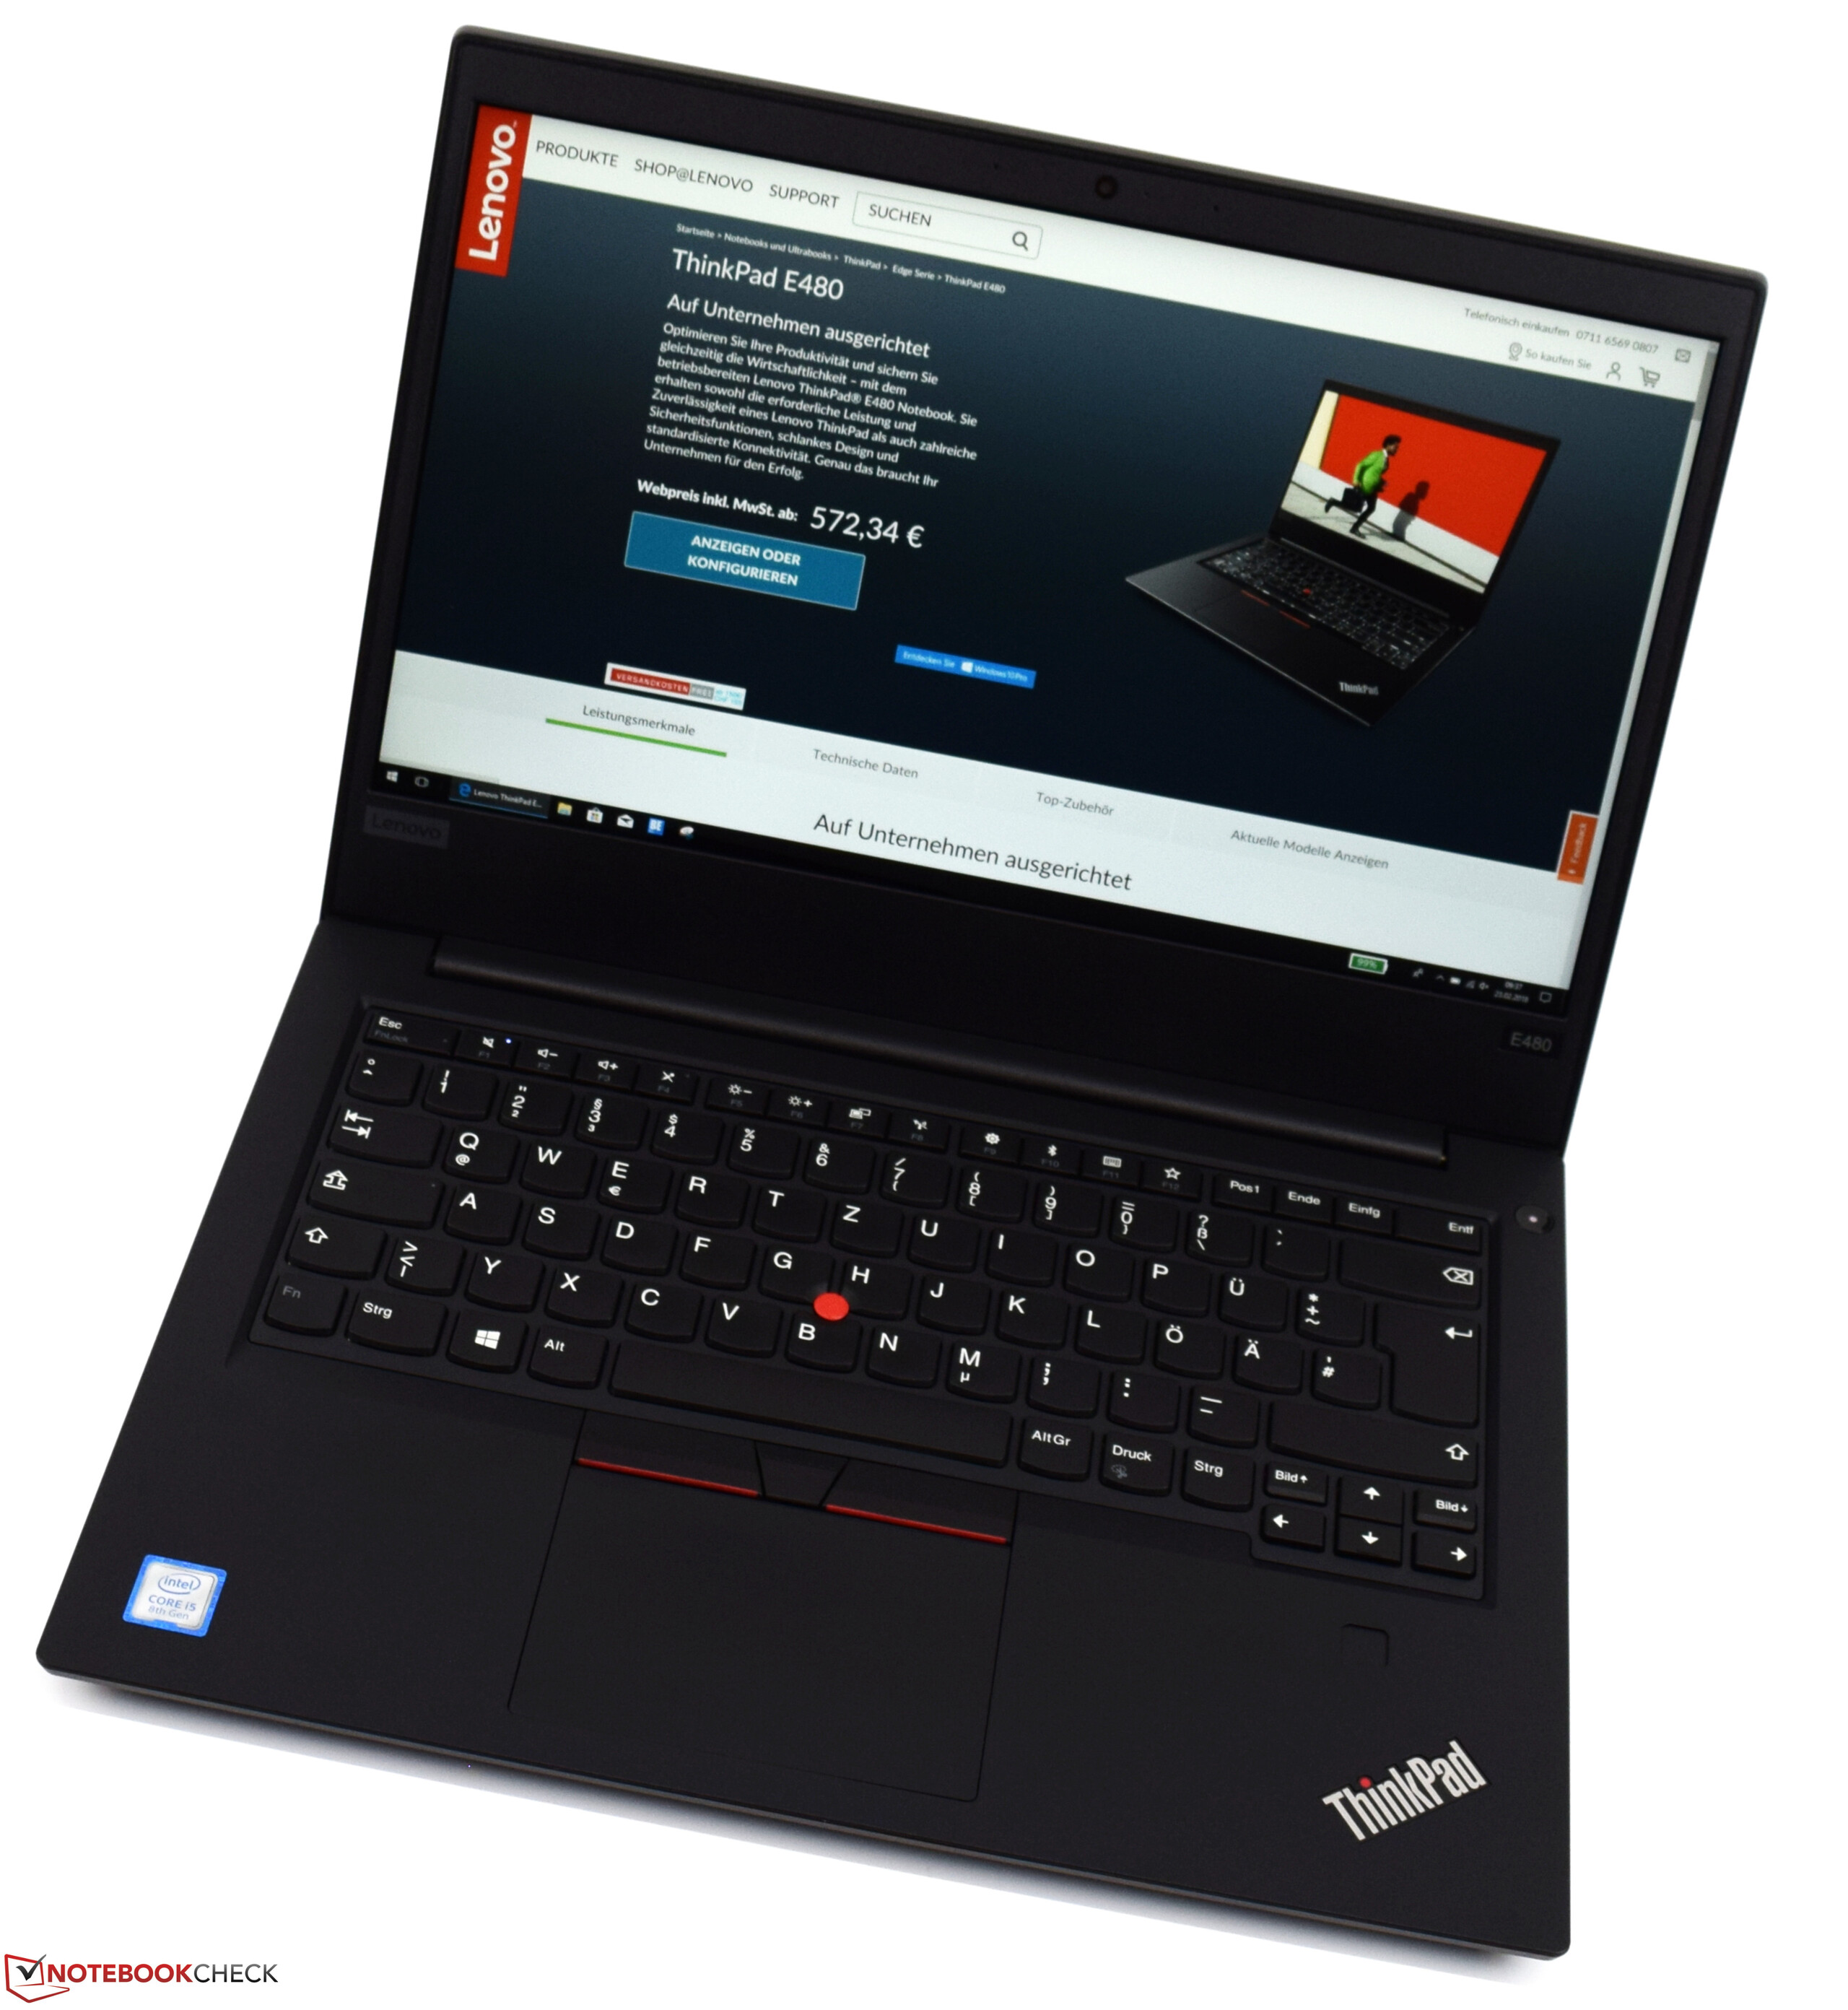
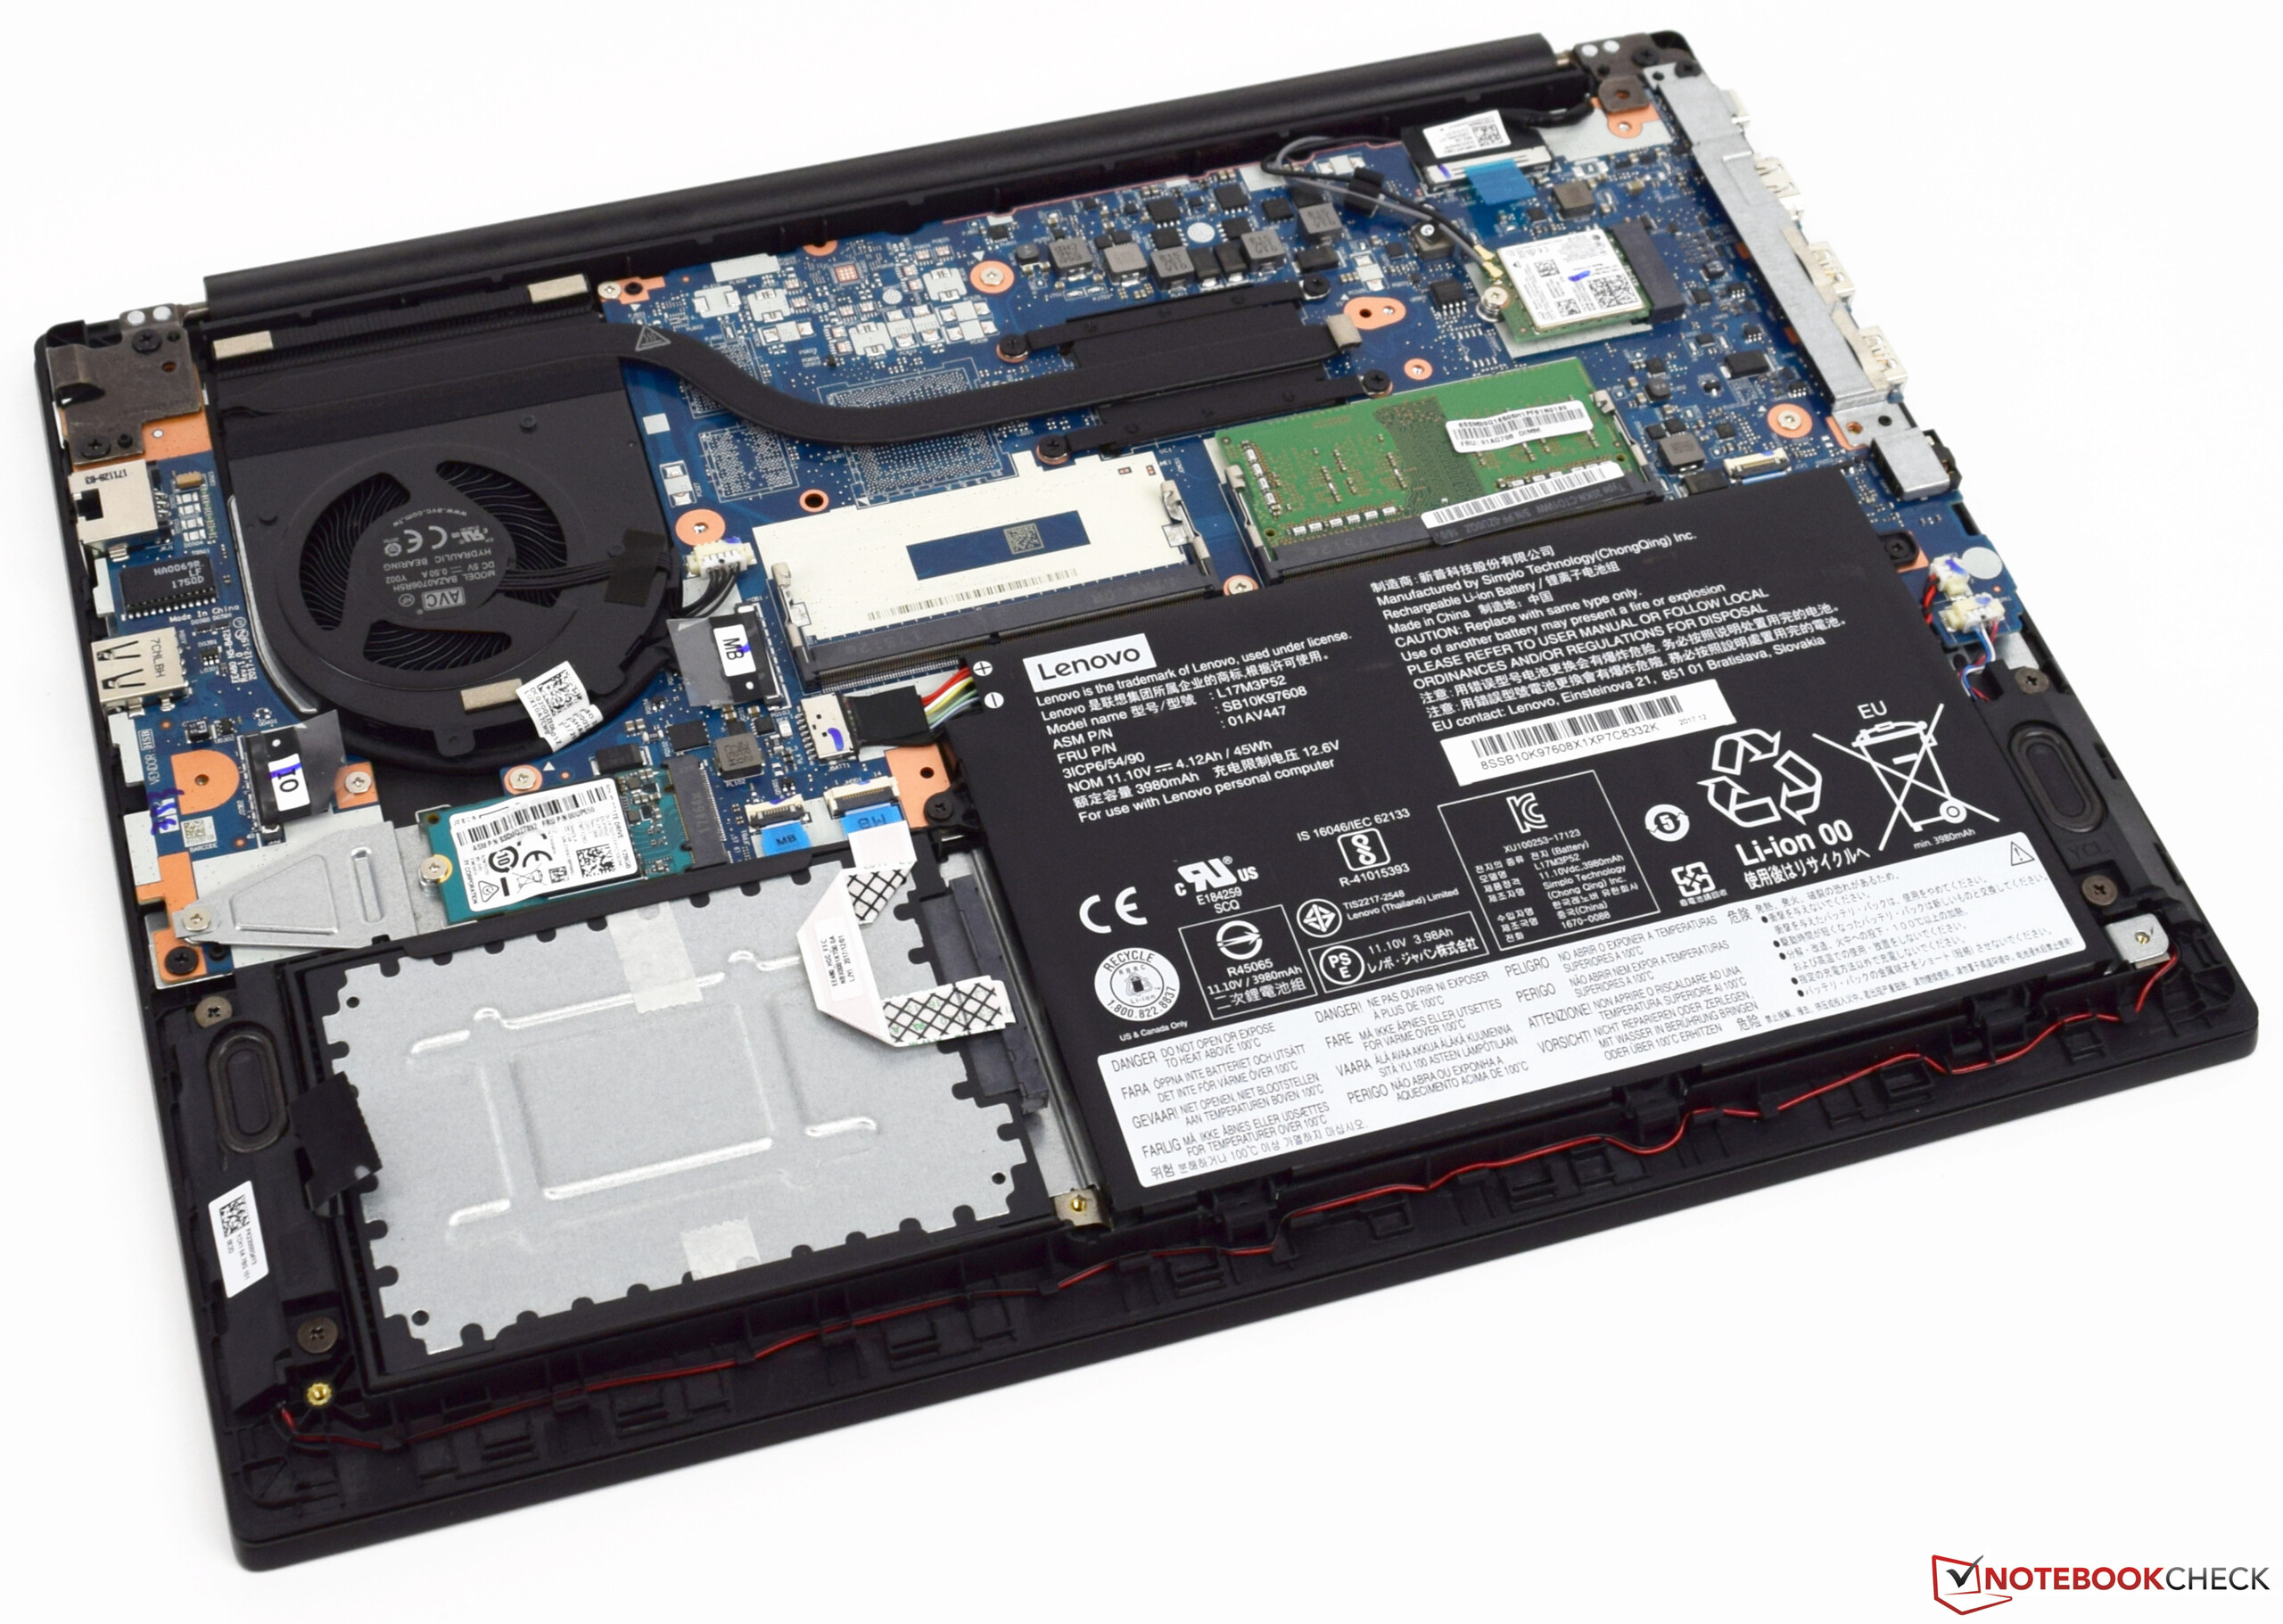
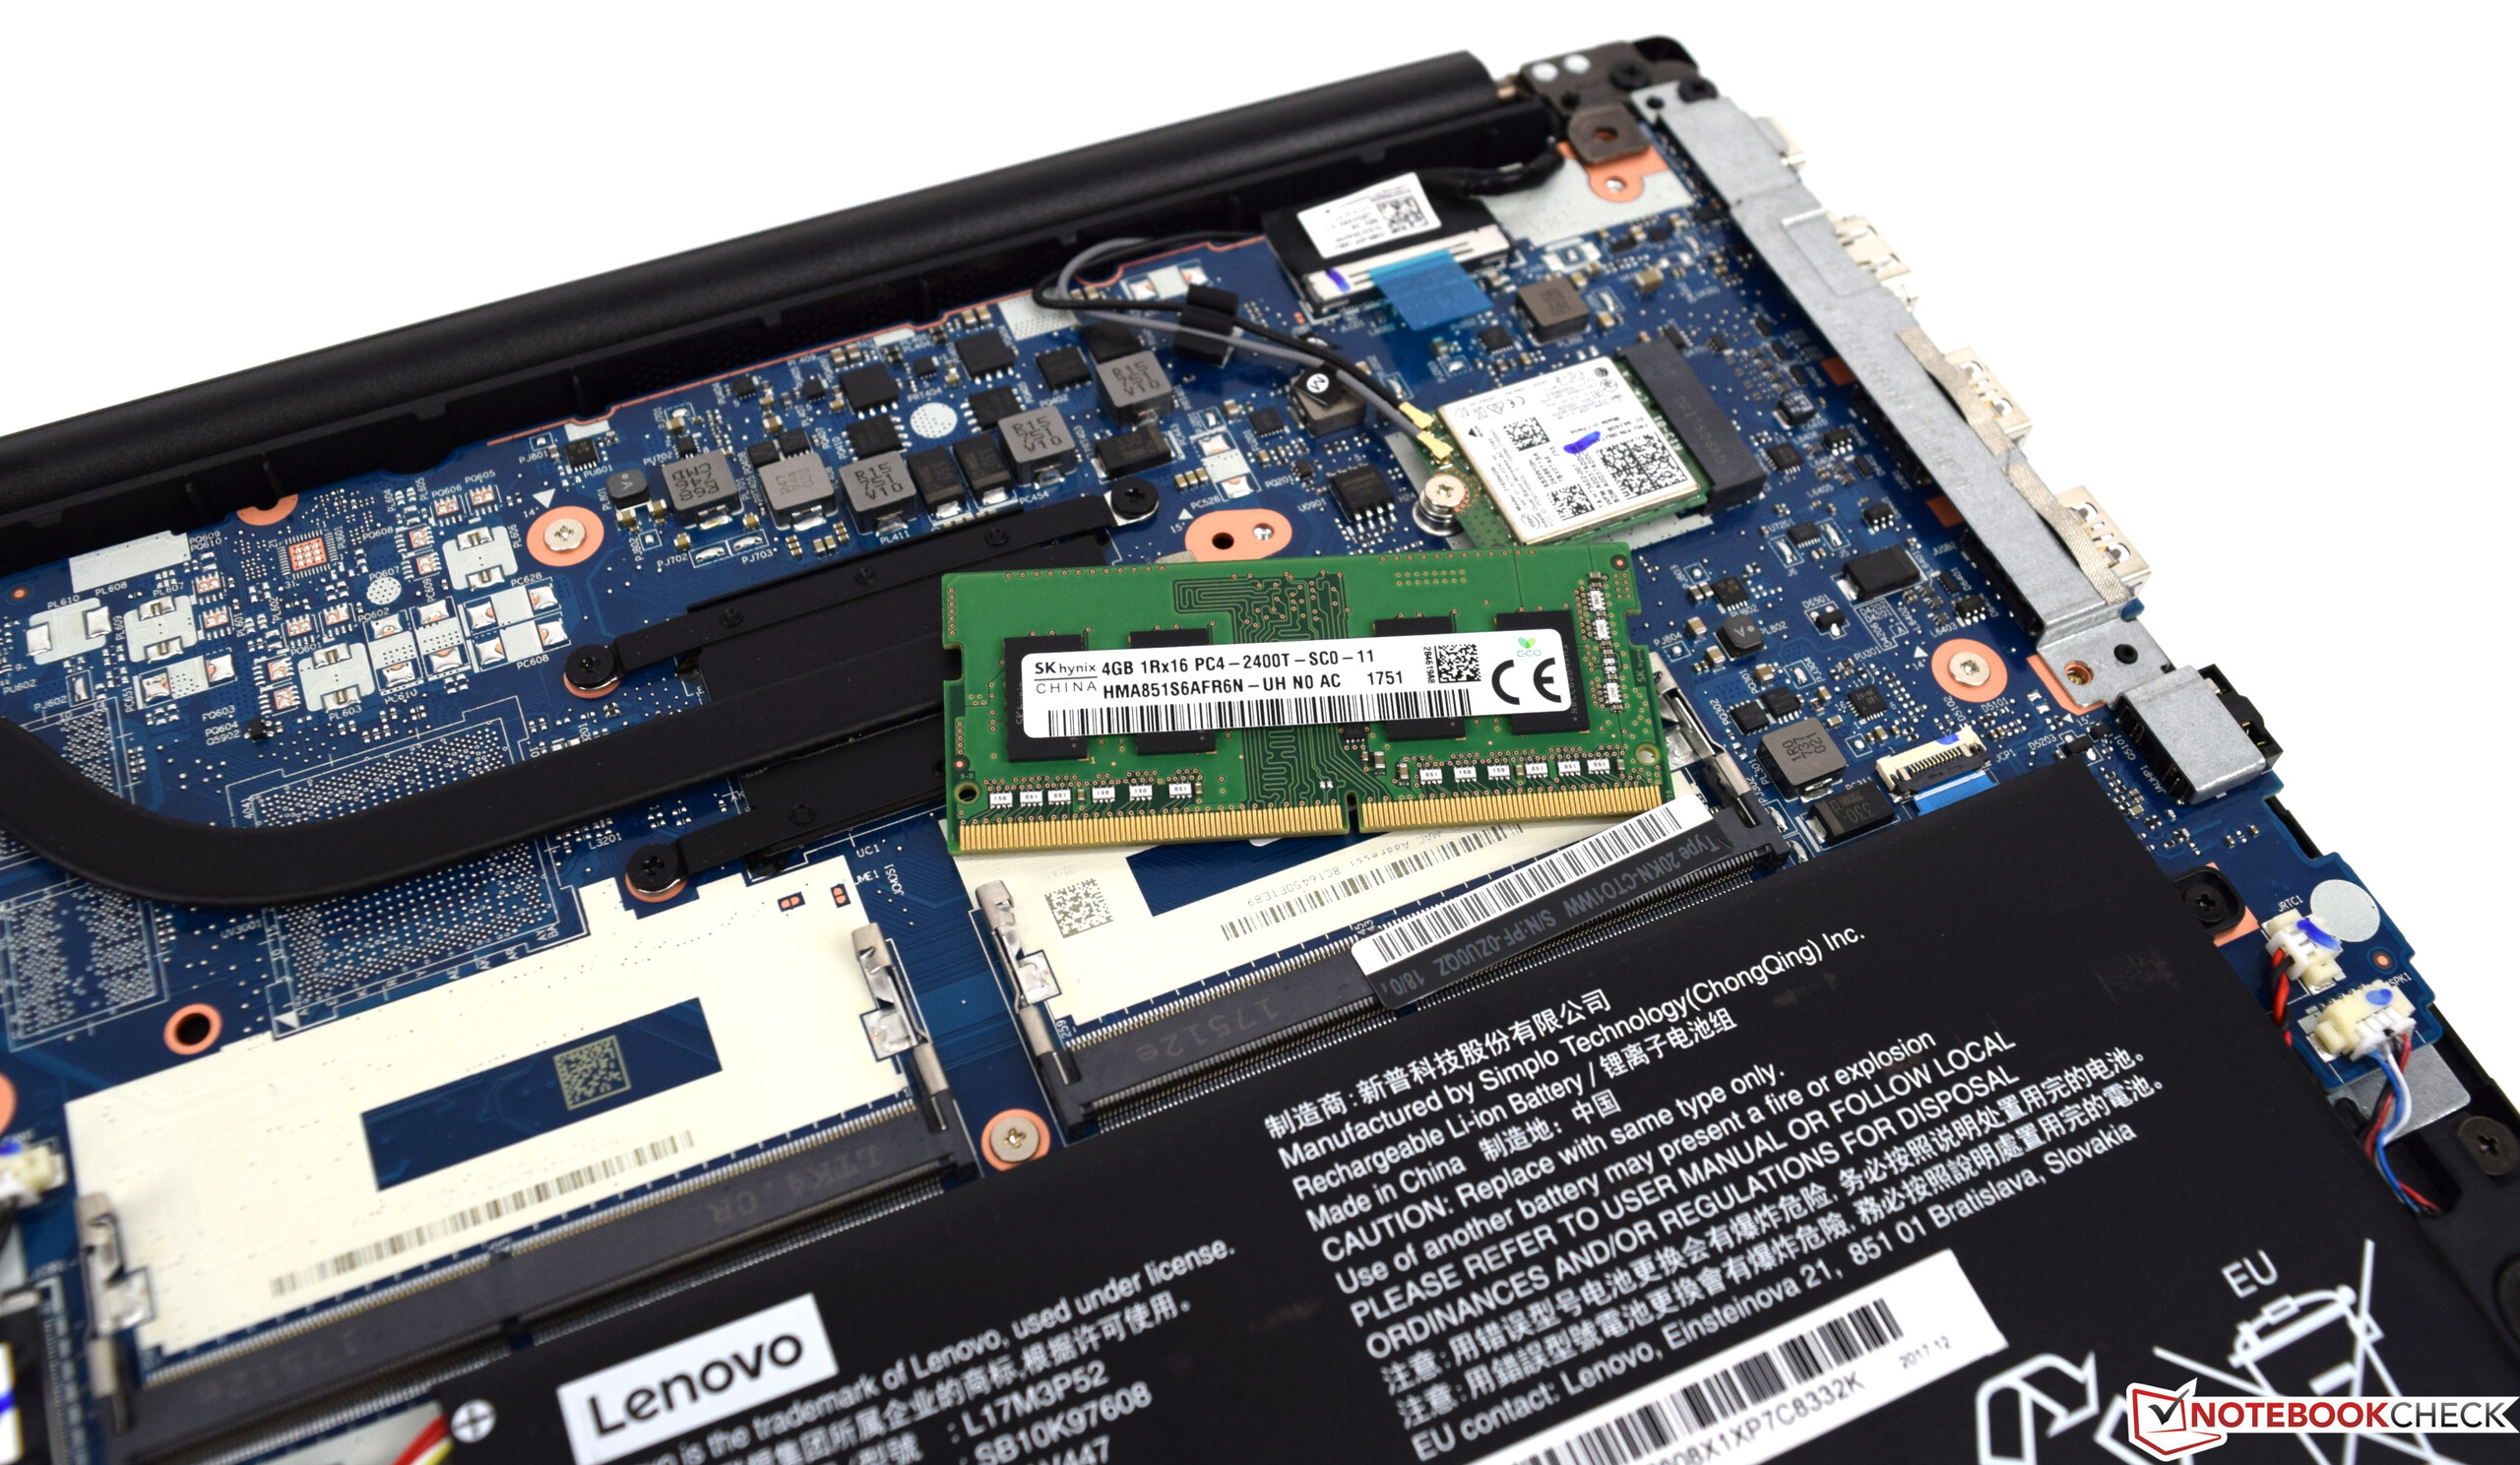
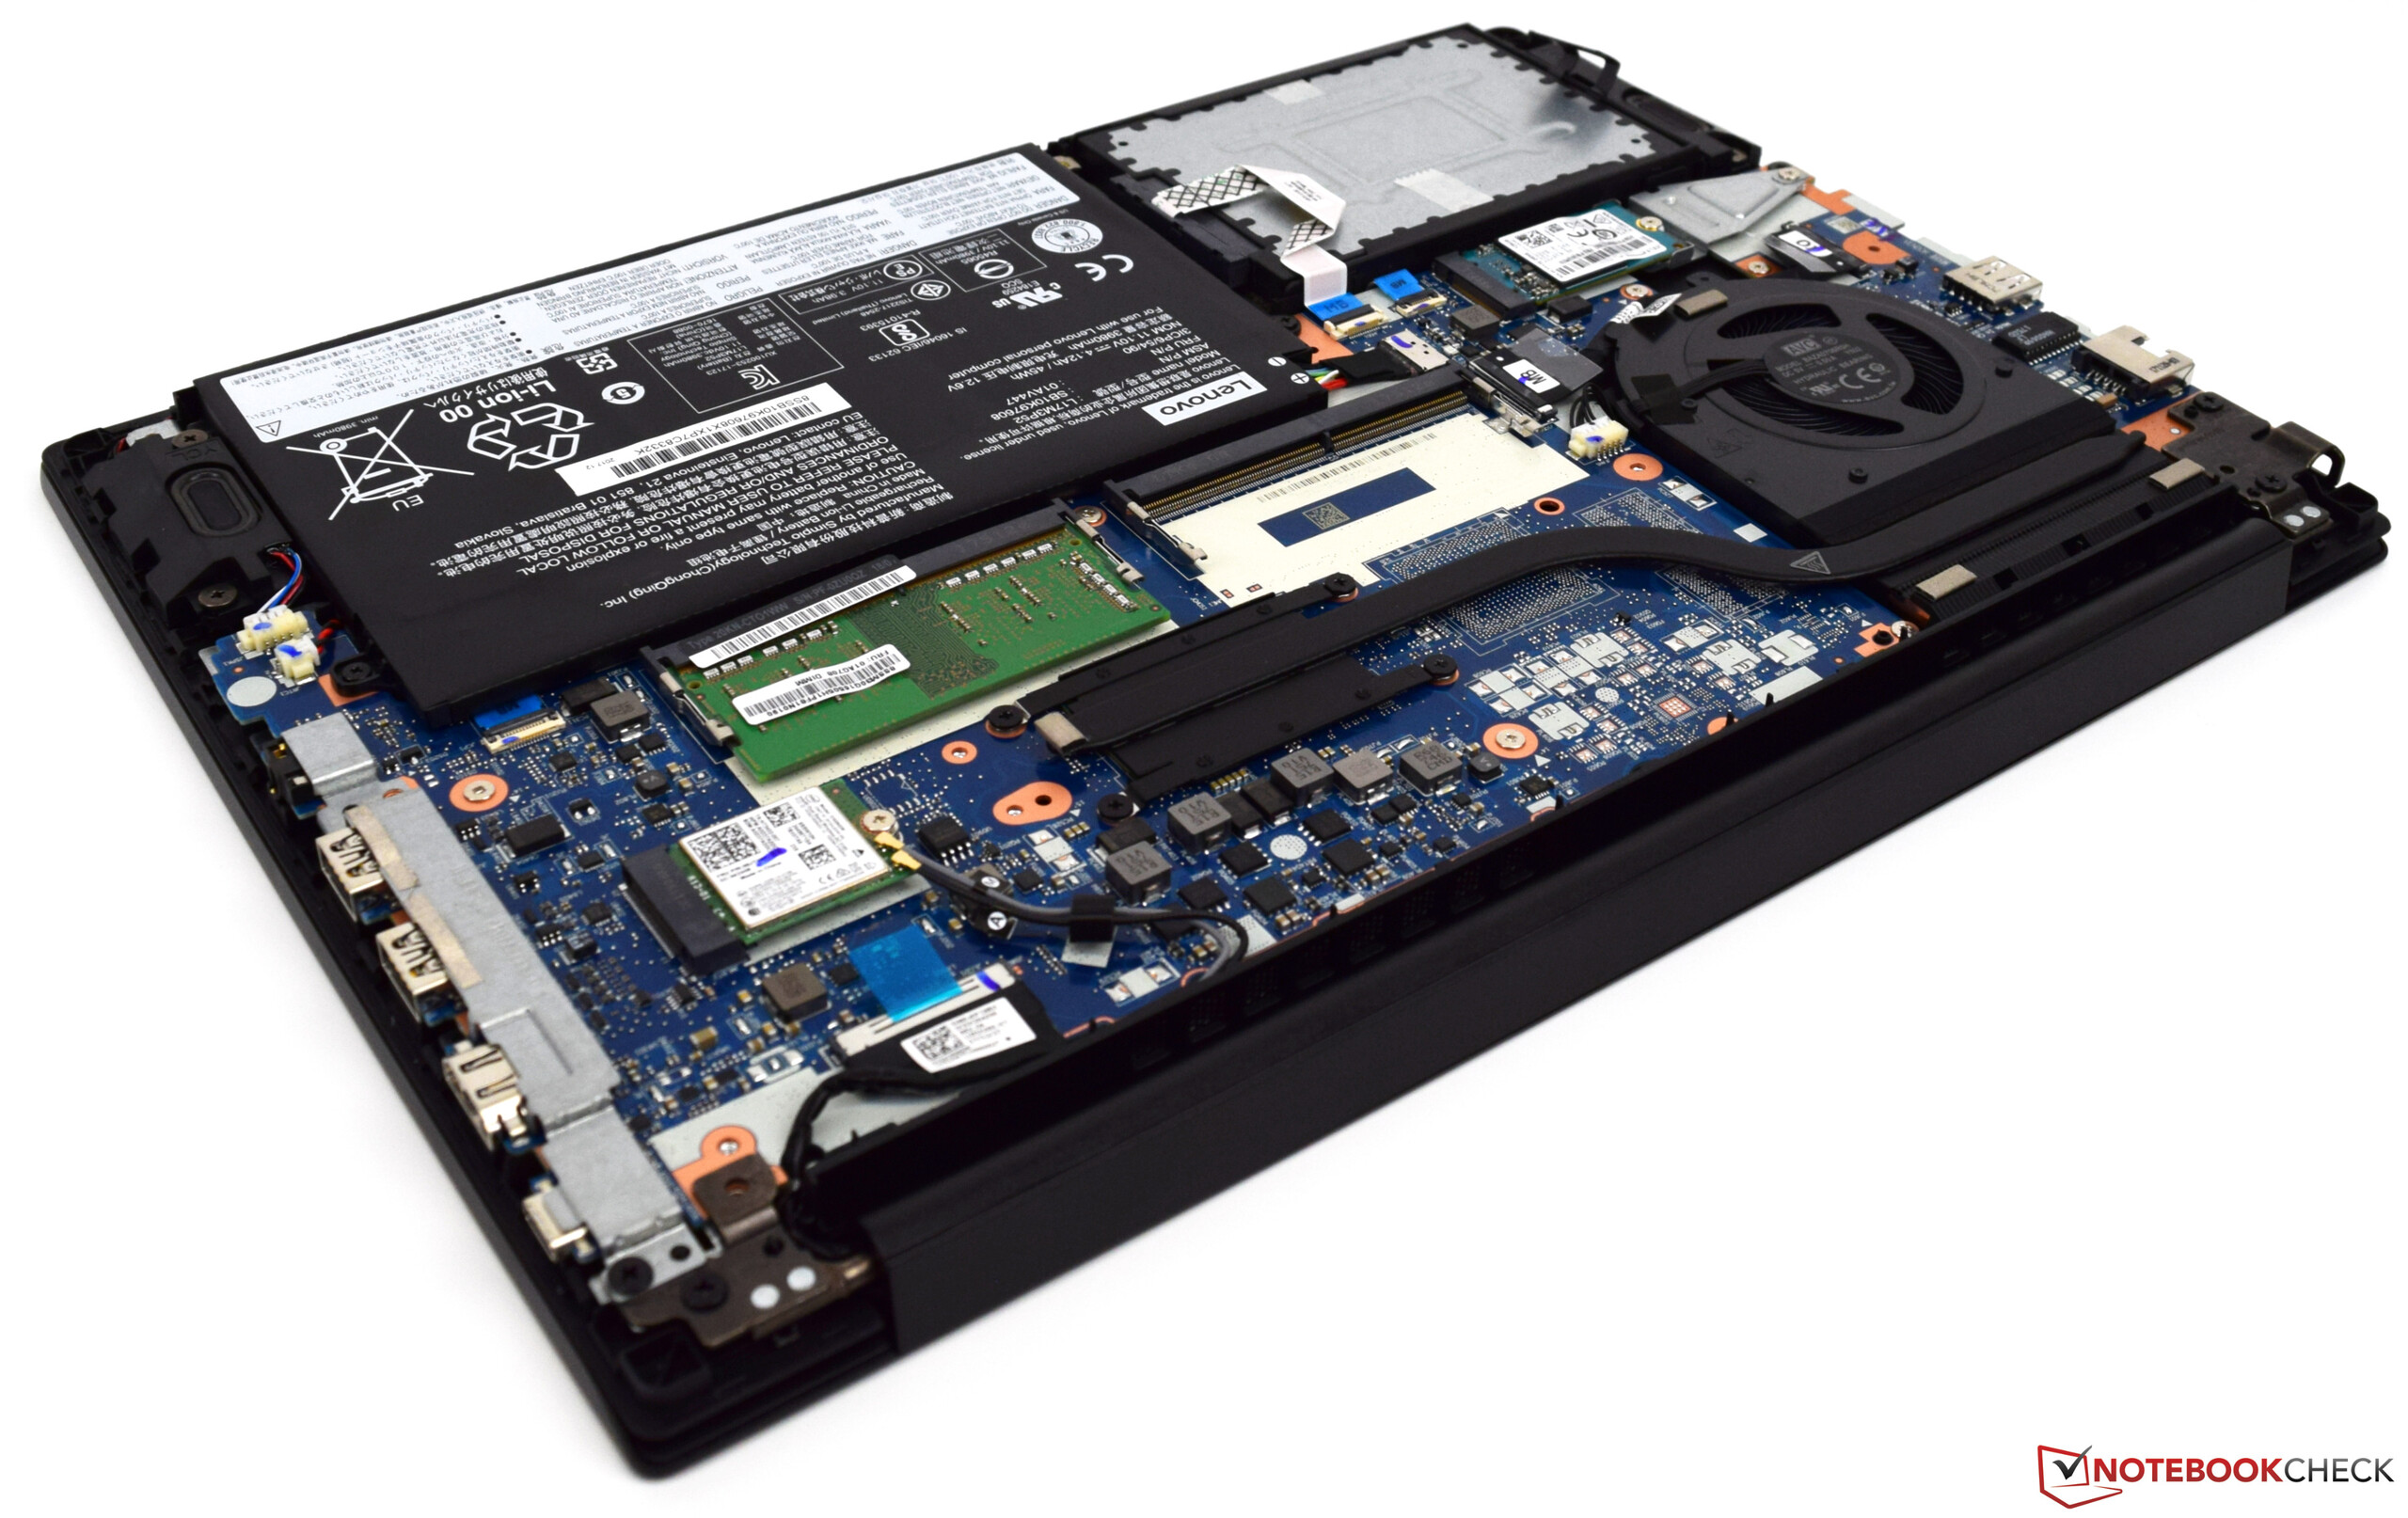
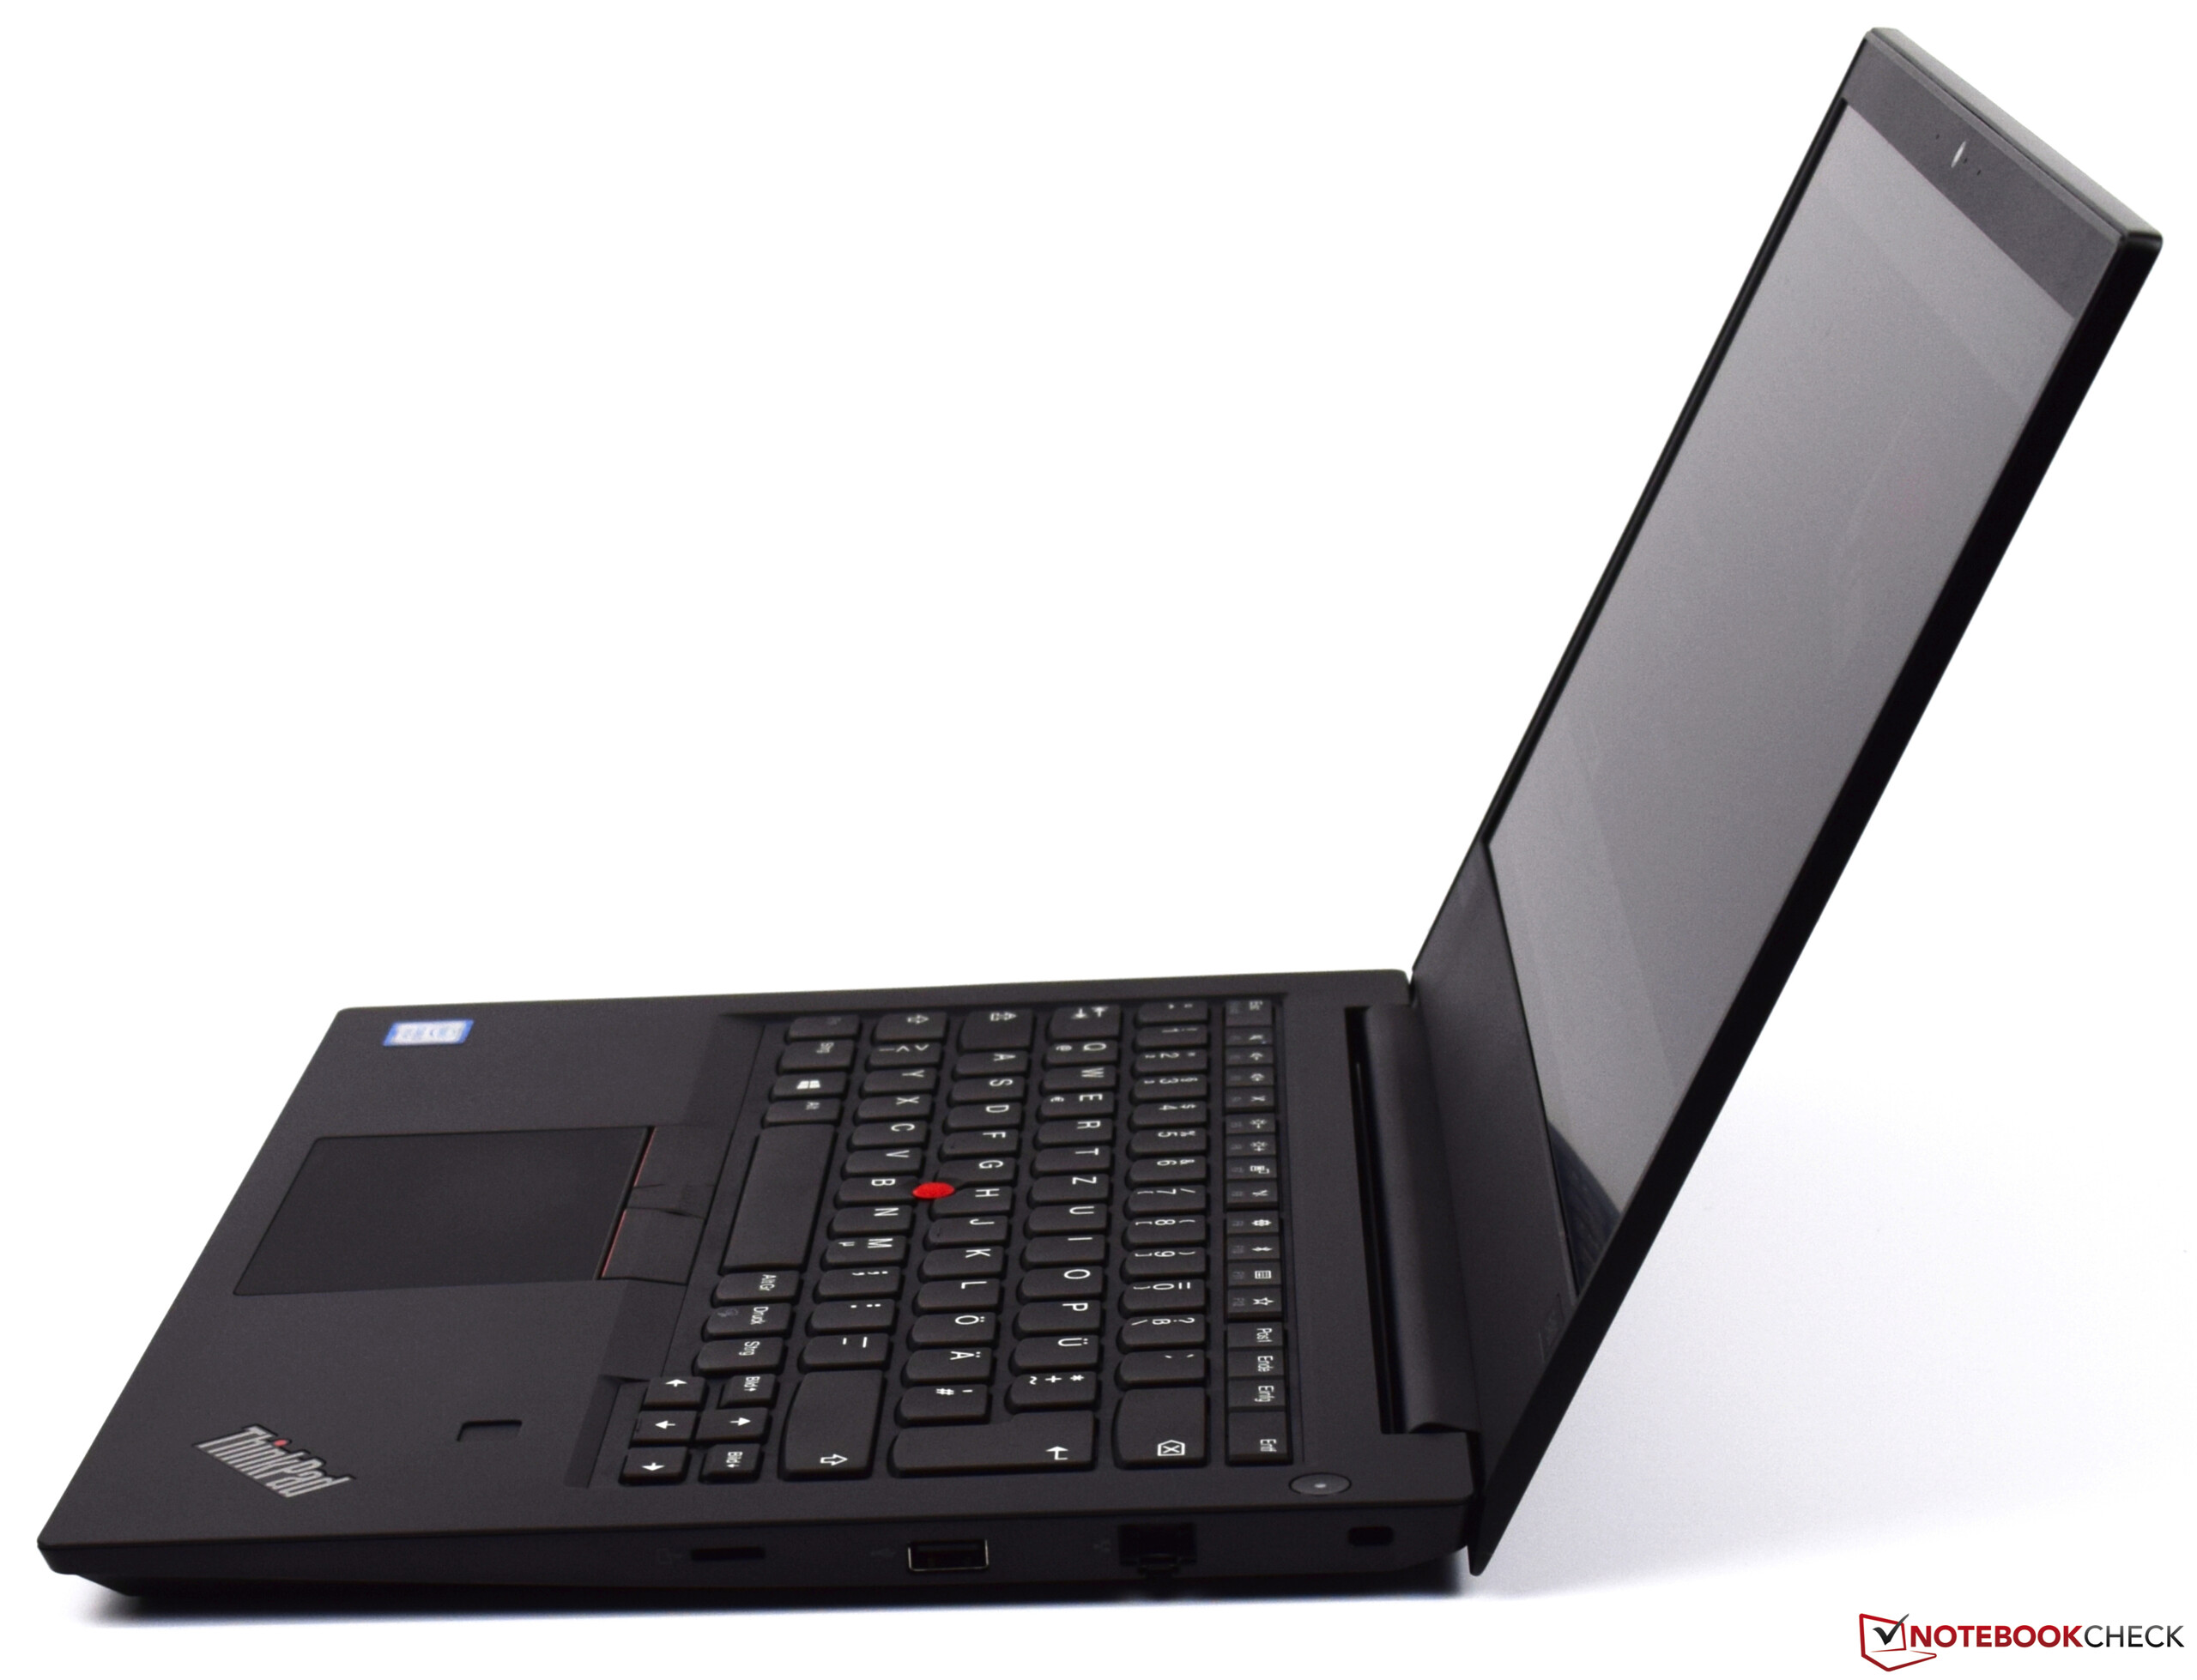
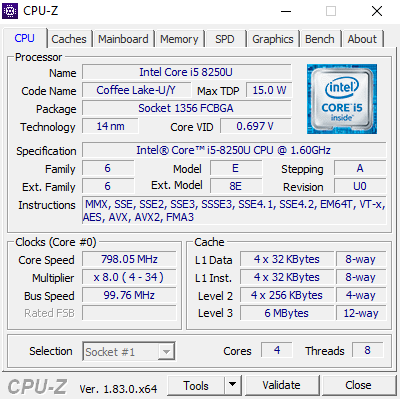
Lenovo ThinkPad E480 är en billig kontorslaptop med kraftfull hårdvara. Dess Intel Core i5-8250U-processor är en kraftfull men ändå energieffektiv CPU vilket leder till energiförbrukning som är bättre än genomsnittet, något batteritiden definitivt drar nytta av. Utrustad med bara 4 GB RAM och 128 GB lagring så erbjuder ThinkPad E480 inte mycket, men mer än tillräckligt för vardaliga kontors- och produktivitetsuppgifter.
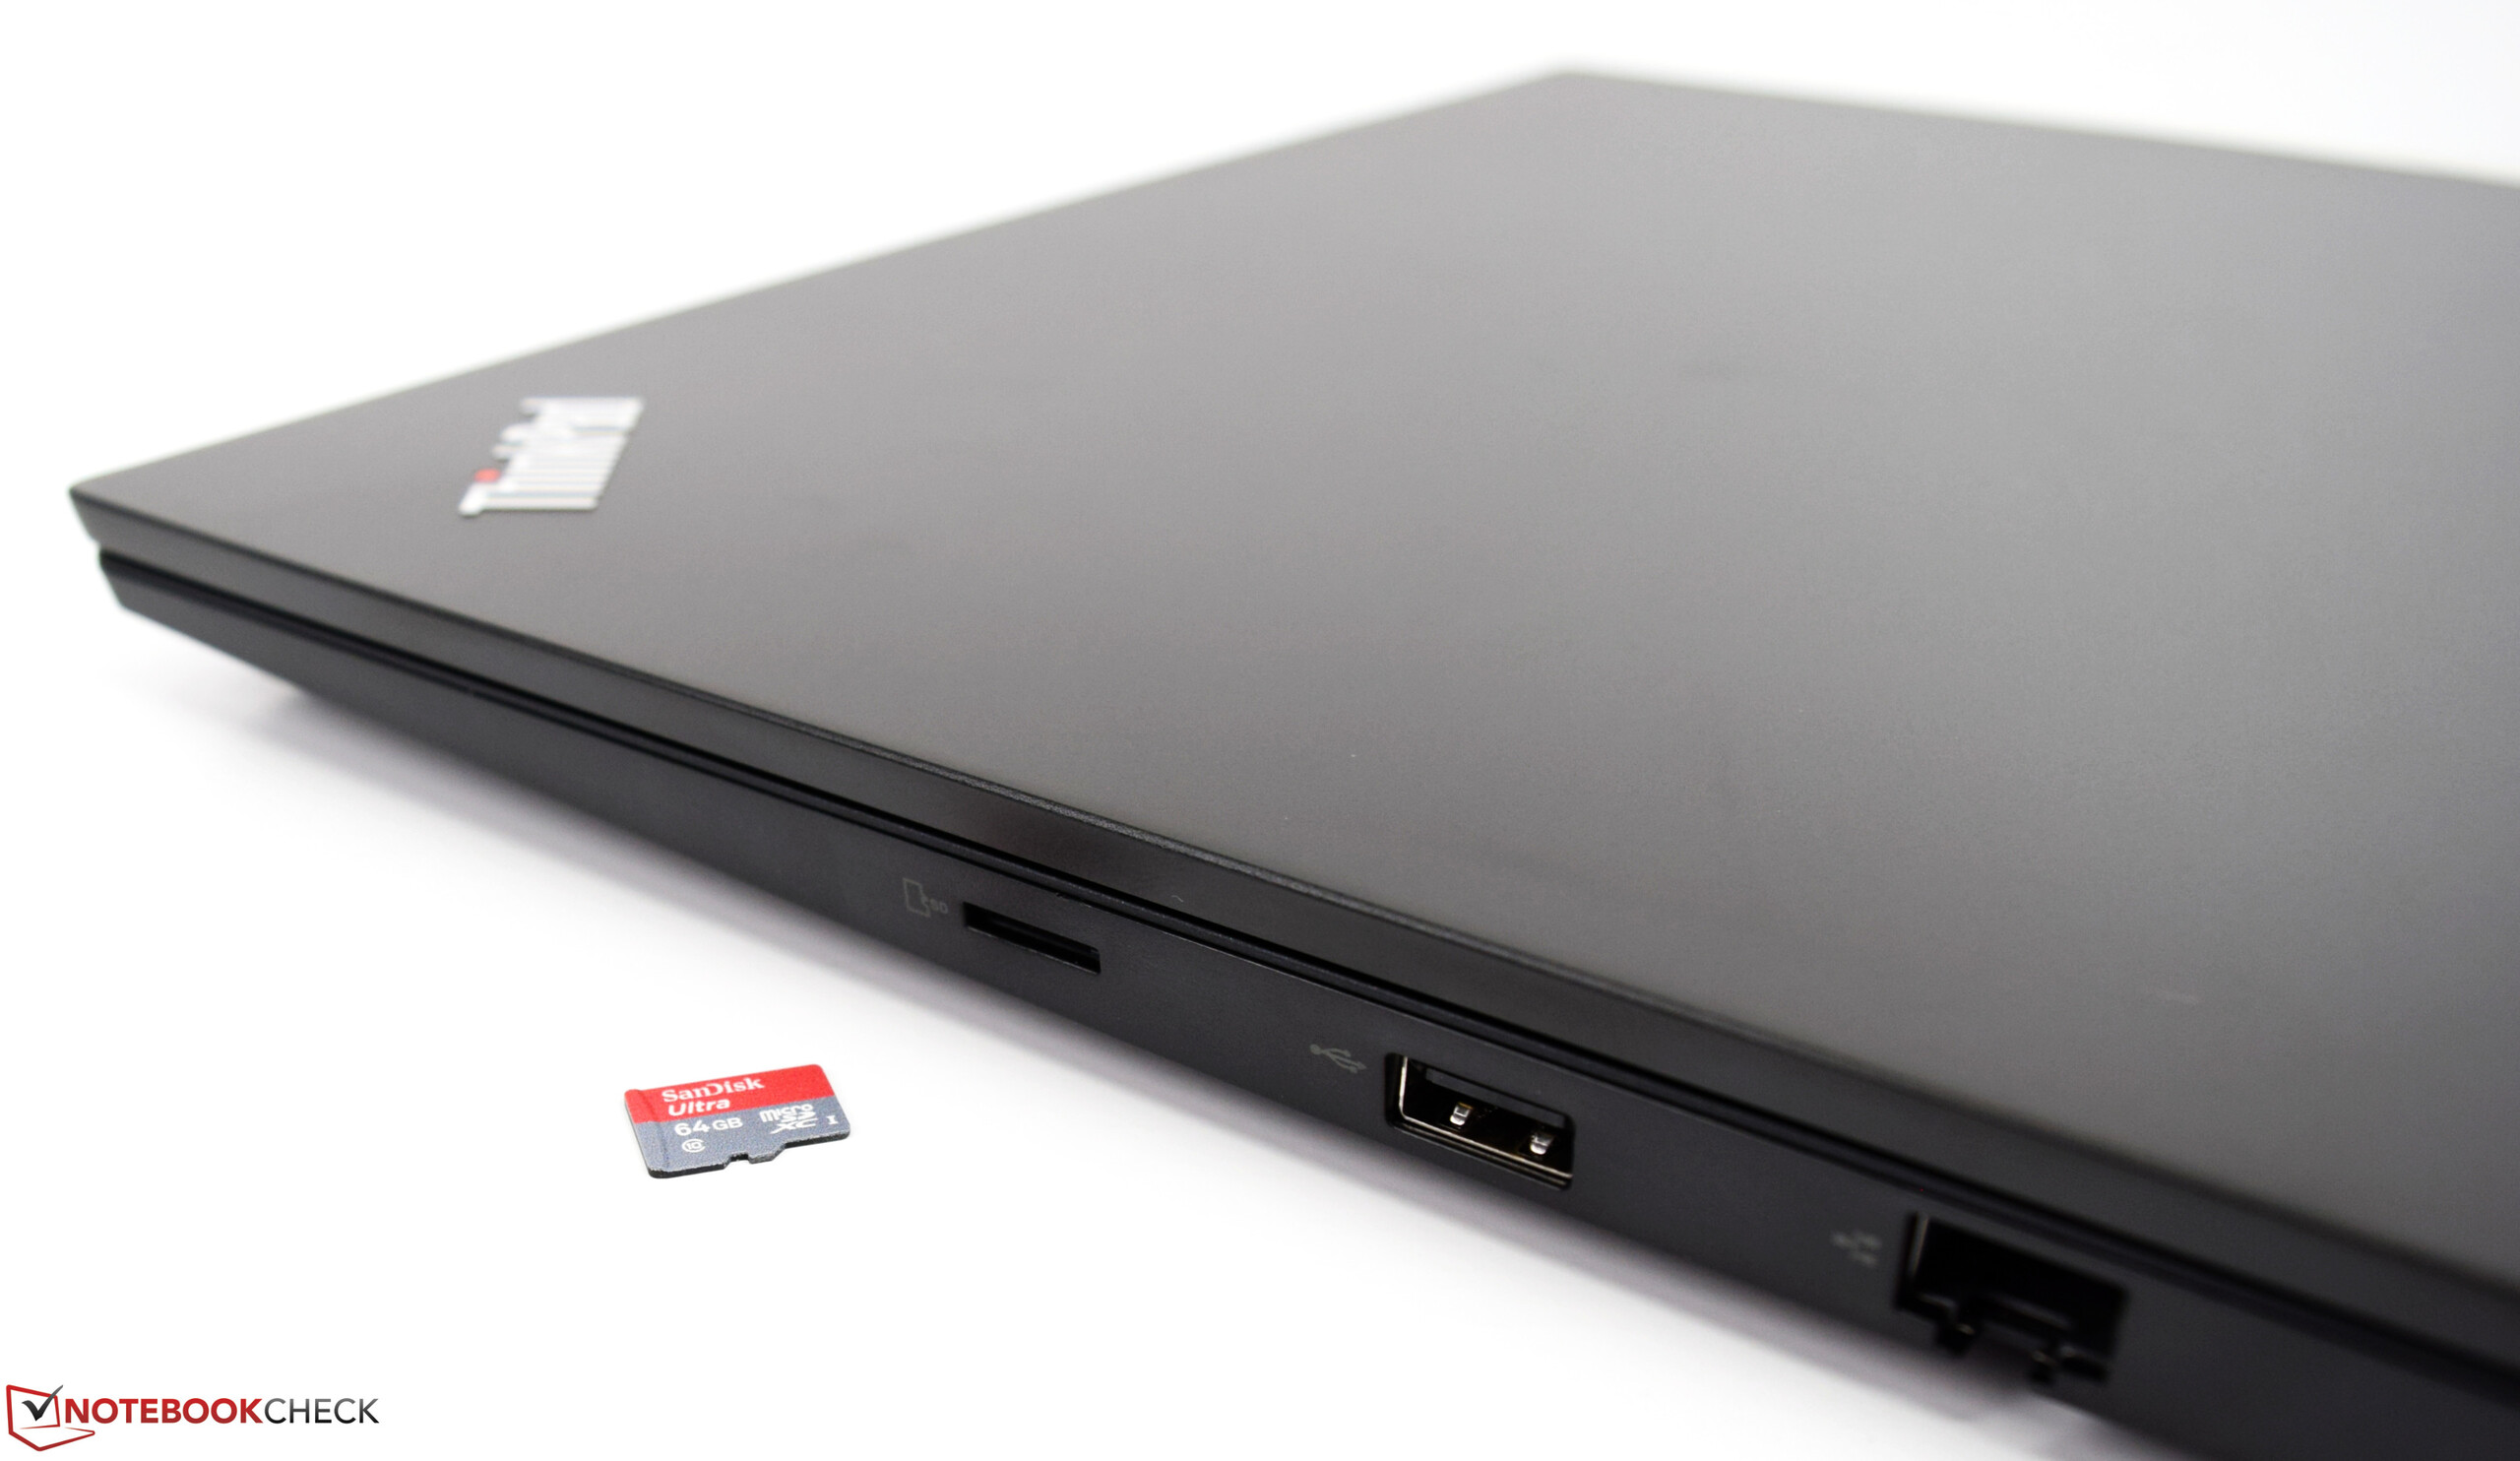
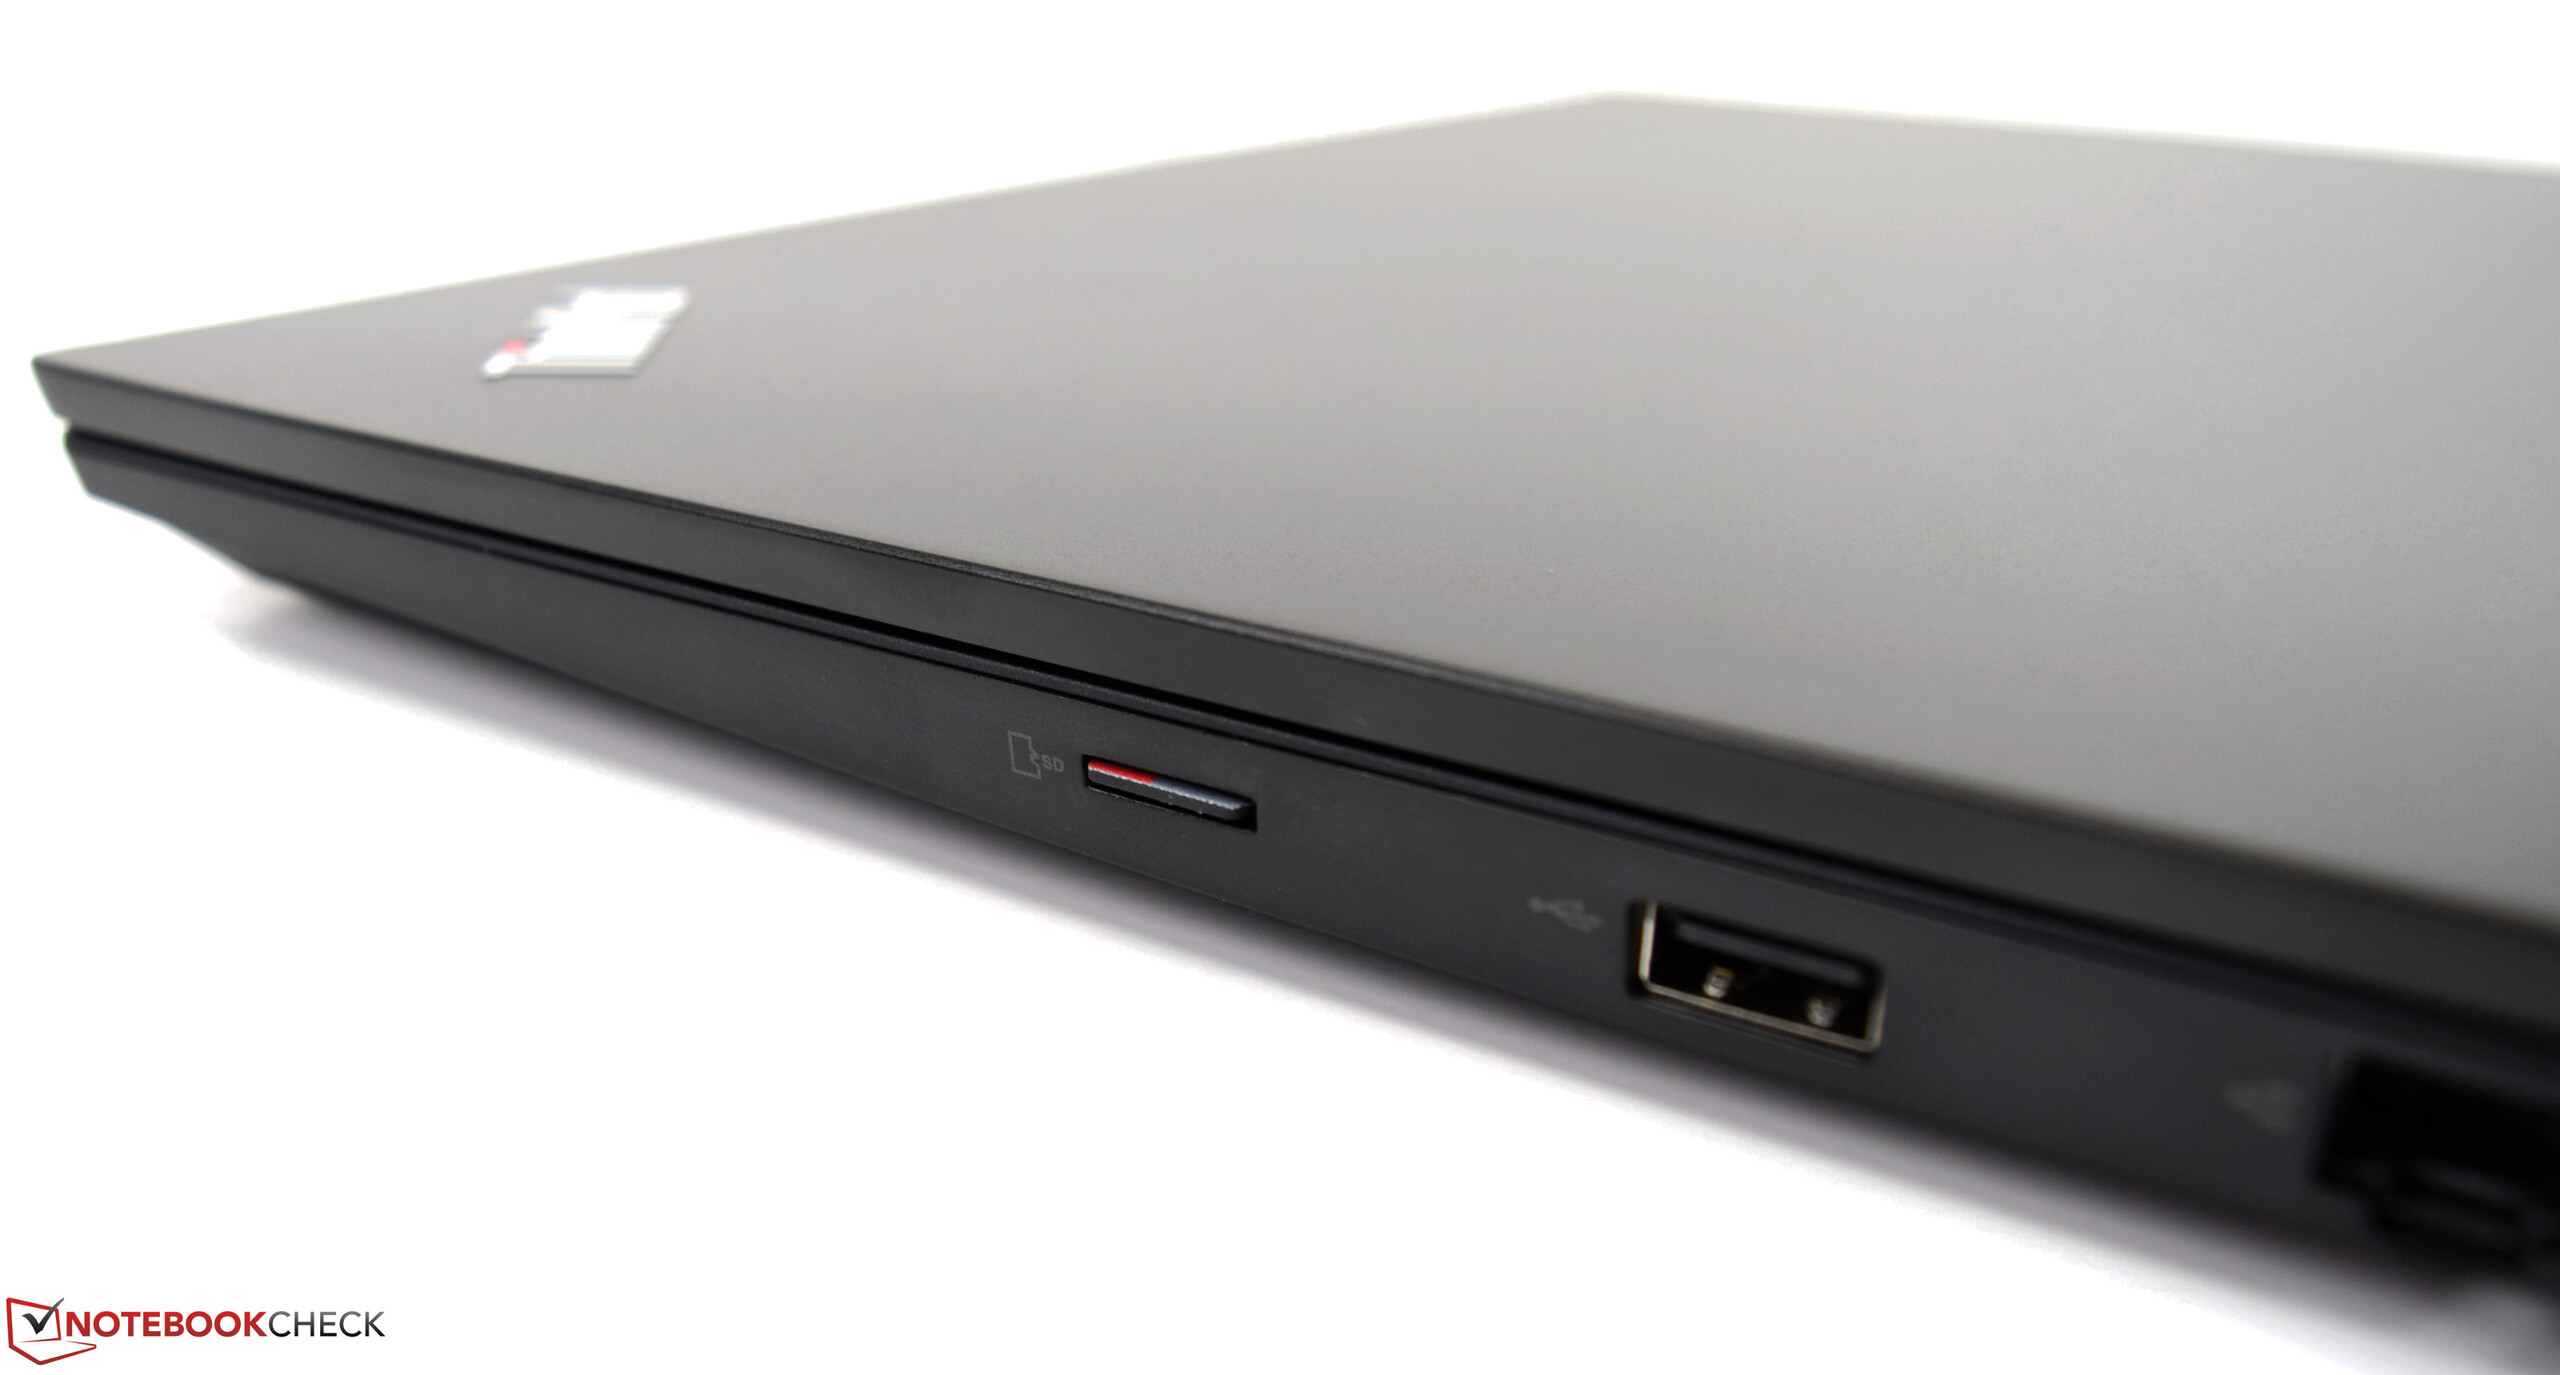
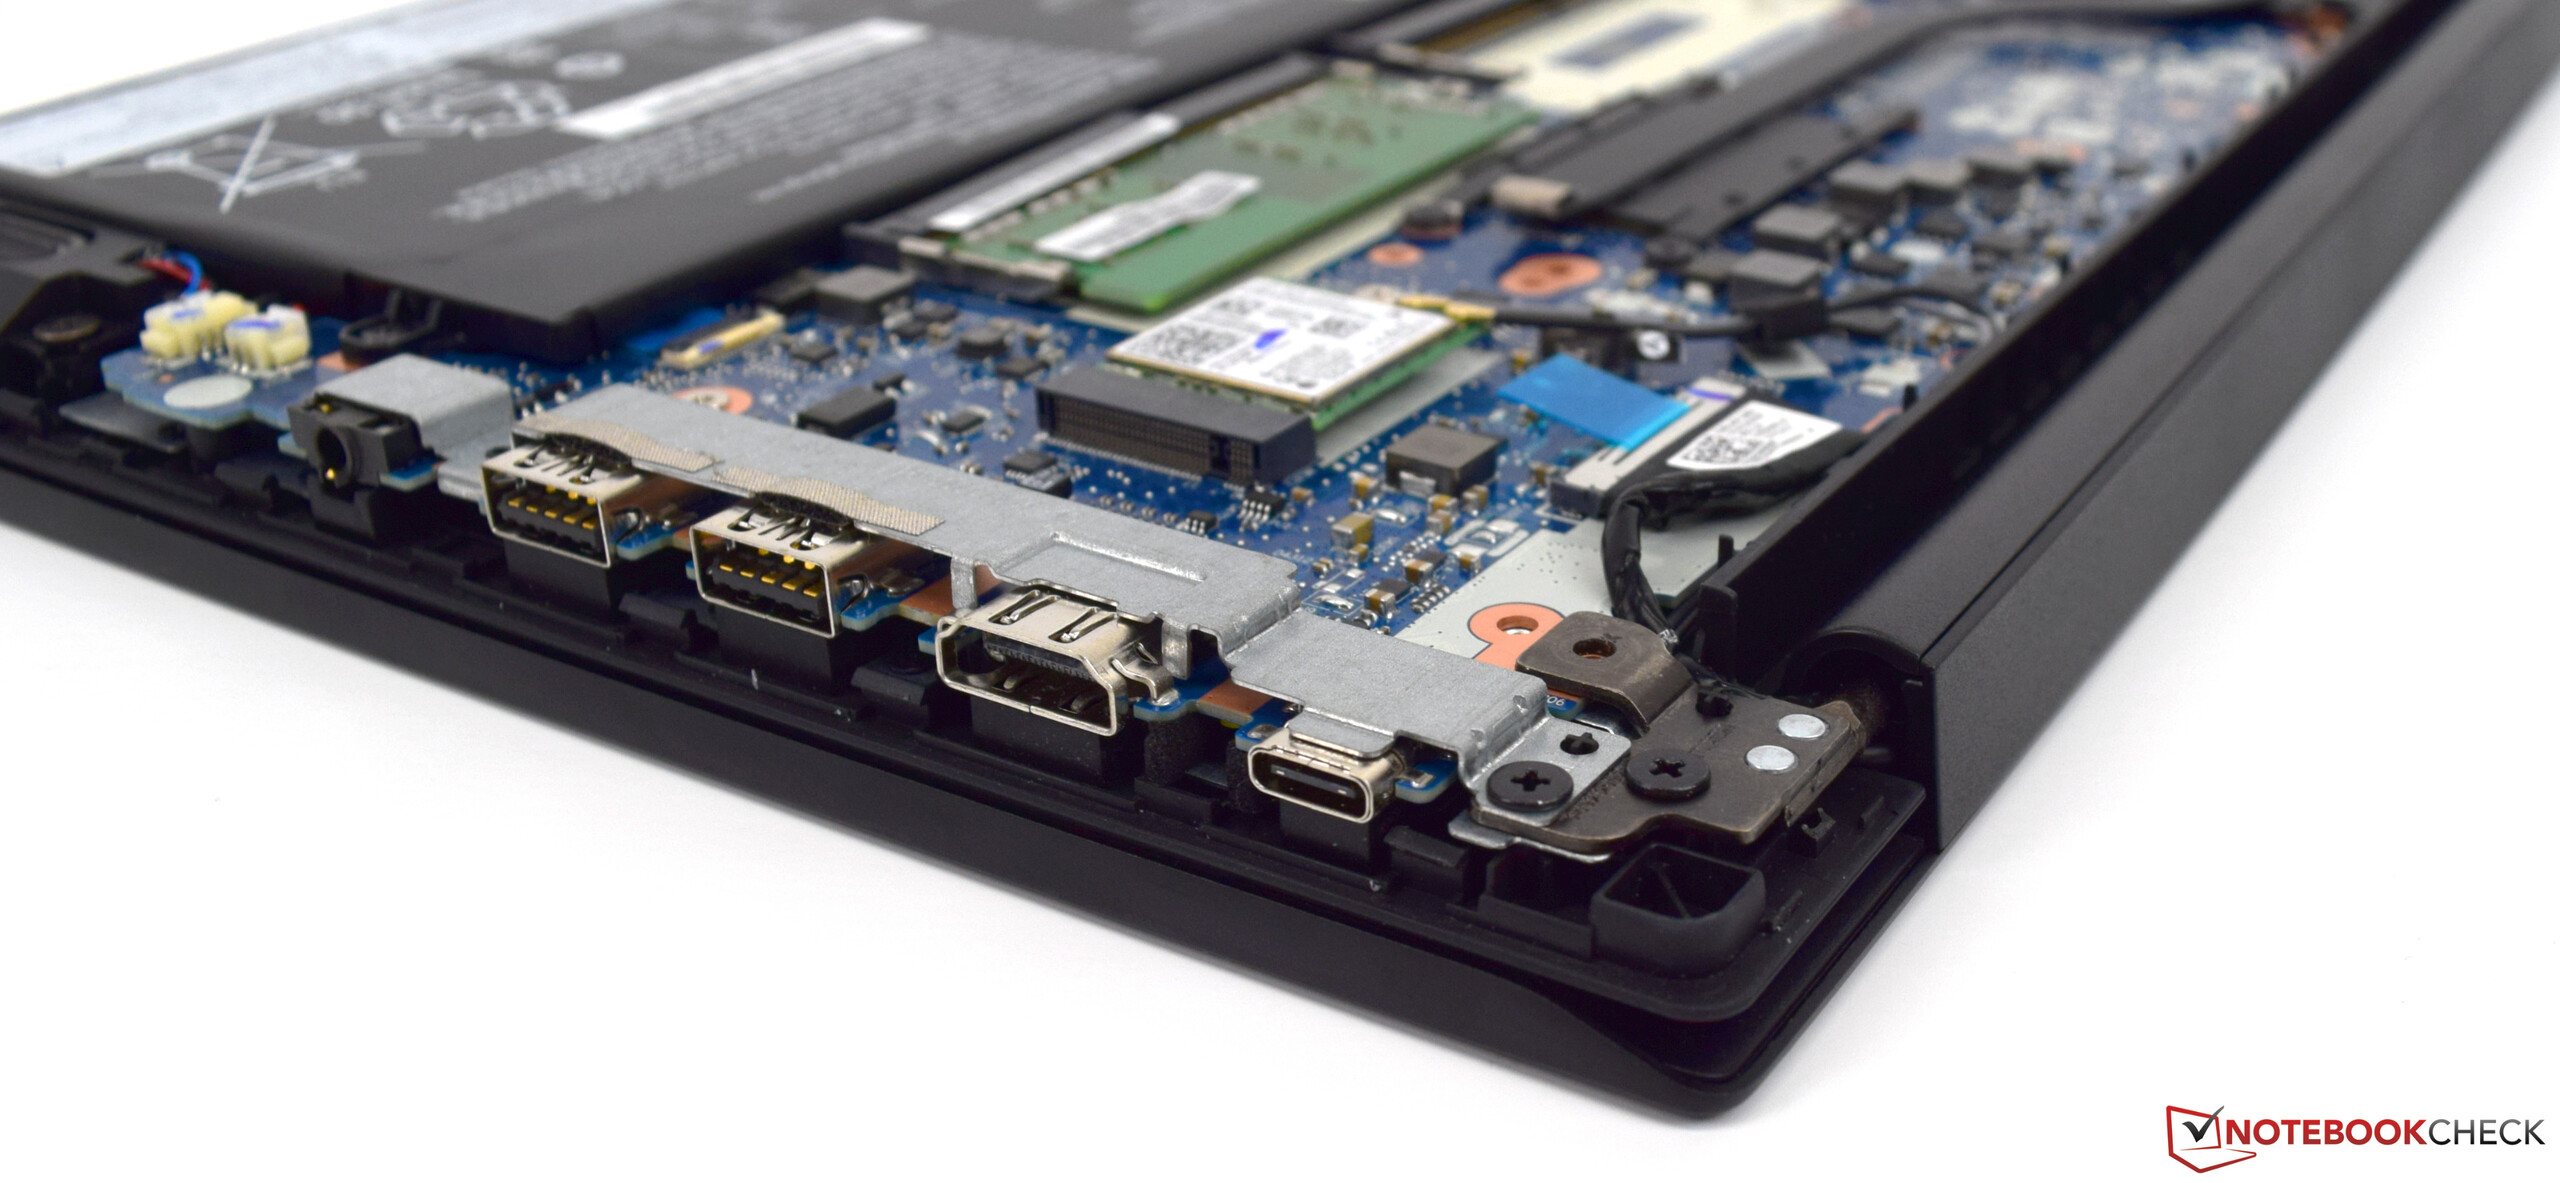
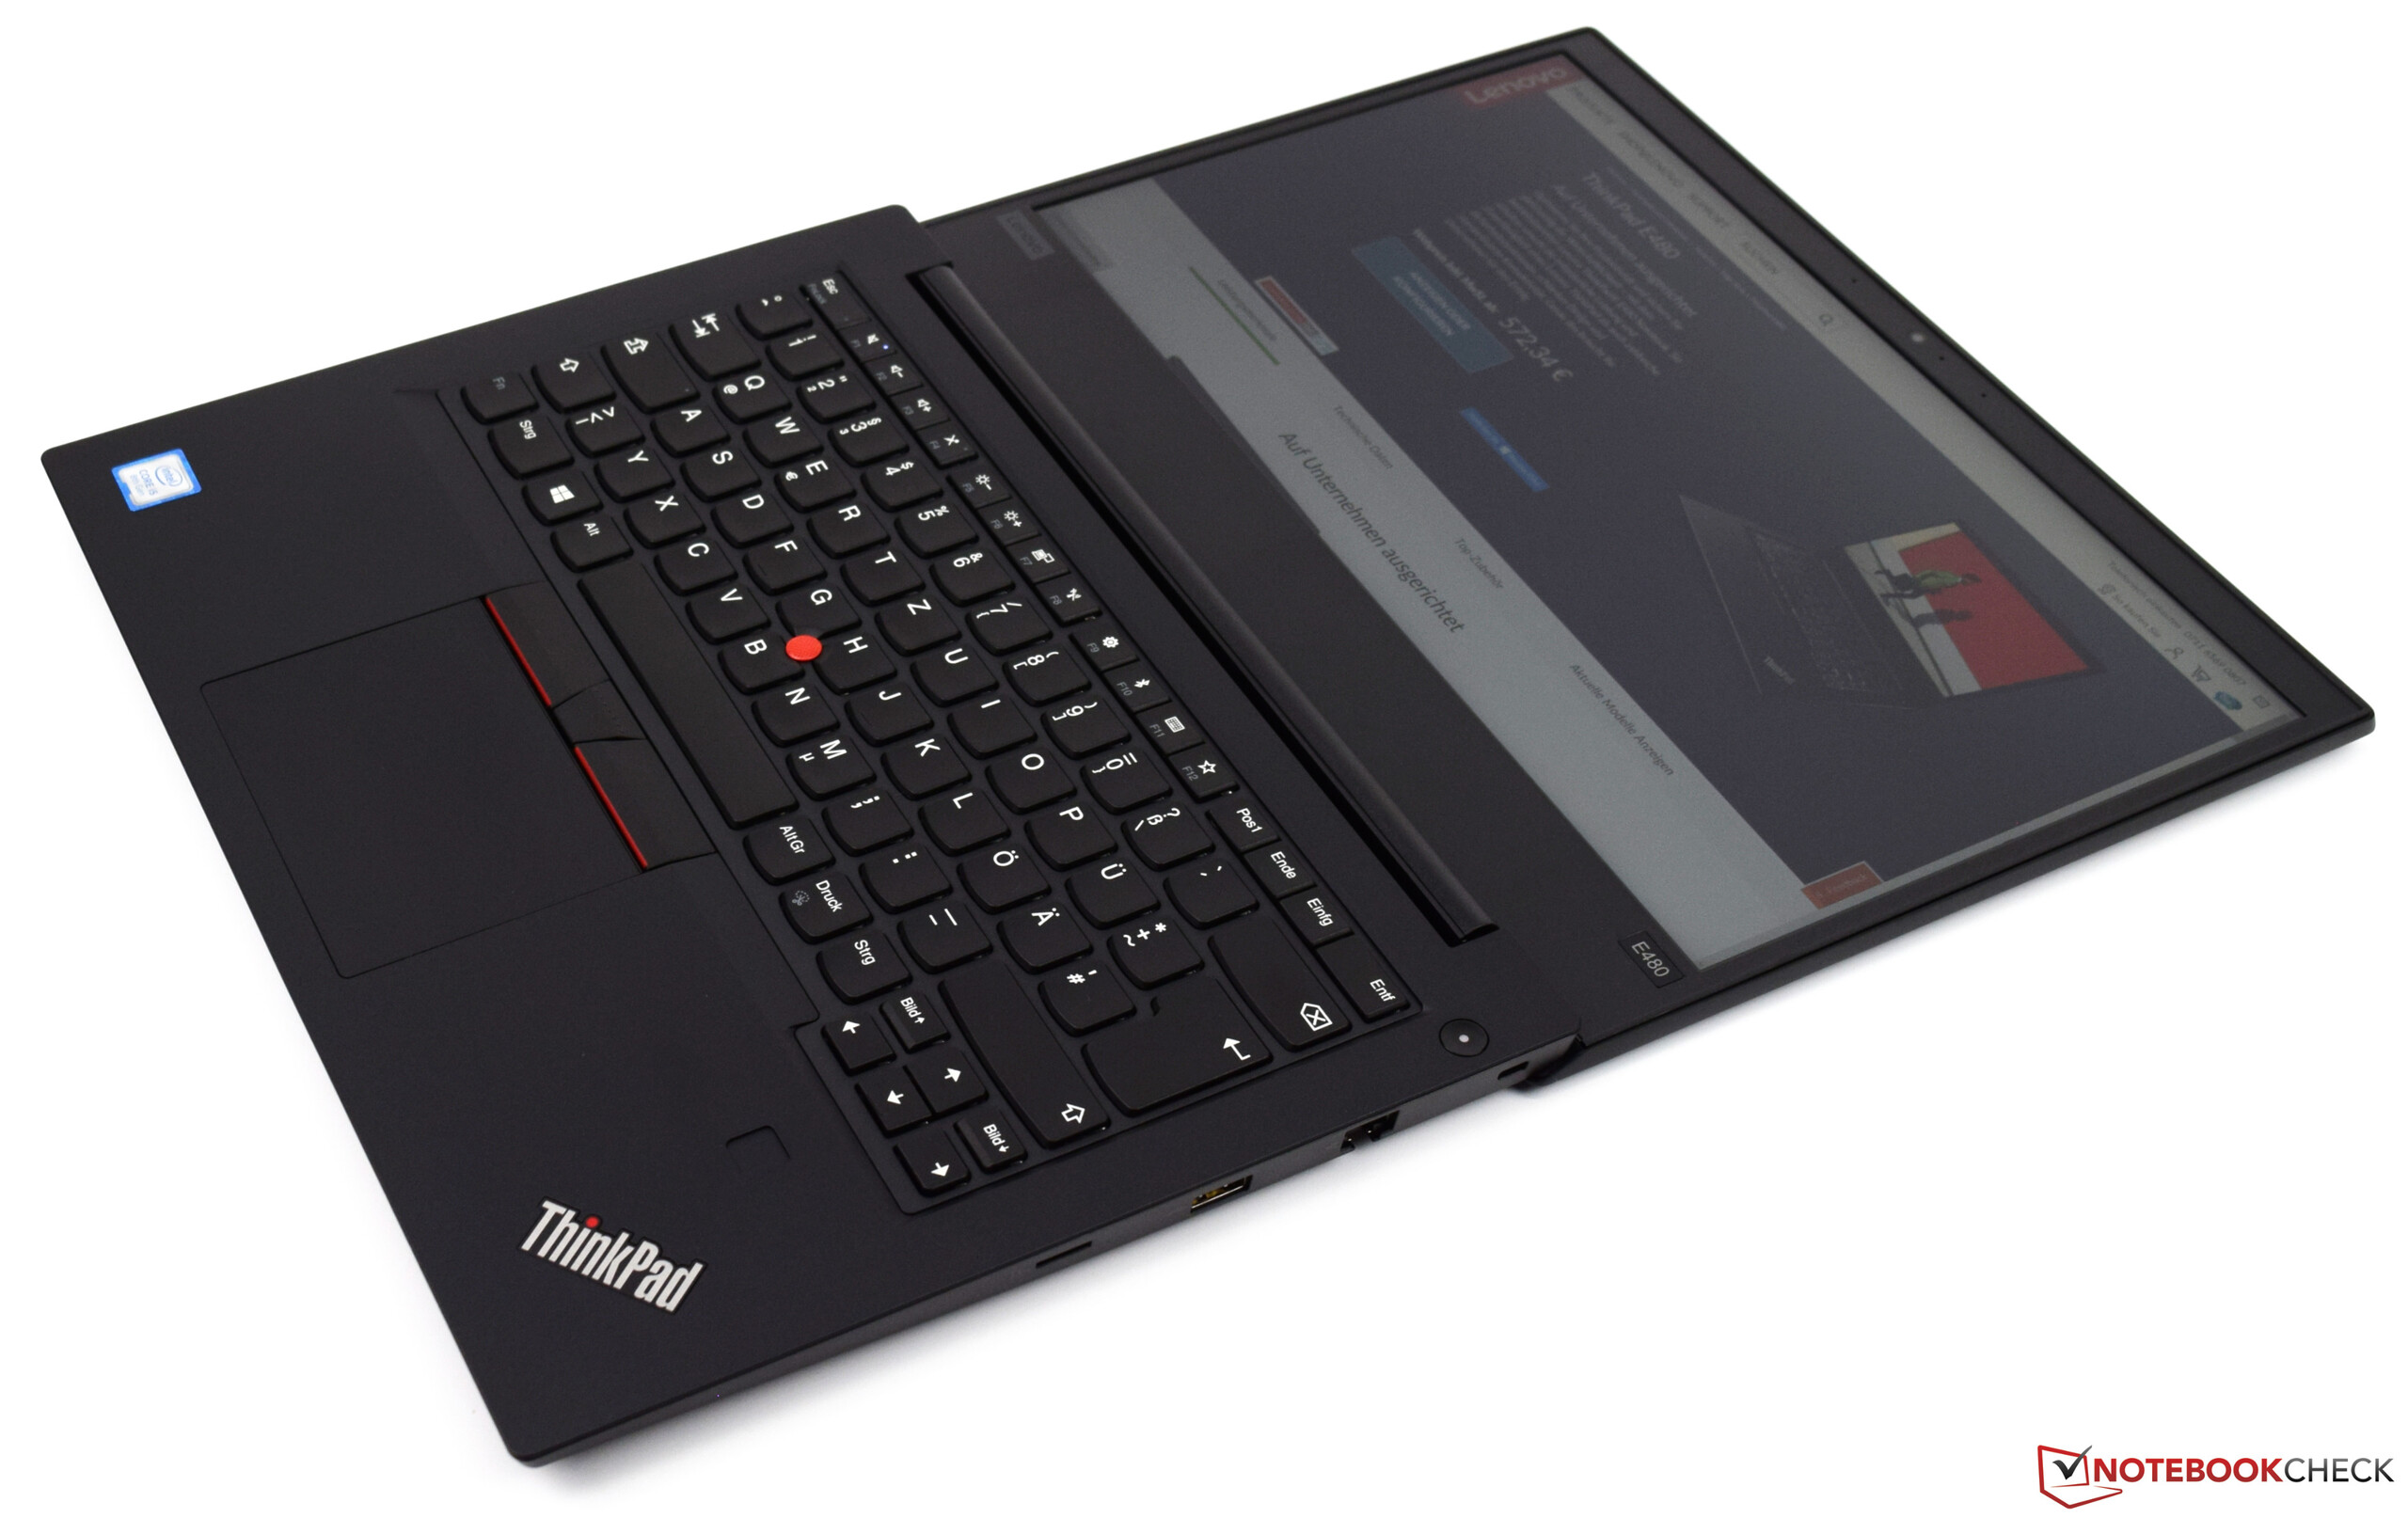
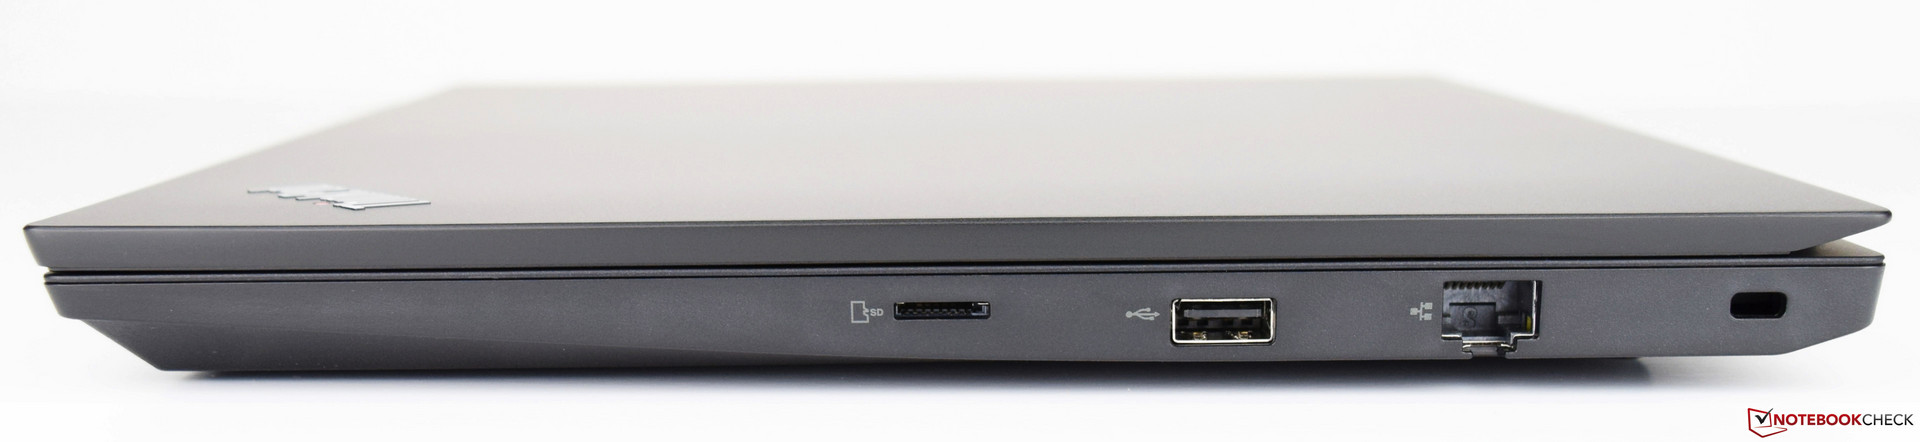
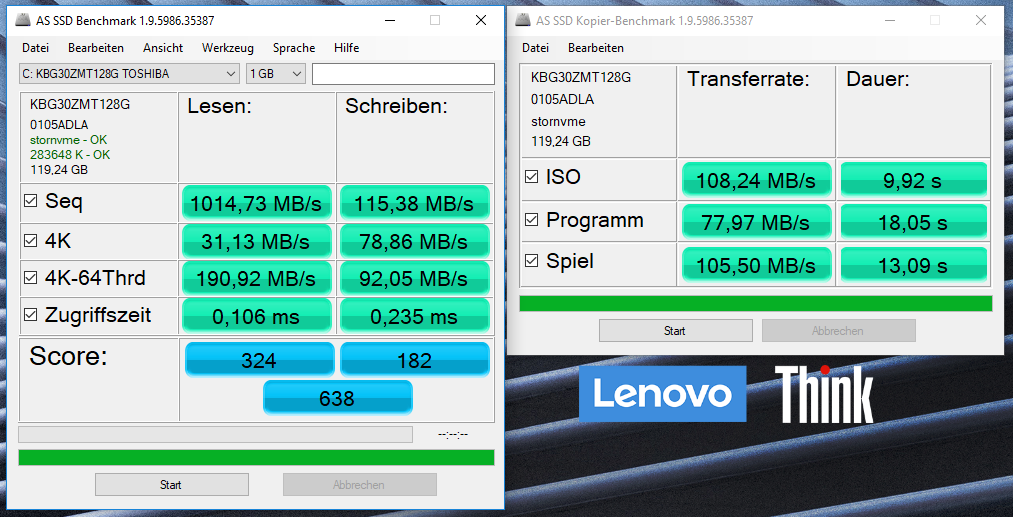
Det kan egentligen inte bli fel med E480:s låga pris på runt 7 000 kronor. Till skillnad från den nyss recenserade E480 med AMD Radeon RX 550 så förtjänar dagens recensionsenhet vårt fulla stöd. Vi imponerades särskilt av IPS-skärmen med hög kontrast - en skärm som den här är ganska ovanlig i det prisspann som E480 befinner sig i. Vårt största klagomål är enhetens dåliga SSD-prestanda och vi irriterades också av avsaknaden av en SD-kortläsare (som har bytts ut av en MicroSD-kortläsare). Totalt sett så får du en gedigen arbetshäst för ett hyggligt och rättvist pris.
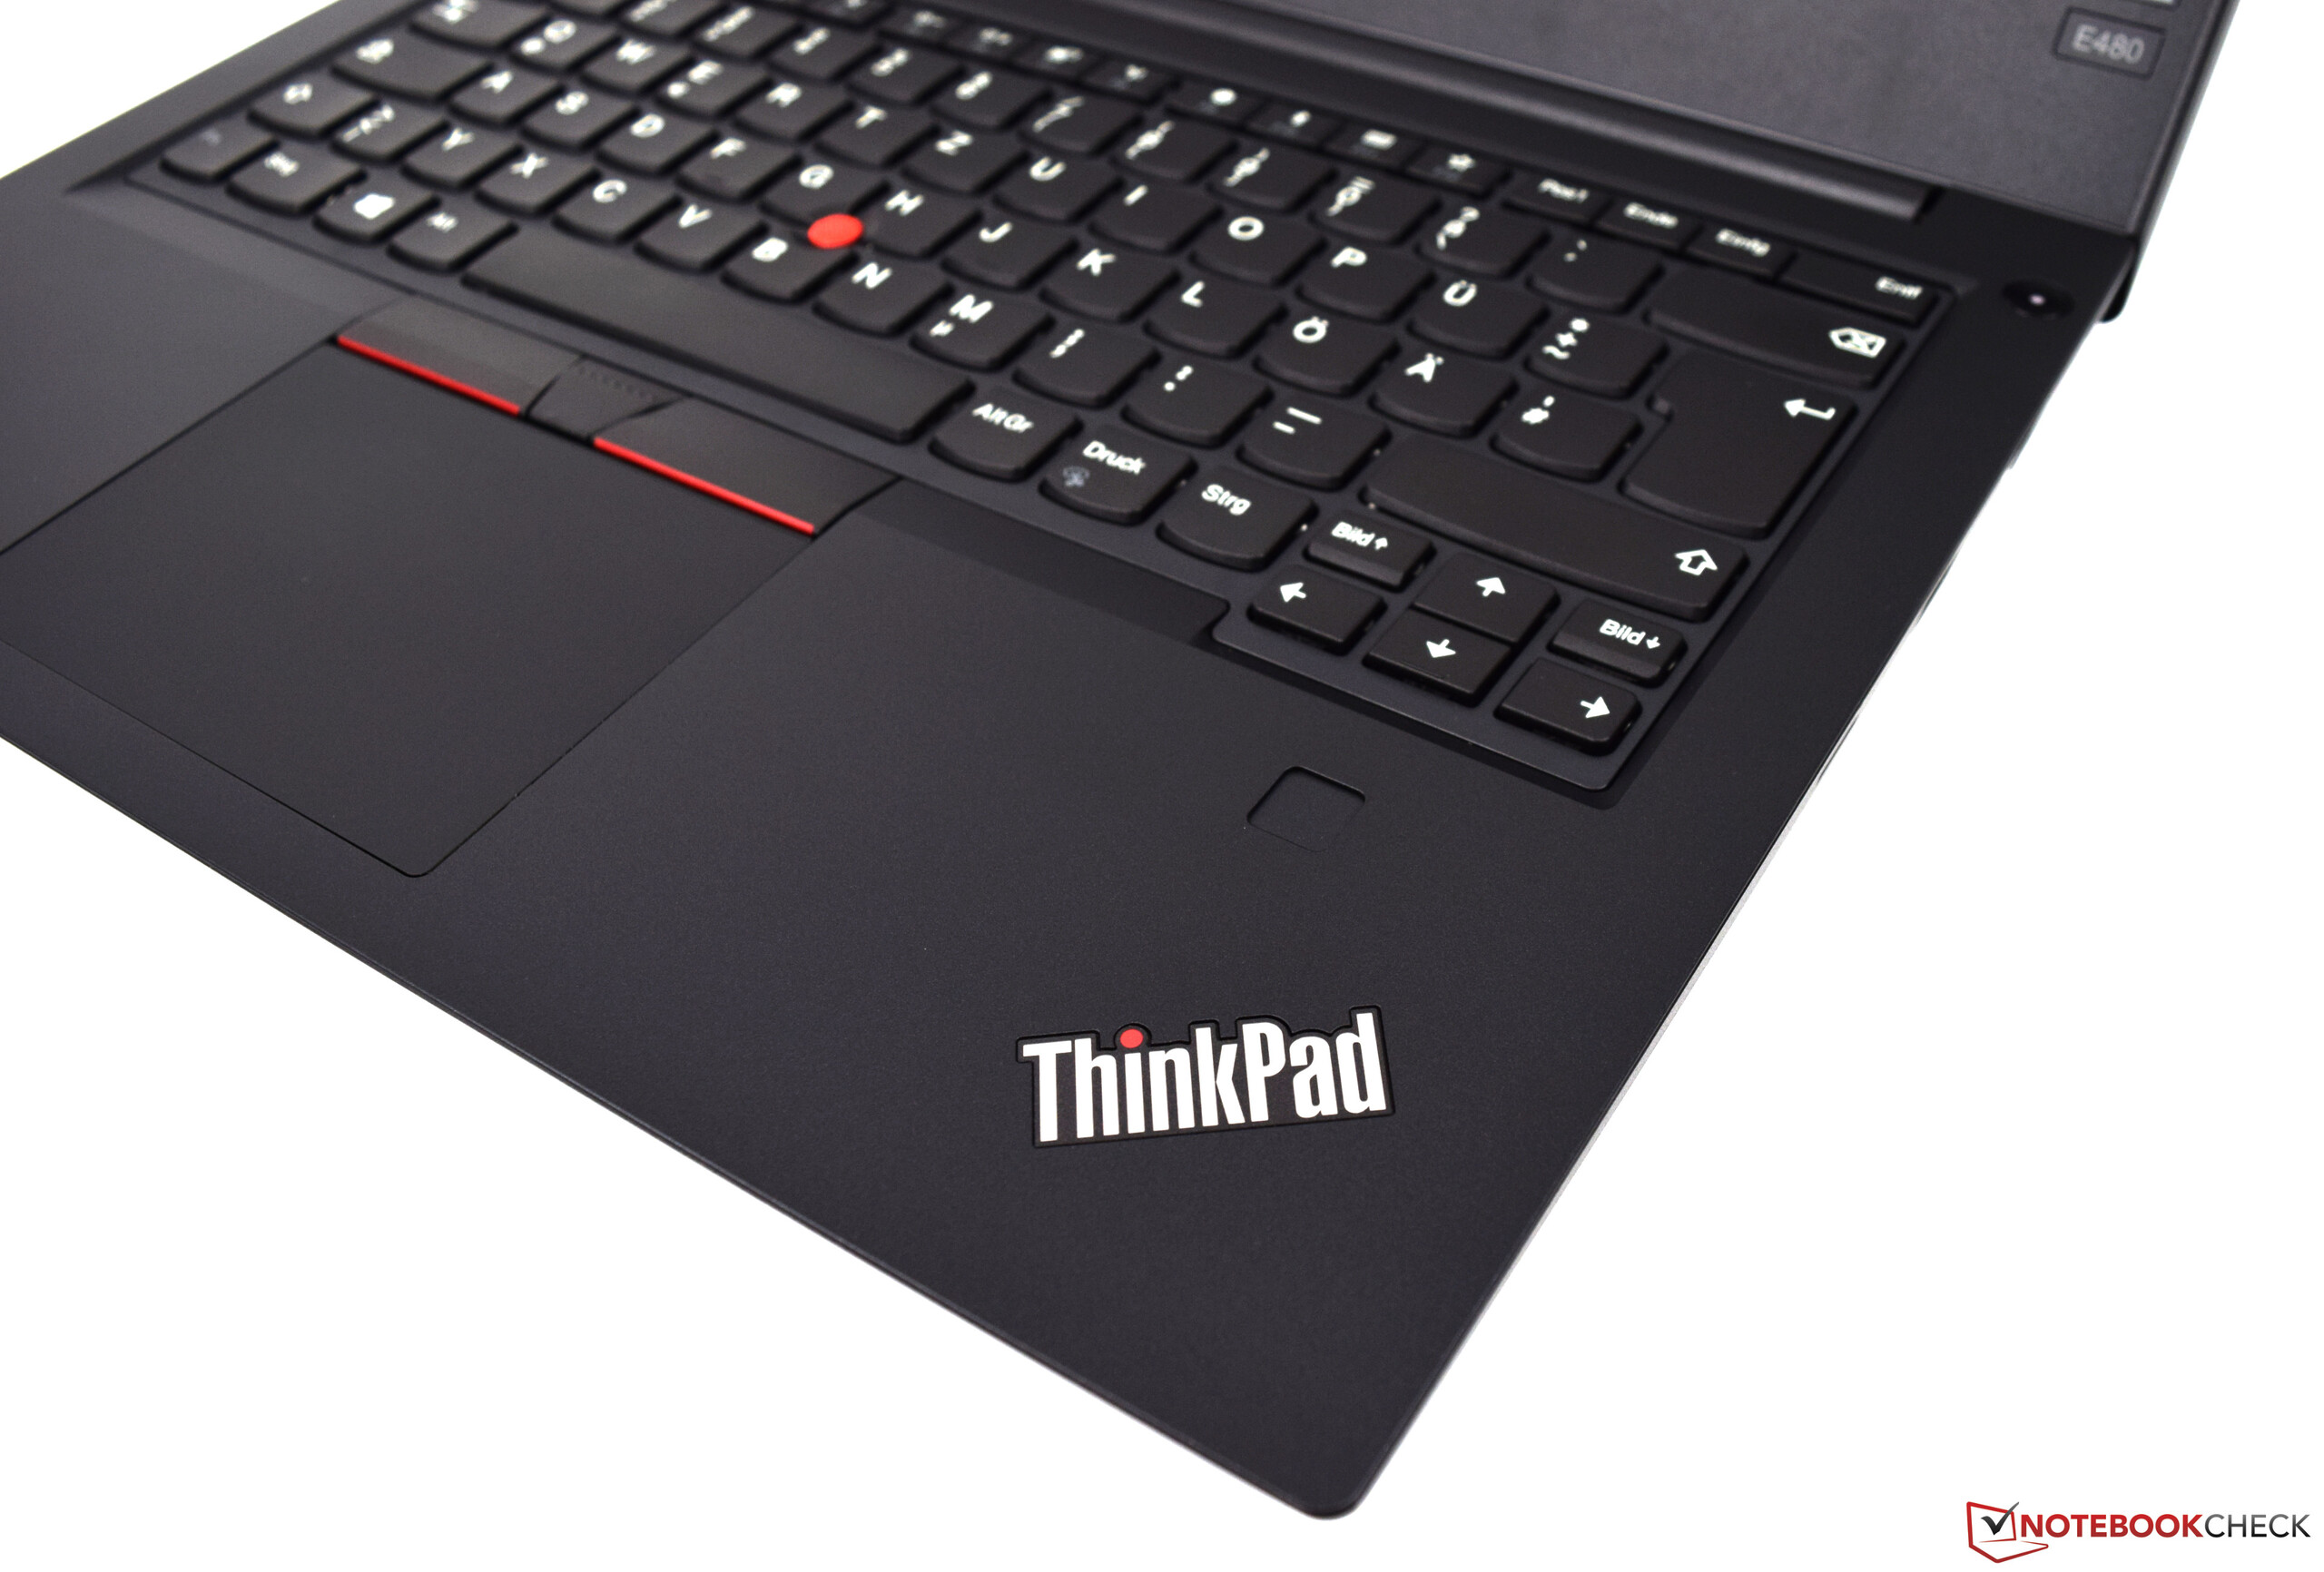
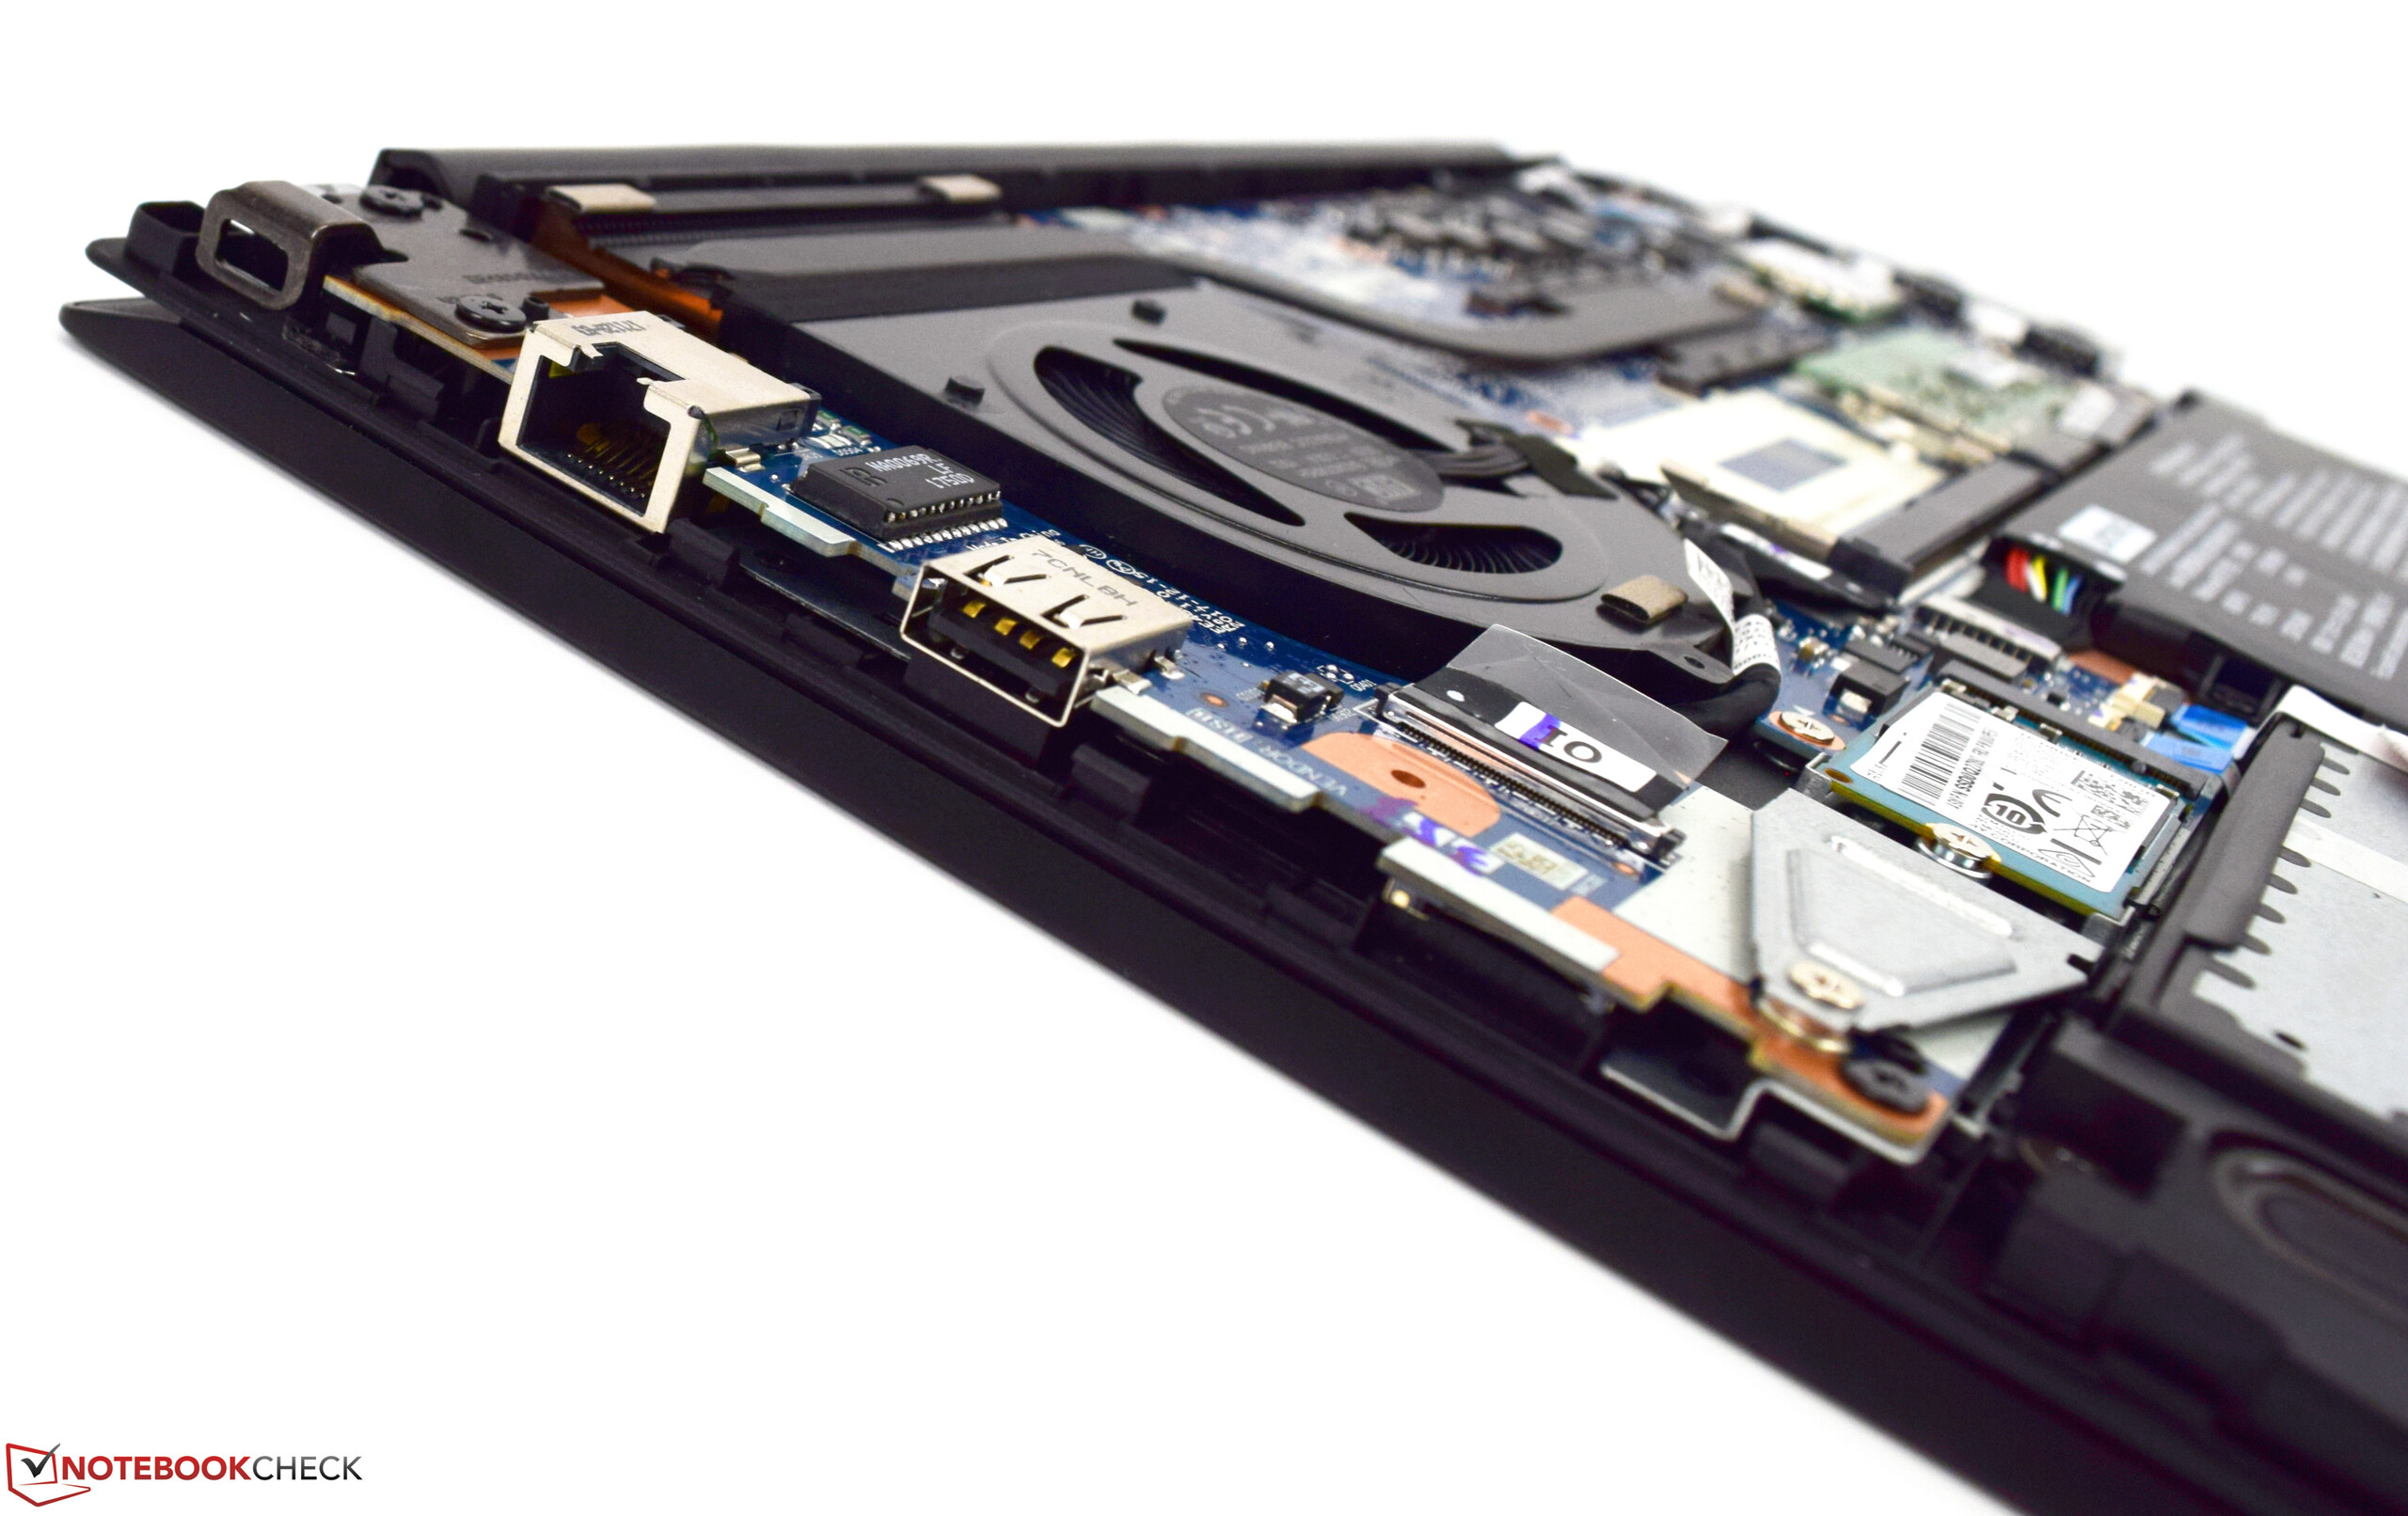
Lenovo ThinkPad E480 är välgjord och kommer med välkända inmatningsenheter som vi redan har berömt många gånger innan.
Lenovo ThinkPad E480-20KNCTO1WW
- 03/13/2018 v6 (old)
Sebastian Bade
Price comparison
