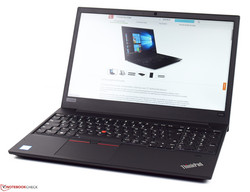
Test: Lenovo ThinkPad E580 (i5-8250U, UHD 620, SSD) Laptop (Sammanfattning)

| SD Card Reader | |
| average JPG Copy Test (av. of 3 runs) | |
| Schenker Slim 15 L17 (Toshiba Exceria Pro SDXC 64 GB UHS-II) | |
| HP ProBook 450 G5-2UB53EA (Toshiba Exceria Pro SDXC 64 GB UHS-II) | |
| Lenovo ThinkPad E580-20KSCTO1WW (Toshiba Exceria Pro M501) | |
| Lenovo ThinkPad E580-20KS001RGE (Toshiba Exceria Pro SDXC 64 GB UHS-II) | |
| Genomsnitt av klass Office (19.8 - 198.5, n=22, senaste 2 åren) | |
| Acer TravelMate P2510-M-51ZQ (Toshiba Exceria Pro SDXC 64 GB UHS-II) | |
| Dell Vostro 15 3568 (Toshiba Exceria Pro SDXC 64 GB UHS-II) | |
| maximum AS SSD Seq Read Test (1GB) | |
| HP ProBook 450 G5-2UB53EA (Toshiba Exceria Pro SDXC 64 GB UHS-II) | |
| Lenovo ThinkPad E580-20KSCTO1WW (Toshiba Exceria Pro M501) | |
| Schenker Slim 15 L17 (Toshiba Exceria Pro SDXC 64 GB UHS-II) | |
| Lenovo ThinkPad E580-20KS001RGE (Toshiba Exceria Pro SDXC 64 GB UHS-II) | |
| Genomsnitt av klass Office (27.4 - 249, n=21, senaste 2 åren) | |
| Acer TravelMate P2510-M-51ZQ (Toshiba Exceria Pro SDXC 64 GB UHS-II) | |
| Dell Vostro 15 3568 (Toshiba Exceria Pro SDXC 64 GB UHS-II) | |
| Networking | |
| iperf3 transmit AX12 | |
| Acer TravelMate P2510-M-51ZQ | |
| Lenovo ThinkPad E570-20H6S02M00 | |
| Schenker Slim 15 L17 | |
| HP ProBook 450 G5-2UB53EA | |
| Lenovo ThinkPad E580-20KS001RGE | |
| Dell Vostro 15 3568 | |
| Lenovo ThinkPad E580-20KSCTO1WW | |
| iperf3 receive AX12 | |
| HP ProBook 450 G5-2UB53EA | |
| Schenker Slim 15 L17 | |
| Acer TravelMate P2510-M-51ZQ | |
| Lenovo ThinkPad E570-20H6S02M00 | |
| Dell Vostro 15 3568 | |
| Lenovo ThinkPad E580-20KSCTO1WW | |
| Lenovo ThinkPad E580-20KS001RGE | |
| |||||||||||||||||||||||||
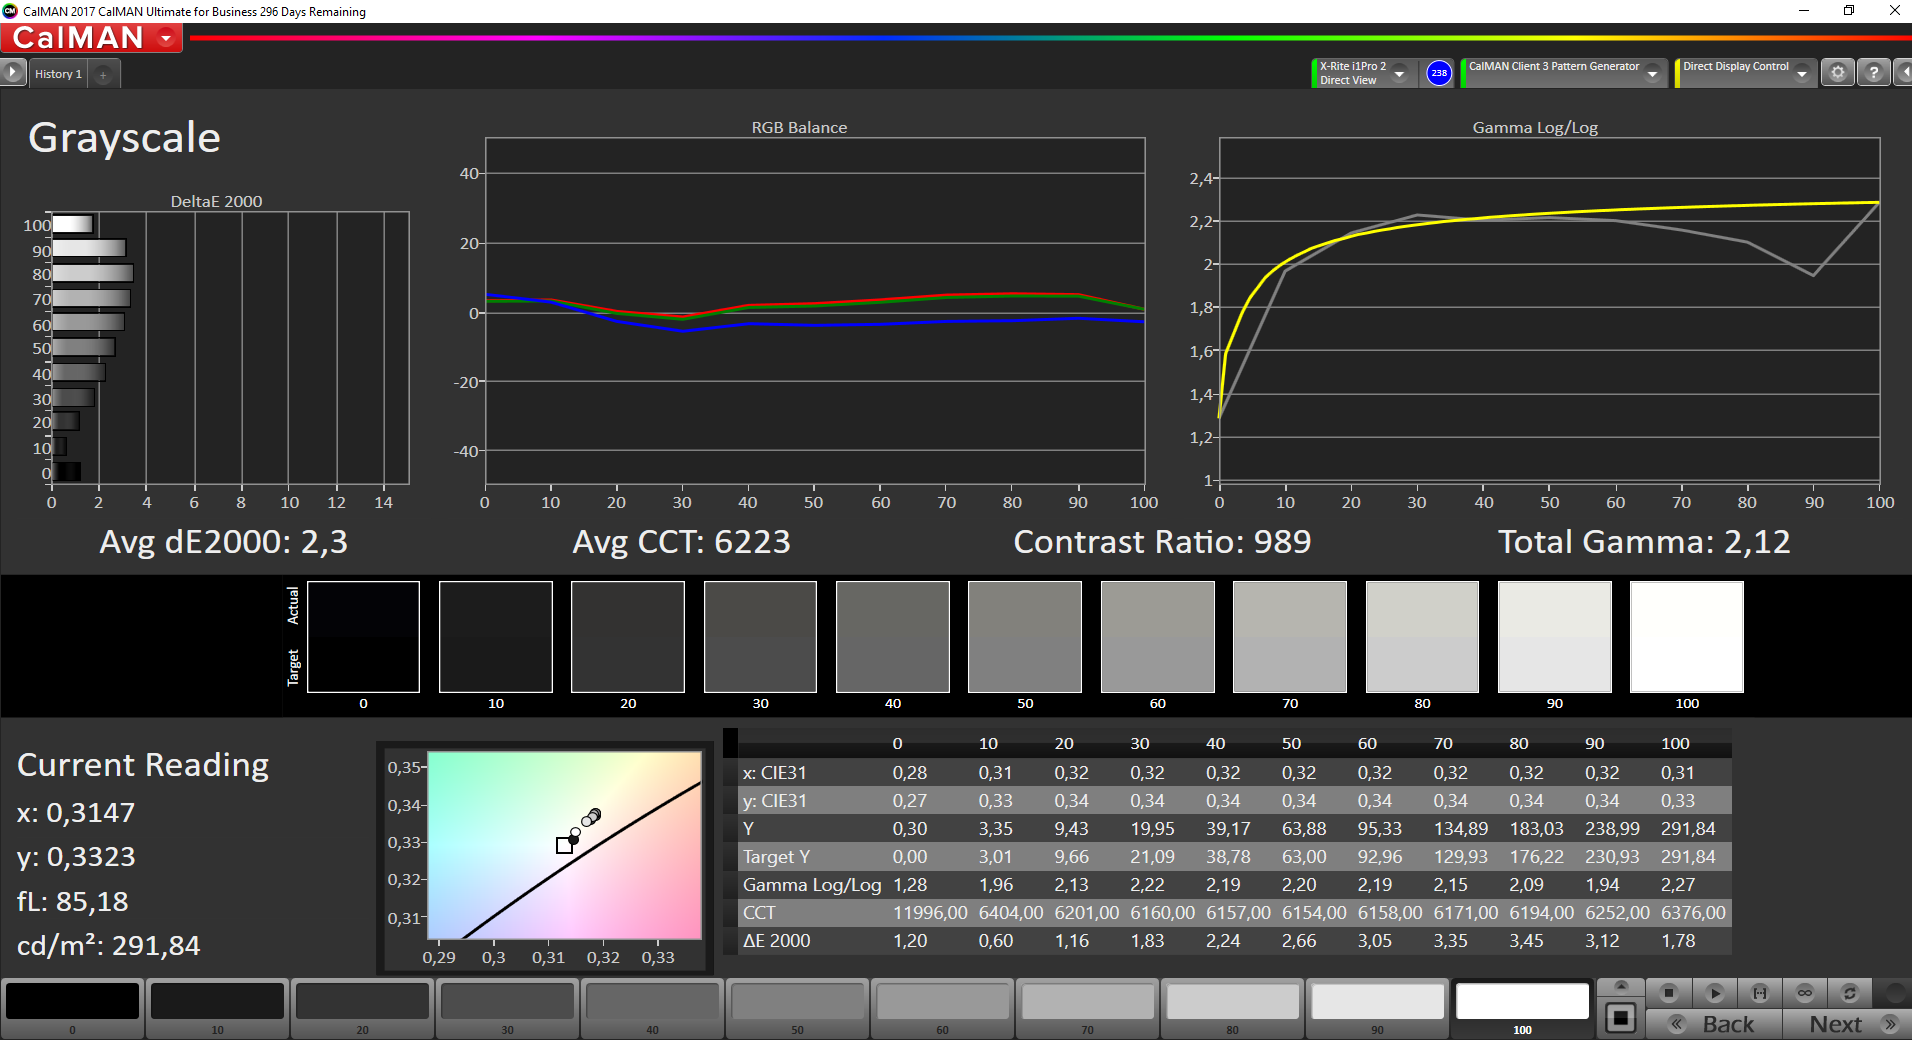
Distribution av ljusstyrkan: 84 %
Mitt på batteriet: 291 cd/m²
Kontrast: 973:1 (Svärta: 0.3 cd/m²)
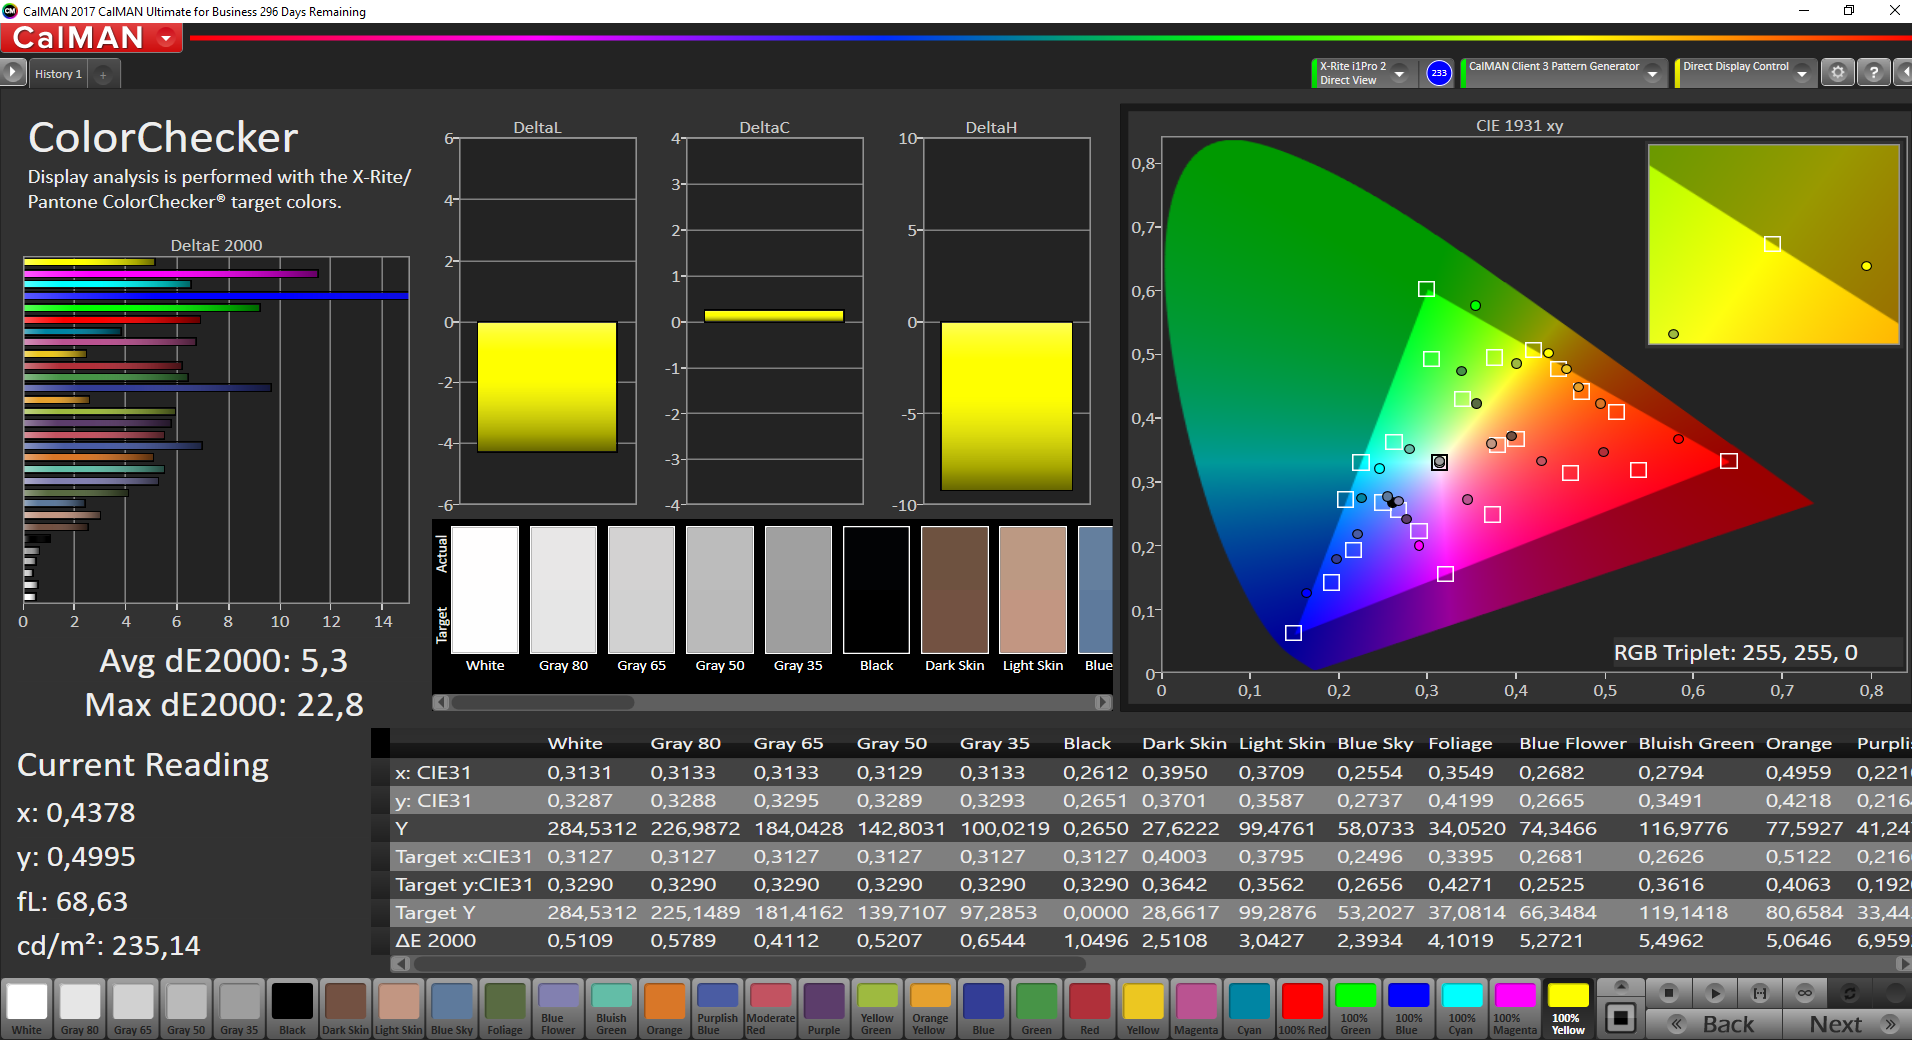
ΔE ColorChecker Calman: 5.8 | ∀{0.5-29.43 Ø4.71}
ΔE Greyscale Calman: 2.3 | ∀{0.09-98 Ø4.96}
58% sRGB (Argyll 1.6.3 3D)
37.6% AdobeRGB 1998 (Argyll 1.6.3 3D)
41.15% AdobeRGB 1998 (Argyll 3D)
58.5% sRGB (Argyll 3D)
39.83% Display P3 (Argyll 3D)
Gamma: 2.12
CCT: 6223 K
| Lenovo ThinkPad E580-20KSCTO1WW BOE NV156FHM-N49, , 1920x1080, 15.6" | Lenovo ThinkPad E580-20KS001RGE BOE NV156FHM-N49, , 1920x1080, 15.6" | Lenovo ThinkPad E570-20H6S02M00 Lenovo NT156WHM-N42, , 1366x768, 15.6" | HP ProBook 450 G5-2UB53EA AUO41ED, , 1920x1080, 15.6" | Acer TravelMate P2510-M-51ZQ Chi Mei CMN15D3 / N156HCE-EAA, , 1920x1080, 15.6" | Schenker Slim 15 L17 LG LP156WF6, , 1920x1080, 15.6" | Dell Vostro 15 3568 BOE0690 / NT15N41 / Dell C1JFR, , 1920x1080, 15.6" | |
|---|---|---|---|---|---|---|---|
| Display | -0% | -7% | -3% | 7% | 50% | -0% | |
| Display P3 Coverage (%) | 39.83 | 40 0% | 36.79 -8% | 38.04 -4% | 42.44 7% | 63.9 60% | 39.39 -1% |
| sRGB Coverage (%) | 58.5 | 58.2 -1% | 55.4 -5% | 57.3 -2% | 63.2 8% | 82.8 42% | 59.3 1% |
| AdobeRGB 1998 Coverage (%) | 41.15 | 41.32 0% | 38.01 -8% | 39.31 -4% | 43.94 7% | 60.5 47% | 40.69 -1% |
| Response Times | 8% | 35% | -2% | 11% | 20% | 45% | |
| Response Time Grey 50% / Grey 80% * (ms) | 48.4 ? | 48 ? 1% | 46 ? 5% | 52.4 ? -8% | 45 ? 7% | 40 ? 17% | 39 ? 19% |
| Response Time Black / White * (ms) | 37.6 ? | 32 ? 15% | 13 ? 65% | 36 ? 4% | 32 ? 15% | 29.2 ? 22% | 11 ? 71% |
| PWM Frequency (Hz) | 22030 ? | 25000 ? | 200 ? | 25000 ? | 20660 ? | 28410 ? | |
| Screen | 13% | -76% | -18% | -11% | 17% | -74% | |
| Brightness middle (cd/m²) | 292 | 290 -1% | 242 -17% | 252 -14% | 215 -26% | 333 14% | 195 -33% |
| Brightness (cd/m²) | 272 | 267 -2% | 233 -14% | 249 -8% | 198 -27% | 336 24% | 195 -28% |
| Brightness Distribution (%) | 84 | 81 -4% | 73 -13% | 88 5% | 78 -7% | 93 11% | 89 6% |
| Black Level * (cd/m²) | 0.3 | 0.19 37% | 0.59 -97% | 0.22 27% | 0.32 -7% | 0.3 -0% | 0.44 -47% |
| Contrast (:1) | 973 | 1526 57% | 410 -58% | 1145 18% | 672 -31% | 1110 14% | 443 -54% |
| Colorchecker dE 2000 * | 5.8 | 4.9 16% | 10.9 -88% | 6.9 -19% | 5.15 11% | 4.7 19% | 12.23 -111% |
| Colorchecker dE 2000 max. * | 22.4 | 9.52 57% | 20.84 7% | 18.4 18% | 10.89 51% | 9.7 57% | 20.85 7% |
| Greyscale dE 2000 * | 2.3 | 2.92 -27% | 13.07 -468% | 6.9 -200% | 4.25 -85% | 3.5 -52% | 13.39 -482% |
| Gamma | 2.12 104% | 2.31 95% | 2.37 93% | 2.43 91% | 2.61 84% | 2.26 97% | 2.5 88% |
| CCT | 6223 104% | 6091 107% | 13123 50% | 7524 86% | 6603 98% | 6339 103% | 15759 41% |
| Color Space (Percent of AdobeRGB 1998) (%) | 37.6 | 37 -2% | 35 -7% | 36.3 -3% | 40 6% | 54.2 44% | 38 1% |
| Color Space (Percent of sRGB) (%) | 58 | 58 0% | 55 -5% | 57.2 -1% | 63 9% | 82.7 43% | 59 2% |
| Totalt genomsnitt (program/inställningar) | 7% /
10% | -16% /
-47% | -8% /
-13% | 2% /
-4% | 29% /
24% | -10% /
-43% |
* ... mindre är bättre


Visa svarstider
| ↔ Svarstid svart till vitt | ||
|---|---|---|
| 37.6 ms ... stiga ↗ och falla ↘ kombinerat | ↗ 21.2 ms stiga | 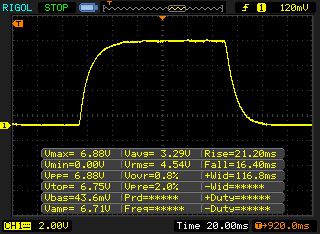 |
| ↘ 16.4 ms hösten | ||
| Skärmen visar långsamma svarsfrekvenser i våra tester och kommer att vara otillfredsställande för spelare. I jämförelse sträcker sig alla testade enheter från 0.1 (minst) till 240 (maximalt) ms. » 95 % av alla enheter är bättre. Detta innebär att den uppmätta svarstiden är sämre än genomsnittet av alla testade enheter (19.8 ms). | ||
| ↔ Svarstid 50 % grått till 80 % grått | ||
| 48.4 ms ... stiga ↗ och falla ↘ kombinerat | ↗ 25.6 ms stiga | 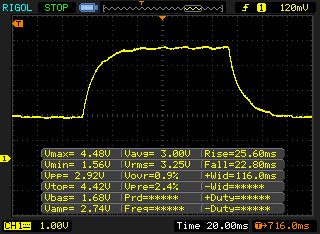 |
| ↘ 22.8 ms hösten | ||
| Skärmen visar långsamma svarsfrekvenser i våra tester och kommer att vara otillfredsställande för spelare. I jämförelse sträcker sig alla testade enheter från 0.165 (minst) till 636 (maximalt) ms. » 84 % av alla enheter är bättre. Detta innebär att den uppmätta svarstiden är sämre än genomsnittet av alla testade enheter (31 ms). | ||
Skärmflimmer / PWM (Puls-Width Modulation)
| Skärmflimmer / PWM upptäckt | 22030 Hz | ≤ 99 % ljusstyrka inställning | 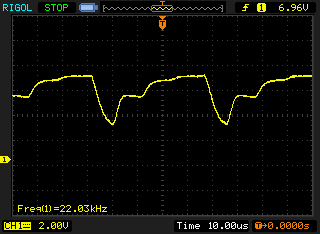 |
Displayens bakgrundsbelysning flimrar vid 22030 Hz (i värsta fall, t.ex. med PWM) Flimrande upptäckt vid en ljusstyrkeinställning på 99 % och lägre. Det ska inte finnas något flimmer eller PWM över denna ljusstyrkeinställning. Frekvensen för 22030 Hz är ganska hög, så de flesta användare som är känsliga för PWM bör inte märka något flimmer. Som jämförelse: 52 % av alla testade enheter använder inte PWM för att dämpa skärmen. Om PWM upptäcktes mättes ett medelvärde av 7754 (minst: 5 - maximum: 343500) Hz. | |||
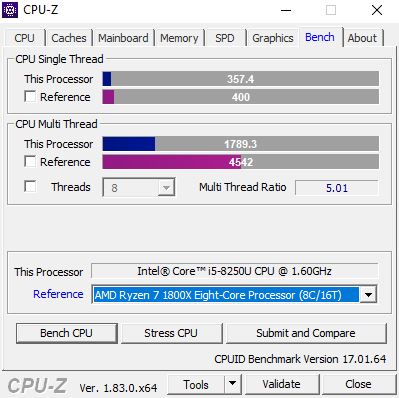
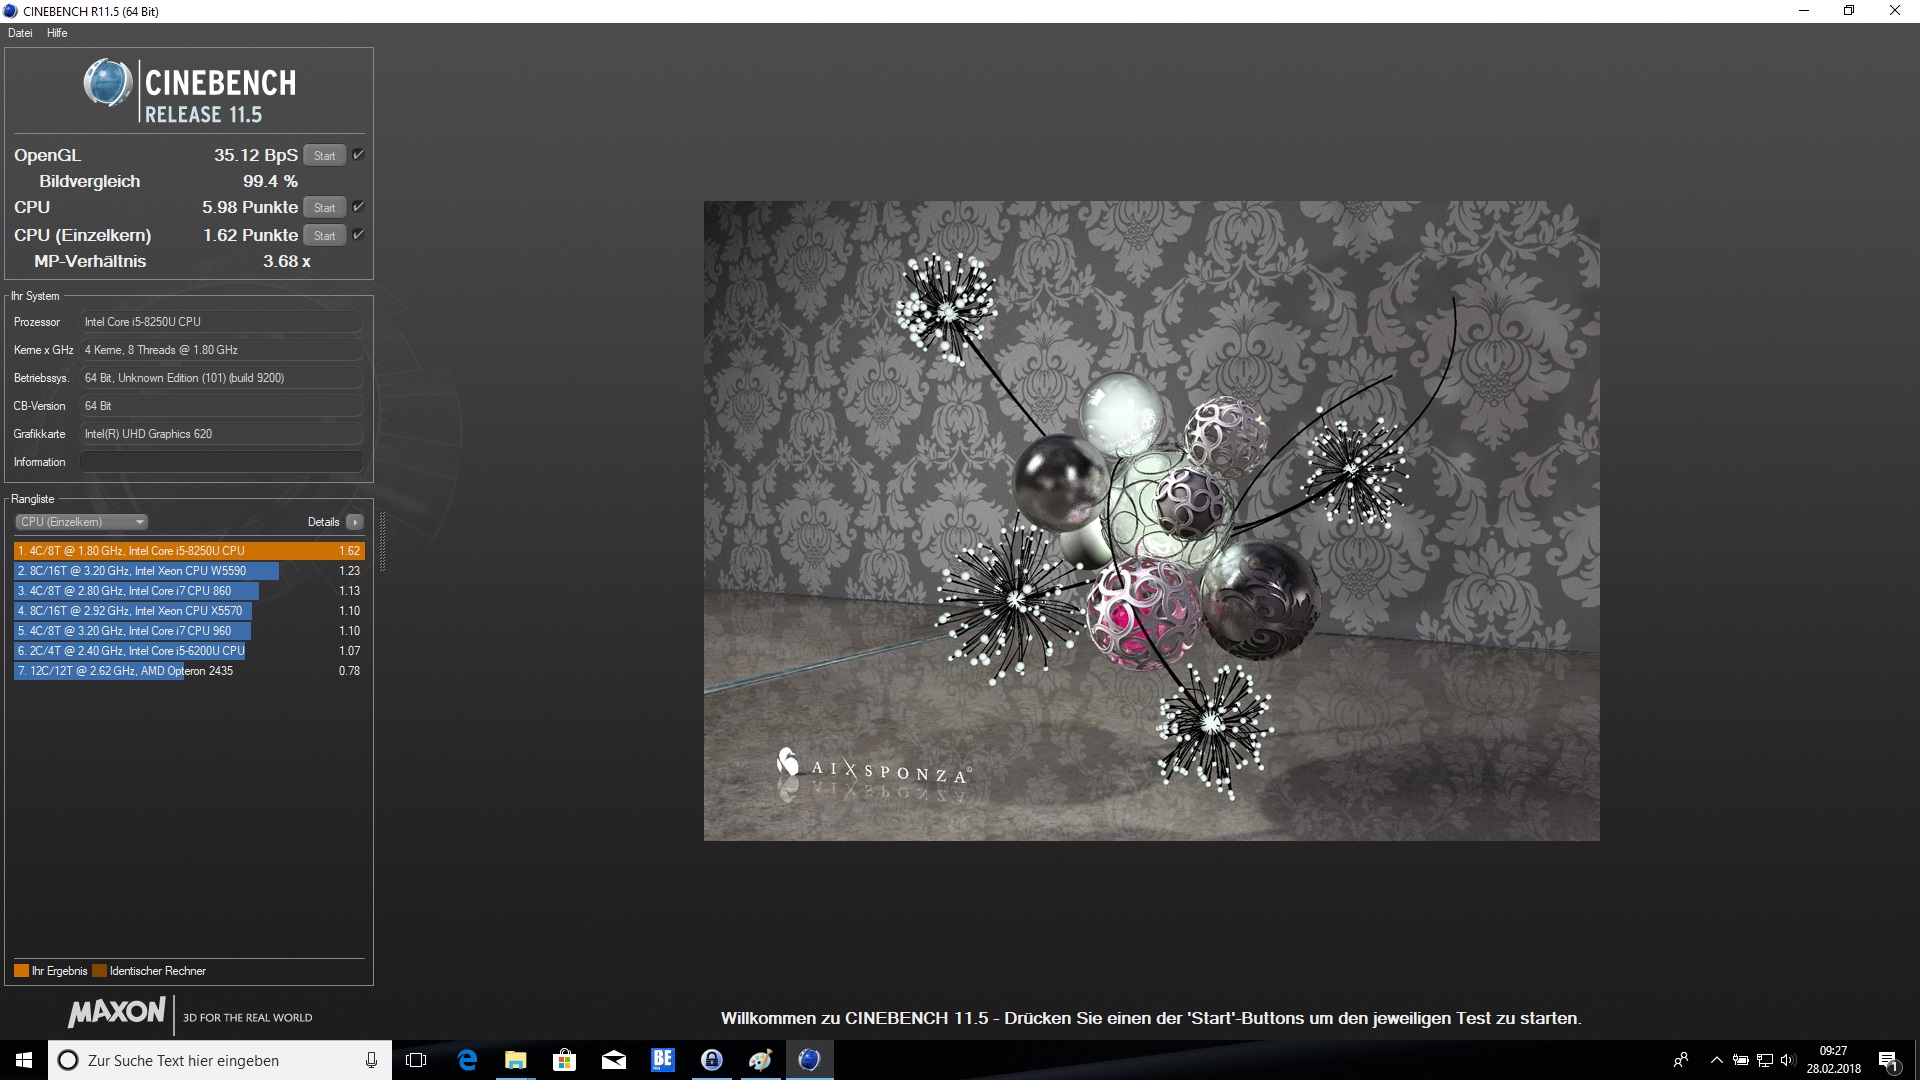
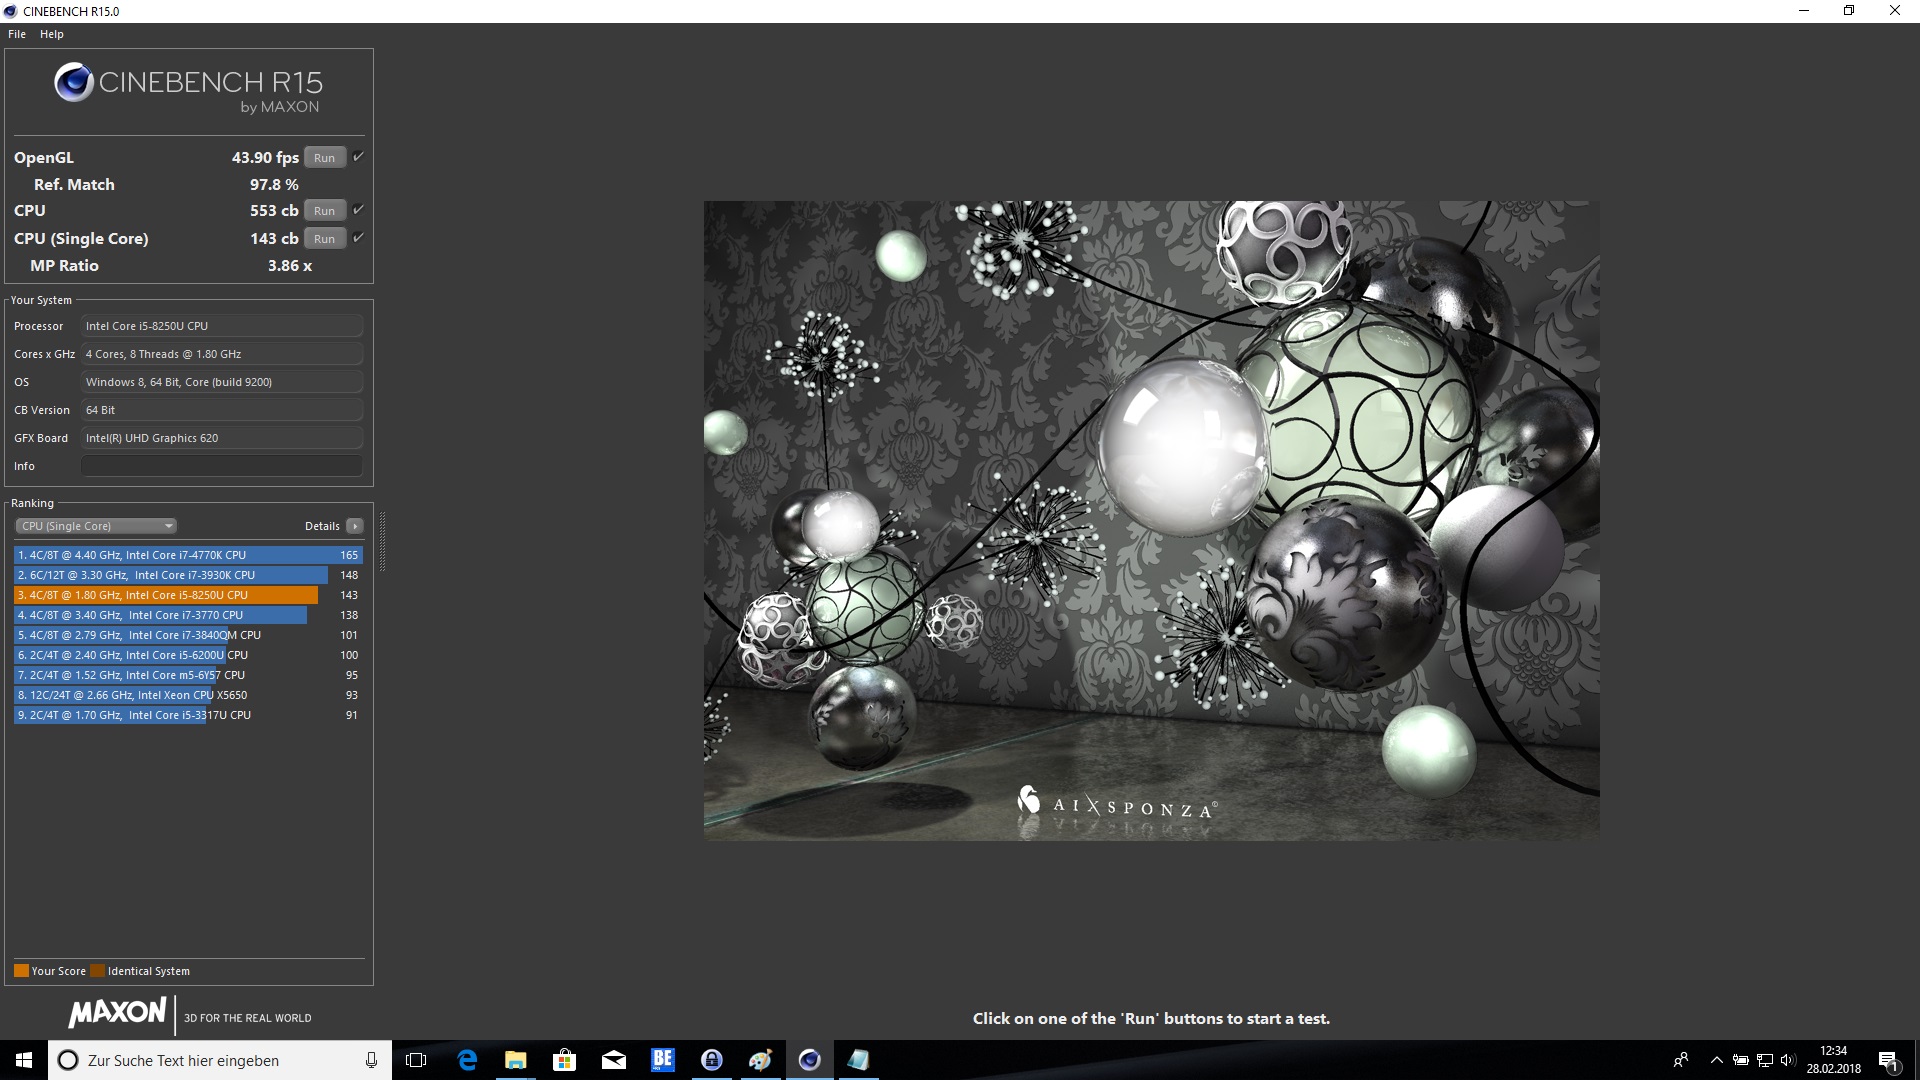
| Cinebench R11.5 | |
| CPU Single 64Bit | |
| Genomsnitt av klass Office (2 - 3.6, n=14, senaste 2 åren) | |
| Schenker Slim 15 L17 | |
| Lenovo ThinkPad E580-20KSCTO1WW | |
| Genomsnitt Intel Core i5-8250U (0.91 - 1.79, n=35) | |
| Lenovo ThinkPad E570-20H6S02M00 | |
| CPU Multi 64Bit | |
| Genomsnitt av klass Office (9.76 - 31.5, n=14, senaste 2 åren) | |
| Genomsnitt Intel Core i5-8250U (3.15 - 7.76, n=35) | |
| Lenovo ThinkPad E580-20KSCTO1WW | |
| Schenker Slim 15 L17 | |
| Lenovo ThinkPad E570-20H6S02M00 | |
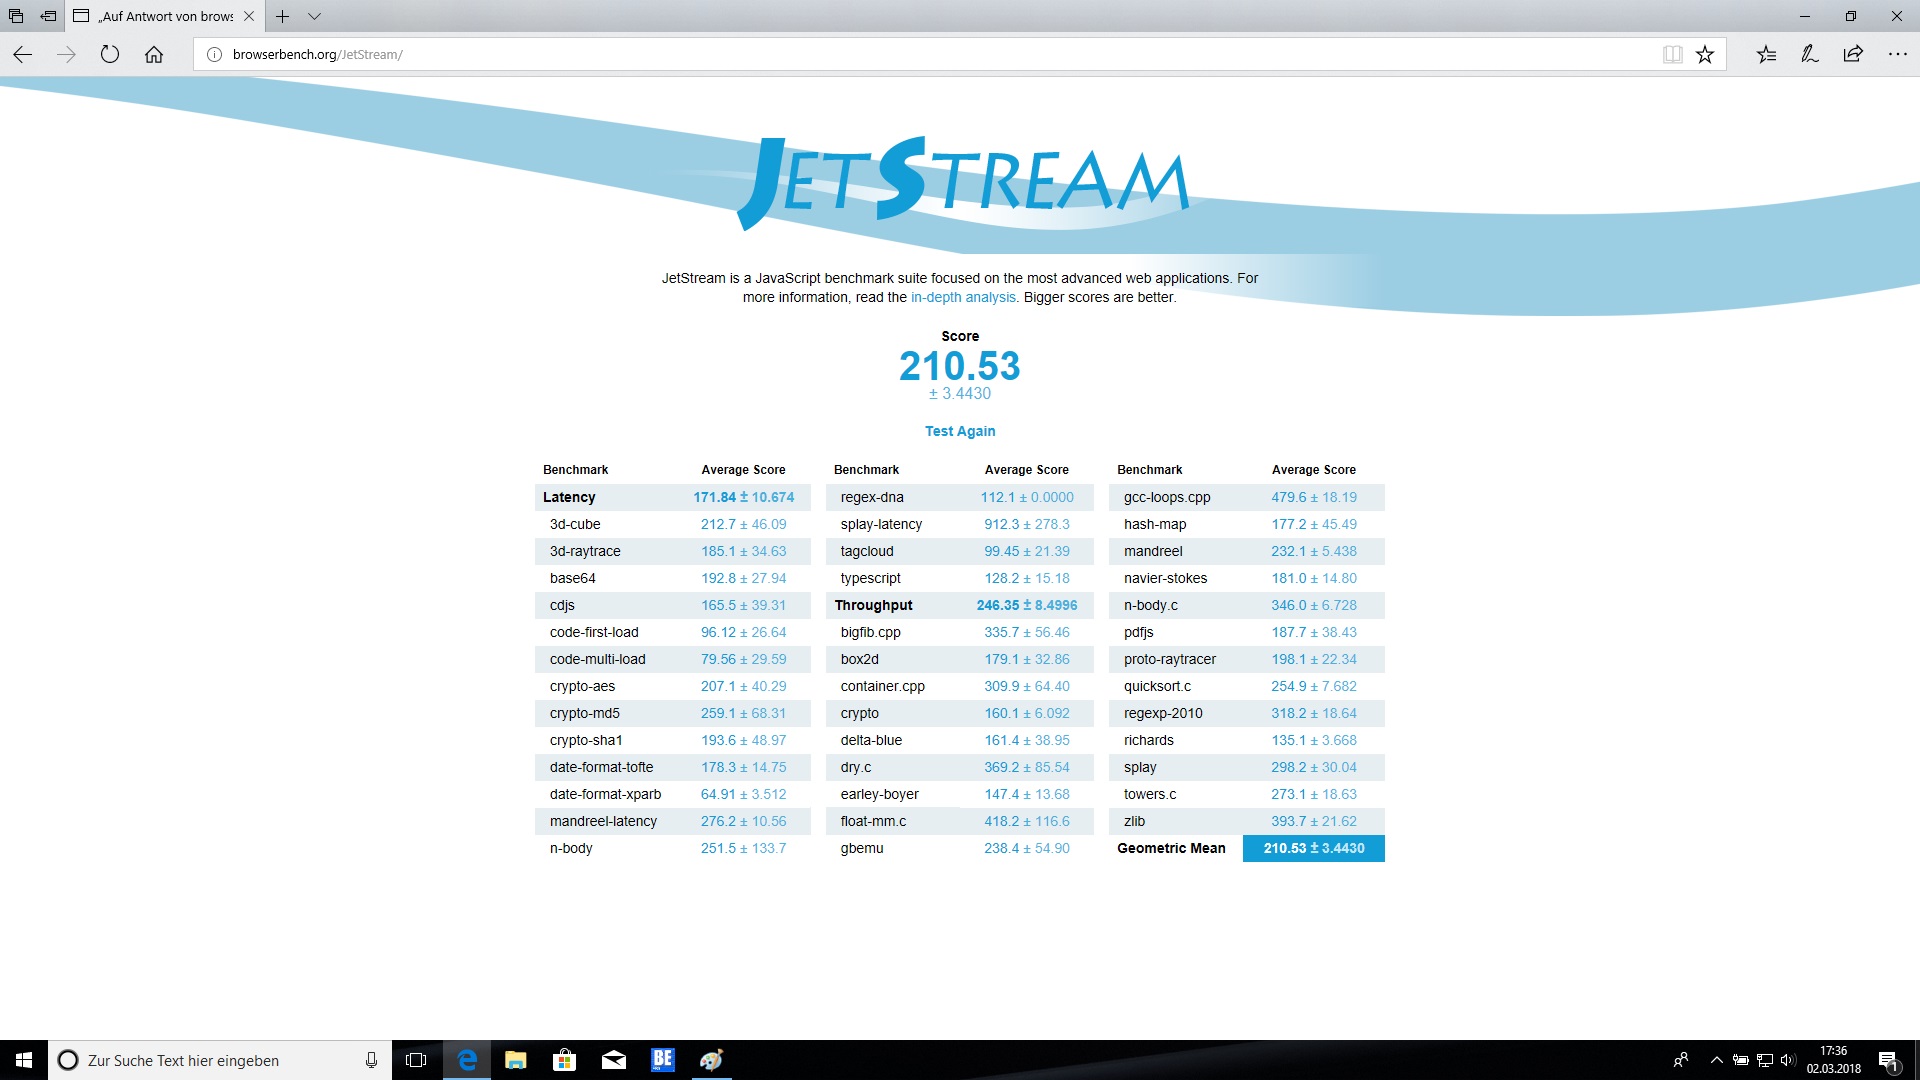
| JetStream 1.1 - 1.1 Total | |
| Lenovo ThinkPad E580-20KS001RGE | |
| Schenker Slim 15 L17 | |
| HP ProBook 450 G5-2UB53EA | |
| Genomsnitt Intel Core i5-8250U (151.5 - 256, n=78) | |
| Lenovo ThinkPad E570-20H6S02M00 | |
| Lenovo ThinkPad E580-20KSCTO1WW | |
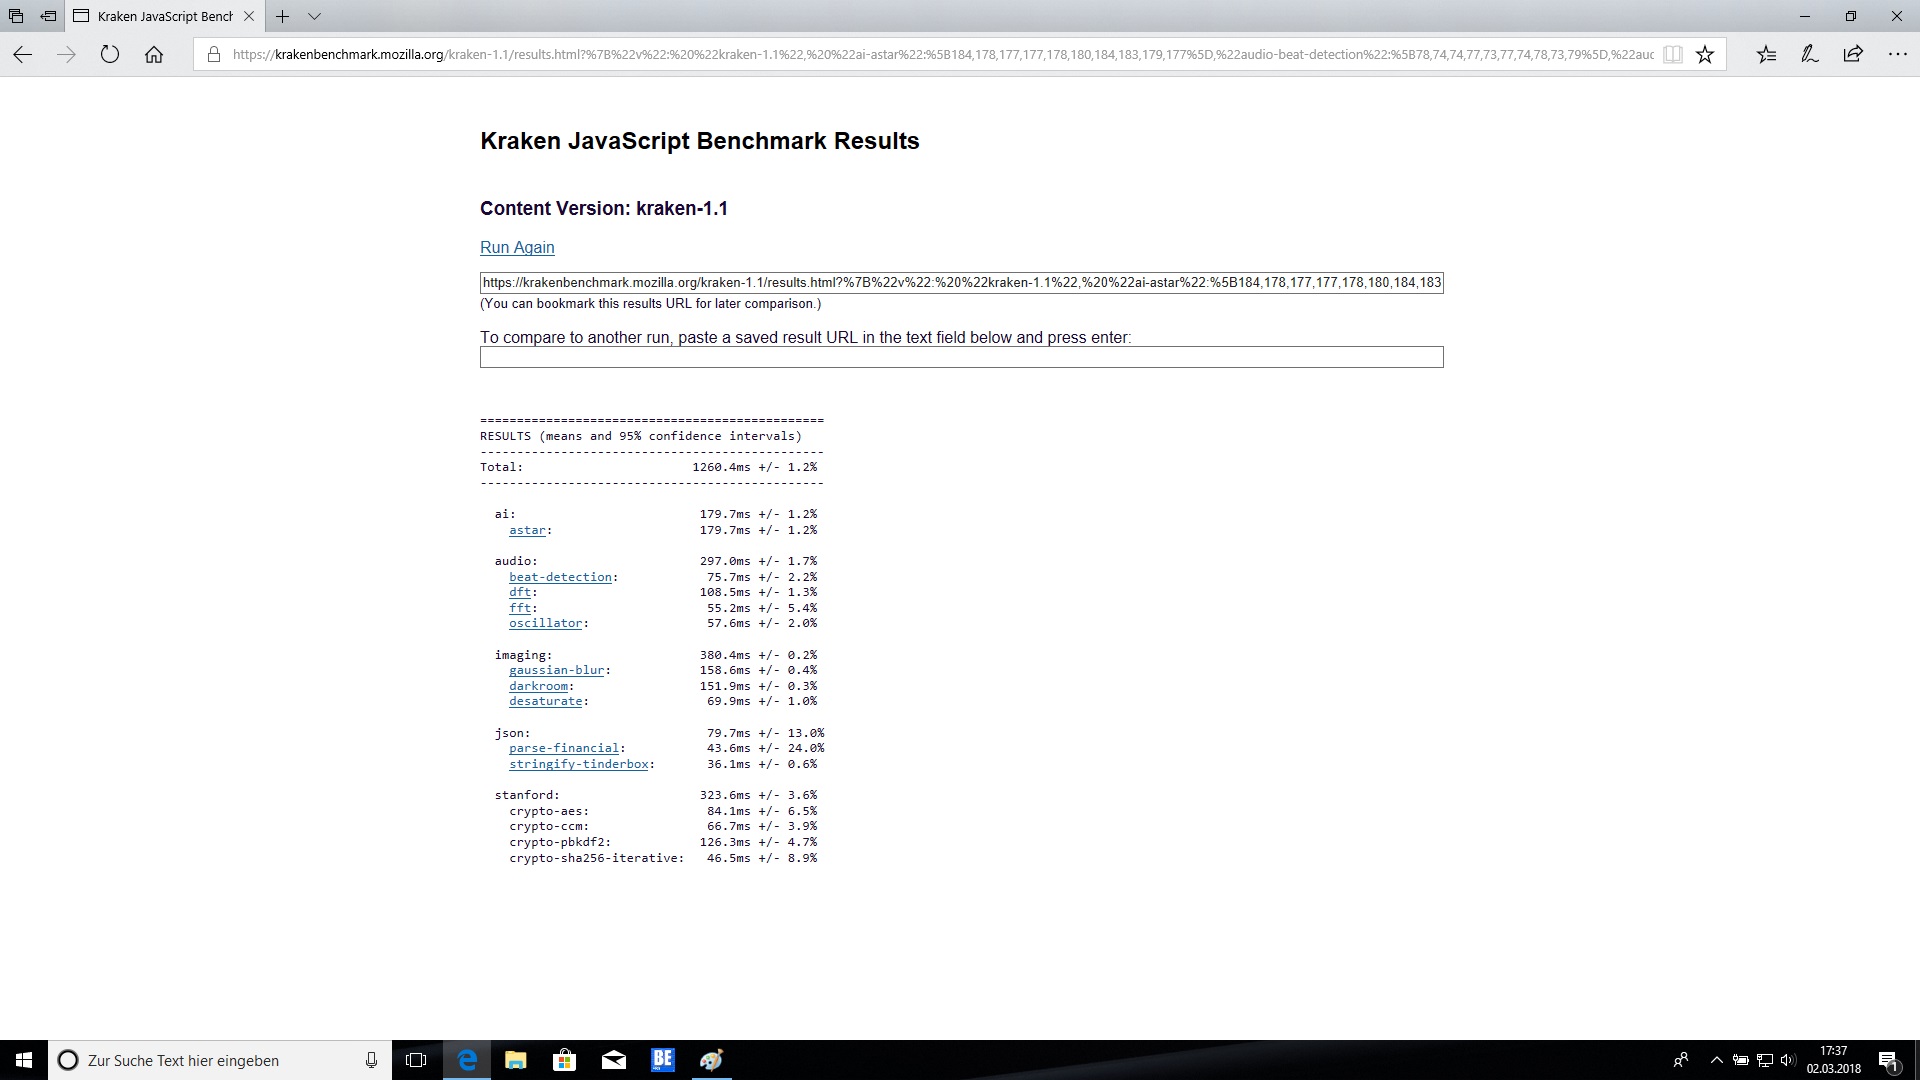
| Mozilla Kraken 1.1 - Total | |
| Lenovo ThinkPad E580-20KSCTO1WW | |
| Genomsnitt Intel Core i5-8250U (986 - 1532, n=59) | |
| Lenovo ThinkPad E570-20H6S02M00 | |
| Schenker Slim 15 L17 | |
| Lenovo ThinkPad E580-20KS001RGE | |
| Genomsnitt av klass Office (391 - 1297, n=78, senaste 2 åren) | |
* ... mindre är bättre
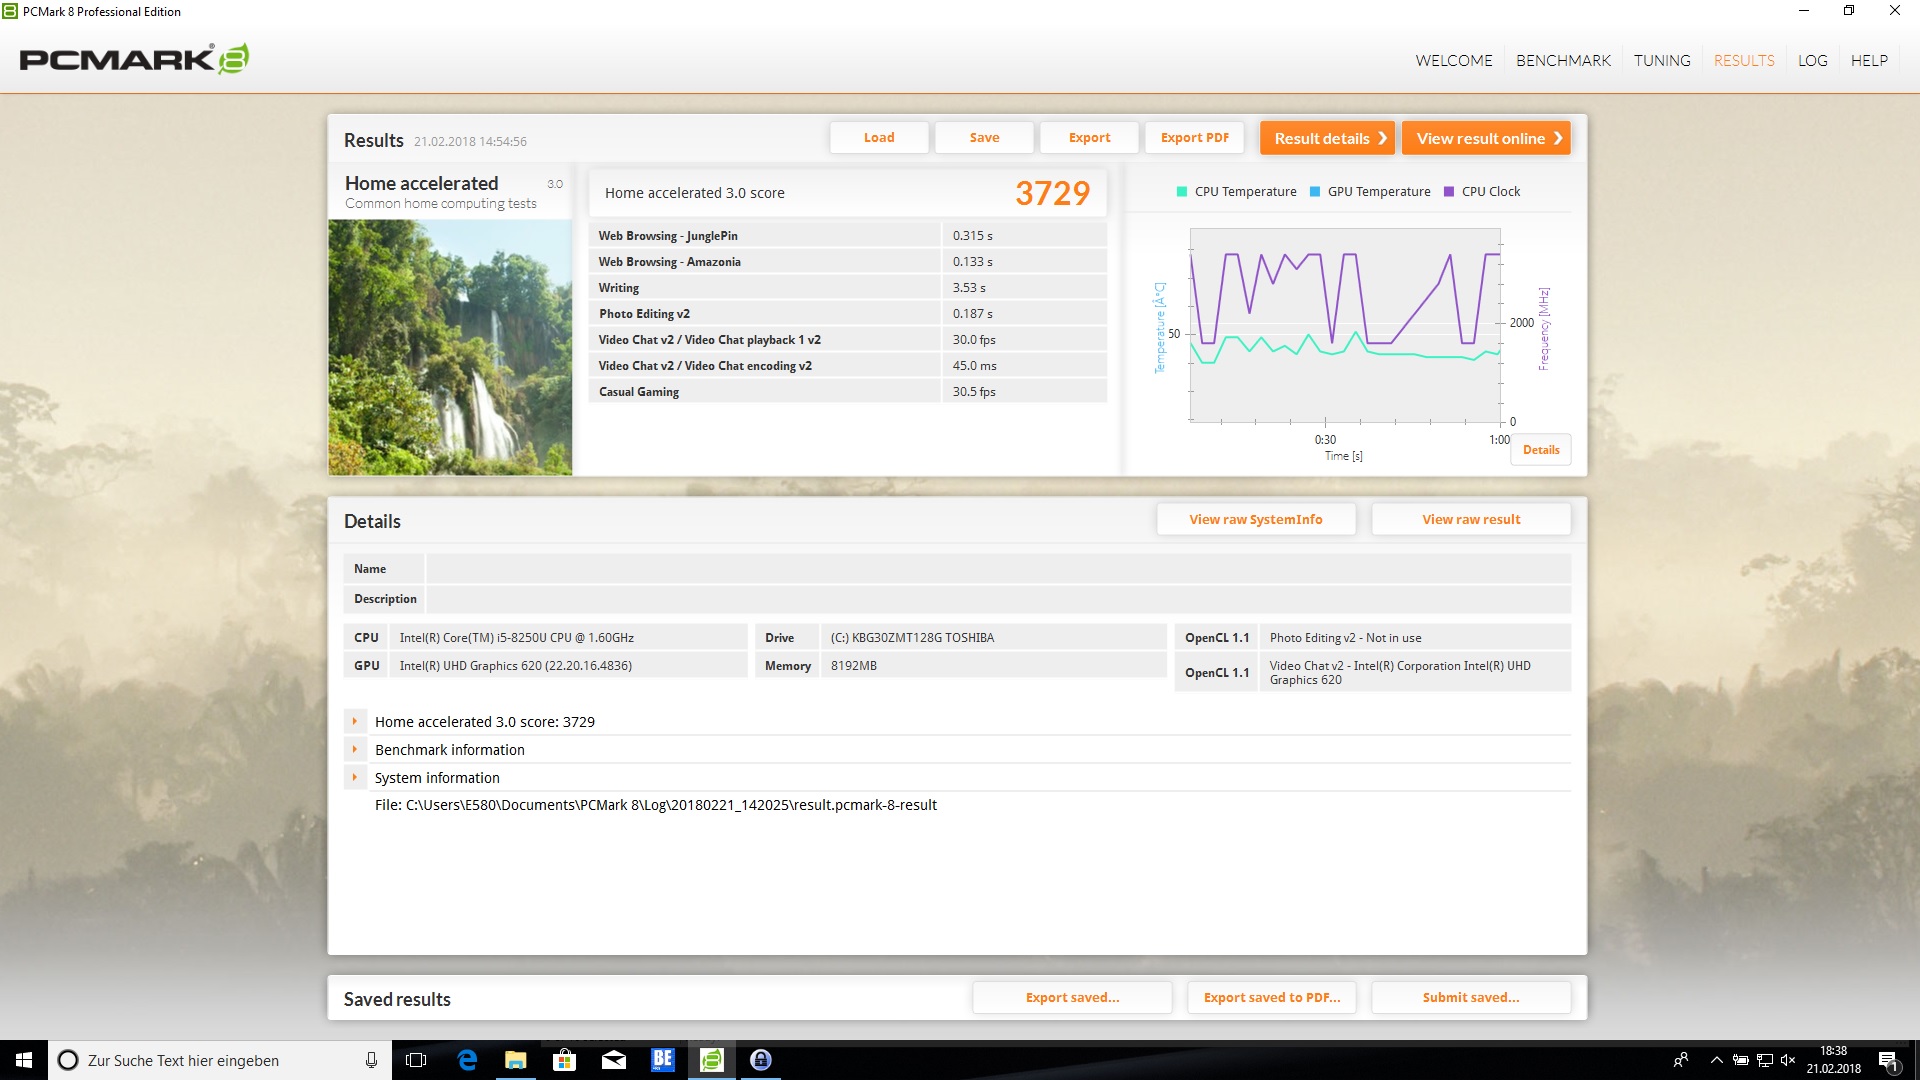
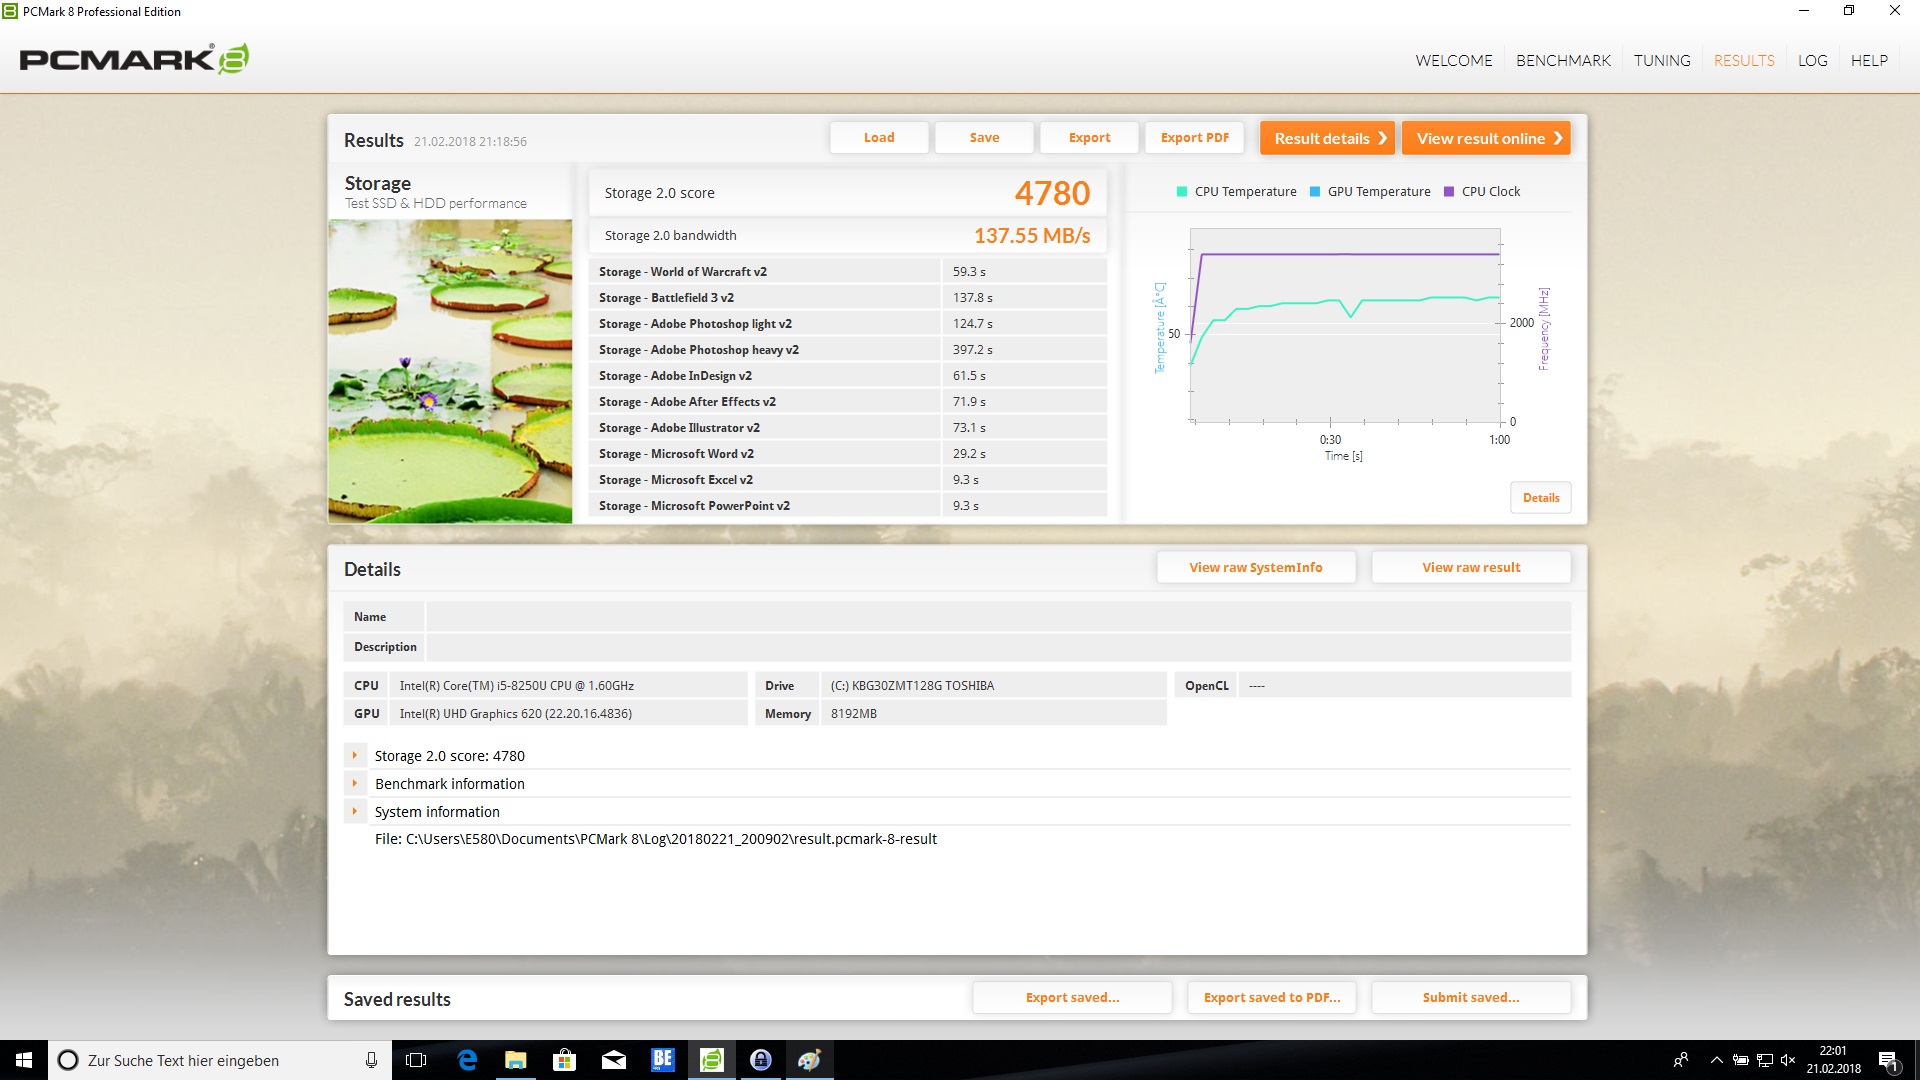
| PCMark 8 Home Score Accelerated v2 | 3729 poäng | |
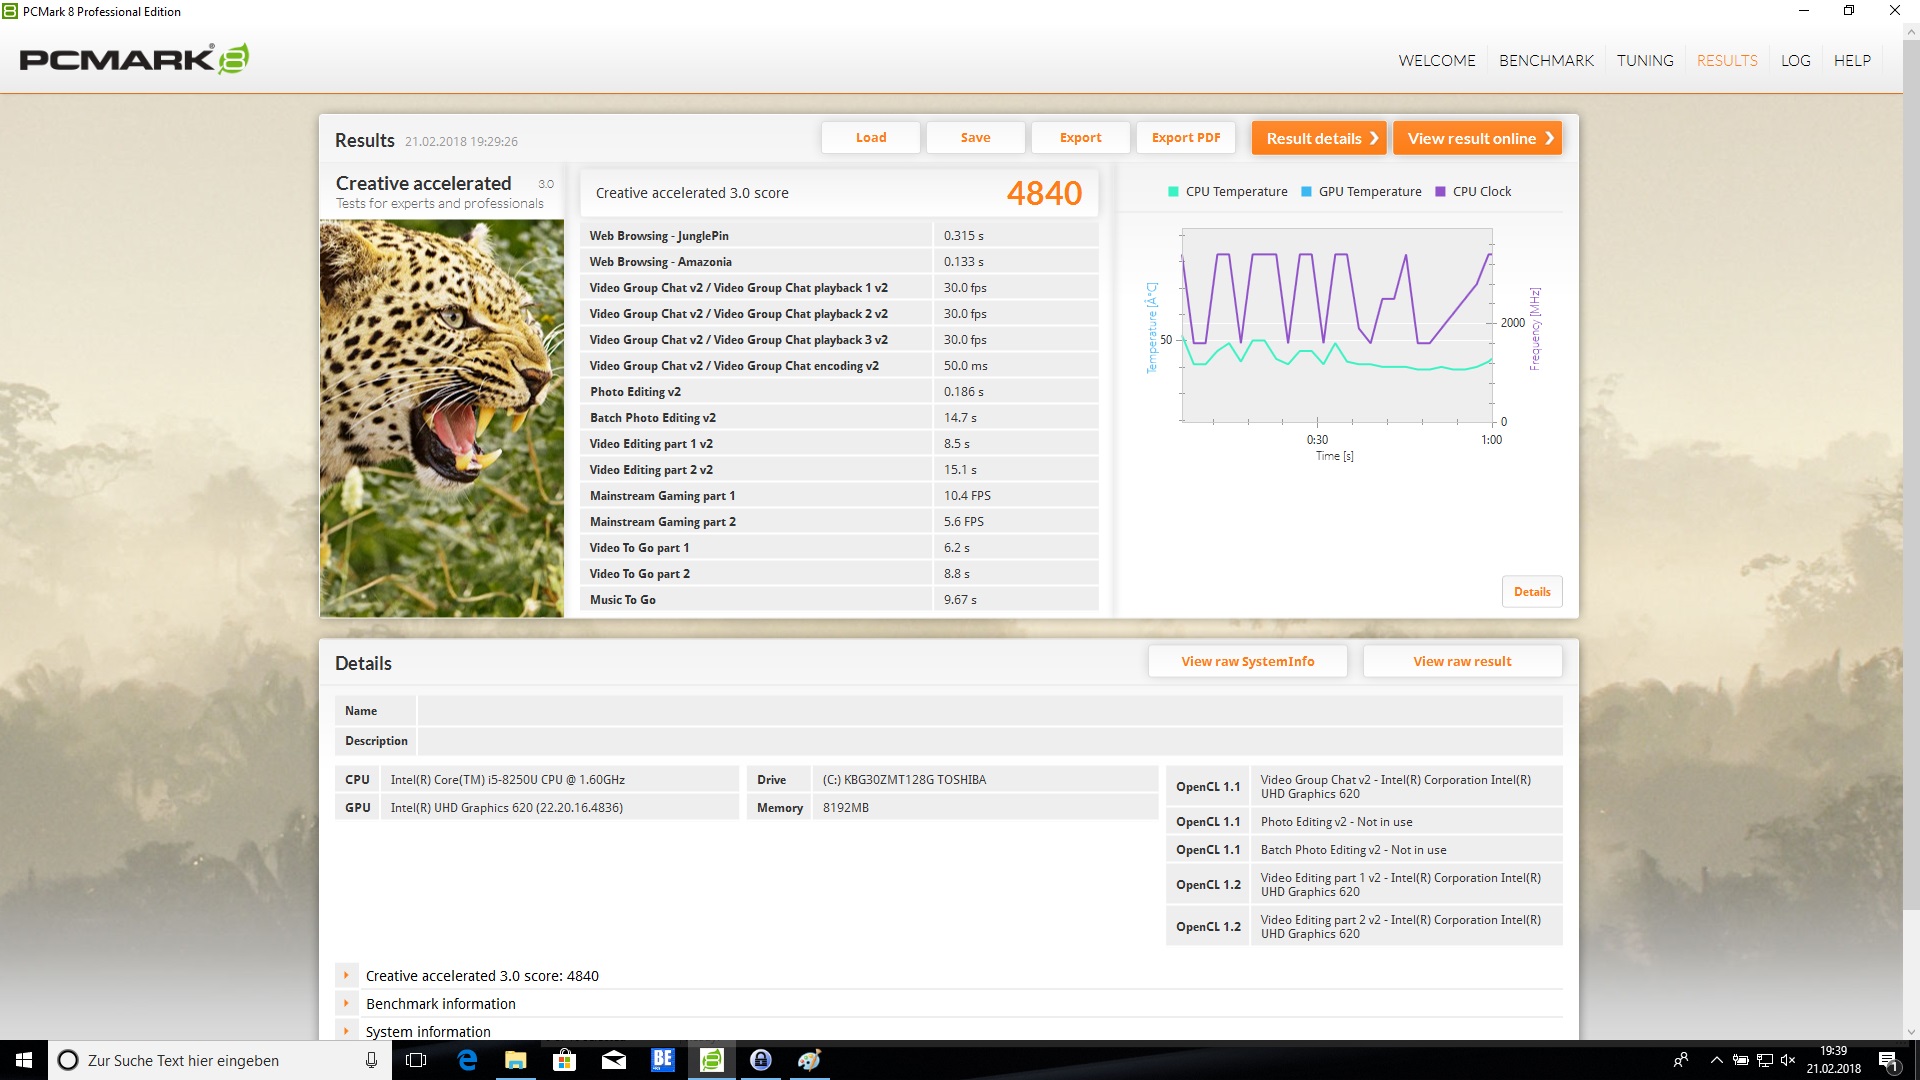
| PCMark 8 Creative Score Accelerated v2 | 4840 poäng | |
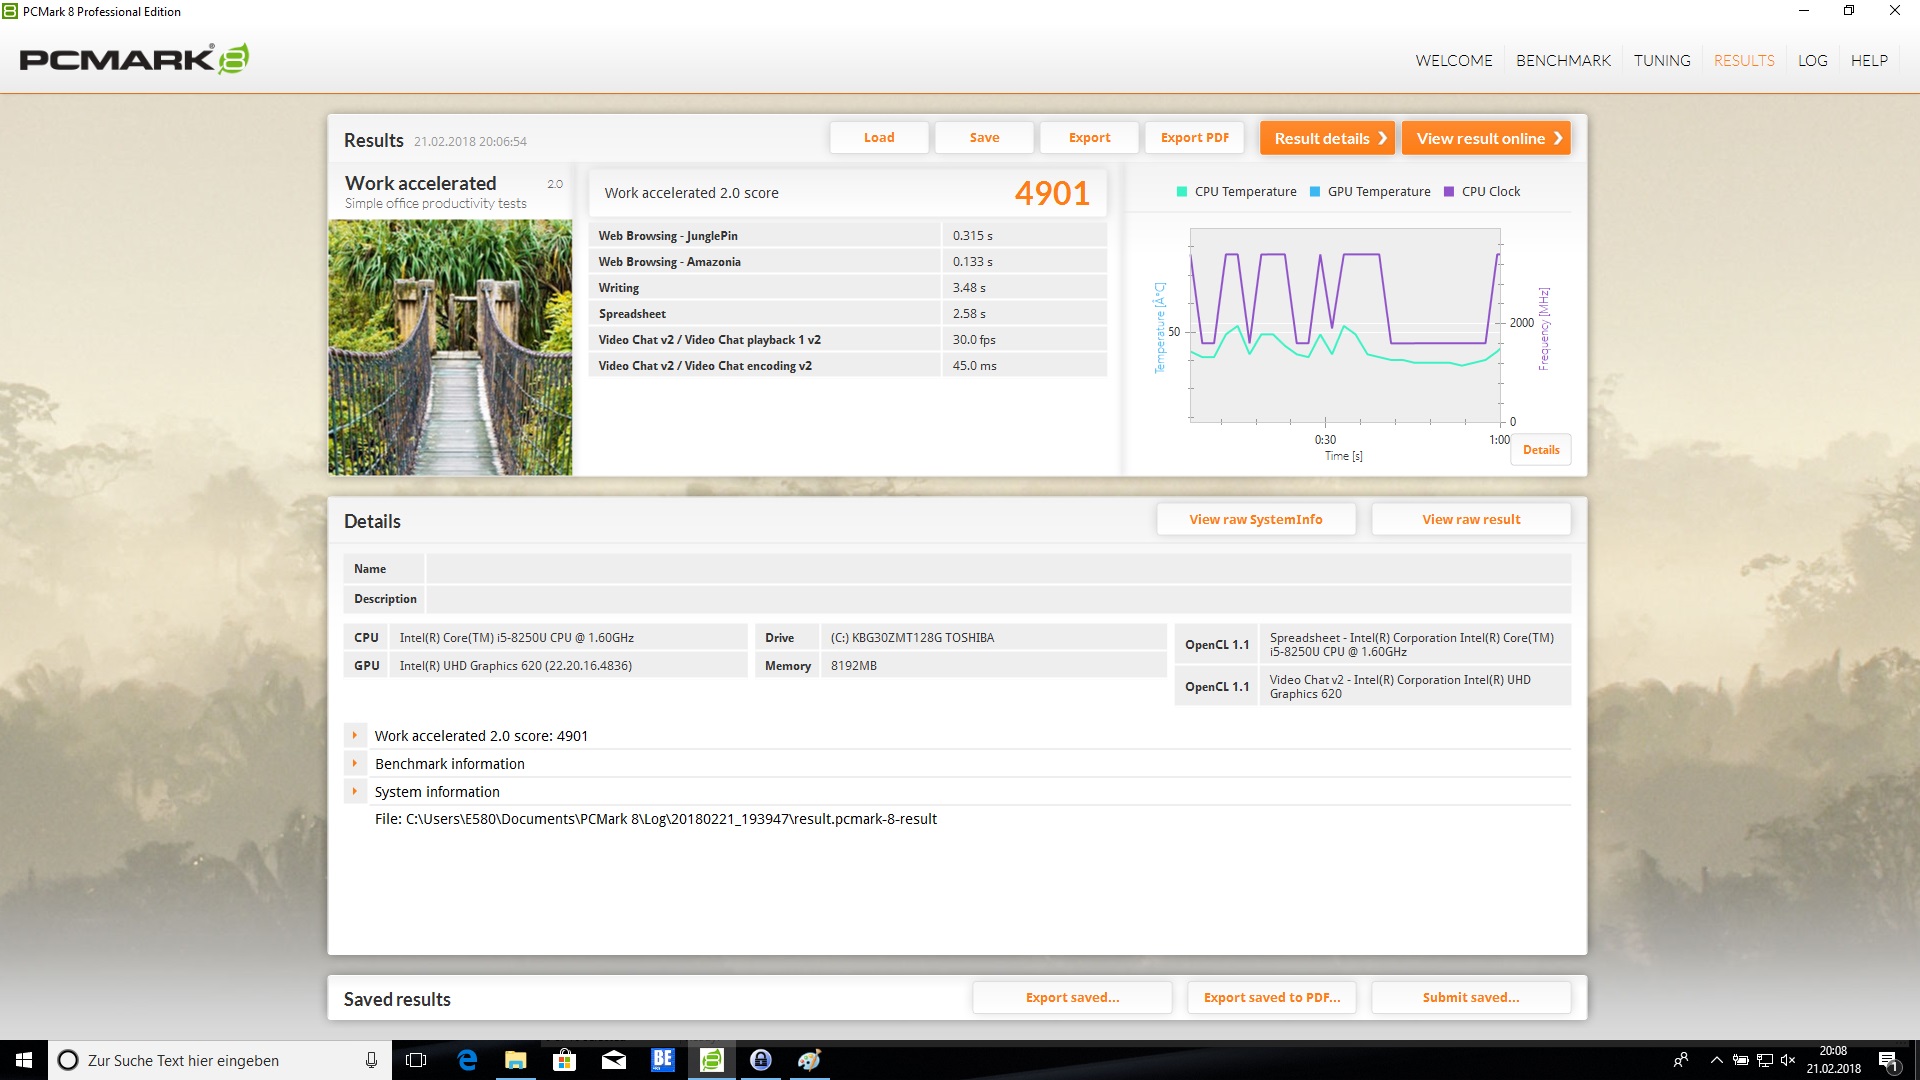
| PCMark 8 Work Score Accelerated v2 | 4901 poäng | |
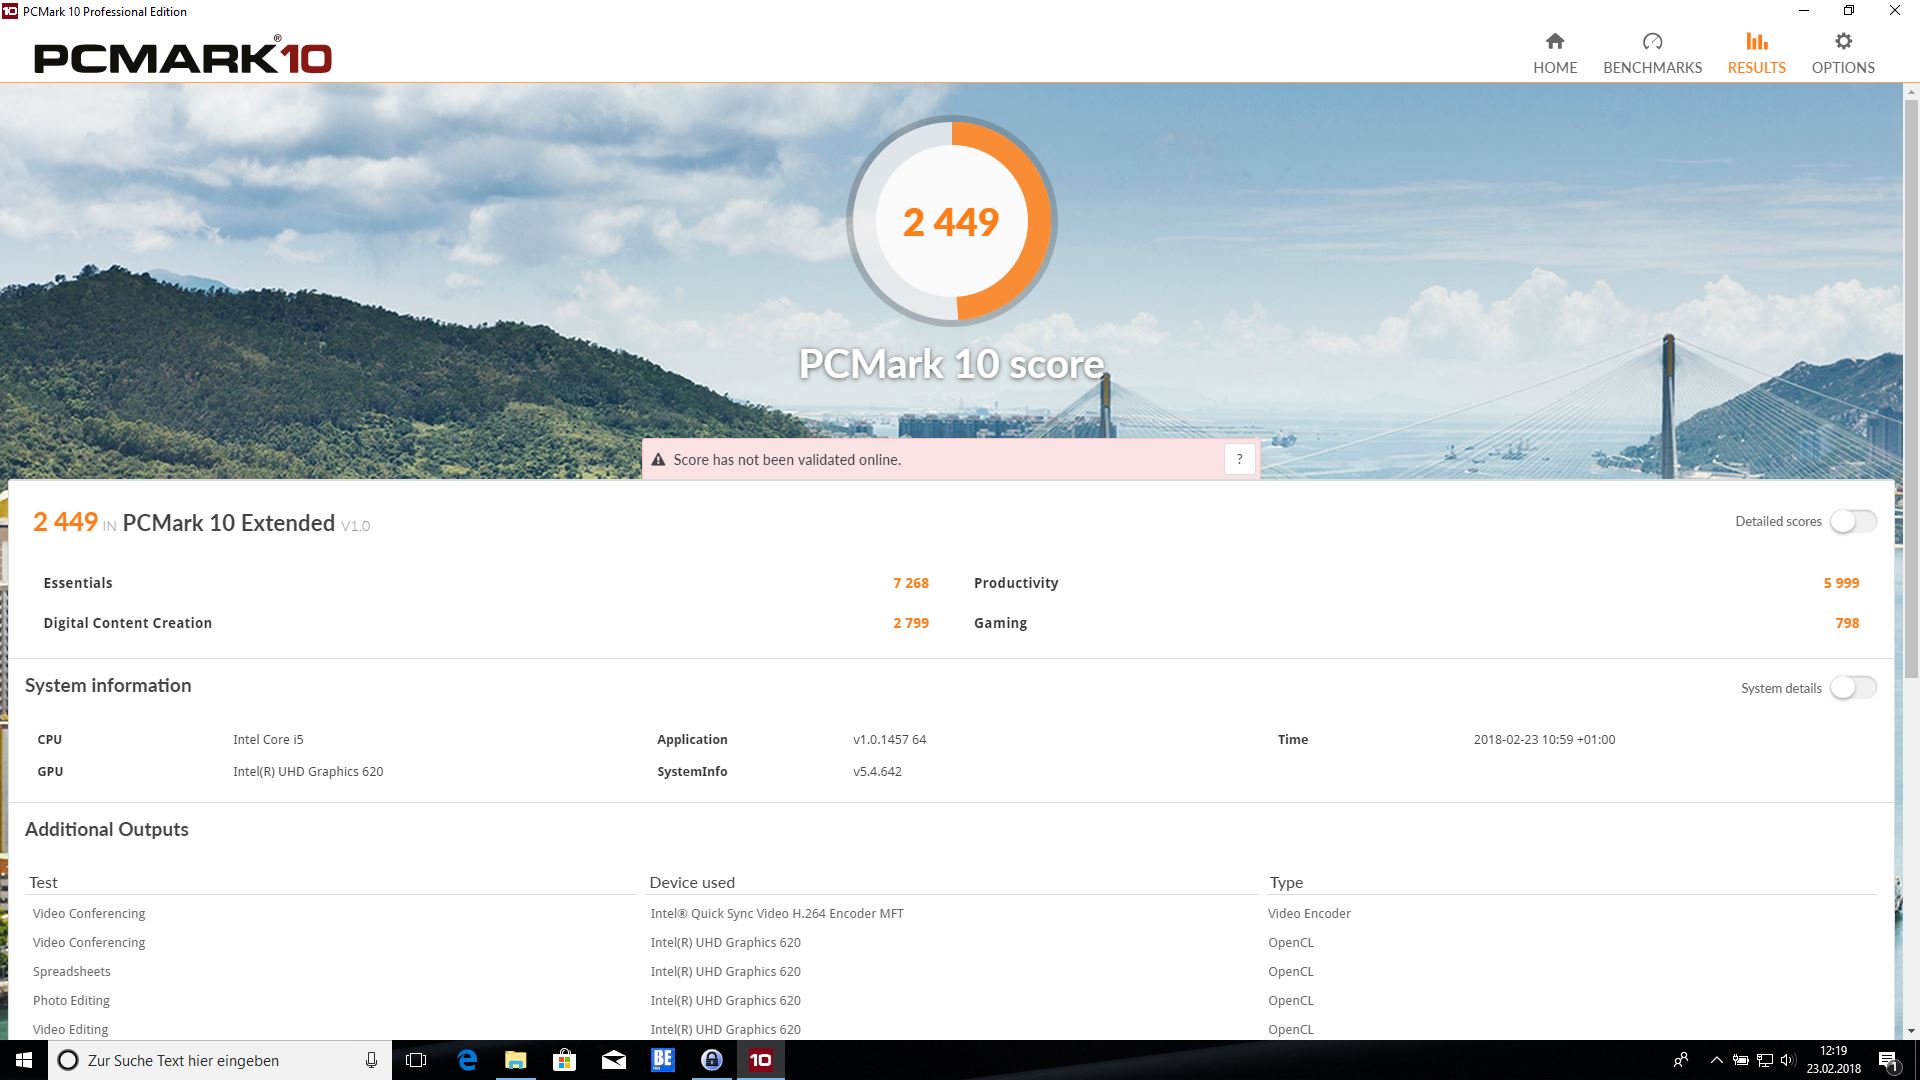
| PCMark 10 Score | 2449 poäng | |
Hjälp | ||
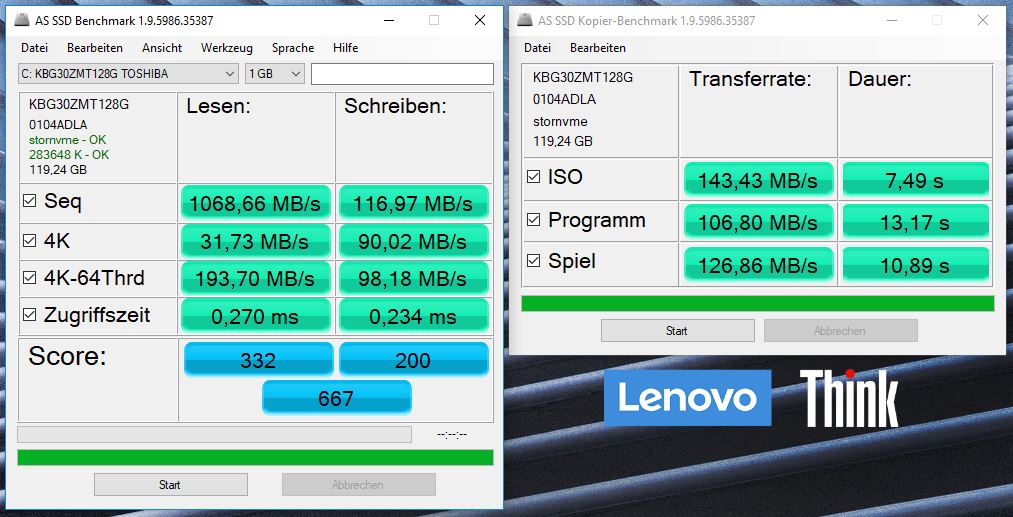
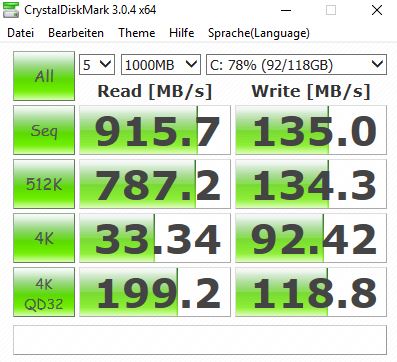
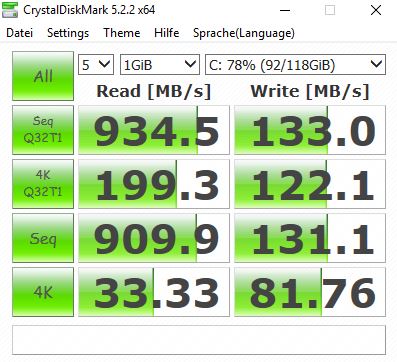
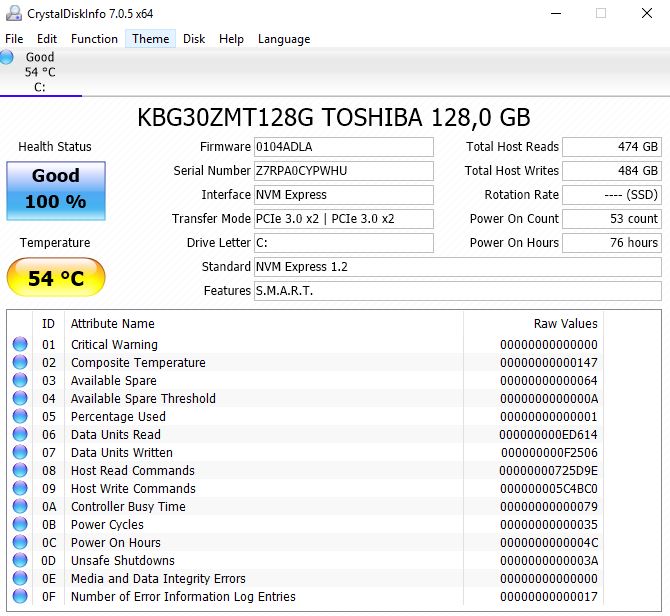
| Lenovo ThinkPad E580-20KSCTO1WW Toshiba KBG30ZMT128G | Lenovo ThinkPad E580-20KS001RGE Lenovo LENSE20256GMSP34MEAT2TA | Lenovo ThinkPad E570-20H6S02M00 Samsung PM961 MZVLW256HEHP | HP ProBook 450 G5-2UB53EA SanDisk SD8SN8U256G1006 | Acer TravelMate P2510-M-51ZQ SK Hynix HFS256G39TND-N210A | Schenker Slim 15 L17 Samsung SSD 960 Pro 512 GB m.2 | Dell Vostro 15 3568 Micron 1100 MTFDDAV256TBN | |
|---|---|---|---|---|---|---|---|
| CrystalDiskMark 3.0 | 53% | 243% | 32% | 34% | 345% | -4% | |
| Read Seq (MB/s) | 916 | 1280 40% | 1589 73% | 502 -45% | 498.1 -46% | 1958 114% | 469.3 -49% |
| Write Seq (MB/s) | 135 | 639 373% | 1217 801% | 451.6 235% | 260.1 93% | 1776 1216% | 179.7 33% |
| Read 512 (MB/s) | 787 | 1011 28% | 1155 47% | 372.5 -53% | 328.5 -58% | 819 4% | 359.6 -54% |
| Write 512 (MB/s) | 134.3 | 115.4 -14% | 783 483% | 269.7 101% | 260.9 94% | 1157 762% | 183.7 37% |
| Read 4k (MB/s) | 33.34 | 30.87 -7% | 59.7 79% | 27.76 -17% | 32.59 -2% | 54 62% | 26.01 -22% |
| Write 4k (MB/s) | 92.4 | 72.6 -21% | 148.8 61% | 52.4 -43% | 84.2 -9% | 157.7 71% | 68.7 -26% |
| Read 4k QD32 (MB/s) | 199.2 | 257.3 29% | 473.6 138% | 260.2 31% | 359.7 81% | 605 204% | 242.4 22% |
| Write 4k QD32 (MB/s) | 118.8 | 118.2 -1% | 428.7 261% | 177.7 50% | 262 121% | 511 330% | 147.1 24% |

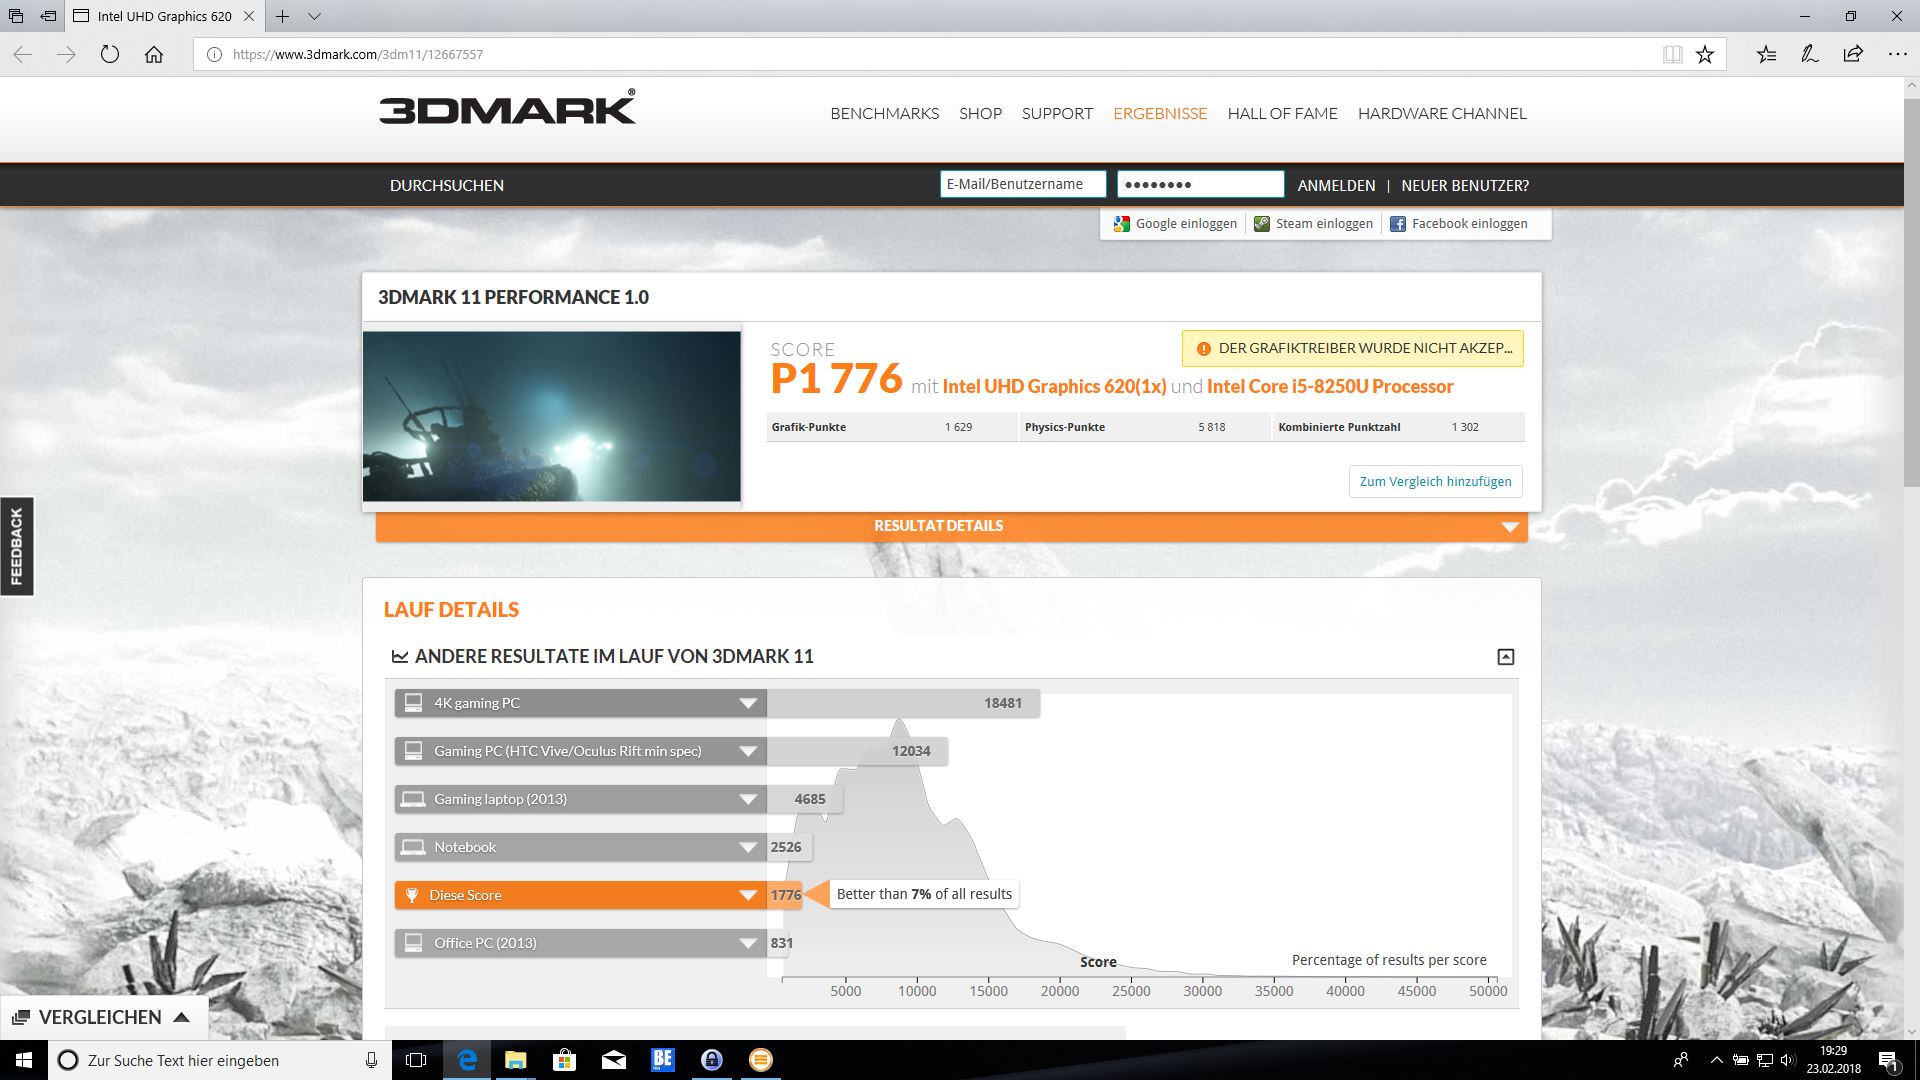
| 3DMark 11 Performance | 1776 poäng | |
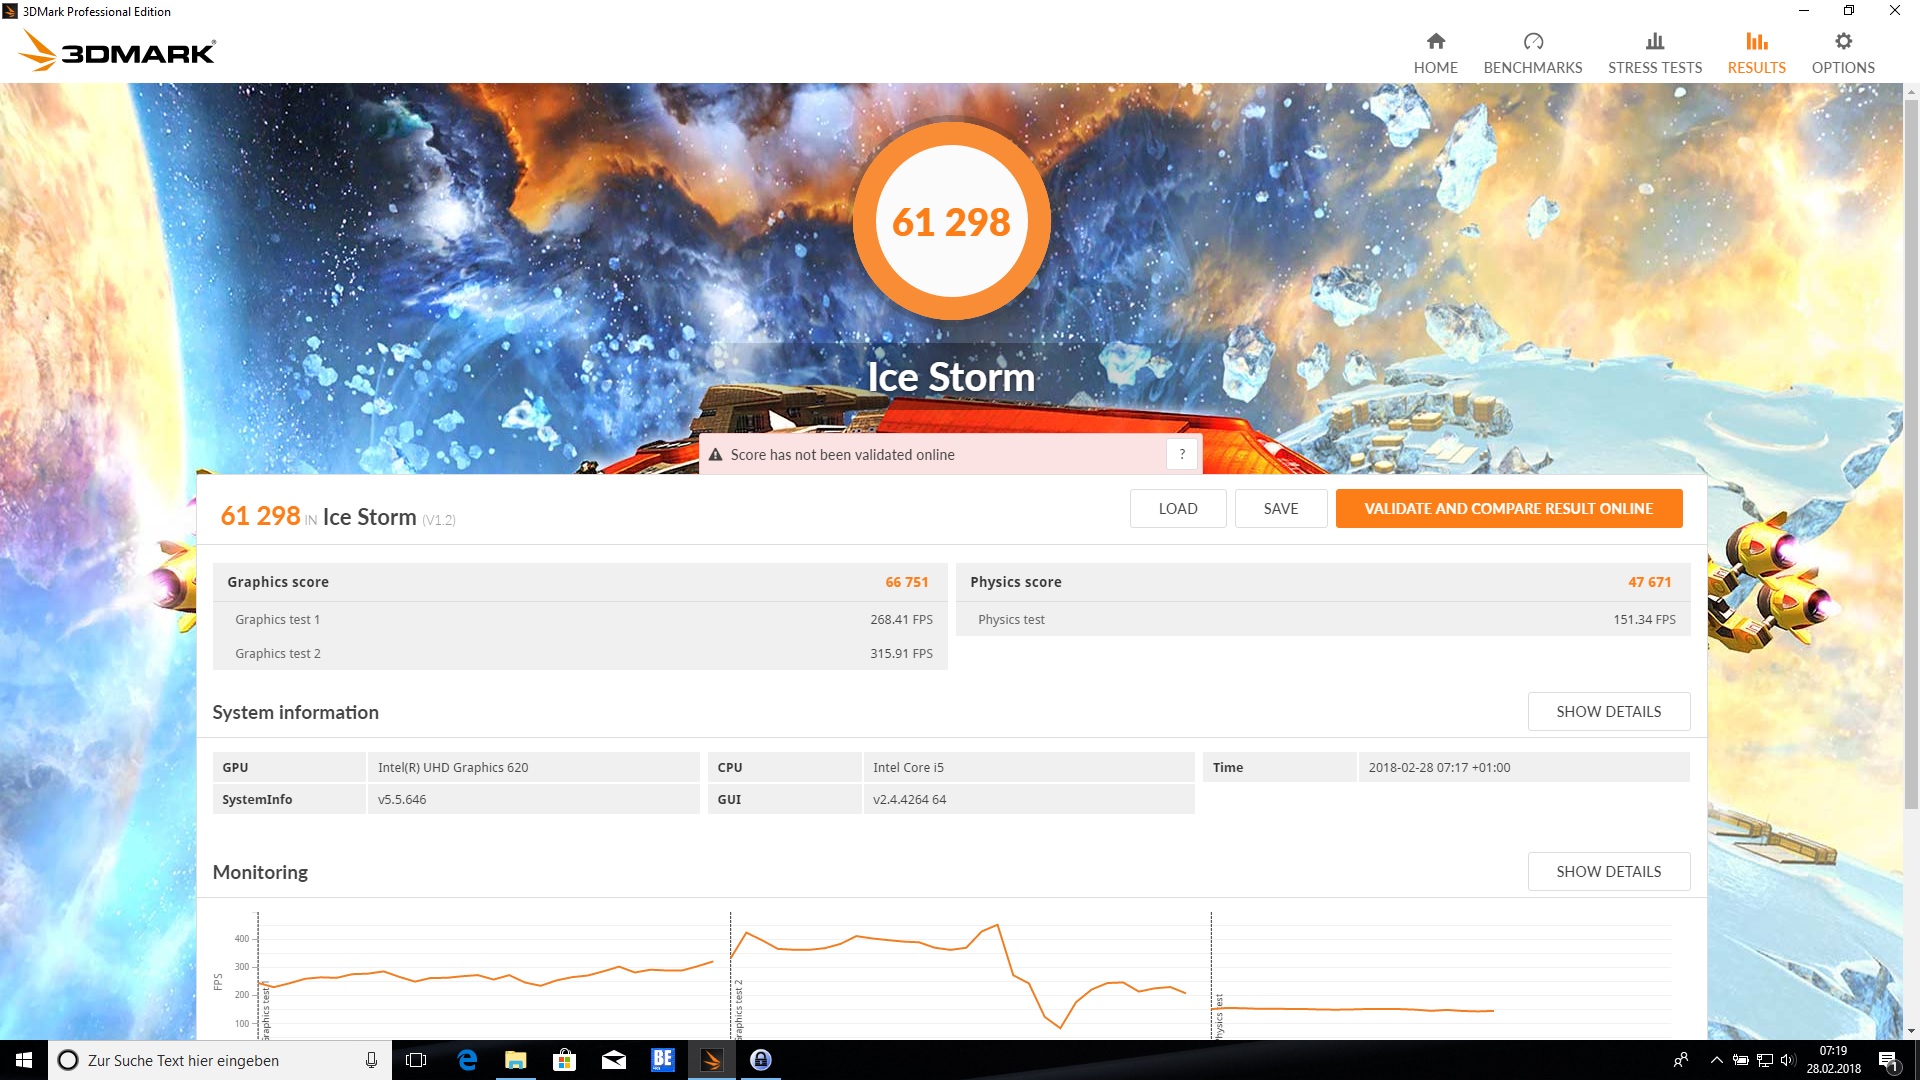
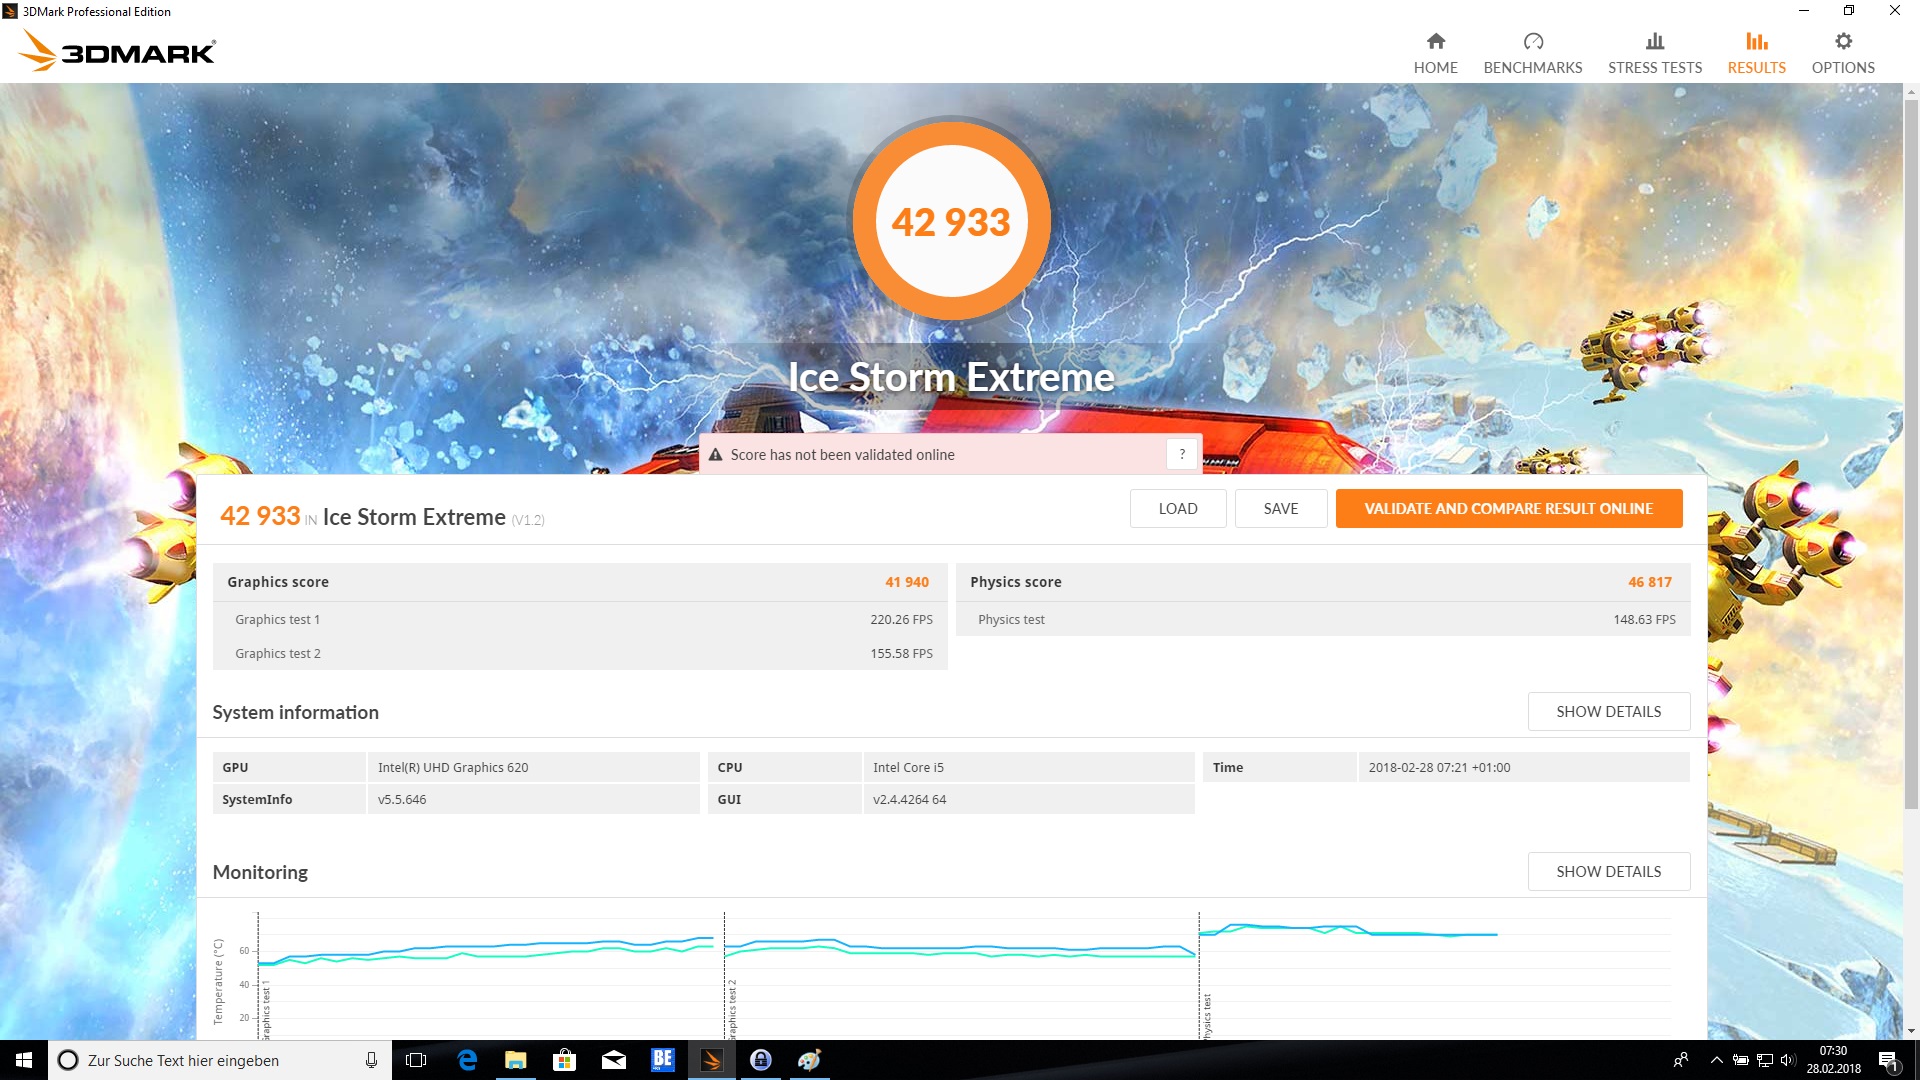
| 3DMark Ice Storm Standard Score | 61298 poäng | |
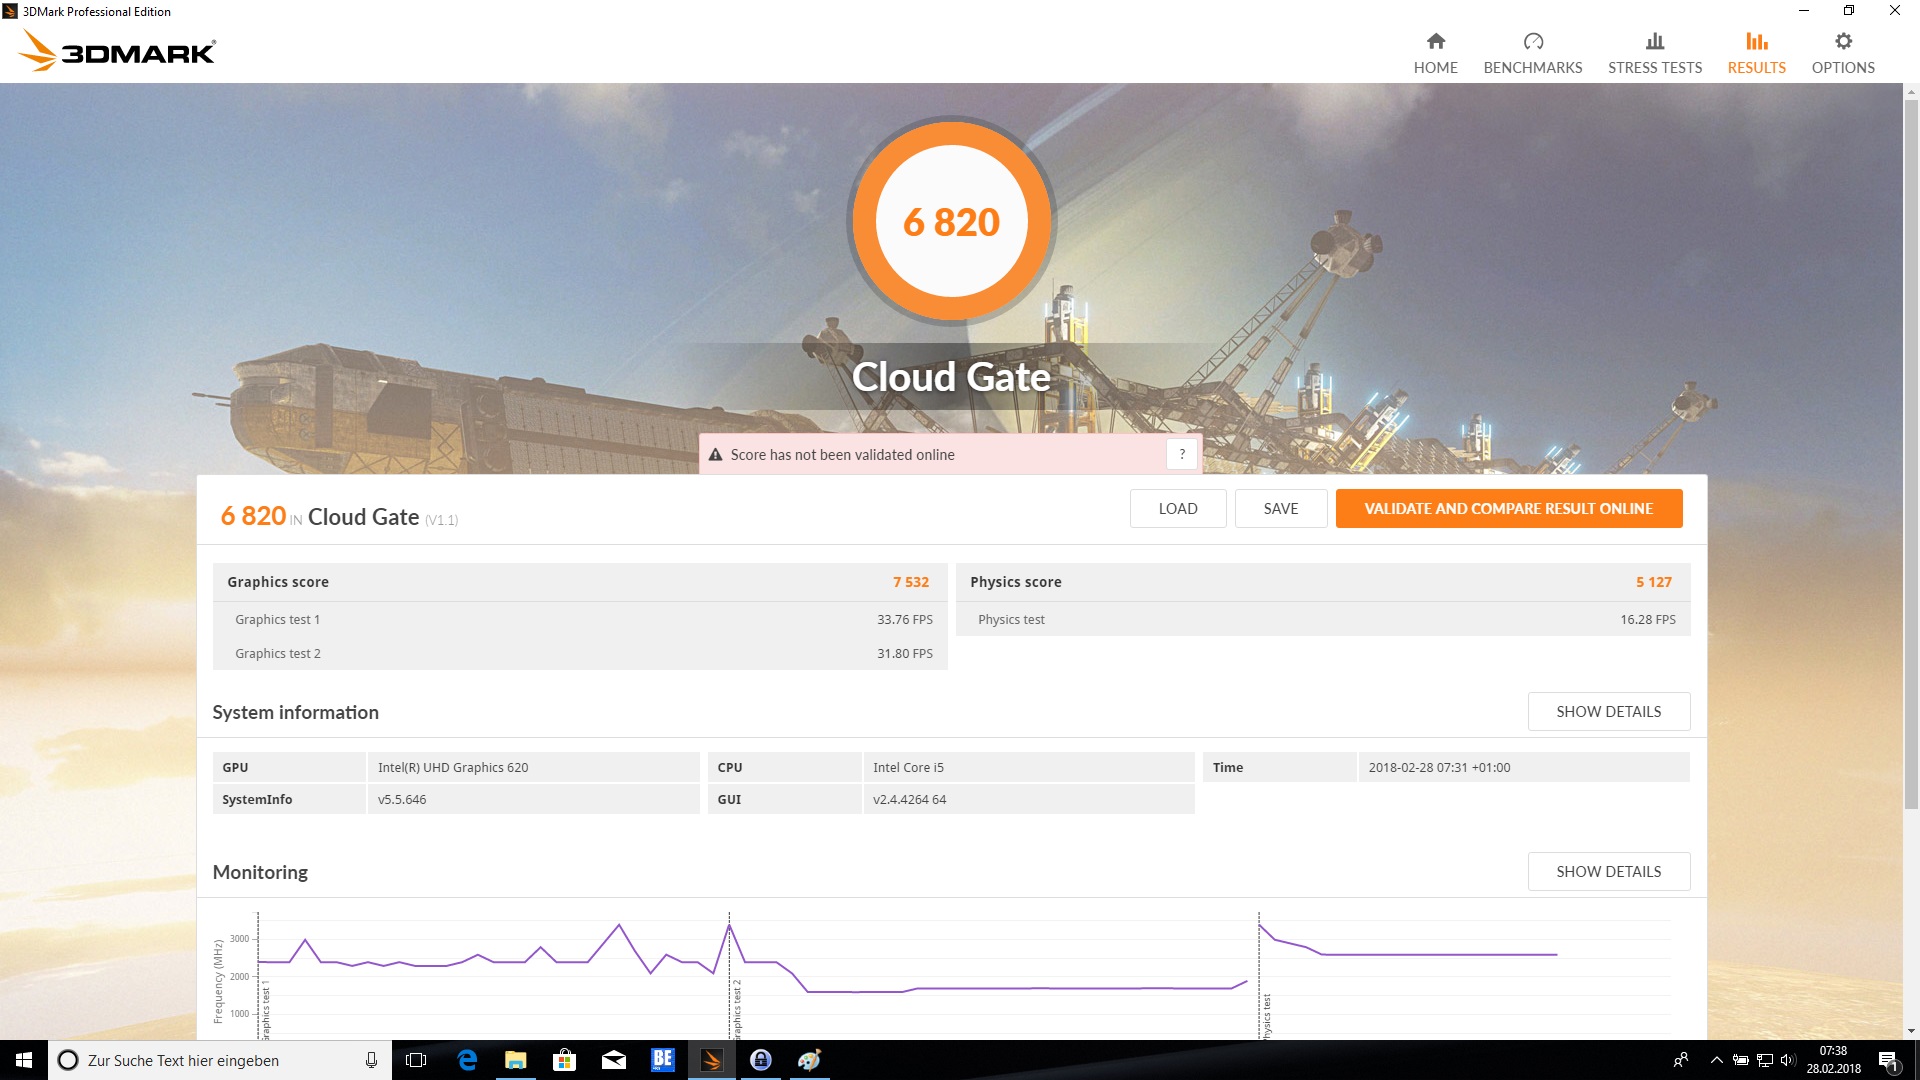
| 3DMark Cloud Gate Standard Score | 6820 poäng | |
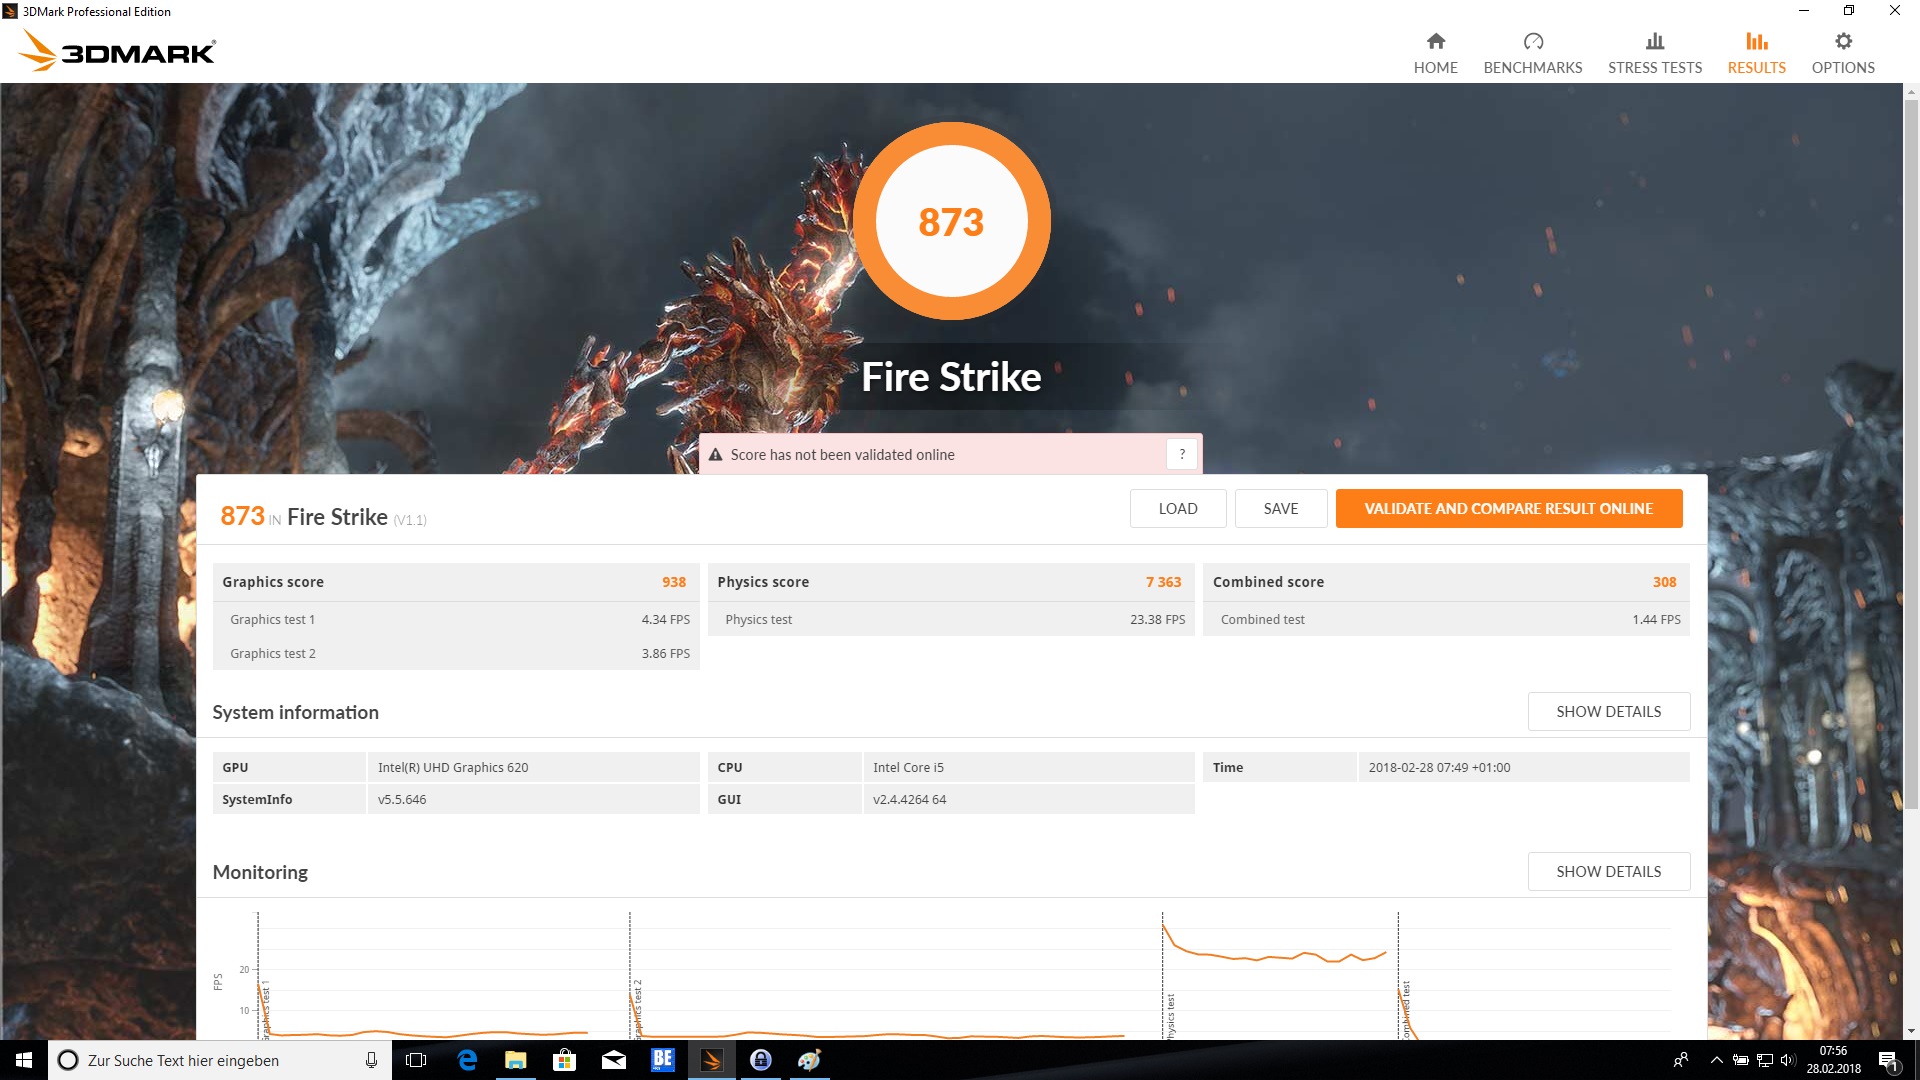
| 3DMark Fire Strike Score | 873 poäng | |
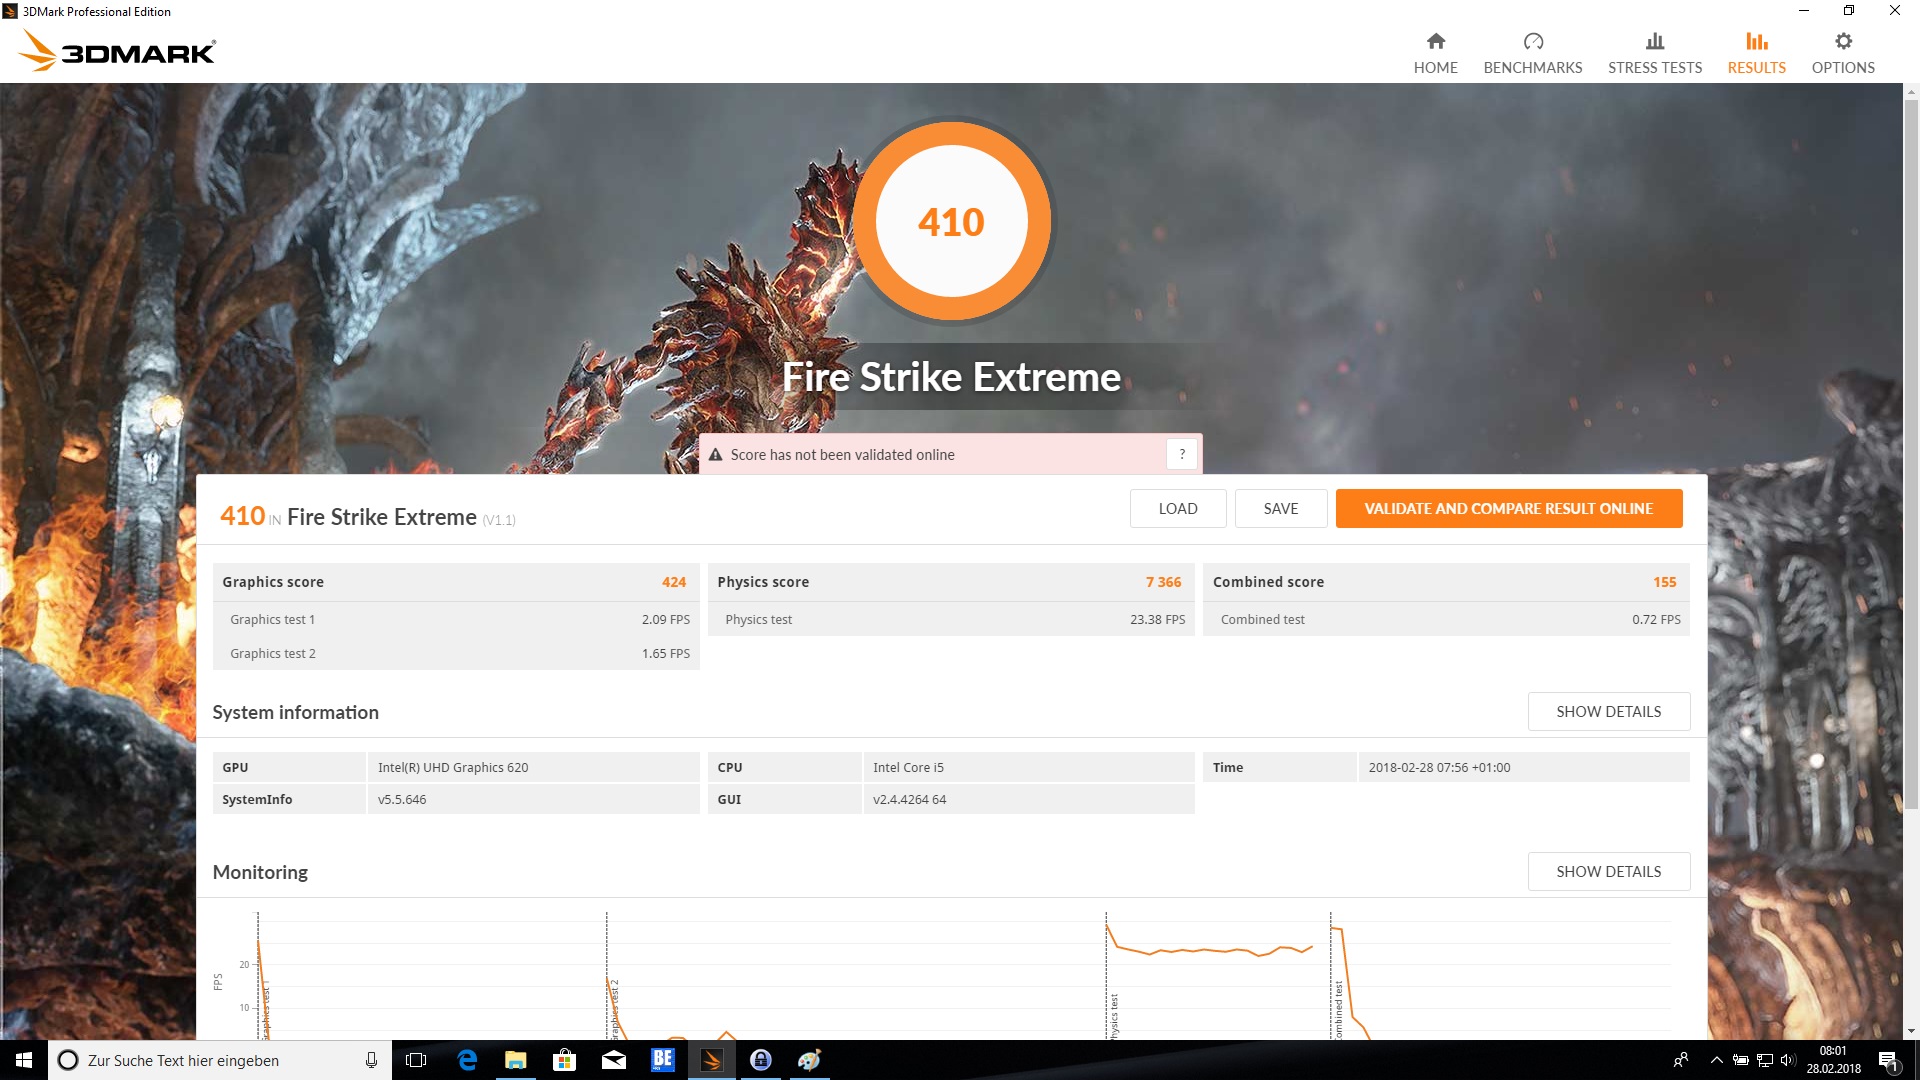
| 3DMark Fire Strike Extreme Score | 410 poäng | |
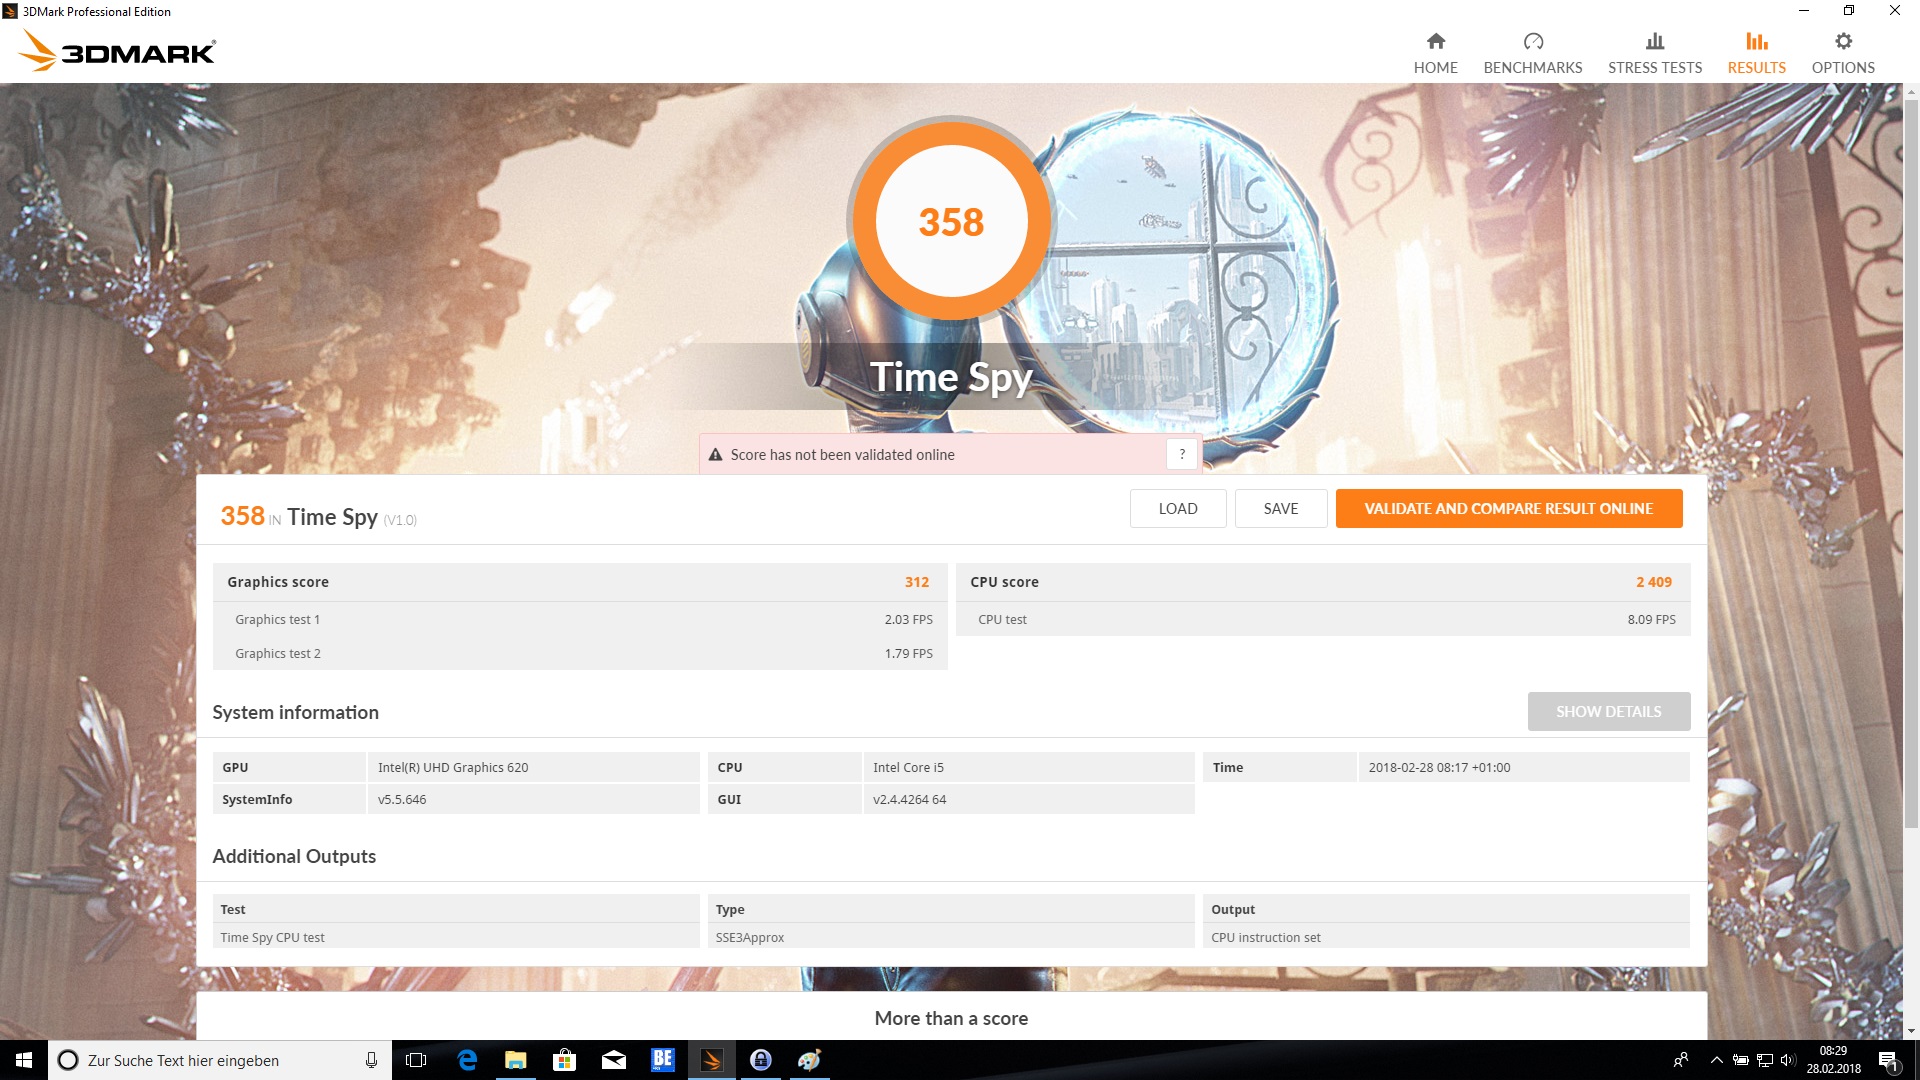
| 3DMark Time Spy Score | 358 poäng | |
Hjälp | ||
| låg | med. | hög | ultra | |
|---|---|---|---|---|
| BioShock Infinite (2013) | 46.1 | 27.7 | 22.9 | 7.6 |
| The Witcher 3 (2015) | 15.7 | 9.9 | 5.4 | |
| Rise of the Tomb Raider (2016) | 17.2 | 10.6 | 6.1 |
Ljudnivå
| Låg belastning |
| 29.1 / 29.1 / 30.2 dB(A) |
| Hög belastning |
| 30.8 / 32.8 dB(A) |
 | ||
30 dB tyst 40 dB(A) hörbar 50 dB(A) högt ljud |
||
min: | ||
| Lenovo ThinkPad E580-20KSCTO1WW UHD Graphics 620, i5-8250U, Toshiba KBG30ZMT128G | Lenovo ThinkPad E580-20KS001RGE Radeon RX 550 (Laptop), i5-8550U, Lenovo LENSE20256GMSP34MEAT2TA | Lenovo ThinkPad E570-20H6S02M00 HD Graphics 620, i5-7200U, Samsung PM961 MZVLW256HEHP | HP ProBook 450 G5-2UB53EA UHD Graphics 620, i5-8250U, SanDisk SD8SN8U256G1006 | Acer TravelMate P2510-M-51ZQ HD Graphics 620, i5-7200U, SK Hynix HFS256G39TND-N210A | Schenker Slim 15 L17 UHD Graphics 620, i5-8550U, Samsung SSD 960 Pro 512 GB m.2 | Dell Vostro 15 3568 HD Graphics 620, i5-7200U, Micron 1100 MTFDDAV256TBN | |
|---|---|---|---|---|---|---|---|
| Noise | -9% | -2% | 1% | -10% | -7% | -7% | |
| av / miljö * (dB) | 29.1 | 30.1 -3% | 30.6 -5% | 29.1 -0% | 31.4 -8% | 29.1 -0% | 30.2 -4% |
| Idle Minimum * (dB) | 29.1 | 30.1 -3% | 30.6 -5% | 29.1 -0% | 31.8 -9% | 29.1 -0% | 30.2 -4% |
| Idle Average * (dB) | 29.1 | 30.1 -3% | 30.6 -5% | 29.1 -0% | 31.8 -9% | 29.1 -0% | 30.2 -4% |
| Idle Maximum * (dB) | 30.2 | 31.6 -5% | 30.6 -1% | 29.1 4% | 31.8 -5% | 30.5 -1% | 30.2 -0% |
| Load Average * (dB) | 30.8 | 37.7 -22% | 31.8 -3% | 31.4 -2% | 36.6 -19% | 31.2 -1% | 36.4 -18% |
| Load Maximum * (dB) | 32.8 | 38 -16% | 31.3 5% | 32 2% | 36.5 -11% | 45.9 -40% | 36.5 -11% |
* ... mindre är bättre
(±) Den maximala temperaturen på ovansidan är 40.4 °C / 105 F, jämfört med genomsnittet av 34.3 °C / 94 F , allt från 21.2 till 62.5 °C för klassen Office.
(±) Botten värms upp till maximalt 43.7 °C / 111 F, jämfört med genomsnittet av 36.8 °C / 98 F
(+) Vid tomgångsbruk är medeltemperaturen för ovansidan 20.4 °C / 69 F, jämfört med enhetsgenomsnittet på 29.5 °C / ### class_avg_f### F.
(+) Handledsstöden och pekplattan är kallare än hudtemperaturen med maximalt 22.6 °C / 72.7 F och är därför svala att ta på.
(+) Medeltemperaturen för handledsstödsområdet på liknande enheter var 27.5 °C / 81.5 F (+4.9 °C / 8.8 F).
| Lenovo ThinkPad E580-20KSCTO1WW UHD Graphics 620, i5-8250U, Toshiba KBG30ZMT128G | Lenovo ThinkPad E580-20KS001RGE Radeon RX 550 (Laptop), i5-8550U, Lenovo LENSE20256GMSP34MEAT2TA | Lenovo ThinkPad E570-20H6S02M00 HD Graphics 620, i5-7200U, Samsung PM961 MZVLW256HEHP | HP ProBook 450 G5-2UB53EA UHD Graphics 620, i5-8250U, SanDisk SD8SN8U256G1006 | Acer TravelMate P2510-M-51ZQ HD Graphics 620, i5-7200U, SK Hynix HFS256G39TND-N210A | Schenker Slim 15 L17 UHD Graphics 620, i5-8550U, Samsung SSD 960 Pro 512 GB m.2 | Dell Vostro 15 3568 HD Graphics 620, i5-7200U, Micron 1100 MTFDDAV256TBN | |
|---|---|---|---|---|---|---|---|
| Heat | -33% | -1% | -4% | 6% | -6% | 3% | |
| Maximum Upper Side * (°C) | 40.4 | 60 -49% | 33.2 18% | 42.2 -4% | 32 21% | 38.5 5% | 35.6 12% |
| Maximum Bottom * (°C) | 43.7 | 57 -30% | 39.4 10% | 45.5 -4% | 35.5 19% | 41.8 4% | 35.3 19% |
| Idle Upper Side * (°C) | 21.4 | 29.1 -36% | 25.9 -21% | 23.9 -12% | 25.6 -20% | 26.4 -23% | 25.1 -17% |
| Idle Bottom * (°C) | 25.5 | 30.2 -18% | 27.8 -9% | 24.2 5% | 25.1 2% | 27.9 -9% | 26.1 -2% |
* ... mindre är bättre
| Av/Standby | |
| Låg belastning | |
| Hög belastning |
|
Förklaring:
min: | |
| Lenovo ThinkPad E580-20KSCTO1WW i5-8250U, UHD Graphics 620, Toshiba KBG30ZMT128G, IPS LED, 1920x1080, 15.6" | Lenovo ThinkPad E580-20KS001RGE i5-8550U, Radeon RX 550 (Laptop), Lenovo LENSE20256GMSP34MEAT2TA, IPS LED, 1920x1080, 15.6" | Lenovo ThinkPad E570-20H6S02M00 i5-7200U, HD Graphics 620, Samsung PM961 MZVLW256HEHP, TN LED, 1366x768, 15.6" | HP ProBook 450 G5-2UB53EA i5-8250U, UHD Graphics 620, SanDisk SD8SN8U256G1006, IPS LED, 1920x1080, 15.6" | Acer TravelMate P2510-M-51ZQ i5-7200U, HD Graphics 620, SK Hynix HFS256G39TND-N210A, IPS, 1920x1080, 15.6" | Schenker Slim 15 L17 i5-8550U, UHD Graphics 620, Samsung SSD 960 Pro 512 GB m.2, IPS, 1920x1080, 15.6" | Dell Vostro 15 3568 i5-7200U, HD Graphics 620, Micron 1100 MTFDDAV256TBN, TN LED, 1920x1080, 15.6" | |
|---|---|---|---|---|---|---|---|
| Power Consumption | -65% | 16% | -3% | 2% | -53% | 21% | |
| Idle Minimum * (Watt) | 3.4 | 7.4 -118% | 2.9 15% | 3.6 -6% | 3.4 -0% | 7.2 -112% | 3 12% |
| Idle Average * (Watt) | 6.7 | 10.4 -55% | 5.8 13% | 6.2 7% | 5.8 13% | 10.9 -63% | 5.5 18% |
| Idle Maximum * (Watt) | 7.7 | 10.3 -34% | 6.6 14% | 7.2 6% | 8 -4% | 12.6 -64% | 5.7 26% |
| Load Average * (Watt) | 31.1 | 57 -83% | 29 7% | 35.2 -13% | 38 -22% | 37 -19% | 27 13% |
| Load Maximum * (Watt) | 42.9 | 57 -33% | 29.4 31% | 46.4 -8% | 32 25% | 45.5 -6% | 27.4 36% |
* ... mindre är bättre
| Lenovo ThinkPad E580-20KSCTO1WW i5-8250U, UHD Graphics 620, 45 Wh | Lenovo ThinkPad E580-20KS001RGE i5-8550U, Radeon RX 550 (Laptop), 45 Wh | Lenovo ThinkPad E570-20H6S02M00 i5-7200U, HD Graphics 620, 42 Wh | HP ProBook 450 G5-2UB53EA i5-8250U, UHD Graphics 620, 48 Wh | Acer TravelMate P2510-M-51ZQ i5-7200U, HD Graphics 620, 48 Wh | Schenker Slim 15 L17 i5-8550U, UHD Graphics 620, 44 Wh | Dell Vostro 15 3568 i5-7200U, HD Graphics 620, 40 Wh | |
|---|---|---|---|---|---|---|---|
| Batteridrifttid | 2% | 5% | 10% | 17% | -34% | 1% | |
| Reader / Idle (h) | 14.4 | 14.4 0% | 18.1 26% | 15.2 6% | 7.4 -49% | 14.6 1% | |
| H.264 (h) | 7.3 | 9.1 25% | 6.5 -11% | 4.3 -41% | |||
| WiFi v1.3 (h) | 7 | 6.7 -4% | 7.2 3% | 7.7 10% | 8.8 26% | 4.6 -34% | 6.3 -10% |
| Load (h) | 1.6 | 1.4 -13% | 1.6 0% | 1.9 19% | 1.4 -13% | 1.8 13% |
För
Emot
Läs den fullständiga versionen av den här recensionen på engelska här.
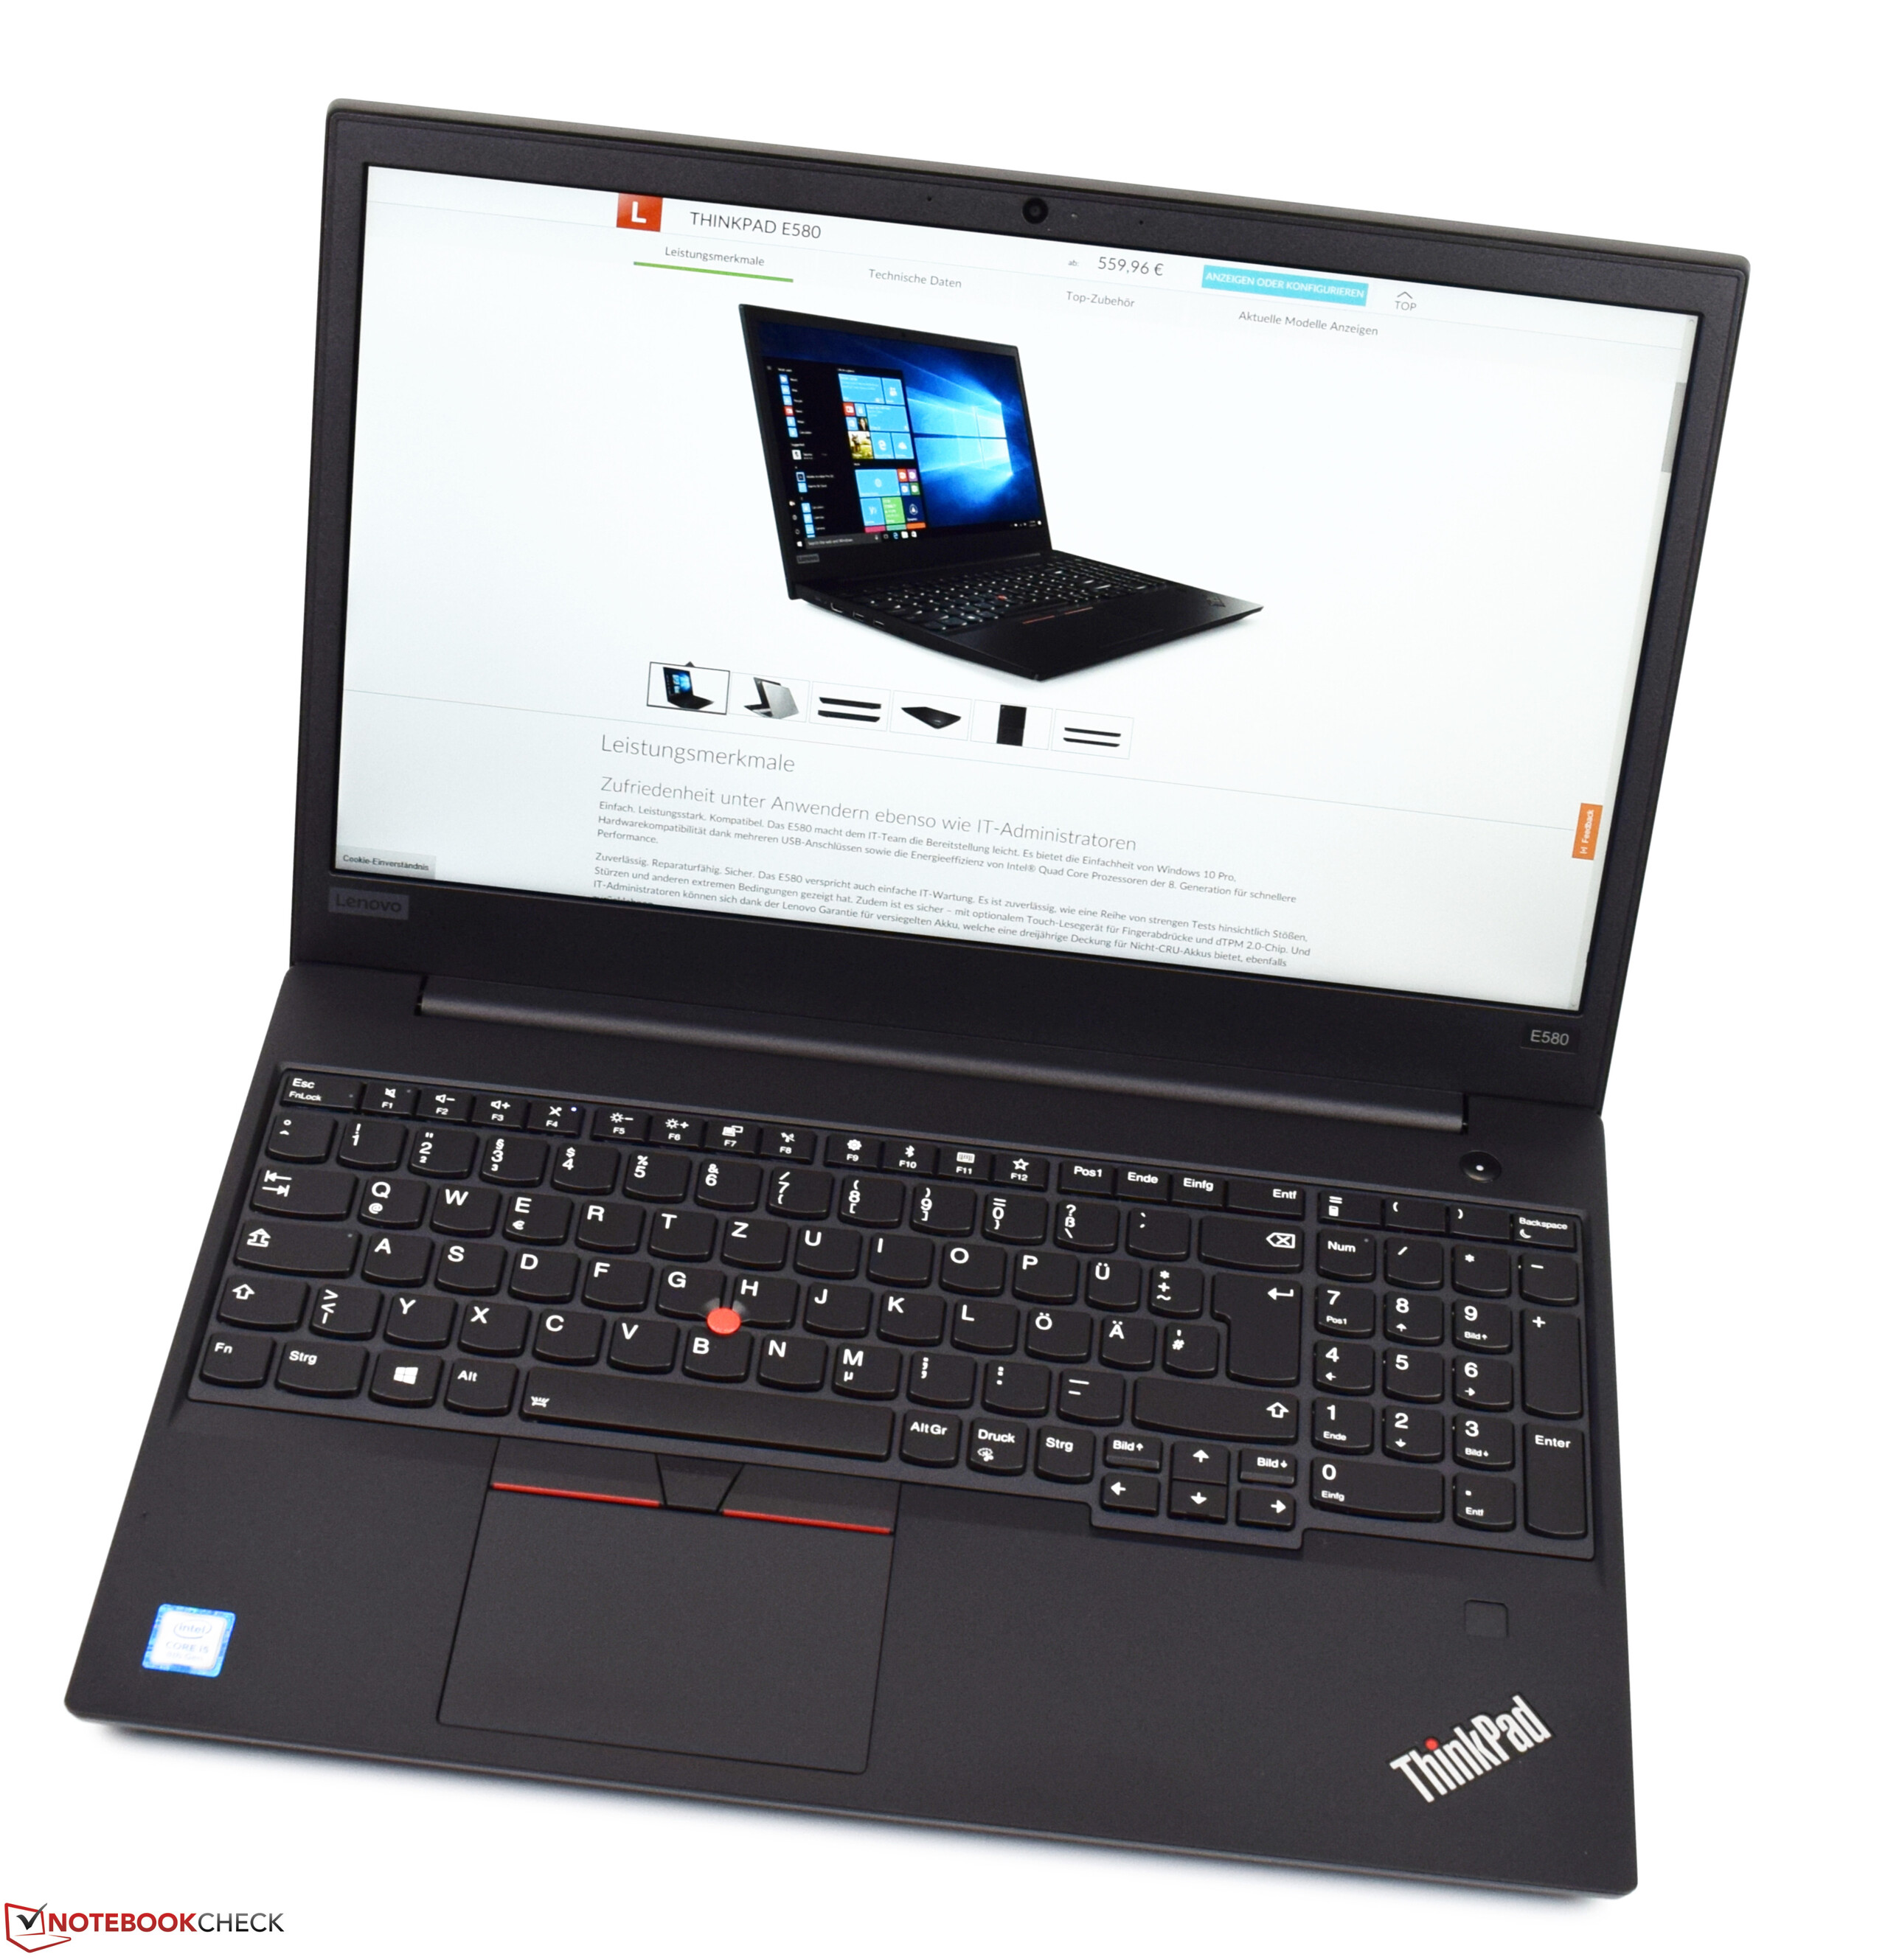
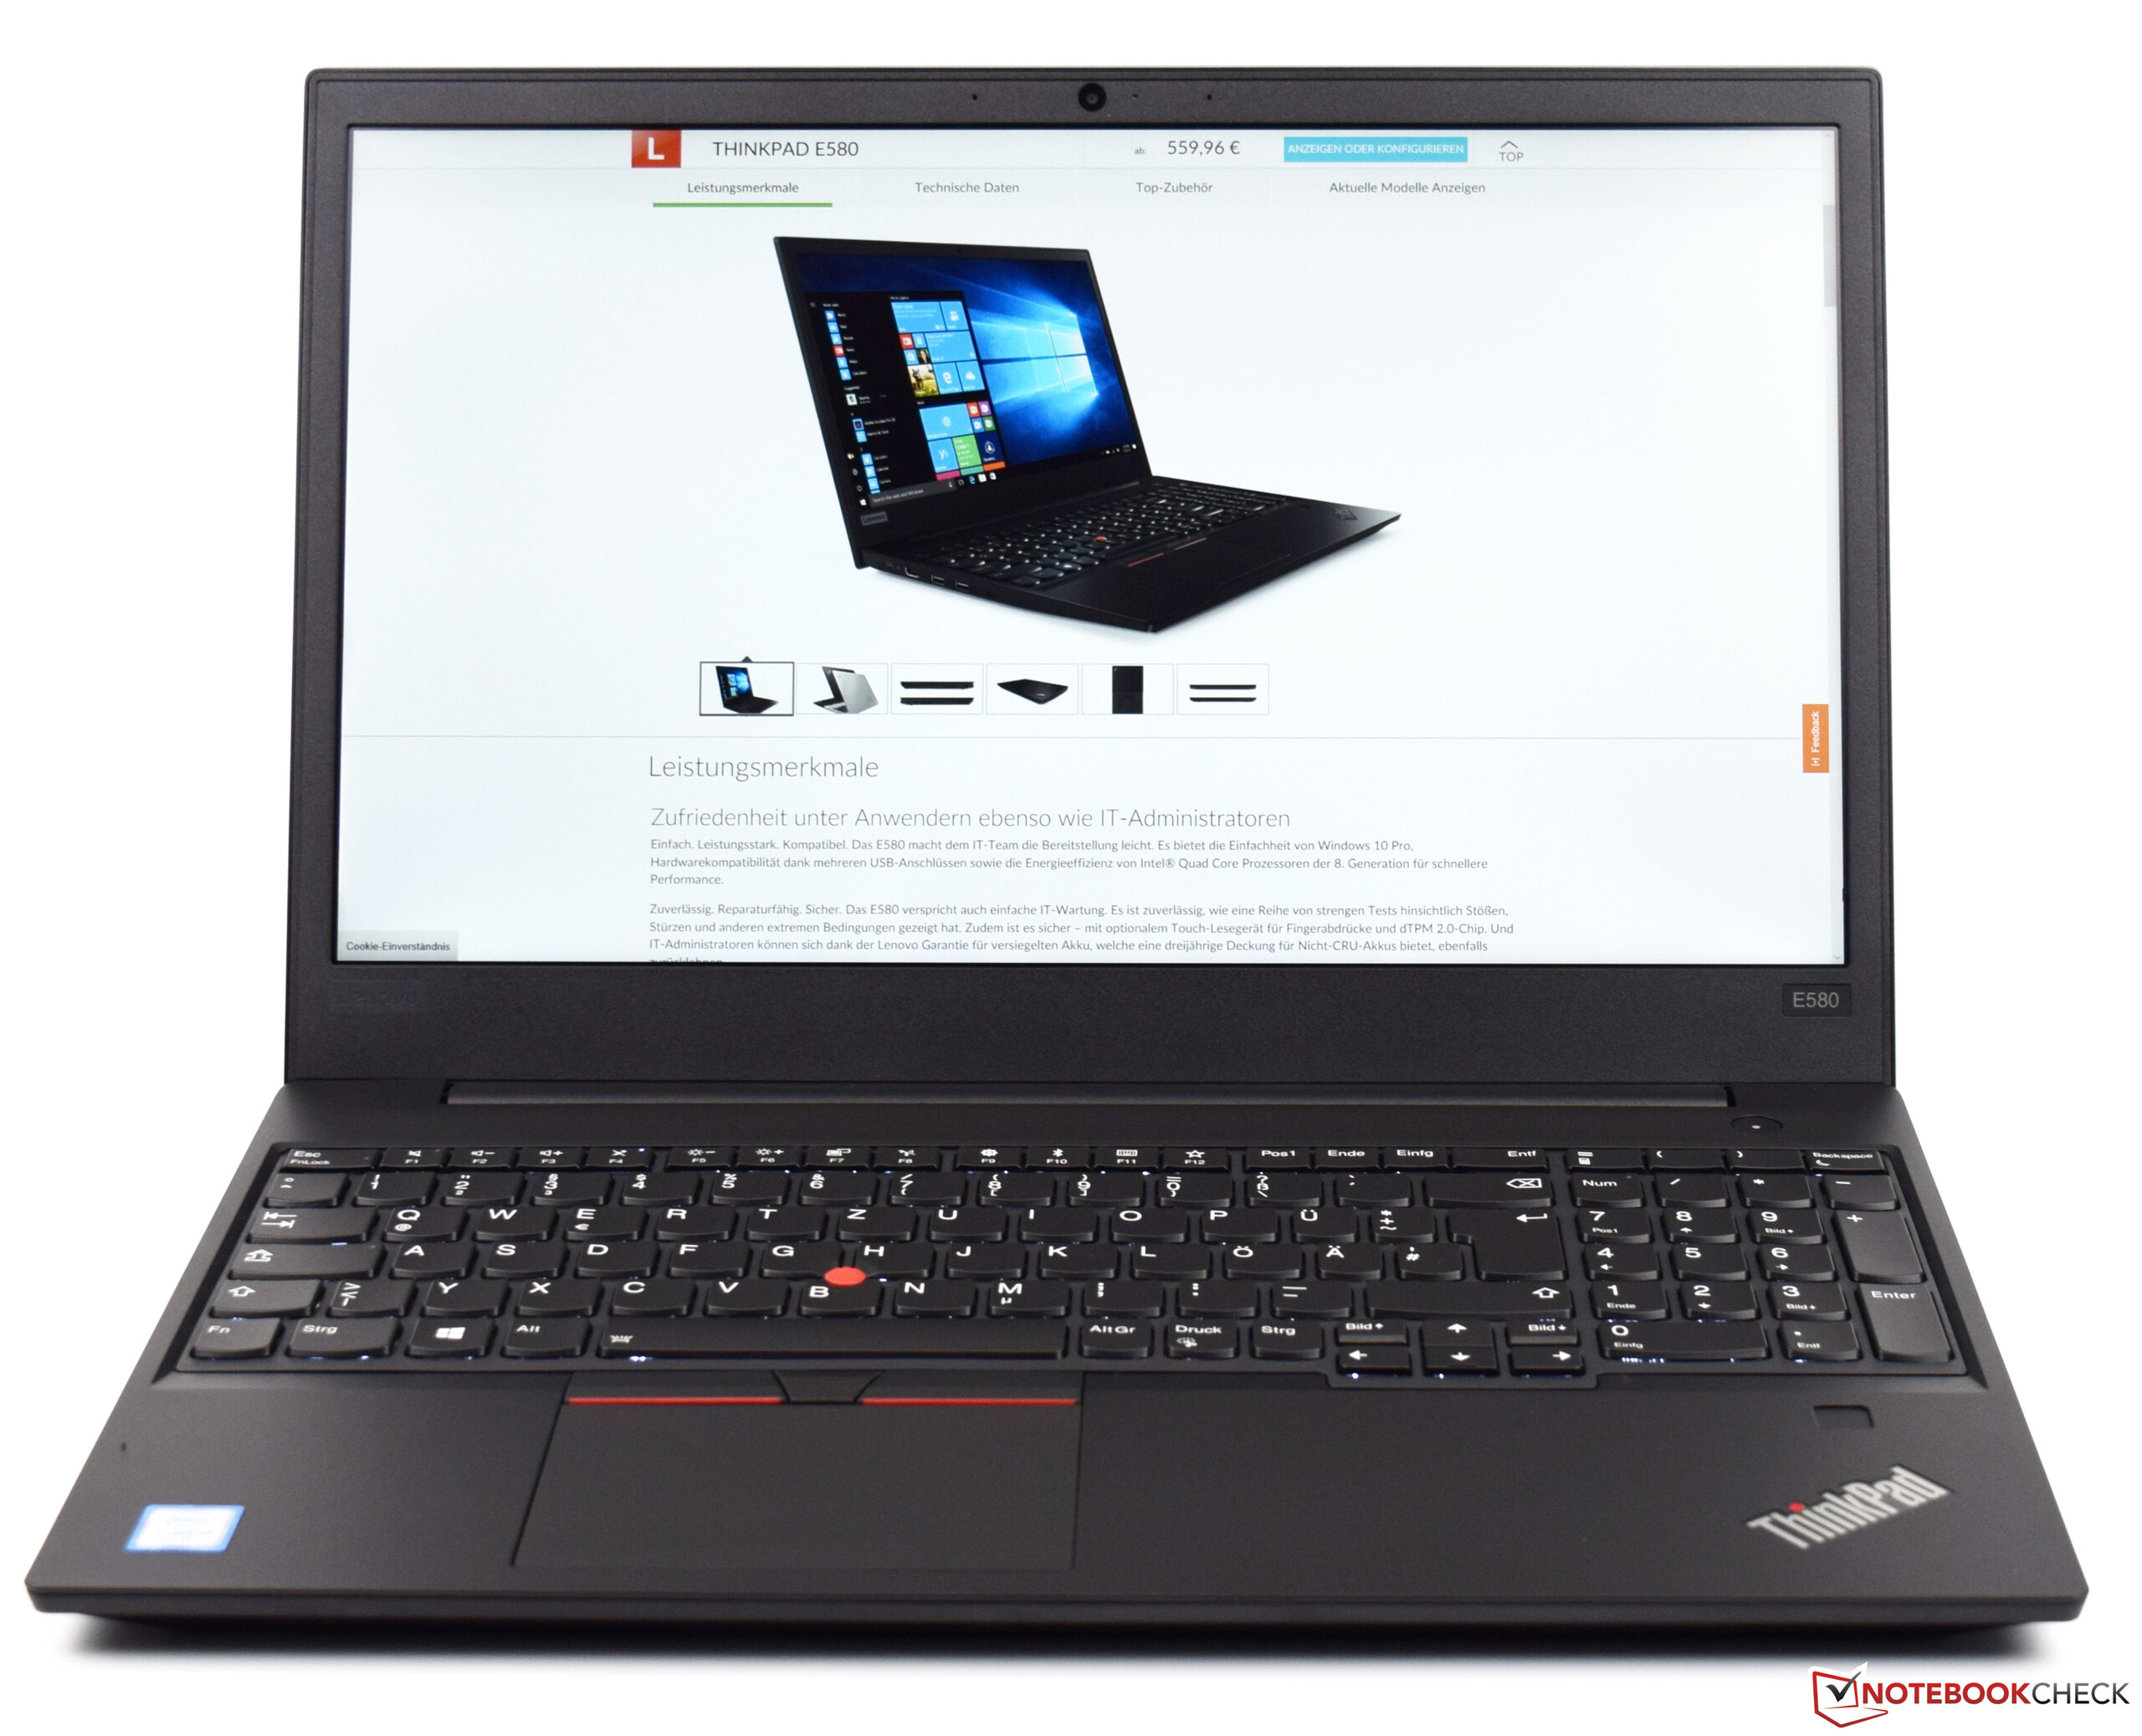
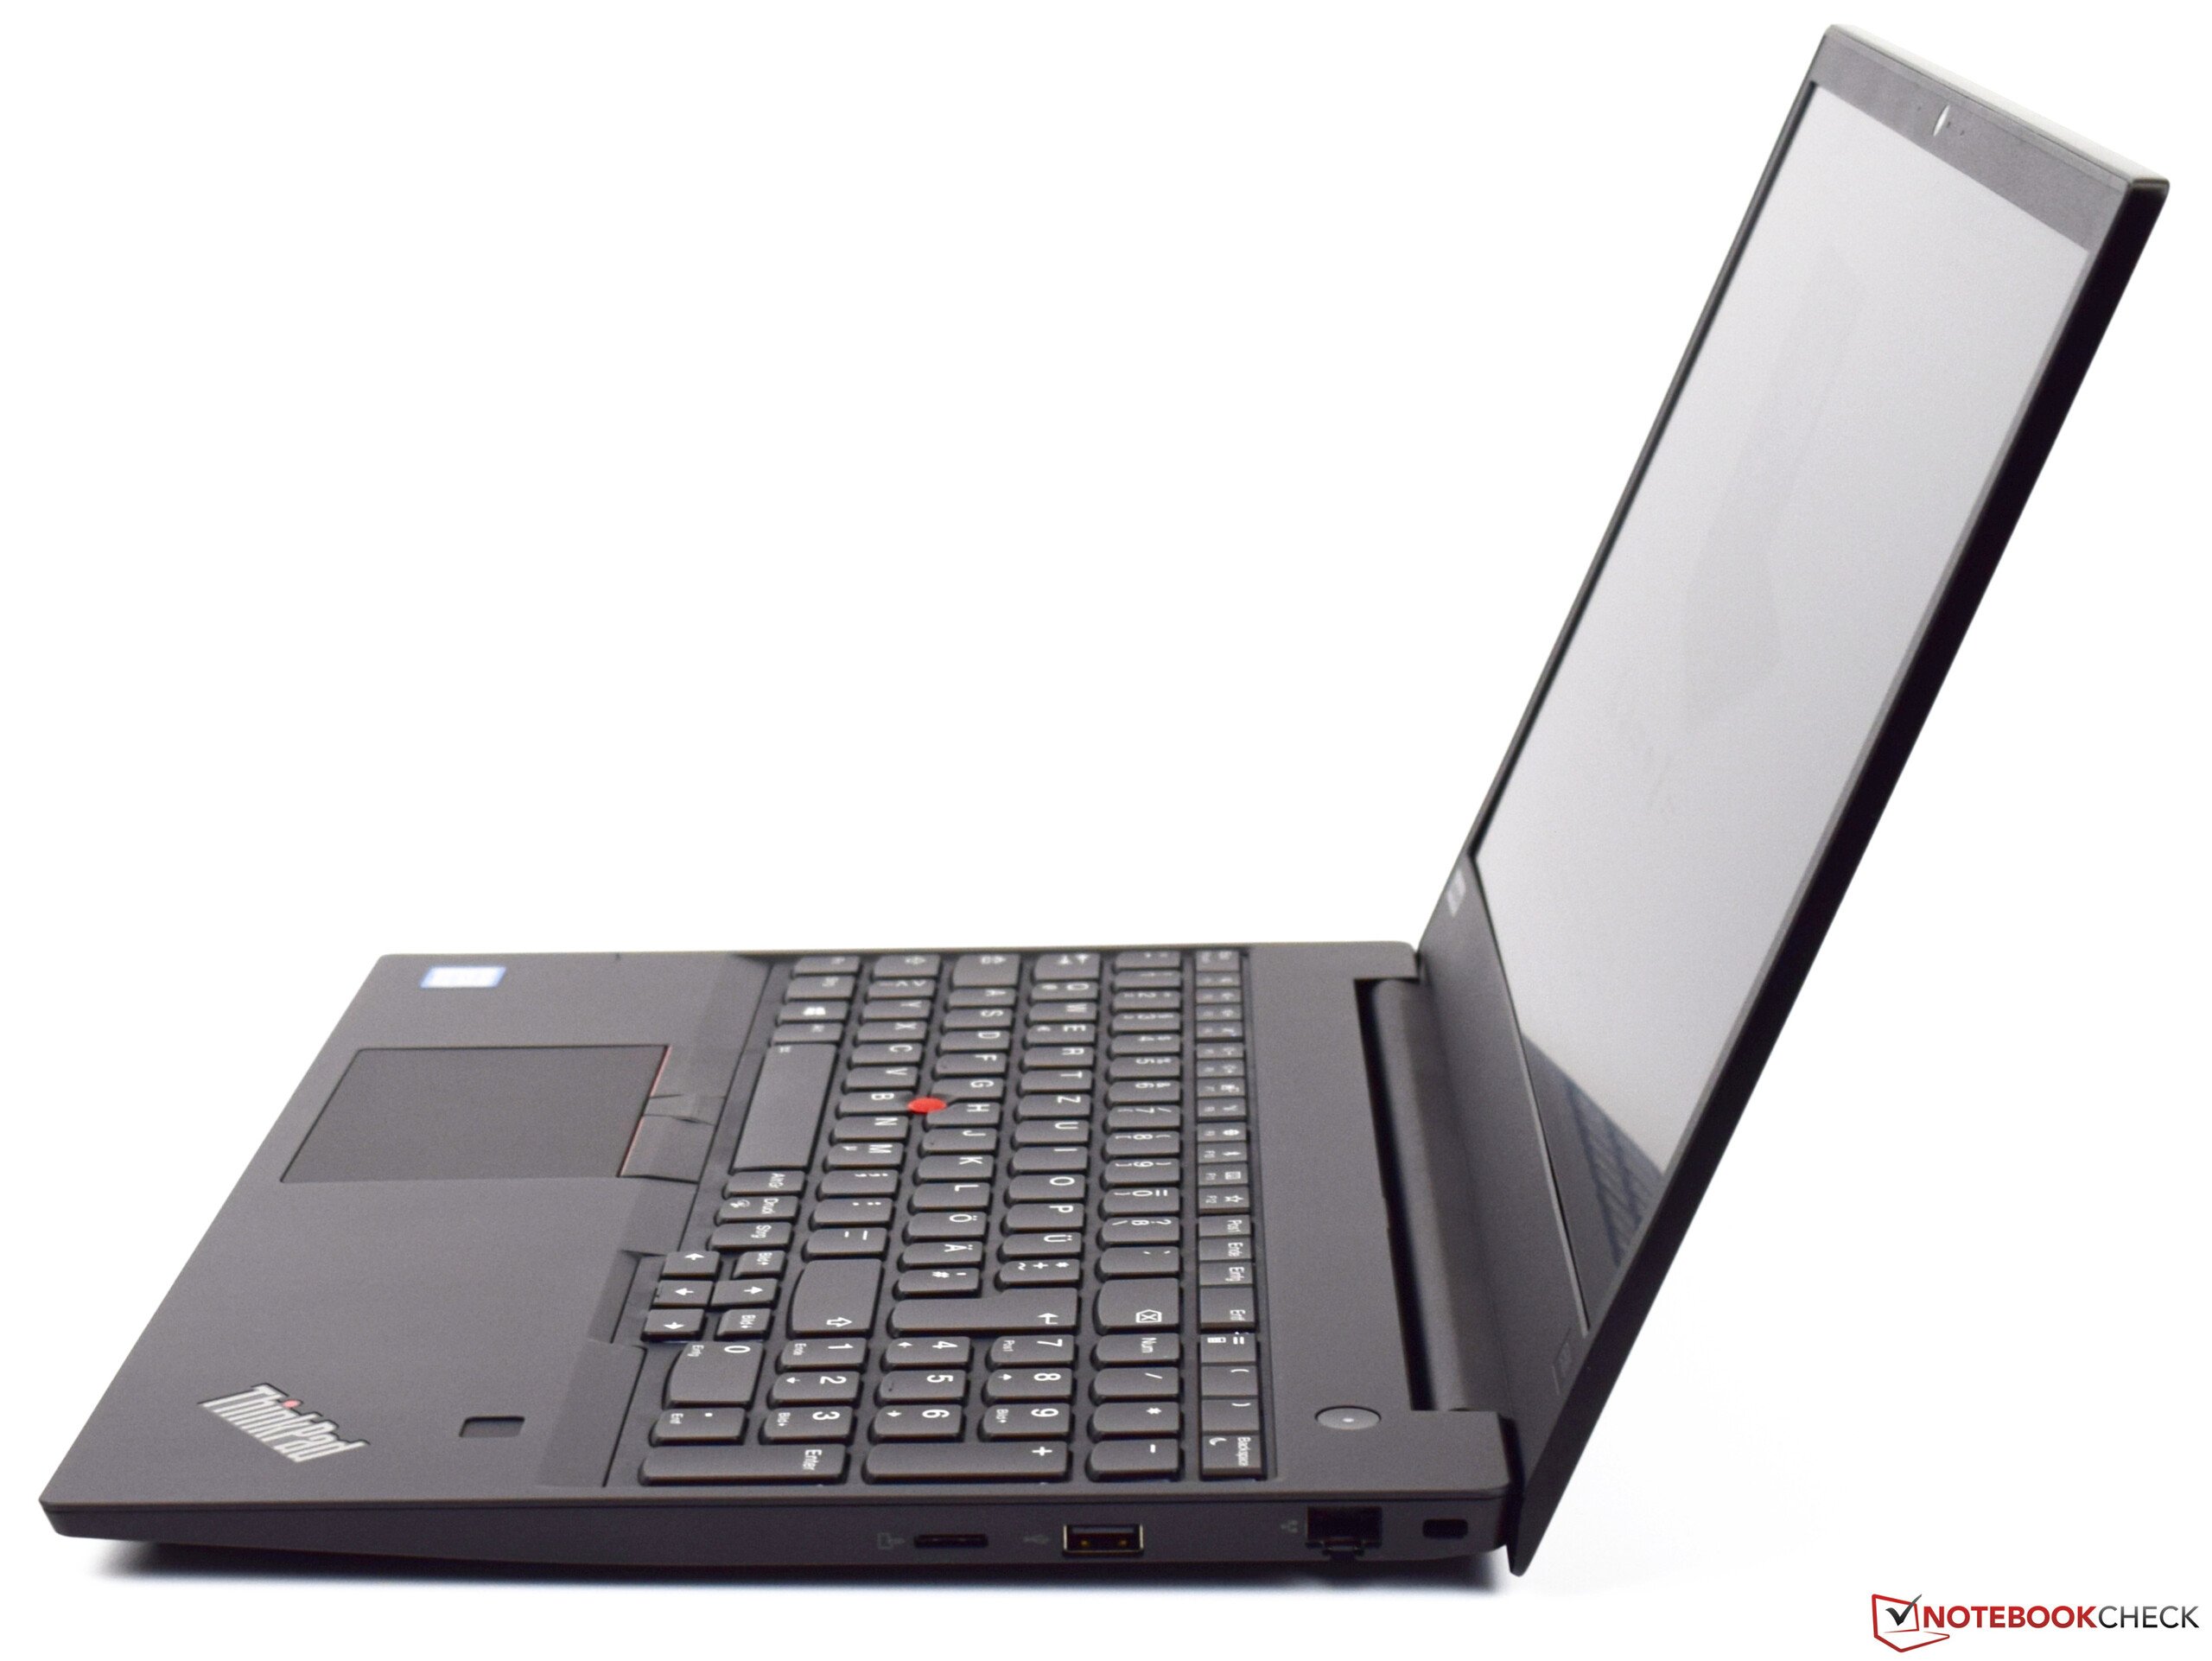
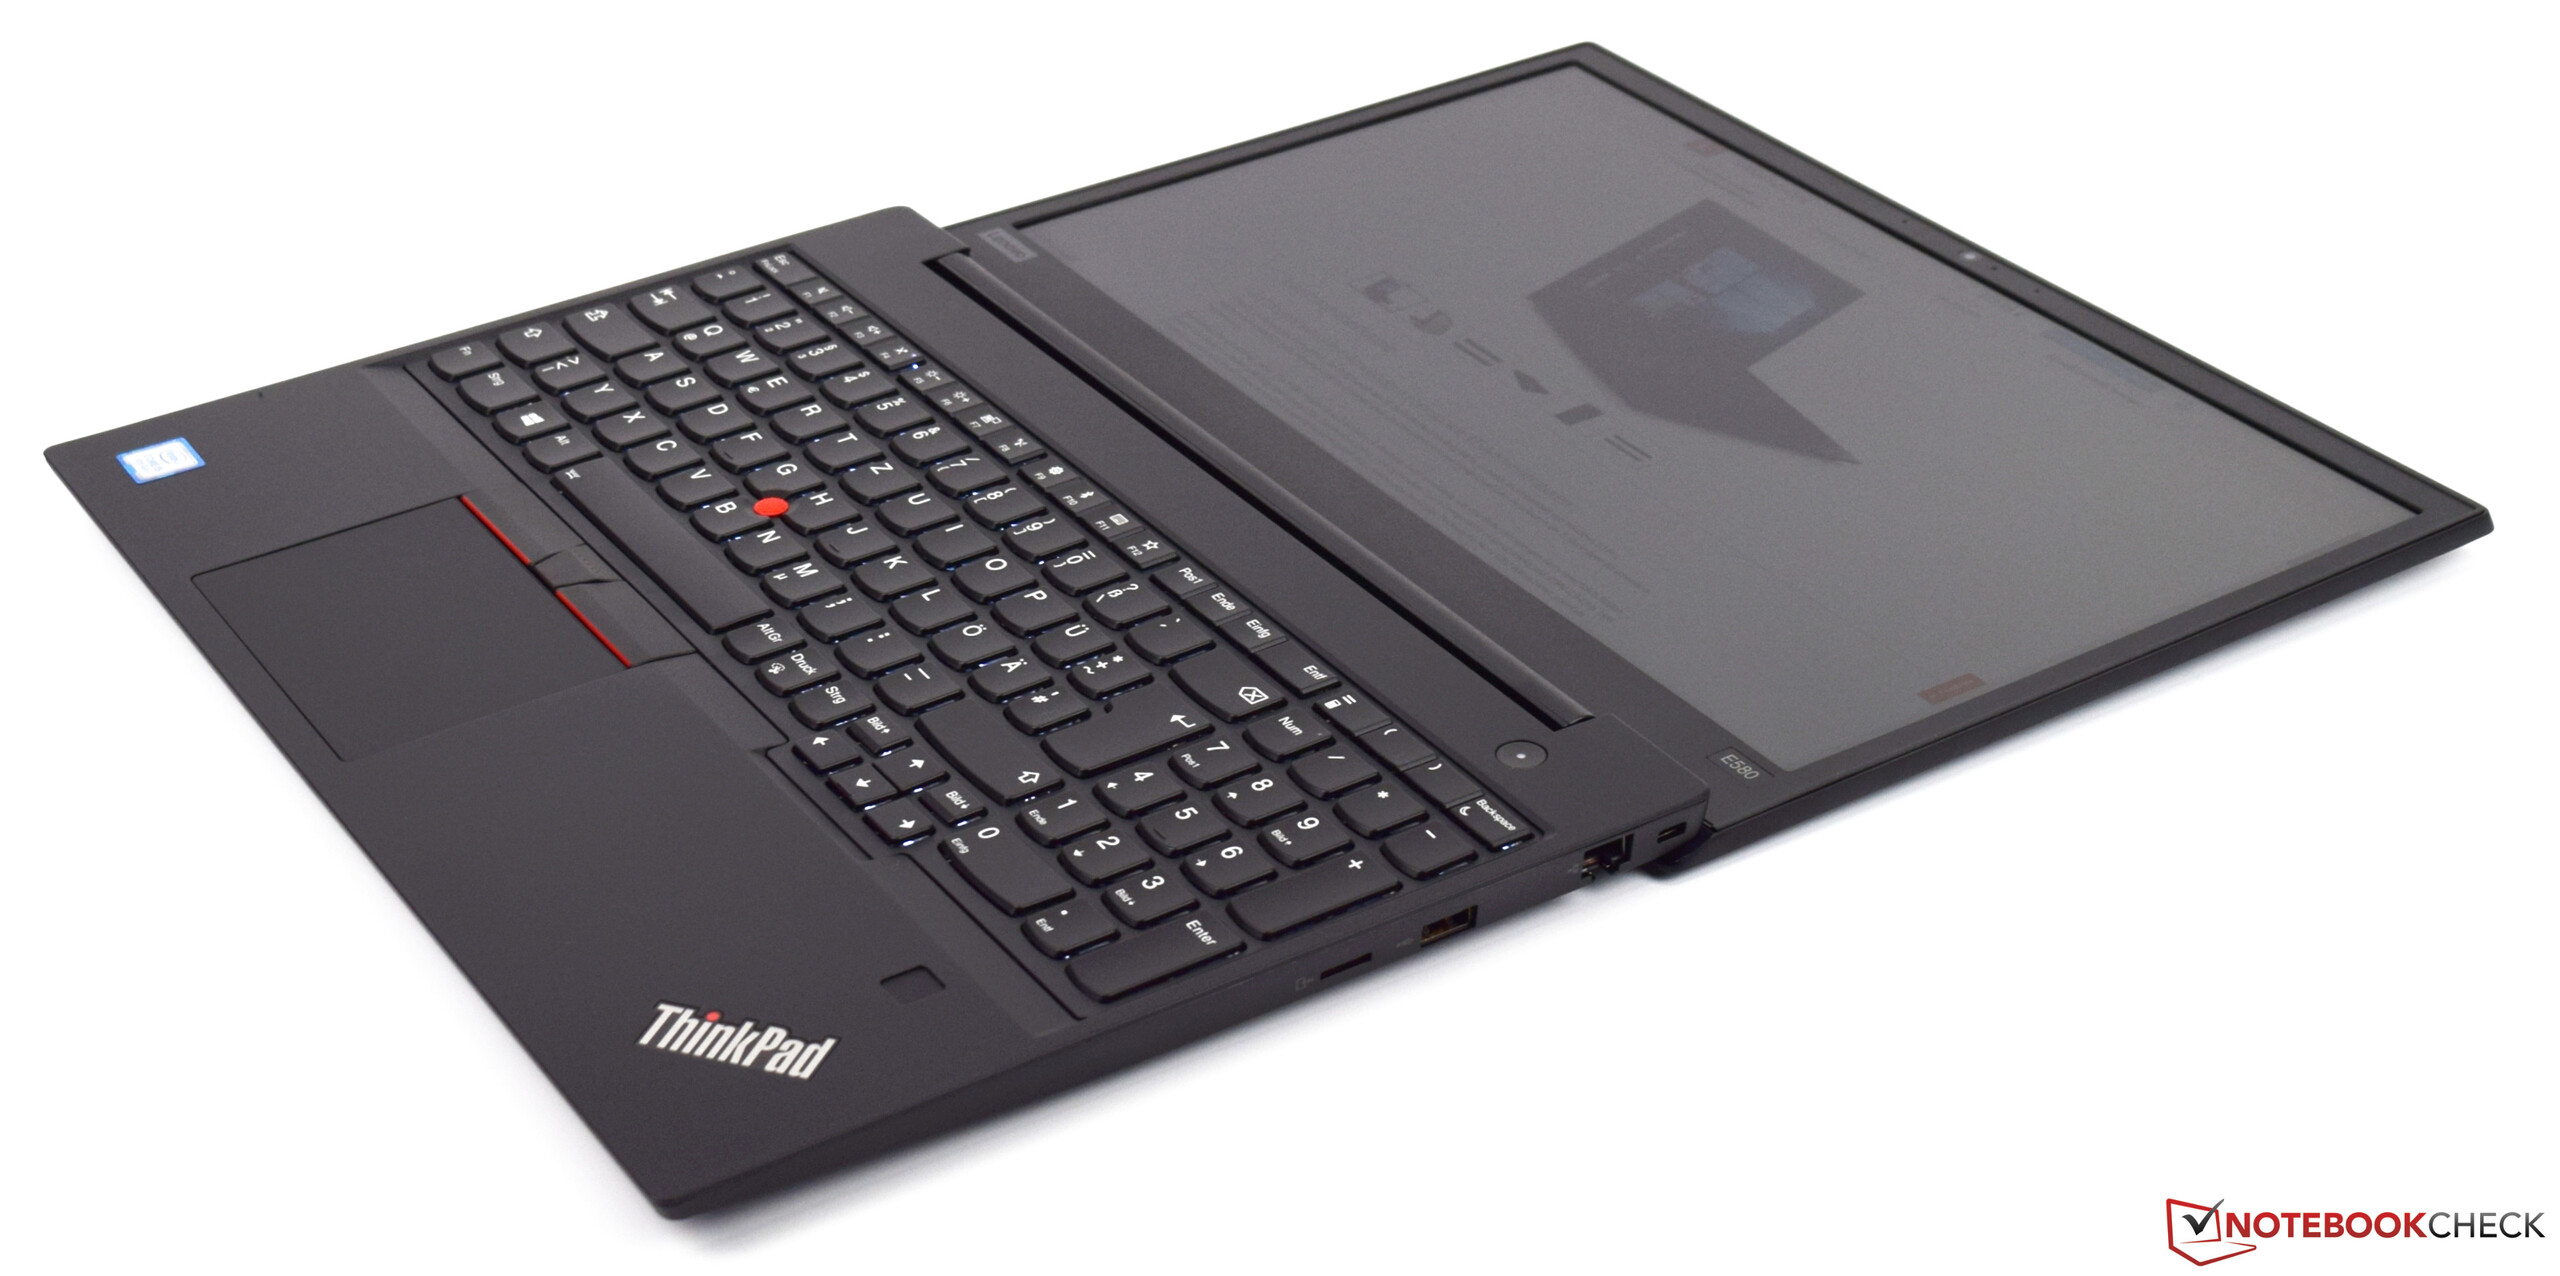
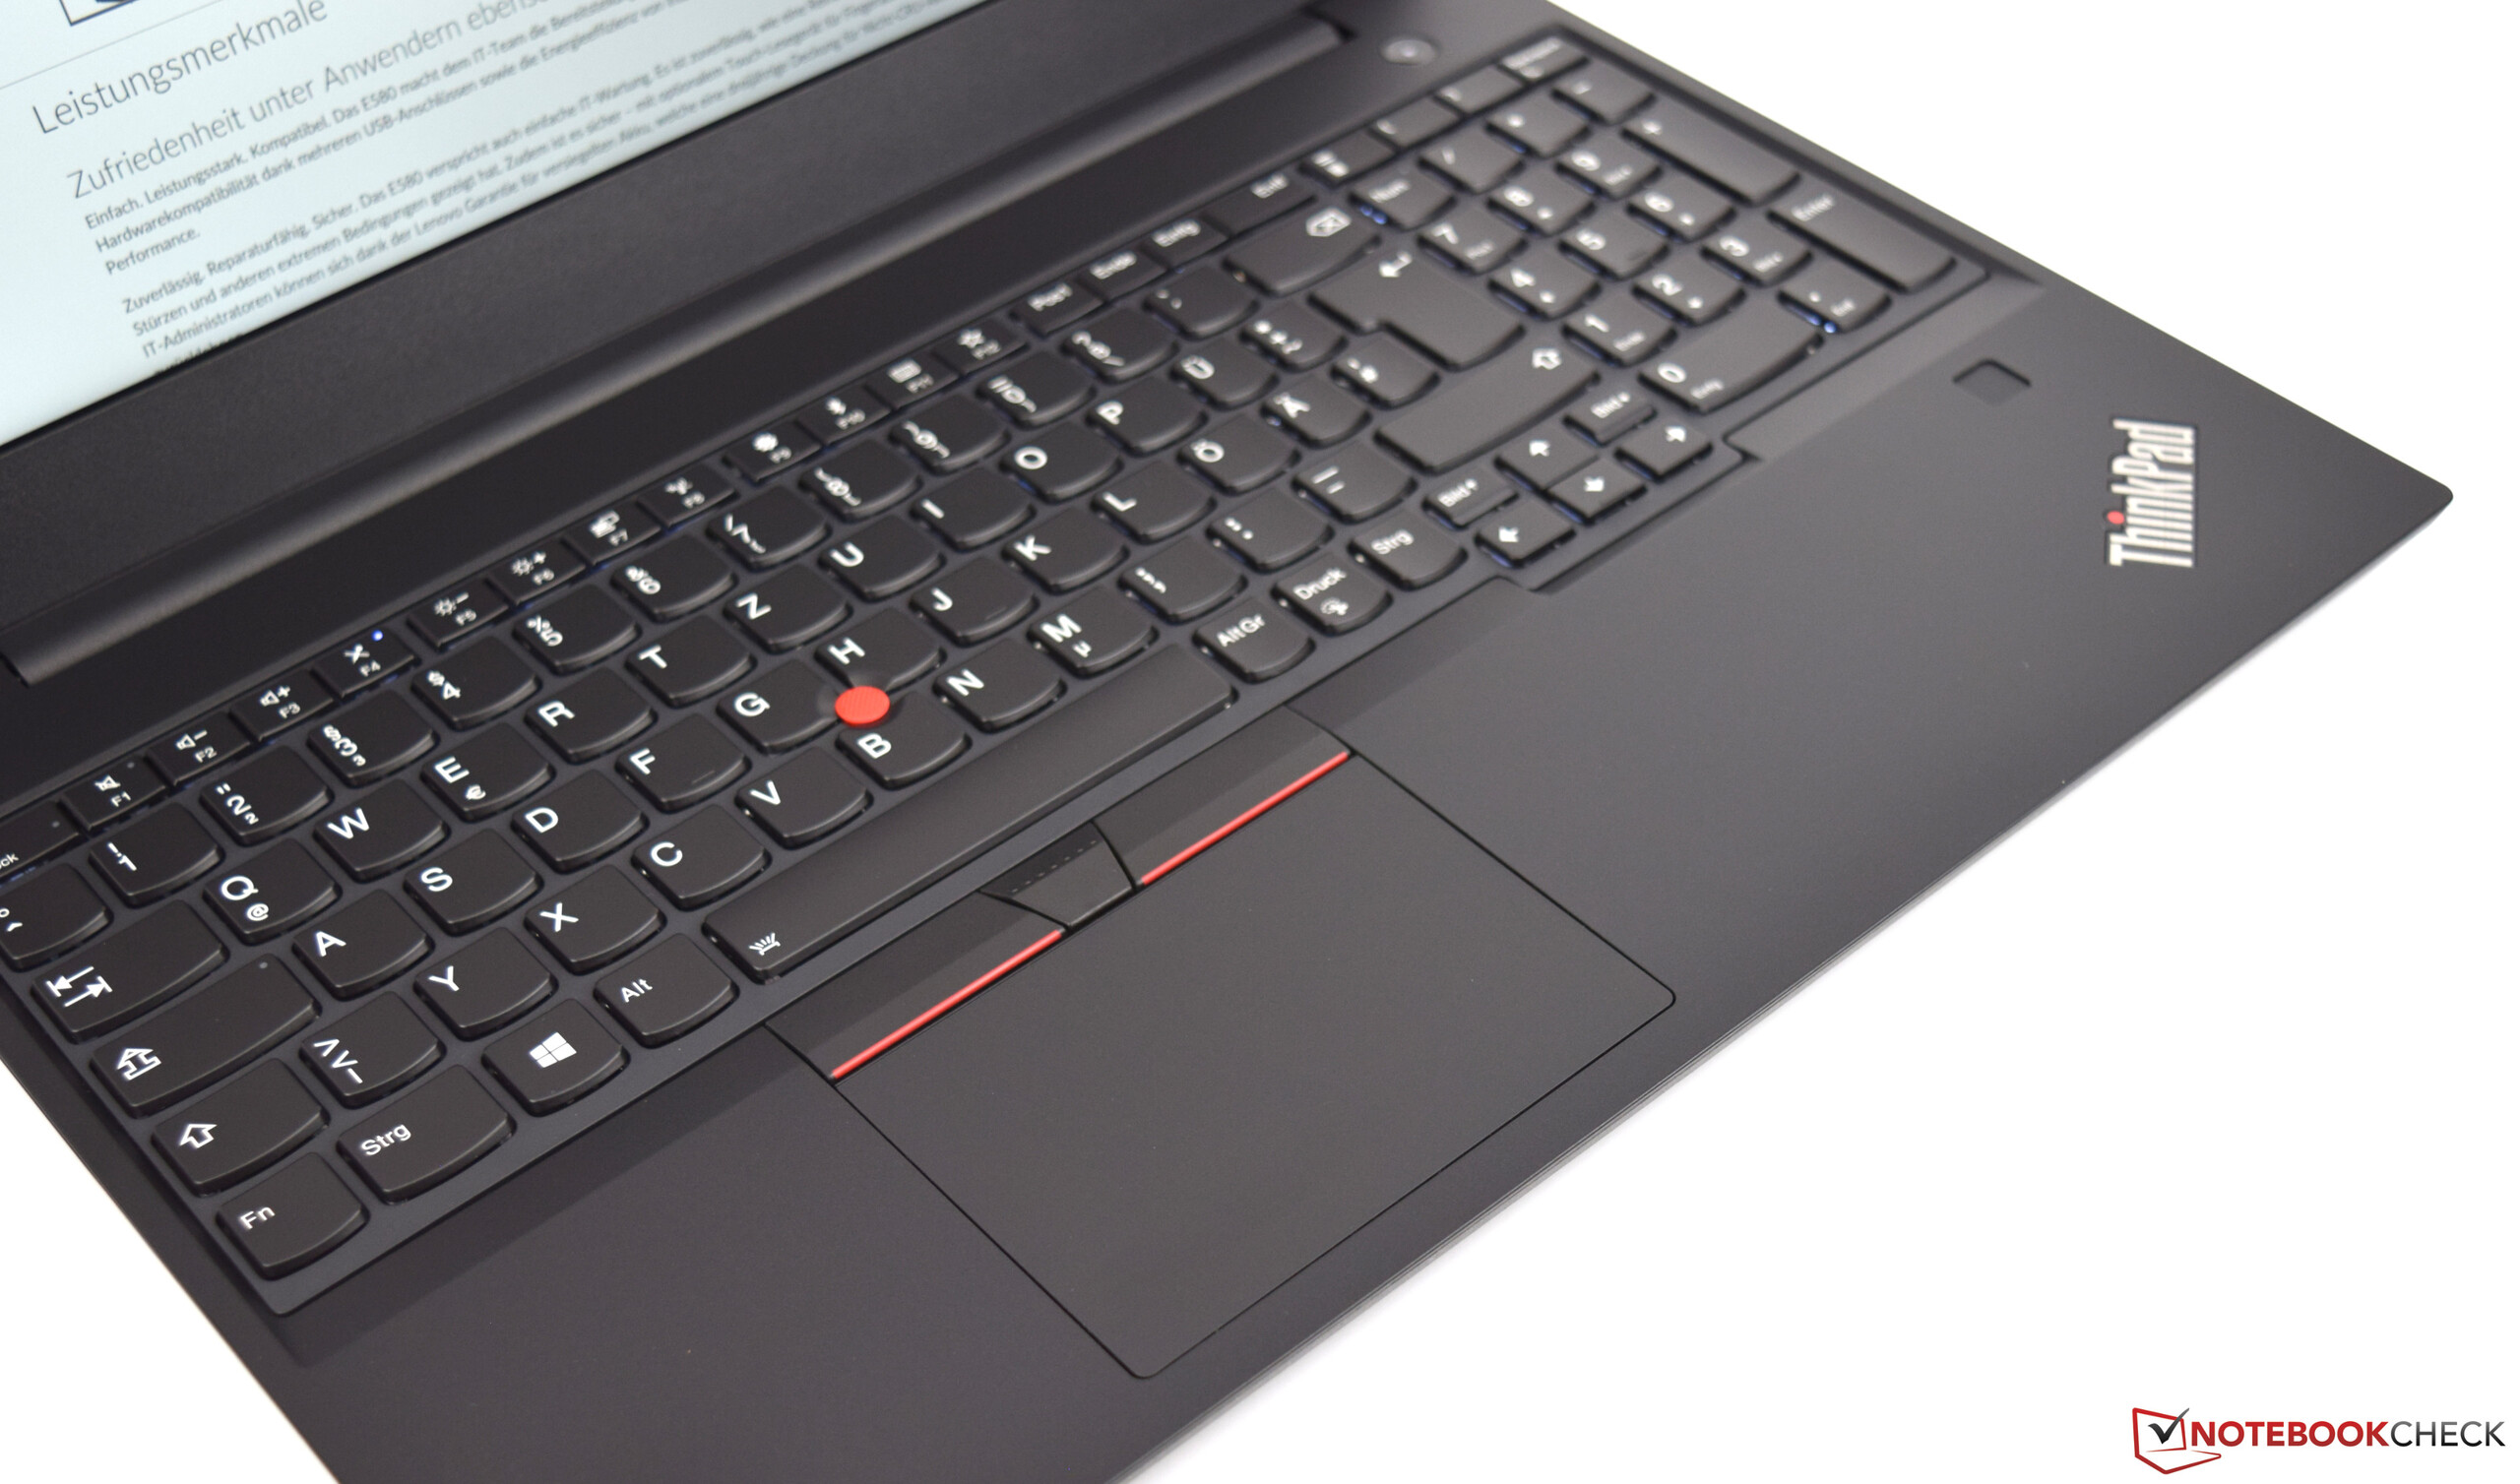
Lenovo ThinkPad E580 är en billig kontorslaptop av instegsmodell utrustad med en kraftfull och modern Intel Core i5-8250U processor. 8 GB DDR4-RAM borde vara tillräckligt för vardagligt kontorsarbete. SSD-enheten på 128 GB kanske verkar tillräckligt stor nu men kommer troligen bli för liten med tiden. En 256 GB SSD hade därför varit ett bättre val. Modellen med 128 GB är dock fullt tillräcklig att börja med. IPS-panelen är särskilt värd att nämna, särskilt med tanke på laptopens låga pris. Dom flesta billiga kontorsmodeller är bara utrustade med billiga och jämförelsevis dåliga TN-paneler.
Lenovo ThinkPad E580 har allt som du behöver av en billig kontorslaptop. SSD-enhetens begränsade lagringskapacitet är en kompromiss, men den totala systemprestandan var väldigt hyfsad med tanke på laptopens låga pris. Enheten förtjänar därför vårt fulla stöd.
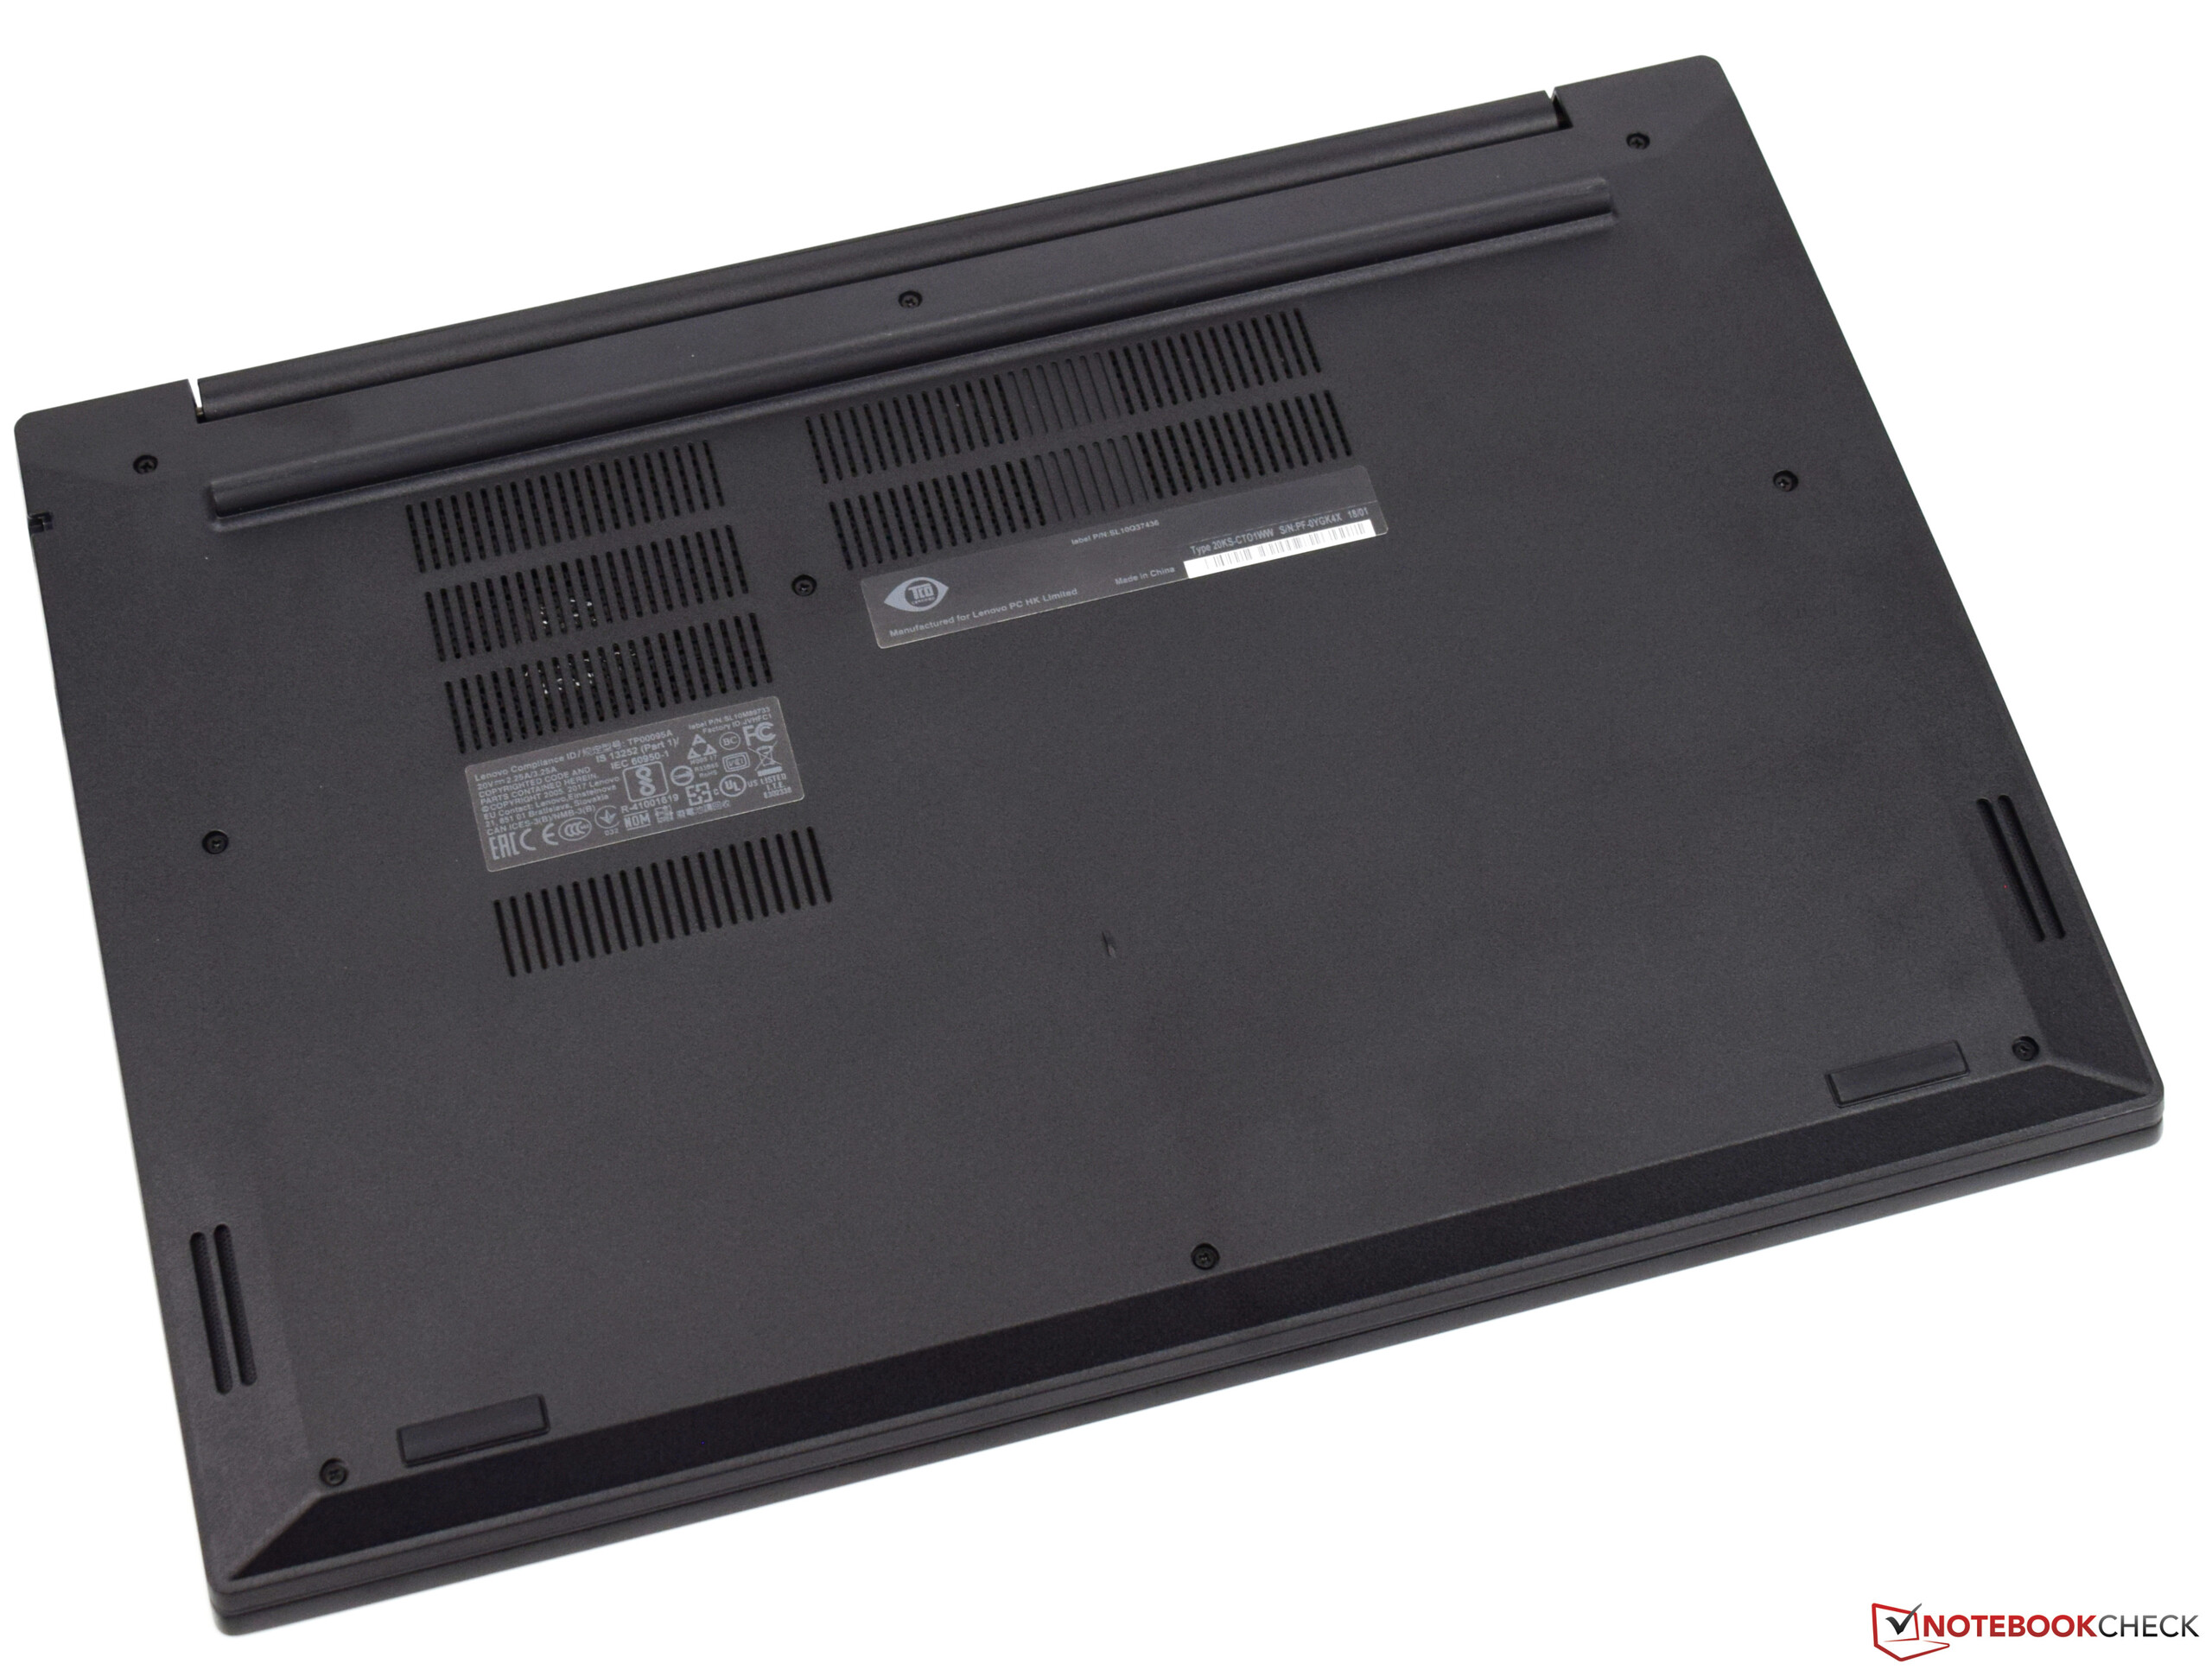
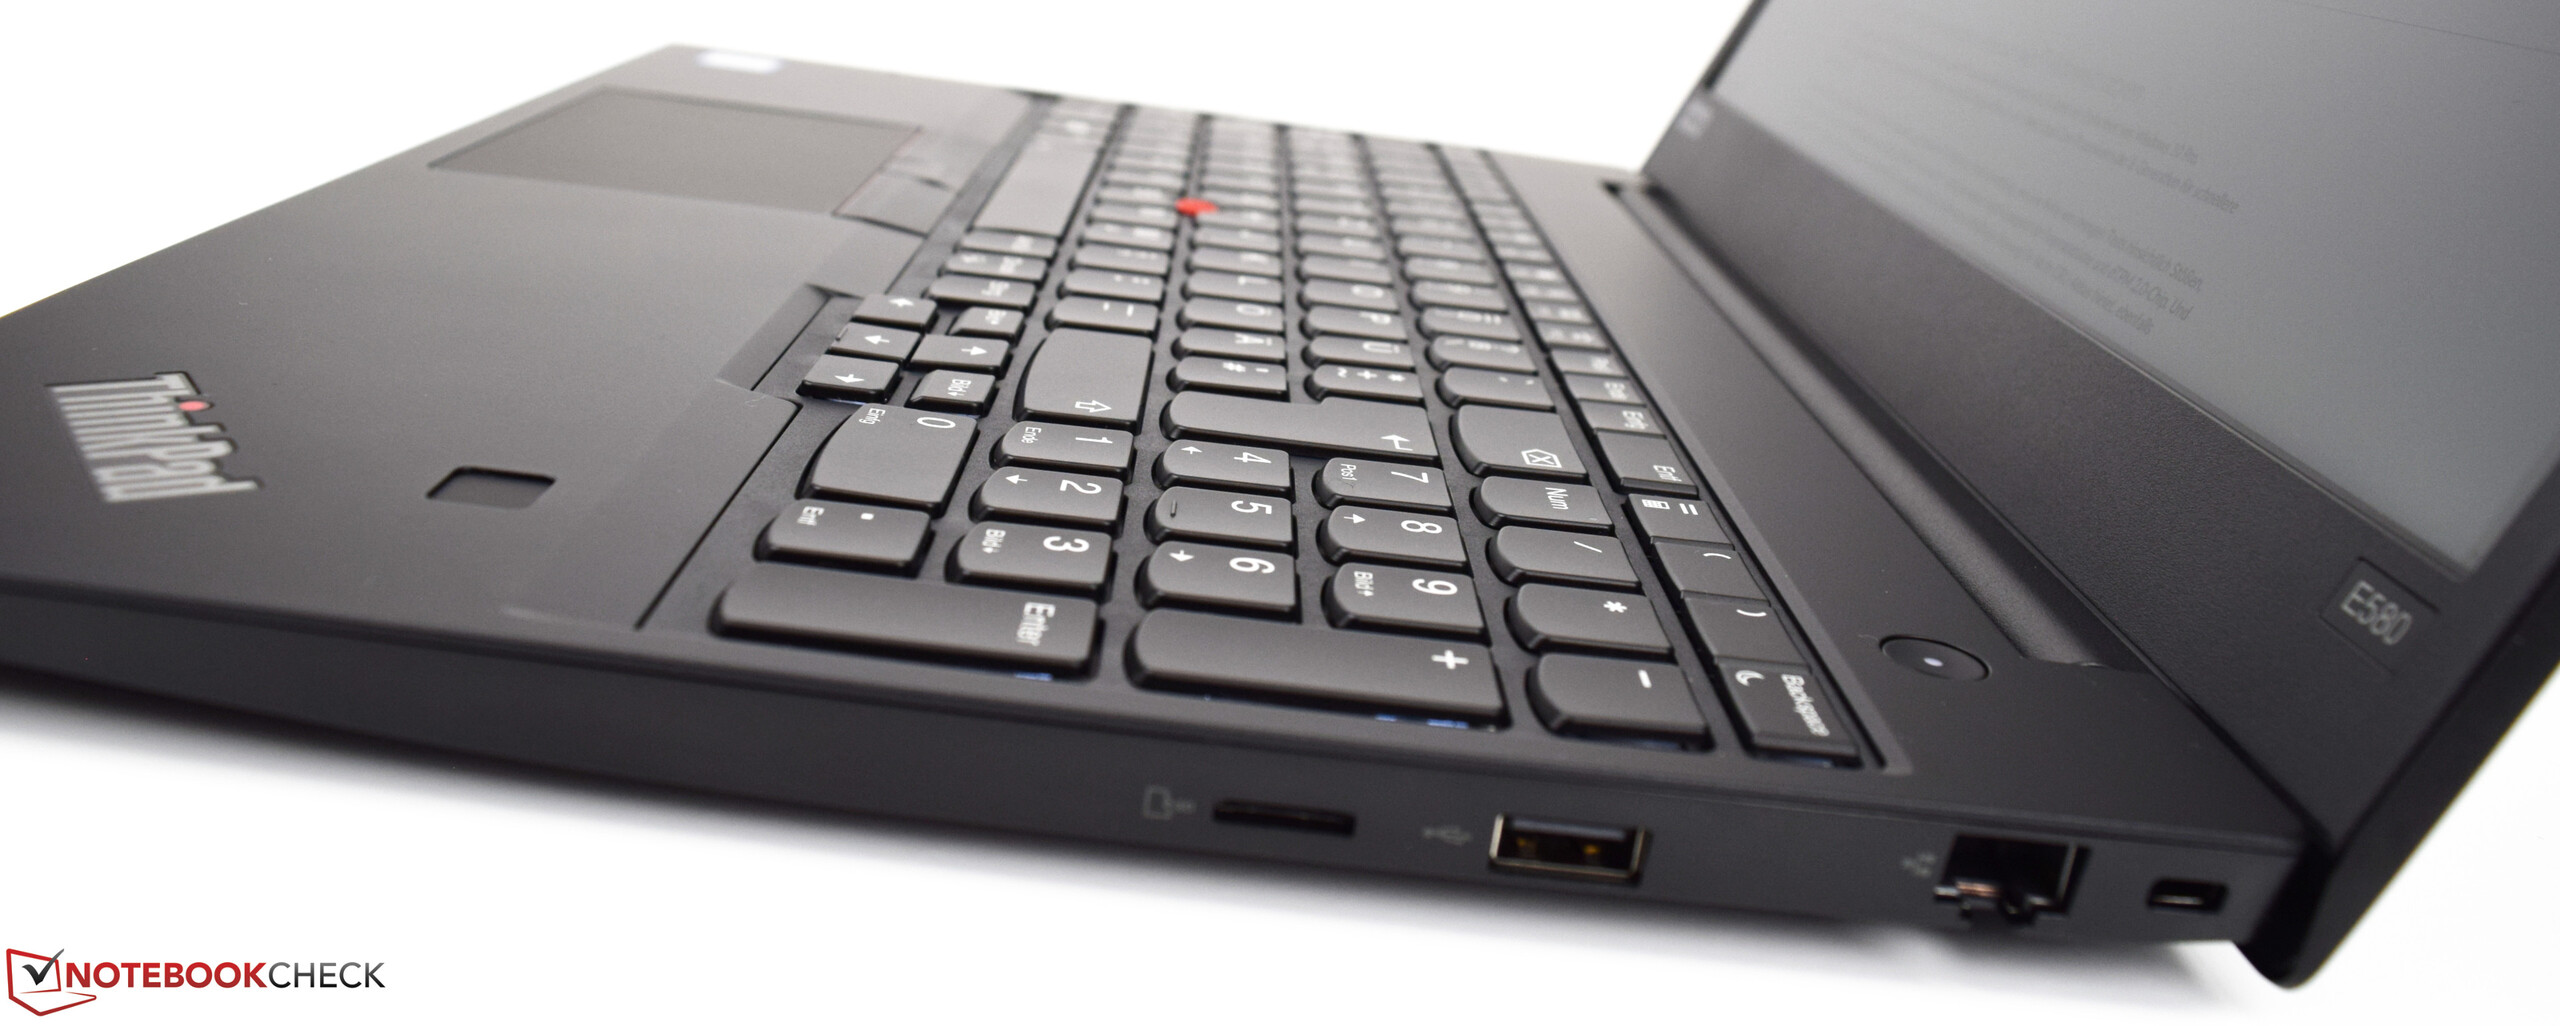
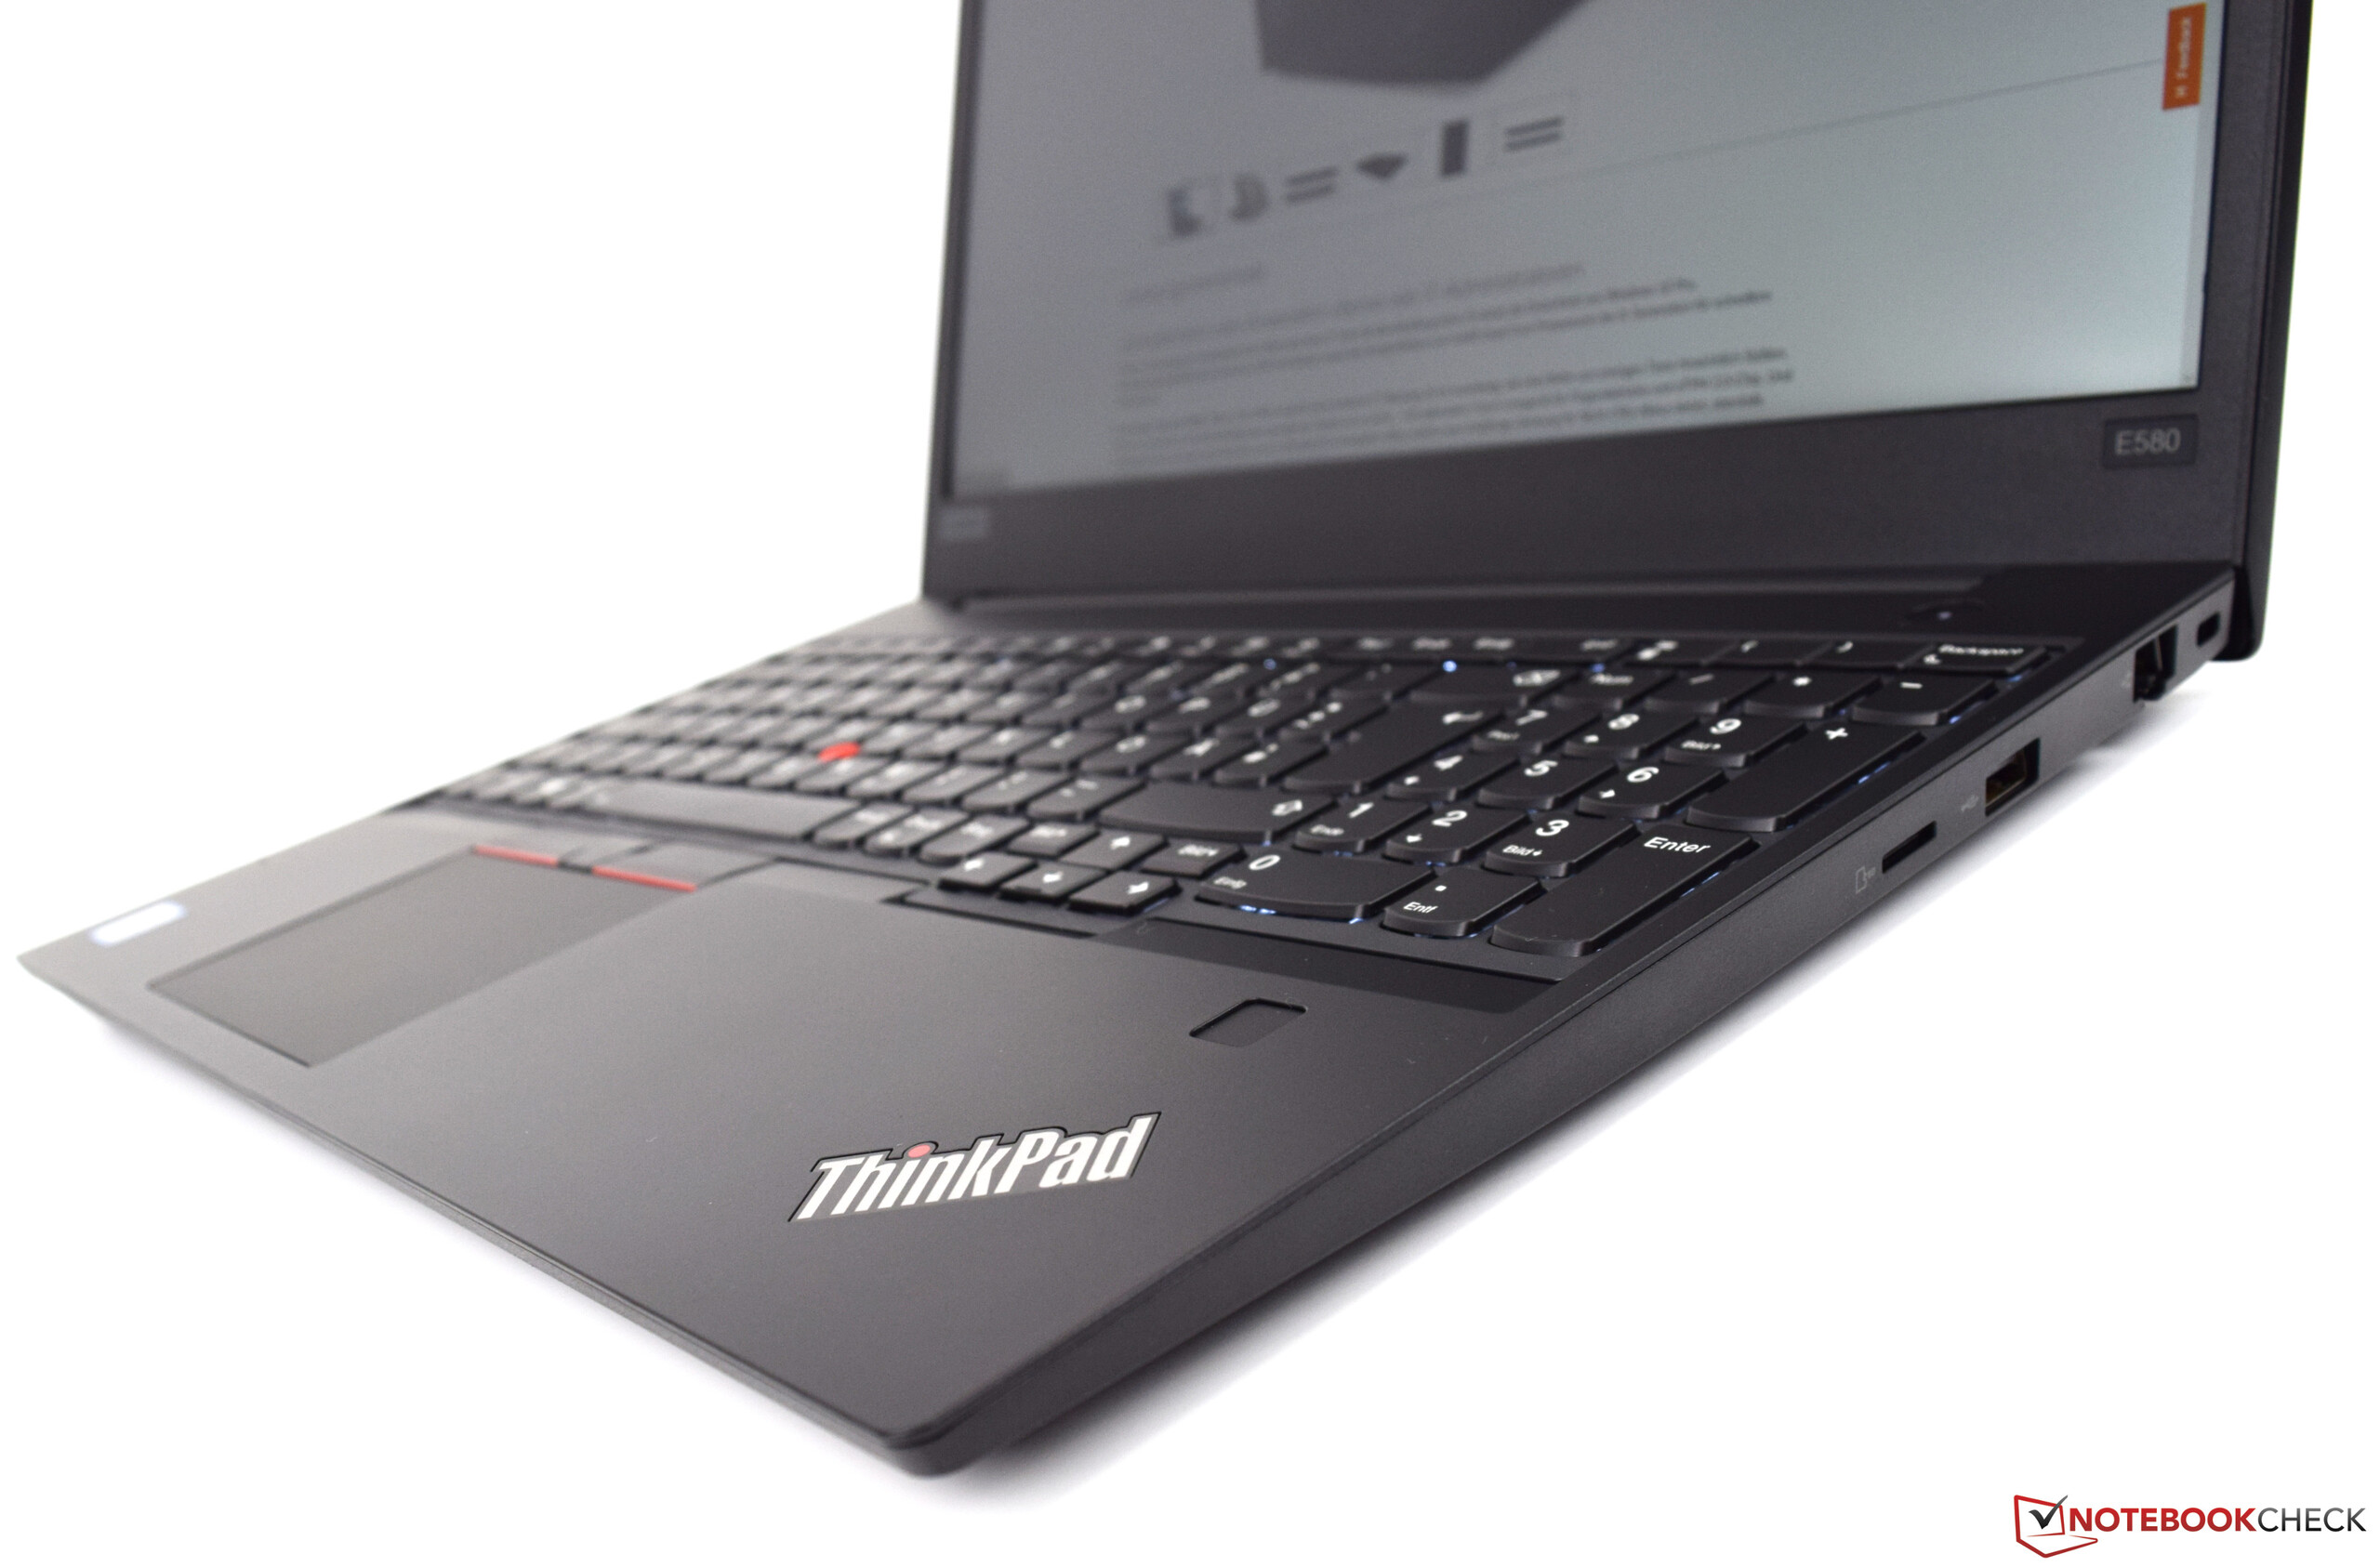
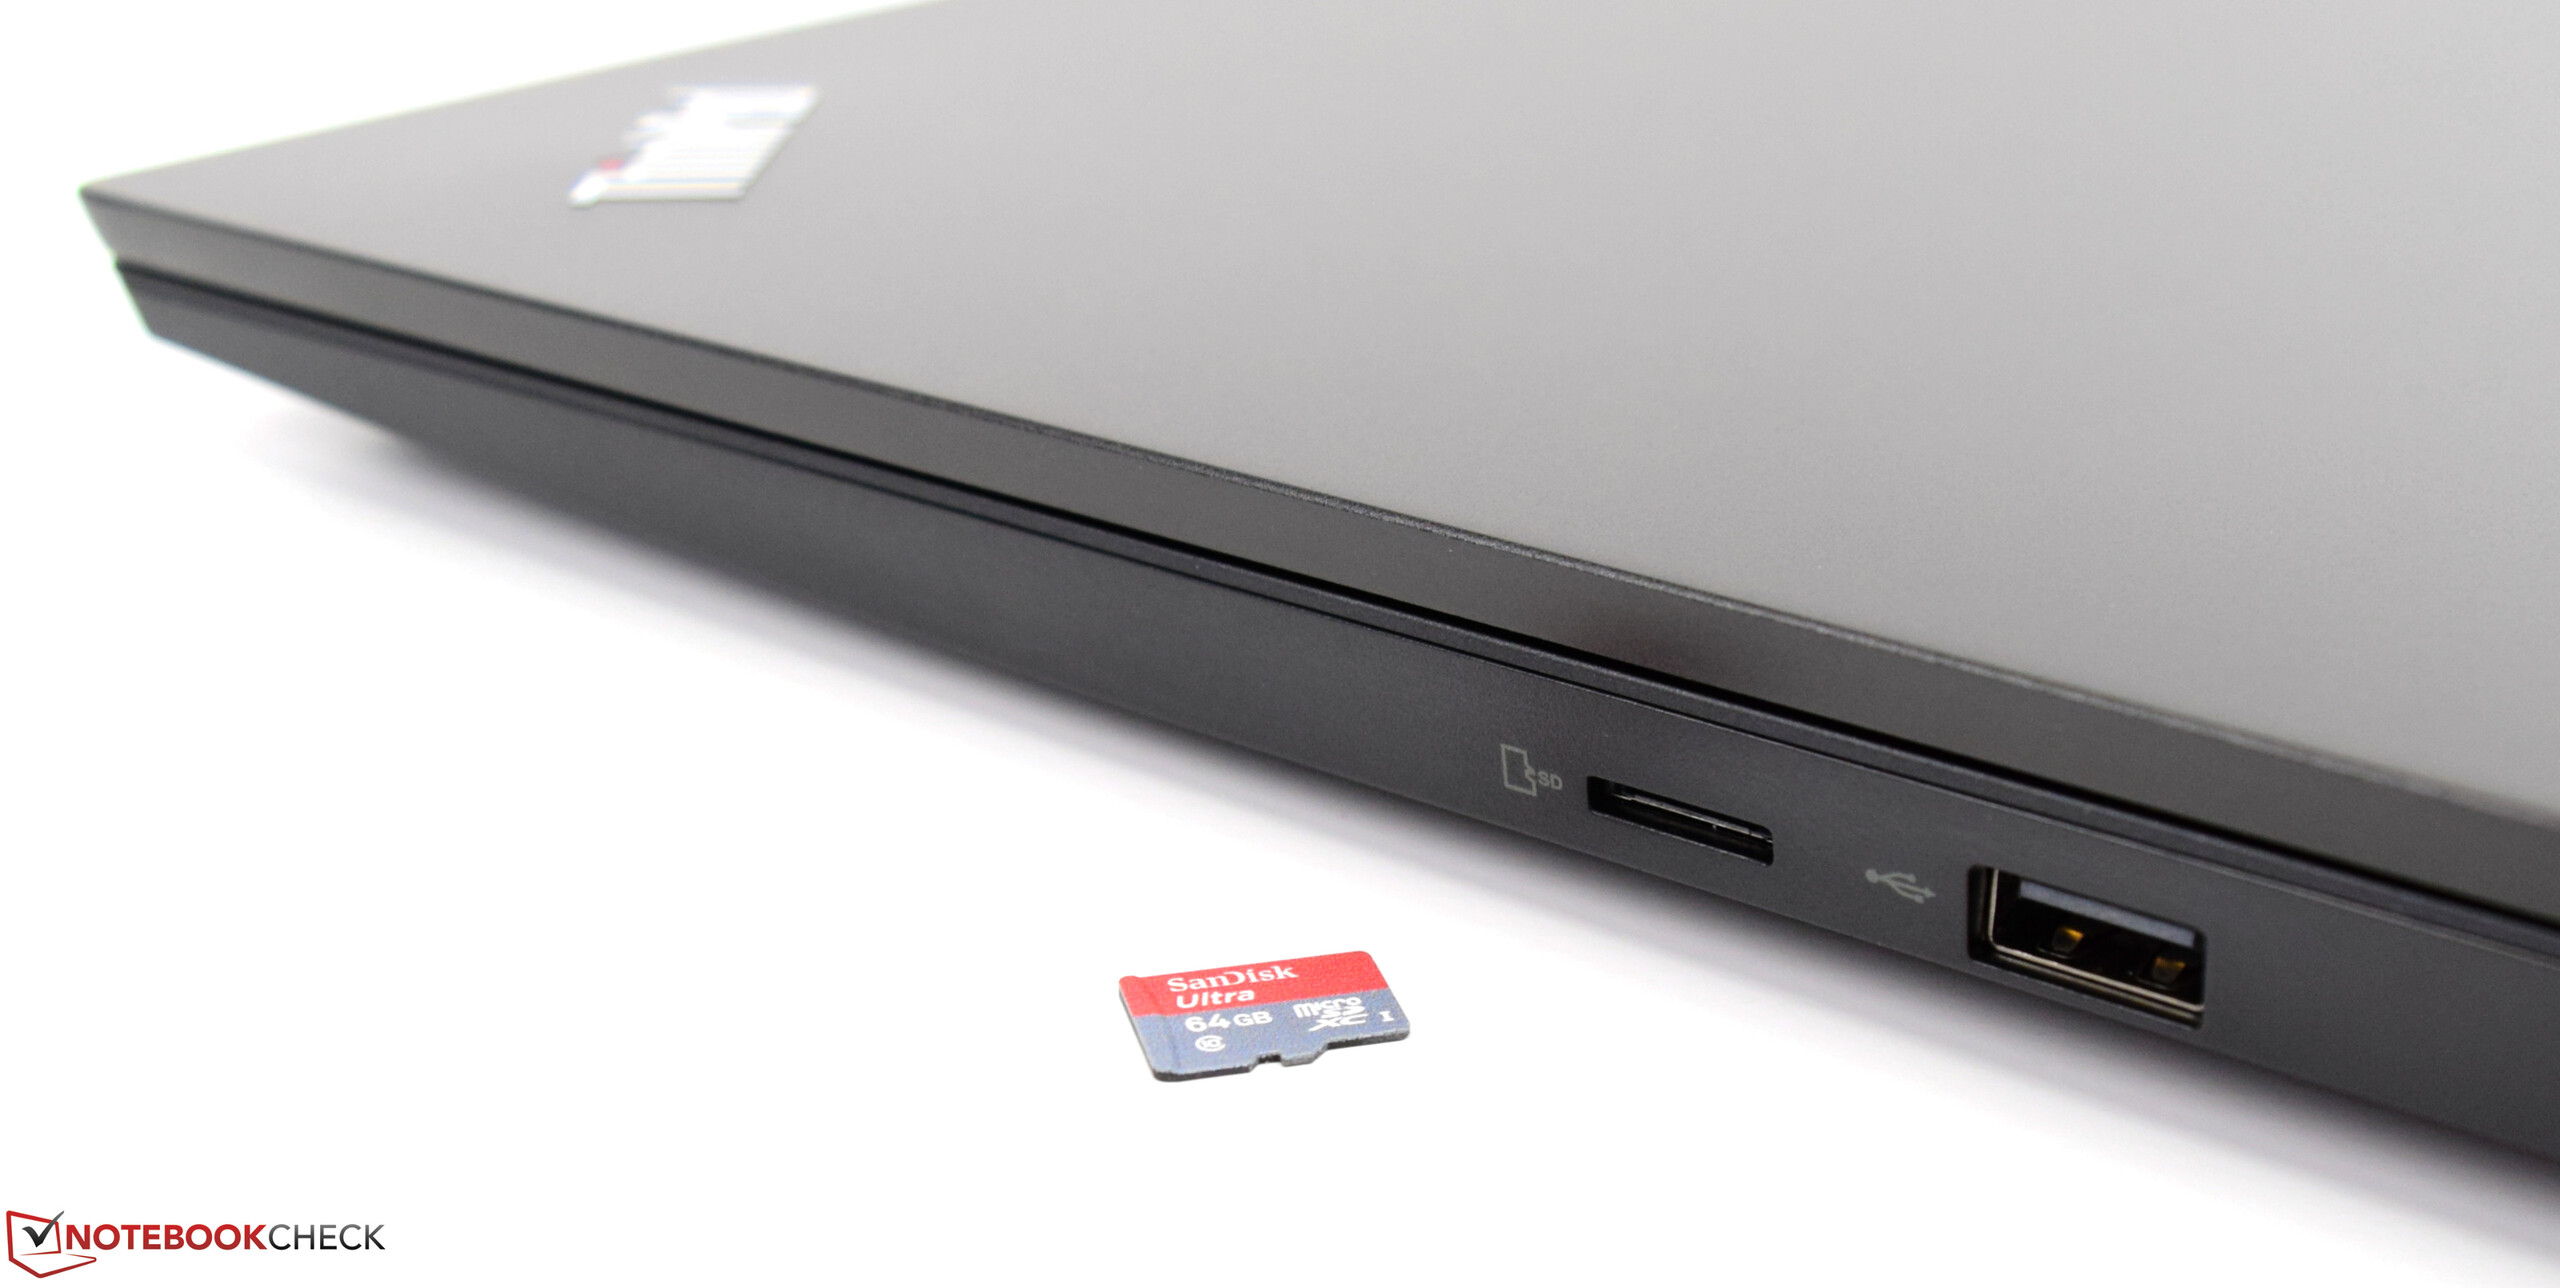
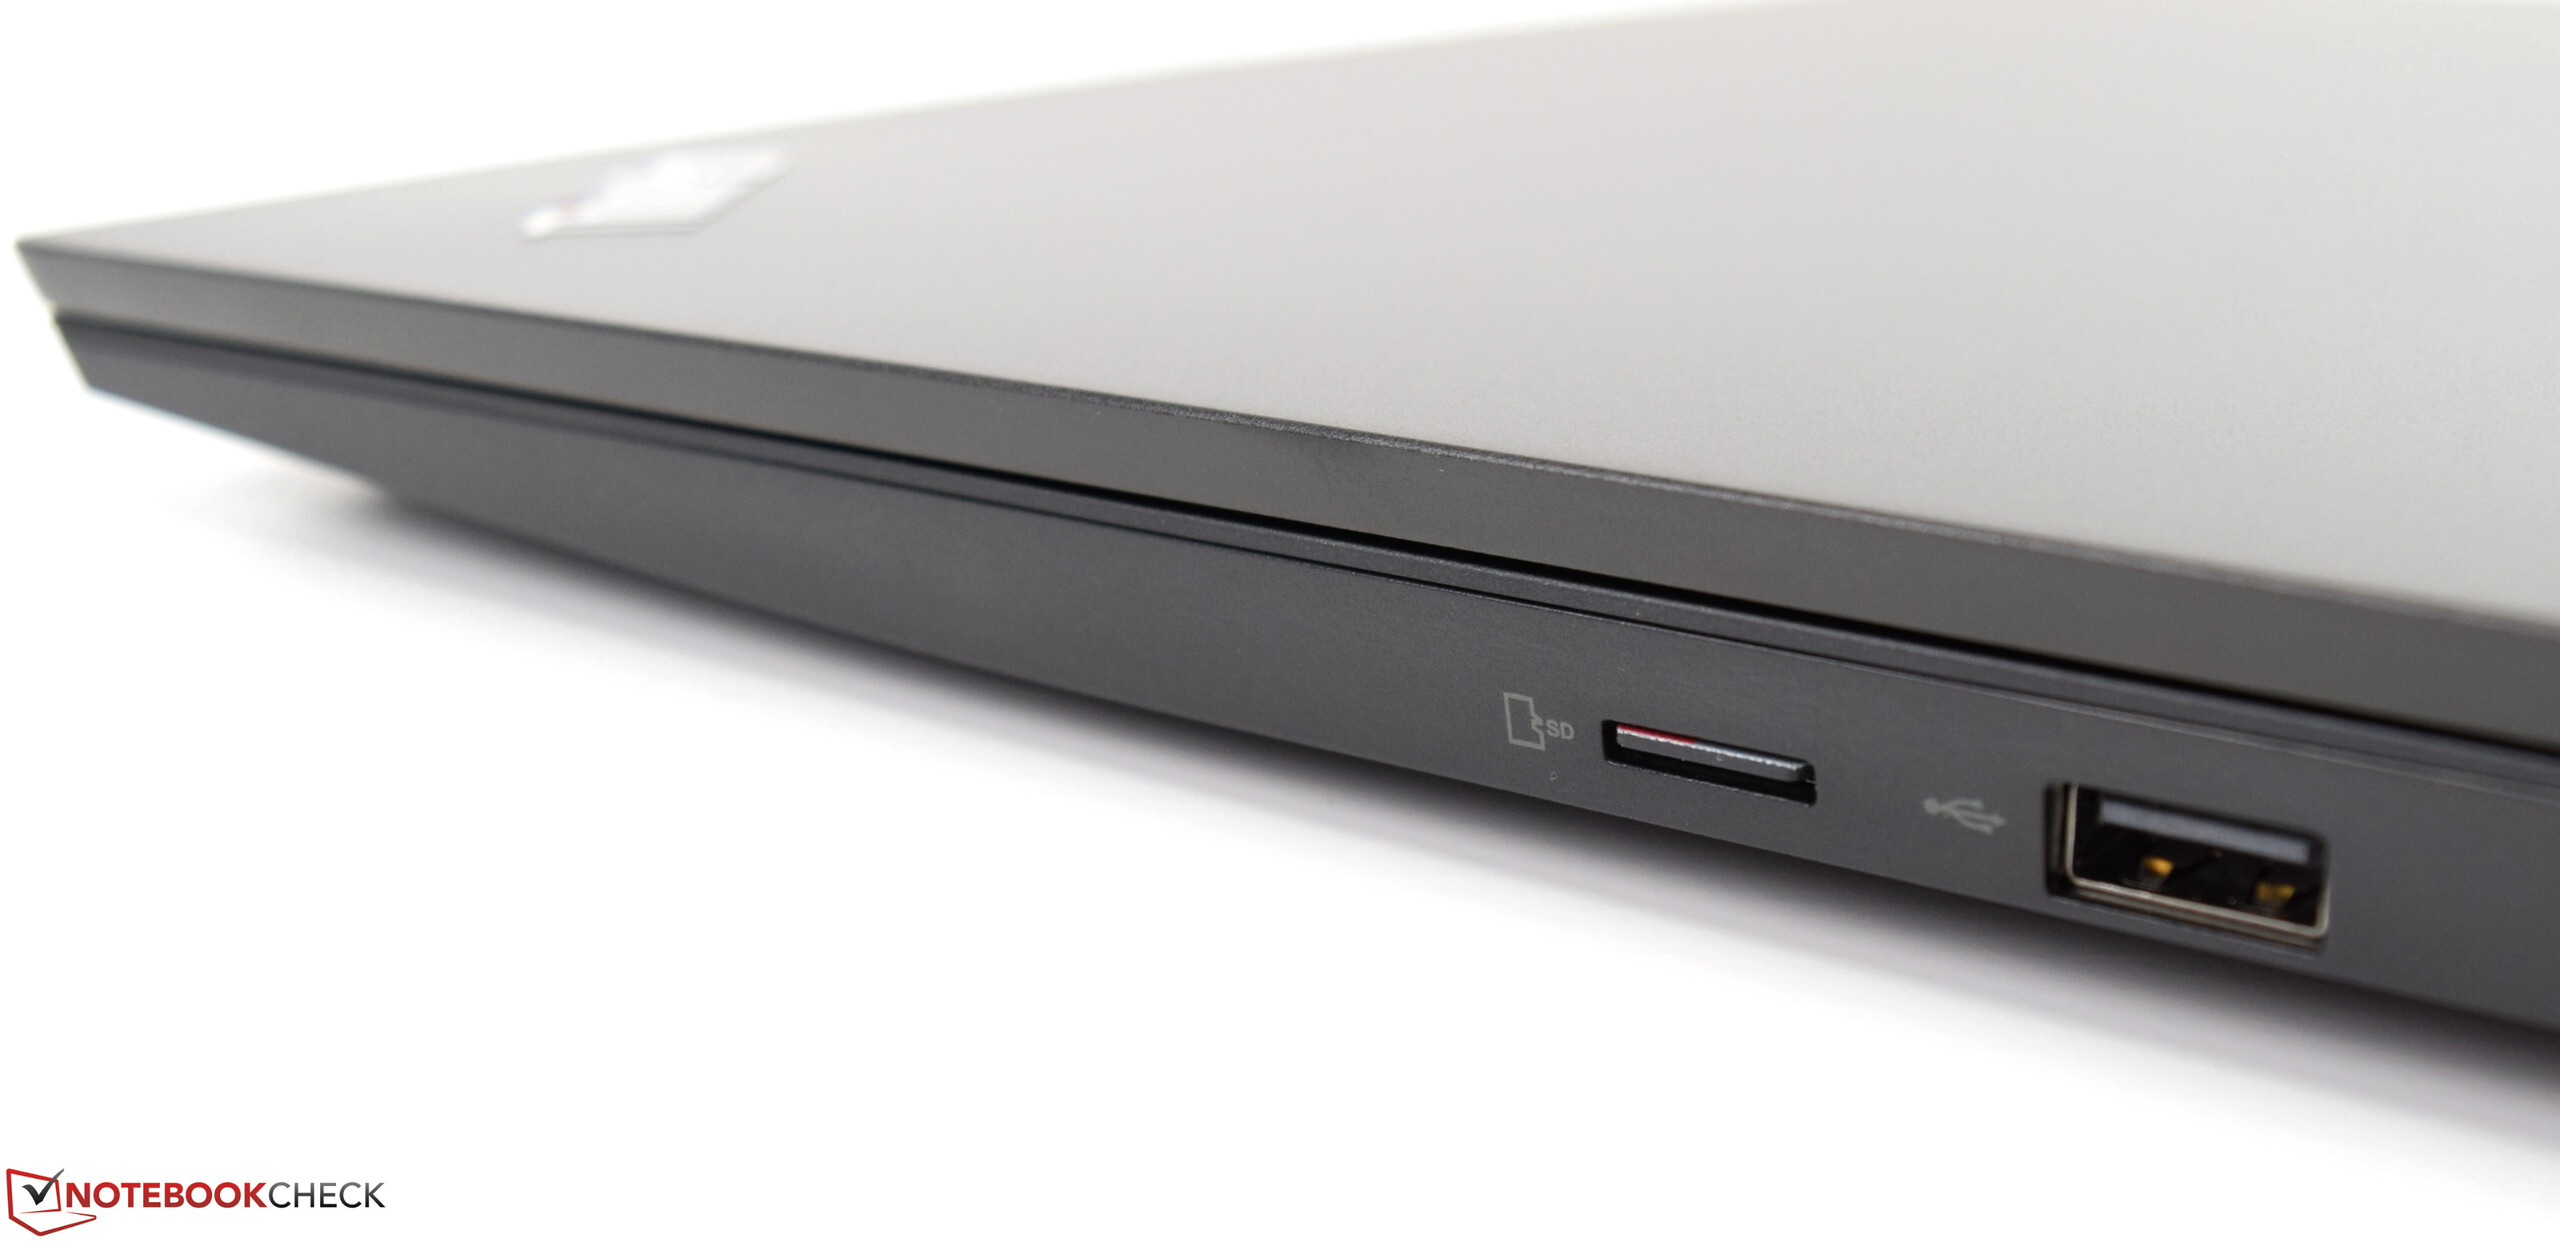
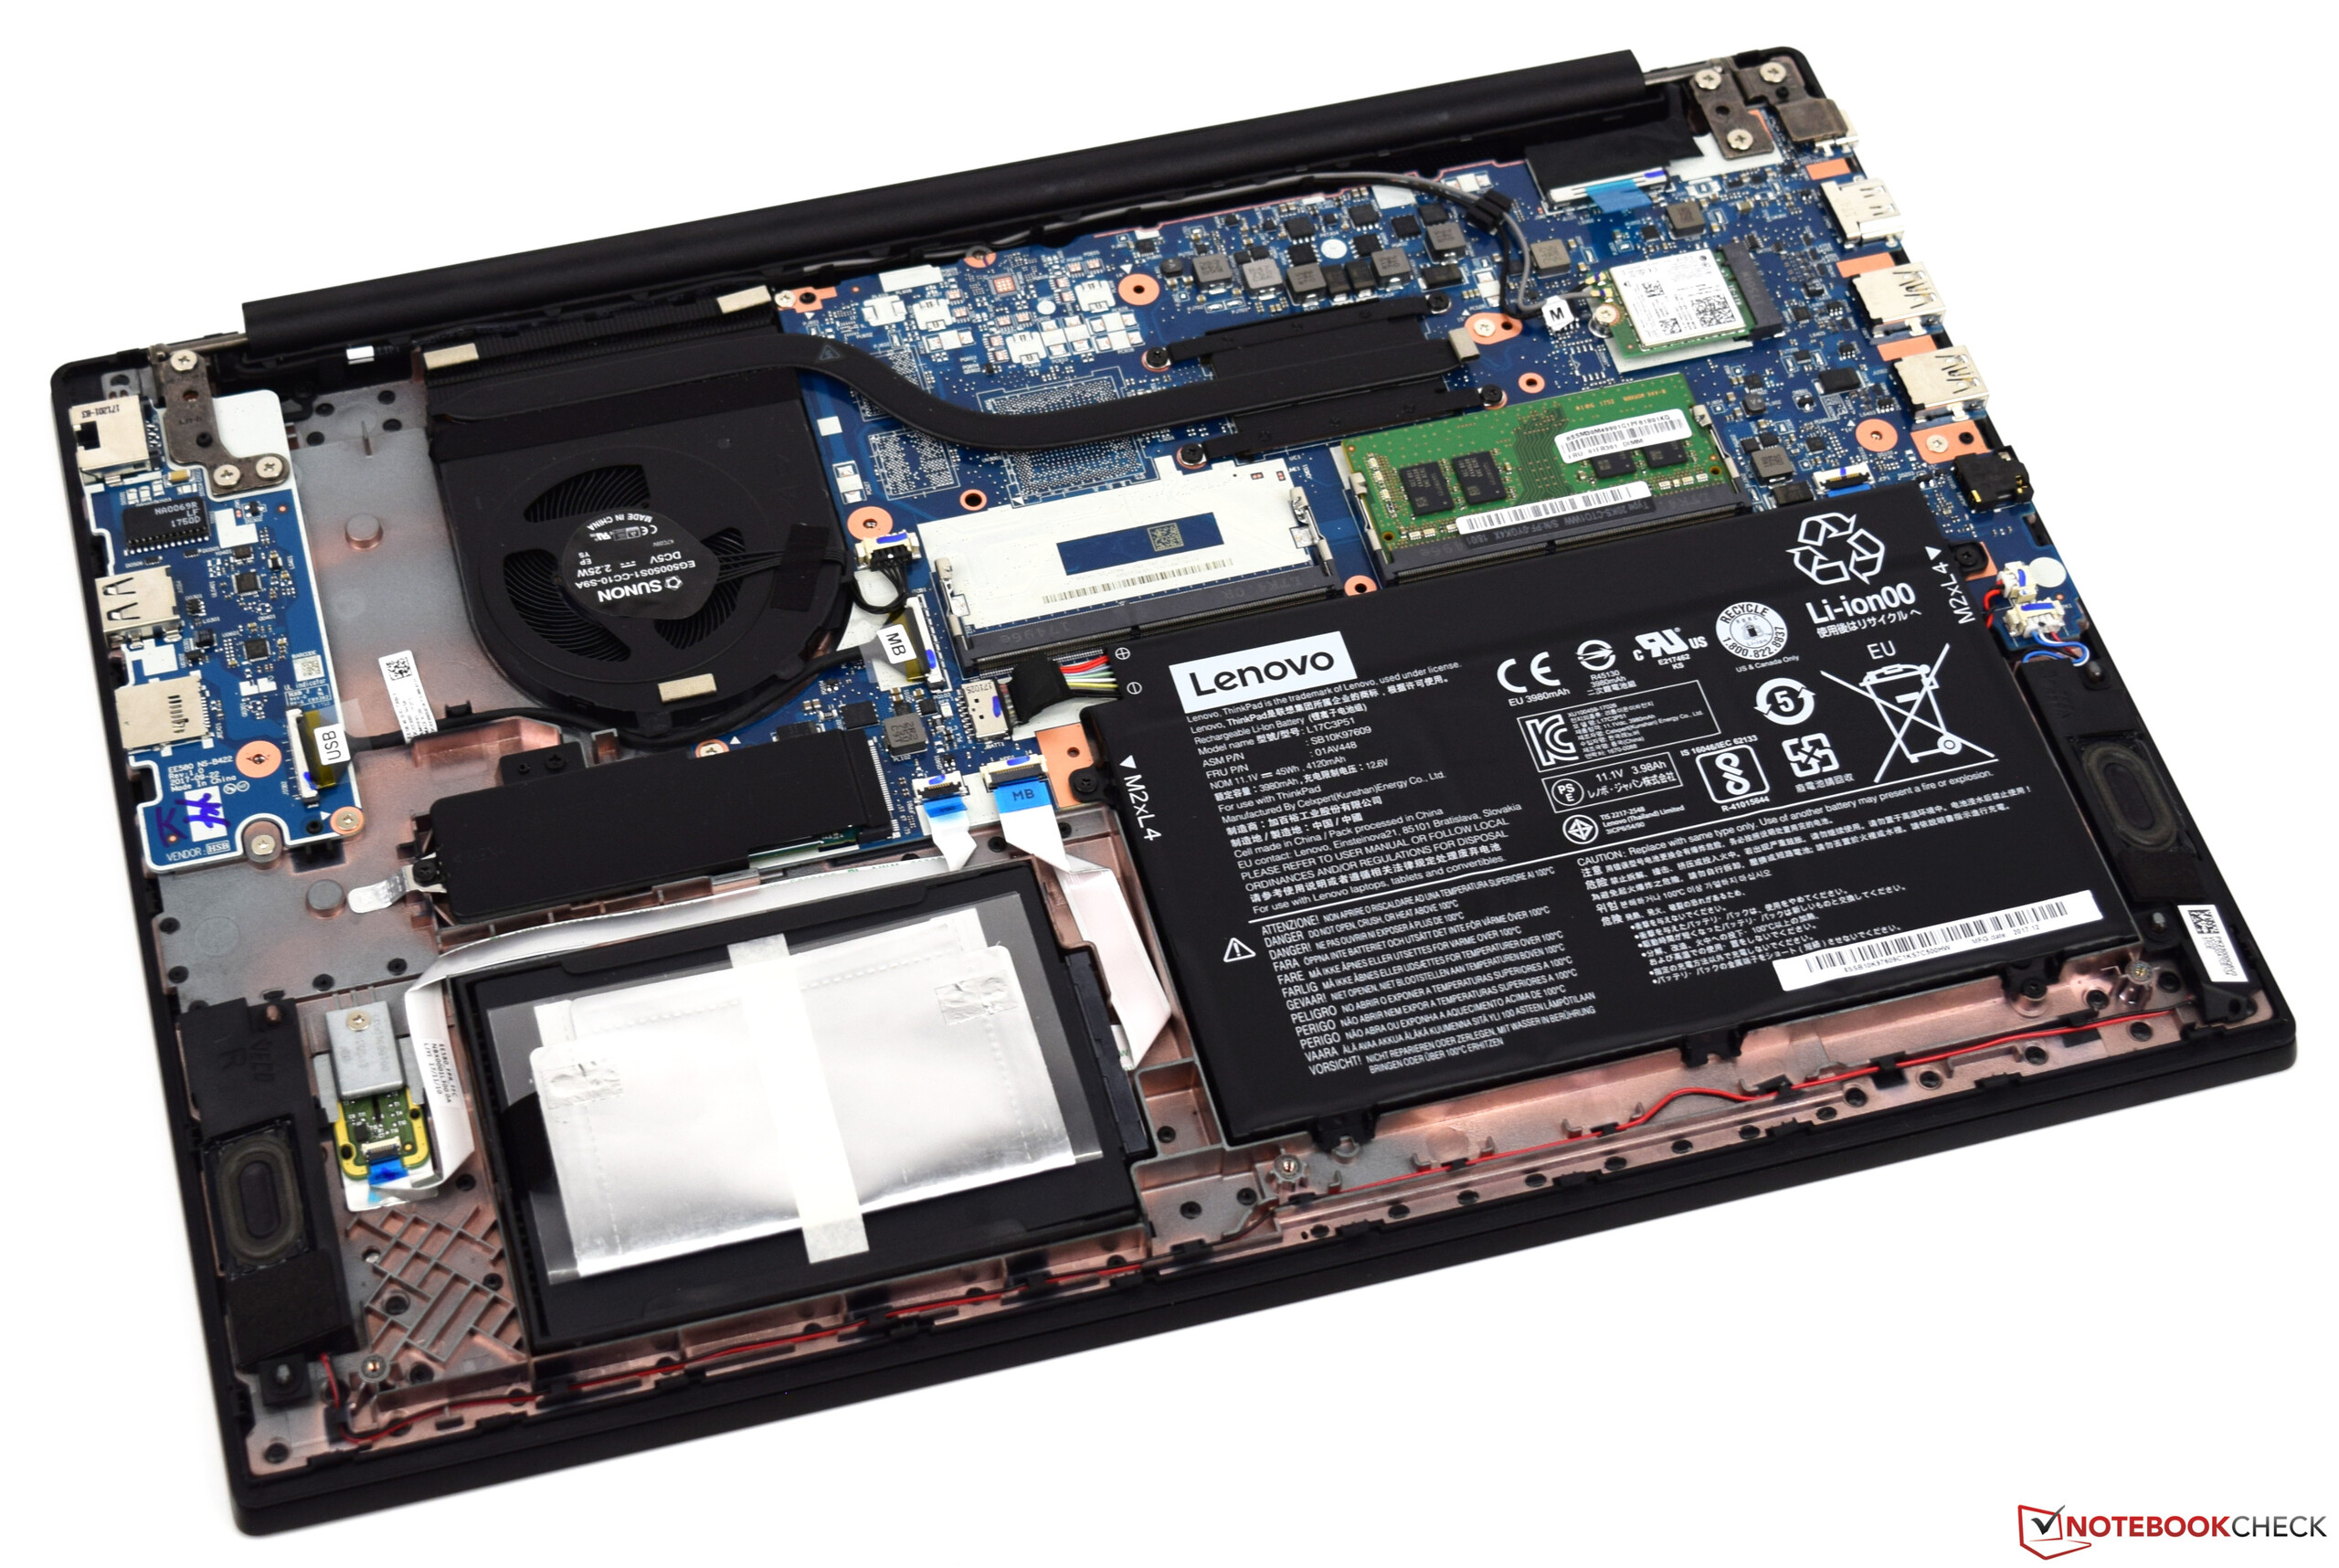
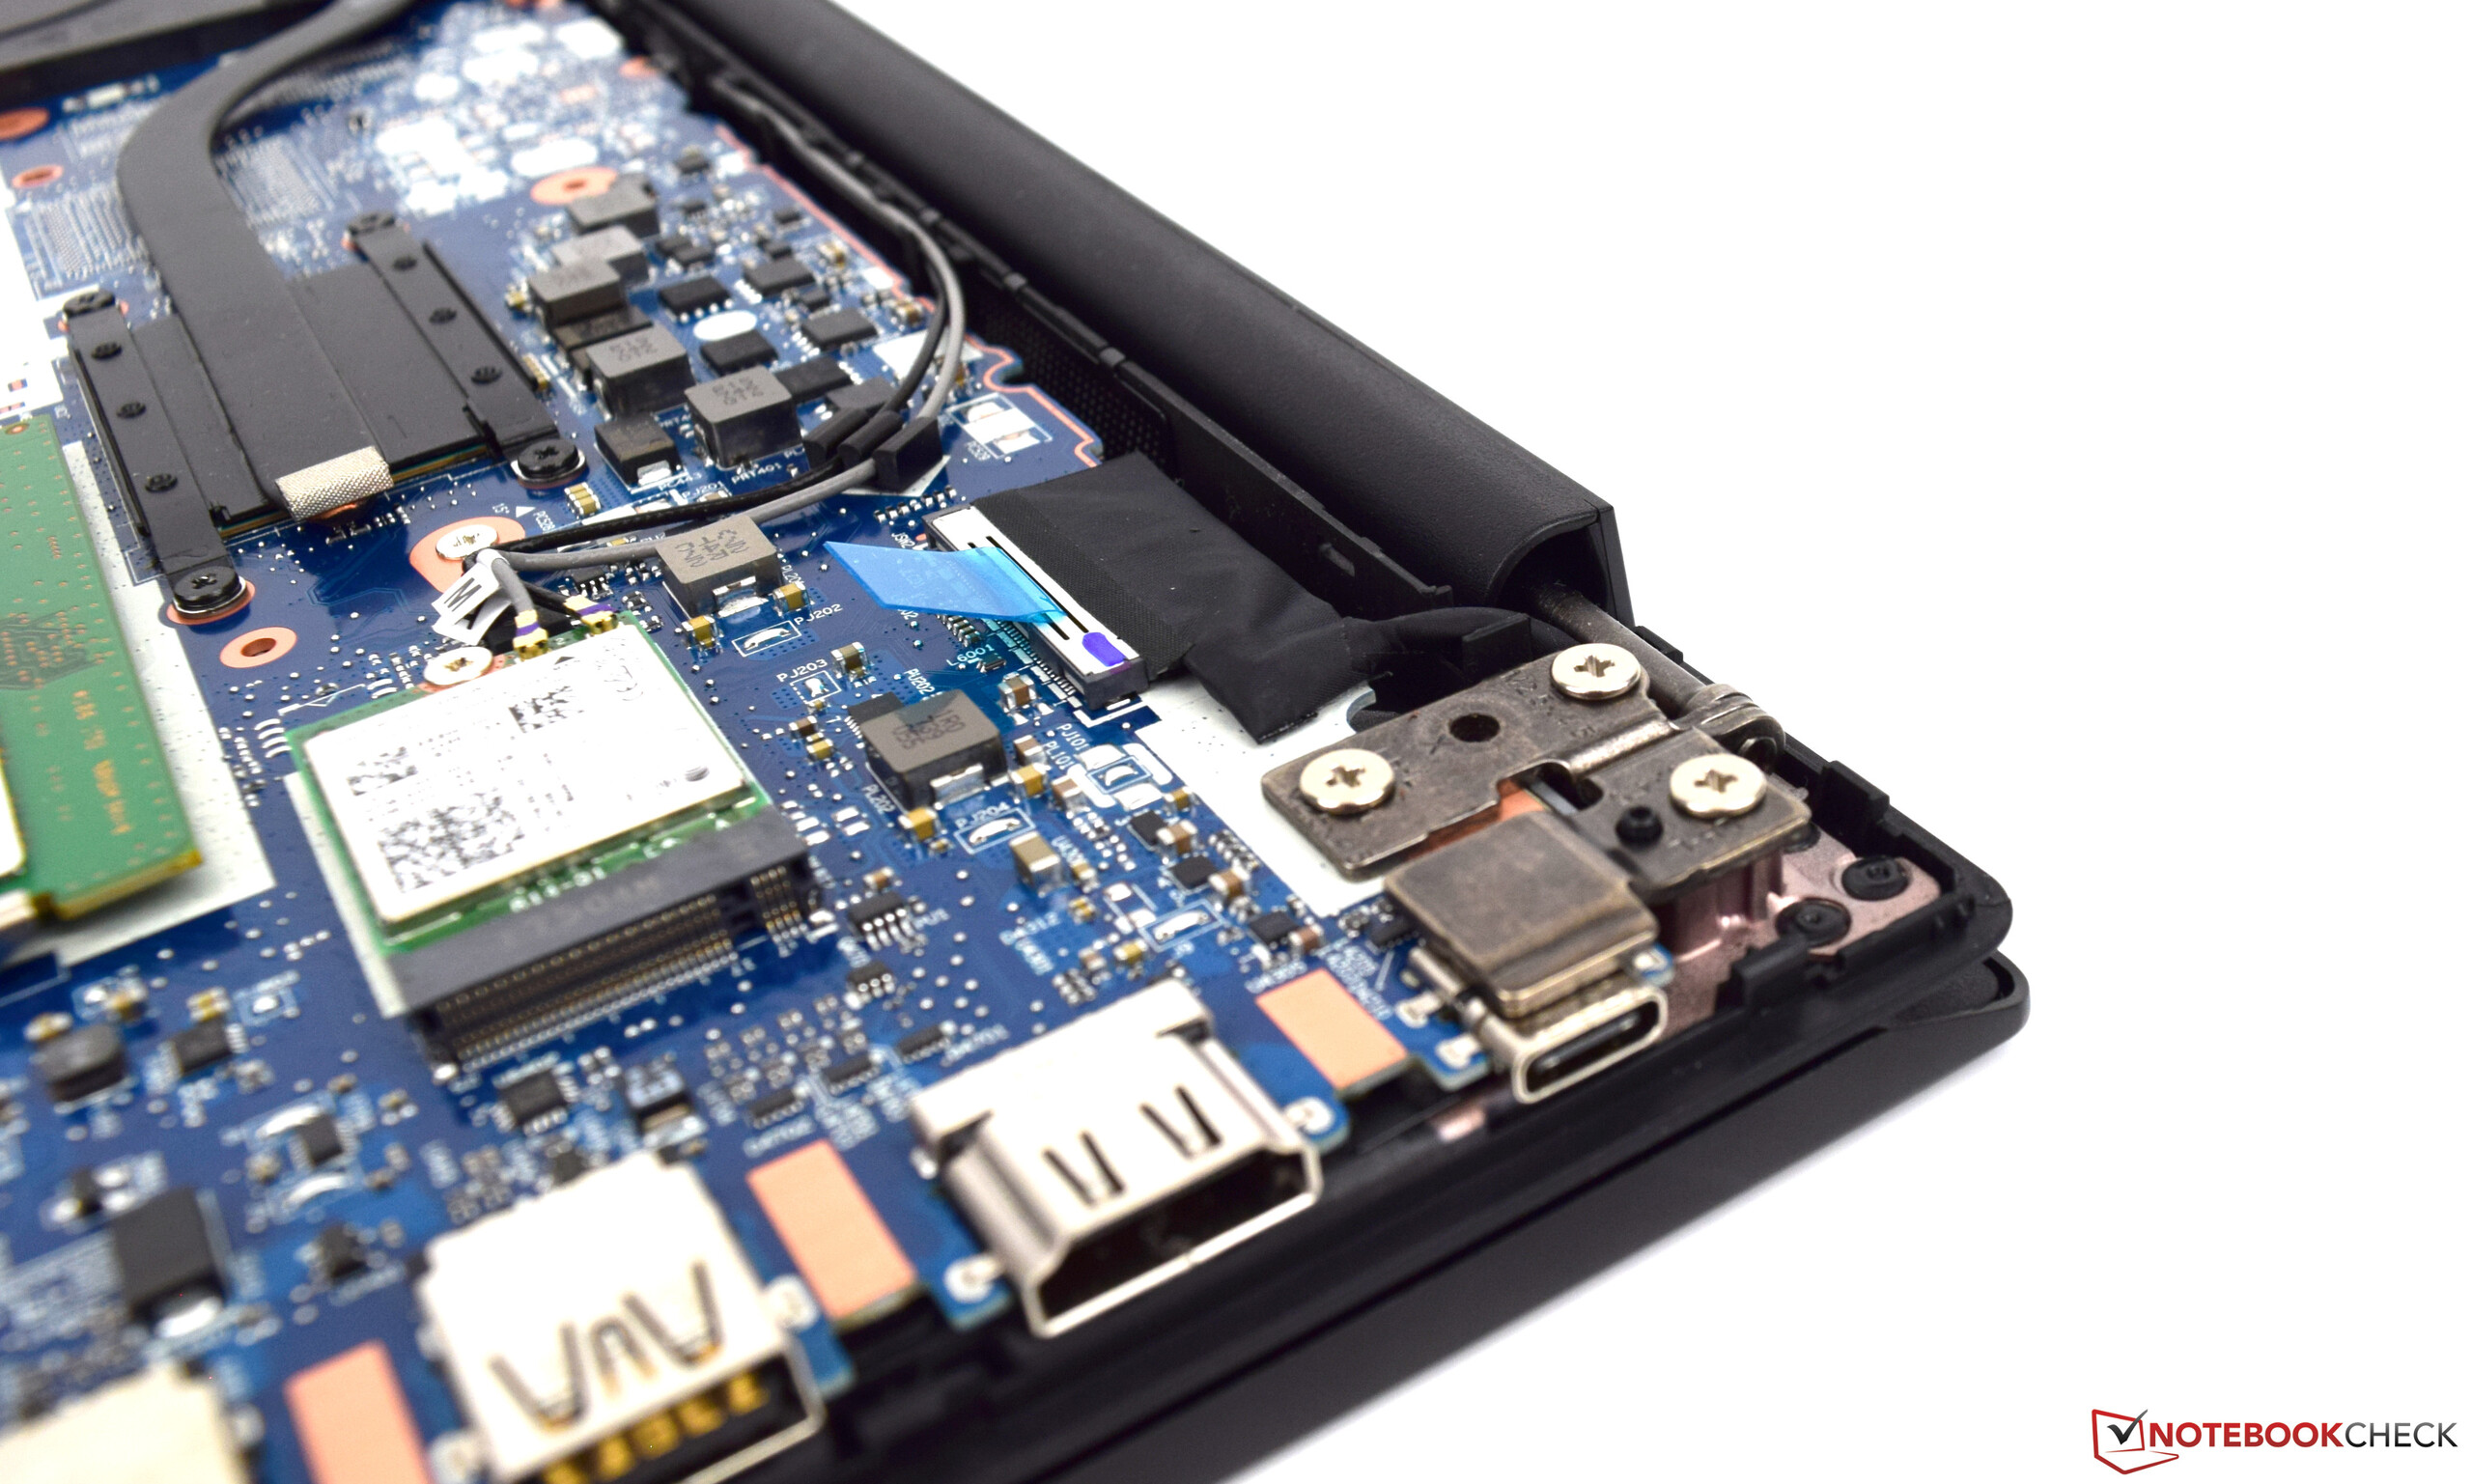
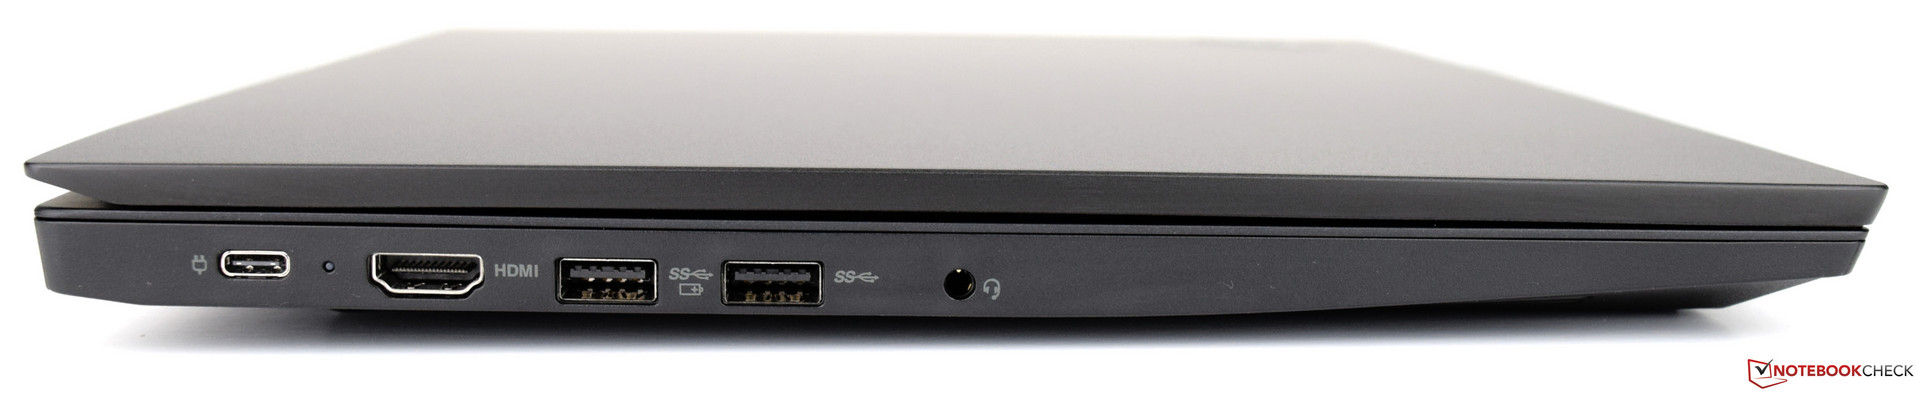
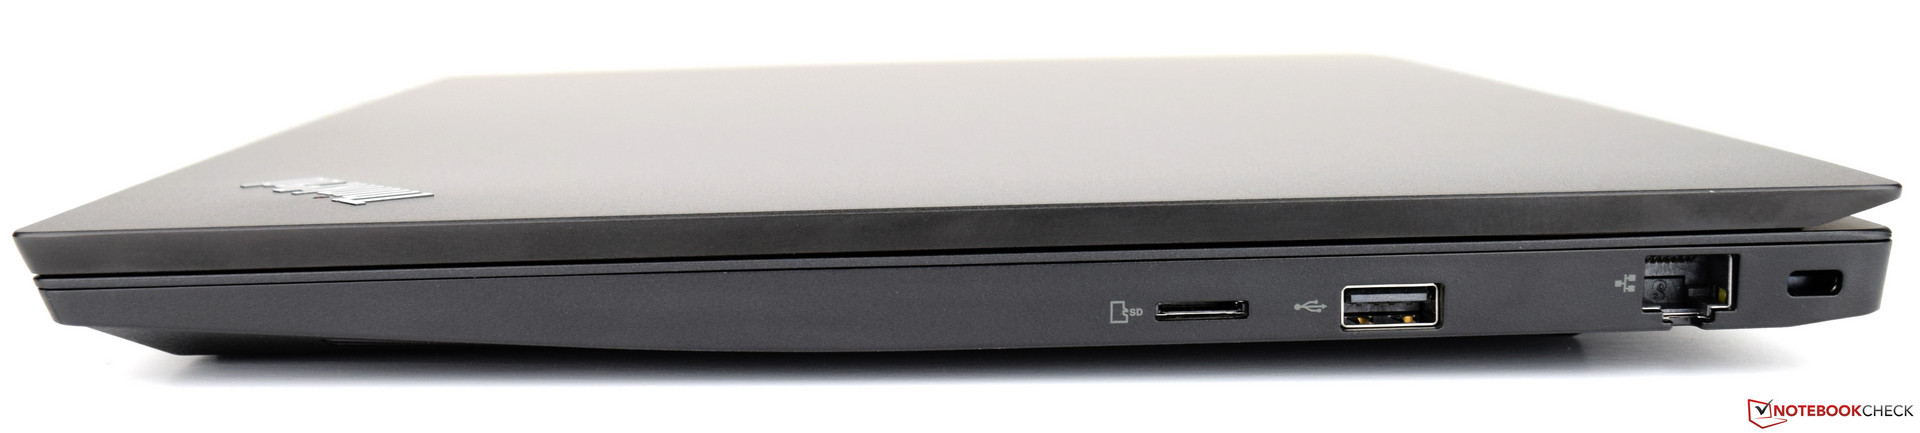
Utöver den höga konstruktionskvaliteten vill vi också betona laptopens uppgraderbarhet, trots avsaknaden av en dedikerad servicelucka och trots att den har dom välkänt högkvalitativa inmatningsenheterna. Och även om SSD-enheten på 128 GB är en aning för liten så är den definitivt mycket bättre än en vanlig hårddisk trots jämförelsevis dålig prestanda. Vi misstänker att inkompatibla drivrutiner är boven i dramat här. En annan nackdel med E580 är MicroSD-kortläsaren - ett oförståeligt steg bakåt jämfört med förra årets modell.
Lenovo ThinkPad E580-20KSCTO1WW
- 03/06/2018 v6 (old)
Sebastian Bade
Price comparison
