Test: Lenovo ThinkPad E570 (7200U, HD Display) Laptop (Sammanfattning)
| SD Card Reader | |
| average JPG Copy Test (av. of 3 runs) | |
| HP ProBook 450 G4 Y8B60EA | |
| Acer TravelMate P259-MG-71UU (Toshiba Exceria Pro SDXC 64 GB UHS-II) | |
| Lenovo ThinkPad E570-20H6S00000 (Toshiba Exceria Pro SDXC 64 GB UHS-II) | |
| Dell Latitude 15-3570 | |
| maximum AS SSD Seq Read Test (1GB) | |
| HP ProBook 450 G4 Y8B60EA | |
| Lenovo ThinkPad E570-20H6S00000 (Toshiba Exceria Pro SDXC 64 GB UHS-II) | |
| Dell Latitude 15-3570 | |
| Networking | |
| iperf3 transmit AX12 | |
| Lenovo ThinkPad E570-20H6S02M00 | |
| Acer TravelMate P259-MG-71UU | |
| Lenovo ThinkPad E570-20H6S00000 | |
| iperf3 receive AX12 | |
| Acer TravelMate P259-MG-71UU | |
| Lenovo ThinkPad E570-20H6S02M00 | |
| Lenovo ThinkPad E570-20H6S00000 | |
| |||||||||||||||||||||||||
Distribution av ljusstyrkan: 73 %
Mitt på batteriet: 242 cd/m²
Kontrast: 410:1 (Svärta: 0.59 cd/m²)
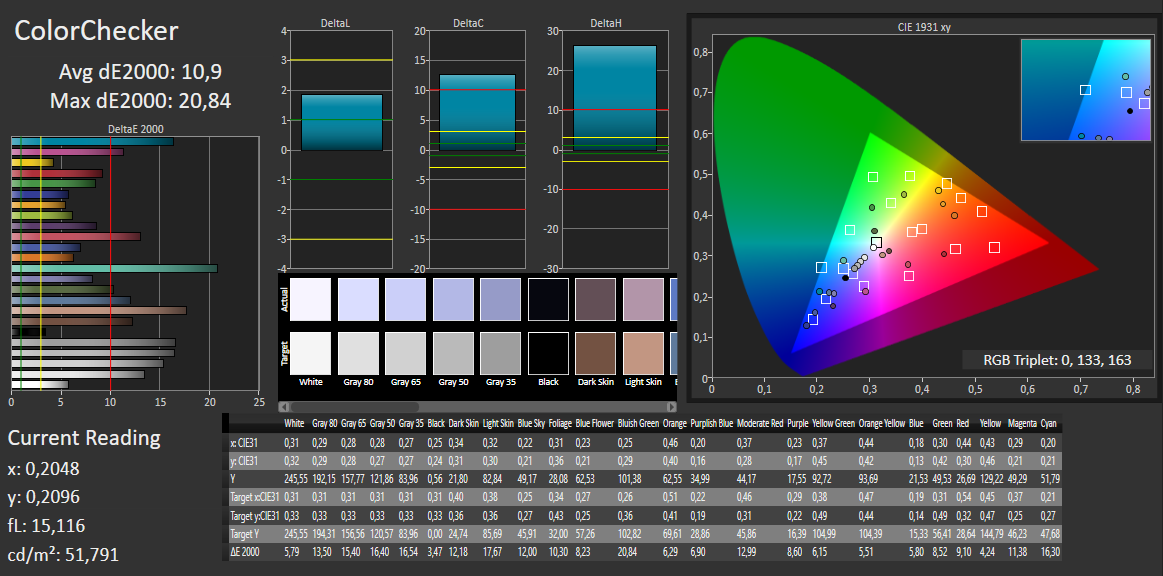
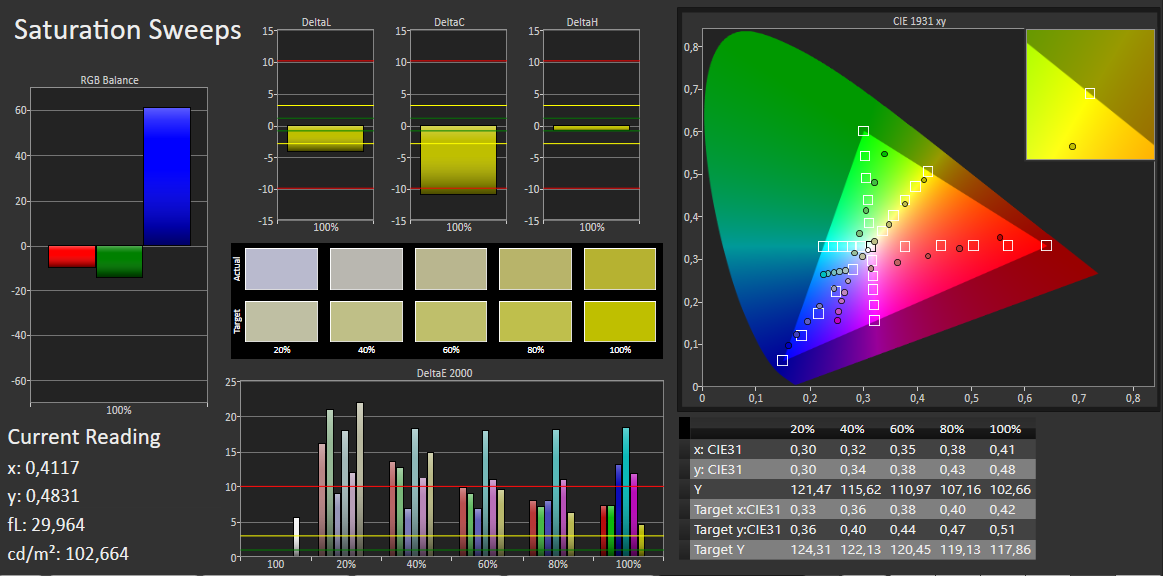
ΔE ColorChecker Calman: 10.9 | ∀{0.5-29.43 Ø4.71}
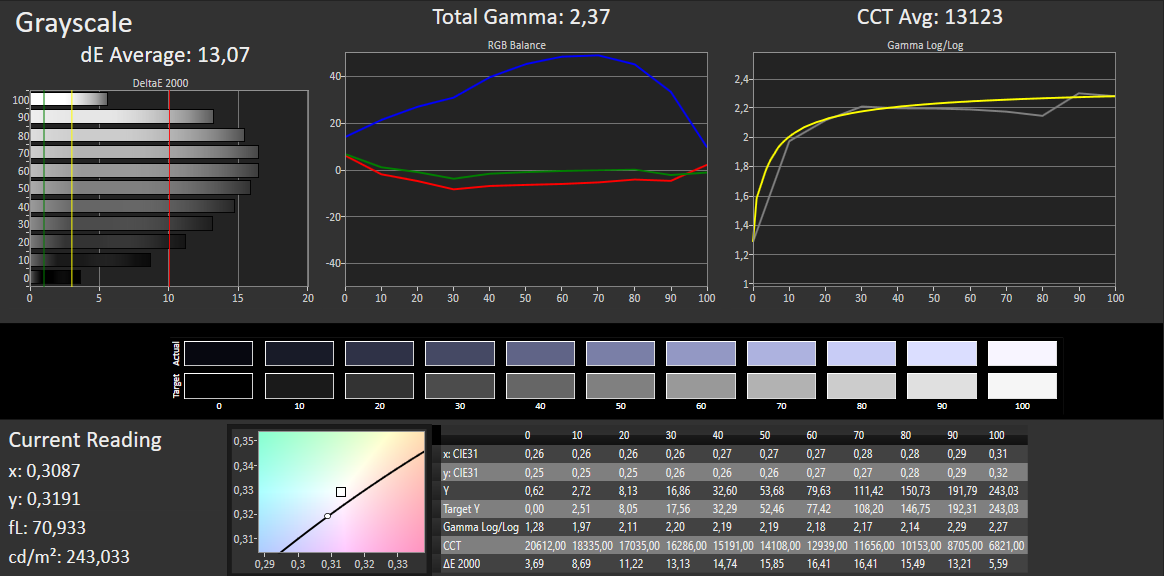
ΔE Greyscale Calman: 13.07 | ∀{0.09-98 Ø4.96}
55% sRGB (Argyll 1.6.3 3D)
35% AdobeRGB 1998 (Argyll 1.6.3 3D)
38.01% AdobeRGB 1998 (Argyll 3D)
55.4% sRGB (Argyll 3D)
36.79% Display P3 (Argyll 3D)
Gamma: 2.37
CCT: 13123 K
| Lenovo ThinkPad E570-20H6S02M00 TN LED, 1366x768, 15.6" | Lenovo ThinkPad E570-20H6S00000 IPS LED, 1920x1080, 15.6" | HP ProBook 450 G4 Y8B60EA TN LED, 1920x1080, 15.6" | Dell Latitude 15-3570 TN LED, 1366x768, 15.6" | Acer TravelMate P259-MG-71UU TN LED, 1920x1080, 15.6" | Fujitsu LifeBook A557 PL IPS, 1920x1080, 15.6" | |
|---|---|---|---|---|---|---|
| Display | 5% | 8% | 10% | 5% | 19% | |
| Display P3 Coverage (%) | 36.79 | 38.65 5% | 39.89 8% | 40.61 10% | 38.58 5% | 44.13 20% |
| sRGB Coverage (%) | 55.4 | 58 5% | 59.5 7% | 61.1 10% | 58 5% | 65.2 18% |
| AdobeRGB 1998 Coverage (%) | 38.01 | 39.94 5% | 41.24 8% | 41.96 10% | 39.85 5% | 45.72 20% |
| Response Times | -47% | -71% | -83% | -31% | ||
| Response Time Grey 50% / Grey 80% * (ms) | 46 ? | 44.8 ? 3% | 51 ? -11% | 37 ? 20% | 43 ? 7% | |
| Response Time Black / White * (ms) | 13 ? | 25.6 ? -97% | 30 ? -131% | 37 ? -185% | 22 ? -69% | |
| PWM Frequency (Hz) | 200 ? | 50 ? | ||||
| Screen | 41% | 7% | -2% | 5% | 52% | |
| Brightness middle (cd/m²) | 242 | 242 0% | 214 -12% | 202 -17% | 180 -26% | 239.5 -1% |
| Brightness (cd/m²) | 233 | 243 4% | 201 -14% | 211 -9% | 178 -24% | 216 -7% |
| Brightness Distribution (%) | 73 | 75 3% | 77 5% | 88 21% | 93 27% | 80 10% |
| Black Level * (cd/m²) | 0.59 | 0.24 59% | 0.43 27% | 0.62 -5% | 0.45 24% | 0.2 66% |
| Contrast (:1) | 410 | 1008 146% | 498 21% | 326 -20% | 400 -2% | 1198 192% |
| Colorchecker dE 2000 * | 10.9 | 4.65 57% | 10.68 2% | 12.35 -13% | 9.91 9% | |
| Colorchecker dE 2000 max. * | 20.84 | 9.64 54% | 18.07 13% | 19.9 5% | 18.19 13% | |
| Greyscale dE 2000 * | 13.07 | 3.39 74% | 11.32 13% | 13.46 -3% | 11.25 14% | |
| Gamma | 2.37 93% | 2.7 81% | 2.26 97% | 2.44 90% | 2.35 94% | |
| CCT | 13123 50% | 6246 104% | 12204 53% | 15217 43% | 12115 54% | |
| Color Space (Percent of AdobeRGB 1998) (%) | 35 | 36.69 5% | 38 9% | 39 11% | 37 6% | |
| Color Space (Percent of sRGB) (%) | 55 | 57.66 5% | 59 7% | 61 11% | 58 5% | |
| Totalt genomsnitt (program/inställningar) | -0% /
22% | -19% /
-3% | -25% /
-10% | -7% /
-0% | 36% /
40% |
* ... mindre är bättre
Skärmflimmer / PWM (Puls-Width Modulation)
| Skärmflimmer / PWM upptäckt | 200 Hz | ≤ 90 % ljusstyrka inställning | 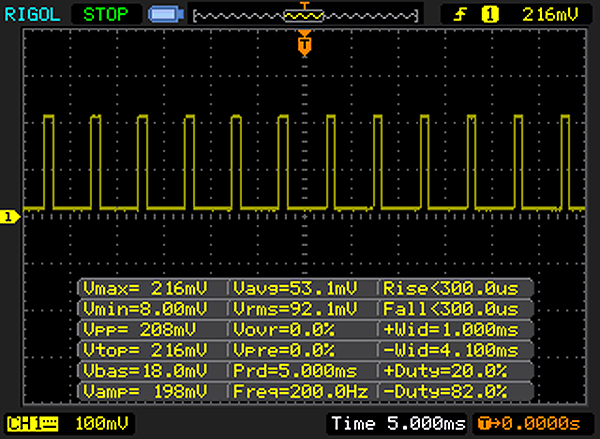 |
Displayens bakgrundsbelysning flimrar vid 200 Hz (i värsta fall, t.ex. med PWM) Flimrande upptäckt vid en ljusstyrkeinställning på 90 % och lägre. Det ska inte finnas något flimmer eller PWM över denna ljusstyrkeinställning. Frekvensen för 200 Hz är relativt låg, så känsliga användare kommer sannolikt att märka flimmer och uppleva ansträngda ögon vid den angivna ljusstyrkeinställningen och nedan. Som jämförelse: 52 % av alla testade enheter använder inte PWM för att dämpa skärmen. Om PWM upptäcktes mättes ett medelvärde av 7754 (minst: 5 - maximum: 343500) Hz. | |||
Visa svarstider
| ↔ Svarstid svart till vitt | ||
|---|---|---|
| 13 ms ... stiga ↗ och falla ↘ kombinerat | ↗ 8 ms stiga | 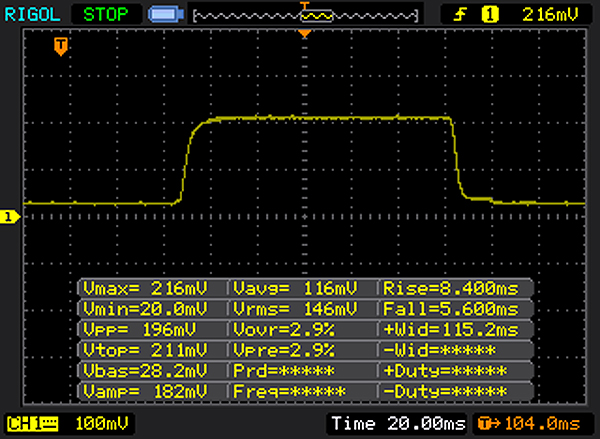 |
| ↘ 5 ms hösten | ||
| Skärmen visar bra svarsfrekvens i våra tester, men kan vara för långsam för konkurrenskraftiga spelare. I jämförelse sträcker sig alla testade enheter från 0.1 (minst) till 240 (maximalt) ms. » 33 % av alla enheter är bättre. Det betyder att den uppmätta svarstiden är bättre än genomsnittet av alla testade enheter (19.8 ms). | ||
| ↔ Svarstid 50 % grått till 80 % grått | ||
| 46 ms ... stiga ↗ och falla ↘ kombinerat | ↗ 24 ms stiga | 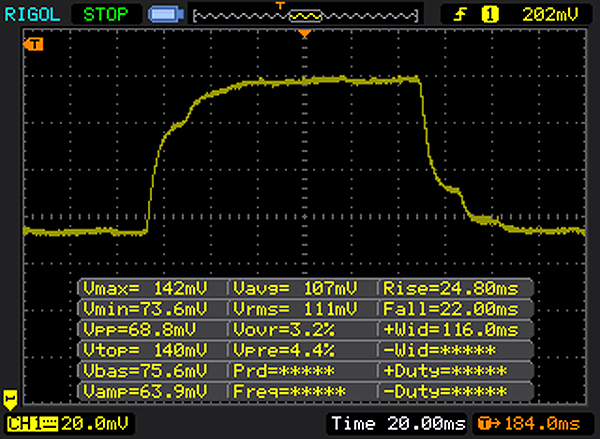 |
| ↘ 22 ms hösten | ||
| Skärmen visar långsamma svarsfrekvenser i våra tester och kommer att vara otillfredsställande för spelare. I jämförelse sträcker sig alla testade enheter från 0.165 (minst) till 636 (maximalt) ms. » 79 % av alla enheter är bättre. Detta innebär att den uppmätta svarstiden är sämre än genomsnittet av alla testade enheter (31 ms). | ||
| Cinebench R15 | |
| CPU Single 64Bit | |
| HP ProBook 450 G4 Y8B60EA | |
| Acer TravelMate P259-MG-71UU | |
| Lenovo ThinkPad E570-20H6S00000 | |
| Fujitsu LifeBook A557 PL | |
| Lenovo ThinkPad E570-20H6S02M00 | |
| Dell Latitude 15-3570 | |
| CPU Multi 64Bit | |
| HP ProBook 450 G4 Y8B60EA | |
| Lenovo ThinkPad E570-20H6S00000 | |
| Acer TravelMate P259-MG-71UU | |
| Fujitsu LifeBook A557 PL | |
| Lenovo ThinkPad E570-20H6S02M00 | |
| Dell Latitude 15-3570 | |
| Cinebench R11.5 | |
| CPU Multi 64Bit | |
| Lenovo ThinkPad E570-20H6S02M00 | |
| Acer TravelMate P259-MG-71UU | |
| CPU Single 64Bit | |
| Acer TravelMate P259-MG-71UU | |
| Lenovo ThinkPad E570-20H6S02M00 | |
| Cinebench R10 | |
| Rendering Multiple CPUs 32Bit | |
| Acer TravelMate P259-MG-71UU | |
| Lenovo ThinkPad E570-20H6S02M00 | |
| Rendering Single 32Bit | |
| Lenovo ThinkPad E570-20H6S02M00 | |
| Acer TravelMate P259-MG-71UU | |
| Geekbench 3 | |
| 32 Bit Multi-Core Score | |
| Acer TravelMate P259-MG-71UU | |
| Lenovo ThinkPad E570-20H6S02M00 | |
| 32 Bit Single-Core Score | |
| Acer TravelMate P259-MG-71UU | |
| Lenovo ThinkPad E570-20H6S02M00 | |
| Geekbench 4.0 | |
| 64 Bit Multi-Core Score | |
| Acer TravelMate P259-MG-71UU | |
| Lenovo ThinkPad E570-20H6S02M00 | |
| 64 Bit Single-Core Score | |
| Acer TravelMate P259-MG-71UU | |
| Lenovo ThinkPad E570-20H6S02M00 | |
| Geekbench 4.4 | |
| 64 Bit Multi-Core Score | |
| Lenovo ThinkPad E570-20H6S02M00 | |
| 64 Bit Single-Core Score | |
| Lenovo ThinkPad E570-20H6S02M00 | |
| JetStream 1.1 - 1.1 Total | |
| HP ProBook 450 G4 Y8B60EA | |
| Lenovo ThinkPad E570-20H6S02M00 | |
| Lenovo ThinkPad E570-20H6S00000 | |
| Acer TravelMate P259-MG-71UU | |
| PCMark 7 Score | 5232 poäng | |
| PCMark 8 Home Score Accelerated v2 | 3714 poäng | |
| PCMark 8 Creative Score Accelerated v2 | 4456 poäng | |
| PCMark 8 Work Score Accelerated v2 | 4857 poäng | |
| PCMark 10 Score | 3235 poäng | |
Hjälp | ||
| PCMark 8 | |
| Home Score Accelerated v2 | |
| Acer TravelMate P259-MG-71UU | |
| Lenovo ThinkPad E570-20H6S02M00 | |
| Lenovo ThinkPad E570-20H6S00000 | |
| Dell Latitude 15-3570 | |
| HP ProBook 450 G4 Y8B60EA | |
| Work Score Accelerated v2 | |
| Lenovo ThinkPad E570-20H6S02M00 | |
| HP ProBook 450 G4 Y8B60EA | |
| Acer TravelMate P259-MG-71UU | |
| Lenovo ThinkPad E570-20H6S00000 | |
| Dell Latitude 15-3570 | |

| Lenovo ThinkPad E570-20H6S02M00 Samsung PM961 MZVLW256HEHP | Dell Latitude 15-3570 Samsung CM871 MZNLF128HCHP | Acer TravelMate P259-MG-71UU Liteonit CV3-8D256 | Fujitsu LifeBook A557 PL Samsung CM871a MZNTY256HDHP | Lenovo ThinkPad E570-20H6S00000 Toshiba THNSF5256GPUK | |
|---|---|---|---|---|---|
| CrystalDiskMark 3.0 | -81% | -58% | -55% | -31% | |
| Read Seq (MB/s) | 1589 | 453.2 -71% | 478.5 -70% | 520 -67% | 1140 -28% |
| Write Seq (MB/s) | 1217 | 137.7 -89% | 258.2 -79% | 337 -72% | 468.1 -62% |
| Read 512 (MB/s) | 1155 | 308.5 -73% | 254.3 -78% | 400.8 -65% | 759 -34% |
| Write 512 (MB/s) | 783 | 134.1 -83% | 264.8 -66% | 240.7 -69% | 414 -47% |
| Read 4k (MB/s) | 59.7 | 19.06 -68% | 28.32 -53% | 34.16 -43% | 34.3 -43% |
| Write 4k (MB/s) | 148.8 | 21.31 -86% | 76.3 -49% | 95.4 -36% | 123.4 -17% |
| Read 4k QD32 (MB/s) | 473.6 | 93.5 -80% | 346.2 -27% | 293.9 -38% | 530 12% |
| Write 4k QD32 (MB/s) | 428.7 | 23.3 -95% | 240.2 -44% | 225.1 -47% | 319.2 -26% |
| 3DMark 11 Performance | 1518 poäng | |
| 3DMark Ice Storm Standard Score | 55340 poäng | |
| 3DMark Cloud Gate Standard Score | 5776 poäng | |
| 3DMark Fire Strike Score | 763 poäng | |
Hjälp | ||
| 3DMark 11 - 1280x720 Performance GPU | |
| Lenovo ThinkPad E570-20H6S00000 | |
| Acer TravelMate P259-MG-71UU | |
| HP ProBook 450 G4 Y8B60EA | |
| Fujitsu LifeBook A557 PL | |
| Lenovo ThinkPad E570-20H6S02M00 | |
| Dell Latitude 15-3570 | |
| 3DMark | |
| 1280x720 Cloud Gate Standard Graphics | |
| Lenovo ThinkPad E570-20H6S00000 | |
| Acer TravelMate P259-MG-71UU | |
| HP ProBook 450 G4 Y8B60EA | |
| Lenovo ThinkPad E570-20H6S02M00 | |
| Fujitsu LifeBook A557 PL | |
| Dell Latitude 15-3570 | |
| 1920x1080 Fire Strike Graphics | |
| Lenovo ThinkPad E570-20H6S00000 | |
| Acer TravelMate P259-MG-71UU | |
| HP ProBook 450 G4 Y8B60EA | |
| Lenovo ThinkPad E570-20H6S02M00 | |
| Fujitsu LifeBook A557 PL | |
| låg | med. | hög | ultra | |
|---|---|---|---|---|
| Tomb Raider (2013) | 63.6 | 33.8 | 19.2 | |
| BioShock Infinite (2013) | 41.8 | 24.5 | 20.2 | |
| Rise of the Tomb Raider (2016) | 16.7 | 10.4 |
| BioShock Infinite - 1280x720 Very Low Preset | |
| Lenovo ThinkPad E570-20H6S00000 | |
| Acer TravelMate P259-MG-71UU | |
| HP ProBook 450 G4 Y8B60EA | |
| Lenovo ThinkPad E570-20H6S02M00 | |
| Dell Latitude 15-3570 | |
Ljudnivå
| Låg belastning |
| 30.6 / 30.6 / 30.6 dB(A) |
| Hårddisk |
| 31.4 dB(A) |
| DVD |
| 33.1 / dB(A) |
| Hög belastning |
| 31.8 / 31.3 dB(A) |
 | ||
30 dB tyst 40 dB(A) hörbar 50 dB(A) högt ljud |
||
min: | ||
| Lenovo ThinkPad E570-20H6S02M00 i5-7200U, HD Graphics 620 | Lenovo ThinkPad E570-20H6S00000 i5-7200U, GeForce GTX 950M | HP ProBook 450 G4 Y8B60EA i7-7500U, GeForce 930MX | Dell Latitude 15-3570 6200U, HD Graphics 520 | Acer TravelMate P259-MG-71UU 6500U, GeForce 940MX | Fujitsu LifeBook A557 PL i5-7200U, HD Graphics 620 | |
|---|---|---|---|---|---|---|
| Noise | -3% | -12% | -4% | -8% | -13% | |
| av / miljö * (dB) | 30.6 | 29 5% | 31.6 -3% | 31 -1% | 30.5 -0% | |
| Idle Minimum * (dB) | 30.6 | 29 5% | 32.6 -7% | 31 -1% | 31.6 -3% | 30 2% |
| Idle Average * (dB) | 30.6 | 29 5% | 32.6 -7% | 31 -1% | 31.6 -3% | 32.5 -6% |
| Idle Maximum * (dB) | 30.6 | 29 5% | 33 -8% | 31 -1% | 32 -5% | 35 -14% |
| Load Average * (dB) | 31.8 | 34.3 -8% | 38.9 -22% | 34.2 -8% | 35.5 -12% | 37.5 -18% |
| Load Maximum * (dB) | 31.3 | 40.1 -28% | 38.9 -24% | 34.3 -10% | 38.3 -22% | 40.3 -29% |
* ... mindre är bättre
(+) Den maximala temperaturen på ovansidan är 33.2 °C / 92 F, jämfört med genomsnittet av 34.3 °C / 94 F , allt från 21.2 till 62.5 °C för klassen Office.
(+) Botten värms upp till maximalt 39.4 °C / 103 F, jämfört med genomsnittet av 36.8 °C / 98 F
(+) Vid tomgångsbruk är medeltemperaturen för ovansidan 24.7 °C / 76 F, jämfört med enhetsgenomsnittet på 29.5 °C / ### class_avg_f### F.
(+) Handledsstöden och pekplattan når maximal hudtemperatur (32.1 °C / 89.8 F) och är därför inte varma.
(-) Medeltemperaturen för handledsstödsområdet på liknande enheter var 27.5 °C / 81.5 F (-4.6 °C / -8.3 F).
| Lenovo ThinkPad E570-20H6S02M00 i5-7200U, HD Graphics 620 | Lenovo ThinkPad E570-20H6S00000 i5-7200U, GeForce GTX 950M | HP ProBook 450 G4 Y8B60EA i7-7500U, GeForce 930MX | Dell Latitude 15-3570 6200U, HD Graphics 520 | Acer TravelMate P259-MG-71UU 6500U, GeForce 940MX | Fujitsu LifeBook A557 PL i5-7200U, HD Graphics 620 | |
|---|---|---|---|---|---|---|
| Heat | -13% | -15% | -17% | -7% | 1% | |
| Maximum Upper Side * (°C) | 33.2 | 46.6 -40% | 44.3 -33% | 36.1 -9% | 35.1 -6% | 34.8 -5% |
| Maximum Bottom * (°C) | 39.4 | 49.1 -25% | 46.3 -18% | 47 -19% | 46.7 -19% | 38.1 3% |
| Idle Upper Side * (°C) | 25.9 | 24.6 5% | 27.8 -7% | 31.7 -22% | 27 -4% | 25.9 -0% |
| Idle Bottom * (°C) | 27.8 | 25.1 10% | 27.7 -0% | 32.9 -18% | 27.4 1% | 26.6 4% |
* ... mindre är bättre
Lenovo ThinkPad E570-20H6S02M00 ljudanalys
(-) | inte särskilt höga högtalare (71.4 dB)
Bas 100 - 315 Hz
(-) | nästan ingen bas - i genomsnitt 17.1% lägre än medianen
(±) | linjäriteten för basen är genomsnittlig (10.9% delta till föregående frekvens)
Mellan 400 - 2000 Hz
(+) | balanserad mellan - endast 3.9% från medianen
(±) | linjäriteten för mids är genomsnittlig (8.2% delta till föregående frekvens)
Högsta 2 - 16 kHz
(+) | balanserade toppar - endast 3.4% från medianen
(±) | linjäriteten för toppar är genomsnittlig (7% delta till föregående frekvens)
Totalt 100 - 16 000 Hz
(±) | linjäriteten för det totala ljudet är genomsnittlig (20.3% skillnad mot median)
Jämfört med samma klass
» 45% av alla testade enheter i den här klassen var bättre, 10% liknande, 45% sämre
» Den bästa hade ett delta på 7%, genomsnittet var 21%, sämst var 53%
Jämfört med alla testade enheter
» 53% av alla testade enheter var bättre, 8% liknande, 39% sämre
» Den bästa hade ett delta på 4%, genomsnittet var 23%, sämst var 134%
Apple MacBook 12 (Early 2016) 1.1 GHz ljudanalys
(+) | högtalare kan spela relativt högt (83.6 dB)
Bas 100 - 315 Hz
(±) | reducerad bas - i genomsnitt 11.3% lägre än medianen
(±) | linjäriteten för basen är genomsnittlig (14.2% delta till föregående frekvens)
Mellan 400 - 2000 Hz
(+) | balanserad mellan - endast 2.4% från medianen
(+) | mids är linjära (5.5% delta till föregående frekvens)
Högsta 2 - 16 kHz
(+) | balanserade toppar - endast 2% från medianen
(+) | toppar är linjära (4.5% delta till föregående frekvens)
Totalt 100 - 16 000 Hz
(+) | det totala ljudet är linjärt (10.2% skillnad mot median)
Jämfört med samma klass
» 7% av alla testade enheter i den här klassen var bättre, 2% liknande, 90% sämre
» Den bästa hade ett delta på 5%, genomsnittet var 18%, sämst var 53%
Jämfört med alla testade enheter
» 5% av alla testade enheter var bättre, 1% liknande, 94% sämre
» Den bästa hade ett delta på 4%, genomsnittet var 23%, sämst var 134%
| Av/Standby | |
| Låg belastning | |
| Hög belastning |
|
Förklaring:
min: | |
| Lenovo ThinkPad E570-20H6S02M00 i5-7200U, HD Graphics 620 | Lenovo ThinkPad E570-20H6S00000 i5-7200U, GeForce GTX 950M | HP ProBook 450 G4 Y8B60EA i7-7500U, GeForce 930MX | Dell Latitude 15-3570 6200U, HD Graphics 520 | Acer TravelMate P259-MG-71UU 6500U, GeForce 940MX | Fujitsu LifeBook A557 PL i5-7200U, HD Graphics 620 | |
|---|---|---|---|---|---|---|
| Power Consumption | -45% | -40% | -18% | -71% | -44% | |
| Idle Minimum * (Watt) | 2.9 | 2.8 3% | 3.8 -31% | 4.9 -69% | 7 -141% | 6.3 -117% |
| Idle Average * (Watt) | 5.8 | 6.3 -9% | 6.6 -14% | 7.2 -24% | 8 -38% | 8.1 -40% |
| Idle Maximum * (Watt) | 6.6 | 6.9 -5% | 11.3 -71% | 7.5 -14% | 10.6 -61% | 12.7 -92% |
| Load Average * (Watt) | 29 | 51.6 -78% | 38 -31% | 25.4 12% | 39.7 -37% | 20.7 29% |
| Load Maximum * (Watt) | 29.4 | 69.7 -137% | 45 -53% | 28 5% | 51.9 -77% | 28.9 2% |
* ... mindre är bättre
| Lenovo ThinkPad E570-20H6S02M00 i5-7200U, HD Graphics 620, 42 Wh | Lenovo ThinkPad E570-20H6S00000 i5-7200U, GeForce GTX 950M, 41 Wh | HP ProBook 450 G4 Y8B60EA i7-7500U, GeForce 930MX, 45 Wh | Dell Latitude 15-3570 6200U, HD Graphics 520, 65 Wh | Acer TravelMate P259-MG-71UU 6500U, GeForce 940MX, 41 Wh | Fujitsu LifeBook A557 PL i5-7200U, HD Graphics 620, 49 Wh | |
|---|---|---|---|---|---|---|
| Batteridrifttid | 9% | 6% | 27% | -40% | -10% | |
| Reader / Idle (h) | 18.1 | 14.7 -19% | 12.4 -31% | 17.1 -6% | 10.3 -43% | 16.3 -10% |
| H.264 (h) | 6.5 | 4.1 -37% | ||||
| WiFi v1.3 (h) | 7.2 | 7.7 7% | 8.6 19% | 9 25% | 4.7 -35% | |
| Load (h) | 1.6 | 2.2 38% | 2.1 31% | 2.6 63% | 0.9 -44% | |
| WiFi (h) | 7.4 |
För
Emot
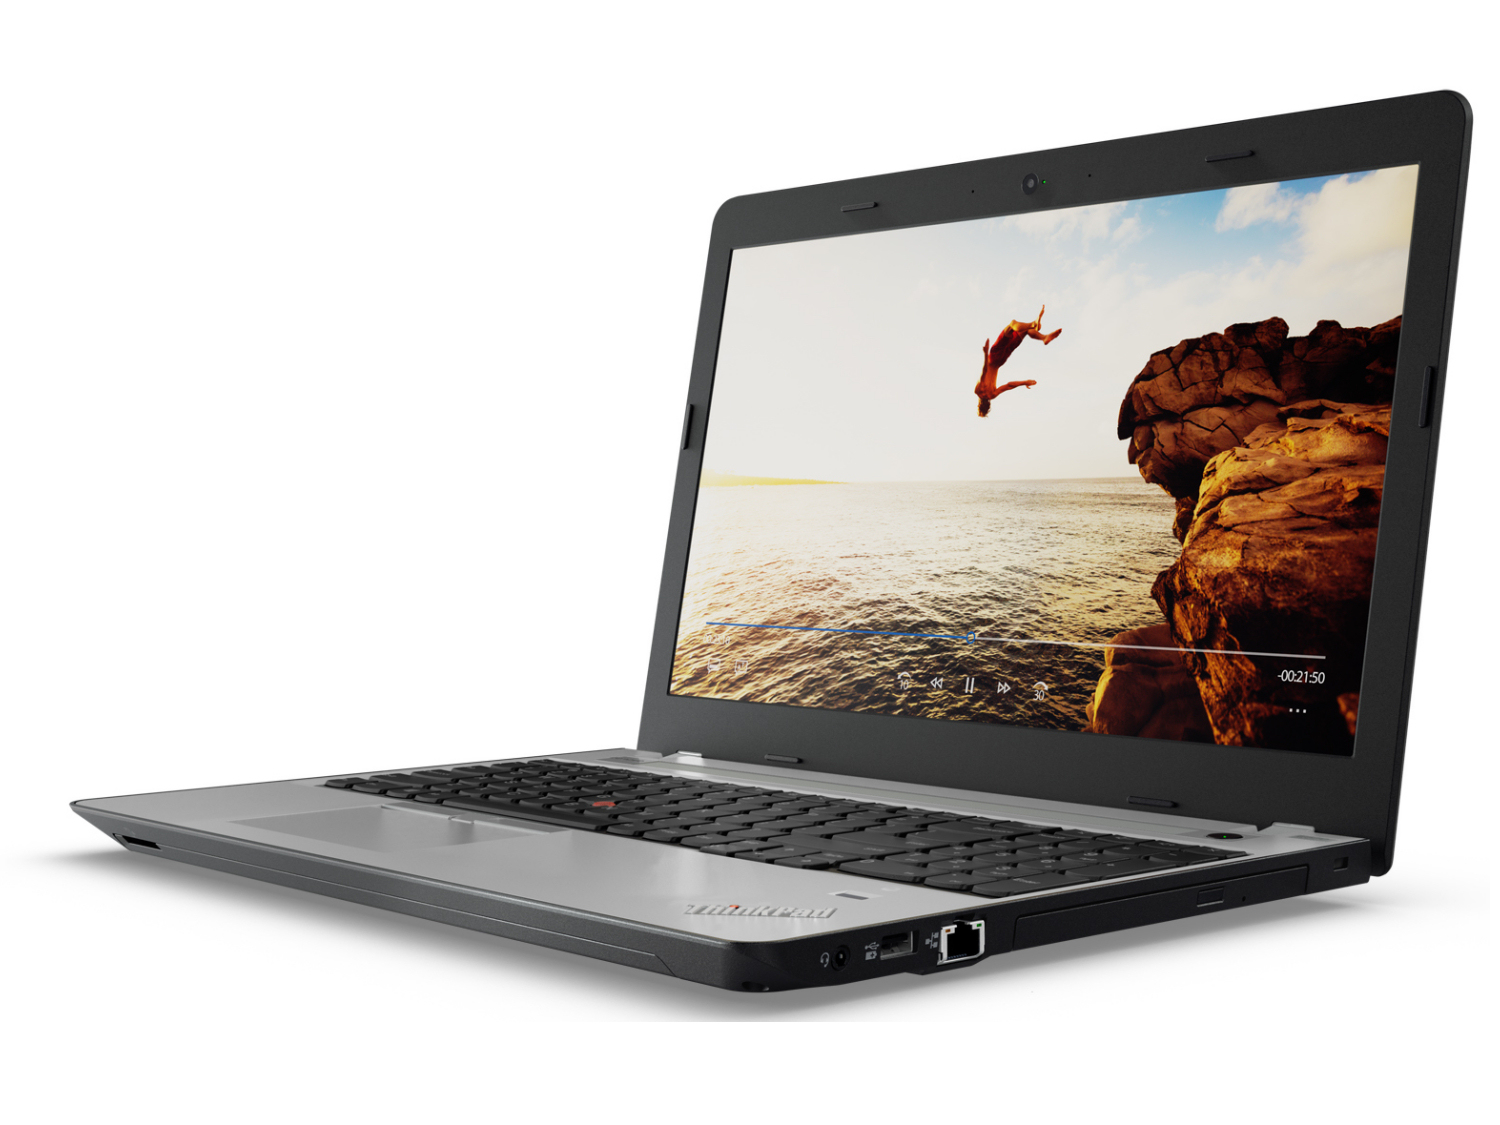
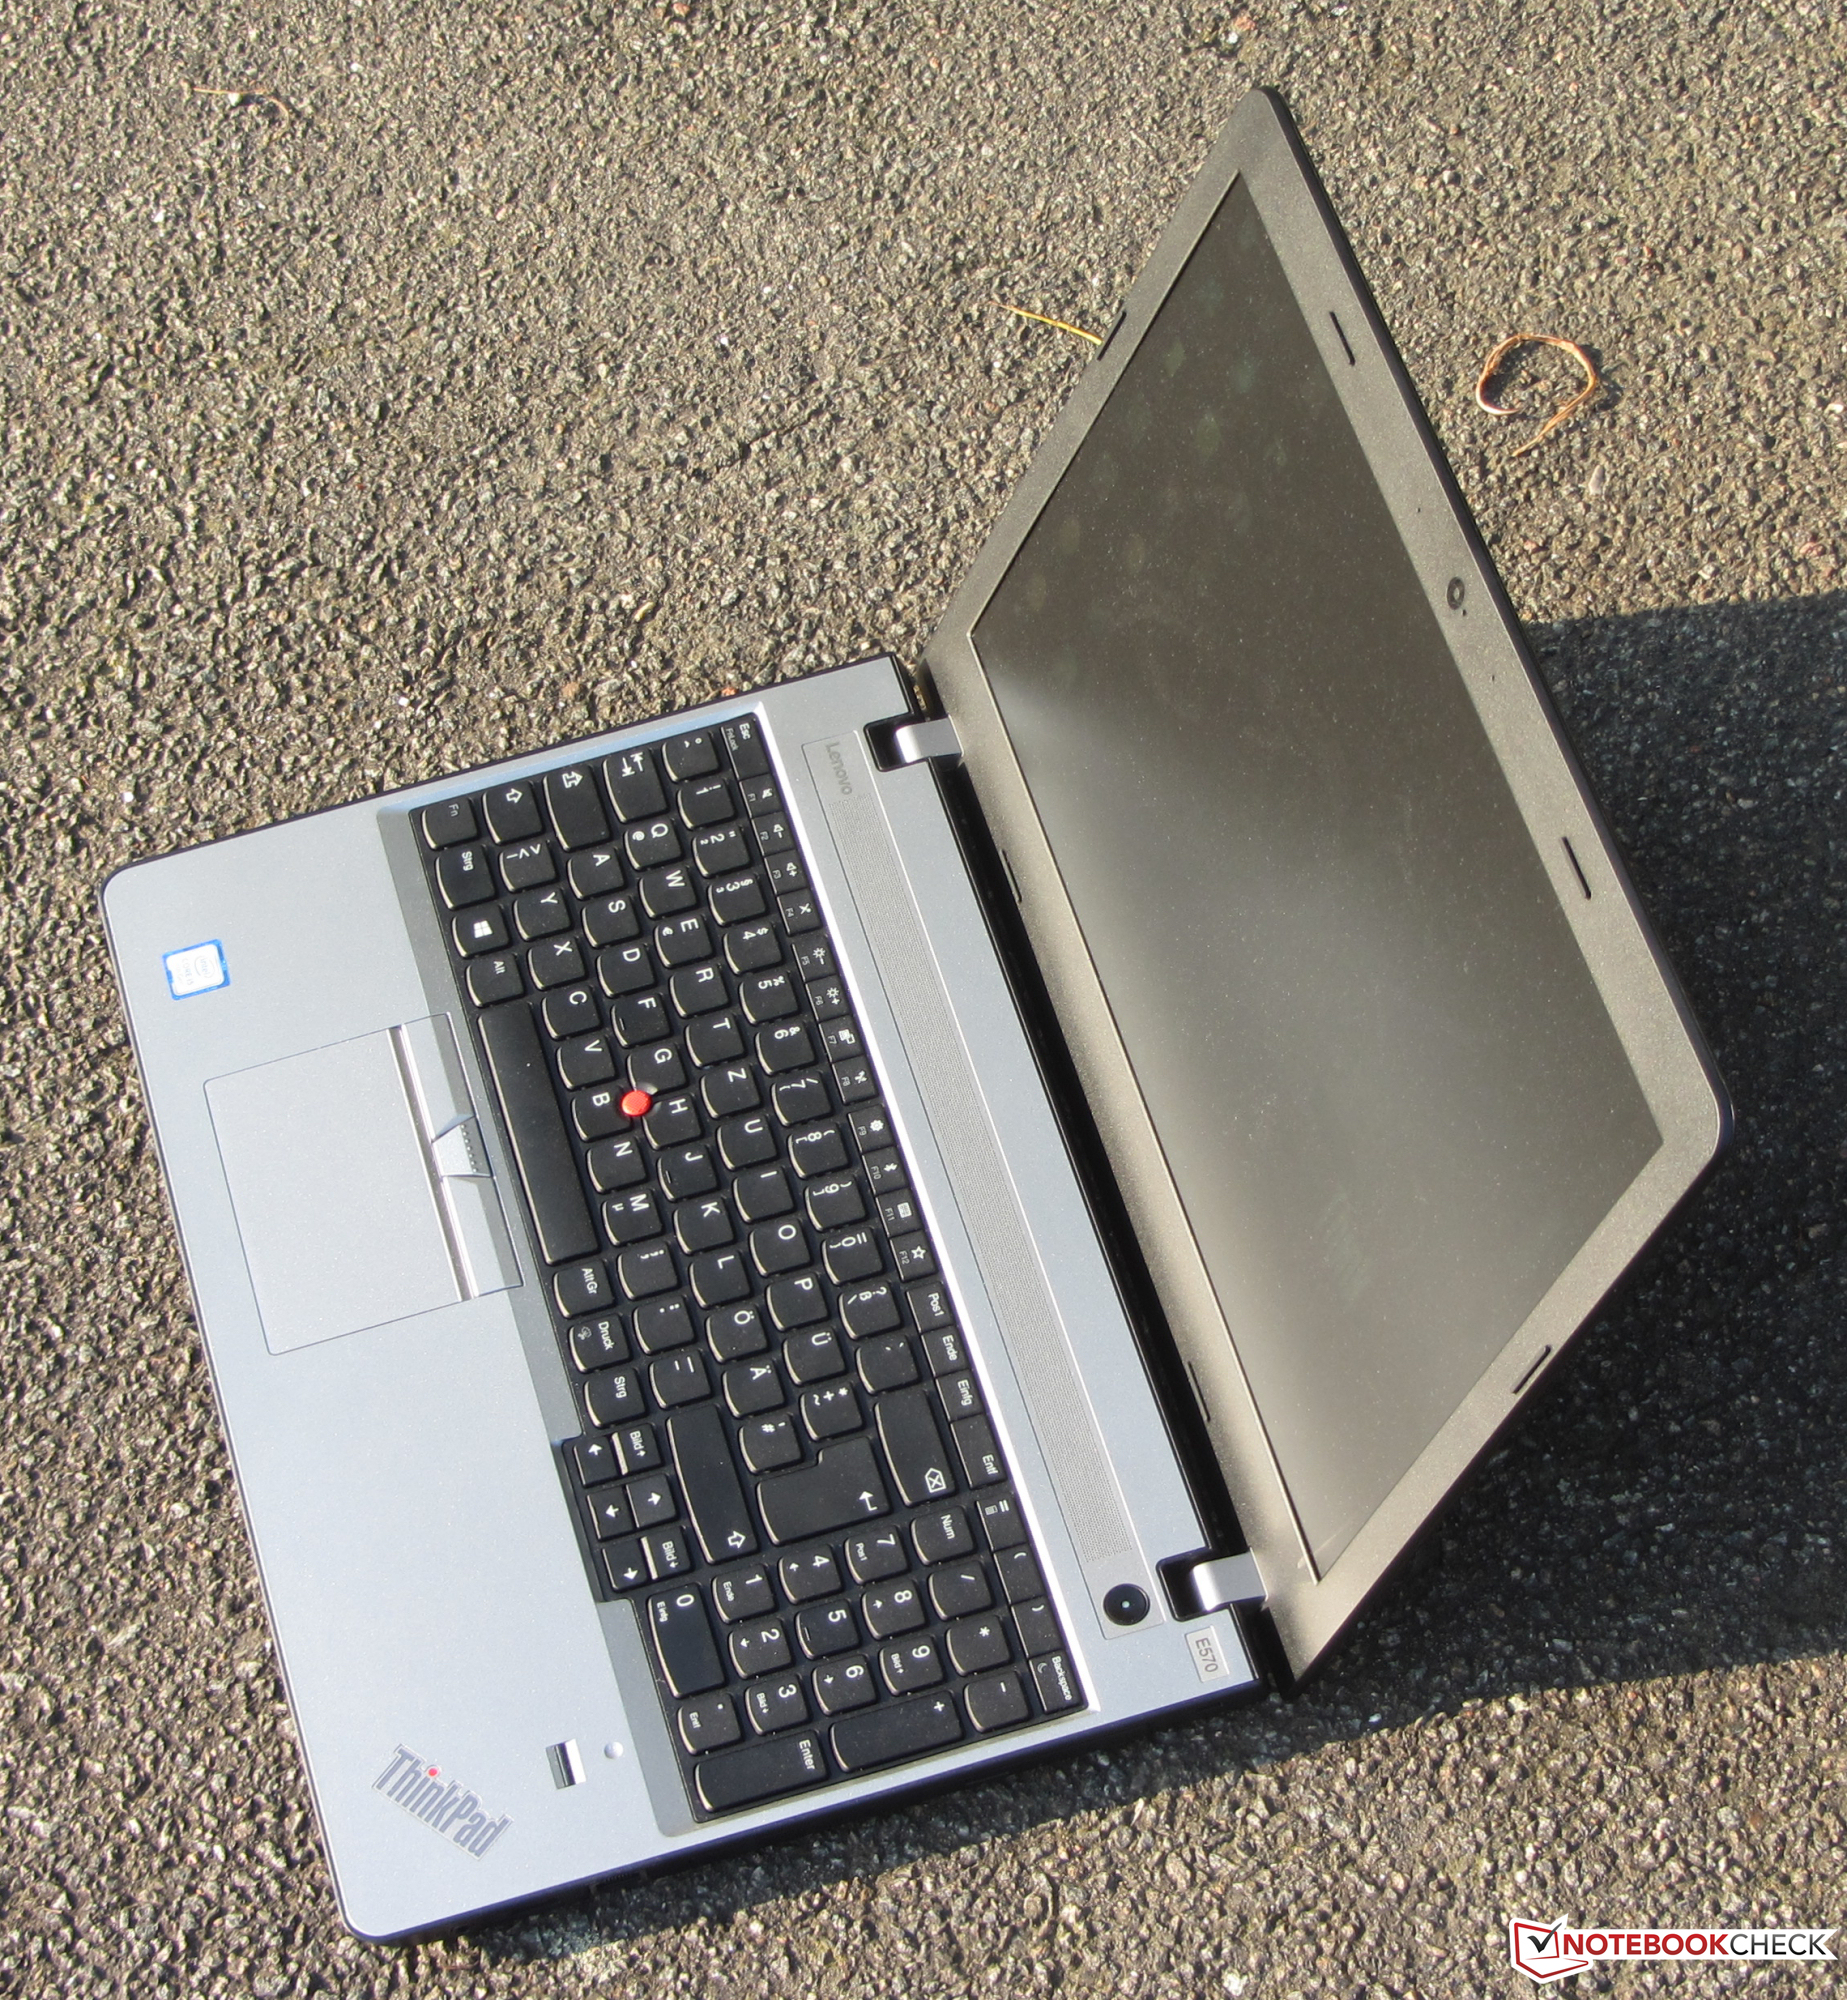
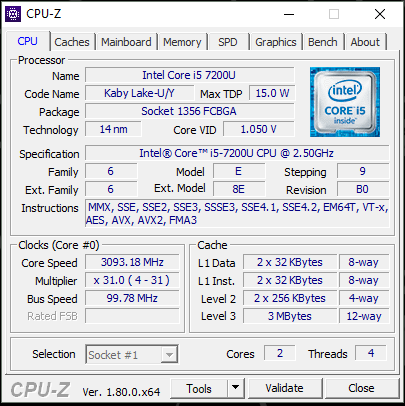
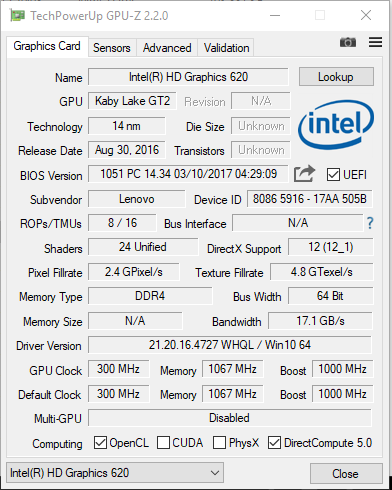
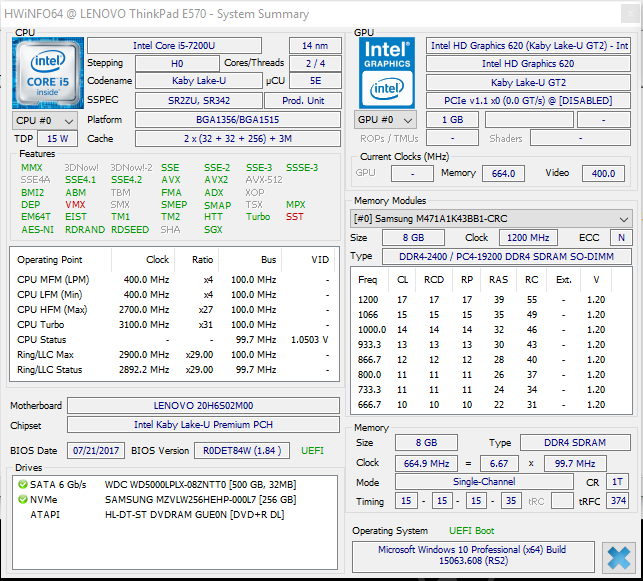
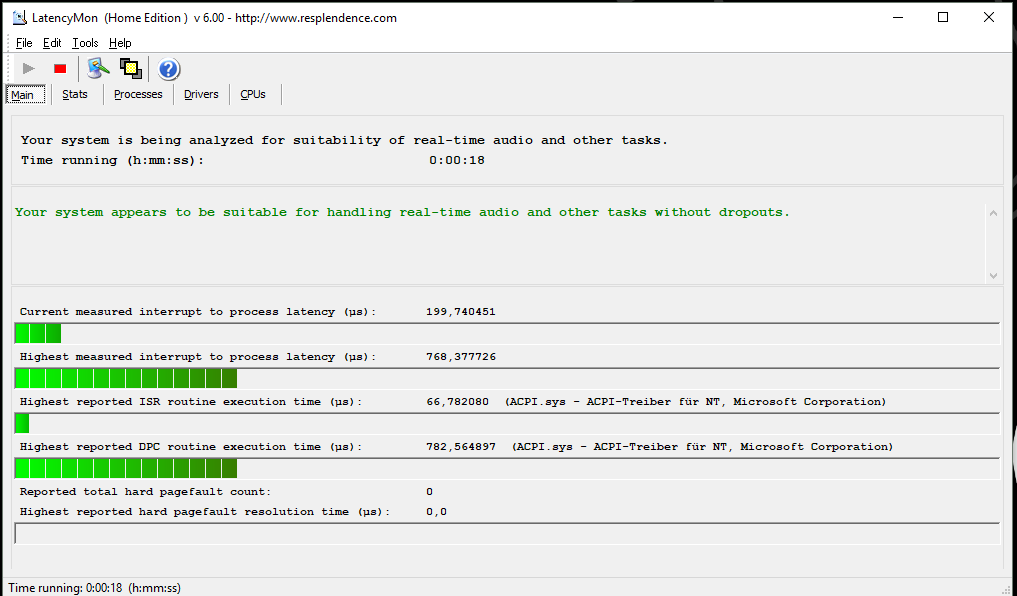
ThinkPad:en kommer med en Core i5 processor från Kaby Lake-generationen, som har mer än nog med kraft för kontors och internetapplikationer. Datorn är tyst oavsett belastning och blir knappt varm alls.
En snabb NVMe SSD säkrar ett snabbt system. En 500 GB hårddisk i 2.5-tumsformatet ger ytterligare utrymme. Båda enheterna kan lätt bytas ut tack vare en stor servicelucka. Likt sin föregångare så kommer ThinkPad E570 också med ett bra tangentbord. Och betteritiden är superb.
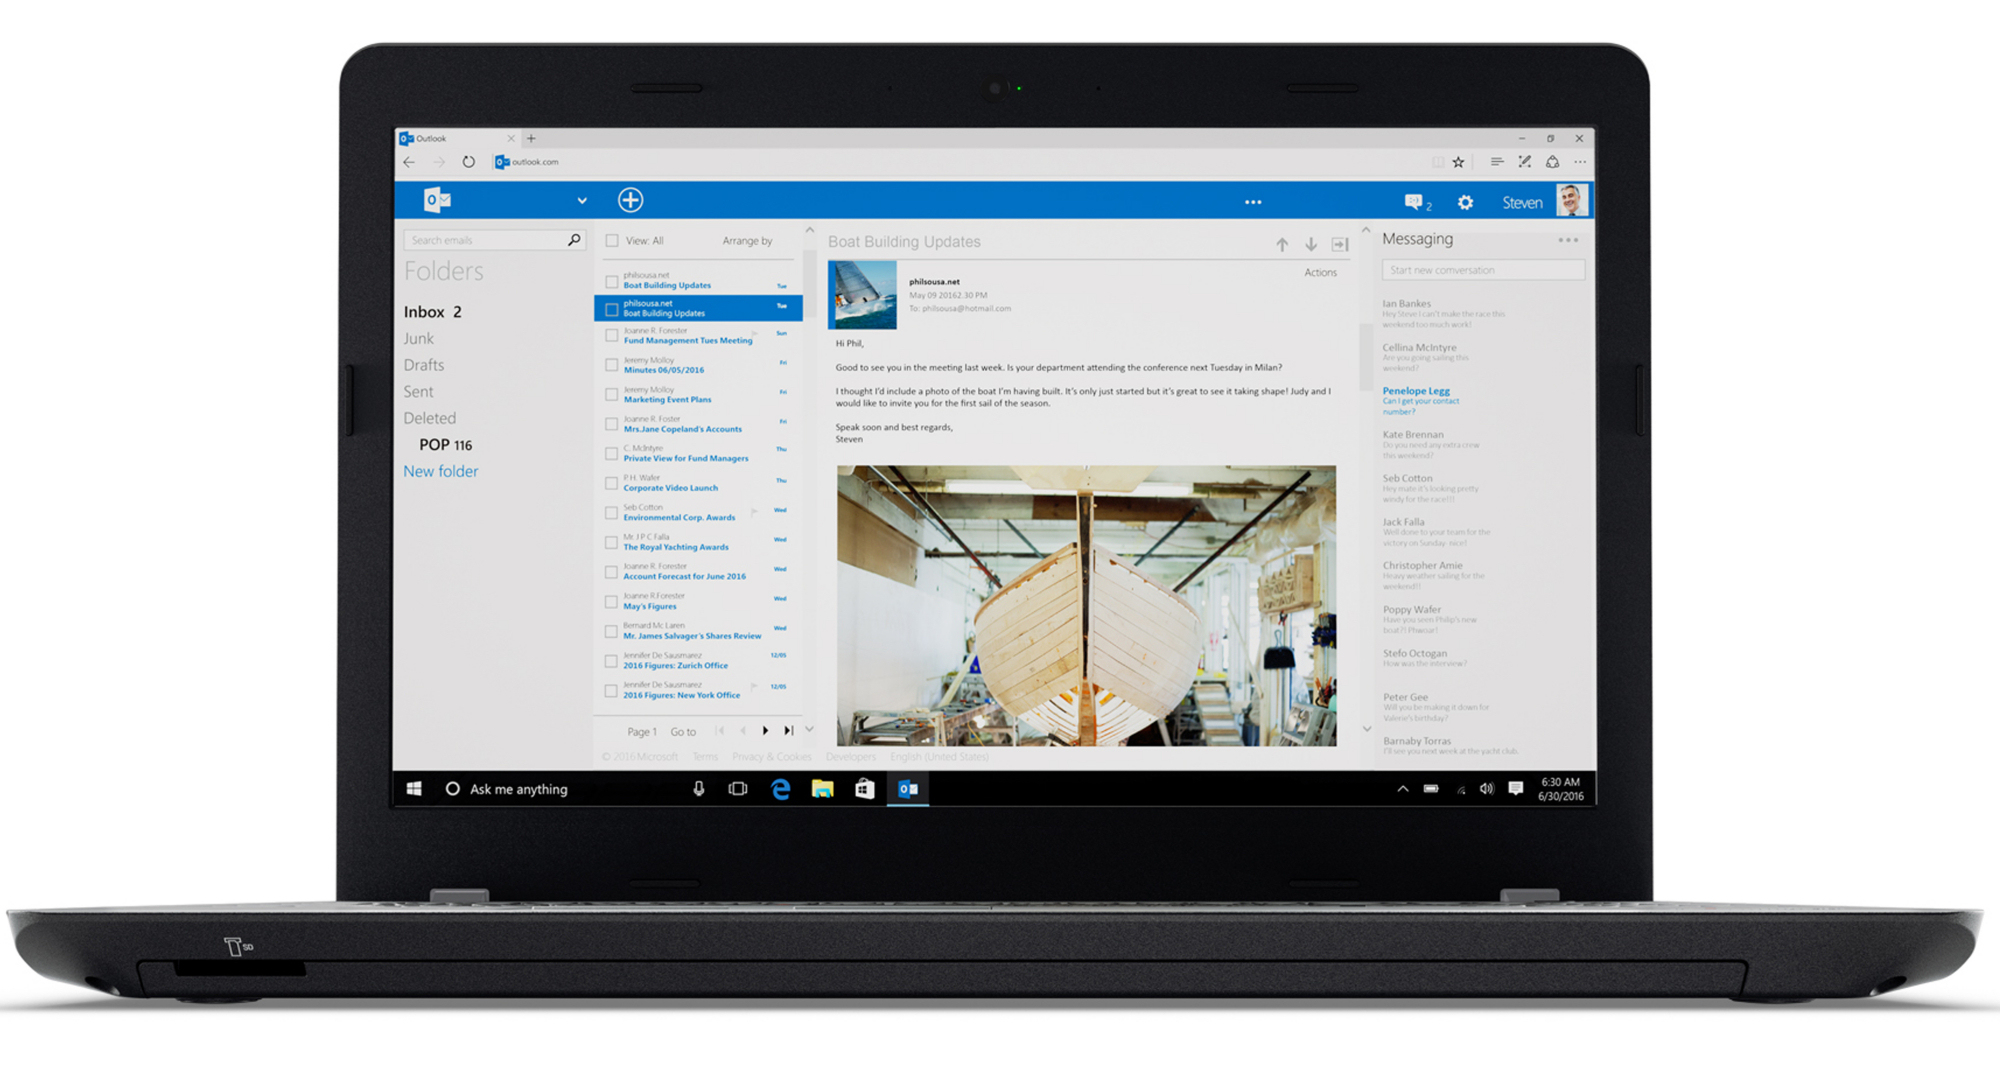
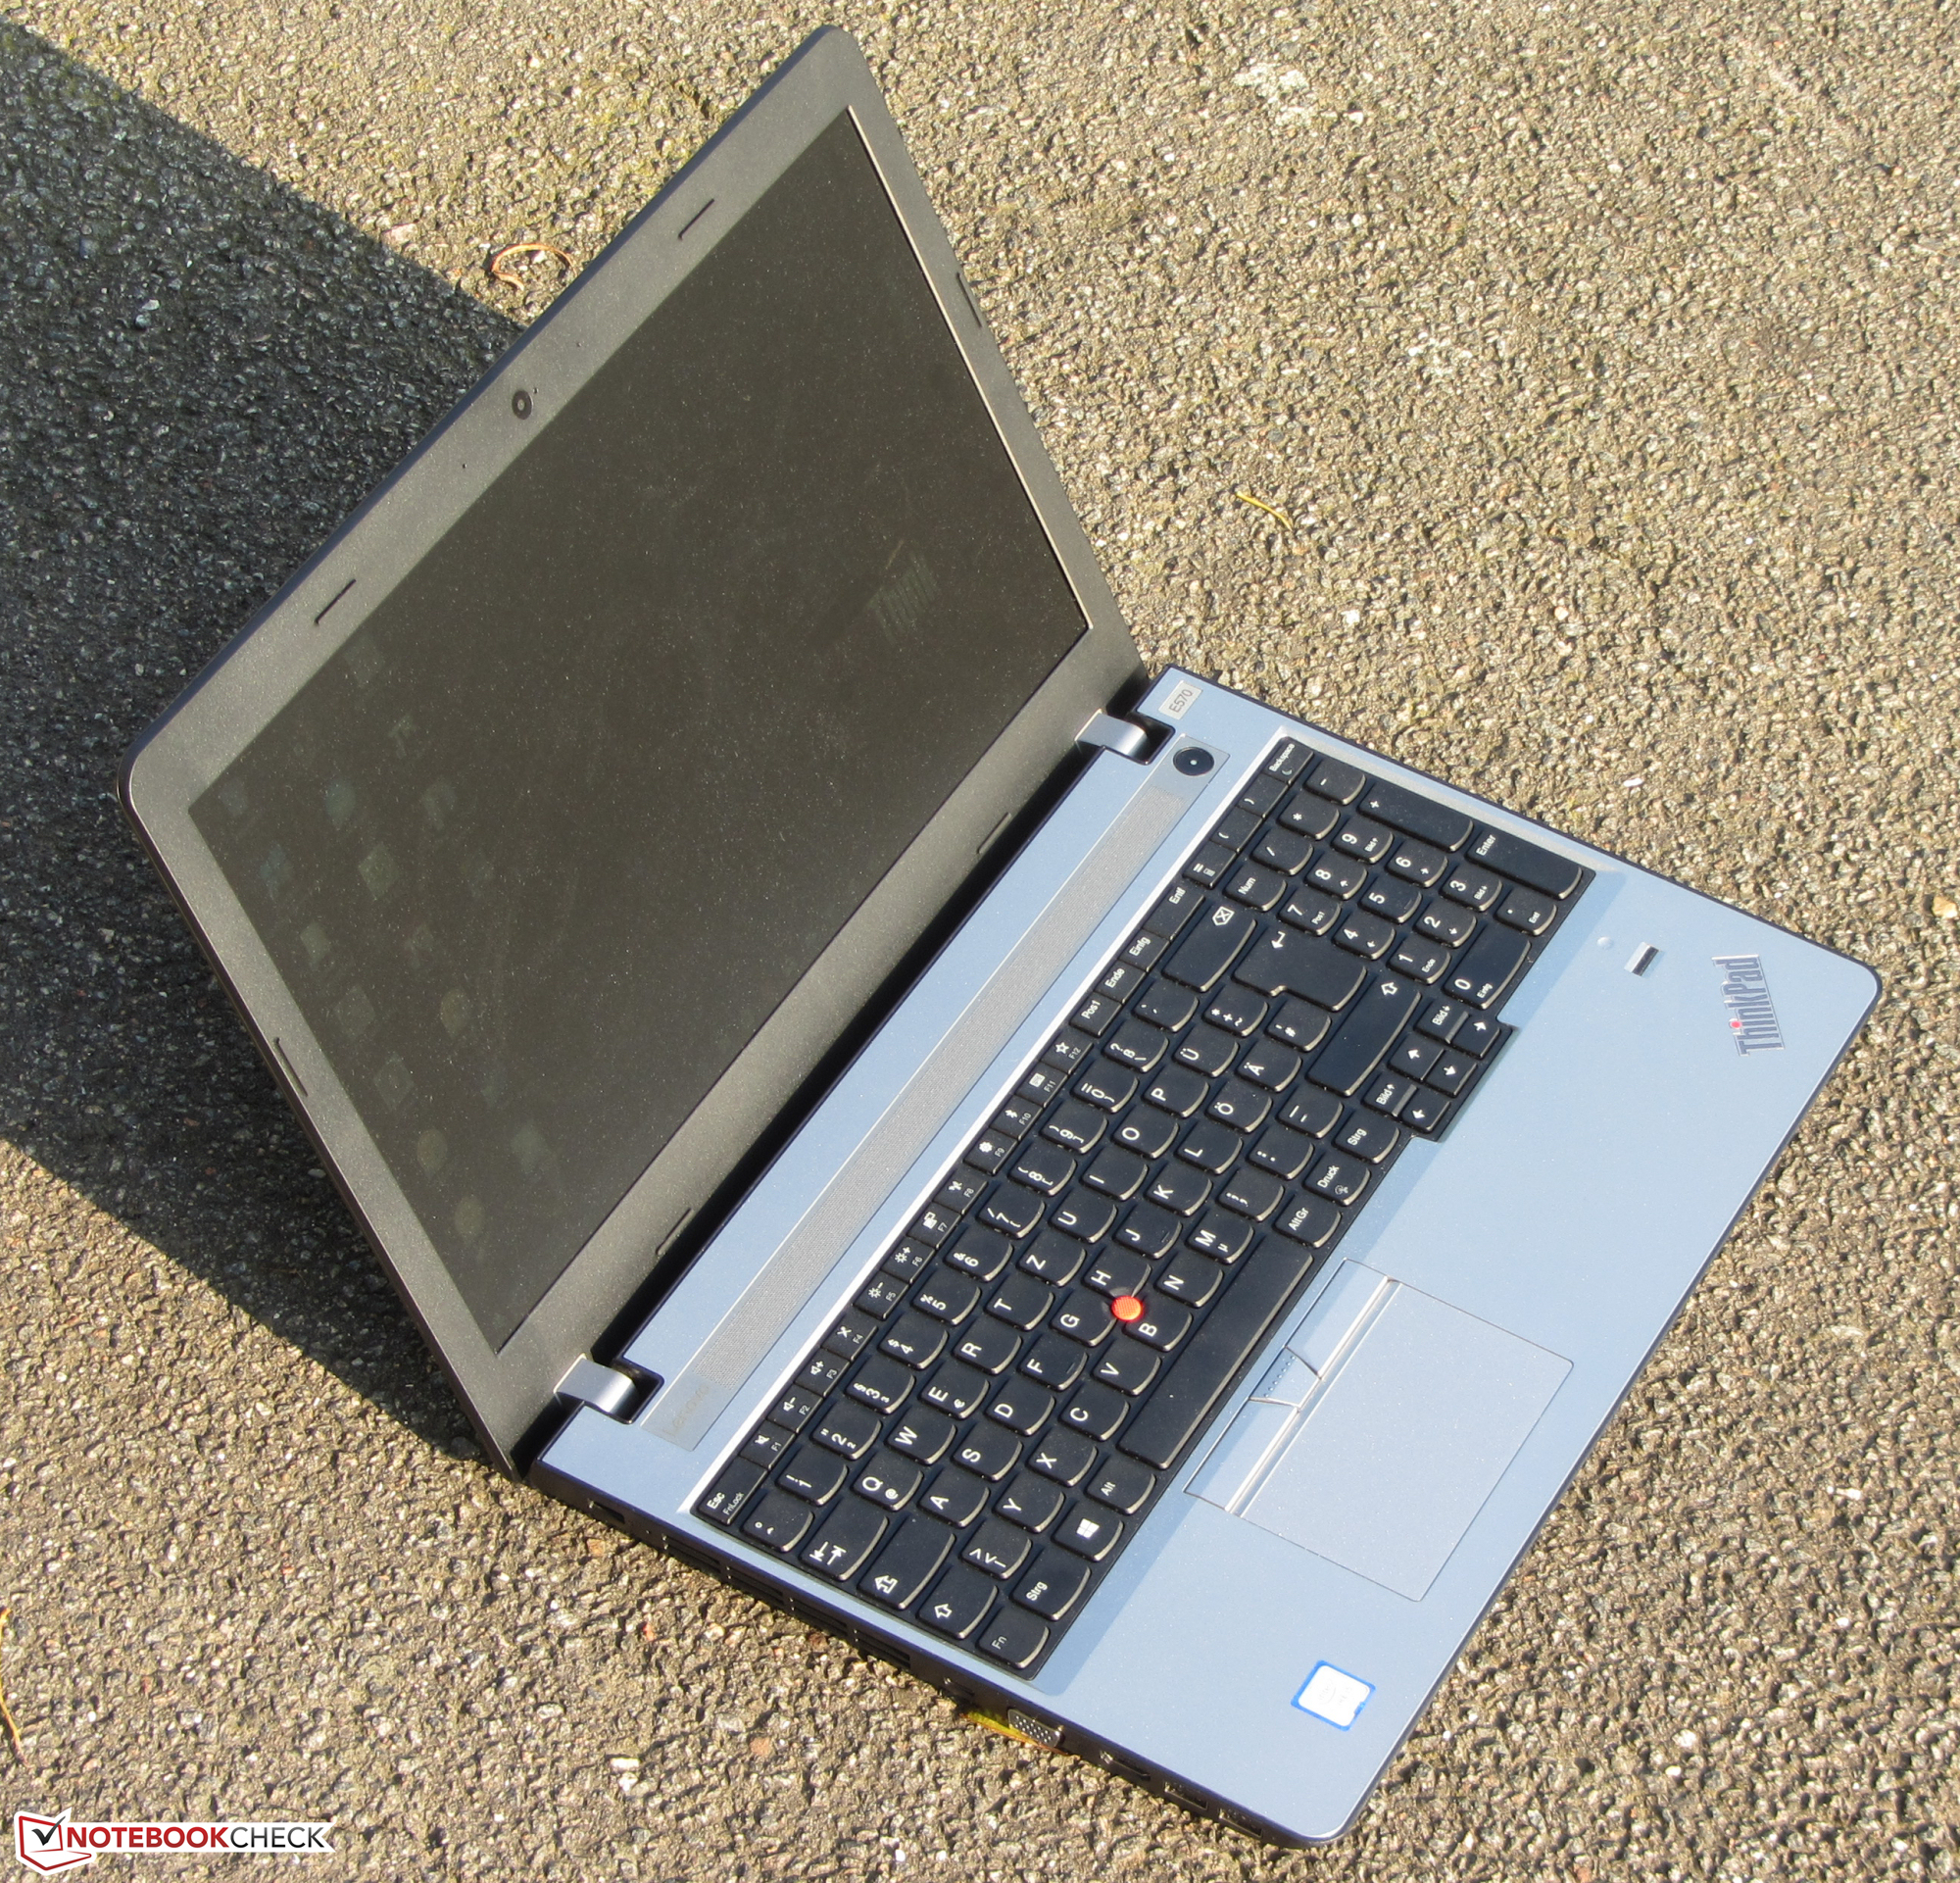
Lenovo har gjort fel val i fråga om skärmen. Vi rekommenderar IPS FHD-modellen.
Så väl den bristande precisionen hos färgåtergivningen och avsaknaden av en dedikerad grafikenhet, den huvudsakliga skillnaden mellan vårt recensionsex och den tidigare testade E570-modellen är skärmen. Lenovo har installerat en HD-panel som inte övertygar. Den är mörk, kräver rätt betraktningsvinkel och avger PWM-flimmer. Användare som är intresserade av ThinkPad:en borde definitivt välja en IPS FHD-modell.
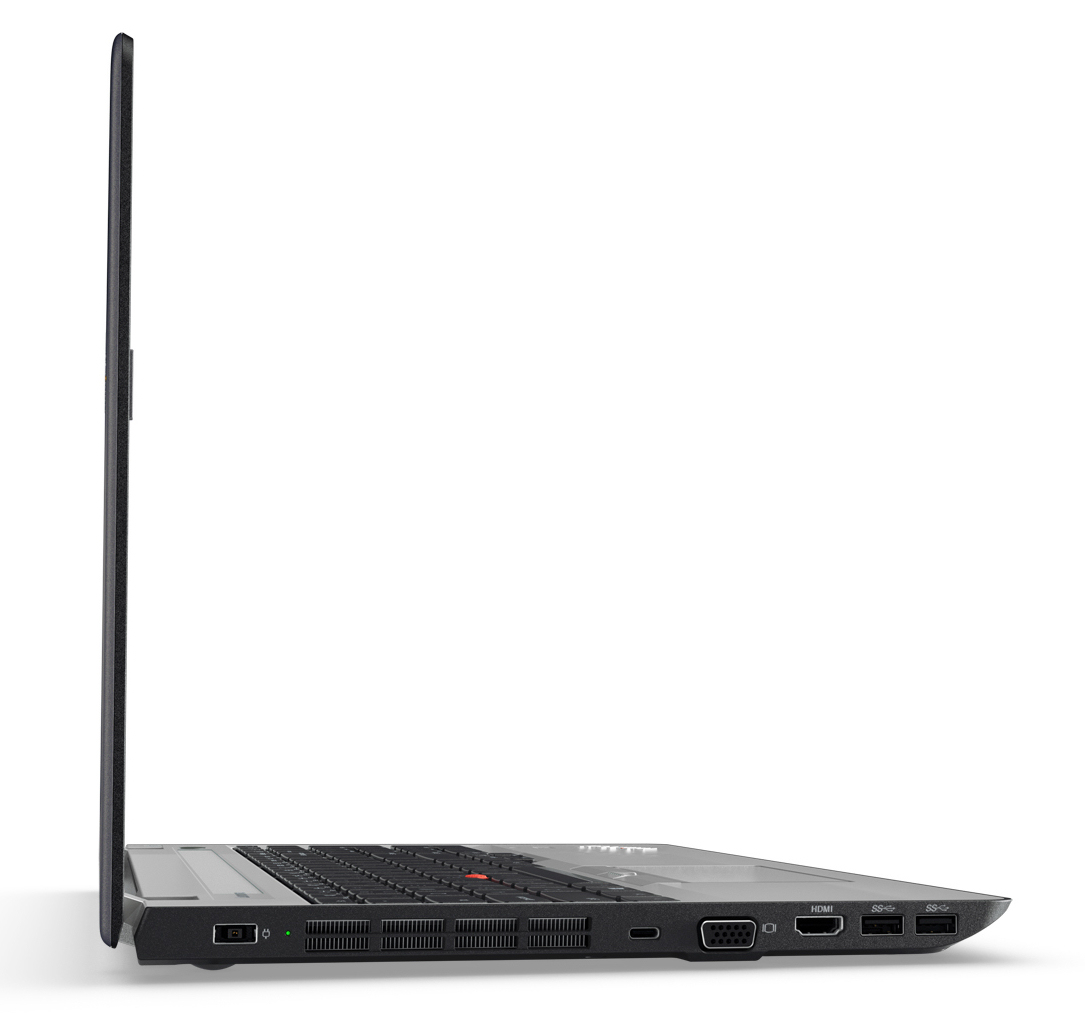
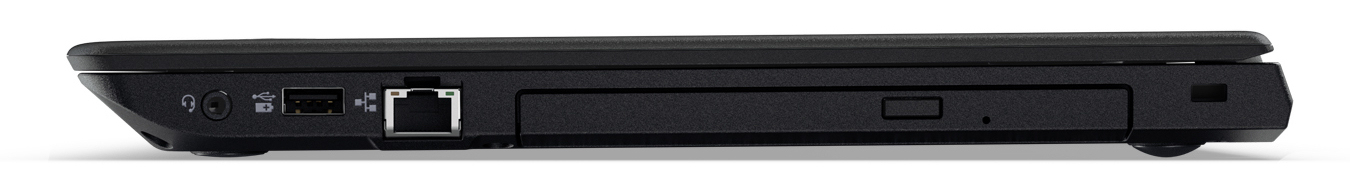
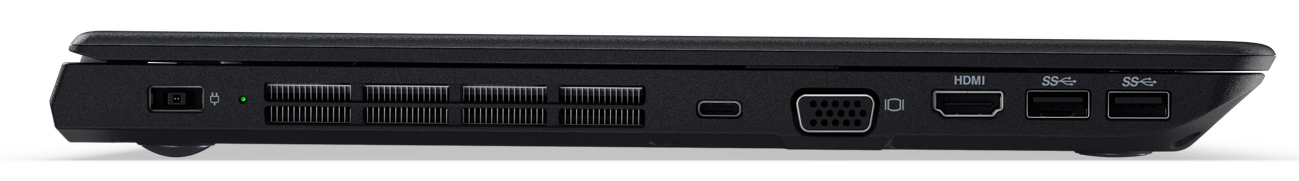
Förutom skärmen finns det andra saker med ThinkPad:en som behöver kritiseras. Skalet på E570 är inte särskilt robust. Detta är ett steg bakåt jämfört med sin föregångare. Ett annat steg bakåt är avsaknaden av en dockningsport (OneLink). Existerande OneLink-dockningsstationer kan inte användas och måste vid behov bytas ut mot USB-modeller. Batterierna från Thinkad E560 kan heller inte användas. Vidare så inkluderar Lenovo bara ett års garanti på datorn.
Lenovo ThinkPad E570-20H6S02M00
- 10/02/2017 v6 (old)
Sascha Mölck