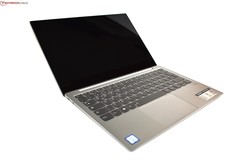
Test: Lenovo Yoga S730-13IWL (FHD, Core i7-8565U) Laptop (Sammanfattning)

| |||||||||||||||||||||||||
Distribution av ljusstyrkan: 85 %
Mitt på batteriet: 343 cd/m²
Kontrast: 1039:1 (Svärta: 0.33 cd/m²)
ΔE ColorChecker Calman: 2.38 | ∀{0.5-29.43 Ø4.73}
ΔE Greyscale Calman: 3.01 | ∀{0.09-98 Ø4.97}
98% sRGB (Argyll 1.6.3 3D)
62% AdobeRGB 1998 (Argyll 1.6.3 3D)
67.8% AdobeRGB 1998 (Argyll 3D)
98.2% sRGB (Argyll 3D)
66.3% Display P3 (Argyll 3D)
Gamma: 2.44
CCT: 7198 K
| Lenovo Yoga S730-13IWL B133HAN05.1, , 1920x1080, 13.3" | Lenovo Ideapad 720S-13IKB LG Philips LGD04EF, , 1920x1080, 13.3" | Dell XPS 13 9370 FHD i5 SHP1484, , 1920x1080, 13.3" | HP Envy 13-ah0003ng M133NVF3 R0, , 1920x1080, 13.3" | Asus ZenBook S UX391U AUO B133HAN04.9, , 1920x1080, 13.3" | Apple MacBook Air 2018 APPA039, , 2560x1600, 13.3" | |
|---|---|---|---|---|---|---|
| Display | -10% | 2% | -17% | -5% | 1% | |
| Display P3 Coverage (%) | 66.3 | 64.3 -3% | 68.9 4% | 54.8 -17% | 64.4 -3% | 67.8 2% |
| sRGB Coverage (%) | 98.2 | 82.3 -16% | 96.6 -2% | 82.5 -16% | 90.5 -8% | 96.1 -2% |
| AdobeRGB 1998 Coverage (%) | 67.8 | 60.2 -11% | 69.6 3% | 56.6 -17% | 65.2 -4% | 69.8 3% |
| Response Times | 27% | -33% | 33% | 11% | 18% | |
| Response Time Grey 50% / Grey 80% * (ms) | 53 ? | 35 ? 34% | 62.4 ? -18% | 31 ? 42% | 44.8 ? 15% | 39.6 ? 25% |
| Response Time Black / White * (ms) | 31 ? | 25 ? 19% | 45.6 ? -47% | 24 ? 23% | 29.2 ? 6% | 28 ? 10% |
| PWM Frequency (Hz) | 131000 ? | 1008 ? | 1000 ? | 113600 ? | ||
| Screen | -46% | -8% | 8% | -37% | 15% | |
| Brightness middle (cd/m²) | 343 | 335 -2% | 428 25% | 289 -16% | 299 -13% | 320 -7% |
| Brightness (cd/m²) | 323 | 303 -6% | 405 25% | 310 -4% | 300 -7% | 315 -2% |
| Brightness Distribution (%) | 85 | 85 0% | 87 2% | 85 0% | 92 8% | 95 12% |
| Black Level * (cd/m²) | 0.33 | 0.46 -39% | 0.26 21% | 0.23 30% | 0.26 21% | 0.29 12% |
| Contrast (:1) | 1039 | 728 -30% | 1646 58% | 1257 21% | 1150 11% | 1103 6% |
| Colorchecker dE 2000 * | 2.38 | 5.09 -114% | 3.8 -60% | 1.64 31% | 5.6 -135% | 1.2 50% |
| Colorchecker dE 2000 max. * | 3.55 | 11.92 -236% | 7.2 -103% | 3.31 7% | 9.1 -156% | 3.2 10% |
| Greyscale dE 2000 * | 3.01 | 3.23 -7% | 4.4 -46% | 1.71 43% | 5.5 -83% | 0.8 73% |
| Gamma | 2.44 90% | 2.18 101% | 2.21 100% | 2.32 95% | 2.47 89% | 2.2 100% |
| CCT | 7198 90% | 6214 105% | 7067 92% | 6291 103% | 7533 86% | 6548 99% |
| Color Space (Percent of AdobeRGB 1998) (%) | 62 | 54 -13% | 62.8 1% | 52 -16% | 58.9 -5% | 62.1 0% |
| Color Space (Percent of sRGB) (%) | 98 | 82 -16% | 96.4 -2% | 82 -16% | 90.3 -8% | 96 -2% |
| Colorchecker dE 2000 calibrated * | 0.99 | 2.6 | 0.5 | |||
| Totalt genomsnitt (program/inställningar) | -10% /
-29% | -13% /
-9% | 8% /
6% | -10% /
-24% | 11% /
13% |
* ... mindre är bättre
Visa svarstider
| ↔ Svarstid svart till vitt | ||
|---|---|---|
| 31 ms ... stiga ↗ och falla ↘ kombinerat | ↗ 16 ms stiga | 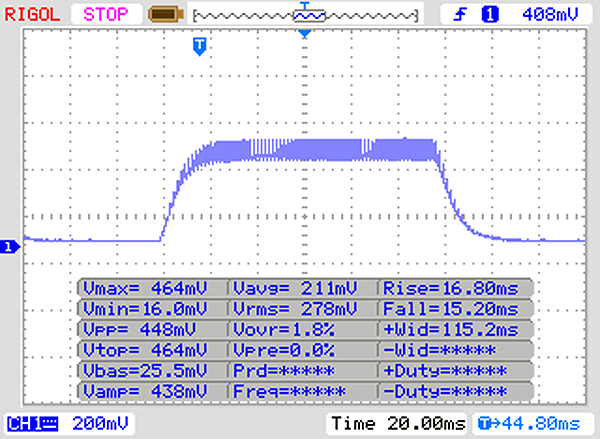 |
| ↘ 15 ms hösten | ||
| Skärmen visar långsamma svarsfrekvenser i våra tester och kommer att vara otillfredsställande för spelare. I jämförelse sträcker sig alla testade enheter från 0.1 (minst) till 240 (maximalt) ms. » 84 % av alla enheter är bättre. Detta innebär att den uppmätta svarstiden är sämre än genomsnittet av alla testade enheter (19.9 ms). | ||
| ↔ Svarstid 50 % grått till 80 % grått | ||
| 53 ms ... stiga ↗ och falla ↘ kombinerat | ↗ 27 ms stiga | 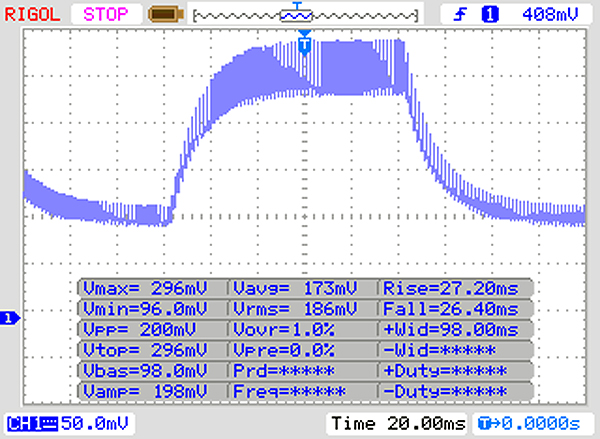 |
| ↘ 26 ms hösten | ||
| Skärmen visar långsamma svarsfrekvenser i våra tester och kommer att vara otillfredsställande för spelare. I jämförelse sträcker sig alla testade enheter från 0.165 (minst) till 636 (maximalt) ms. » 90 % av alla enheter är bättre. Detta innebär att den uppmätta svarstiden är sämre än genomsnittet av alla testade enheter (31.1 ms). | ||
Skärmflimmer / PWM (Puls-Width Modulation)
| Skärmflimmer / PWM upptäcktes inte | 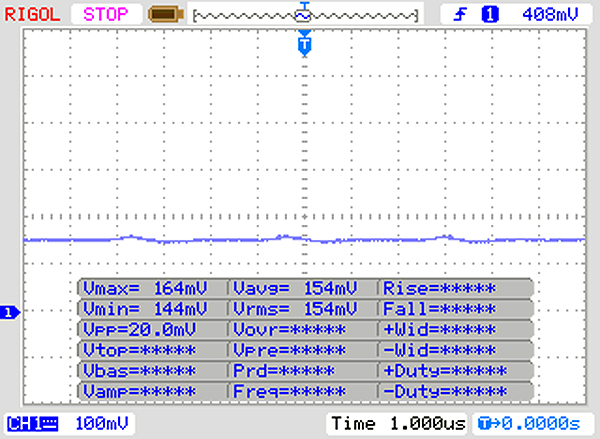 | ||
Som jämförelse: 52 % av alla testade enheter använder inte PWM för att dämpa skärmen. Om PWM upptäcktes mättes ett medelvärde av 7794 (minst: 5 - maximum: 343500) Hz. | |||
| PCMark 8 Home Score Accelerated v2 | 3096 poäng | |
| PCMark 8 Work Score Accelerated v2 | 4733 poäng | |
| PCMark 10 Score | 4022 poäng | |
Hjälp | ||
| Lenovo Yoga S730-13IWL Samsung SSD PM981 MZVLB1T0HALR | Dell XPS 13 9370 FHD i5 Toshiba XG5 KXG50ZNV256G | HP Envy 13-ah0003ng SK Hynix BC501 HFM512GDJTNG | Asus ZenBook S UX391U Samsung PM961 NVMe MZVLW512HMJP | Lenovo Ideapad 720S-13IKB Samsung PM961 MZVLW256HEHP | Genomsnitt Samsung SSD PM981 MZVLB1T0HALR | |
|---|---|---|---|---|---|---|
| CrystalDiskMark 5.2 / 6 | -0% | -30% | -12% | -5% | 16% | |
| Write 4K (MB/s) | 139.6 | 128.2 -8% | 112.9 -19% | 98.9 -29% | 115 -18% | 165.7 ? 19% |
| Read 4K (MB/s) | 36.97 | 48.09 30% | 38.69 5% | 38.33 4% | 41.36 12% | 44.6 ? 21% |
| Write Seq (MB/s) | 1490 | 1088 -27% | 654 -56% | 1414 -5% | 1208 -19% | 1982 ? 33% |
| Read Seq (MB/s) | 1321 | 1877 42% | 642 -51% | 1051 -20% | 1448 10% | 1764 ? 34% |
| Write 4K Q32T1 (MB/s) | 302.4 | 367.1 21% | 305.9 1% | 370.7 23% | 395 31% | 395 ? 31% |
| Read 4K Q32T1 (MB/s) | 375.4 | 411.9 10% | 351.6 -6% | 251.4 -33% | 373.9 0% | 434 ? 16% |
| Write Seq Q32T1 (MB/s) | 2391 | 1078 -55% | 869 -64% | 1606 -33% | 1217 -49% | 2351 ? -2% |
| Read Seq Q32T1 (MB/s) | 3272 | 2771 -15% | 1683 -49% | 3218 -2% | 3167 -3% | 3234 ? -1% |
| Write 4K Q8T8 (MB/s) | 1254 | 1408 ? 12% | ||||
| Read 4K Q8T8 (MB/s) | 1525 | 1449 ? -5% |

| 3DMark 11 Performance | 2025 poäng | |
| 3DMark Cloud Gate Standard Score | 6769 poäng | |
| 3DMark Fire Strike Score | 1073 poäng | |
| 3DMark Time Spy Score | 444 poäng | |
Hjälp | ||
| låg | med. | hög | ultra | |
|---|---|---|---|---|
| BioShock Infinite (2013) | 81.7 | 41 | 34.1 | 10.38 |
| Rise of the Tomb Raider (2016) | 19 | |||
| Civilization 6 (2016) | 39.9 | 17.2 |
Ljudnivå
| Låg belastning |
| 30.6 / 30.6 / 30.6 dB(A) |
| Hög belastning |
| 37.5 / 34.5 dB(A) |
 | ||
30 dB tyst 40 dB(A) hörbar 50 dB(A) högt ljud |
||
min: | ||
(-) Den maximala temperaturen på ovansidan är 46.1 °C / 115 F, jämfört med genomsnittet av 34.3 °C / 94 F , allt från 21.2 till 62.5 °C för klassen Office.
(±) Botten värms upp till maximalt 43.9 °C / 111 F, jämfört med genomsnittet av 36.8 °C / 98 F
(+) Vid tomgångsbruk är medeltemperaturen för ovansidan 26.4 °C / 80 F, jämfört med enhetsgenomsnittet på 29.5 °C / ### class_avg_f### F.
(+) Handledsstöden och pekplattan är kallare än hudtemperaturen med maximalt 30 °C / 86 F och är därför svala att ta på.
(-) Medeltemperaturen för handledsstödsområdet på liknande enheter var 27.5 °C / 81.5 F (-2.5 °C / -4.5 F).
Lenovo Yoga S730-13IWL ljudanalys
(-) | inte särskilt höga högtalare (68.9 dB)
Bas 100 - 315 Hz
(±) | reducerad bas - i genomsnitt 10.4% lägre än medianen
(-) | basen är inte linjär (15.9% delta till föregående frekvens)
Mellan 400 - 2000 Hz
(±) | högre mellan - i genomsnitt 6.3% högre än median
(+) | mids är linjära (4.7% delta till föregående frekvens)
Högsta 2 - 16 kHz
(+) | balanserade toppar - endast 3.1% från medianen
(+) | toppar är linjära (4.9% delta till föregående frekvens)
Totalt 100 - 16 000 Hz
(±) | linjäriteten för det totala ljudet är genomsnittlig (17.7% skillnad mot median)
Jämfört med samma klass
» 28% av alla testade enheter i den här klassen var bättre, 6% liknande, 66% sämre
» Den bästa hade ett delta på 7%, genomsnittet var 21%, sämst var 53%
Jämfört med alla testade enheter
» 35% av alla testade enheter var bättre, 8% liknande, 57% sämre
» Den bästa hade ett delta på 4%, genomsnittet var 24%, sämst var 134%
Apple MacBook Air 2018 ljudanalys
(±) | högtalarljudstyrkan är genomsnittlig men bra (75 dB)
Bas 100 - 315 Hz
(±) | reducerad bas - i genomsnitt 8.1% lägre än medianen
(±) | linjäriteten för basen är genomsnittlig (10% delta till föregående frekvens)
Mellan 400 - 2000 Hz
(+) | balanserad mellan - endast 2.9% från medianen
(+) | mids är linjära (5.6% delta till föregående frekvens)
Högsta 2 - 16 kHz
(+) | balanserade toppar - endast 2.2% från medianen
(+) | toppar är linjära (4.5% delta till föregående frekvens)
Totalt 100 - 16 000 Hz
(+) | det totala ljudet är linjärt (12.3% skillnad mot median)
Jämfört med samma klass
» 16% av alla testade enheter i den här klassen var bättre, 5% liknande, 80% sämre
» Den bästa hade ett delta på 5%, genomsnittet var 18%, sämst var 53%
Jämfört med alla testade enheter
» 10% av alla testade enheter var bättre, 3% liknande, 87% sämre
» Den bästa hade ett delta på 4%, genomsnittet var 24%, sämst var 134%
Lenovo Yoga C930-13IKB ljudanalys
(±) | högtalarljudstyrkan är genomsnittlig men bra (77.4 dB)
Bas 100 - 315 Hz
(+) | bra bas - bara 4.8% från medianen
(±) | linjäriteten för basen är genomsnittlig (8.8% delta till föregående frekvens)
Mellan 400 - 2000 Hz
(+) | balanserad mellan - endast 3% från medianen
(+) | mids är linjära (4.6% delta till föregående frekvens)
Högsta 2 - 16 kHz
(±) | reducerade toppar - i genomsnitt 5.1% lägre än medianen
(+) | toppar är linjära (5.4% delta till föregående frekvens)
Totalt 100 - 16 000 Hz
(+) | det totala ljudet är linjärt (14.1% skillnad mot median)
Jämfört med samma klass
» 20% av alla testade enheter i den här klassen var bättre, 4% liknande, 76% sämre
» Den bästa hade ett delta på 6%, genomsnittet var 20%, sämst var 57%
Jämfört med alla testade enheter
» 17% av alla testade enheter var bättre, 4% liknande, 80% sämre
» Den bästa hade ett delta på 4%, genomsnittet var 24%, sämst var 134%
| Av/Standby | |
| Låg belastning | |
| Hög belastning |
|
Förklaring:
min: | |
| Lenovo Yoga S730-13IWL i7-8565U, UHD Graphics 620, Samsung SSD PM981 MZVLB1T0HALR, IPS LED, 1920x1080, 13.3" | Dell XPS 13 9370 FHD i5 i5-8250U, UHD Graphics 620, Toshiba XG5 KXG50ZNV256G, IPS, 1920x1080, 13.3" | HP Envy 13-ah0003ng i5-8550U, GeForce MX150, SK Hynix BC501 HFM512GDJTNG, IPS, 1920x1080, 13.3" | Asus ZenBook S UX391U i5-8550U, UHD Graphics 620, Samsung PM961 NVMe MZVLW512HMJP, IPS, 1920x1080, 13.3" | Apple MacBook Air 2018 i5-8210Y, UHD Graphics 617, Apple SSD AP0256, IPS, 2560x1600, 13.3" | Lenovo Ideapad 720S-13IKB i5-8250U, UHD Graphics 620, Samsung PM961 MZVLW256HEHP, IPS, 1920x1080, 13.3" | Genomsnitt Intel UHD Graphics 620 | Genomsnitt av klass Office | |
|---|---|---|---|---|---|---|---|---|
| Power Consumption | 10% | -16% | -0% | 21% | -3% | -3% | -19% | |
| Idle Minimum * (Watt) | 3 | 3.14 -5% | 5.3 -77% | 3.24 -8% | 2.2 27% | 3.9 -30% | 3.81 ? -27% | 4.44 ? -48% |
| Idle Average * (Watt) | 5.6 | 5.22 7% | 7.3 -30% | 6.1 -9% | 5.7 -2% | 7.7 -38% | 6.94 ? -24% | 7.38 ? -32% |
| Idle Maximum * (Watt) | 11 | 6 45% | 9.3 15% | 9.2 16% | 10.3 6% | 10.4 5% | 8.75 ? 20% | 8.59 ? 22% |
| Load Average * (Watt) | 38 | 38.5 -1% | 39 -3% | 38.8 -2% | 25.6 33% | 33.3 12% | 35 ? 8% | 43 ? -13% |
| Load Maximum * (Watt) | 53 | 50.4 5% | 46 13% | 52.6 1% | 30.6 42% | 34 36% | 47.5 ? 10% | 64.5 ? -22% |
* ... mindre är bättre
| Lenovo Yoga S730-13IWL i7-8565U, UHD Graphics 620, 42 Wh | Dell XPS 13 9370 FHD i5 i5-8250U, UHD Graphics 620, 52 Wh | HP Envy 13-ah0003ng i5-8550U, GeForce MX150, 53.2 Wh | Asus ZenBook S UX391U i5-8550U, UHD Graphics 620, 50 Wh | Apple MacBook Air 2018 i5-8210Y, UHD Graphics 617, 50.3 Wh | Lenovo Ideapad 720S-13IKB i5-8250U, UHD Graphics 620, 46 Wh | Genomsnitt av klass Office | |
|---|---|---|---|---|---|---|---|
| Batteridrifttid | 44% | -1% | 22% | 43% | 14% | 53% | |
| Reader / Idle (h) | 15.9 | 23.6 48% | 15.5 -3% | 22.3 40% | 17.3 9% | 23.7 ? 49% | |
| H.264 (h) | 8.9 | 13.9 56% | 6.3 -29% | 10.4 17% | 12.3 38% | 15 ? 69% | |
| WiFi v1.3 (h) | 6.9 | 10.7 55% | 8 16% | 8.2 19% | 11.1 61% | 10.1 46% | 12.9 ? 87% |
| Load (h) | 1.7 | 2 18% | 1.9 12% | 1.9 12% | 2.2 29% | 1.5 -12% | 1.807 ? 6% |
För
Emot
Läs den fullständiga versionen av den här recensionen på engelska här.
Lenovo har lämnat Yoga-seriens populära riktning bakom sig i och med släppet av Yoga S730-13IWL; åtminstone i Europa och Asien, då de fortfarande säljer enheten som IdeaPad 730s-13IWL i Kanada och USA. Lenovo har försökt att bjuda under Dell XPS 13 med IdeaPad 710s-13ISK och IdeaPad 720s-13IKB, men konceptet börjar kännas lite tunt med S730-13IWL.
Lenovo har gjort för många kompromisser med Yoga S730-13IWL, vilket får den att hamna en aning bakom de bästa kompakta ultrabook-modellerna, vilka Lenovo desperat försöker att överträffa.
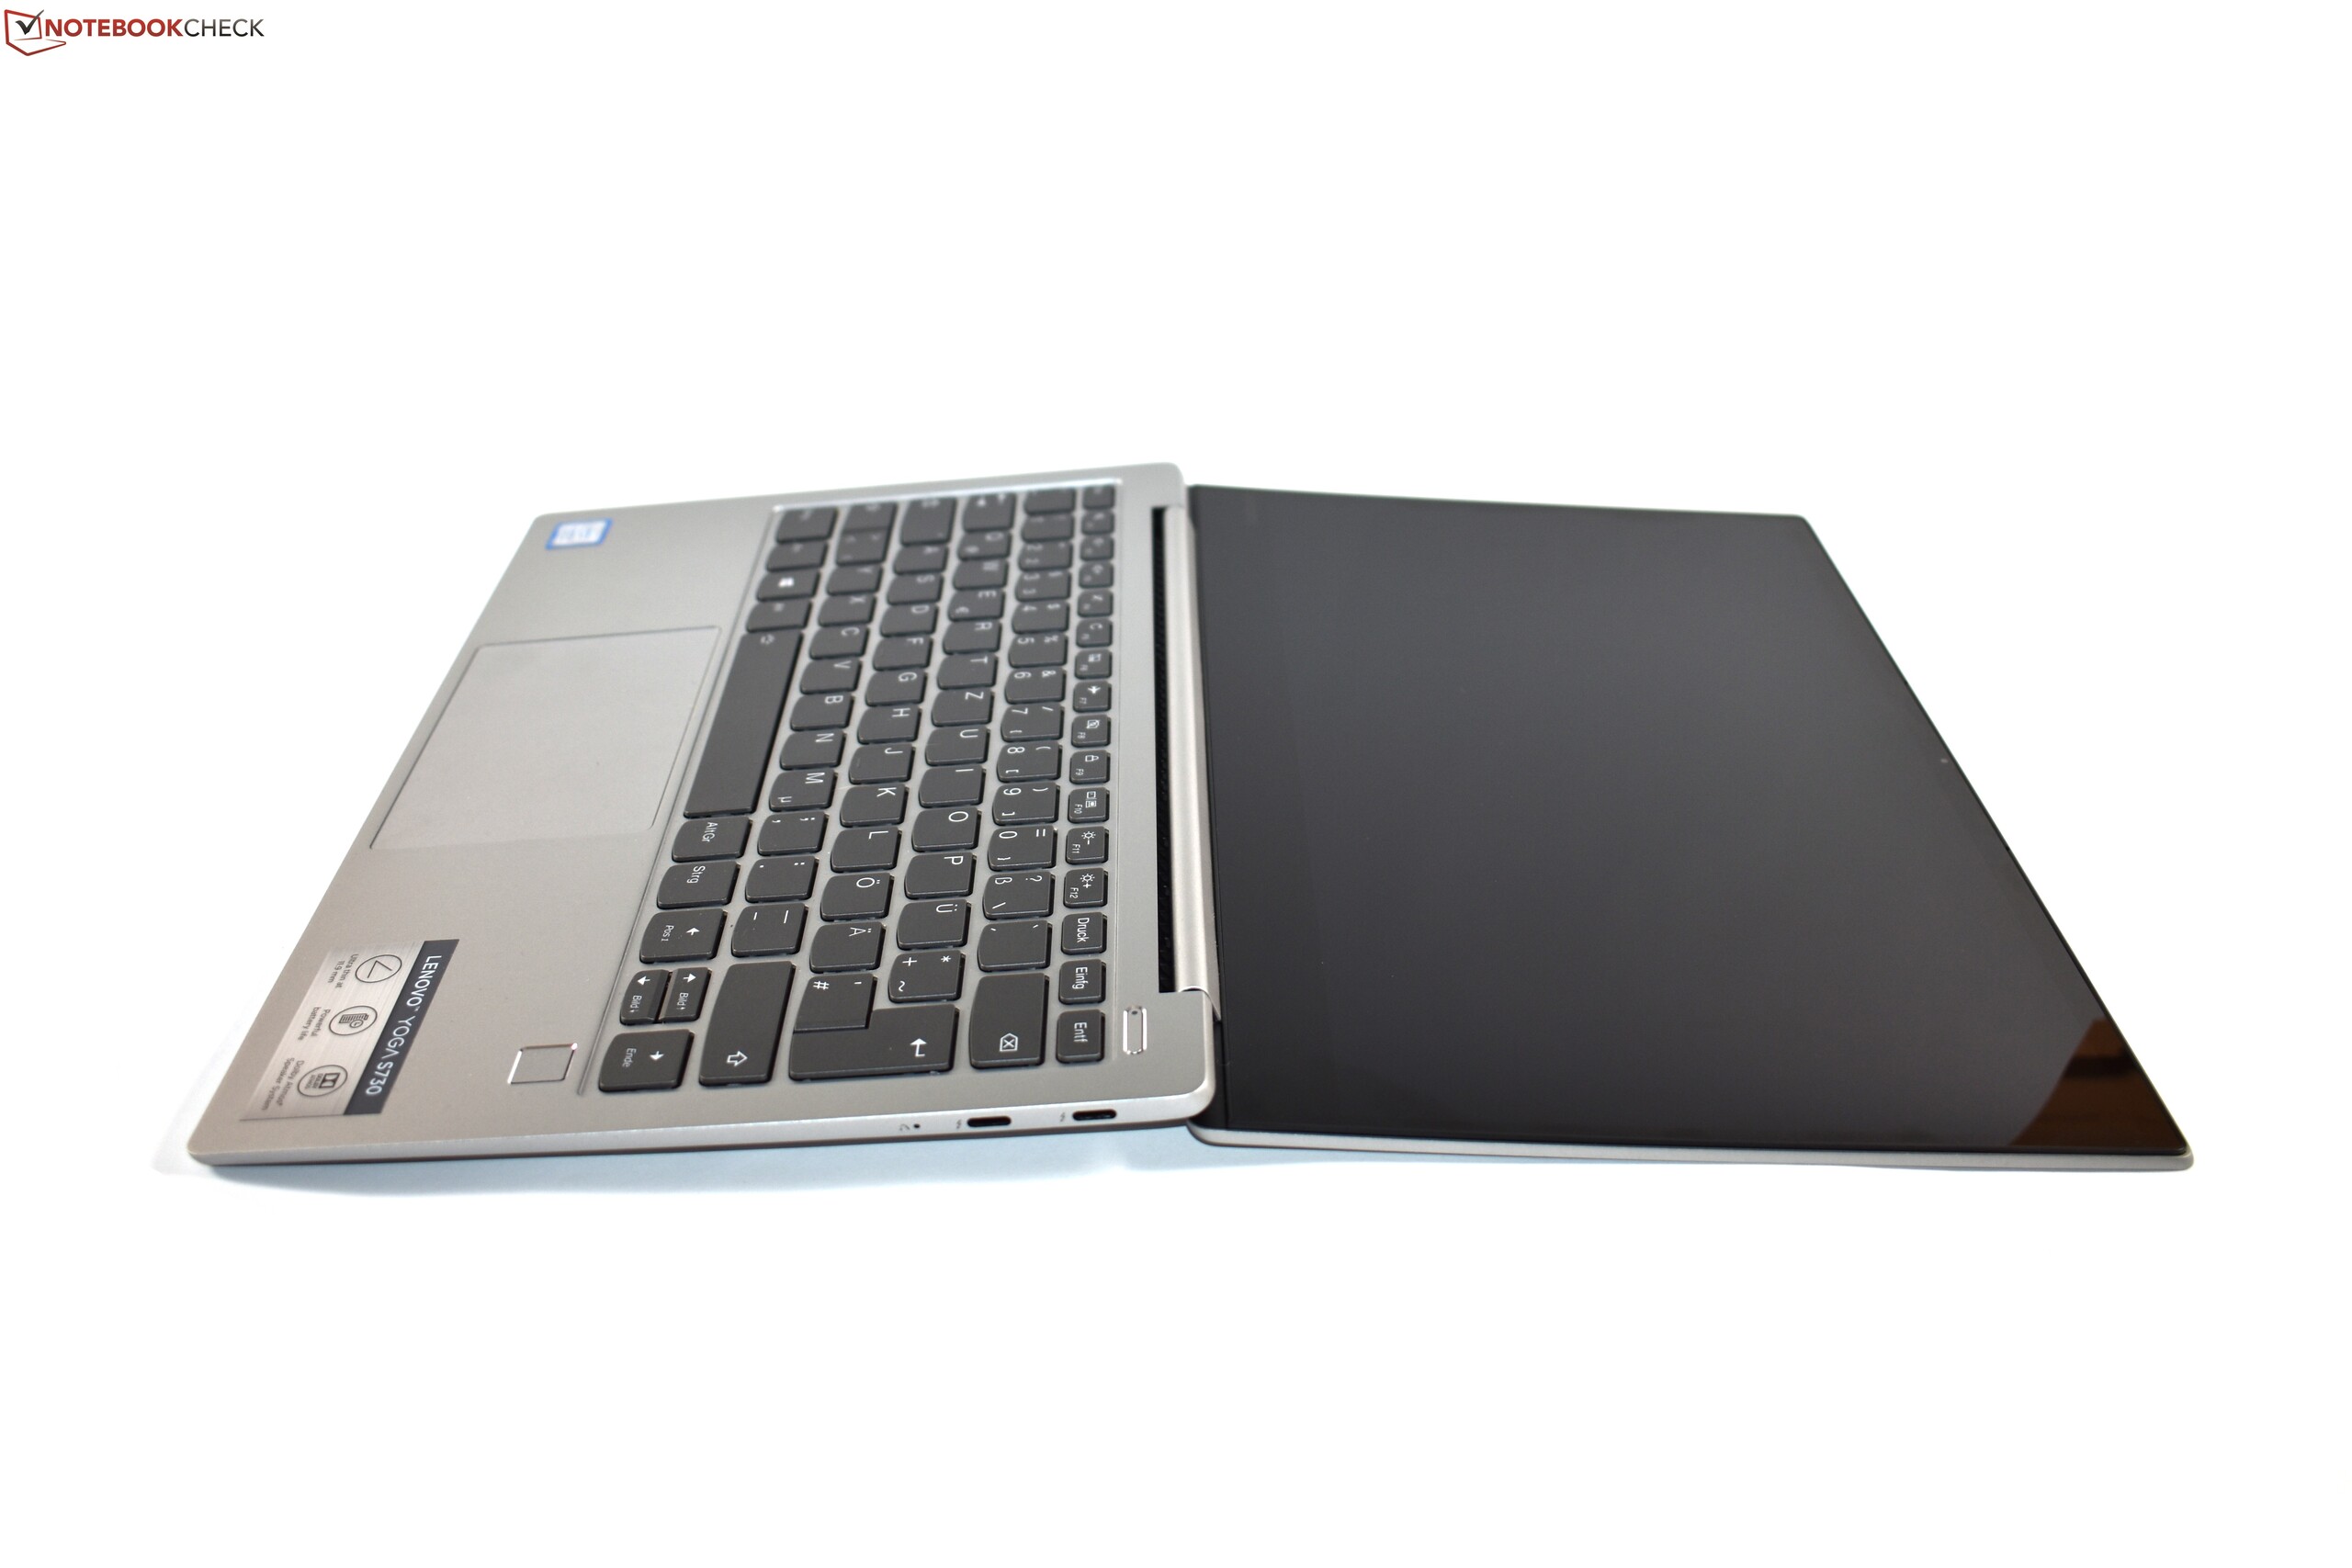
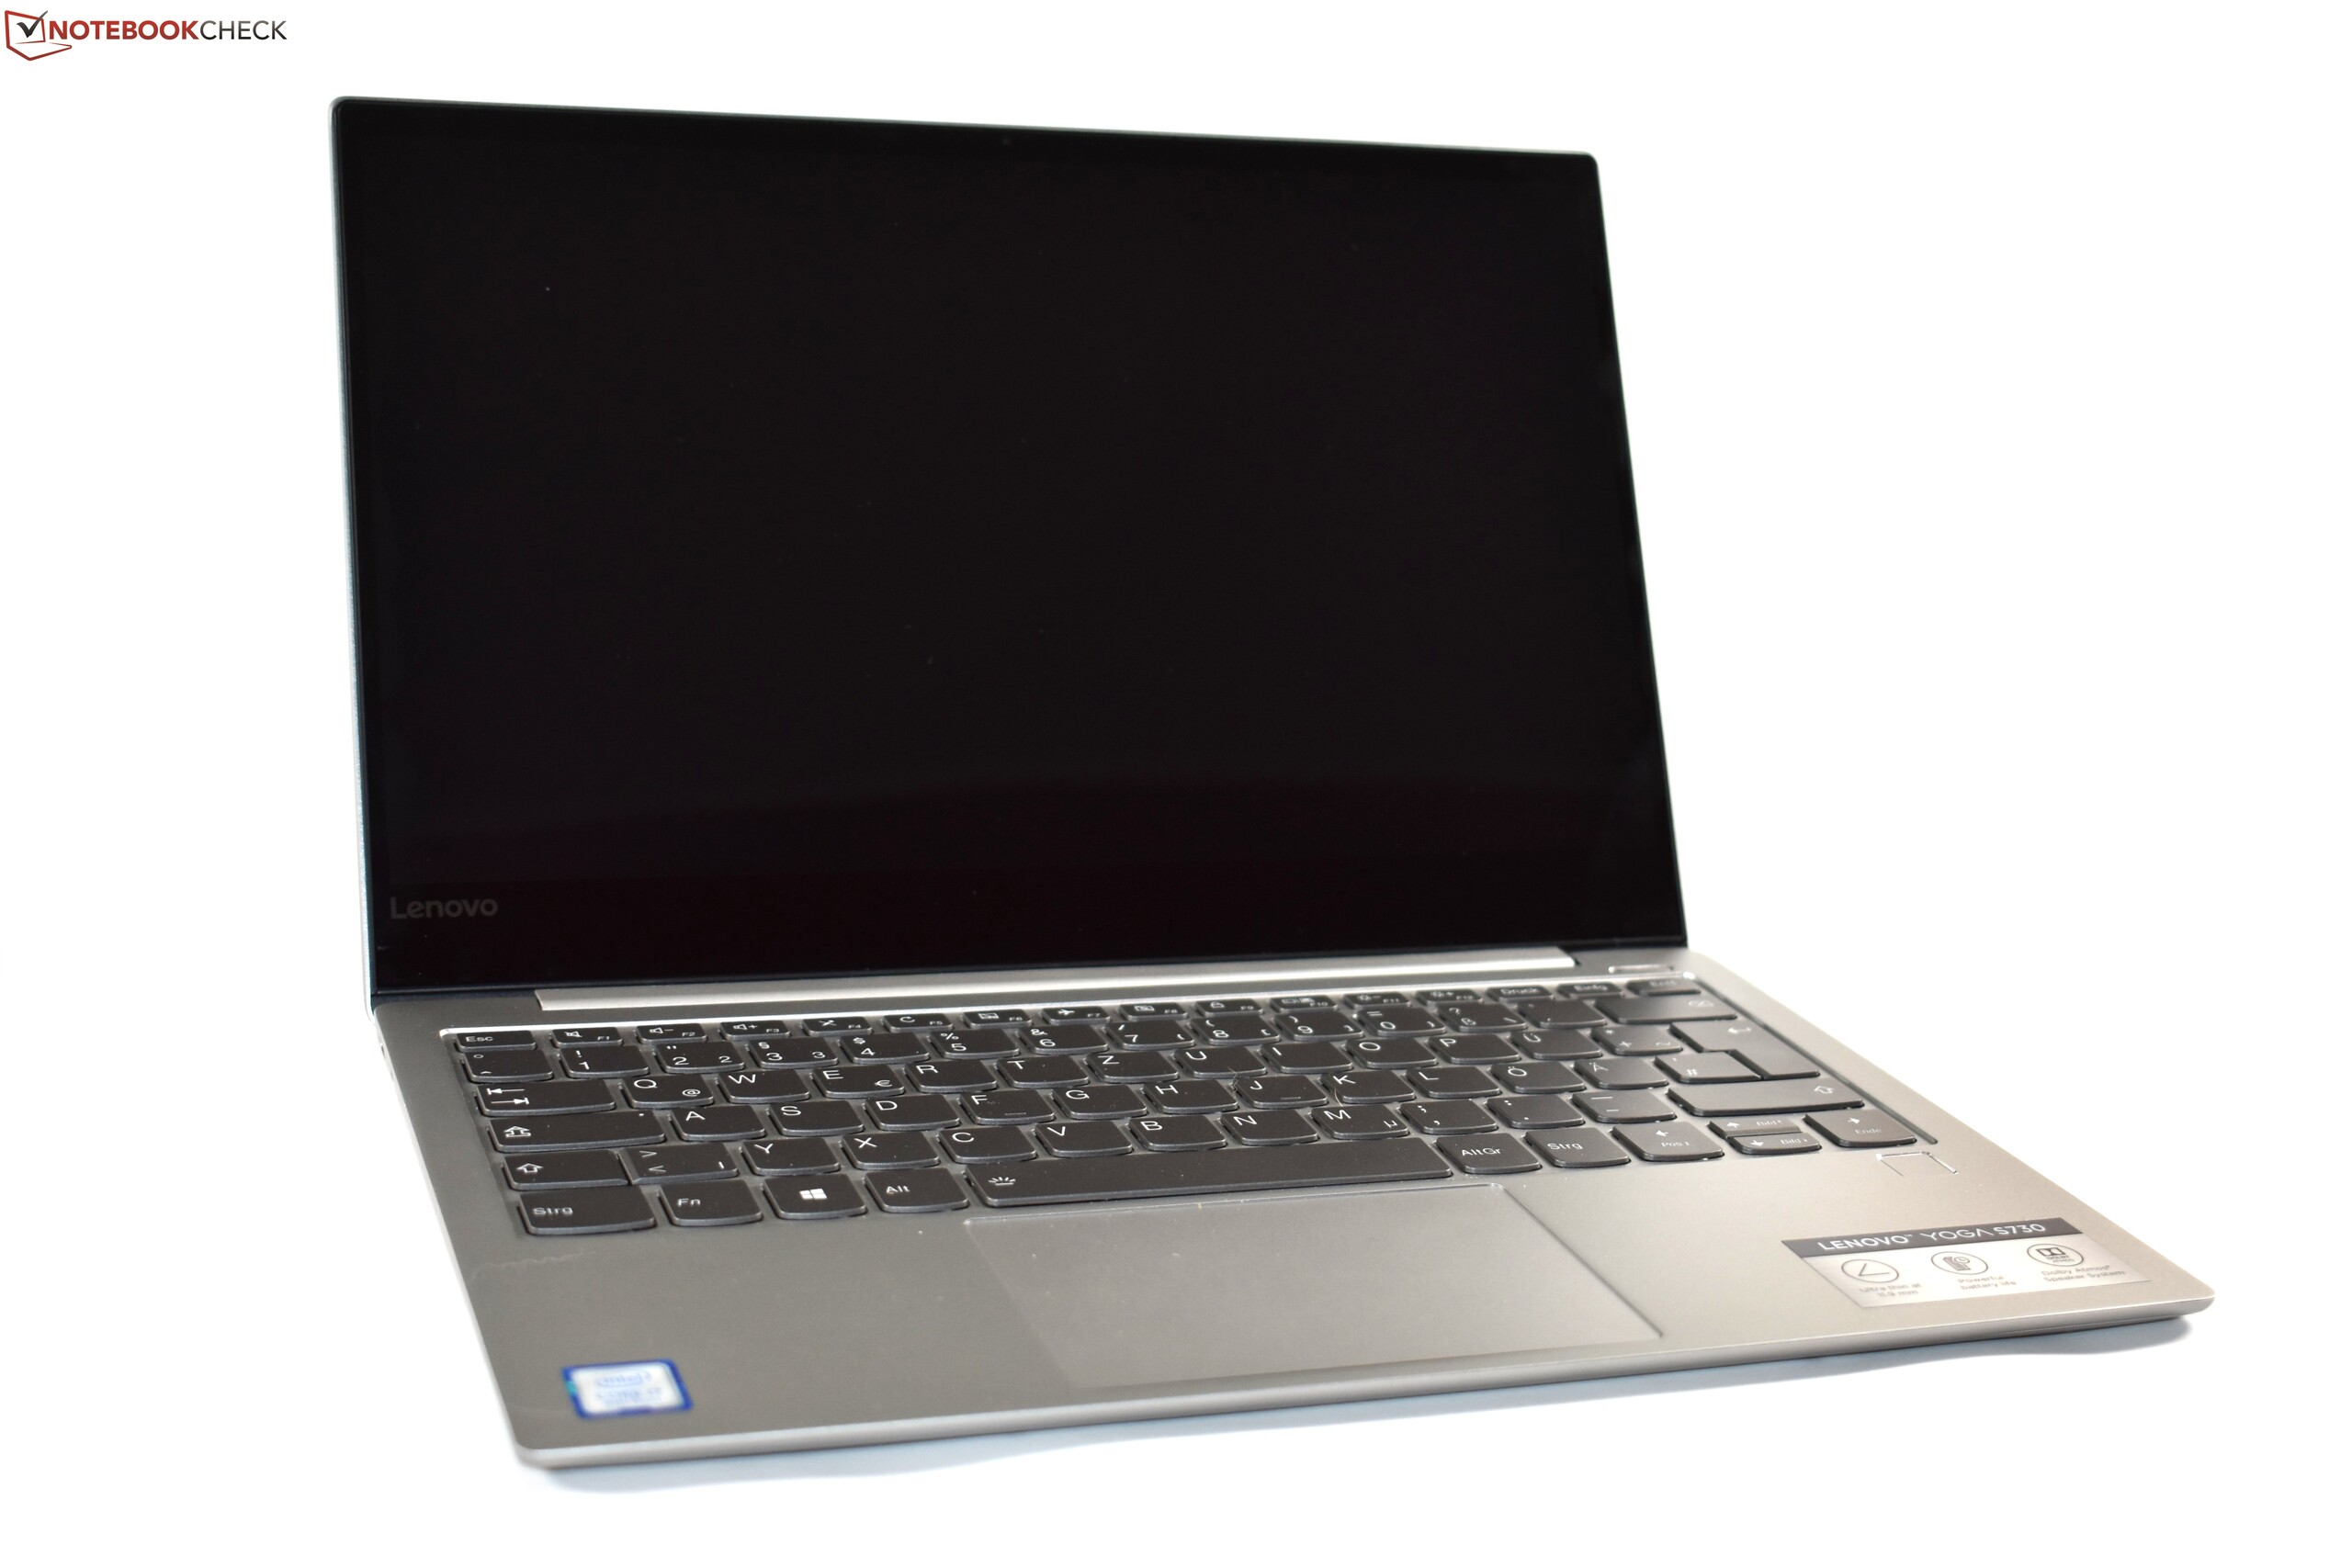
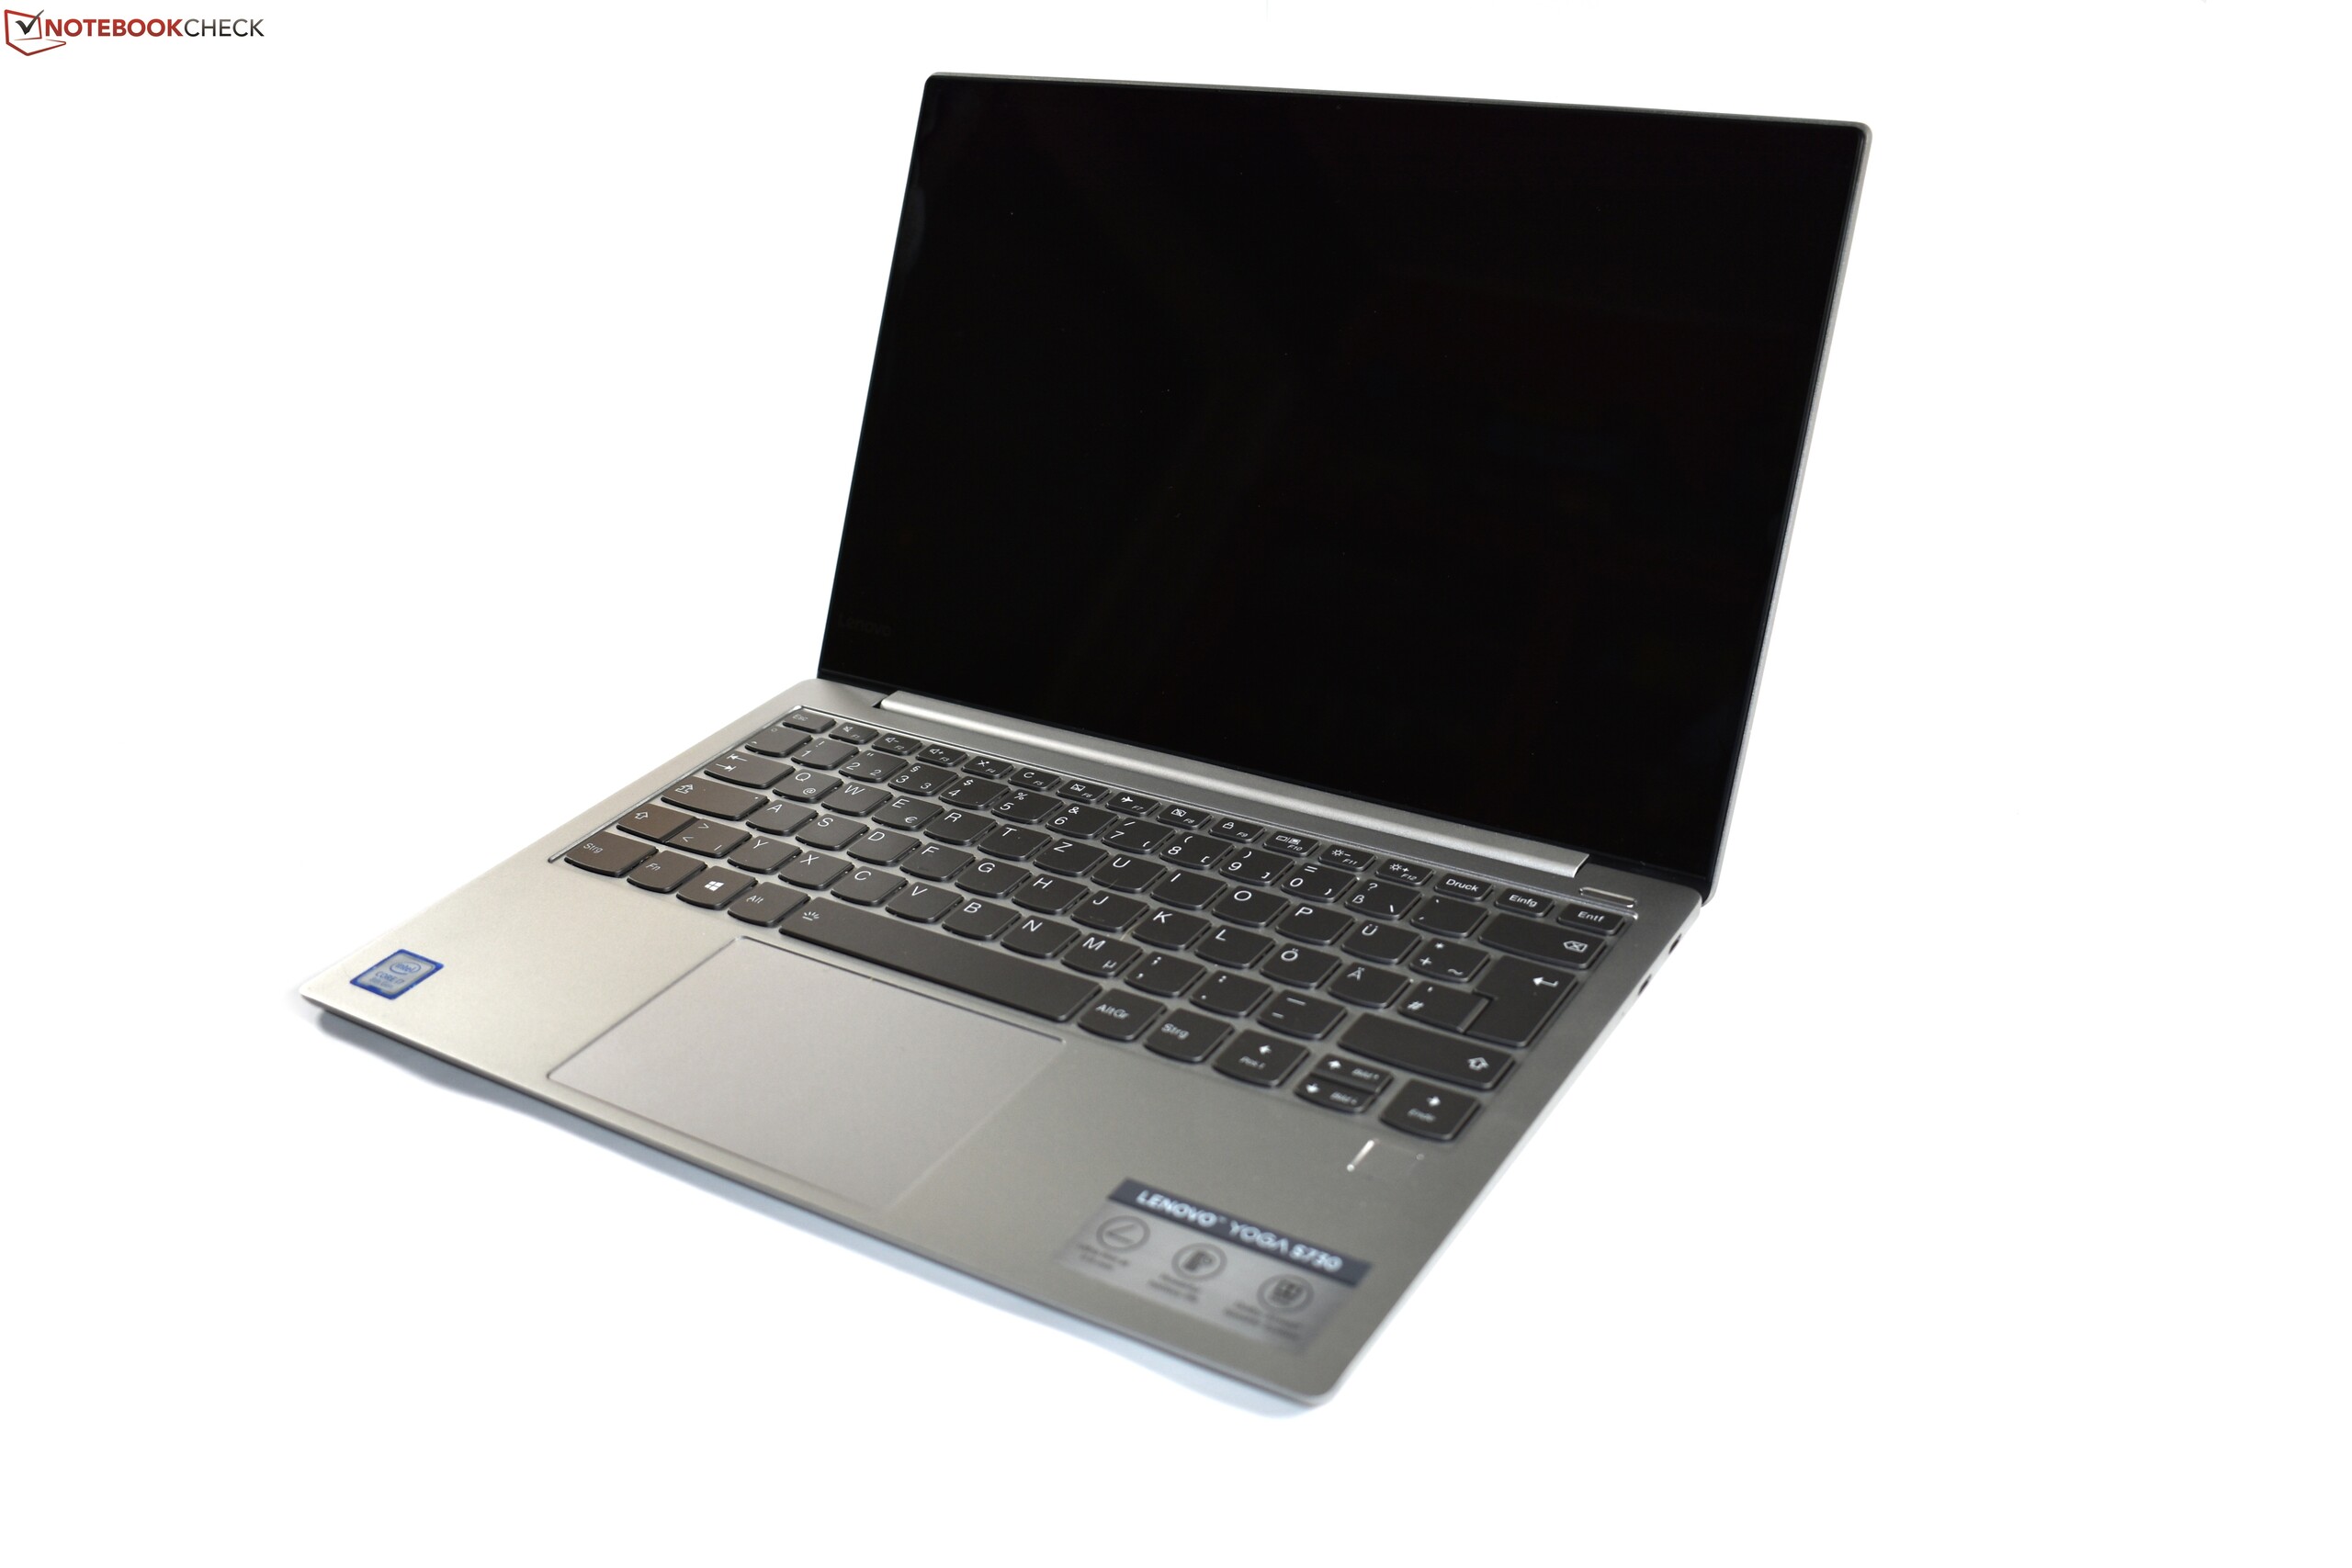
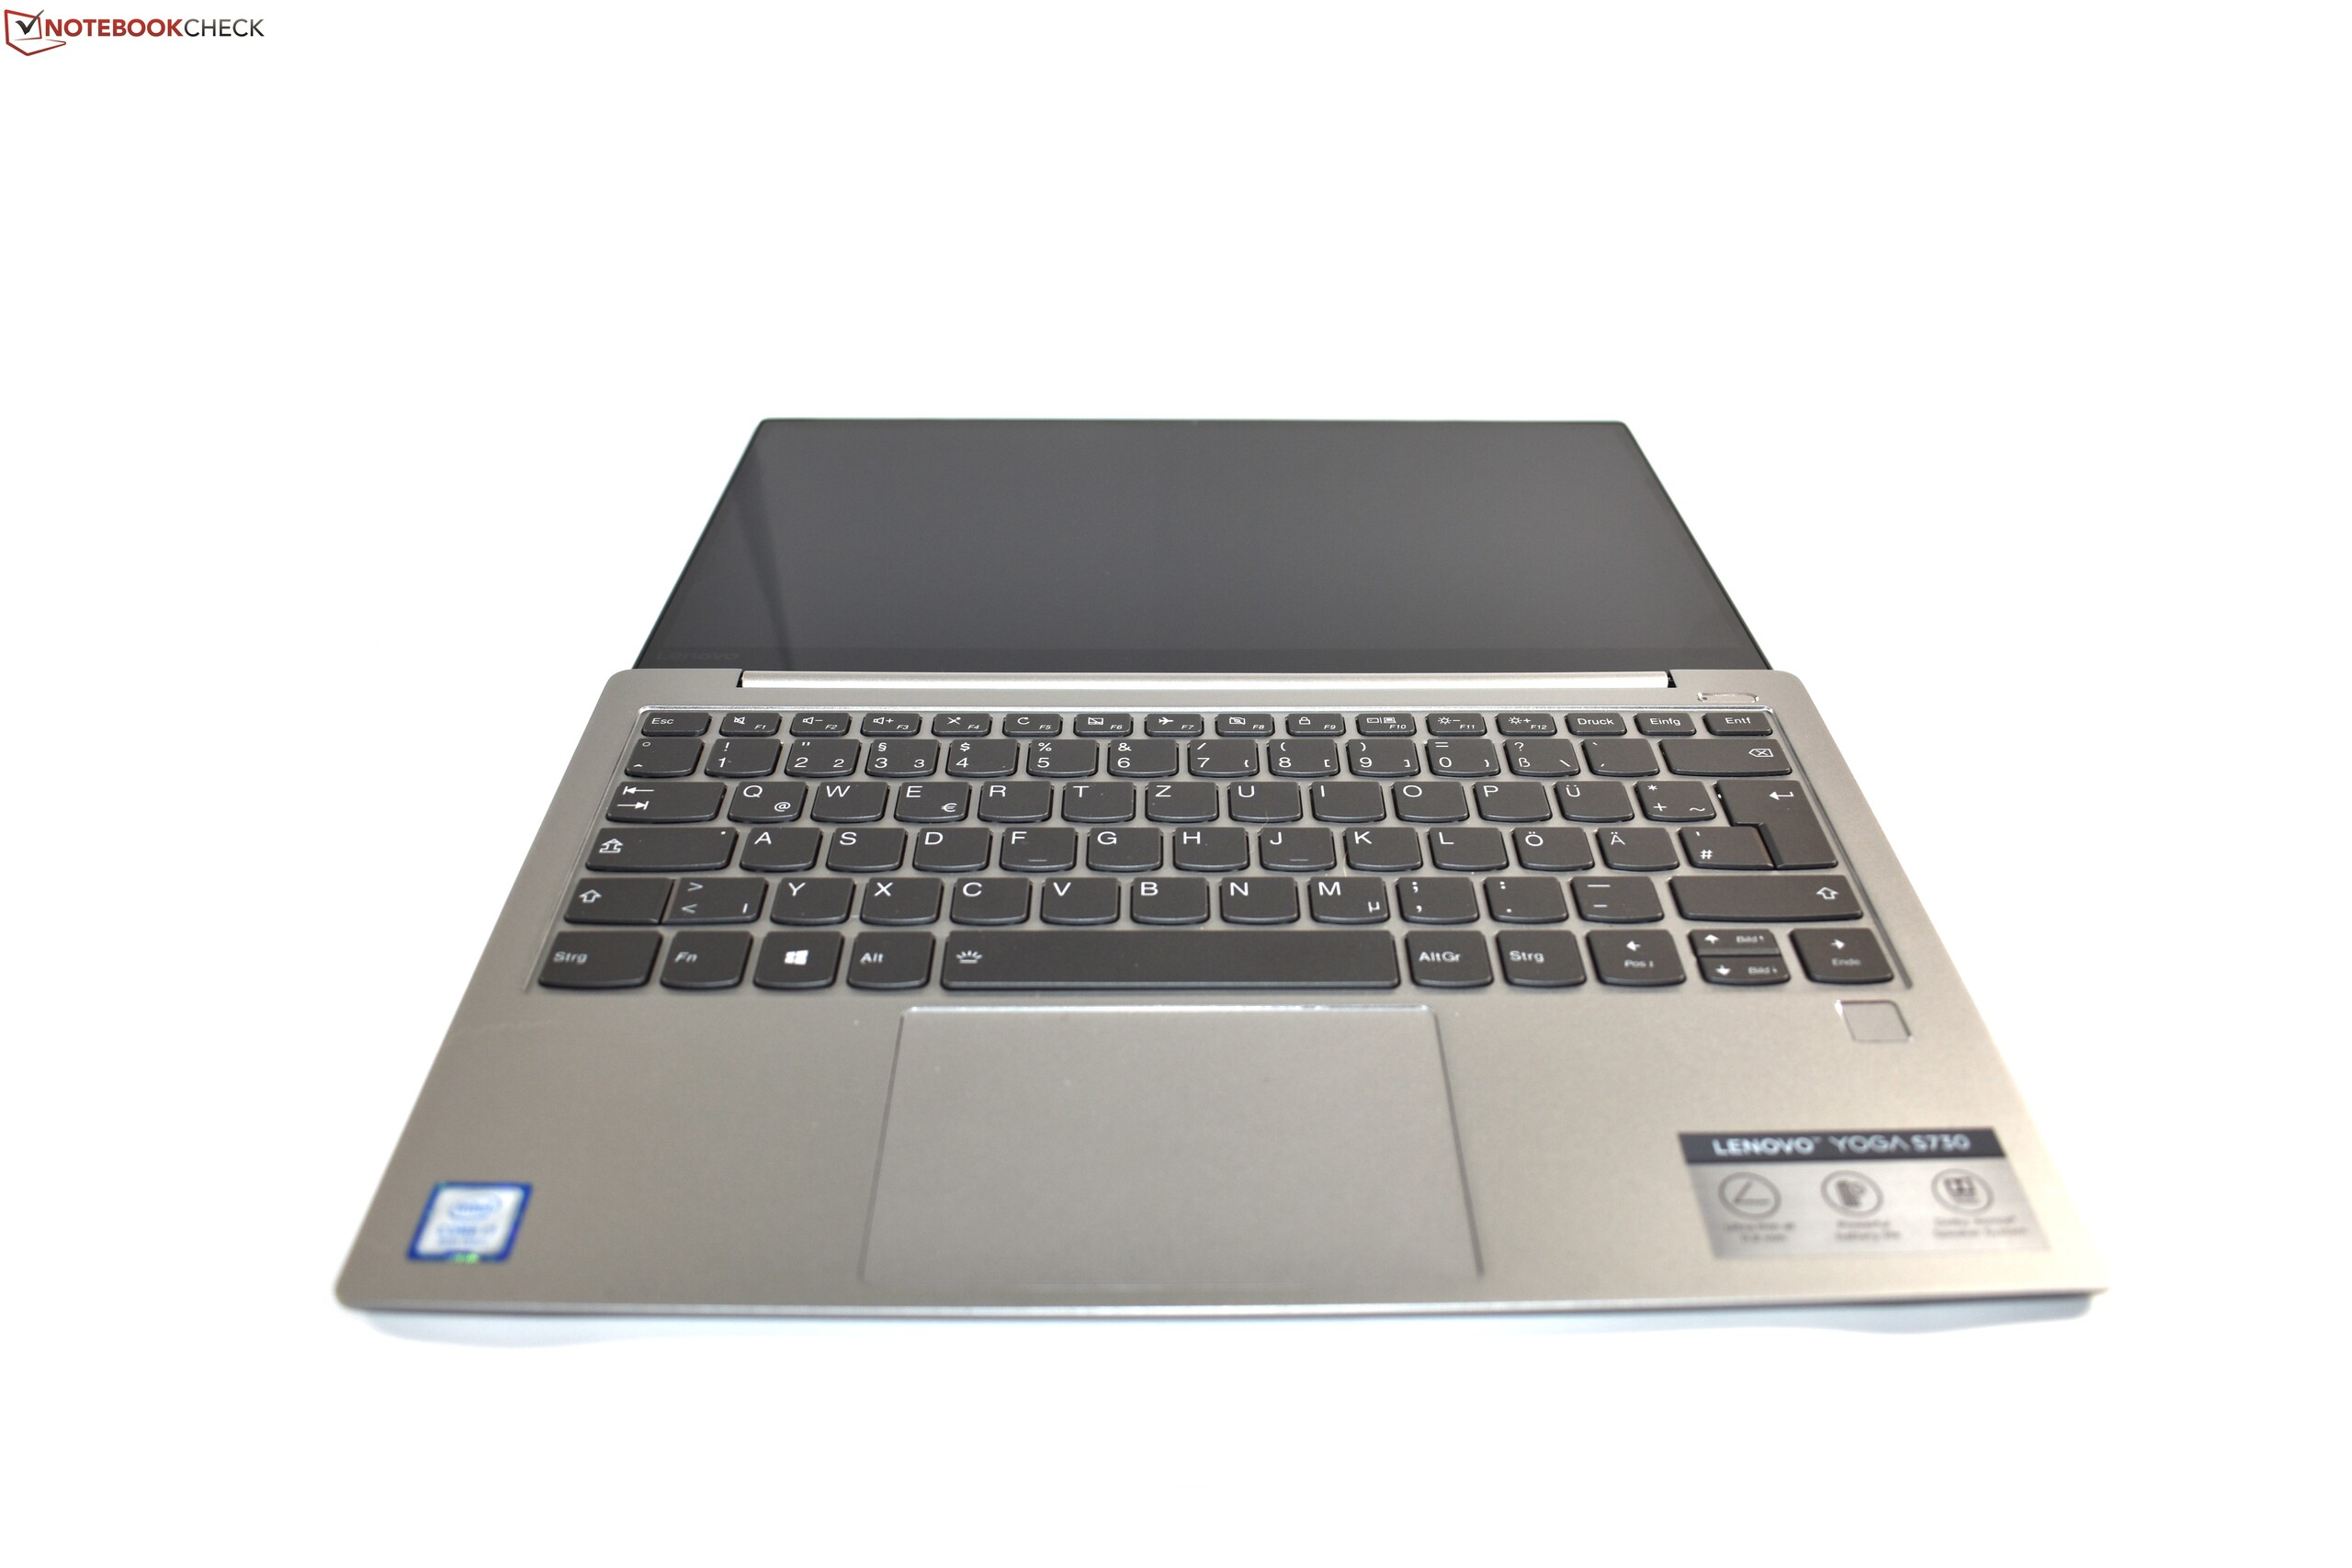
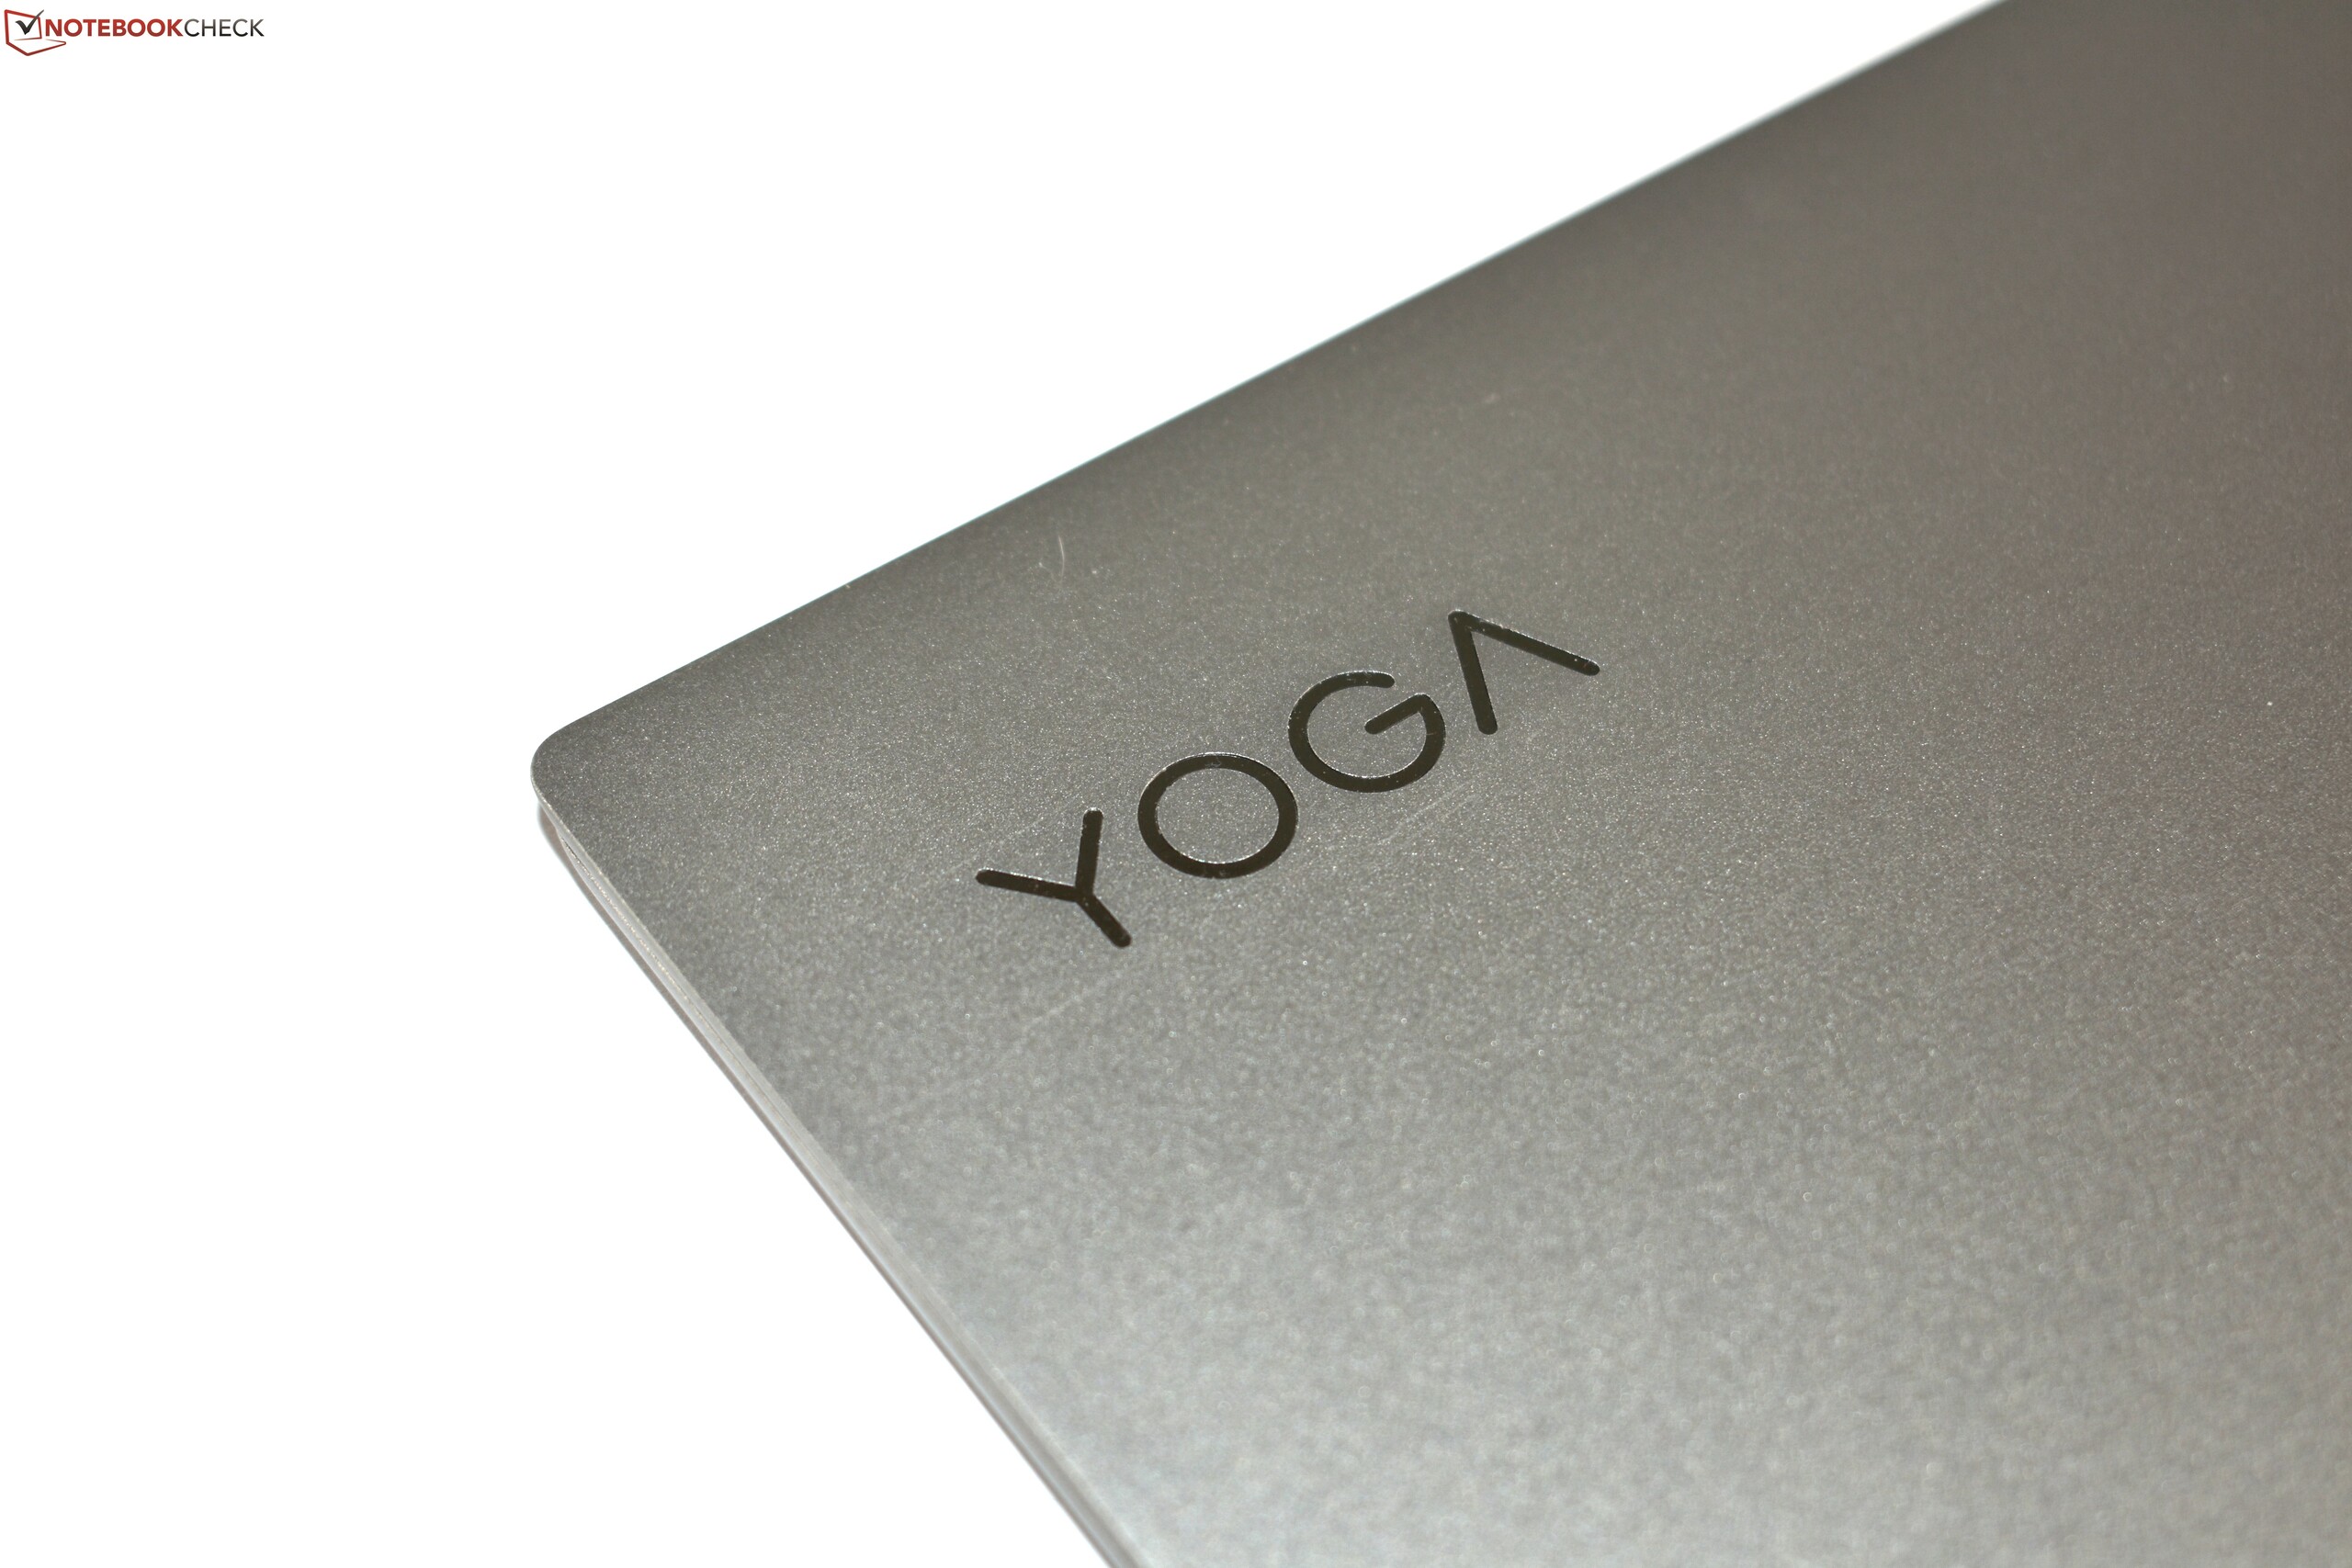
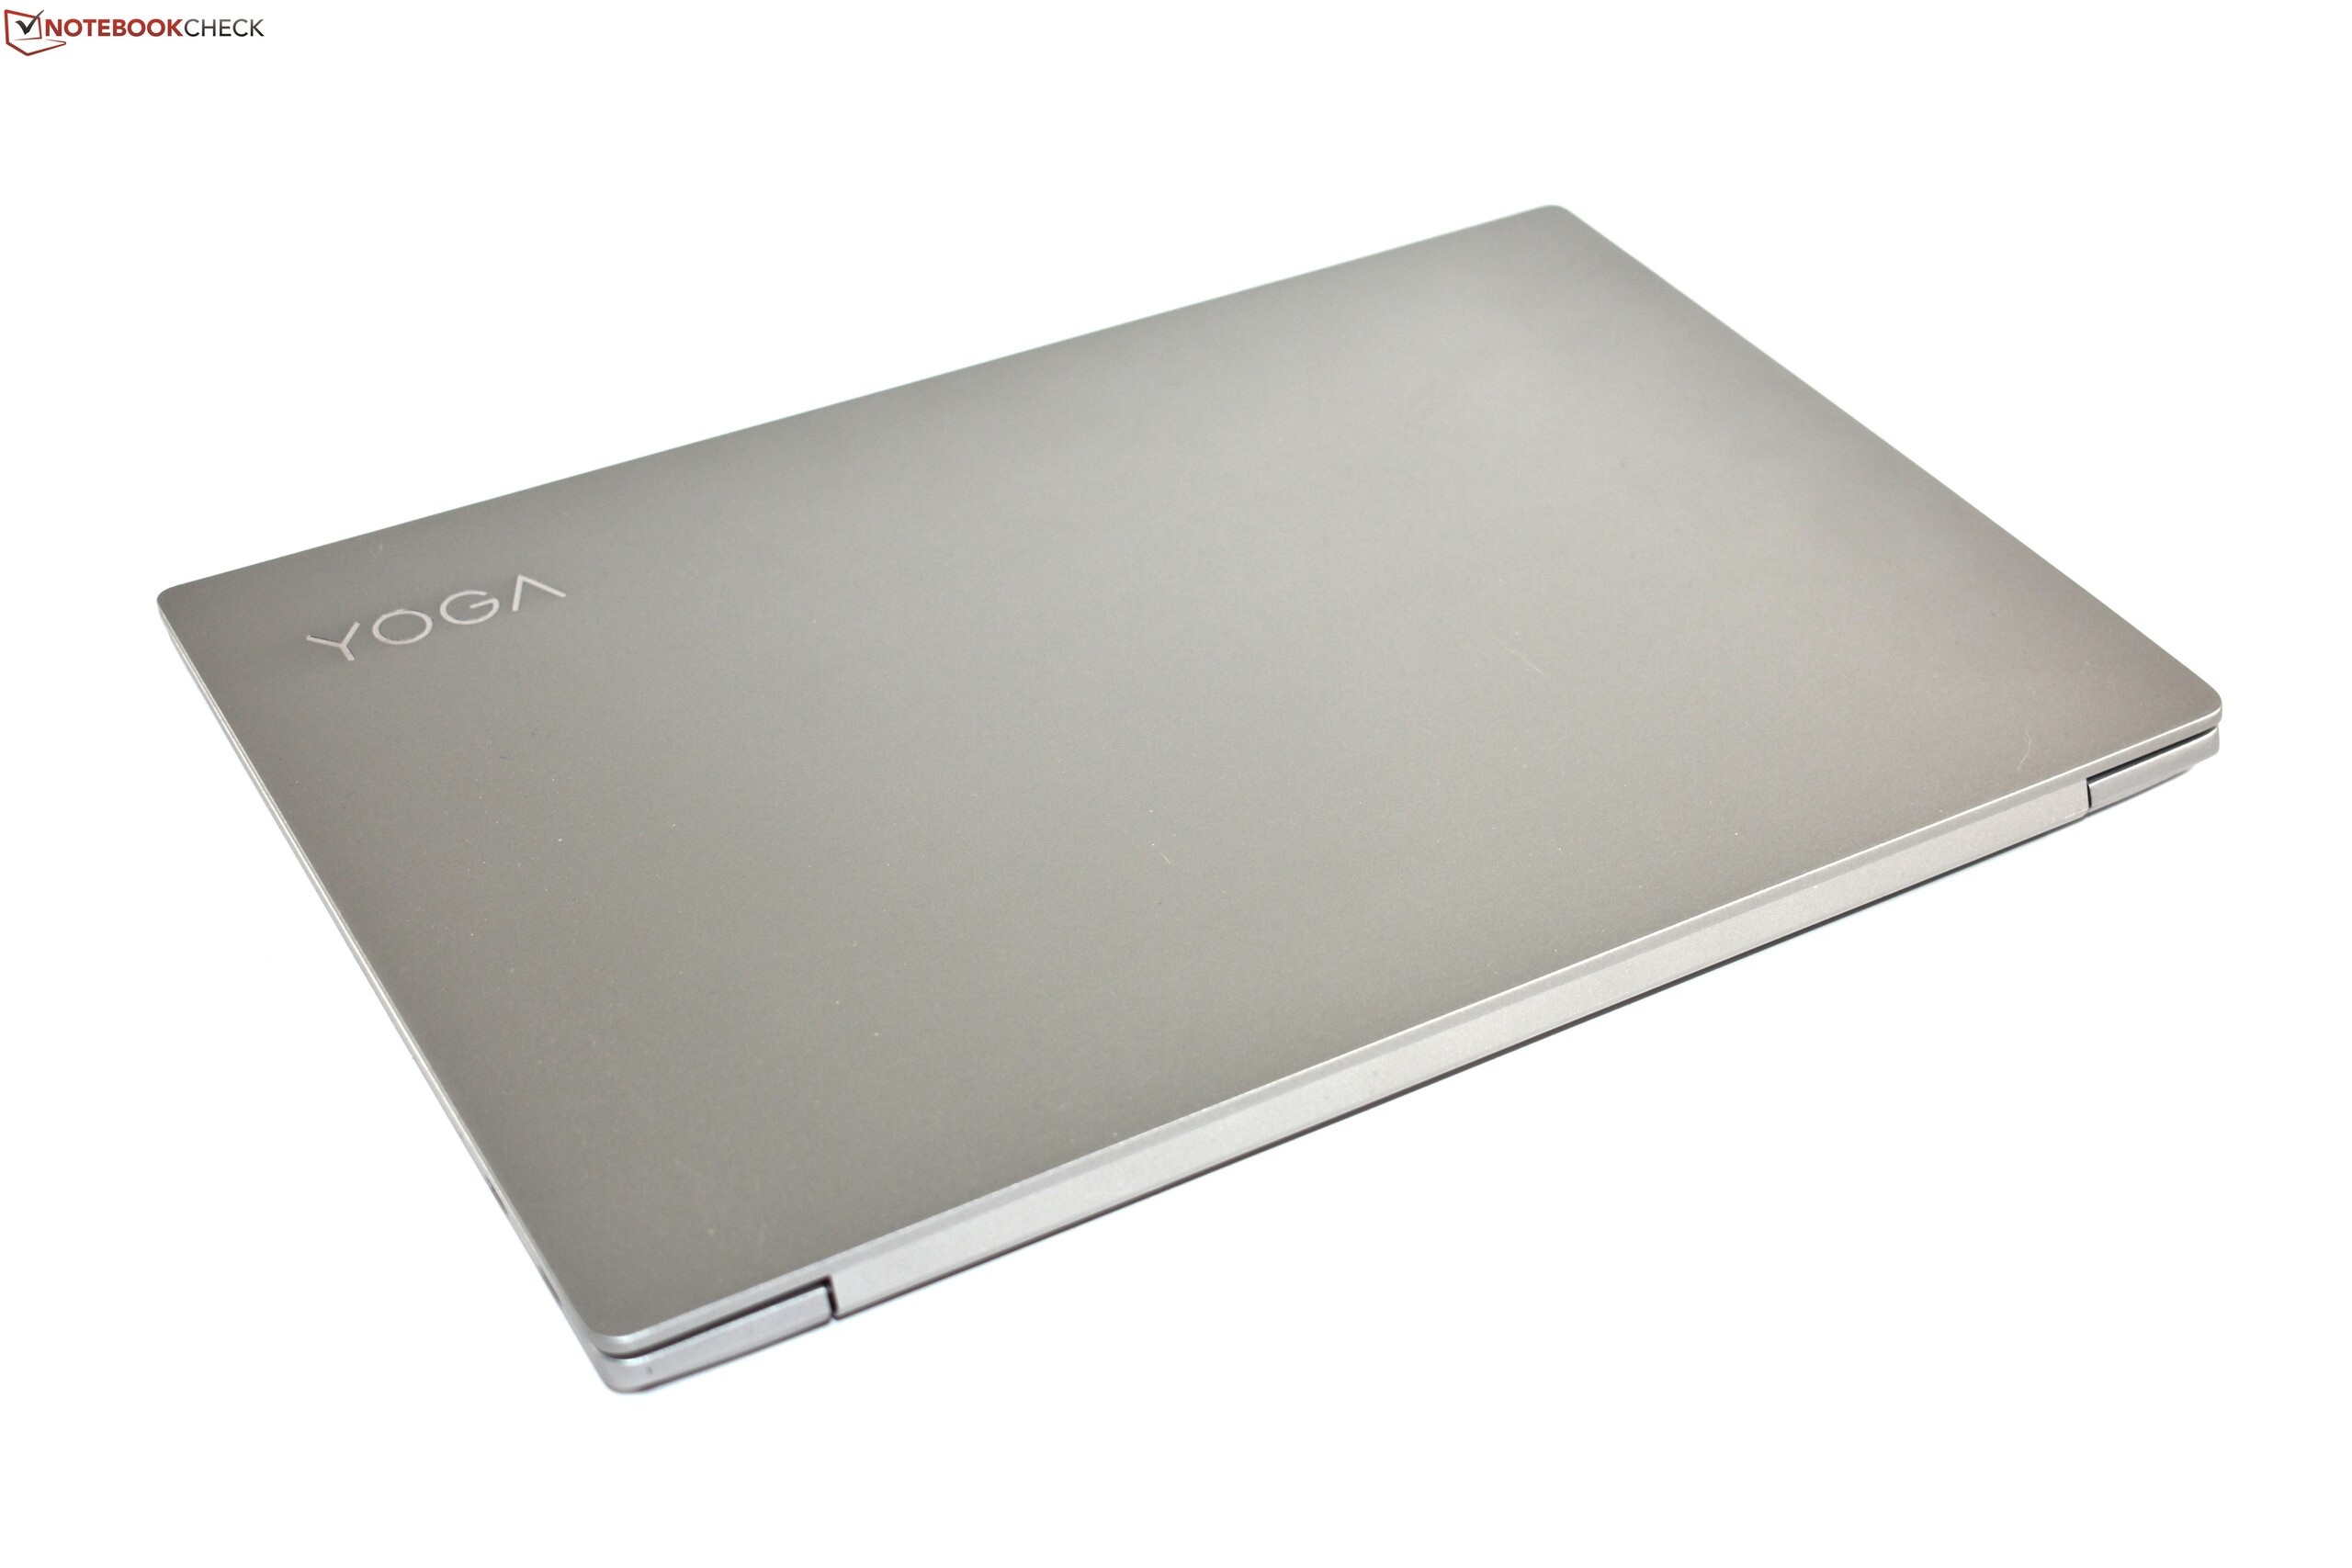
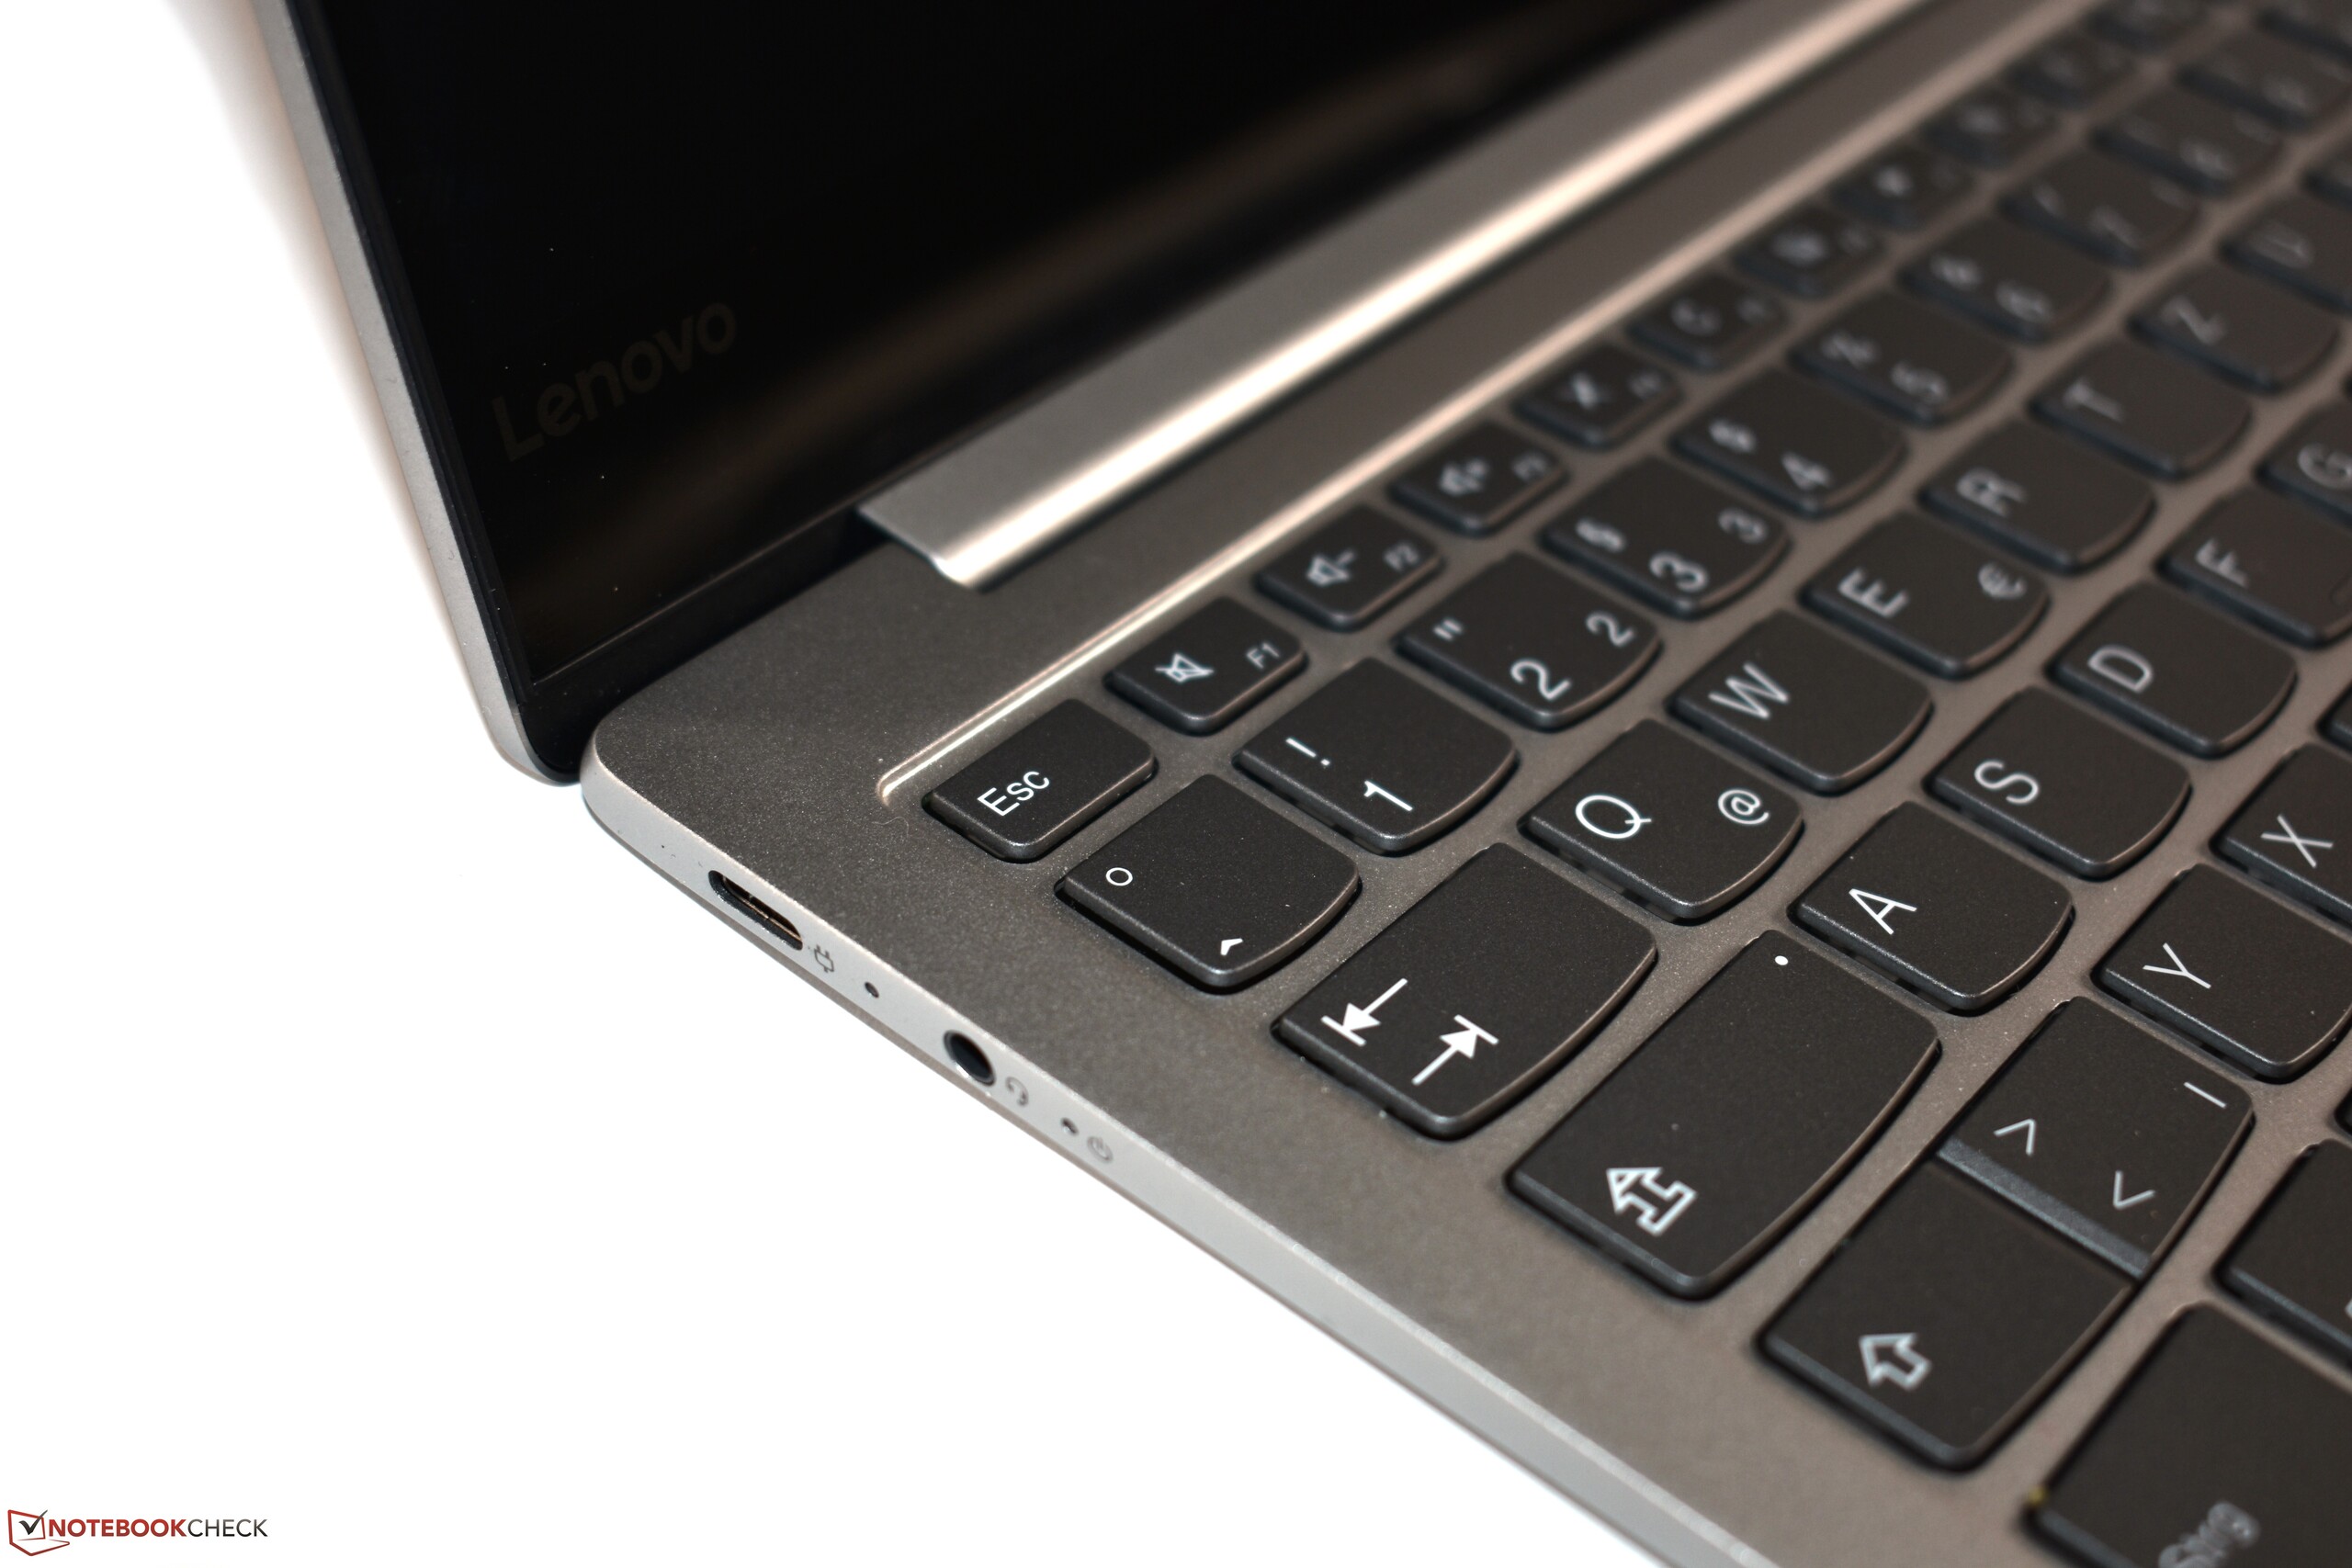
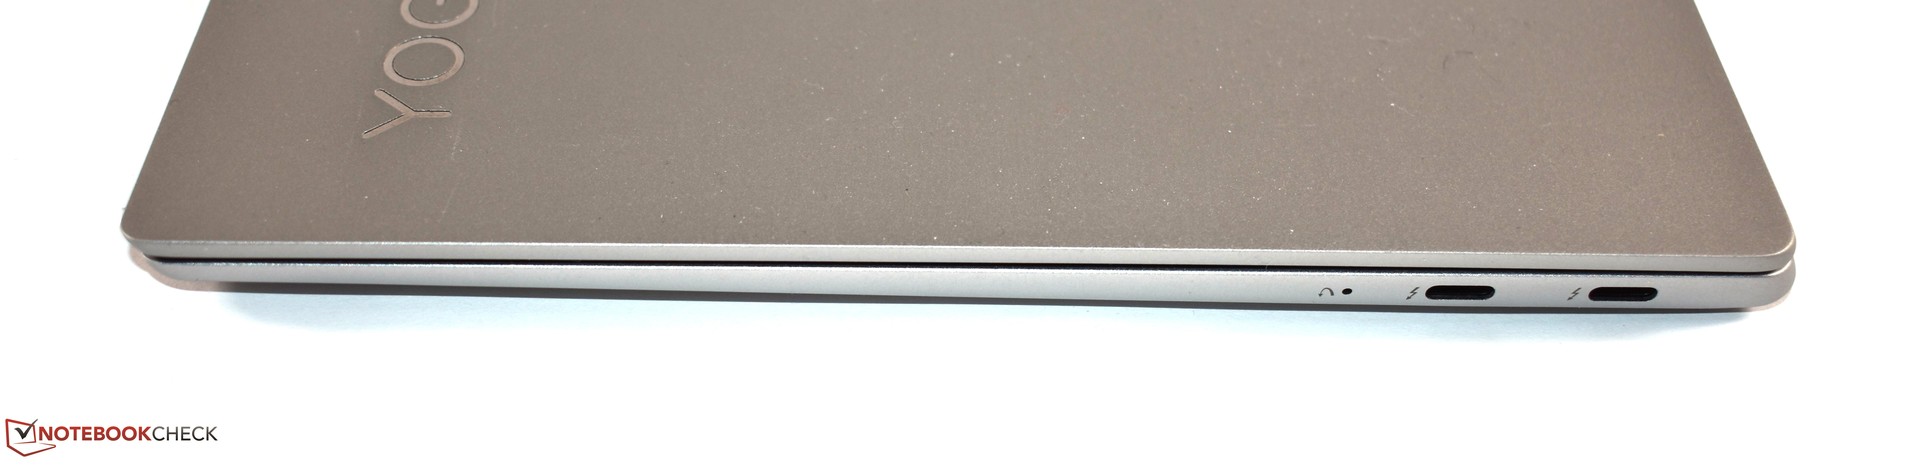
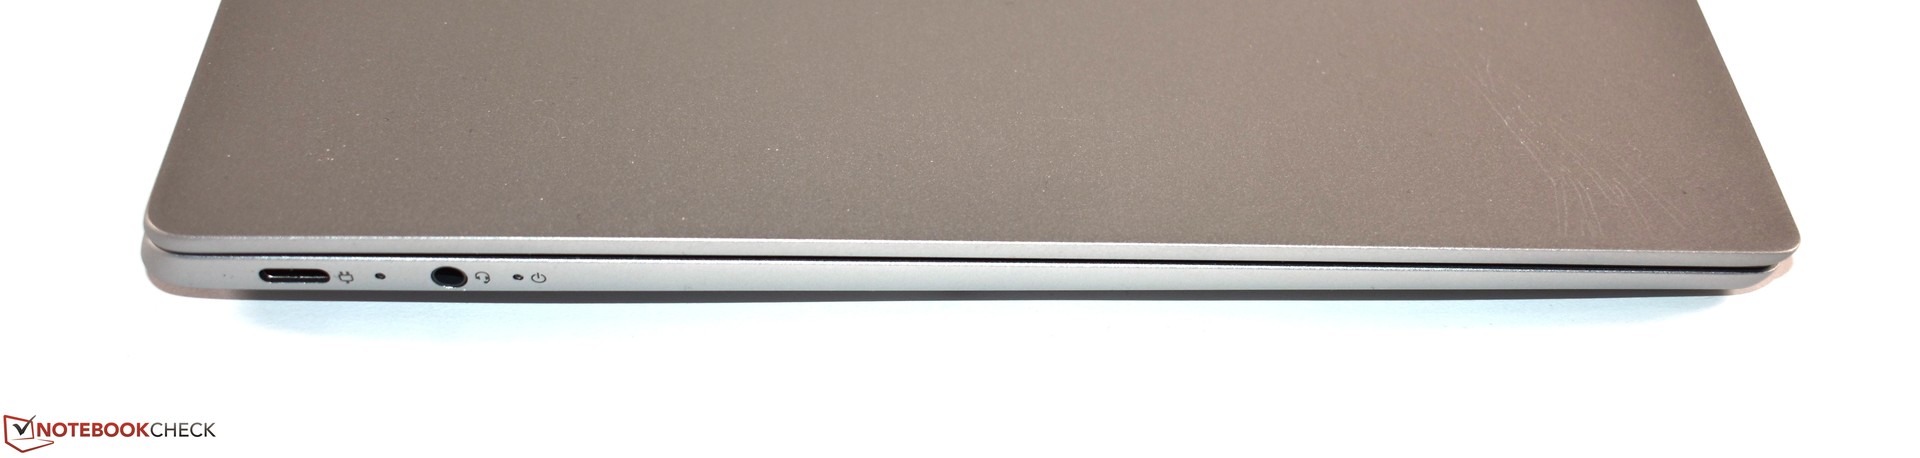
En del ändringar är dock välkomna, som det lyxiga höljet av aluminium, som är bekvämt att hålla i tack vare att det är några millimeter tunnare. Vidare ger vi Lenovo en applåd för att de inkluderat tre USB Typ C-portar och för att de gjort två av dem till Thunderbolt 3. Att ha USB Typ C-portar på enhetens båda sidor gör att den går att ladda från båda hållen, vilket i sin natur är mycket mer flexibelt än att behöva välja en sida.
Skärmen är också mycket bättre med hög färgrymdstäckning. Den använder heller inte PWM. Tangentbordet känns dessutom bra att slå an på även om det inte är på ThinkPad-nivå. Vi gillade också styrplattan i glas, och att datorn innehåller en Samsung PM981 SSD är lovvärt då den modellen håller flaggan högst bland aktuella NVMe-enheter. Slutligen är 180°-gångjärnet användbart, vilket är en funktion som vi är vanare vid att se på företagsmodeller än på konsumentmodeller.
Tyvärr finns det några nackdelar som i huvudsak kommer av den tunna höljet. Batteriet är jämförelsevis litet och batteritiden gjorde oss besvikna. På samma sätt kan avsaknaden av USB Typ A frustrera en del användare, precis som bristen på ett alternativ för dedikerad GPU. Vidare har Lenovo bara utrustat enheten med en fläkt, vilket resulterar i att processorn stryps kraftigt på grund av värmen. Vi hade uppskattat alternativ för en matt skärm eller en 4K-skärm då den blanka ytan drar åt sig fingeravtryck och reflektioner. Slutligen är WiFi-kortet ett svagt val för en dyr laptop och spoltjutet kan med tiden bli irriterande.
Lenovo Yoga S730-13IWL är totalt sett en skaplig laptop, men vi kan inte rekommendera den framför dess konkurrenter. På de flesta sätt är den en gedigen ultrabook, men enheter som Dell XPS 13 9370 är mer kompletta som allt-i-allo samtidigt som andra konkurrenter som HP Envy 13 har alternativ för 4K-skärm och dedikerade grafikkort. För att sammanfatta så rekommenderar vi att du överväger de bästa av våra jämförelseenheter innan du överväger att köpa Lenovo Yoga S730-13IWL.
Lenovo Yoga S730-13IWL
- 12/22/2018 v6 (old)
Benjamin Herzig