Test: Schenker XMG Core 17 (Core i7-9750H, GeForce GTX 1660 Ti, 144 Hz-skärm) Tongfang GK7CP6R (Sammanfattning)


| SD Card Reader | |
| average JPG Copy Test (av. of 3 runs) | |
| Genomsnitt av klass Gaming (20.9 - 210, n=54, senaste 2 åren) | |
| Schenker XMG Core 15 (Toshiba Exceria Pro SDXC 64 GB UHS-II) | |
| Schenker XMG Neo 17 (Toshiba Exceria Pro SDXC 64 GB UHS-II) | |
| Gigabyte Sabre 17-W8 (Toshiba Exceria Pro SDXC 64 GB UHS-II) | |
| Dell G7 17 7790 (Toshiba Exceria Pro SDXC 64 GB UHS-II) | |
| MSI GP75 Leopard 9SD (Toshiba Exceria Pro SDXC 64 GB UHS-II) | |
| Schenker XMG Core 17 (Toshiba Exceria Pro SDXC 64 GB UHS-II) | |
| maximum AS SSD Seq Read Test (1GB) | |
| Genomsnitt av klass Gaming (25.5 - 261, n=51, senaste 2 åren) | |
| Schenker XMG Neo 17 (Toshiba Exceria Pro SDXC 64 GB UHS-II) | |
| Schenker XMG Core 15 (Toshiba Exceria Pro SDXC 64 GB UHS-II) | |
| Gigabyte Sabre 17-W8 (Toshiba Exceria Pro SDXC 64 GB UHS-II) | |
| Dell G7 17 7790 (Toshiba Exceria Pro SDXC 64 GB UHS-II) | |
| MSI GP75 Leopard 9SD (Toshiba Exceria Pro SDXC 64 GB UHS-II) | |
| Schenker XMG Core 17 (Toshiba Exceria Pro SDXC 64 GB UHS-II) | |
| Networking | |
| iperf3 transmit AX12 | |
| Dell G7 17 7790 | |
| MSI GP75 Leopard 9SD | |
| Schenker XMG Neo 17 | |
| Schenker XMG Core 17 | |
| Lenovo Legion Y730-17ICH, i7-8750H | |
| Schenker XMG Core 15 | |
| Gigabyte Sabre 17-W8 | |
| iperf3 receive AX12 | |
| MSI GP75 Leopard 9SD | |
| Schenker XMG Core 17 | |
| Schenker XMG Core 15 | |
| Schenker XMG Neo 17 | |
| Dell G7 17 7790 | |
| Lenovo Legion Y730-17ICH, i7-8750H | |
| Gigabyte Sabre 17-W8 | |

| |||||||||||||||||||||||||
Distribution av ljusstyrkan: 79 %
Mitt på batteriet: 329 cd/m²
Kontrast: 1097:1 (Svärta: 0.3 cd/m²)
ΔE ColorChecker Calman: 2.52 | ∀{0.5-29.43 Ø4.73}
calibrated: 1.31
ΔE Greyscale Calman: 2.98 | ∀{0.09-98 Ø4.97}
95% sRGB (Argyll 1.6.3 3D)
60% AdobeRGB 1998 (Argyll 1.6.3 3D)
65.6% AdobeRGB 1998 (Argyll 3D)
95.6% sRGB (Argyll 3D)
64.4% Display P3 (Argyll 3D)
Gamma: 2.38
CCT: 6738 K
| Schenker XMG Core 17 LG Philips LP173WFG-SPB1 (LGD0615), IPS, 1920x1080 | Schenker XMG Neo 17 BOEhydis NV173FHM-N44 (BOE07B6), IPS, 1920x1080 | Dell G7 17 7790 AU Optronics AUO409D, B173HAN, IPS, 1920x1080 | MSI GP75 Leopard 9SD Chi Mei N173HCE-G33 (CMN175C), IPS, 1920x1080 | Gigabyte Sabre 17-W8 Chi Mei CMN1747, TN, 1920x1080 | Lenovo Legion Y730-17ICH, i7-8750H LP173WF4-SPF6, IPS, 1920x1080 | |
|---|---|---|---|---|---|---|
| Display | -1% | -5% | -1% | 25% | -4% | |
| Display P3 Coverage (%) | 64.4 | 65.2 1% | 61.9 -4% | 63.4 -2% | 89.9 40% | 66.4 3% |
| sRGB Coverage (%) | 95.6 | 92.2 -4% | 89.6 -6% | 94.9 -1% | 100 5% | 84.9 -11% |
| AdobeRGB 1998 Coverage (%) | 65.6 | 66.5 1% | 63.2 -4% | 65.1 -1% | 85.1 30% | 62.1 -5% |
| Response Times | -28% | -22% | 26% | 27% | -153% | |
| Response Time Grey 50% / Grey 80% * (ms) | 14.4 ? | 18.8 ? -31% | 17.2 ? -19% | 8 ? 44% | 9 ? 37% | 36.8 ? -156% |
| Response Time Black / White * (ms) | 9.6 ? | 12 ? -25% | 12 ? -25% | 8.8 ? 8% | 8 ? 17% | 24 ? -150% |
| PWM Frequency (Hz) | 971 ? | 25510 ? | 25000 ? | |||
| Screen | 2% | -24% | 6% | -62% | -46% | |
| Brightness middle (cd/m²) | 329 | 304 -8% | 308.6 -6% | 420 28% | 326 -1% | 328.7 0% |
| Brightness (cd/m²) | 286 | 289 1% | 299 5% | 393 37% | 309 8% | 318 11% |
| Brightness Distribution (%) | 79 | 90 14% | 92 16% | 91 15% | 82 4% | 91 15% |
| Black Level * (cd/m²) | 0.3 | 0.26 13% | 0.29 3% | 0.32 -7% | 0.27 10% | 0.51 -70% |
| Contrast (:1) | 1097 | 1169 7% | 1064 -3% | 1313 20% | 1207 10% | 645 -41% |
| Colorchecker dE 2000 * | 2.52 | 2.65 -5% | 4.26 -69% | 3.04 -21% | 9.11 -262% | 4.91 -95% |
| Colorchecker dE 2000 max. * | 6.9 | 6.11 11% | 7.83 -13% | 7.22 -5% | 14.14 -105% | 10.15 -47% |
| Colorchecker dE 2000 calibrated * | 1.31 | 1.5 -15% | 2.93 -124% | 0.89 32% | 2.62 -100% | 4.27 -226% |
| Greyscale dE 2000 * | 2.98 | 2.75 8% | 5 -68% | 3.91 -31% | 11.17 -275% | 3.9 -31% |
| Gamma | 2.38 92% | 2.46 89% | 2.07 106% | 2.26 97% | 2.28 96% | 2.13 103% |
| CCT | 6738 96% | 6763 96% | 7488 87% | 7138 91% | 12475 52% | 6911 94% |
| Color Space (Percent of AdobeRGB 1998) (%) | 60 | 60 0% | 57.8 -4% | 60 0% | 76 27% | 55.6 -7% |
| Color Space (Percent of sRGB) (%) | 95 | 92 -3% | 89.2 -6% | 95 0% | 100 5% | 84.7 -11% |
| Totalt genomsnitt (program/inställningar) | -9% /
-2% | -17% /
-20% | 10% /
7% | -3% /
-34% | -68% /
-51% |
* ... mindre är bättre
Visa svarstider
| ↔ Svarstid svart till vitt | ||
|---|---|---|
| 9.6 ms ... stiga ↗ och falla ↘ kombinerat | ↗ 5.2 ms stiga | 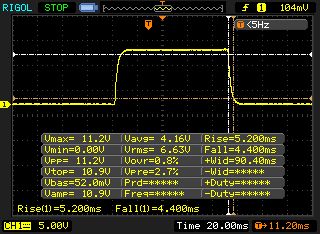 |
| ↘ 4.4 ms hösten | ||
| Skärmen visar snabba svarsfrekvenser i våra tester och bör passa för spel. I jämförelse sträcker sig alla testade enheter från 0.1 (minst) till 240 (maximalt) ms. » 26 % av alla enheter är bättre. Det betyder att den uppmätta svarstiden är bättre än genomsnittet av alla testade enheter (19.9 ms). | ||
| ↔ Svarstid 50 % grått till 80 % grått | ||
| 14.4 ms ... stiga ↗ och falla ↘ kombinerat | ↗ 7.6 ms stiga | 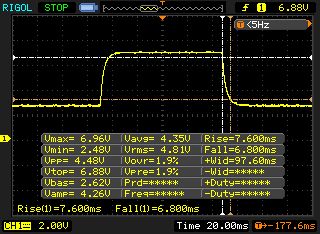 |
| ↘ 6.8 ms hösten | ||
| Skärmen visar bra svarsfrekvens i våra tester, men kan vara för långsam för konkurrenskraftiga spelare. I jämförelse sträcker sig alla testade enheter från 0.165 (minst) till 636 (maximalt) ms. » 28 % av alla enheter är bättre. Det betyder att den uppmätta svarstiden är bättre än genomsnittet av alla testade enheter (31.1 ms). | ||
Skärmflimmer / PWM (Puls-Width Modulation)
| Skärmflimmer / PWM upptäcktes inte |  | ||
Som jämförelse: 52 % av alla testade enheter använder inte PWM för att dämpa skärmen. Om PWM upptäcktes mättes ett medelvärde av 7794 (minst: 5 - maximum: 343500) Hz. | |||
| Cinebench R15 | |
| CPU Single 64Bit | |
| Genomsnitt av klass Gaming (188.8 - 343, n=111, senaste 2 åren) | |
| MSI GP75 Leopard 9SD | |
| Schenker XMG Core 17 | |
| Schenker XMG Core 17 (Overboost-Profil) | |
| Schenker XMG Core 17 (Enthusiast-Profil) | |
| Schenker XMG Neo 17 | |
| Lenovo Legion Y730-17ICH, i7-8750H | |
| Gigabyte Sabre 17-W8 | |
| Dell G7 17 7790 | |
| CPU Multi 64Bit | |
| Genomsnitt av klass Gaming (1578 - 6271, n=111, senaste 2 åren) | |
| Schenker XMG Core 17 (Enthusiast-Profil) | |
| Schenker XMG Core 17 (Overboost-Profil) | |
| Lenovo Legion Y730-17ICH, i7-8750H | |
| Gigabyte Sabre 17-W8 | |
| MSI GP75 Leopard 9SD | |
| Dell G7 17 7790 | |
| Schenker XMG Core 17 | |
| Schenker XMG Neo 17 | |
| Cinebench R10 | |
| Rendering Single 32Bit | |
| Genomsnitt av klass Gaming (7457 - 11779, n=8, senaste 2 åren) | |
| Schenker XMG Core 17 | |
| Rendering Multiple CPUs 32Bit | |
| Genomsnitt av klass Gaming (42932 - 81339, n=8, senaste 2 åren) | |
| Schenker XMG Core 17 | |
| Cinebench R20 | |
| CPU (Single Core) | |
| Genomsnitt av klass Gaming (442 - 895, n=111, senaste 2 åren) | |
| Schenker XMG Core 17 | |
| CPU (Multi Core) | |
| Genomsnitt av klass Gaming (4029 - 16108, n=111, senaste 2 åren) | |
| Schenker XMG Core 17 | |
| Geekbench 3 | |
| 32 Bit Multi-Core Score | |
| Schenker XMG Core 17 | |
| 32 Bit Single-Core Score | |
| Schenker XMG Core 17 | |
| Geekbench 4.4 | |
| 64 Bit Multi-Core Score | |
| Genomsnitt av klass Gaming (89200 - 97490, n=2, senaste 2 åren) | |
| Schenker XMG Core 17 | |
| 64 Bit Single-Core Score | |
| Genomsnitt av klass Gaming (9335 - 9492, n=2, senaste 2 åren) | |
| Schenker XMG Core 17 | |
| Mozilla Kraken 1.1 - Total | |
| Gigabyte Sabre 17-W8 | |
| MSI GP75 Leopard 9SD | |
| Schenker XMG Core 17 (Edge 44) | |
| Genomsnitt av klass Gaming (391 - 590, n=105, senaste 2 åren) | |
| Octane V2 - Total Score | |
| Genomsnitt av klass Gaming (87588 - 139447, n=30, senaste 2 åren) | |
| MSI GP75 Leopard 9SD | |
| Schenker XMG Core 17 (Edge 44) | |
| Gigabyte Sabre 17-W8 | |
| JetStream 1.1 - 1.1 Total | |
| Genomsnitt av klass Gaming (518 - 647, n=5, senaste 2 åren) | |
| Schenker XMG Core 17 (Edge 44) | |
| MSI GP75 Leopard 9SD | |
| Gigabyte Sabre 17-W8 | |
* ... mindre är bättre
| PCMark 7 Score | 6946 poäng | |
| PCMark 8 Home Score Accelerated v2 | 4401 poäng | |
| PCMark 8 Creative Score Accelerated v2 | 4153 poäng | |
| PCMark 8 Work Score Accelerated v2 | 5697 poäng | |
| PCMark 10 Score | 5657 poäng | |
Hjälp | ||
| PCMark 10 - Score | |
| Genomsnitt av klass Gaming (5828 - 11574, n=95, senaste 2 åren) | |
| Schenker XMG Core 17 (Overboost-Profil) | |
| Schenker XMG Core 17 (Enthusiast-Profil) | |
| Schenker XMG Core 17 | |
| MSI GP75 Leopard 9SD | |
| Schenker XMG Neo 17 | |
| Dell G7 17 7790 | |
| Gigabyte Sabre 17-W8 | |
| Lenovo Legion Y730-17ICH, i7-8750H | |
| PCMark 8 | |
| Home Score Accelerated v2 | |
| Genomsnitt av klass Gaming (n=1senaste 2 åren) | |
| Schenker XMG Core 17 | |
| Gigabyte Sabre 17-W8 | |
| Lenovo Legion Y730-17ICH, i7-8750H | |
| Dell G7 17 7790 | |
| MSI GP75 Leopard 9SD | |
| Work Score Accelerated v2 | |
| Schenker XMG Core 17 | |
| MSI GP75 Leopard 9SD | |
| Lenovo Legion Y730-17ICH, i7-8750H | |
| Gigabyte Sabre 17-W8 | |
| Dell G7 17 7790 | |
| Genomsnitt av klass Gaming (n=1senaste 2 åren) | |

| Schenker XMG Core 17 Samsung SSD 970 EVO Plus 500GB | Schenker XMG Neo 17 Samsung SSD 970 EVO Plus 1TB | Dell G7 17 7790 Toshiba BG3 KBG30ZMS256G | MSI GP75 Leopard 9SD Kingston RBUSNS8154P3256GJ1 | Gigabyte Sabre 17-W8 Toshiba NVMe THNSN5256GPU7 | Lenovo Legion Y730-17ICH, i7-8750H Toshiba KBG30ZMT128G | |
|---|---|---|---|---|---|---|
| CrystalDiskMark 5.2 / 6 | -5% | -48% | -40% | -23% | -58% | |
| Write 4K (MB/s) | 99.3 | 92.7 -7% | 78.6 -21% | 105.8 7% | 104.7 5% | 71.4 -28% |
| Read 4K (MB/s) | 38.47 | 41.4 8% | 31.89 -17% | 27.89 -28% | 37.39 -3% | 29.98 -22% |
| Write Seq (MB/s) | 1449 | 1363 -6% | 230.4 -84% | 270.8 -81% | 866 -40% | 129.6 -91% |
| Read Seq (MB/s) | 1237 | 1259 2% | 925 -25% | 879 -29% | 944 -24% | 843 -32% |
| Write 4K Q32T1 (MB/s) | 364.4 | 289.7 -20% | 159.1 -56% | 273.3 -25% | 293.3 -20% | 88.9 -76% |
| Read 4K Q32T1 (MB/s) | 421.9 | 337.5 -20% | 315.6 -25% | 361.2 -14% | 374.3 -11% | 196.4 -53% |
| Write Seq Q32T1 (MB/s) | 3276 | 3332 2% | 230.7 -93% | 253 -92% | 1064 -68% | 130.5 -96% |
| Read Seq Q32T1 (MB/s) | 3338 | 3477 4% | 1323 -60% | 1505 -55% | 2616 -22% | 1037 -69% |


| 3DMark 06 Standard Score | 38141 poäng | |
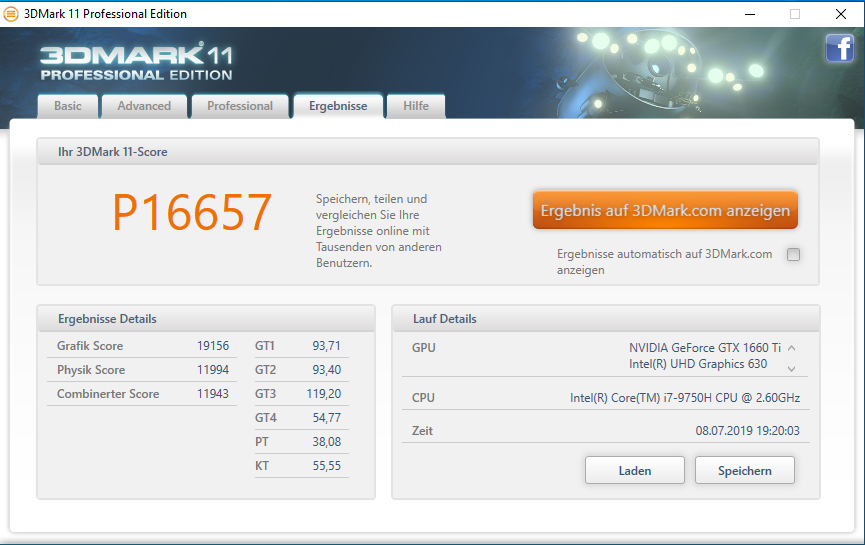
| 3DMark 11 Performance | 16657 poäng | |
| 3DMark Ice Storm Standard Score | 109442 poäng | |
| 3DMark Cloud Gate Standard Score | 34040 poäng | |
| 3DMark Fire Strike Score | 12816 poäng | |
| 3DMark Time Spy Score | 5578 poäng | |
Hjälp | ||
| 3DMark 11 - 1280x720 Performance GPU | |
| Genomsnitt av klass Gaming (21841 - 80022, n=108, senaste 2 åren) | |
| Schenker XMG Neo 17 | |
| Dell G7 17 7790 | |
| Schenker XMG Core 17 (Overboost-Profil) | |
| MSI GP75 Leopard 9SD | |
| Schenker XMG Core 17 (Enthusiast-Profil) | |
| Schenker XMG Core 17 | |
| Gigabyte Sabre 17-W8 | |
| 3DMark | |
| 1280x720 Cloud Gate Standard Graphics | |
| Genomsnitt av klass Gaming (86886 - 223650, n=61, senaste 2 åren) | |
| Schenker XMG Neo 17 | |
| MSI GP75 Leopard 9SD | |
| Schenker XMG Core 17 | |
| Dell G7 17 7790 | |
| Gigabyte Sabre 17-W8 | |
| Lenovo Legion Y730-17ICH, i7-8750H | |
| 1920x1080 Fire Strike Graphics | |
| Genomsnitt av klass Gaming (12242 - 62849, n=120, senaste 2 åren) | |
| Schenker XMG Neo 17 | |
| Dell G7 17 7790 | |
| Schenker XMG Core 17 (Overboost-Profil) | |
| MSI GP75 Leopard 9SD | |
| Schenker XMG Core 17 | |
| Schenker XMG Core 17 (Enthusiast-Profil) | |
| Gigabyte Sabre 17-W8 | |
| Lenovo Legion Y730-17ICH, i7-8750H | |
| 2560x1440 Time Spy Graphics | |
| Genomsnitt av klass Gaming (5012 - 26212, n=119, senaste 2 åren) | |
| Dell G7 17 7790 | |
| Schenker XMG Core 17 (Overboost-Profil) | |
| MSI GP75 Leopard 9SD | |
| Schenker XMG Core 17 | |
| Schenker XMG Core 17 (Enthusiast-Profil) | |
| The Witcher 3 - 1920x1080 Ultra Graphics & Postprocessing (HBAO+) | |
| Genomsnitt av klass Gaming (95 - 240, n=8, senaste 2 åren) | |
| Dell G7 17 7790 | |
| MSI GP75 Leopard 9SD | |
| Schenker XMG Core 17 | |
| Lenovo Legion Y730-17ICH, i7-8750H | |
| Gigabyte Sabre 17-W8 | |
| BioShock Infinite - 1920x1080 Ultra Preset, DX11 (DDOF) | |
| MSI GP75 Leopard 9SD | |
| Schenker XMG Core 17 | |
| Dell G7 17 7790 | |
| Lenovo Legion Y730-17ICH, i7-8750H | |
| Rage 2 - 1920x1080 Ultra Preset (Resolution Scale Off) | |
| Schenker XMG Core 17 | |
| Far Cry New Dawn - 1920x1080 Ultra Preset | |
| Schenker XMG Core 17 | |
| Schenker XMG Core 17 (Overboost-Profil) | |
| Anno 1800 - 1920x1080 Ultra Graphics Quality (DX11) | |
| Genomsnitt av klass Gaming (n=1senaste 2 åren) | |
| Schenker XMG Core 17 | |
| MSI GP75 Leopard 9SD | |
| For Honor - 1920x1080 Extreme Preset AA:T AF:16x | |
| Schenker XMG Core 17 | |
| F1 2019 - 1920x1080 Ultra High Preset AA:T AF:16x | |
| Schenker XMG Core 17 (Overboost-Profil) | |
| Schenker XMG Core 17 | |

| låg | med. | hög | ultra | |
|---|---|---|---|---|
| BioShock Infinite (2013) | 304.3 | 271.6 | 248.7 | 136.2 |
| The Witcher 3 (2015) | 258.9 | 163.9 | 102.6 | 53.3 |
| For Honor (2017) | 237.2 | 128.6 | 121.5 | 93.1 |
| Final Fantasy XV Benchmark (2018) | 120.9 | 79.9 | 57.2 | |
| Far Cry 5 (2018) | 119 | 93 | 88 | 83 |
| Far Cry New Dawn (2019) | 109 | 90 | 86 | 78 |
| Anno 1800 (2019) | 94.6 | 89.6 | 69.2 | 39.6 |
| Rage 2 (2019) | 175.1 | 83.3 | 69.9 | 68.8 |
| F1 2019 (2019) | 181 | 144 | 122 | 92 |
Ljudnivå
| Låg belastning |
| 30 / 32 / 35 dB(A) |
| Hög belastning |
| 47 / 51 dB(A) |
 | ||
30 dB tyst 40 dB(A) hörbar 50 dB(A) högt ljud |
||
min: | ||
| Schenker XMG Core 17 i7-9750H, GeForce GTX 1660 Ti Mobile | Schenker XMG Neo 17 i7-8750H, GeForce RTX 2070 Mobile | Dell G7 17 7790 i7-8750H, GeForce RTX 2070 Max-Q | MSI GP75 Leopard 9SD i7-9750H, GeForce GTX 1660 Ti Mobile | Gigabyte Sabre 17-W8 i7-8750H, GeForce GTX 1060 Mobile | Lenovo Legion Y730-17ICH, i7-8750H i7-8750H, GeForce GTX 1050 Ti Mobile | Genomsnitt av klass Gaming | |
|---|---|---|---|---|---|---|---|
| Noise | 4% | 10% | -5% | 2% | 12% | 11% | |
| av / miljö * (dB) | 30 | 29 3% | 28.2 6% | 29 3% | 30.5 -2% | 28 7% | 24.1 ? 20% |
| Idle Minimum * (dB) | 30 | 29 3% | 28.6 5% | 29 3% | 32.1 -7% | 28 7% | 25.8 ? 14% |
| Idle Average * (dB) | 32 | 32 -0% | 28.6 11% | 34 -6% | 32.1 -0% | 28 12% | 27.4 ? 14% |
| Idle Maximum * (dB) | 35 | 33 6% | 28.6 18% | 37 -6% | 32.3 8% | 31.3 11% | 30 ? 14% |
| Load Average * (dB) | 47 | 42 11% | 31.8 32% | 53 -13% | 42.9 9% | 33.4 29% | 43 ? 9% |
| Witcher 3 ultra * (dB) | 48 | 49 -2% | 50.6 -5% | 51 -6% | 42.8 11% | ||
| Load Maximum * (dB) | 51 | 49 4% | 50.8 -0% | 55 -8% | 48.8 4% | 46.2 9% | 54 ? -6% |
* ... mindre är bättre
(-) Den maximala temperaturen på ovansidan är 47 °C / 117 F, jämfört med genomsnittet av 40.4 °C / 105 F , allt från 21.2 till 68.8 °C för klassen Gaming.
(-) Botten värms upp till maximalt 50 °C / 122 F, jämfört med genomsnittet av 43.2 °C / 110 F
(+) Vid tomgångsbruk är medeltemperaturen för ovansidan 30.7 °C / 87 F, jämfört med enhetsgenomsnittet på 33.9 °C / ### class_avg_f### F.
(-) När du spelar The Witcher 3 är medeltemperaturen för ovansidan 38.7 °C / 102 F, jämfört med enhetsgenomsnittet på 33.9 °C / ## #class_avg_f### F.
(+) Handledsstöden och pekplattan når maximal hudtemperatur (35 °C / 95 F) och är därför inte varma.
(-) Medeltemperaturen för handledsstödsområdet på liknande enheter var 28.8 °C / 83.8 F (-6.2 °C / -11.2 F).
| Schenker XMG Core 17 i7-9750H, GeForce GTX 1660 Ti Mobile | Schenker XMG Neo 17 i7-8750H, GeForce RTX 2070 Mobile | Dell G7 17 7790 i7-8750H, GeForce RTX 2070 Max-Q | MSI GP75 Leopard 9SD i7-9750H, GeForce GTX 1660 Ti Mobile | Gigabyte Sabre 17-W8 i7-8750H, GeForce GTX 1060 Mobile | Lenovo Legion Y730-17ICH, i7-8750H i7-8750H, GeForce GTX 1050 Ti Mobile | Genomsnitt av klass Gaming | |
|---|---|---|---|---|---|---|---|
| Heat | 3% | -6% | 8% | 18% | 1% | 3% | |
| Maximum Upper Side * (°C) | 47 | 47 -0% | 46.6 1% | 45 4% | 35 26% | 42 11% | 45.2 ? 4% |
| Maximum Bottom * (°C) | 50 | 56 -12% | 57 -14% | 42 16% | 34.3 31% | 51.2 -2% | 48 ? 4% |
| Idle Upper Side * (°C) | 34 | 28 18% | 34.4 -1% | 30 12% | 30.1 11% | 31.8 6% | 31.1 ? 9% |
| Idle Bottom * (°C) | 32 | 30 6% | 34.6 -8% | 32 -0% | 30.5 5% | 35.4 -11% | 34.2 ? -7% |
* ... mindre är bättre
Schenker XMG Core 17 ljudanalys
(±) | högtalarljudstyrkan är genomsnittlig men bra (74 dB)
Bas 100 - 315 Hz
(±) | reducerad bas - i genomsnitt 12.5% lägre än medianen
(±) | linjäriteten för basen är genomsnittlig (12.5% delta till föregående frekvens)
Mellan 400 - 2000 Hz
(±) | högre mellan - i genomsnitt 6.1% högre än median
(±) | linjäriteten för mids är genomsnittlig (10.9% delta till föregående frekvens)
Högsta 2 - 16 kHz
(+) | balanserade toppar - endast 1.1% från medianen
(+) | toppar är linjära (5.2% delta till föregående frekvens)
Totalt 100 - 16 000 Hz
(±) | linjäriteten för det totala ljudet är genomsnittlig (18.9% skillnad mot median)
Jämfört med samma klass
» 63% av alla testade enheter i den här klassen var bättre, 8% liknande, 29% sämre
» Den bästa hade ett delta på 6%, genomsnittet var 18%, sämst var 132%
Jämfört med alla testade enheter
» 44% av alla testade enheter var bättre, 8% liknande, 48% sämre
» Den bästa hade ett delta på 4%, genomsnittet var 24%, sämst var 134%
Schenker XMG Core 15 ljudanalys
(±) | högtalarljudstyrkan är genomsnittlig men bra (75 dB)
Bas 100 - 315 Hz
(±) | reducerad bas - i genomsnitt 8% lägre än medianen
(±) | linjäriteten för basen är genomsnittlig (11.7% delta till föregående frekvens)
Mellan 400 - 2000 Hz
(±) | högre mellan - i genomsnitt 10.1% högre än median
(±) | linjäriteten för mids är genomsnittlig (13.2% delta till föregående frekvens)
Högsta 2 - 16 kHz
(+) | balanserade toppar - endast 1.9% från medianen
(±) | linjäriteten för toppar är genomsnittlig (7.5% delta till föregående frekvens)
Totalt 100 - 16 000 Hz
(±) | linjäriteten för det totala ljudet är genomsnittlig (23.6% skillnad mot median)
Jämfört med samma klass
» 86% av alla testade enheter i den här klassen var bättre, 4% liknande, 10% sämre
» Den bästa hade ett delta på 6%, genomsnittet var 18%, sämst var 132%
Jämfört med alla testade enheter
» 71% av alla testade enheter var bättre, 6% liknande, 23% sämre
» Den bästa hade ett delta på 4%, genomsnittet var 24%, sämst var 134%
| Av/Standby | |
| Låg belastning | |
| Hög belastning |
|
Förklaring:
min: | |
| Schenker XMG Core 17 i7-9750H, GeForce GTX 1660 Ti Mobile | Schenker XMG Neo 17 i7-8750H, GeForce RTX 2070 Mobile | Dell G7 17 7790 i7-8750H, GeForce RTX 2070 Max-Q | MSI GP75 Leopard 9SD i7-9750H, GeForce GTX 1660 Ti Mobile | Gigabyte Sabre 17-W8 i7-8750H, GeForce GTX 1060 Mobile | Lenovo Legion Y730-17ICH, i7-8750H i7-8750H, GeForce GTX 1050 Ti Mobile | Genomsnitt av klass Gaming | |
|---|---|---|---|---|---|---|---|
| Power Consumption | -17% | -11% | -11% | 2% | 24% | -32% | |
| Idle Minimum * (Watt) | 10 | 13 -30% | 9.5 5% | 10 -0% | 9.3 7% | 6.3 37% | 13.2 ? -32% |
| Idle Average * (Watt) | 13 | 16 -23% | 16.2 -25% | 15 -15% | 14.8 -14% | 11 15% | 18.9 ? -45% |
| Idle Maximum * (Watt) | 21 | 21 -0% | 23.8 -13% | 22 -5% | 22 -5% | 11.5 45% | 24.3 ? -16% |
| Load Average * (Watt) | 89 | 96 -8% | 101.7 -14% | 92 -3% | 63 29% | 89.8 -1% | 108 ? -21% |
| Witcher 3 ultra * (Watt) | 128 | 172 -34% | 155 -21% | 153 -20% | 102 20% | ||
| Load Maximum * (Watt) | 177 | 191 -8% | 172.2 3% | 216 -22% | 187 -6% | 130.7 26% | 254 ? -44% |
* ... mindre är bättre
| Schenker XMG Core 17 i7-9750H, GeForce GTX 1660 Ti Mobile, 46.74 Wh | Schenker XMG Neo 17 i7-8750H, GeForce RTX 2070 Mobile, 46.74 Wh | Dell G7 17 7790 i7-8750H, GeForce RTX 2070 Max-Q, 60 Wh | MSI GP75 Leopard 9SD i7-9750H, GeForce GTX 1660 Ti Mobile, 51 Wh | Gigabyte Sabre 17-W8 i7-8750H, GeForce GTX 1060 Mobile, 62 Wh | Lenovo Legion Y730-17ICH, i7-8750H i7-8750H, GeForce GTX 1050 Ti Mobile, 76 Wh | Genomsnitt av klass Gaming | |
|---|---|---|---|---|---|---|---|
| Batteridrifttid | -29% | 14% | -42% | 2% | 25% | 32% | |
| Reader / Idle (h) | 8.1 | 5.3 -35% | 8.5 5% | 4.8 -41% | 6.9 -15% | 13.2 63% | 8.71 ? 8% |
| H.264 (h) | 5.3 | 5.3 0% | 8.26 ? 56% | ||||
| WiFi v1.3 (h) | 4.7 | 3.7 -21% | 3.9 -17% | 3.2 -32% | 5.4 15% | 6.7 43% | 7.02 ? 49% |
| Load (h) | 1.3 | 0.9 -31% | 2 54% | 0.6 -54% | 1.4 8% | 0.9 -31% | 1.47 ? 13% |
För
Emot
Läs den fullständiga versionen av den här recensionen på engelska här.
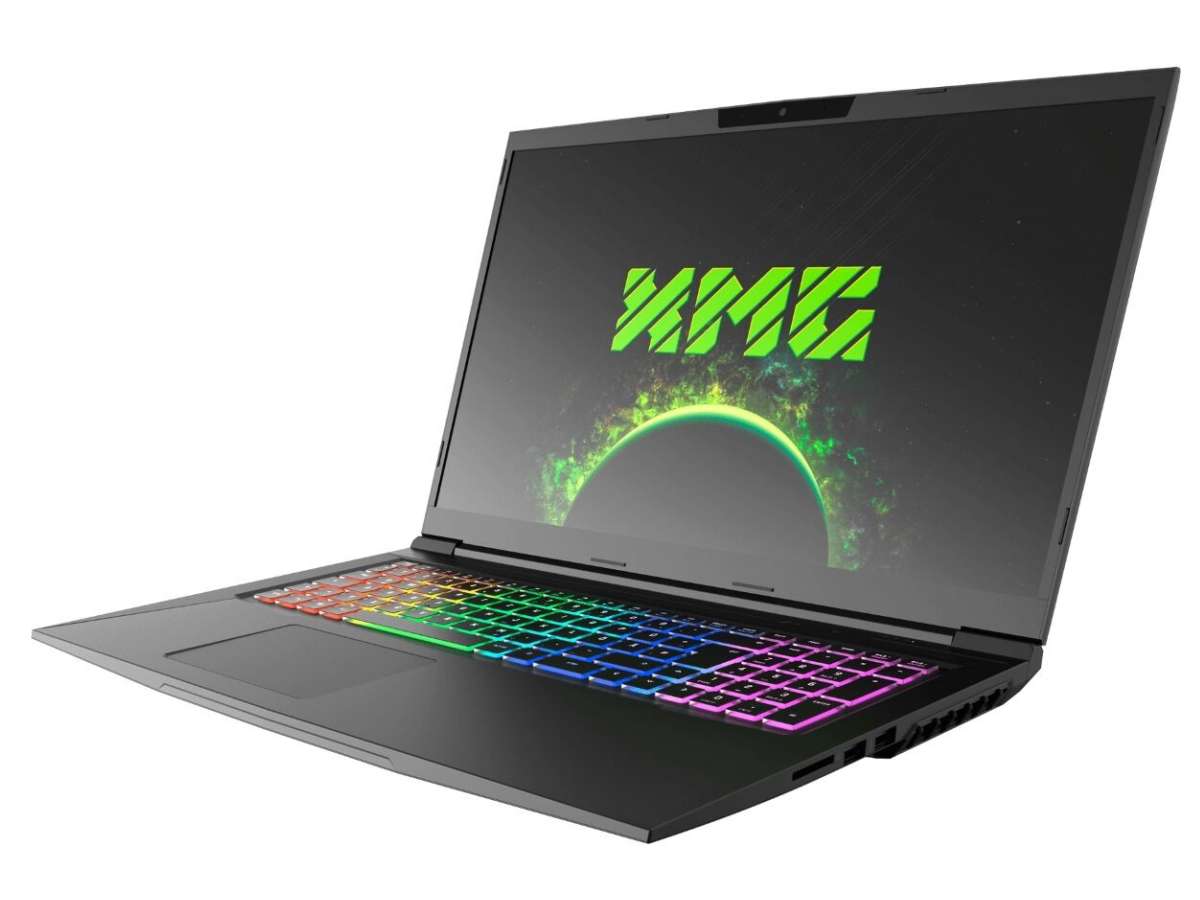
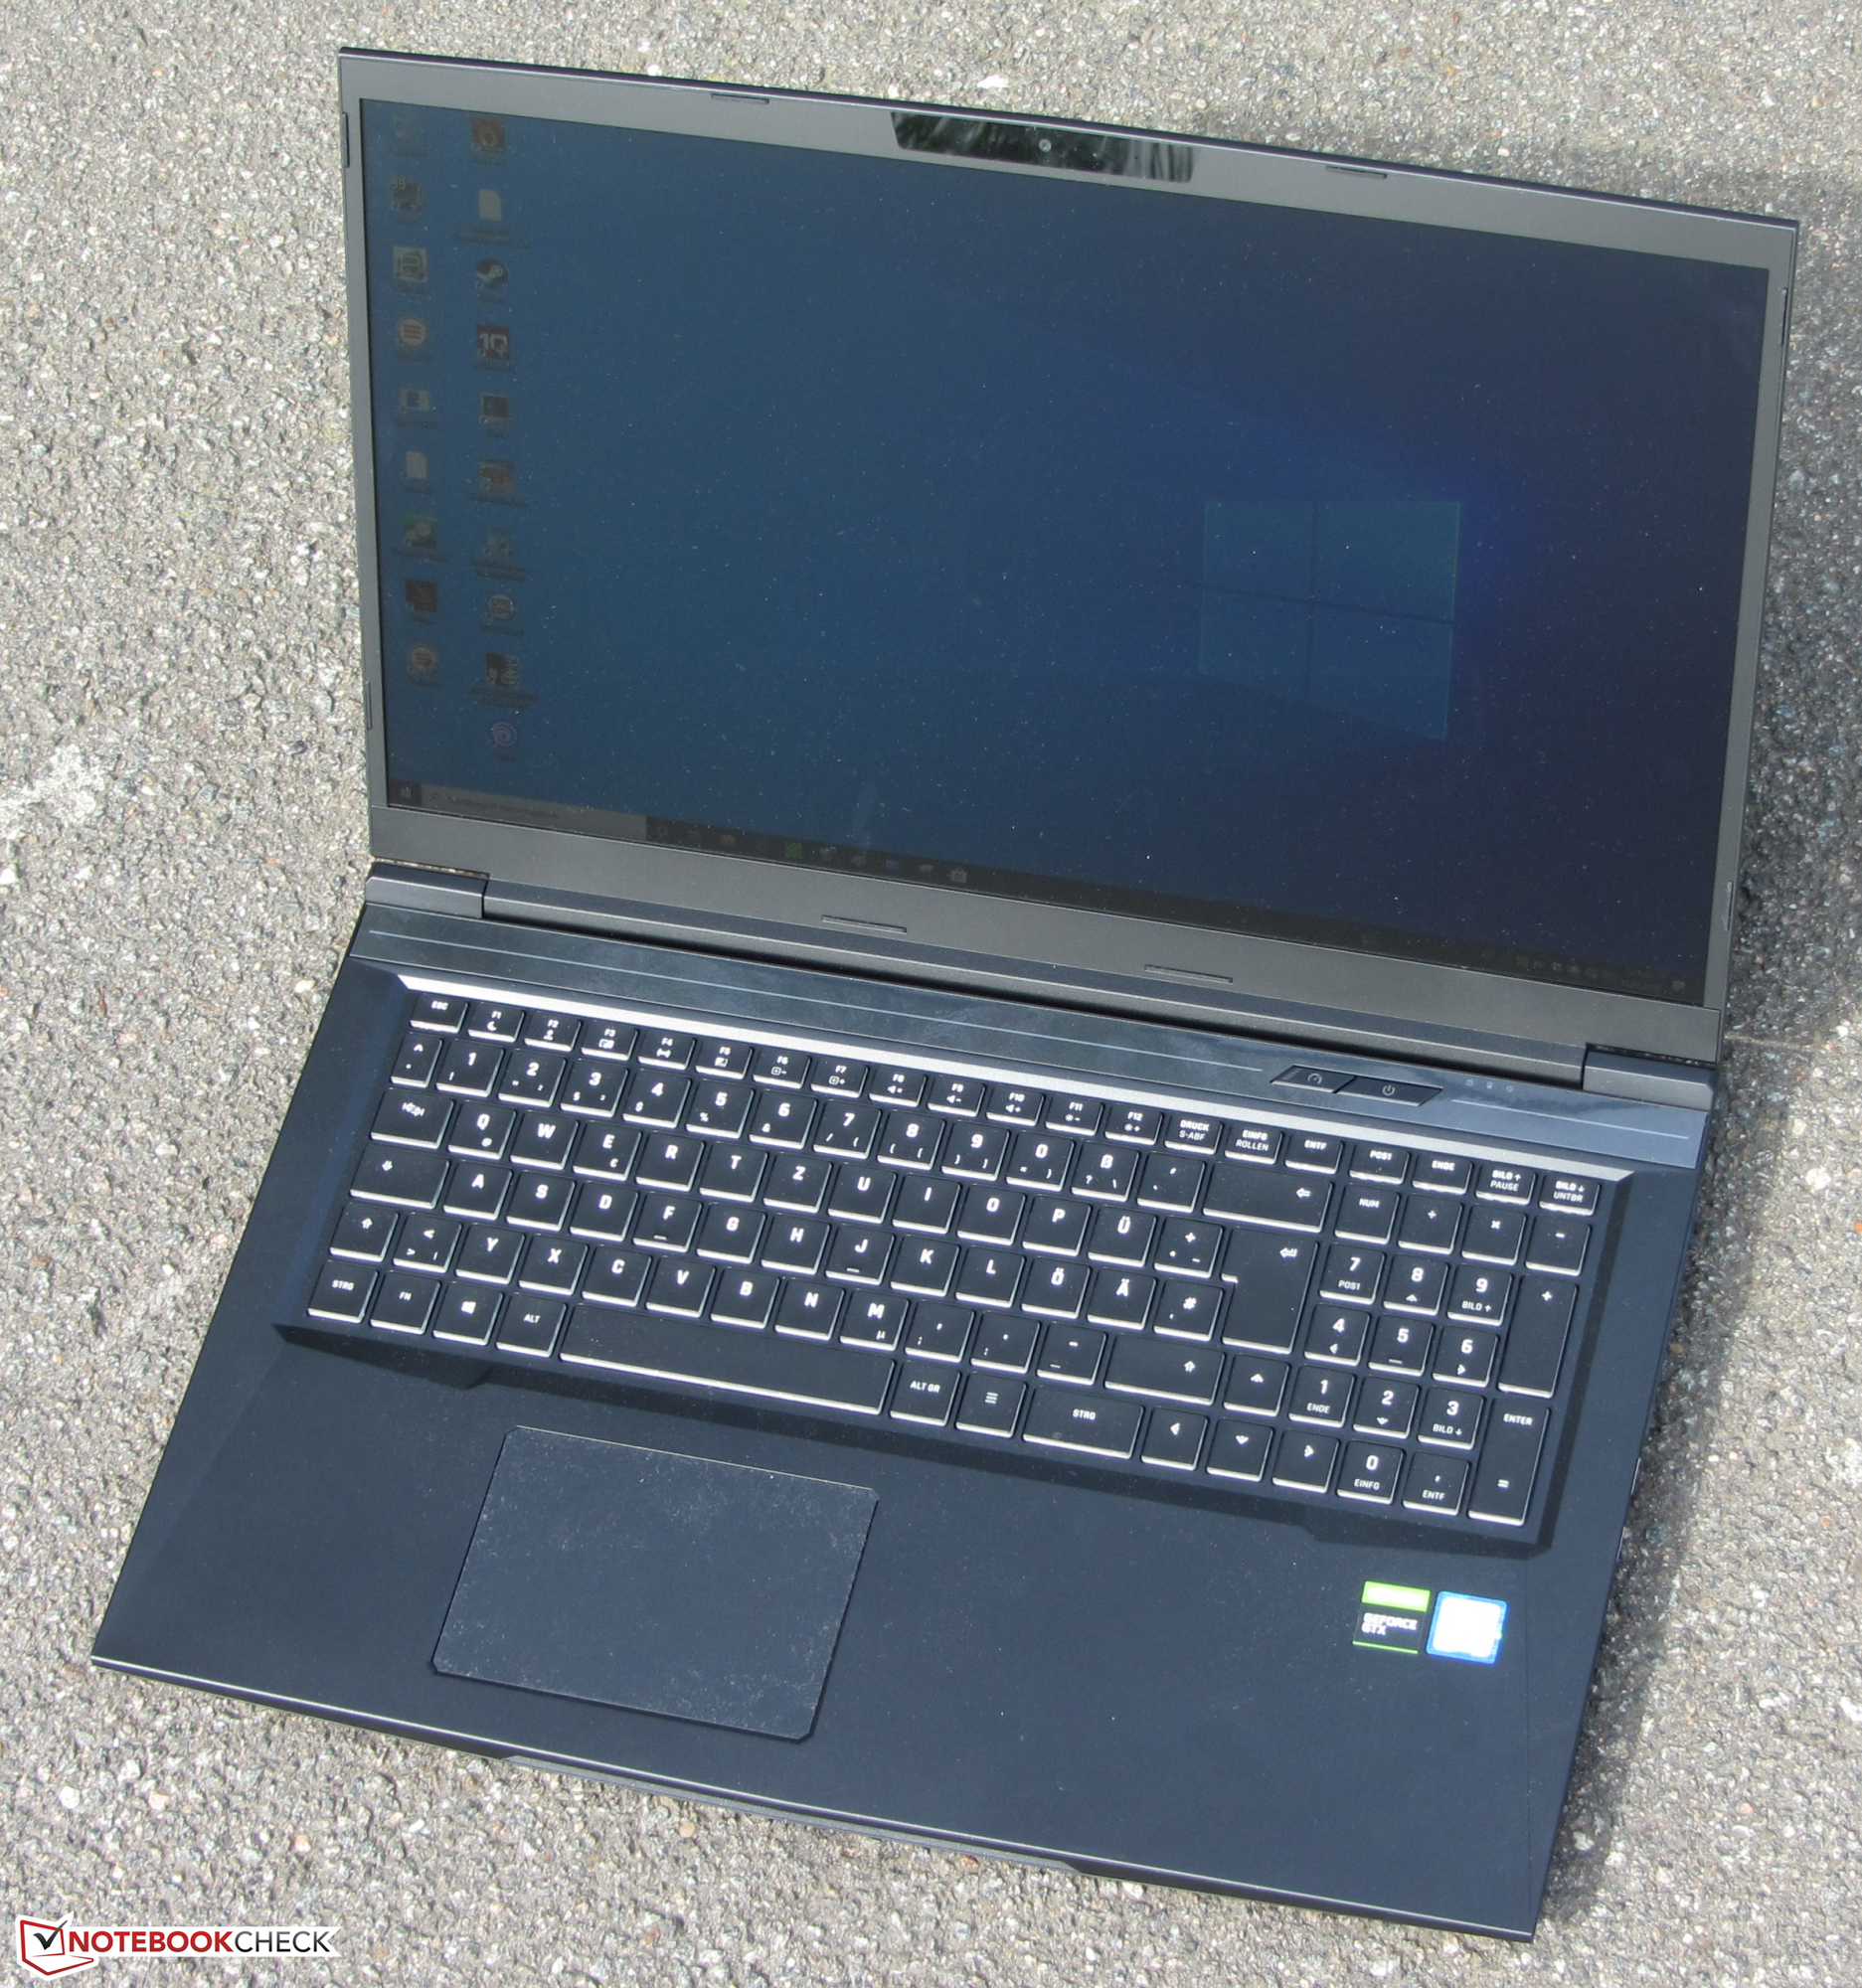
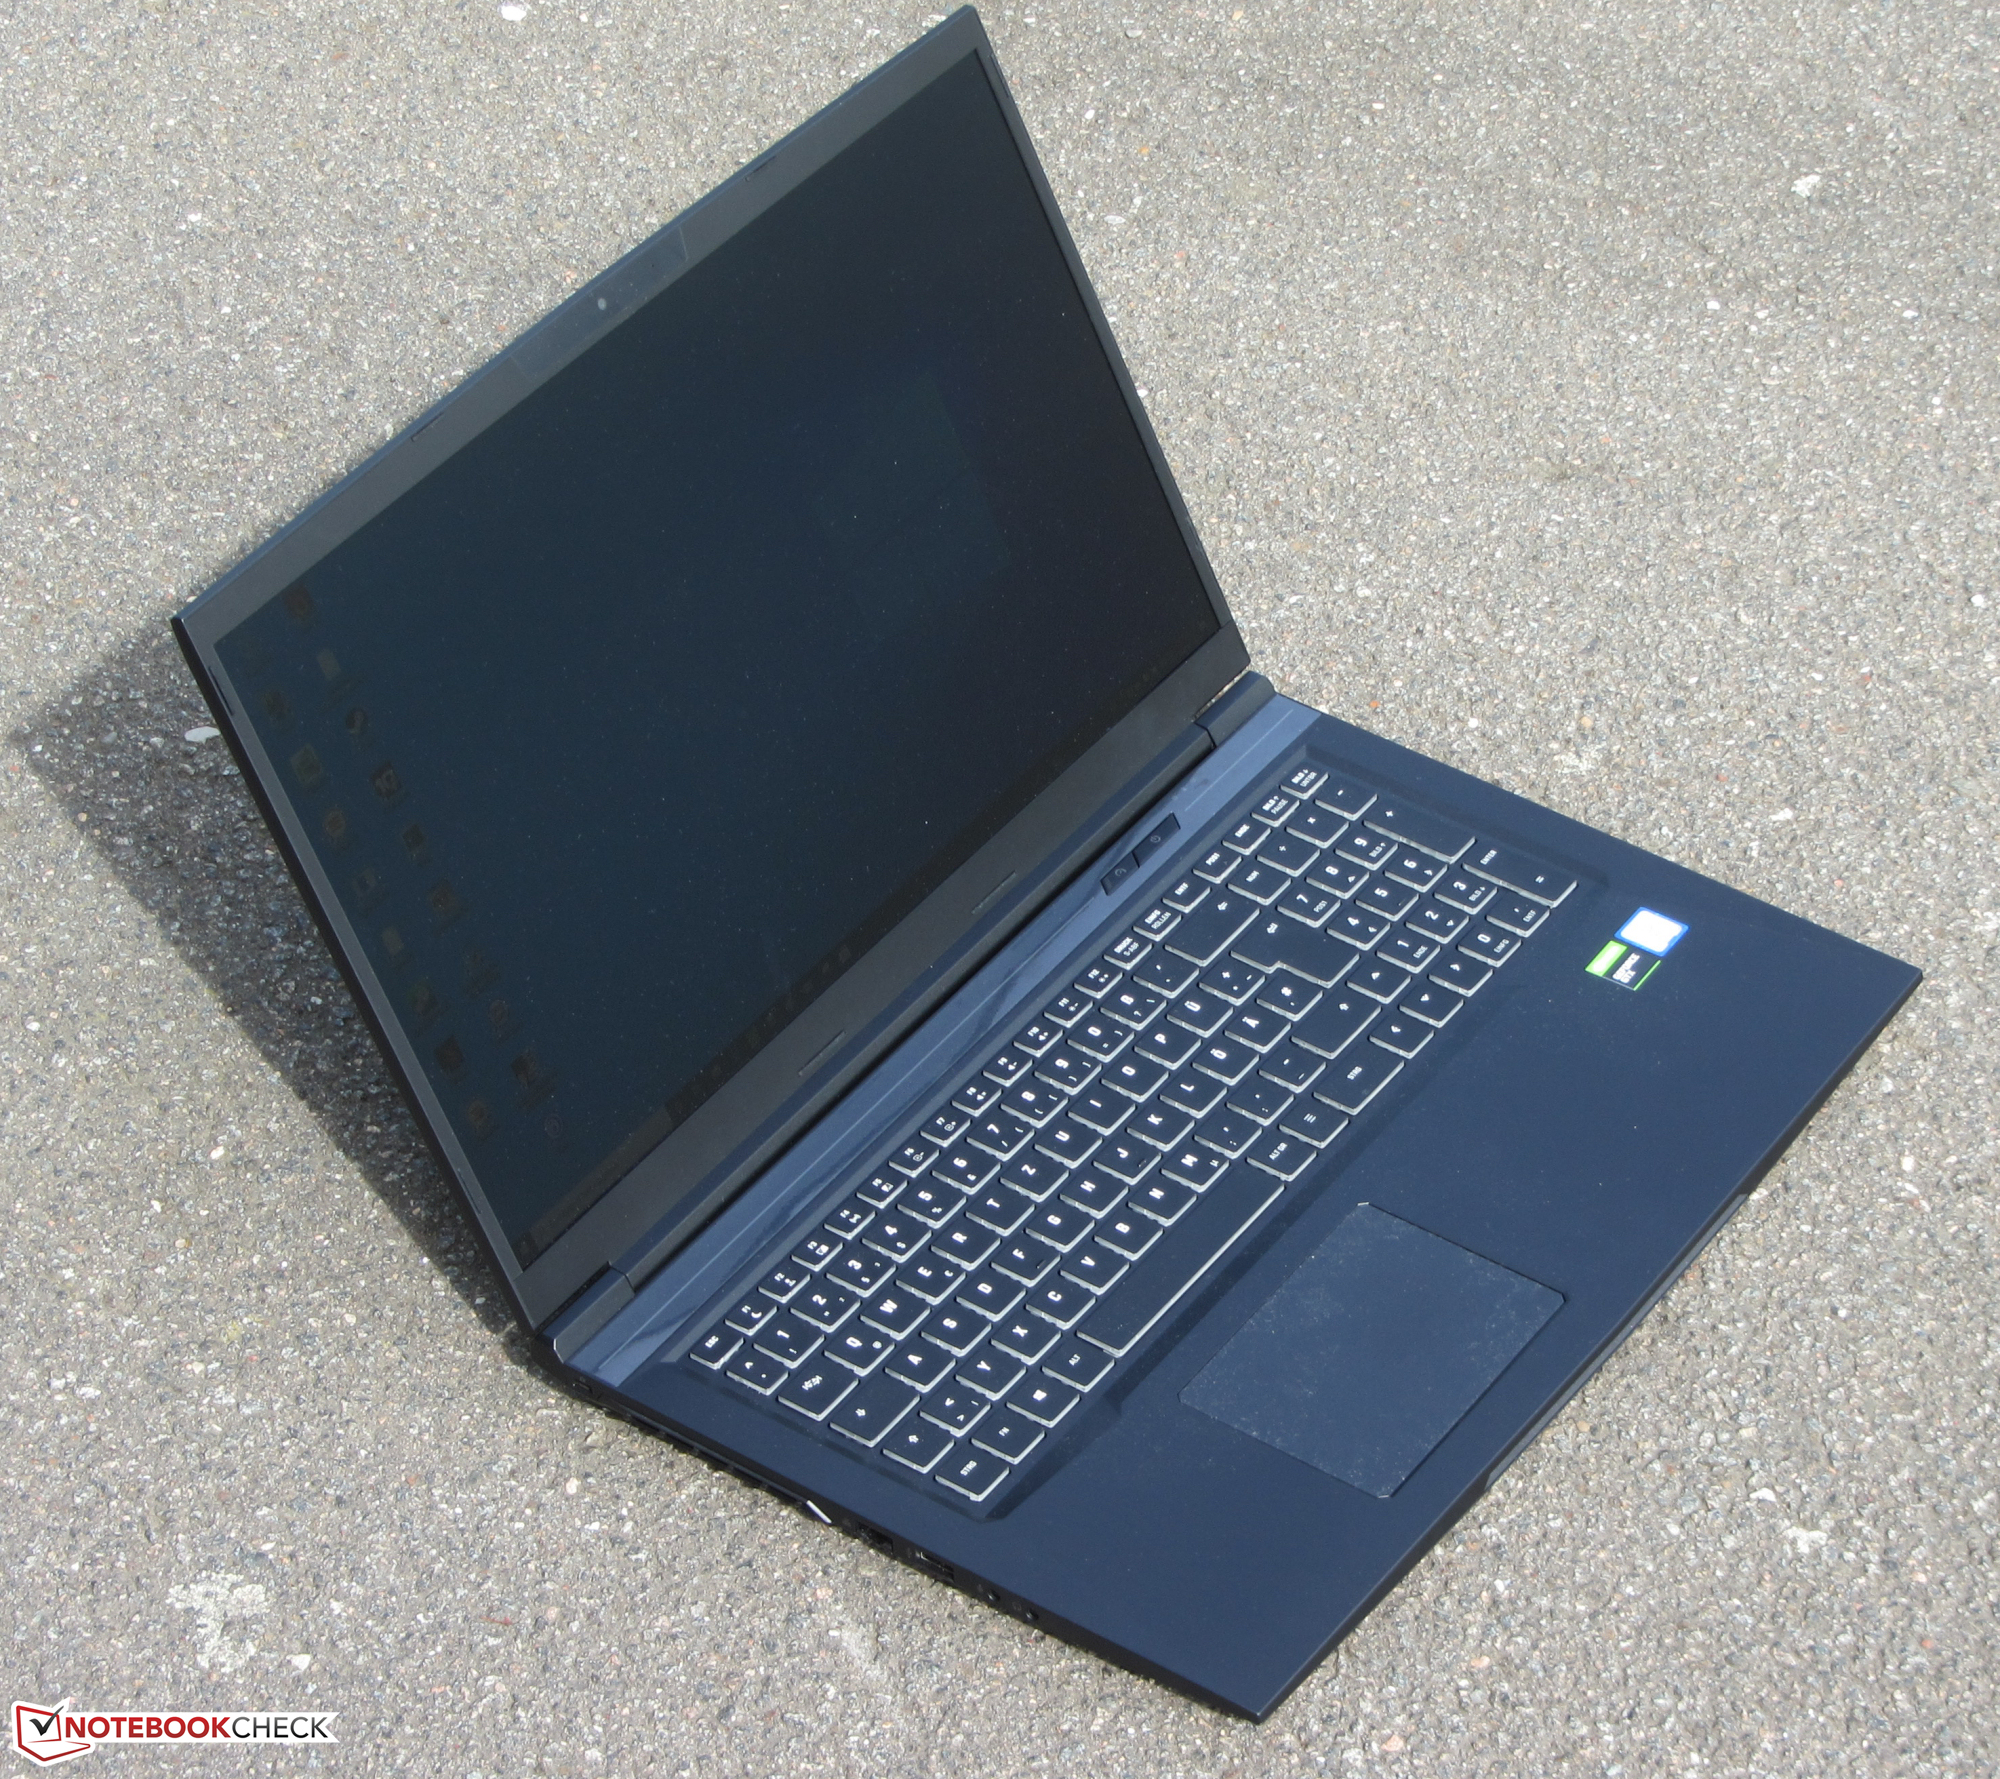
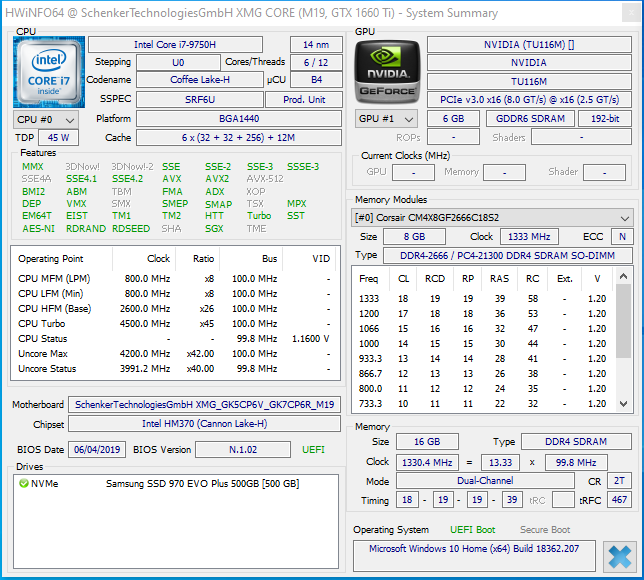
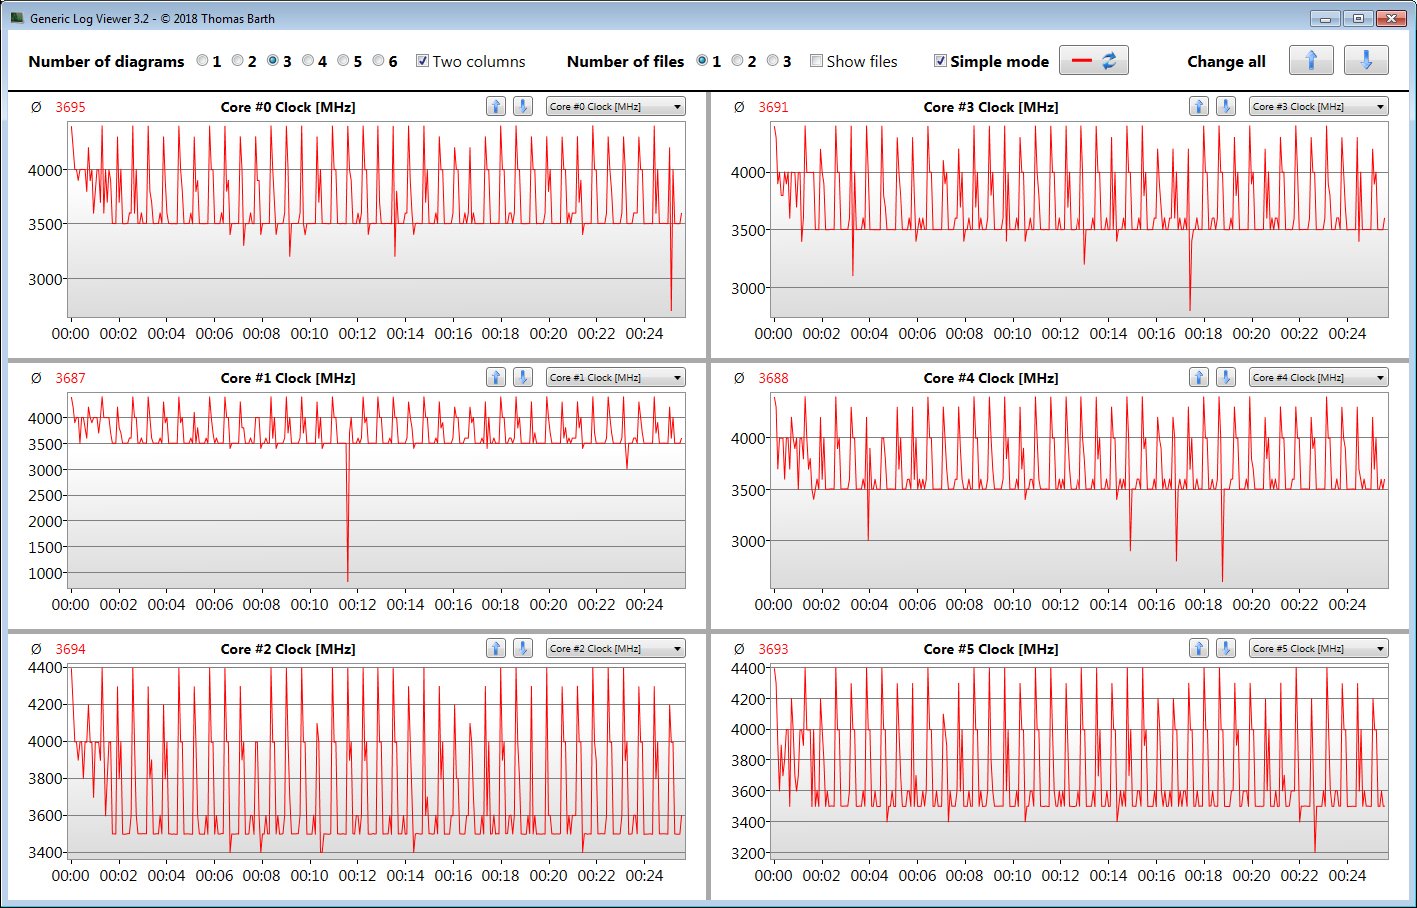
Med XMG Core 17 levererar Schenker en bärbar speldator på 17.3 tum som kan visa alla aktuella datorspel smidigt på den matta Full HD-skärmen tack vare en Core i7-9750H processor och GeForce GTX 1660 Ti-grafik. Det går alltid att välja höga eller maximala kvalitetsinställningar.
Det är också trevligt att Core 17 inte blir överdrivet varm vid belastning, vilket ofta är fallet på andra bärbara speldatorer. Den producerar heller inte särskilt mycket ljud - åtminstone inte vid tomgång eller låg belastning. Detta gäller i synnerhet vid tomgång då det oftast inte ens går att höra fläktarna. Men vid högre belastning är det en annan femma.
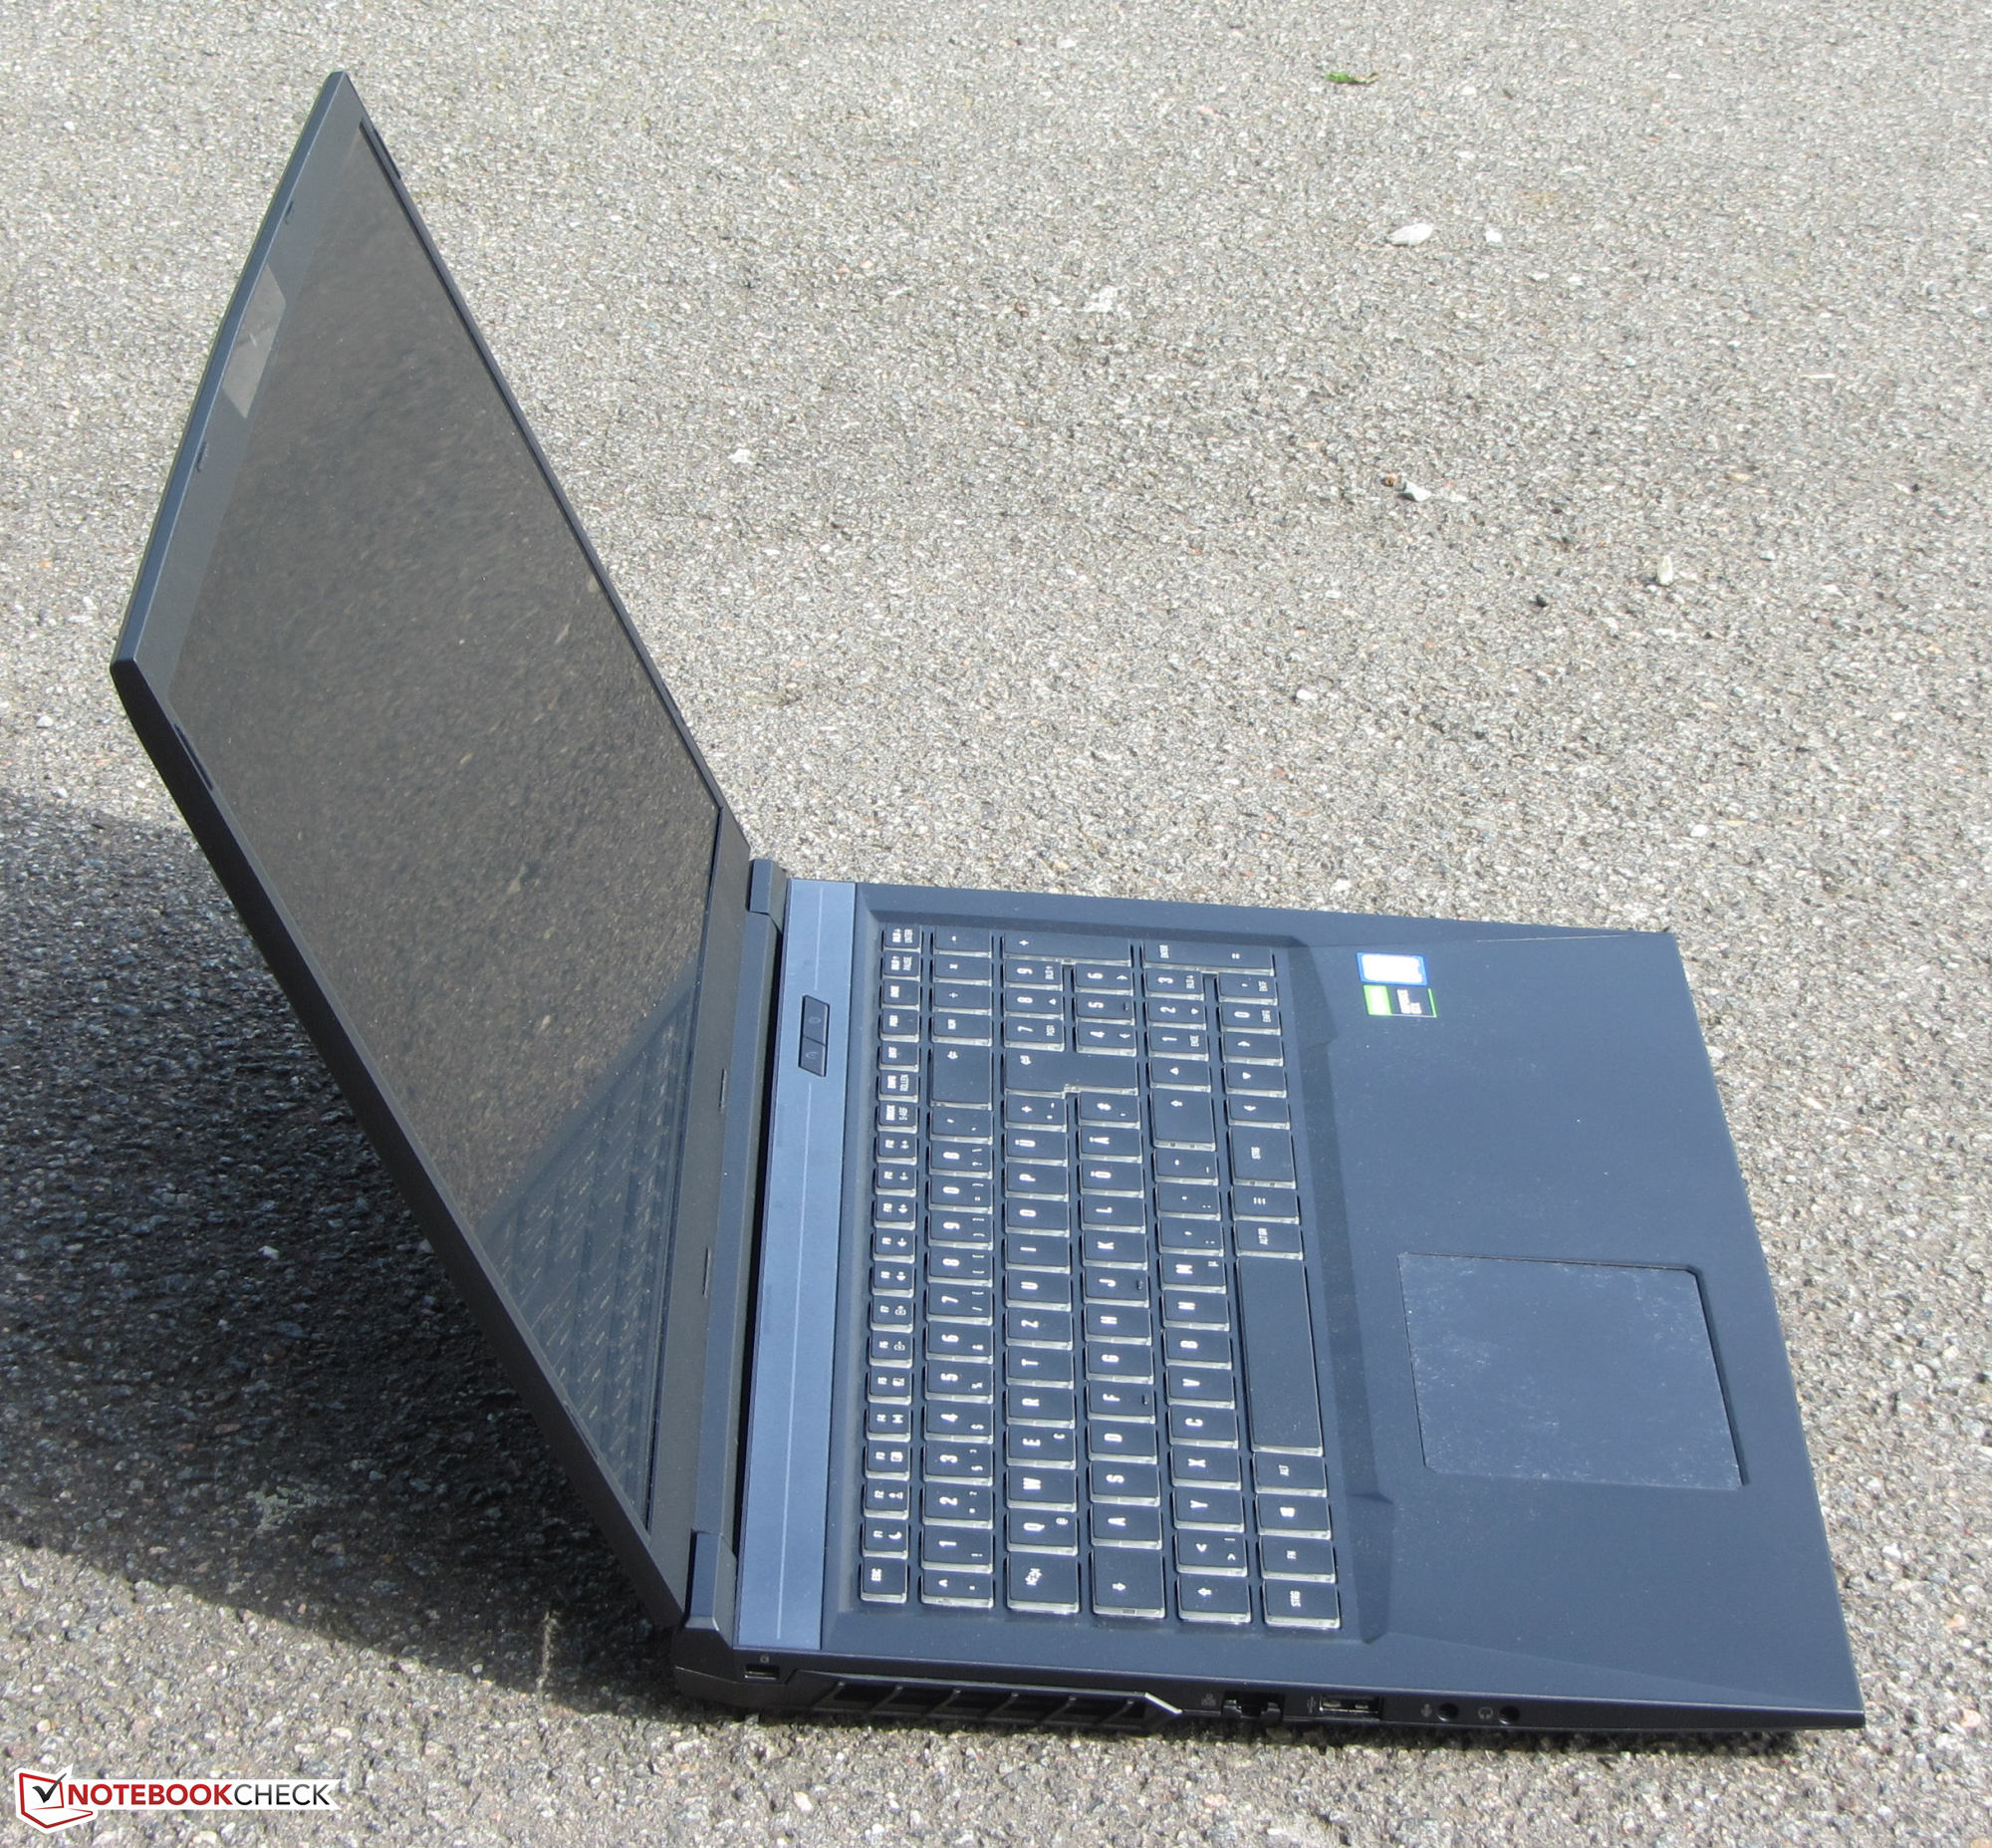
XMG Core 17 visar sig vara en välavrundad spellaptop med ett anspråkslöst yttre.
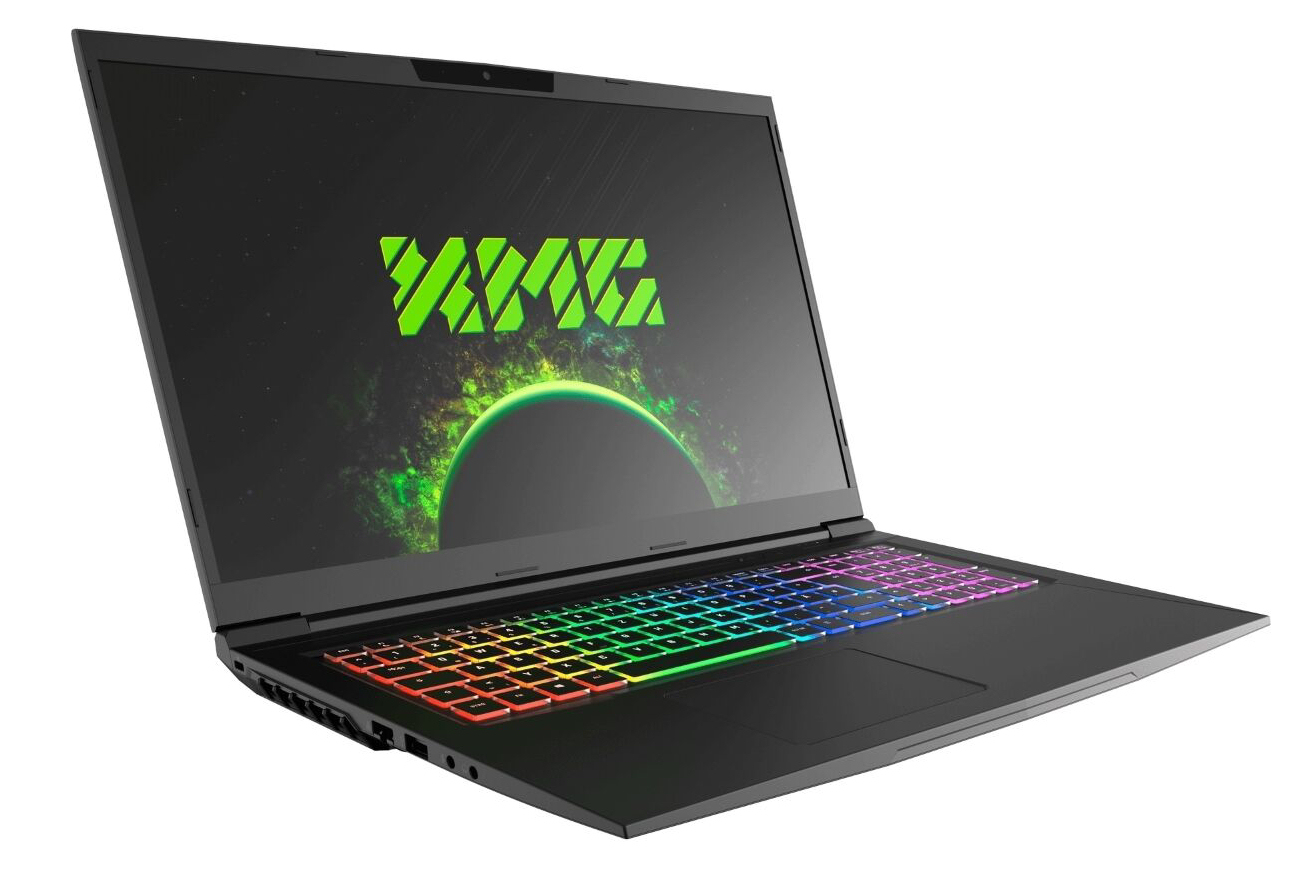
IPS-skärmen med 144 Hz bilduppdatering får poäng för korta responstider, stabila betraktningsvinklar, bra kontrast och riktigt bra färgåtergivning. Skärmens ljusstyrka är okej, men kunde varit bättre för en laptop i det här prisskiktet. Vi får heller inte glömma att nämna den tunna skärminfattningen.
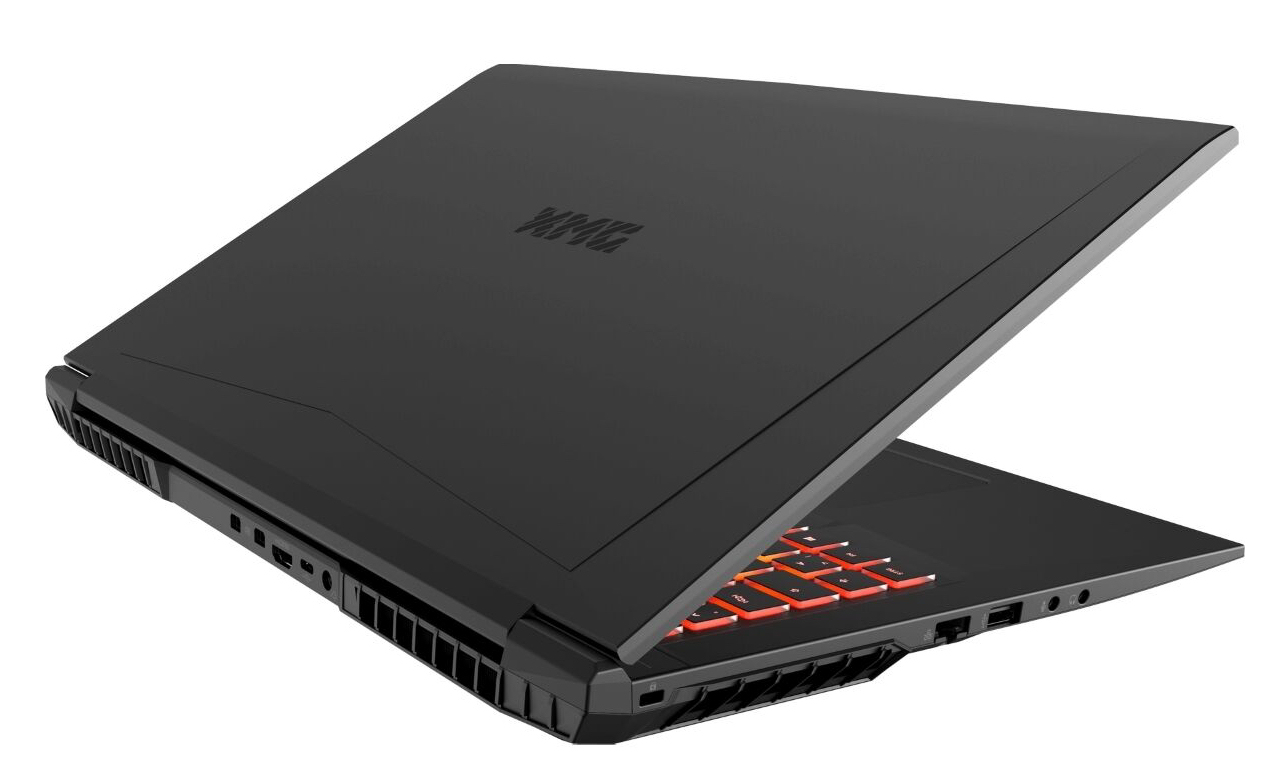
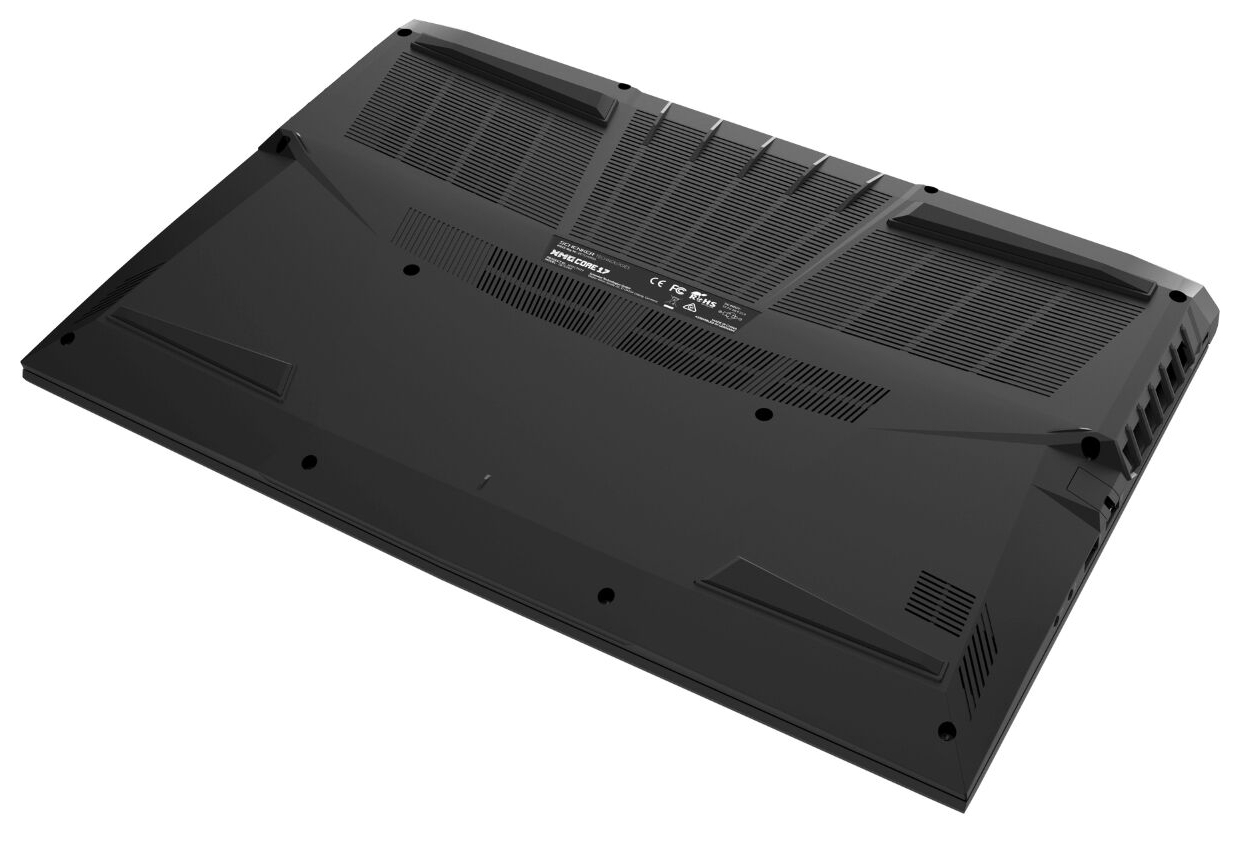
Datorn har plats för två NVMe SSD-enheter i M.2 2280-format som dessutom går att konfigurera i RAID (0 eller 1). Dessutom går det att lägga till en hårddisk på 2.5 tum. Uppgraderingar och underhåll kan utföras utan problem. Efter att du tagit bort bottenhöljet kommer du åt alla komponenterna.
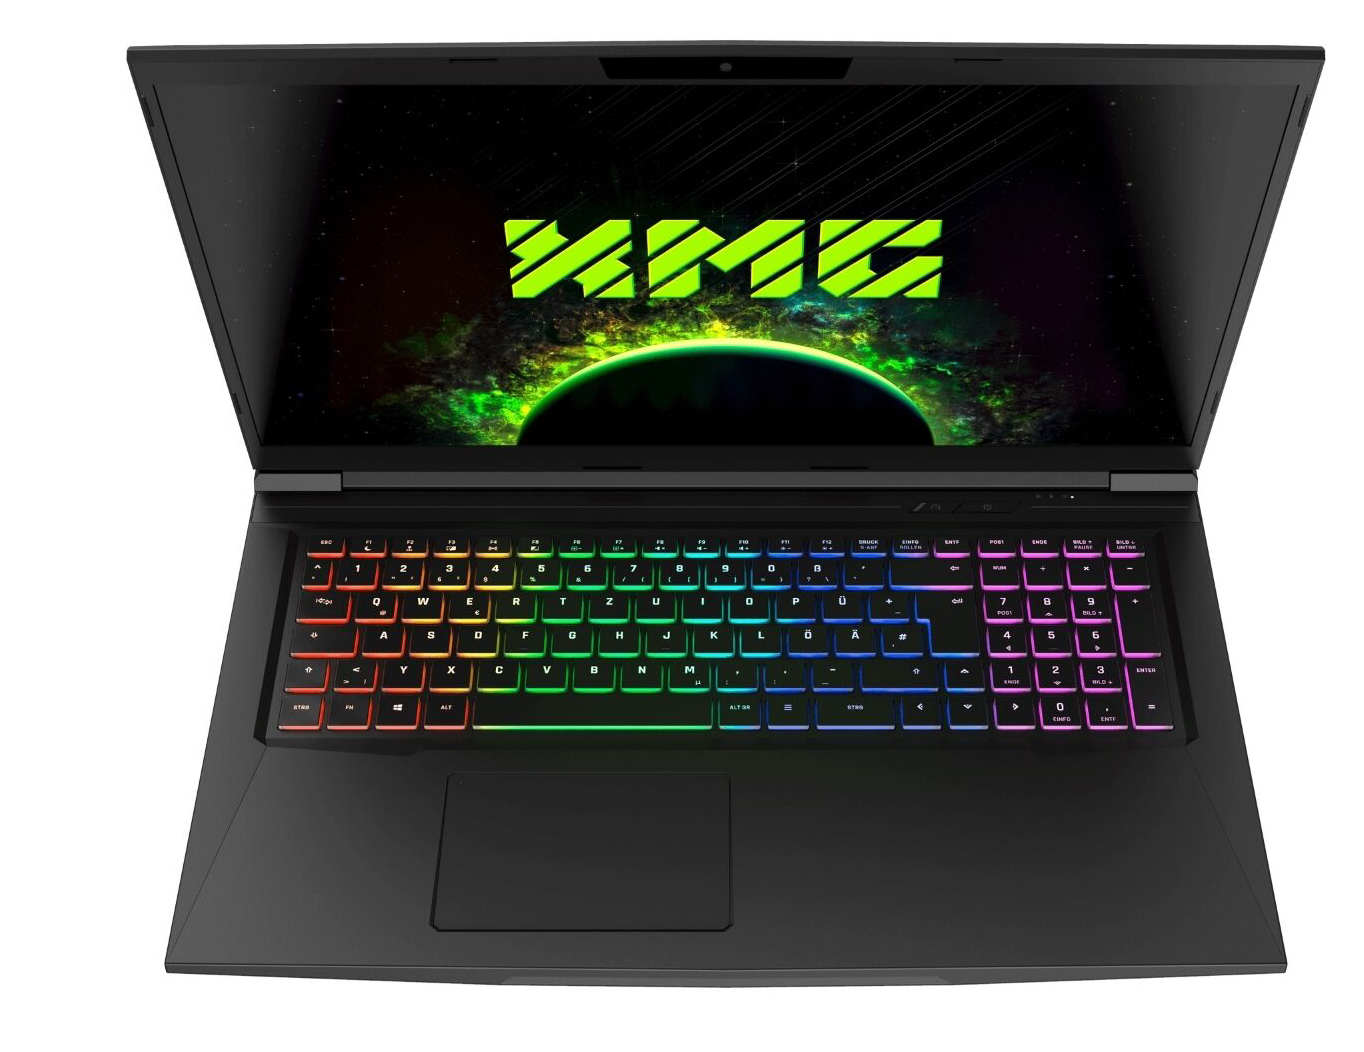
Batteritiden kommer inte göra någon entusiastisk men den är ganska skaplig för en bärbar speldator. Chiclet-tangentbordet (med RGB-belysning) har visat sig vara lämpligt för vardagsuppgifter. Datorn har en ganska stor mängd anslutningsmöjligheter, men vi saknar en Thunderbolt 3-port.
Schenker XMG Core 17
- 07/16/2019 v6 (old)
Sascha Mölck
Price comparison
