Test: HP ZBook Studio G3 Workstation (sammanfattning)
| |||||||||||||||||||||||||
Distribution av ljusstyrkan: 86 %
Mitt på batteriet: 307 cd/m²
Kontrast: 1069:1 (Svärta: 0.29 cd/m²)
ΔE ColorChecker Calman: 5.9 | ∀{0.5-29.43 Ø4.71}
ΔE Greyscale Calman: 5.5 | ∀{0.09-98 Ø4.96}
99.9% sRGB (Calman 2D)
99% sRGB (Argyll 1.6.3 3D)
85% AdobeRGB 1998 (Argyll 1.6.3 3D)
98% AdobeRGB 1998 (Argyll 3D)
98.9% sRGB (Argyll 3D)
86% Display P3 (Argyll 3D)
Gamma: 2.09
CCT: 5980 K
| HP ZBook Studio G3 15.6", 3840x2160, IPS | Dell Precision 5510 15.6", 3840x2160, IGZO LED | MSI WS60-6QJE316H11 15.6", 3840x2160, IPS | Lenovo ThinkPad P50 15.6", 1920x1080, IPS | Lenovo ThinkPad P50s-20FKS00400 15.5", 2880x1620, IPS | HP ZBook 15 G3 15.6", 1920x1080, UWVA-IPS | HP ZBook 15u G3 15.6", 1920x1080, TN LED | Apple MacBook Pro Retina 15 inch 2015-05 15.4", 2880x1800, IPS-Panel | |
|---|---|---|---|---|---|---|---|---|
| Display | 2% | -31% | -51% | -24% | -18% | -34% | -24% | |
| Display P3 Coverage (%) | 86 | 88.4 3% | 55.1 -36% | 39.13 -54% | 63.7 -26% | 66.8 -22% | 53.2 -38% | 61.4 -29% |
| sRGB Coverage (%) | 98.9 | 100 1% | 83 -16% | 58.5 -41% | 87.6 -11% | 95.5 -3% | 80.1 -19% | 90.8 -8% |
| AdobeRGB 1998 Coverage (%) | 98 | 99.5 2% | 56.9 -42% | 40.45 -59% | 63.8 -35% | 69 -30% | 54.9 -44% | 62.9 -36% |
| Response Times | -38% | 10% | -9% | -5% | -38% | -26% | ||
| Response Time Grey 50% / Grey 80% * (ms) | 44 ? | 56.4 ? -28% | 34 ? 23% | 46 ? -5% | 38 ? 14% | 54 ? -23% | 45.6 ? -4% | |
| Response Time Black / White * (ms) | 23.2 ? | 34 ? -47% | 24 ? -3% | 26 ? -12% | 28.8 ? -24% | 35.6 ? -53% | 34.4 ? -48% | |
| PWM Frequency (Hz) | 200 ? | 1316 ? | 219 ? | 198 ? | 198.4 ? | |||
| Screen | 7% | -6% | -10% | -2% | -8% | -48% | 15% | |
| Brightness middle (cd/m²) | 310 | 391 26% | 237 -24% | 263 -15% | 319 3% | 306 -1% | 297.8 -4% | 341 10% |
| Brightness (cd/m²) | 299 | 361 21% | 208 -30% | 236 -21% | 290 -3% | 289 -3% | 284 -5% | 315 5% |
| Brightness Distribution (%) | 86 | 87 1% | 77 -10% | 78 -9% | 82 -5% | 85 -1% | 89 3% | 82 -5% |
| Black Level * (cd/m²) | 0.29 | 0.4 -38% | 0.26 10% | 0.34 -17% | 0.31 -7% | 0.34 -17% | 0.849 -193% | 0.34 -17% |
| Contrast (:1) | 1069 | 978 -9% | 912 -15% | 774 -28% | 1029 -4% | 900 -16% | 351 -67% | 1003 -6% |
| Colorchecker dE 2000 * | 5.9 | 4.85 18% | 4.42 25% | 2.35 60% | 4.8 19% | 5.1 14% | 8.68 -47% | 2.07 65% |
| Colorchecker dE 2000 max. * | 10.7 | 8.54 20% | 7.8 27% | 9.9 7% | 14.98 -40% | 3.27 69% | ||
| Greyscale dE 2000 * | 5.5 | 4.01 27% | 4.43 19% | 3.33 39% | 5.7 -4% | 7.4 -35% | 9.3 -69% | 1.9 65% |
| Gamma | 2.09 105% | 2.18 101% | 2.23 99% | 2.38 92% | 2.07 106% | 2.37 93% | 2.27 97% | 2.62 84% |
| CCT | 5980 109% | 7340 89% | 6133 106% | 6917 94% | 6260 104% | 7263 89% | 10585 61% | 6514 100% |
| Color Space (Percent of AdobeRGB 1998) (%) | 85 | 96 13% | 52.5 -38% | 37 -56% | 56.9 -33% | 63 -26% | 50.99 -40% | 58 -32% |
| Color Space (Percent of sRGB) (%) | 99 | 100 1% | 82.9 -16% | 58 -41% | 87.4 -12% | 95 -4% | 80.42 -19% | 91 -8% |
| Totalt genomsnitt (program/inställningar) | -10% /
-1% | -9% /
-9% | -23% /
-19% | -10% /
-7% | -21% /
-14% | -36% /
-42% | -5% /
6% |
* ... mindre är bättre
Visa svarstider
| ↔ Svarstid svart till vitt | ||
|---|---|---|
| 23.2 ms ... stiga ↗ och falla ↘ kombinerat | ↗ 6 ms stiga | 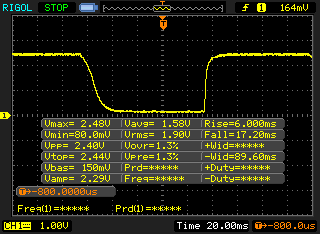 |
| ↘ 17.2 ms hösten | ||
| Skärmen visar bra svarsfrekvens i våra tester, men kan vara för långsam för konkurrenskraftiga spelare. I jämförelse sträcker sig alla testade enheter från 0.1 (minst) till 240 (maximalt) ms. » 53 % av alla enheter är bättre. Detta innebär att den uppmätta svarstiden är sämre än genomsnittet av alla testade enheter (19.8 ms). | ||
| ↔ Svarstid 50 % grått till 80 % grått | ||
| 44 ms ... stiga ↗ och falla ↘ kombinerat | ↗ 17 ms stiga | 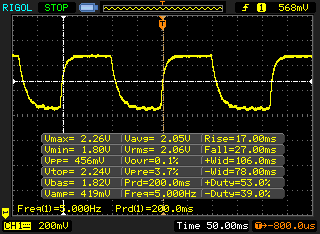 |
| ↘ 27 ms hösten | ||
| Skärmen visar långsamma svarsfrekvenser i våra tester och kommer att vara otillfredsställande för spelare. I jämförelse sträcker sig alla testade enheter från 0.165 (minst) till 636 (maximalt) ms. » 73 % av alla enheter är bättre. Detta innebär att den uppmätta svarstiden är sämre än genomsnittet av alla testade enheter (31 ms). | ||
Skärmflimmer / PWM (Puls-Width Modulation)
| Skärmflimmer / PWM upptäckt | 200 Hz | ≤ 55 % ljusstyrka inställning | 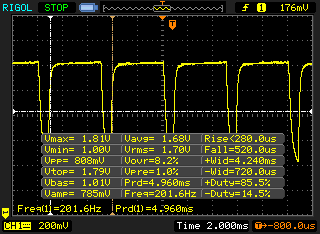 |
Displayens bakgrundsbelysning flimrar vid 200 Hz (i värsta fall, t.ex. med PWM) Flimrande upptäckt vid en ljusstyrkeinställning på 55 % och lägre. Det ska inte finnas något flimmer eller PWM över denna ljusstyrkeinställning. Frekvensen för 200 Hz är relativt låg, så känsliga användare kommer sannolikt att märka flimmer och uppleva ansträngda ögon vid den angivna ljusstyrkeinställningen och nedan. Som jämförelse: 52 % av alla testade enheter använder inte PWM för att dämpa skärmen. Om PWM upptäcktes mättes ett medelvärde av 7754 (minst: 5 - maximum: 343500) Hz. | |||

| Cinebench R10 | |
| Rendering Multiple CPUs 32Bit | |
| HP ZBook 15 G3 | |
| Dell Precision 5510 | |
| HP ZBook Studio G3 | |
| MSI WS60-6QJE316H11 | |
| Apple MacBook Pro Retina 15 inch 2015-05 | |
| Lenovo ThinkPad P50 | |
| HP ZBook 15u G3 | |
| Lenovo ThinkPad P50s-20FKS00400 | |
| Rendering Single 32Bit | |
| MSI WS60-6QJE316H11 | |
| HP ZBook 15 G3 | |
| HP ZBook Studio G3 | |
| HP ZBook 15u G3 | |
| Dell Precision 5510 | |
| Apple MacBook Pro Retina 15 inch 2015-05 | |
| Lenovo ThinkPad P50s-20FKS00400 | |
| Lenovo ThinkPad P50 | |
| Rendering Multiple CPUs 64Bit | |
| HP ZBook 15 G3 | |
| Dell Precision 5510 | |
| HP ZBook Studio G3 | |
| Apple MacBook Pro Retina 15 inch 2015-05 | |
| MSI WS60-6QJE316H11 | |
| Lenovo ThinkPad P50 | |
| Lenovo ThinkPad P50s-20FKS00400 | |
| Rendering Single CPUs 64Bit | |
| MSI WS60-6QJE316H11 | |
| HP ZBook 15 G3 | |
| Apple MacBook Pro Retina 15 inch 2015-05 | |
| HP ZBook Studio G3 | |
| Dell Precision 5510 | |
| Lenovo ThinkPad P50s-20FKS00400 | |
| Lenovo ThinkPad P50 | |
| PCMark 8 | |
| Work Score Accelerated v2 | |
| HP ZBook 15 G3 | |
| Dell Precision 5510 | |
| HP ZBook 15u G3 | |
| Lenovo ThinkPad P50 | |
| Apple MacBook Pro Retina 15 inch 2015-05 | |
| HP ZBook Studio G3 | |
| MSI WS60-6QJE316H11 | |
| Lenovo ThinkPad P50s-20FKS00400 | |
| Creative Score Accelerated v2 | |
| Apple MacBook Pro Retina 15 inch 2015-05 | |
| HP ZBook 15u G3 | |
| Dell Precision 5510 | |
| HP ZBook 15 G3 | |
| HP ZBook Studio G3 | |
| Home Score Accelerated v2 | |
| Lenovo ThinkPad P50 | |
| HP ZBook 15u G3 | |
| HP ZBook 15 G3 | |
| Dell Precision 5510 | |
| Apple MacBook Pro Retina 15 inch 2015-05 | |
| HP ZBook Studio G3 | |
| MSI WS60-6QJE316H11 | |
| Lenovo ThinkPad P50s-20FKS00400 | |
| PCMark 7 - Score | |
| HP ZBook 15 G3 | |
| HP ZBook 15u G3 | |
| Apple MacBook Pro Retina 15 inch 2015-05 | |
| MSI WS60-6QJE316H11 | |
| HP ZBook Studio G3 | |
| Dell Precision 5510 | |
| Lenovo ThinkPad P50s-20FKS00400 | |
| Lenovo ThinkPad P50 | |
| PCMark 7 Score | 5336 poäng | |
| PCMark 8 Home Score Accelerated v2 | 3262 poäng | |
| PCMark 8 Creative Score Accelerated v2 | 4235 poäng | |
| PCMark 8 Work Score Accelerated v2 | 4301 poäng | |
Hjälp | ||

| LuxMark v2.0 64Bit | |
| Room GPUs-only | |
| HP ZBook 15 G3 | |
| MSI WS60-6QJE316H11 | |
| HP ZBook Studio G3 | |
| Lenovo ThinkPad P50 | |
| Dell Precision 5510 | |
| Apple MacBook Pro Retina 15 inch 2015-05 | |
| Lenovo ThinkPad P50s-20FKS00400 | |
| Sala GPUs-only | |
| HP ZBook 15 G3 | |
| HP ZBook Studio G3 | |
| MSI WS60-6QJE316H11 | |
| Lenovo ThinkPad P50 | |
| HP ZBook 15u G3 | |
| Lenovo ThinkPad P50s-20FKS00400 | |
| Dell Precision 5510 | |
| Apple MacBook Pro Retina 15 inch 2015-05 | |
| SiSoft Sandra 2016 | |
| Image Processing | |
| HP ZBook 15 G3 | |
| HP ZBook Studio G3 | |
| MSI WS60-6QJE316H11 | |
| Lenovo ThinkPad P50 | |
| Dell Precision 5510 | |
| Lenovo ThinkPad P50s-20FKS00400 | |
| GP Cryptography (Higher Security AES256+SHA2-512) | |
| Lenovo ThinkPad P50 | |
| HP ZBook 15 G3 | |
| MSI WS60-6QJE316H11 | |
| HP ZBook Studio G3 | |
| Dell Precision 5510 | |
| Lenovo ThinkPad P50s-20FKS00400 | |
| GP Financial Analysis (FP High/Double Precision) | |
| HP ZBook 15 G3 | |
| Lenovo ThinkPad P50 | |
| MSI WS60-6QJE316H11 | |
| Dell Precision 5510 | |
| HP ZBook Studio G3 | |
| Lenovo ThinkPad P50s-20FKS00400 | |
| Unigine Heaven 3.0 | |
| 1920x1080 DX 11, Normal Tessellation, High Shaders AA:Off AF:Off | |
| MSI WS60-6QJE316H11 | |
| Lenovo ThinkPad P50 | |
| HP ZBook 15 G3 | |
| Dell Precision 5510 | |
| HP ZBook Studio G3 | |
| Lenovo ThinkPad P50s-20FKS00400 | |
| 1920x1080 OpenGL, Normal Tessellation, High Shaders AA:Off AF:Off | |
| HP ZBook 15 G3 | |
| HP ZBook Studio G3 | |
| Dell Precision 5510 | |
| MSI WS60-6QJE316H11 | |
| Lenovo ThinkPad P50 | |
| Lenovo ThinkPad P50s-20FKS00400 | |
| Unigine Valley 1.0 | |
| 1920x1080 Extreme HD DirectX AA:x8 | |
| Lenovo ThinkPad P50 | |
| HP ZBook 15 G3 | |
| MSI WS60-6QJE316H11 | |
| HP ZBook Studio G3 | |
| Dell Precision 5510 | |
| Lenovo ThinkPad P50s-20FKS00400 | |
| 1920x1080 Extreme HD Preset OpenGL AA:x8 | |
| HP ZBook 15 G3 | |
| HP ZBook Studio G3 | |
| Dell Precision 5510 | |
| MSI WS60-6QJE316H11 | |
| Lenovo ThinkPad P50 | |
| Lenovo ThinkPad P50s-20FKS00400 | |
| 3DMark | |
| 1920x1080 Fire Strike Score | |
| Asus G501VW-FY081T | |
| MSI WS60-6QJE316H11 | |
| HP ZBook 15 G3 | |
| Lenovo ThinkPad P50 | |
| Dell Precision 5510 | |
| HP ZBook Studio G3 | |
| Asus N752VX-GC131T | |
| Apple MacBook Pro Retina 15 inch 2015-05 | |
| HP ZBook 15u G3 | |
| Lenovo ThinkPad P50s-20FKS00400 | |
| 1920x1080 Fire Strike Graphics | |
| Asus G501VW-FY081T | |
| MSI WS60-6QJE316H11 | |
| Lenovo ThinkPad P50 | |
| HP ZBook 15 G3 | |
| Dell Precision 5510 | |
| HP ZBook Studio G3 | |
| Asus N752VX-GC131T | |
| Apple MacBook Pro Retina 15 inch 2015-05 | |
| Lenovo ThinkPad P50s-20FKS00400 | |
| HP ZBook 15u G3 | |
| 3DMark 06 Standard Score | 24393 poäng | |
| 3DMark 11 Performance | 4673 poäng | |
| 3DMark Ice Storm Standard Score | 42096 poäng | |
| 3DMark Cloud Gate Standard Score | 15717 poäng | |
| 3DMark Fire Strike Score | 3302 poäng | |
Hjälp | ||
| låg | med. | hög | ultra | 4K | |
|---|---|---|---|---|---|
| BioShock Infinite (2013) | 176.7 | 115 | 100.1 | 37 | |
| The Witcher 3 (2015) | 59.4 | 36.5 | 20.8 | 10.8 | 7.7 |
| Rainbow Six Siege (2015) | 137.8 | 79.9 | 43.5 | 32 | 13.2 |
Ljudnivå
| Låg belastning |
| 30 / 30 / 30 dB(A) |
| Hög belastning |
| 51 / 52.8 dB(A) |
 | ||
30 dB tyst 40 dB(A) hörbar 50 dB(A) högt ljud |
||
min: | ||
| HP ZBook Studio G3 6820HQ, Quadro M1000M | Dell Precision 5510 E3-1505M v5, Quadro M1000M | MSI WS60-6QJE316H11 E3-1505M v5, Quadro M2000M | Lenovo ThinkPad P50 6820HQ, Quadro M2000M | Lenovo ThinkPad P50s-20FKS00400 6500U, Quadro M500M | HP ZBook 15 G3 E3-1505M v5, Quadro M2000M | HP ZBook 15u G3 6600U, FirePro W4190M | Apple MacBook Pro Retina 15 inch 2015-05 4870HQ, Radeon R9 M370X | |
|---|---|---|---|---|---|---|---|---|
| Noise | 6% | -10% | 10% | 11% | 3% | 9% | 7% | |
| av / miljö * (dB) | 30 | 30 -0% | ||||||
| Idle Minimum * (dB) | 30 | 30 -0% | 37.2 -24% | 30 -0% | 30 -0% | 30 -0% | 29.8 1% | 28.9 4% |
| Idle Average * (dB) | 30 | 30 -0% | 37.2 -24% | 30 -0% | 30 -0% | 30 -0% | 29.8 1% | 28.9 4% |
| Idle Maximum * (dB) | 30 | 30 -0% | 37.2 -24% | 30 -0% | 30 -0% | 30 -0% | 29.8 1% | 28.9 4% |
| Load Average * (dB) | 51 | 42.08 17% | 42.1 17% | 34.5 32% | 33.5 34% | 45.3 11% | 39.5 23% | 46 10% |
| Load Maximum * (dB) | 52.8 | 46.78 11% | 50.7 4% | 42.1 20% | 41.9 21% | 49.7 6% | 43.2 18% | 46 13% |
* ... mindre är bättre
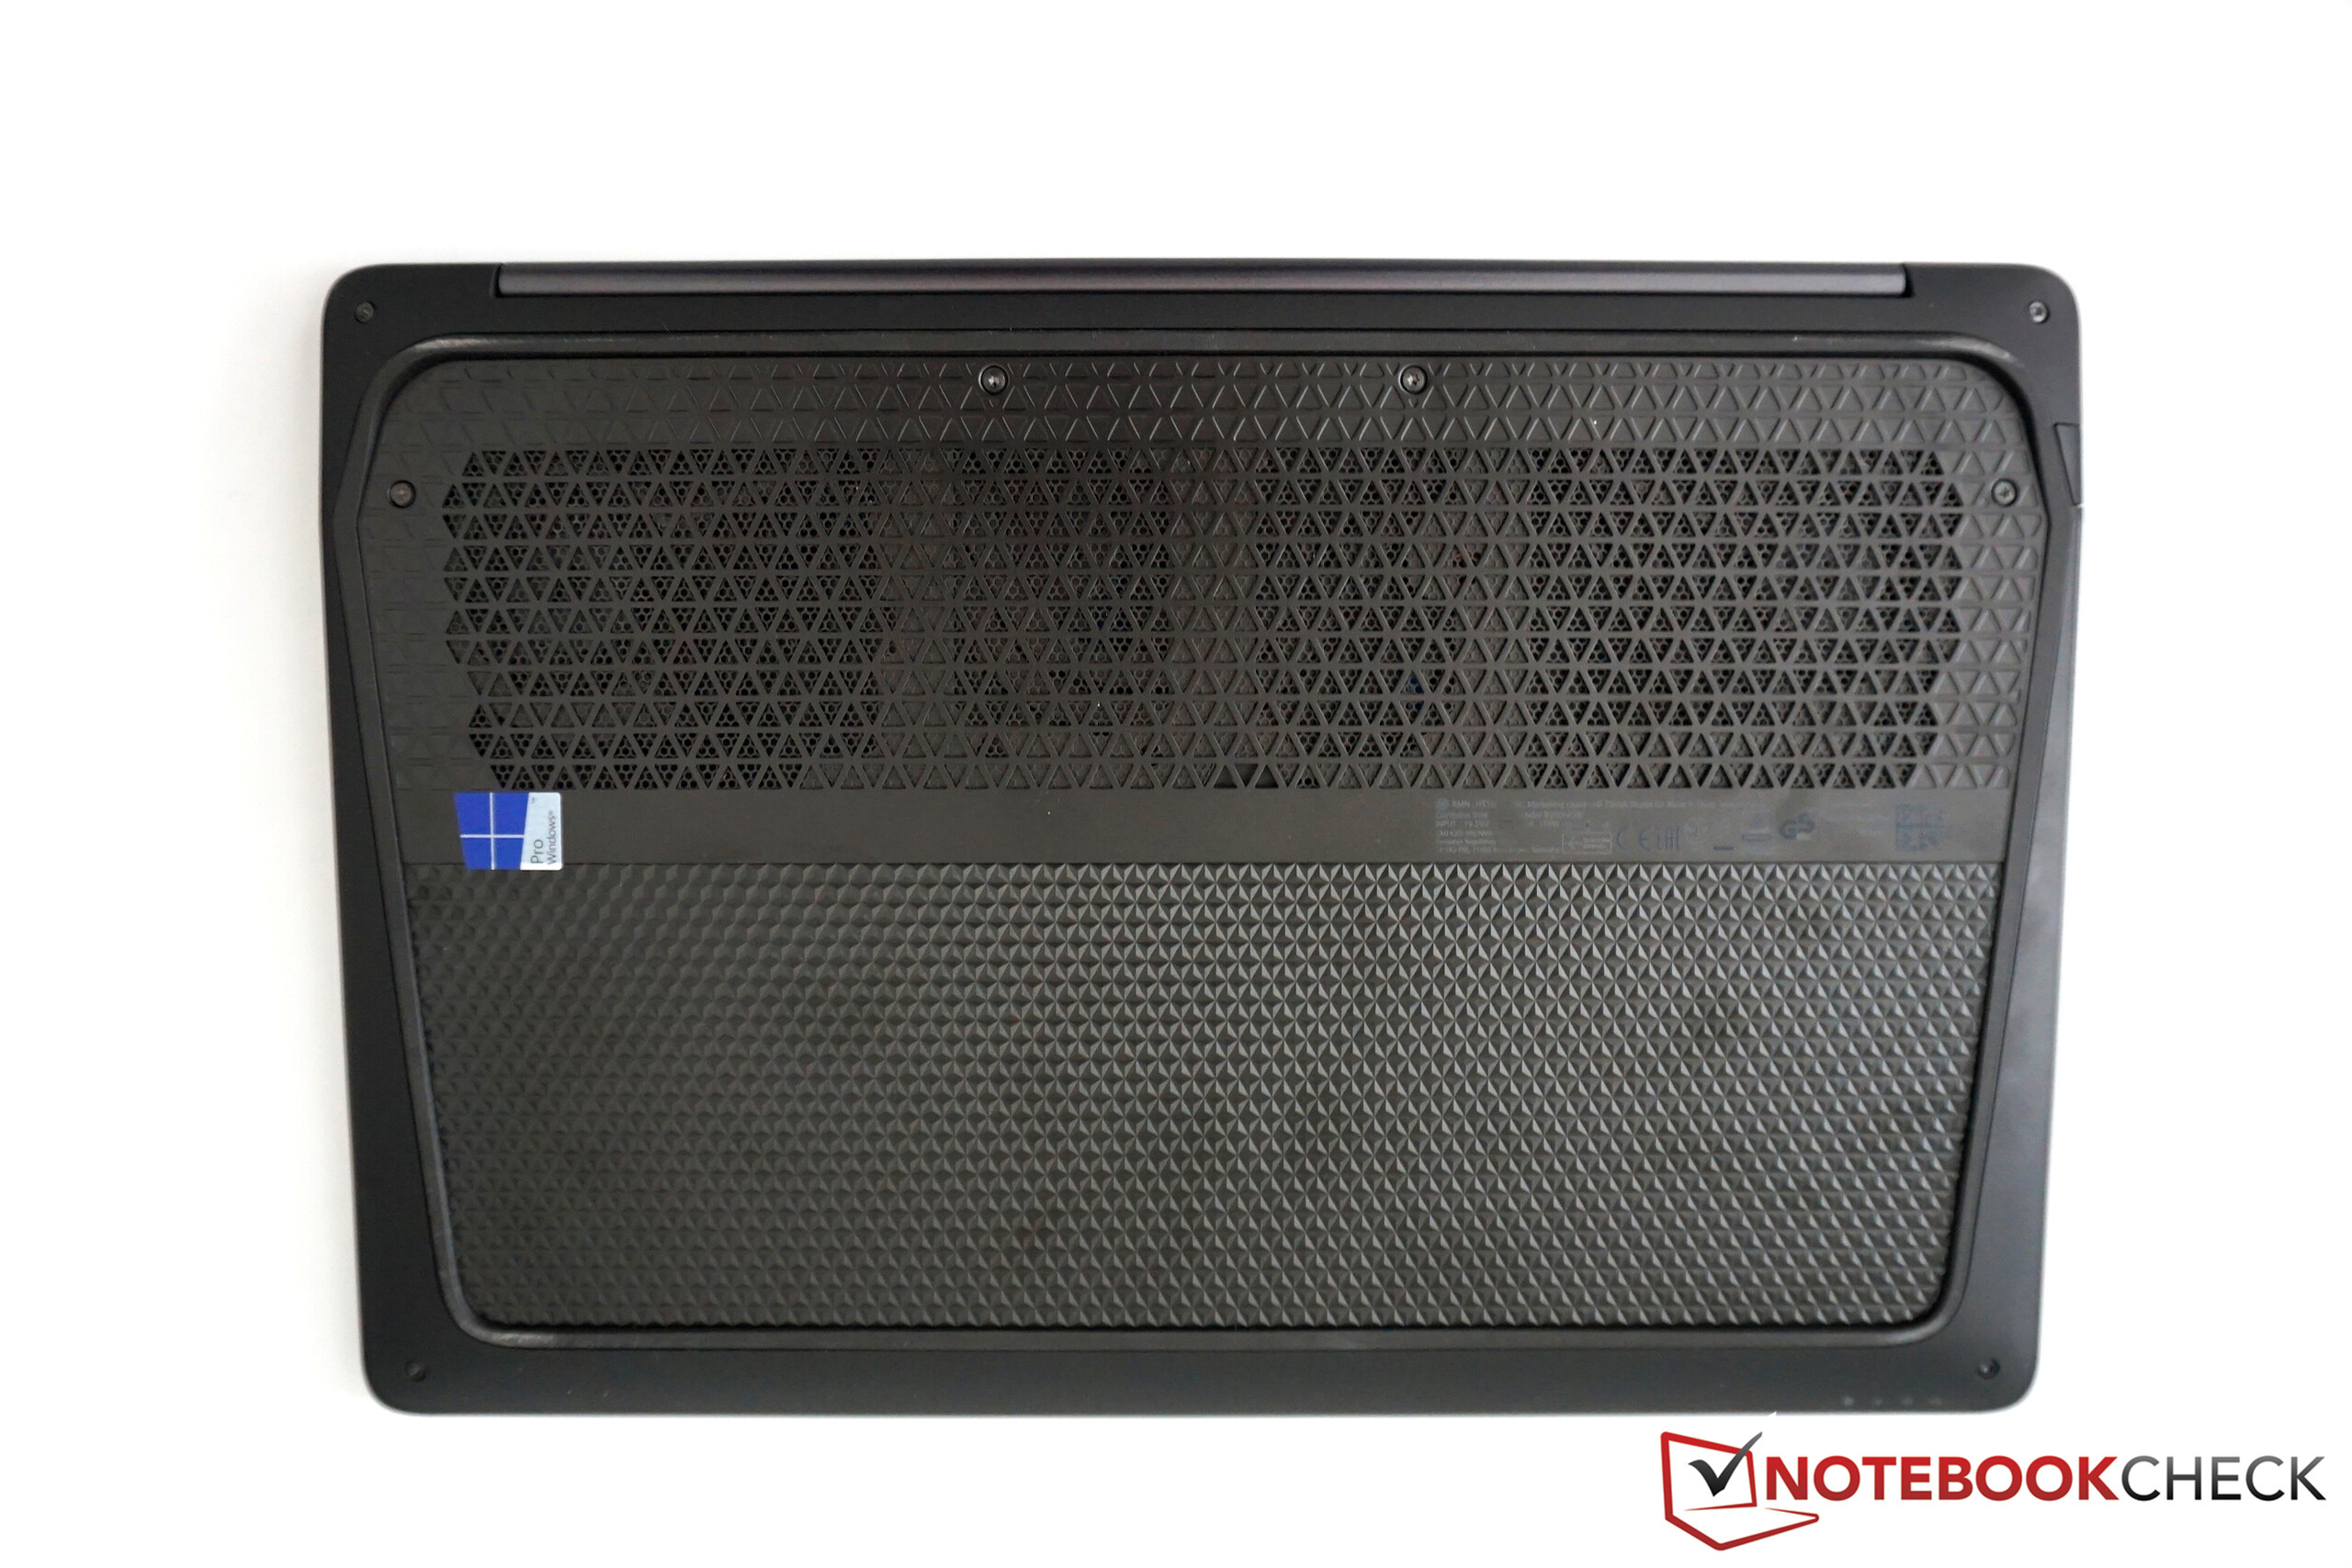
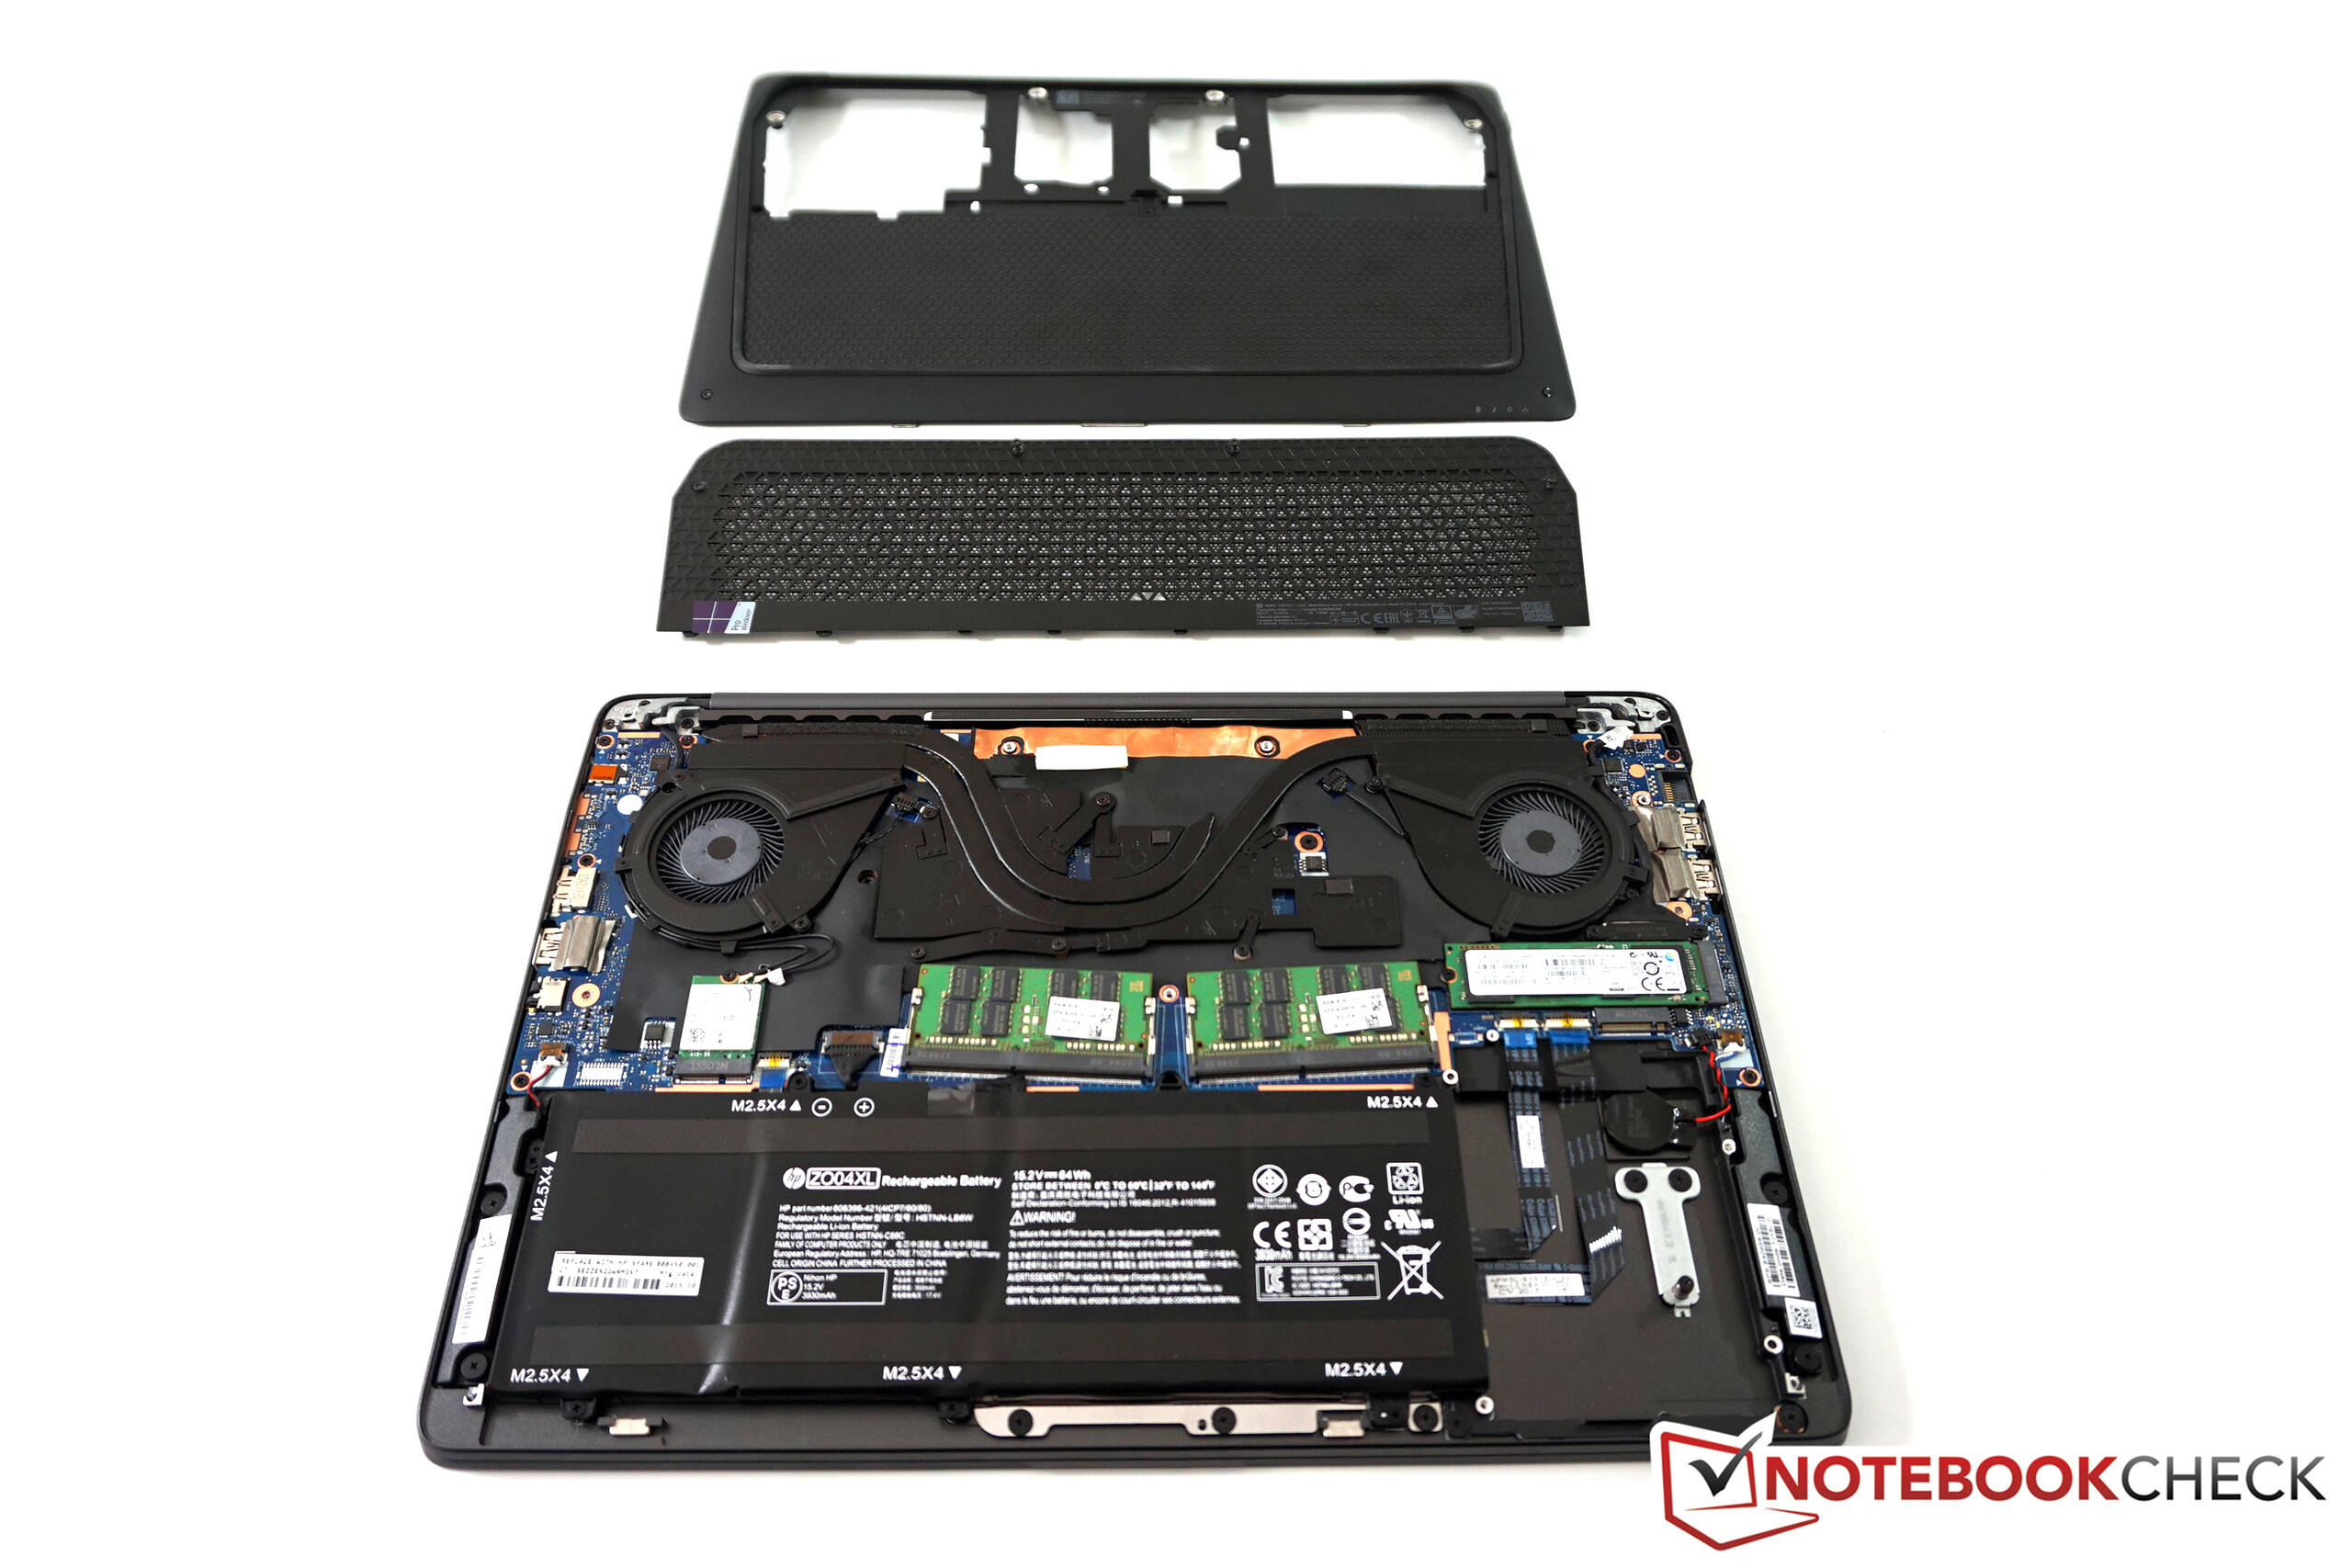
(-) Den maximala temperaturen på ovansidan är 69.8 °C / 158 F, jämfört med genomsnittet av 38.2 °C / 101 F , allt från 22.2 till 69.8 °C för klassen Workstation.
(-) Botten värms upp till maximalt 77.3 °C / 171 F, jämfört med genomsnittet av 41.1 °C / 106 F
(+) Vid tomgångsbruk är medeltemperaturen för ovansidan 30.1 °C / 86 F, jämfört med enhetsgenomsnittet på 32 °C / ### class_avg_f### F.
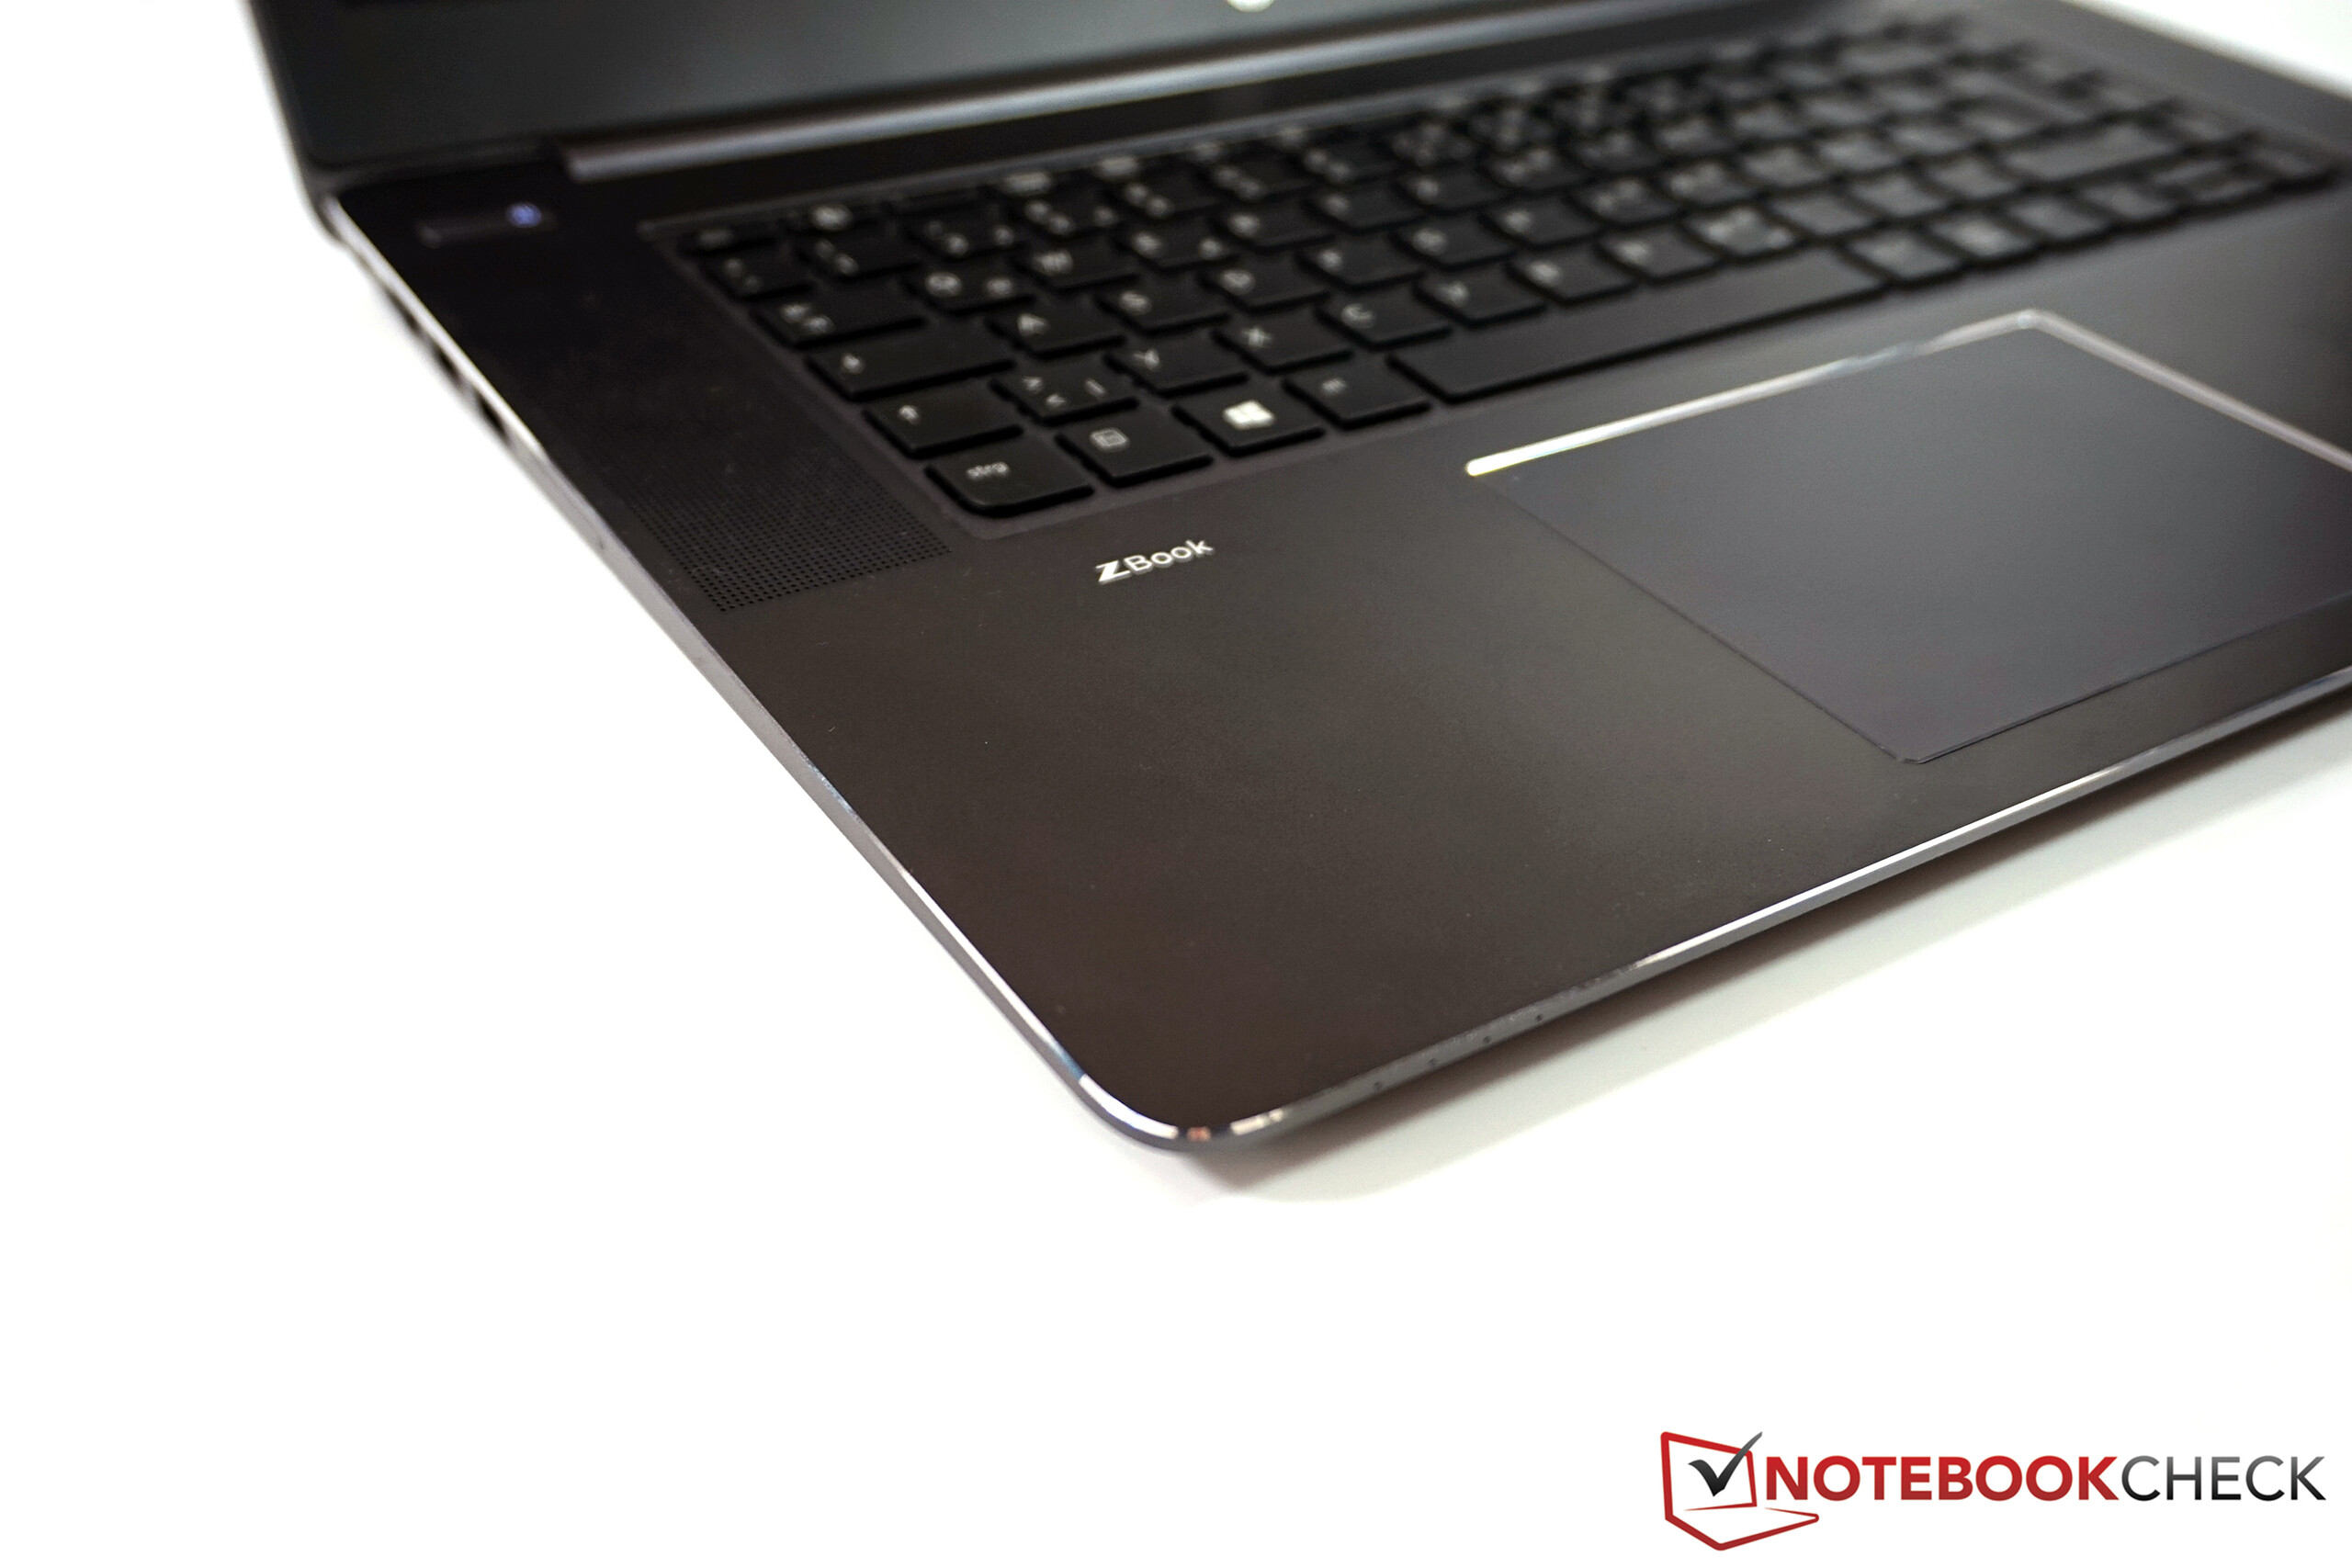
(±) Handledsstöden och pekplattan kan bli väldigt varma vid beröring med maximalt 38 °C / 100.4 F.
(-) Medeltemperaturen för handledsstödsområdet på liknande enheter var 27.8 °C / 82 F (-10.2 °C / -18.4 F).
| HP ZBook Studio G3 6820HQ, Quadro M1000M | Dell Precision 5510 E3-1505M v5, Quadro M1000M | MSI WS60-6QJE316H11 E3-1505M v5, Quadro M2000M | Lenovo ThinkPad P50 6820HQ, Quadro M2000M | Lenovo ThinkPad P50s-20FKS00400 6500U, Quadro M500M | HP ZBook 15 G3 E3-1505M v5, Quadro M2000M | HP ZBook 15u G3 6600U, FirePro W4190M | Apple MacBook Pro Retina 15 inch 2015-05 4870HQ, Radeon R9 M370X | |
|---|---|---|---|---|---|---|---|---|
| Heat | 22% | 17% | 24% | 26% | 16% | 30% | 29% | |
| Maximum Upper Side * (°C) | 69.8 | 45.8 34% | 42.3 39% | 36.7 47% | 44.2 37% | 54.6 22% | 44.6 36% | 43.2 38% |
| Maximum Bottom * (°C) | 77.3 | 46.7 40% | 60.1 22% | 41.3 47% | 57.8 25% | 60.8 21% | 46 40% | 39 50% |
| Idle Upper Side * (°C) | 37.8 | 31.2 17% | 32.7 13% | 31.1 18% | 26.4 30% | 30.3 20% | 25.8 32% | 30 21% |
| Idle Bottom * (°C) | 31.4 | 31.9 -2% | 33.1 -5% | 36.2 -15% | 28.1 11% | 30.7 2% | 27.4 13% | 29.3 7% |
* ... mindre är bättre
| Av/Standby | |
| Låg belastning | |
| Hög belastning |
|
Förklaring:
min: | |
| HP ZBook Studio G3 64 Wh, 3840x2160 | Dell Precision 5510 56 Wh, 3840x2160 | MSI WS60-6QJE316H11 47 Wh, 3840x2160 | Lenovo ThinkPad P50 90 Wh, 1920x1080 | Lenovo ThinkPad P50s-20FKS00400 67 Wh, 2880x1620 | HP ZBook 15 G3 90 Wh, 1920x1080 | HP ZBook 15u G3 90 Wh, 1920x1080 | Apple MacBook Pro Retina 15 inch 2015-05 100 Wh, 2880x1800 | |
|---|---|---|---|---|---|---|---|---|
| Power Consumption | -5% | -71% | 25% | 43% | 11% | 42% | 16% | |
| Idle Minimum * (Watt) | 8.7 | 8.6 1% | 18.8 -116% | 5.6 36% | 4.3 51% | 5.7 34% | 4.3 51% | 6 31% |
| Idle Average * (Watt) | 14.2 | 16.2 -14% | 29.6 -108% | 8.6 39% | 9.7 32% | 12.2 14% | 7.9 44% | 12.8 10% |
| Idle Maximum * (Watt) | 14.4 | 16.7 -16% | 30.3 -110% | 9.3 35% | 10.2 29% | 12.6 12% | 11.5 20% | 13.3 8% |
| Load Average * (Watt) | 85.6 | 82.6 4% | 90.4 -6% | 89.5 -5% | 45.7 47% | 83.1 3% | 43.3 49% | 82.4 4% |
| Load Maximum * (Watt) | 129.7 | 131.8 -2% | 150.2 -16% | 105 19% | 55.8 57% | 138.2 -7% | 72.3 44% | 91.8 29% |
* ... mindre är bättre
| HP ZBook Studio G3 64 Wh | Dell Precision 5510 56 Wh | MSI WS60-6QJE316H11 47 Wh | Lenovo ThinkPad P50 90 Wh | Lenovo ThinkPad P50s-20FKS00400 67 Wh | HP ZBook 15 G3 90 Wh | HP ZBook 15u G3 90 Wh | Apple MacBook Pro Retina 15 inch 2015-05 100 Wh | |
|---|---|---|---|---|---|---|---|---|
| Batteridrifttid | 18% | -43% | 103% | 112% | 76% | 72% | 89% | |
| Reader / Idle (h) | 8.5 | 7.1 -16% | 2.7 -68% | 14.3 68% | 18.5 118% | 13.7 61% | 12.6 48% | 17.3 104% |
| H.264 (h) | 3.8 | 3.3 -13% | 2.4 -37% | 8.9 134% | 9 137% | 7.5 97% | 6.9 82% | |
| WiFi v1.3 (h) | 3.5 | 4.8 37% | 1.8 -49% | 8.3 137% | 6.8 94% | 6.4 83% | 5.2 49% | 7.2 106% |
| Load (h) | 1.1 | 1.8 64% | 0.9 -18% | 1.9 73% | 2.2 100% | 1.8 64% | 2.4 118% | 1.8 64% |
| WiFi (h) | 5 |
För
Emot
Läs en längre version av testet på engelska här.
ZBook Studio G3 är något av en gåta för oss. HP har gjort en bra produkt i vissa avseenden, medan den sviker i andra kategorier. Tyvärr överväger de negativa intrycken – främst på grund av temperaturerna och batteritiden.
Ytorna når oroväckande höga temperaturer som möjligen kan orsaka brännskador, även vid normal arbetsbelastning. Fläktens beteende är också mycket irriterande, eftersom båda fläktarna agerar självständigt, är högljudda och pulserar kraftigt.
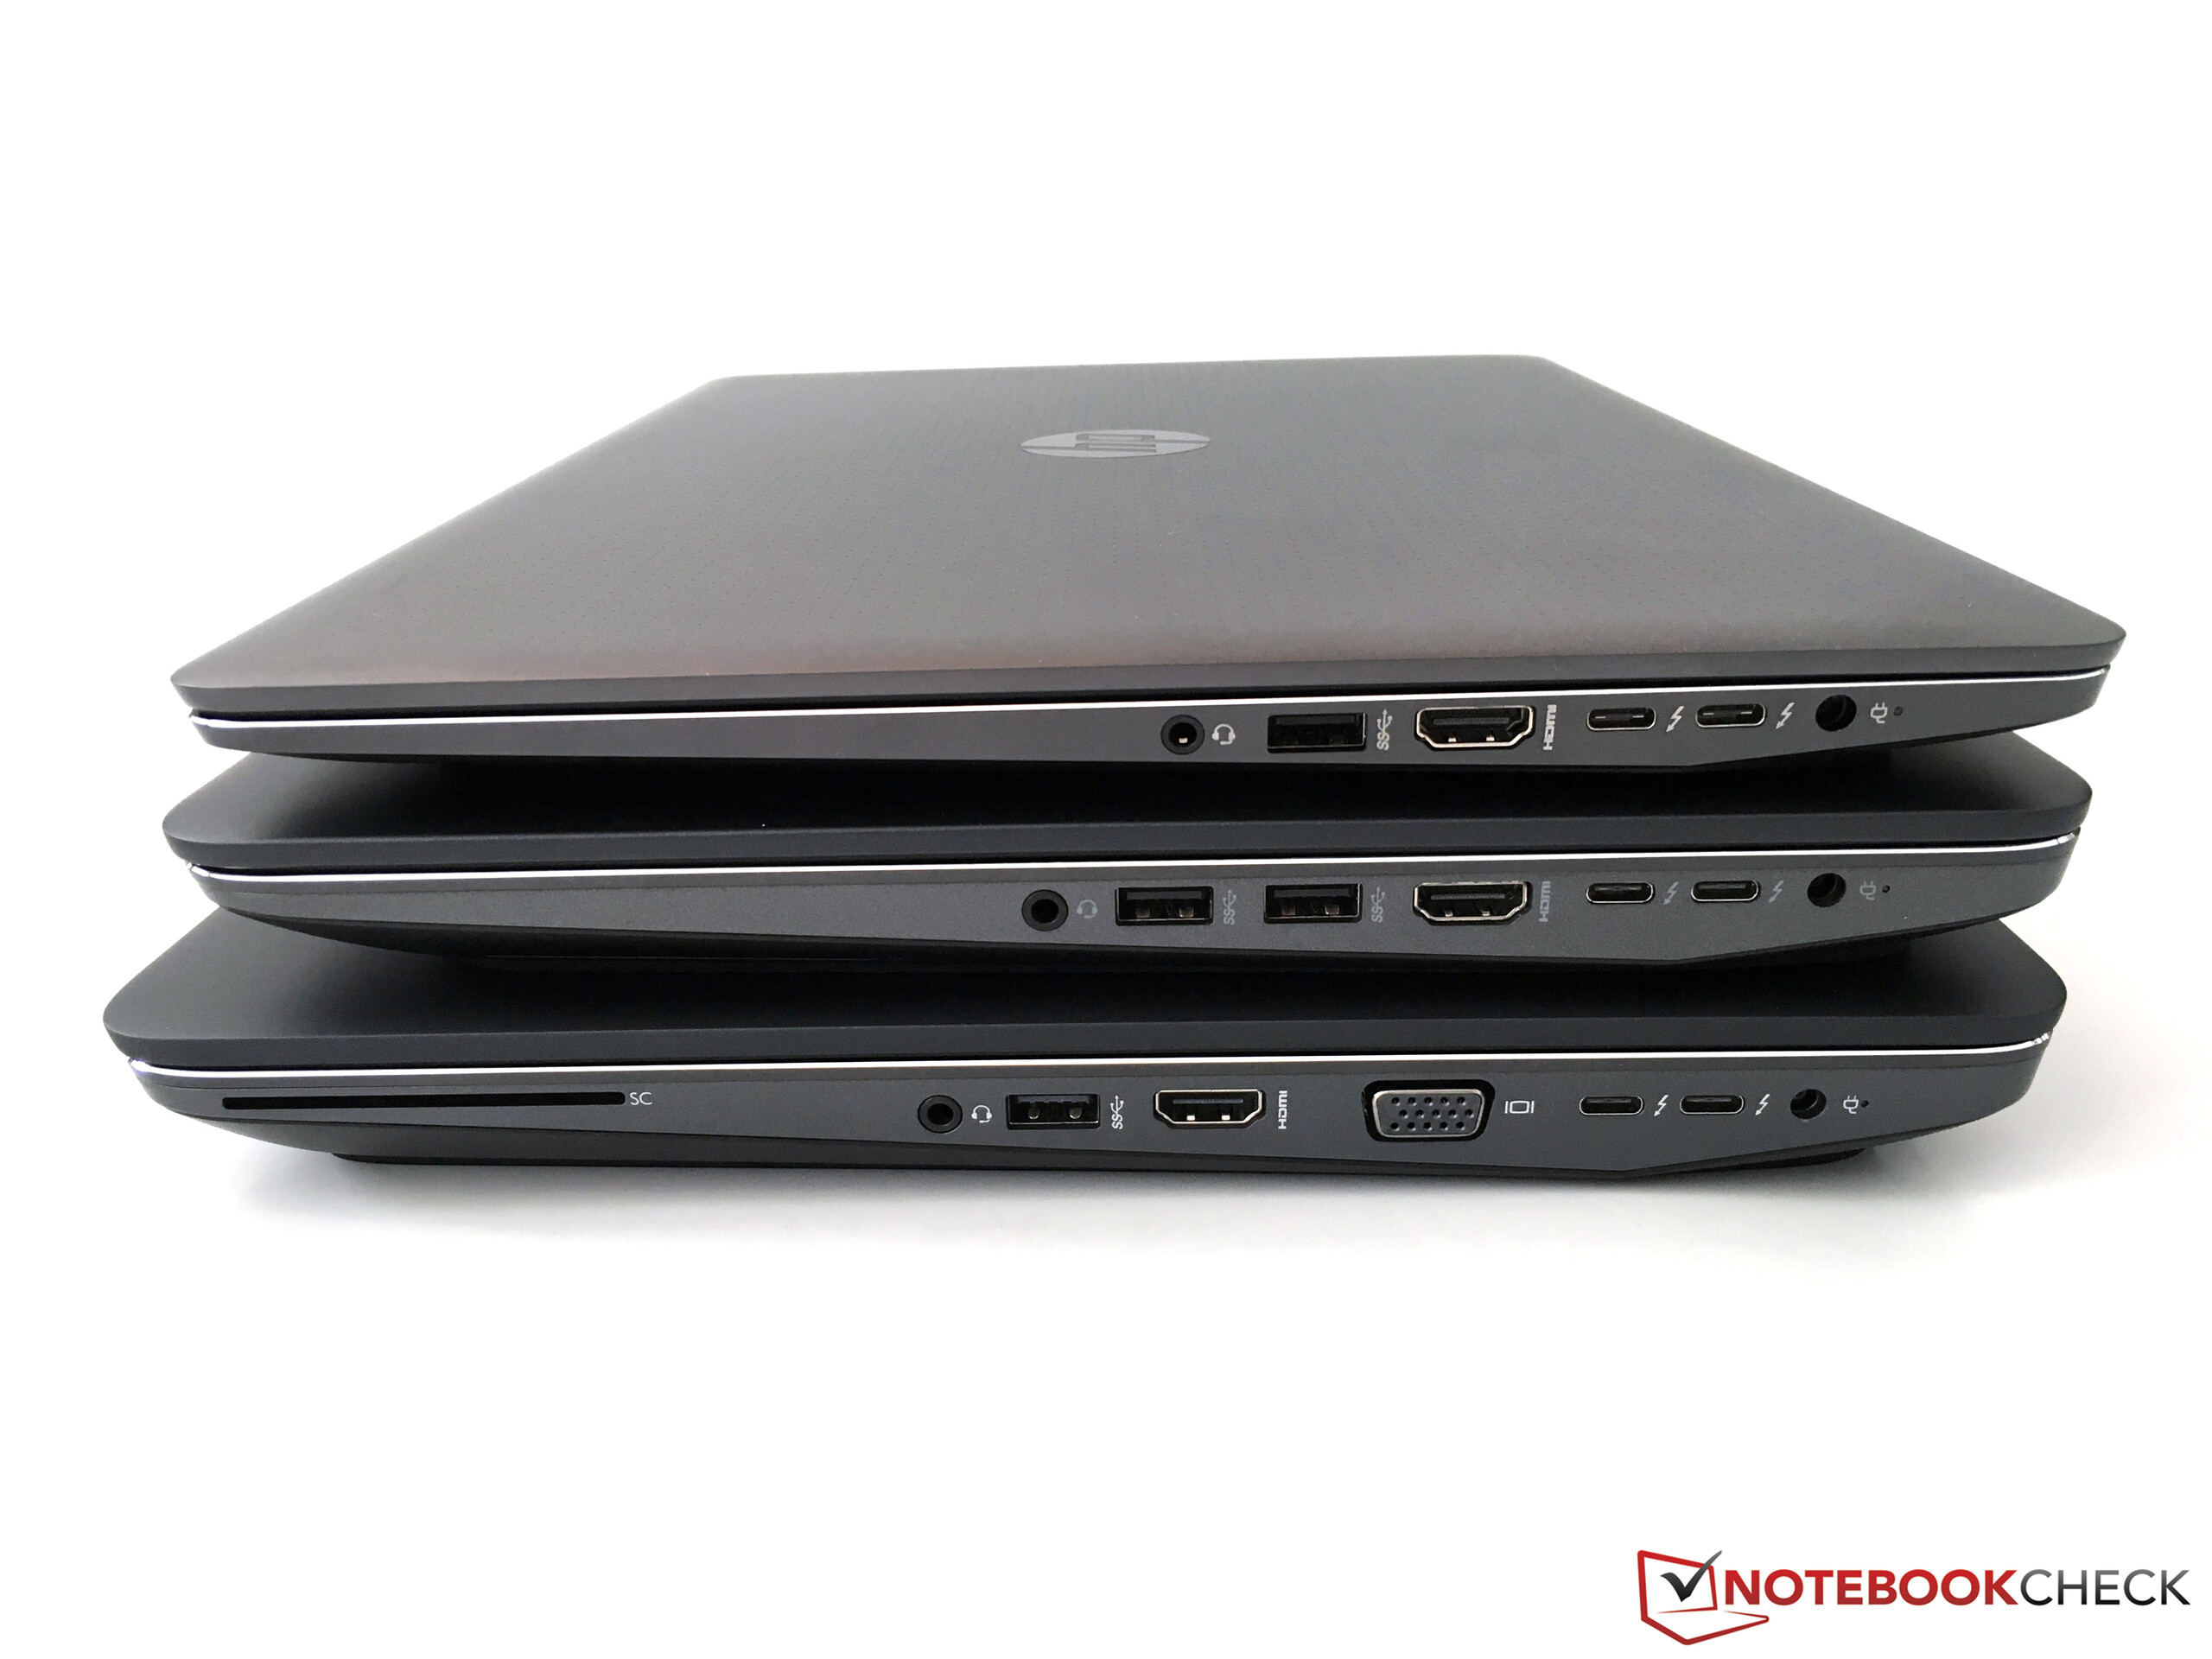
Batteritiden på mindre än fyra timmar vid normal användning är också svår att motivera med tanke på den mobila designen. I övrigt finns det bara några små frågetecken, som avsaknaden av Smartcard-läsare och modem.
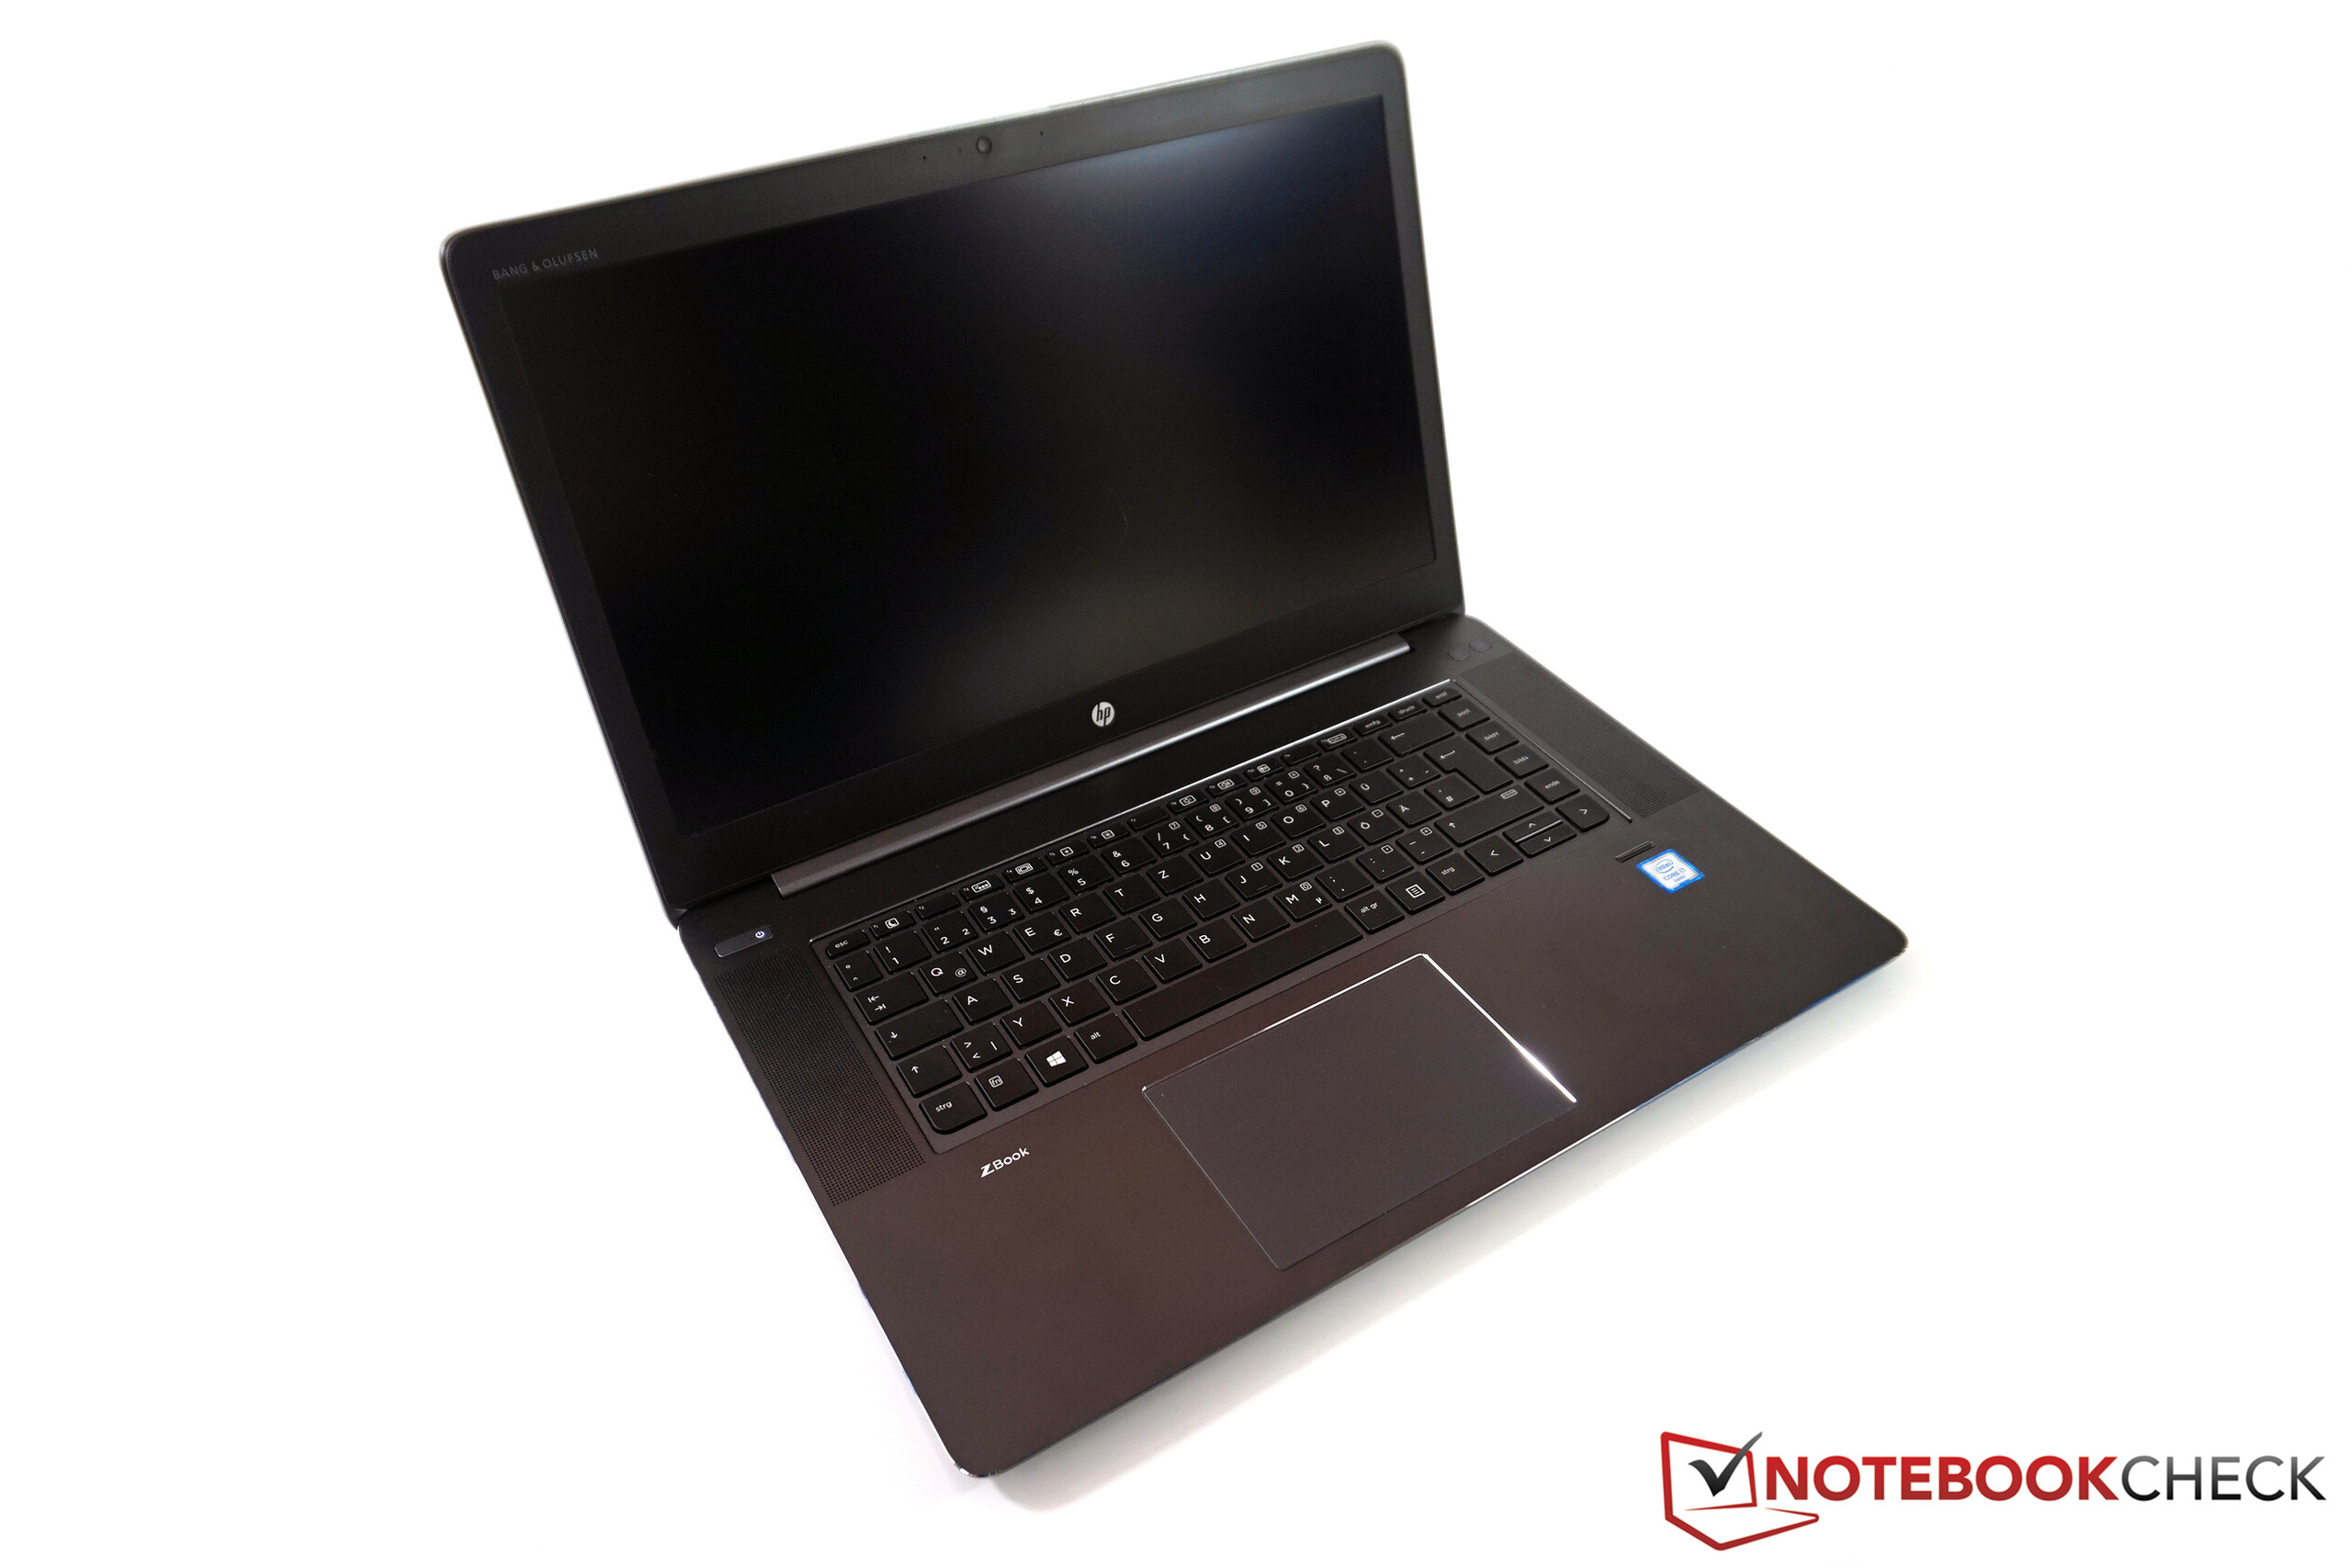
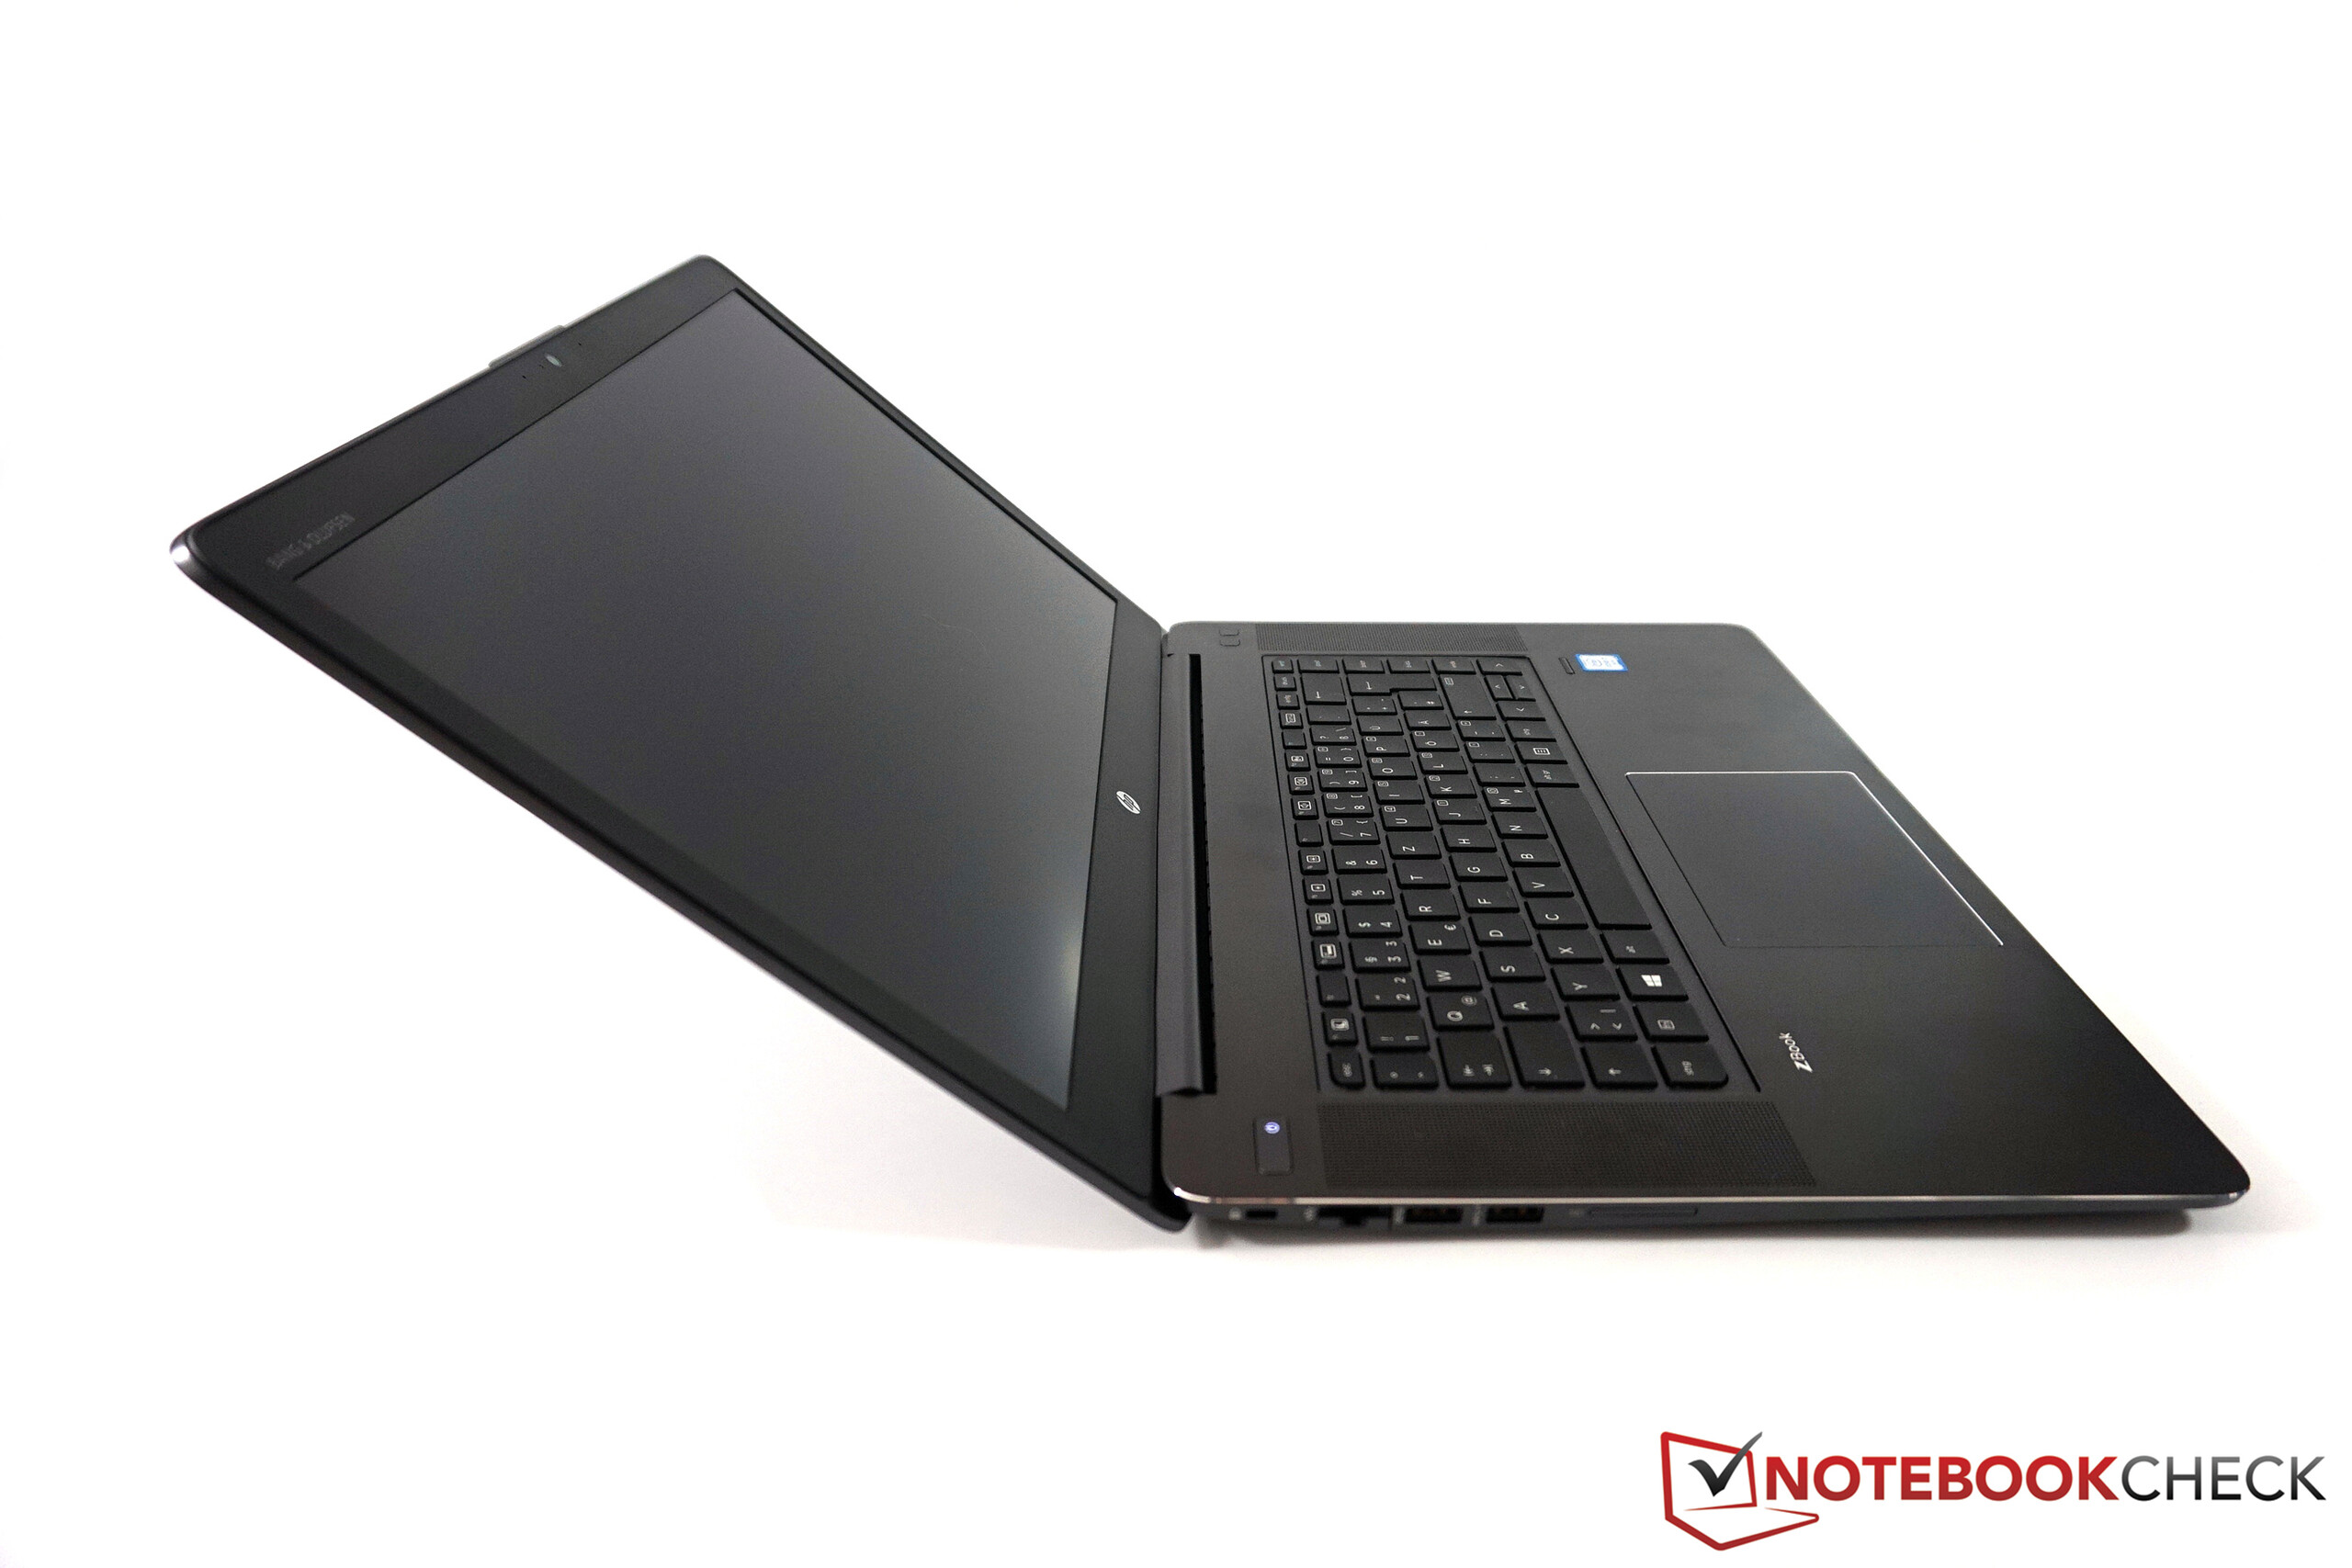
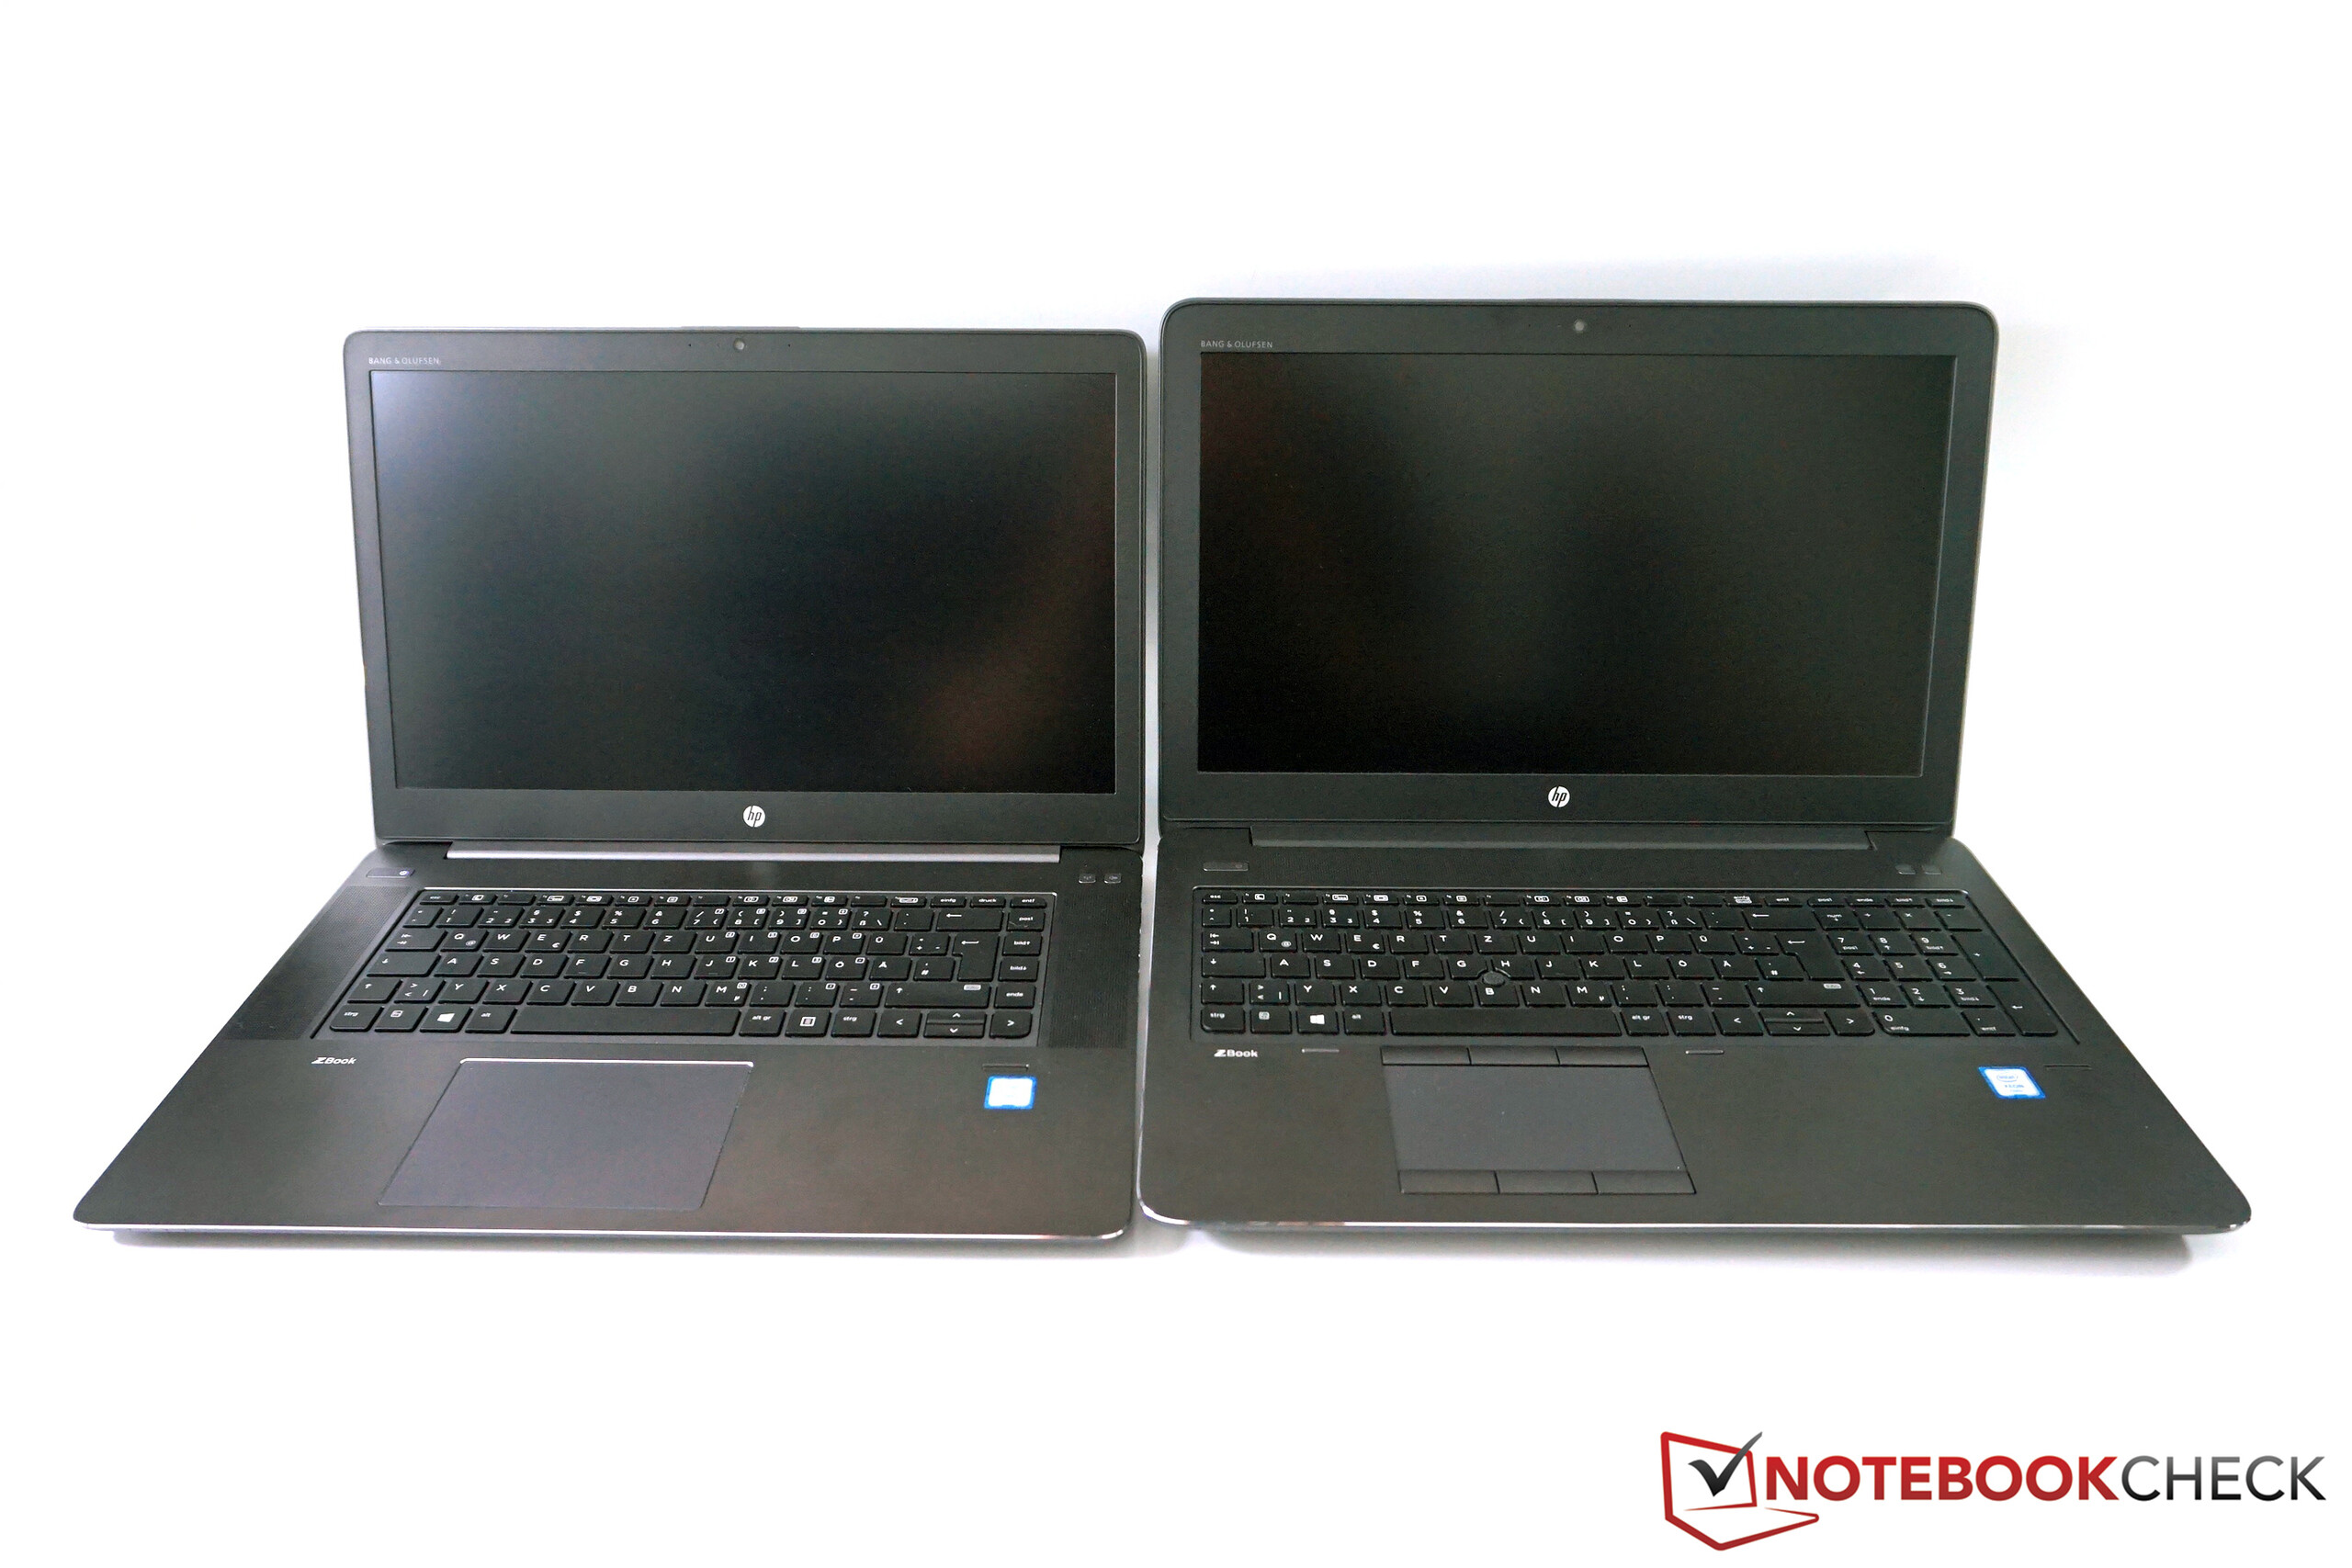
På plussidan övertygar ZBook Studio i många avseenden: Prestandan är hög, datorn har 4K-skärm och bra inmatningsenheter. Men begränsningarna är alldeles för stora. Sedan tillkommer det extremt höga priset på cirka 3800 euro för vår konfiguration, vilket är svårt att motivera med tanke på problemen. BIOS-uppdateringar har inte förbättrat situationen hittills, men vi hoppas HP åtminstone kan förbättra den irriterande fläktstyrningen med en kommande uppdatering.
Sammanfattningsvis är HP:s ZBook Studio ett ambitiöst projekt. Du får en hel del prestanda i ett kompakt paket, men också extrema temperaturer och irriterande fläktar. Det är helt oacceptabelt i prisklassen.
HP ZBook Studio G3
- 05/19/2016 v5.1 (old)
Andreas Osthoff
Price comparison
