Test: Microsoft Surface Book (Core i7, 940M) (sammanfattning)
| |||||||||||||||||||||||||
Distribution av ljusstyrkan: 88 %
Mitt på batteriet: 438 cd/m²
Kontrast: 1752:1 (Svärta: 0.25 cd/m²)
ΔE ColorChecker Calman: 2.06 | ∀{0.5-29.43 Ø4.71}
ΔE Greyscale Calman: 2.87 | ∀{0.09-98 Ø4.96}
96% sRGB (Argyll 1.6.3 3D)
64% AdobeRGB 1998 (Argyll 1.6.3 3D)
68% AdobeRGB 1998 (Argyll 3D)
96% sRGB (Argyll 3D)
66.3% Display P3 (Argyll 3D)
Gamma: 2.44
CCT: 6820 K
| Microsoft Surface Book Core i7 13.5", 3000x2000 | Apple MacBook Pro Retina 13 inch 2015-03 13.3", 2560x1600 | Toshiba KIRA-10D 13.3", 1920x1080 | Microsoft Surface Pro 4, Core i5, 128GB 12.3", 2736x1824 | Dell XPS 13 9343 Core i7 13.3", 3200x1800 | HP Spectre x360 13-4104ng 13.3", 2560x1440 | HP Spectre x2 12-a003ng K3D42EA 12", 1920x1080 | |
|---|---|---|---|---|---|---|---|
| Display | -0% | 3% | -1% | -6% | -1% | -23% | |
| Display P3 Coverage (%) | 66.3 | 65.9 -1% | 69.1 4% | 65 -2% | 62.6 -6% | 66.8 1% | 52.9 -20% |
| sRGB Coverage (%) | 96 | 97 1% | 98.2 2% | 96.5 1% | 89.8 -6% | 92.8 -3% | 71.8 -25% |
| AdobeRGB 1998 Coverage (%) | 68 | 67.4 -1% | 71 4% | 67 -1% | 64.2 -6% | 67.3 -1% | 52.6 -23% |
| Response Times | -5% | 41% | 2% | ||||
| Response Time Grey 50% / Grey 80% * (ms) | 39 ? | 46 ? -18% | 24 ? 38% | 47 ? -21% | |||
| Response Time Black / White * (ms) | 34 ? | 31.2 ? 8% | 19 ? 44% | 26 ? 24% | |||
| PWM Frequency (Hz) | 50 ? | ||||||
| Screen | -9% | -11% | -20% | -28% | -34% | -59% | |
| Brightness middle (cd/m²) | 438 | 361 -18% | 334 -24% | 413 -6% | 232 -47% | 324 -26% | 353 -19% |
| Brightness (cd/m²) | 414 | 342 -17% | 316 -24% | 396 -4% | 231 -44% | 324 -22% | 347 -16% |
| Brightness Distribution (%) | 88 | 81 -8% | 92 5% | 87 -1% | 82 -7% | 90 2% | 91 3% |
| Black Level * (cd/m²) | 0.25 | 0.361 -44% | 0.29 -16% | 0.36 -44% | 0.25 -0% | 0.34 -36% | 0.44 -76% |
| Contrast (:1) | 1752 | 1000 -43% | 1152 -34% | 1147 -35% | 928 -47% | 953 -46% | 802 -54% |
| Colorchecker dE 2000 * | 2.06 | 1.82 12% | 2.27 -10% | 3.09 -50% | 3.63 -76% | 4.36 -112% | 6.09 -196% |
| Greyscale dE 2000 * | 2.87 | 1.8 37% | 2.47 14% | 3.92 -37% | 2.57 10% | 4.62 -61% | 6.24 -117% |
| Gamma | 2.44 90% | 2.49 88% | 2.36 93% | 2.3 96% | 2.17 101% | 2.18 101% | 2.41 91% |
| CCT | 6820 95% | 6417 101% | 6872 95% | 7333 89% | 6422 101% | 6857 95% | 7238 90% |
| Color Space (Percent of AdobeRGB 1998) (%) | 64 | 61.9 -3% | 64 0% | 61 -5% | 58 -9% | 60 -6% | 46 -28% |
| Color Space (Percent of sRGB) (%) | 96 | 96.9 1% | 97 1% | 93 -3% | 71 -26% | ||
| Colorchecker dE 2000 max. * | 3.26 | ||||||
| Totalt genomsnitt (program/inställningar) | -5% /
-7% | -4% /
-7% | -9% /
-14% | -17% /
-22% | 2% /
-17% | -27% /
-42% |
* ... mindre är bättre
Visa svarstider
| ↔ Svarstid svart till vitt | ||
|---|---|---|
| 34 ms ... stiga ↗ och falla ↘ kombinerat | ↗ 10 ms stiga | 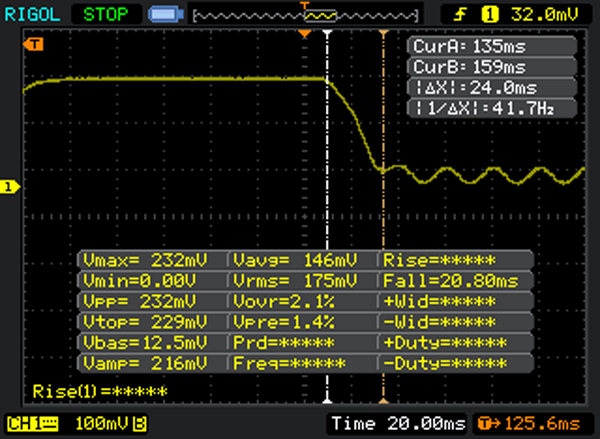 |
| ↘ 24 ms hösten | ||
| Skärmen visar långsamma svarsfrekvenser i våra tester och kommer att vara otillfredsställande för spelare. I jämförelse sträcker sig alla testade enheter från 0.1 (minst) till 240 (maximalt) ms. » 91 % av alla enheter är bättre. Detta innebär att den uppmätta svarstiden är sämre än genomsnittet av alla testade enheter (19.8 ms). | ||
| ↔ Svarstid 50 % grått till 80 % grått | ||
| 39 ms ... stiga ↗ och falla ↘ kombinerat | ↗ 24 ms stiga | 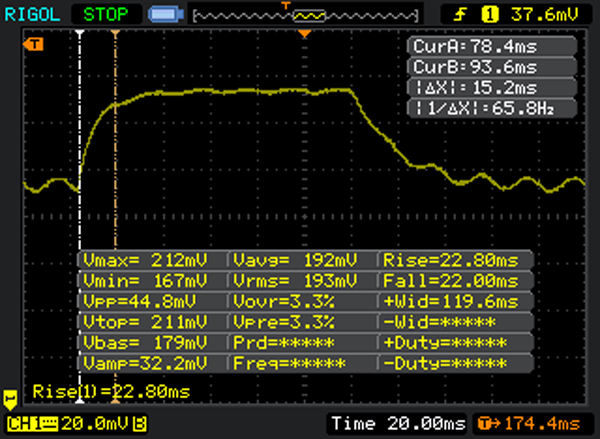 |
| ↘ 15 ms hösten | ||
| Skärmen visar långsamma svarsfrekvenser i våra tester och kommer att vara otillfredsställande för spelare. I jämförelse sträcker sig alla testade enheter från 0.165 (minst) till 636 (maximalt) ms. » 59 % av alla enheter är bättre. Detta innebär att den uppmätta svarstiden är sämre än genomsnittet av alla testade enheter (31 ms). | ||
Skärmflimmer / PWM (Puls-Width Modulation)
| Skärmflimmer / PWM upptäcktes inte | ||
Som jämförelse: 52 % av alla testade enheter använder inte PWM för att dämpa skärmen. Om PWM upptäcktes mättes ett medelvärde av 7754 (minst: 5 - maximum: 343500) Hz. | ||
| PCMark 7 | |
| Score (sortera efter värde) | |
| Microsoft Surface Book Core i7 | |
| Microsoft Surface Book Core i5 | |
| Microsoft Surface Pro 4, Core m3 | |
| Microsoft Surface Pro 4, Core i5, 128GB | |
| Microsoft Surface Pro 4 Core i7 | |
| HP EliteBook Folio 1040 G2 | |
| Apple MacBook Pro Retina 13 inch 2015-03 | |
| Toshiba KIRA-10D | |
| HP Spectre x360 13-4104ng | |
| HP Spectre x360 13-4104ng | |
| Productivity (sortera efter värde) | |
| Microsoft Surface Book Core i7 | |
| Microsoft Surface Book Core i5 | |
| Microsoft Surface Pro 4, Core i5, 128GB | |
| Microsoft Surface Pro 4 Core i7 | |
| HP EliteBook Folio 1040 G2 | |
| Apple MacBook Pro Retina 13 inch 2015-03 | |
| HP Spectre x360 13-4104ng | |
| HP Spectre x360 13-4104ng | |
| PCMark 7 Score | 5178 poäng | |
| PCMark 8 Home Score Accelerated v2 | 2947 poäng | |
| PCMark 8 Creative Score Accelerated v2 | 3755 poäng | |
| PCMark 8 Work Score Accelerated v2 | 3782 poäng | |
Hjälp | ||
| Microsoft Surface Book Core i7 13.5", 3000x2000 | Microsoft Surface Book Core i5 13.5", 3000x2000 | Microsoft Surface Pro 4 Core i7 12.3", 2736x1824 | HP EliteBook Folio 1040 G2 14", 1920x1080 | Apple MacBook Pro Retina 13 inch 2015-03 13.3", 2560x1600 | Toshiba KIRA-10D 13.3", 1920x1080 | Dell XPS 13 9343 Core i7 13.3", 3200x1800 | HP Spectre x2 12-a003ng K3D42EA 12", 1920x1080 | |
|---|---|---|---|---|---|---|---|---|
| AS SSD | -14% | -15% | -50% | -29% | -47% | -48% | -60% | |
| Seq Read (MB/s) | 1342 | 1223 -9% | 1312 -2% | 480.7 -64% | 1233 -8% | 515 -62% | 515 -62% | 439.1 -67% |
| Seq Write (MB/s) | 545 | 275.2 -50% | 274.8 -50% | 250.1 -54% | 616 13% | 467.6 -14% | 233.4 -57% | 216.9 -60% |
| 4K Read (MB/s) | 37.25 | 34.31 -8% | 33.47 -10% | 25.98 -30% | 20.6 -45% | 21.74 -42% | 26.28 -29% | 23.12 -38% |
| 4K Write (MB/s) | 109 | 85 -22% | 89.2 -18% | 84.4 -23% | 30.2 -72% | 78.8 -28% | 91.7 -16% | 49.2 -55% |
| 4K-64 Read (MB/s) | 919 | 1409 53% | 1280 39% | 356.1 -61% | 891 -3% | 352.6 -62% | 359 -61% | 265.6 -71% |
| 4K-64 Write (MB/s) | 520 | 281.4 -46% | 268.7 -48% | 182.7 -65% | 221.2 -57% | 149.7 -71% | 181 -65% | 151.8 -71% |
| CrystalDiskMark 3.0 | -27% | -39% | -1% | -31% | -40% | -52% | ||
| Read Seq (MB/s) | 953 | 834 -12% | 499.9 -48% | 1403 47% | 530 -44% | 527 -45% | 410.1 -57% | |
| Write Seq (MB/s) | 592 | 304 -49% | 264.3 -55% | 657 11% | 474.3 -20% | 237.2 -60% | 316 -47% | |
| Read 512 (MB/s) | 520 | 396.7 -24% | 418.9 -19% | 810 56% | 426.1 -18% | 420.5 -19% | 260.8 -50% | |
| Write 512 (MB/s) | 591 | 304.3 -49% | 264.6 -55% | 648 10% | 445.8 -25% | 241.6 -59% | 241.6 -59% | |
| Read 4k (MB/s) | 42.66 | 40.75 -4% | 28.4 -33% | 20.95 -51% | 23.27 -45% | 28.29 -34% | 27.4 -36% | |
| Write 4k (MB/s) | 136.3 | 106.3 -22% | 101.2 -26% | 32.43 -76% | 90.1 -34% | 103.7 -24% | 53.5 -61% | |
| Totalt genomsnitt (program/inställningar) | -14% /
-14% | -21% /
-21% | -45% /
-44% | -15% /
-15% | -39% /
-39% | -44% /
-44% | -56% /
-56% |

| Microsoft Surface Book Core i7 13.5", 3000x2000 | Microsoft Surface Book i7 Heat Keyboard iGPU 13.5", 3000x2000 | Microsoft Surface Book Core i5 13.5", 3000x2000 | Microsoft Surface Pro 4, Core m3 12.3", 2736x1824 | Microsoft Surface Pro 4, Core i5, 128GB 12.3", 2736x1824 | Microsoft Surface Pro 4 Core i7 12.3", 2736x1824 | HP EliteBook Folio 1040 G2 14", 1920x1080 | Apple MacBook Pro Retina 13 inch 2015-03 13.3", 2560x1600 | Dell XPS 13 9343 Core i7 13.3", 3200x1800 | HP Spectre x2 12-a003ng K3D42EA 12", 1920x1080 | |
|---|---|---|---|---|---|---|---|---|---|---|
| 3DMark 11 | -32% | -5% | -47% | -35% | -3% | -47% | -28% | -44% | -56% | |
| 1280x720 Performance Physics (Points) | 4760 | 4765 0% | 4199 -12% | 3067 -36% | 3984 -16% | 4919 3% | 3692 -22% | 4084 -14% | 3845 -19% | 2604 -45% |
| 1280x720 Performance GPU (Points) | 2606 | 1319 -49% | 2548 -2% | 1206 -54% | 1402 -46% | 2450 -6% | 1011 -61% | 1706 -35% | 1115 -57% | 996 -62% |
| 1280x720 Performance (Points) | 2761 | 1480 -46% | 2711 -2% | 1344 -51% | 1565 -43% | 2624 -5% | 1133 -59% | 1828 -34% | 1252 -55% | 1098 -60% |
| 3DMark | -34% | -2% | -36% | -19% | 12% | -11% | -14% | -21% | -36% | |
| 1280x720 Cloud Gate Standard Physics (Points) | 3745 | 3701 -1% | 3362 -10% | 2238 -40% | 3342 -11% | 3639 -3% | 3185 -15% | 3527 -6% | 3362 -10% | 2304 -38% |
| 1280x720 Ice Storm Standard Physics (Points) | 36360 | 31340 -14% | 38206 5% | 25720 -29% | 38764 7% | 44259 22% | 37081 2% | 38688 6% | 38854 7% | 27821 -23% |
| 1280x720 Ice Storm Standard Graphics (Points) | 54706 | 22709 -58% | 54088 -1% | 51362 -6% | 56071 2% | 91565 67% | 60003 10% | 60636 11% | 54695 0% | 50126 -8% |
| 1280x720 Cloud Gate Standard Graphics (Points) | 11420 | 6274 -45% | 11340 -1% | 6597 -42% | 7455 -35% | 11650 2% | 6585 -42% | 7894 -31% | 6475 -43% | 6298 -45% |
| 1920x1080 Fire Strike Graphics (Points) | 2120 | 1010 -52% | 2031 -4% | 810 -62% | 905 -57% | 1477 -30% | 1020 -52% | 834 -61% | 725 -66% | |
| Totalt genomsnitt (program/inställningar) | -33% /
-33% | -4% /
-3% | -42% /
-40% | -27% /
-25% | 5% /
6% | -29% /
-27% | -21% /
-19% | -33% /
-30% | -46% /
-43% |
| 3DMark 11 Performance | 2761 poäng | |
| 3DMark Ice Storm Standard Score | 50418 poäng | |
| 3DMark Cloud Gate Standard Score | 7505 poäng | |
| 3DMark Fire Strike Score | 1952 poäng | |
Hjälp | ||
| Microsoft Surface Book Core i7 13.5", 3000x2000 | Microsoft Surface Book Core i5 13.5", 3000x2000 | Microsoft Surface Pro 4 Core i7 12.3", 2736x1824 | HP EliteBook Folio 1040 G2 14", 1920x1080 | Apple MacBook Pro Retina 13 inch 2015-03 13.3", 2560x1600 | Toshiba KIRA-10D 13.3", 1920x1080 | Dell XPS 13 9343 Core i7 13.3", 3200x1800 | HP Spectre x360 13-4104ng 13.3", 2560x1440 | |
|---|---|---|---|---|---|---|---|---|
| Noise | 3% | 3% | 4% | -1% | -2% | -3% | 3% | |
| av / miljö * (dB) | 31.3 | |||||||
| Idle Minimum * (dB) | 31.3 | 29.5 6% | 28.4 9% | 29.6 5% | 29 7% | 29.6 5% | 29.6 5% | 29.6 5% |
| Idle Average * (dB) | 31.3 | 29.6 5% | 28.6 9% | 29.6 5% | 29 7% | 29.6 5% | 29.6 5% | 29.6 5% |
| Idle Maximum * (dB) | 31.3 | 29.7 5% | 28.7 8% | 32.2 -3% | 29 7% | 30.7 2% | 33.2 -6% | 34.6 -11% |
| Load Average * (dB) | 38 | 37.5 1% | 40.8 -7% | 36.4 4% | 42.5 -12% | 43.9 -16% | 43.2 -14% | 34.7 9% |
| Load Maximum * (dB) | 40.5 | 40.9 -1% | 41.4 -2% | 36.4 10% | 45.6 -13% | 43.9 -8% | 43.2 -7% | 37.9 6% |
* ... mindre är bättre
Ljudnivå
| Låg belastning |
| 31.3 / 31.3 / 31.3 dB(A) |
| Hög belastning |
| 38 / 40.5 dB(A) |
 | ||
30 dB tyst 40 dB(A) hörbar 50 dB(A) högt ljud |
||
min: | ||
| Microsoft Surface Book Core i7 13.5", 3000x2000 | Microsoft Surface Book Core i5 13.5", 3000x2000 | Microsoft Surface Pro 4, Core i5, 128GB 12.3", 2736x1824 | Microsoft Surface Pro 4 Core i7 12.3", 2736x1824 | HP EliteBook Folio 1040 G2 14", 1920x1080 | Apple MacBook Pro Retina 13 inch 2015-03 13.3", 2560x1600 | Toshiba KIRA-10D 13.3", 1920x1080 | Dell XPS 13 9343 Core i7 13.3", 3200x1800 | HP Spectre x2 12-a003ng K3D42EA 12", 1920x1080 | |
|---|---|---|---|---|---|---|---|---|---|
| Heat | 13% | -21% | 12% | 10% | 7% | 13% | 14% | 2% | |
| Maximum Upper Side * (°C) | 47.4 | 44.2 7% | 52.3 -10% | 45.4 4% | 35.9 24% | 45.1 5% | 42.2 11% | 43.4 8% | 43.5 8% |
| Maximum Bottom * (°C) | 50.2 | 41.2 18% | 51.4 -2% | 43.2 14% | 42.4 16% | 39.6 21% | 34.4 31% | 37 26% | 42 16% |
| Idle Upper Side * (°C) | 30.4 | 26 14% | 43.2 -42% | 25.2 17% | 28.5 6% | 28.5 6% | 26.2 14% | 25.9 15% | 33 -9% |
| Idle Bottom * (°C) | 27.4 | 23.8 13% | 36 -31% | 24 12% | 29 -6% | 28.3 -3% | 28.5 -4% | 25.1 8% | 29.3 -7% |
* ... mindre är bättre
Heat Tablet
(-) Den maximala temperaturen på ovansidan är 47.4 °C / 117 F, jämfört med genomsnittet av 35.4 °C / 96 F , allt från 19.6 till 60 °C för klassen Convertible.
(-) Botten värms upp till maximalt 50.2 °C / 122 F, jämfört med genomsnittet av 36.9 °C / 98 F
(+) Vid tomgångsbruk är medeltemperaturen för ovansidan 26.6 °C / 80 F, jämfört med enhetsgenomsnittet på 30.3 °C / ### class_avg_f### F.
(-) Handledsstöden och pekplattan kan bli väldigt varma vid beröring med maximalt 47.35 °C / 117.2 F.
(-) Medeltemperaturen för handledsstödsområdet på liknande enheter var 28 °C / 82.4 F (-19.4 °C / -34.8 F).
Heat Keyboard with Maxwell Geforce
(+) Den maximala temperaturen på ovansidan är 39.6 °C / 103 F, jämfört med genomsnittet av 35.4 °C / 96 F , allt från 19.6 till 60 °C för klassen Convertible.
(±) Botten värms upp till maximalt 40.7 °C / 105 F, jämfört med genomsnittet av 36.9 °C / 98 F
(+) Handledsstöden och pekplattan är kallare än hudtemperaturen med maximalt 28.6 °C / 83.5 F och är därför svala att ta på.
(±) Medeltemperaturen för handledsstödsområdet på liknande enheter var 28 °C / 82.4 F (-0.6 °C / -1.1 F).
| Microsoft Surface Book Core i7 13.5", 3000x2000 | Microsoft Surface Pro 4, Core i5, 128GB 12.3", 2736x1824 | HP EliteBook Folio 1040 G2 14", 1920x1080 | Apple MacBook Pro Retina 13 inch 2015-03 13.3", 2560x1600 | Toshiba KIRA-10D 13.3", 1920x1080 | Dell XPS 13 9343 Core i7 13.3", 3200x1800 | HP Spectre x360 13-4104ng 13.3", 2560x1440 | HP Spectre x2 12-a003ng K3D42EA 12", 1920x1080 | |
|---|---|---|---|---|---|---|---|---|
| Power Consumption | 29% | 40% | 13% | 41% | 8% | 30% | 35% | |
| Idle Minimum * (Watt) | 4.5 | 4.4 2% | 3.2 29% | 2.8 38% | 2.6 42% | 6.6 -47% | 3.9 13% | 4.5 -0% |
| Idle Average * (Watt) | 9.8 | 9 8% | 6.5 34% | 7.8 20% | 6.3 36% | 9.3 5% | 7.4 24% | 7.7 21% |
| Idle Maximum * (Watt) | 12.2 | 10.7 12% | 7.4 39% | 8.1 34% | 6.5 47% | 11 10% | 9.2 25% | 8.3 32% |
| Load Average * (Watt) | 46 | 19.6 57% | 25.6 44% | 52.4 -14% | 30.9 33% | 32.2 30% | 28.1 39% | 19.8 57% |
| Load Maximum * (Watt) | 56 | 19.9 64% | 26.1 53% | 62.8 -12% | 30.9 45% | 33.2 41% | 27.6 51% | 20.6 63% |
* ... mindre är bättre
| Av/Standby | |
| Låg belastning | |
| Hög belastning |
|
Förklaring:
min: | |
För
Emot
Läs det mer kompletta testet här (engelska.
Den försöker verkligen hårt och tjänar en poäng mer än sitt Core i5-syskon från vårt första test av Surface Book. Den avgörande faktorn var längre batteritid, eftersom vi bara kunde hitta en mycket liten, om någon, fördel med i7/512 GB-versionen i prestandaväg. Den större SSD:n klarar högre skrivhastigheter, vilket alltid är något. Värmeutvecklingen är högre jämfört med i5-modellen, men handledsstödet förblir svalt.
Surface Book i7 är nästan 30% snabbare än rivalerna Lenovo Miix 700 (Core m3), HP Spectre X2 (Core m7) och Microsoft Surface Pro 3 (Haswell Core i5). Anledningen är den aktiva kylningen, som garanterar att CPU-Turbon utnyttjas konstant, medan fläktlösa system måste minska sina klockhastigheter. Den mer kraftfulla Surface Book – oavsett om det är med Core i5 eller i7 – är därför lämpad för processorintensiva program som också måste utföras på batteridrift.
Om du vill spara på eventuella renderingsminuter är Surface Book är definitivt det bästa valet i storleksklassen. Den levererar CPU-prestanda i ett litet format och kan slå konkurrenter som MacBook Pro 13 eller Dell XPS 13. Om det sedan är värt det höga priset är en annan fråga, men Surface Book är ett bra val för teknikentusiaster.
Microsoft Surface Book Core i7
- 04/27/2016 v5.1 (old)
Sebastian Jentsch
Price comparison
