Test: Asus ROG Zephyrus M15 GU502L - Kompakt spellaptop med Turbo-reserver (Sammanfattning)
Gradering | Datum | Modell | Vikt | Höjd | Storlek | Upplösning | Pris |
|---|---|---|---|---|---|---|---|
| 82.5 % v7 (old) | 10/2020 | Asus ROG Zephyrus M15 GU502L i7-10750H, GeForce RTX 2070 Max-Q | 2 kg | 18.9 mm | 15.60" | 3840x2160 | |
| 84.5 % v7 (old) | Schenker Key 15 Comet Lake i7-10875H, GeForce RTX 2080 Super Max-Q | 2 kg | 19.8 mm | 15.60" | 1920x1080 | ||
| 86.9 % v7 (old) | Razer Blade 15 RTX 2070 Super Max-Q i7-10875H, GeForce RTX 2070 Super Max-Q | 2.1 kg | 17.8 mm | 15.60" | 1920x1080 | ||
| 85.8 % v7 (old) | 05/2020 | Gigabyte Aero 15 OLED XB-8DE51B0SP i7-10875H, GeForce RTX 2070 Super Max-Q | 2.2 kg | 20 mm | 15.60" | 3840x2160 | |
v (old) | 04/2020 | Acer Predator Triton 500 PT515-52-70N3 i7-10750H, GeForce RTX 2080 Super Max-Q | 2.1 kg | 18 mm | 15.60" | 1920x1080 | |
| 84 % v7 (old) | 05/2020 | MSI GS66 10SGS i7-10750H, GeForce RTX 2080 Super Max-Q | 2.2 kg | 20 mm | 15.60" | 1920x1080 |
| Networking | |
| iperf3 transmit AX12 | |
| Acer Predator Triton 500 PT515-52-70N3 | |
| Gigabyte Aero 15 OLED XB-8DE51B0SP | |
| MSI GS66 10SGS | |
| Razer Blade 15 RTX 2070 Super Max-Q | |
| Genomsnitt Intel Wi-Fi 6 AX201 (49.8 - 1775, n=324) | |
| Asus ROG Zephyrus M15 GU502L | |
| Schenker Key 15 Comet Lake | |
| iperf3 receive AX12 | |
| Razer Blade 15 RTX 2070 Super Max-Q | |
| Acer Predator Triton 500 PT515-52-70N3 | |
| Schenker Key 15 Comet Lake | |
| Asus ROG Zephyrus M15 GU502L | |
| MSI GS66 10SGS | |
| Genomsnitt Intel Wi-Fi 6 AX201 (136 - 1743, n=324) | |
| Gigabyte Aero 15 OLED XB-8DE51B0SP | |
| |||||||||||||||||||||||||
Distribution av ljusstyrkan: 90 %
Mitt på batteriet: 387 cd/m²
Kontrast: 1683:1 (Svärta: 0.23 cd/m²)
ΔE ColorChecker Calman: 1.8 | ∀{0.5-29.43 Ø4.73}
calibrated: 0.7
ΔE Greyscale Calman: 2.9 | ∀{0.09-98 Ø4.97}
99% sRGB (Argyll 1.6.3 3D)
99% AdobeRGB 1998 (Argyll 1.6.3 3D)
70.5% AdobeRGB 1998 (Argyll 3D)
99% sRGB (Argyll 3D)
69.4% Display P3 (Argyll 3D)
Gamma: 2.178
CCT: 6992 K
| Asus ROG Zephyrus M15 GU502L AU Optronics B156ZAN03.1, IPS, 3840x2160, 15.6" | Asus ROG Zephyrus M15 GU502GU-XB74 AU Optronics B156HAN08.2, IPS, 1920x1080, 15.6" | Schenker Key 15 Comet Lake Panda LM156LF-1F02, IPS, 1920x1080, 15.6" | Razer Blade 15 RTX 2070 Super Max-Q AU Optronics B156HAN12.0, IPS, 1920x1080, 15.6" | Gigabyte Aero 15 OLED XB-8DE51B0SP Samsung SDCA029, OLED, 3840x2160, 15.6" | Acer Predator Triton 500 PT515-52-70N3 AUO B156HAN12.0 (AUO7A8C), IPS, 1920x1080, 15.6" | MSI GS66 10SGS AU Optronics B156HAN12.0, IPS, 1920x1080, 15.6" | |
|---|---|---|---|---|---|---|---|
| Display | -6% | -3% | 0% | 28% | 1% | 1% | |
| Display P3 Coverage (%) | 69.4 | 66.5 -4% | 67.2 -3% | 69.4 0% | 99.9 44% | 70.3 1% | 69.9 1% |
| sRGB Coverage (%) | 99 | 90.8 -8% | 96.2 -3% | 98.8 0% | 100 1% | 99.5 1% | 99.1 0% |
| AdobeRGB 1998 Coverage (%) | 70.5 | 66.5 -6% | 68.7 -3% | 70.5 0% | 98.2 39% | 72.2 2% | 71.1 1% |
| Response Times | 78% | 74% | 82% | 95% | 68% | 71% | |
| Response Time Grey 50% / Grey 80% * (ms) | 60 ? | 6.4 ? 89% | 10 ? 83% | 3.2 ? 95% | 2.2 ? 96% | 14.4 ? 76% | 11.2 ? 81% |
| Response Time Black / White * (ms) | 25.6 ? | 8.8 ? 66% | 9.2 ? 64% | 8 ? 69% | 1.8 ? 93% | 10.4 ? 59% | 10 ? 61% |
| PWM Frequency (Hz) | 60 ? | ||||||
| Screen | -64% | -92% | -43% | -28% | -43% | -14% | |
| Brightness middle (cd/m²) | 387 | 297.7 -23% | 300 -22% | 345.4 -11% | 385 -1% | 320 -17% | 339.4 -12% |
| Brightness (cd/m²) | 377 | 280 -26% | 281 -25% | 342 -9% | 390 3% | 318 -16% | 331 -12% |
| Brightness Distribution (%) | 90 | 84 -7% | 80 -11% | 90 0% | 93 3% | 88 -2% | 92 2% |
| Black Level * (cd/m²) | 0.23 | 0.43 -87% | 0.29 -26% | 0.34 -48% | 0.24 -4% | 0.24 -4% | |
| Contrast (:1) | 1683 | 692 -59% | 1034 -39% | 1016 -40% | 1333 -21% | 1414 -16% | |
| Colorchecker dE 2000 * | 1.8 | 3.13 -74% | 5.39 -199% | 3.18 -77% | 2.46 -37% | 4.03 -124% | 1.58 12% |
| Colorchecker dE 2000 max. * | 3.94 | 7.1 -80% | 14.35 -264% | 6.57 -67% | 4.01 -2% | 8.43 -114% | 3.8 4% |
| Colorchecker dE 2000 calibrated * | 0.7 | 3.06 -337% | 1.73 -147% | 1.77 -153% | 2.6 -271% | 0.98 -40% | 1.47 -110% |
| Greyscale dE 2000 * | 2.9 | 1.9 34% | 9.8 -238% | 3.8 -31% | 1.39 52% | 5.94 -105% | 2.3 21% |
| Gamma | 2.178 101% | 2.23 99% | 2.019 109% | 2.15 102% | 2.31 95% | 2.42 91% | 2.24 98% |
| CCT | 6992 93% | 6325 103% | 8174 80% | 7109 91% | 6395 102% | 6751 96% | 6952 93% |
| Color Space (Percent of AdobeRGB 1998) (%) | 99 | 59.2 -40% | 69 -30% | 64.3 -35% | 98 -1% | 66 -33% | 64.8 -35% |
| Color Space (Percent of sRGB) (%) | 99 | 90.5 -9% | 92 -7% | 99 0% | 100 1% | 99 0% | 99.4 0% |
| Totalt genomsnitt (program/inställningar) | 3% /
-36% | -7% /
-54% | 13% /
-19% | 32% /
1% | 9% /
-21% | 19% /
-0% |
* ... mindre är bättre
Visa svarstider
| ↔ Svarstid svart till vitt | ||
|---|---|---|
| 25.6 ms ... stiga ↗ och falla ↘ kombinerat | ↗ 11.6 ms stiga | 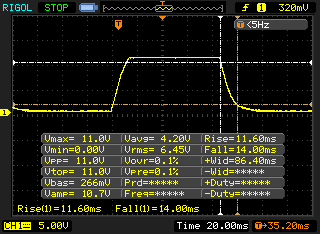 |
| ↘ 14 ms hösten | ||
| Skärmen visar relativt långsamma svarsfrekvenser i våra tester och kan vara för långsam för spelare. I jämförelse sträcker sig alla testade enheter från 0.1 (minst) till 240 (maximalt) ms. » 61 % av alla enheter är bättre. Detta innebär att den uppmätta svarstiden är sämre än genomsnittet av alla testade enheter (19.9 ms). | ||
| ↔ Svarstid 50 % grått till 80 % grått | ||
| 60 ms ... stiga ↗ och falla ↘ kombinerat | ↗ 29.2 ms stiga | 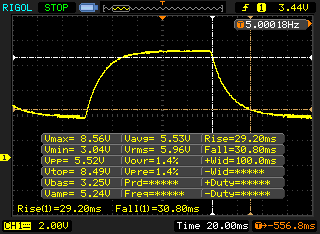 |
| ↘ 30.8 ms hösten | ||
| Skärmen visar långsamma svarsfrekvenser i våra tester och kommer att vara otillfredsställande för spelare. I jämförelse sträcker sig alla testade enheter från 0.165 (minst) till 636 (maximalt) ms. » 96 % av alla enheter är bättre. Detta innebär att den uppmätta svarstiden är sämre än genomsnittet av alla testade enheter (31.1 ms). | ||
Skärmflimmer / PWM (Puls-Width Modulation)
| Skärmflimmer / PWM upptäcktes inte | 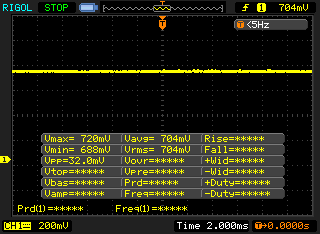 | ||
Som jämförelse: 52 % av alla testade enheter använder inte PWM för att dämpa skärmen. Om PWM upptäcktes mättes ett medelvärde av 7794 (minst: 5 - maximum: 343500) Hz. | |||
| Cinebench R15 | |
| CPU Single 64Bit | |
| Genomsnitt av klass Gaming (188.8 - 343, n=111, senaste 2 åren) | |
| Gigabyte Aero 15 OLED XB-8DE51B0SP | |
| Schenker Key 15 Comet Lake | |
| Razer Blade 15 RTX 2070 Super Max-Q | |
| Genomsnitt Intel Core i7-10750H (184 - 213, n=45) | |
| Asus ROG Zephyrus M15 GU502GU-XB74 | |
| Asus ROG Zephyrus M15 GU502L (Turbo) | |
| Acer Predator Triton 500 PT515-52-70N3 | |
| Asus ROG Zephyrus M15 GU502L | |
| MSI GS66 10SGS | |
| CPU Multi 64Bit | |
| Genomsnitt av klass Gaming (1578 - 6271, n=111, senaste 2 åren) | |
| Gigabyte Aero 15 OLED XB-8DE51B0SP | |
| Schenker Key 15 Comet Lake | |
| Razer Blade 15 RTX 2070 Super Max-Q | |
| Asus ROG Zephyrus M15 GU502L (Turbo) | |
| Asus ROG Zephyrus M15 GU502L | |
| Acer Predator Triton 500 PT515-52-70N3 | |
| MSI GS66 10SGS | |
| Asus ROG Zephyrus M15 GU502GU-XB74 | |
| Genomsnitt Intel Core i7-10750H (804 - 1418, n=50) | |
| Blender - v2.79 BMW27 CPU | |
| Genomsnitt Intel Core i7-10750H (322 - 587, n=43) | |
| MSI GS66 10SGS | |
| Acer Predator Triton 500 PT515-52-70N3 | |
| Asus ROG Zephyrus M15 GU502L | |
| Schenker Key 15 Comet Lake | |
| Razer Blade 15 RTX 2070 Super Max-Q | |
| Gigabyte Aero 15 OLED XB-8DE51B0SP | |
| Genomsnitt av klass Gaming (80 - 330, n=109, senaste 2 åren) | |
| 7-Zip 18.03 | |
| 7z b 4 -mmt1 | |
| Genomsnitt av klass Gaming (4199 - 7436, n=110, senaste 2 åren) | |
| Schenker Key 15 Comet Lake | |
| Gigabyte Aero 15 OLED XB-8DE51B0SP | |
| Razer Blade 15 RTX 2070 Super Max-Q | |
| Genomsnitt Intel Core i7-10750H (4504 - 5470, n=43) | |
| Acer Predator Triton 500 PT515-52-70N3 | |
| MSI GS66 10SGS | |
| Asus ROG Zephyrus M15 GU502L | |
| 7z b 4 | |
| Genomsnitt av klass Gaming (33491 - 148086, n=110, senaste 2 åren) | |
| Gigabyte Aero 15 OLED XB-8DE51B0SP | |
| Schenker Key 15 Comet Lake | |
| Razer Blade 15 RTX 2070 Super Max-Q | |
| Asus ROG Zephyrus M15 GU502L | |
| MSI GS66 10SGS | |
| Acer Predator Triton 500 PT515-52-70N3 | |
| Genomsnitt Intel Core i7-10750H (26040 - 37345, n=43) | |
| Cinebench R20 | |
| CPU (Single Core) | |
| Genomsnitt av klass Gaming (442 - 895, n=111, senaste 2 åren) | |
| Gigabyte Aero 15 OLED XB-8DE51B0SP | |
| Schenker Key 15 Comet Lake | |
| Razer Blade 15 RTX 2070 Super Max-Q | |
| Genomsnitt Intel Core i7-10750H (431 - 504, n=43) | |
| Asus ROG Zephyrus M15 GU502GU-XB74 | |
| Acer Predator Triton 500 PT515-52-70N3 | |
| Asus ROG Zephyrus M15 GU502L | |
| MSI GS66 10SGS | |
| CPU (Multi Core) | |
| Genomsnitt av klass Gaming (4029 - 16108, n=111, senaste 2 åren) | |
| Gigabyte Aero 15 OLED XB-8DE51B0SP | |
| Razer Blade 15 RTX 2070 Super Max-Q | |
| Schenker Key 15 Comet Lake | |
| Asus ROG Zephyrus M15 GU502GU-XB74 | |
| Asus ROG Zephyrus M15 GU502L | |
| Acer Predator Triton 500 PT515-52-70N3 | |
| MSI GS66 10SGS | |
| Genomsnitt Intel Core i7-10750H (1749 - 3325, n=43) | |
| Geekbench 5.5 | |
| Single-Core | |
| Genomsnitt av klass Gaming (986 - 2474, n=110, senaste 2 åren) | |
| Gigabyte Aero 15 OLED XB-8DE51B0SP | |
| Schenker Key 15 Comet Lake | |
| Razer Blade 15 RTX 2070 Super Max-Q | |
| Genomsnitt Intel Core i7-10750H (1114 - 1333, n=43) | |
| Acer Predator Triton 500 PT515-52-70N3 | |
| Asus ROG Zephyrus M15 GU502L | |
| MSI GS66 10SGS | |
| Multi-Core | |
| Genomsnitt av klass Gaming (6460 - 27010, n=110, senaste 2 åren) | |
| Gigabyte Aero 15 OLED XB-8DE51B0SP | |
| Schenker Key 15 Comet Lake | |
| Razer Blade 15 RTX 2070 Super Max-Q | |
| MSI GS66 10SGS | |
| Asus ROG Zephyrus M15 GU502L | |
| Acer Predator Triton 500 PT515-52-70N3 | |
| Genomsnitt Intel Core i7-10750H (4443 - 6674, n=43) | |
| HWBOT x265 Benchmark v2.2 - 4k Preset | |
| Genomsnitt av klass Gaming (11.5 - 44.3, n=110, senaste 2 åren) | |
| Gigabyte Aero 15 OLED XB-8DE51B0SP | |
| Razer Blade 15 RTX 2070 Super Max-Q | |
| Schenker Key 15 Comet Lake | |
| Asus ROG Zephyrus M15 GU502L | |
| Acer Predator Triton 500 PT515-52-70N3 | |
| MSI GS66 10SGS | |
| Genomsnitt Intel Core i7-10750H (5.54 - 11.6, n=43) | |
| LibreOffice - 20 Documents To PDF | |
| Asus ROG Zephyrus M15 GU502L | |
| MSI GS66 10SGS | |
| Genomsnitt Intel Core i7-10750H (43.1 - 99.2, n=43) | |
| Gigabyte Aero 15 OLED XB-8DE51B0SP | |
| Acer Predator Triton 500 PT515-52-70N3 | |
| Schenker Key 15 Comet Lake | |
| Genomsnitt av klass Gaming (19 - 88.8, n=110, senaste 2 åren) | |
| Razer Blade 15 RTX 2070 Super Max-Q | |
| R Benchmark 2.5 - Overall mean | |
| MSI GS66 10SGS | |
| Asus ROG Zephyrus M15 GU502L | |
| Genomsnitt Intel Core i7-10750H (0.578 - 0.708, n=42) | |
| Acer Predator Triton 500 PT515-52-70N3 | |
| Razer Blade 15 RTX 2070 Super Max-Q | |
| Schenker Key 15 Comet Lake | |
| Gigabyte Aero 15 OLED XB-8DE51B0SP | |
| Genomsnitt av klass Gaming (0.3439 - 0.759, n=111, senaste 2 åren) | |
* ... mindre är bättre
| PCMark 8 Home Score Accelerated v2 | 3409 poäng | |
| PCMark 8 Creative Score Accelerated v2 | 4848 poäng | |
| PCMark 8 Work Score Accelerated v2 | 4396 poäng | |
| PCMark 10 Score | 5208 poäng | |
Hjälp | ||
| PCMark 10 - Score | |
| Genomsnitt av klass Gaming (5828 - 11574, n=95, senaste 2 åren) | |
| Razer Blade 15 RTX 2070 Super Max-Q | |
| Gigabyte Aero 15 OLED XB-8DE51B0SP | |
| MSI GS66 10SGS | |
| Schenker Key 15 Comet Lake | |
| Genomsnitt Intel Core i7-10750H, NVIDIA GeForce RTX 2070 Max-Q (5208 - 6301, n=3) | |
| Acer Predator Triton 500 PT515-52-70N3 | |
| Asus ROG Zephyrus M15 GU502GU-XB74 | |
| Asus ROG Zephyrus M15 GU502L | |
| PCMark 8 | |
| Home Score Accelerated v2 | |
| Razer Blade 15 RTX 2070 Super Max-Q | |
| Genomsnitt av klass Gaming (n=1senaste 2 åren) | |
| MSI GS66 10SGS | |
| Schenker Key 15 Comet Lake | |
| Asus ROG Zephyrus M15 GU502GU-XB74 | |
| Genomsnitt Intel Core i7-10750H, NVIDIA GeForce RTX 2070 Max-Q (3409 - 4410, n=3) | |
| Asus ROG Zephyrus M15 GU502L | |
| Work Score Accelerated v2 | |
| Razer Blade 15 RTX 2070 Super Max-Q | |
| MSI GS66 10SGS | |
| Schenker Key 15 Comet Lake | |
| Asus ROG Zephyrus M15 GU502GU-XB74 | |
| Genomsnitt Intel Core i7-10750H, NVIDIA GeForce RTX 2070 Max-Q (4396 - 5556, n=3) | |
| Asus ROG Zephyrus M15 GU502L | |
| Genomsnitt av klass Gaming (n=1senaste 2 åren) | |
| DPC Latencies / LatencyMon - interrupt to process latency (max), Web, Youtube, Prime95 | |
| Acer Predator Triton 500 PT515-52-70N3 | |
| Gigabyte Aero 15 OLED XB-8DE51B0SP | |
| Razer Blade 15 RTX 2070 Super Max-Q | |
| Asus ROG Zephyrus M15 GU502L | |
| MSI GS66 10SGS | |
| Schenker Key 15 Comet Lake | |
* ... mindre är bättre

| Asus ROG Zephyrus M15 GU502L 2x Intel SSD 660p SSDPEKNW512G8 (RAID 0) | Asus ROG Zephyrus M15 GU502GU-XB74 Intel SSD 660p SSDPEKNW512G8 | Schenker Key 15 Comet Lake Samsung SSD 970 EVO Plus 1TB | Razer Blade 15 RTX 2070 Super Max-Q Samsung SSD PM981a MZVLB512HBJQ | Gigabyte Aero 15 OLED XB-8DE51B0SP Intel Optane Memory H10 with Solid State Storage 32GB + 512GB HBRPEKNX0202A(L/H) | Acer Predator Triton 500 PT515-52-70N3 Samsung SSD PM981a MZVLB512HBJQ | MSI GS66 10SGS Samsung SSD PM981 MZVLB512HAJQ | |
|---|---|---|---|---|---|---|---|
| CrystalDiskMark 5.2 / 6 | -18% | 36% | 15% | 3% | 16% | 0% | |
| Write 4K (MB/s) | 123 | 156 27% | 193 57% | 139.8 14% | 127.4 4% | 131.7 7% | 132.5 8% |
| Read 4K (MB/s) | 52.5 | 60.7 16% | 54.3 3% | 48.62 -7% | 147.5 181% | 47.34 -10% | 45.03 -14% |
| Write Seq (MB/s) | 1698 | 968 -43% | 2988 76% | 2260 33% | 485.9 -71% | 2884 70% | 1987 17% |
| Read Seq (MB/s) | 2440 | 1619 -34% | 2633 8% | 2135 -12% | 1352 -45% | 2303 -6% | 1434 -41% |
| Write 4K Q32T1 (MB/s) | 450.4 | 485 8% | 540 20% | 499.3 11% | 476.5 6% | 423.9 -6% | 467.5 4% |
| Read 4K Q32T1 (MB/s) | 550 | 337.3 -39% | 620 13% | 552 0% | 531 -3% | 487.7 -11% | 536 -3% |
| Write Seq Q32T1 (MB/s) | 1794 | 969 -46% | 3284 83% | 2960 65% | 1061 -41% | 2822 57% | 2003 12% |
| Read Seq Q32T1 (MB/s) | 2812 | 1825 -35% | 3564 27% | 3269 16% | 2552 -9% | 3478 24% | 3306 18% |
| AS SSD | -44% | 128% | 27% | -11% | 42% | 24% | |
| Seq Read (MB/s) | 2523 | 1221 -52% | 2928 16% | 1957 -22% | 1200 -52% | 2767 10% | 1086 -57% |
| Seq Write (MB/s) | 1578 | 911 -42% | 2733 73% | 2092 33% | 836 -47% | 2613 66% | 1901 20% |
| 4K Read (MB/s) | 50.4 | 48.24 -4% | 51.6 2% | 50.2 0% | 65.8 31% | 47.55 -6% | 51 1% |
| 4K Write (MB/s) | 115.6 | 99.2 -14% | 129.8 12% | 96.5 -17% | 103.8 -10% | 98.9 -14% | 117.3 1% |
| 4K-64 Read (MB/s) | 634 | 321.4 -49% | 1838 190% | 1594 151% | 789 24% | 1205 90% | 1503 137% |
| 4K-64 Write (MB/s) | 1114 | 744 -33% | 2291 106% | 2005 80% | 929 -17% | 2007 80% | 1721 54% |
| Access Time Read * (ms) | 0.095 | 0.071 25% | 0.062 35% | 0.057 40% | 0.103 -8% | 0.065 32% | 0.059 38% |
| Access Time Write * (ms) | 0.038 | 0.139 -266% | 0.029 24% | 0.112 -195% | 0.045 -18% | 0.038 -0% | 0.1 -163% |
| Score Read (Points) | 936 | 492 -47% | 2183 133% | 1840 97% | 975 4% | 1529 63% | 1662 78% |
| Score Write (Points) | 1388 | 934 -33% | 2694 94% | 2310 66% | 1117 -20% | 2367 71% | 2029 46% |
| Score Total (Points) | 2770 | 1681 -39% | 5984 116% | 5103 84% | 2594 -6% | 4677 69% | 4588 66% |
| Copy ISO MB/s (MB/s) | 2106 | 906 -57% | 2183 4% | 1793 -15% | 2155 2% | ||
| Copy Program MB/s (MB/s) | 549 | 486.6 -11% | 2694 391% | 573 4% | 715 30% | ||
| Copy Game MB/s (MB/s) | 854 | 952 11% | 5984 601% | 1418 66% | 1506 76% | ||
| Totalt genomsnitt (program/inställningar) | -31% /
-34% | 82% /
95% | 21% /
22% | -4% /
-5% | 29% /
31% | 12% /
15% |
* ... mindre är bättre
Kontinuerlig inläsning: DiskSpd Read Loop, Queue Depth 8
| 3DMark 11 Performance | 19044 poäng | |
| 3DMark Cloud Gate Standard Score | 39844 poäng | |
| 3DMark Fire Strike Score | 15573 poäng | |
| 3DMark Time Spy Score | 6604 poäng | |
Hjälp | ||
| 3DMark | |
| 1920x1080 Fire Strike Graphics | |
| Genomsnitt av klass Gaming (12242 - 62849, n=120, senaste 2 åren) | |
| Acer Predator Triton 500 PT515-52-70N3 | |
| Schenker Key 15 Comet Lake | |
| Gigabyte Aero 15 OLED XB-8DE51B0SP | |
| Razer Blade 15 RTX 2070 Super Max-Q | |
| MSI GS66 10SGS | |
| Genomsnitt NVIDIA GeForce RTX 2070 Max-Q (11563 - 21191, n=31) | |
| Asus ROG Zephyrus M15 GU502L | |
| Asus ROG Zephyrus M15 GU502GU-XB74 | |
| 2560x1440 Time Spy Graphics | |
| Genomsnitt av klass Gaming (5012 - 26212, n=119, senaste 2 åren) | |
| Acer Predator Triton 500 PT515-52-70N3 | |
| Schenker Key 15 Comet Lake | |
| Razer Blade 15 RTX 2070 Super Max-Q | |
| Gigabyte Aero 15 OLED XB-8DE51B0SP | |
| Asus ROG Zephyrus M15 GU502L (Turbo) | |
| MSI GS66 10SGS | |
| Genomsnitt NVIDIA GeForce RTX 2070 Max-Q (5948 - 8065, n=28) | |
| Asus ROG Zephyrus M15 GU502L | |
| Asus ROG Zephyrus M15 GU502GU-XB74 | |
| 3DMark 11 - 1280x720 Performance GPU | |
| Genomsnitt av klass Gaming (21841 - 80022, n=108, senaste 2 åren) | |
| Acer Predator Triton 500 PT515-52-70N3 | |
| Gigabyte Aero 15 OLED XB-8DE51B0SP | |
| Schenker Key 15 Comet Lake | |
| Razer Blade 15 RTX 2070 Super Max-Q | |
| Asus ROG Zephyrus M15 GU502L (Turbo) | |
| MSI GS66 10SGS | |
| Genomsnitt NVIDIA GeForce RTX 2070 Max-Q (14723 - 27694, n=31) | |
| Asus ROG Zephyrus M15 GU502L | |
| Asus ROG Zephyrus M15 GU502GU-XB74 | |
| The Witcher 3 - 1920x1080 Ultra Graphics & Postprocessing (HBAO+) | |
| Genomsnitt av klass Gaming (95 - 240, n=8, senaste 2 åren) | |
| Schenker Key 15 Comet Lake | |
| Asus ROG Zephyrus M15 GU502L (Turbo) | |
| Acer Predator Triton 500 PT515-52-70N3 | |
| Gigabyte Aero 15 OLED XB-8DE51B0SP | |
| MSI GS66 10SGS | |
| Razer Blade 15 RTX 2070 Super Max-Q | |
| Asus ROG Zephyrus M15 GU502L | |
| Genomsnitt NVIDIA GeForce RTX 2070 Max-Q (56 - 83.8, n=31) | |
| Asus ROG Zephyrus M15 GU502GU-XB74 | |
| F1 2020 - 1920x1080 Ultra High Preset AA:T AF:16x | |
| Asus ROG Zephyrus M15 GU502L (Turbo) | |
| Genomsnitt NVIDIA GeForce RTX 2070 Max-Q (101 - 109, n=2) | |
| Schenker Key 15 Comet Lake | |
| Asus ROG Zephyrus M15 GU502L | |
| Horizon Zero Dawn - 1920x1080 Ultimate Quality | |
| Schenker Key 15 Comet Lake | |
| Asus ROG Zephyrus M15 GU502L (Turbo) | |
| Genomsnitt NVIDIA GeForce RTX 2070 Max-Q (60 - 68, n=2) | |
| Asus ROG Zephyrus M15 GU502L | |
| Doom Eternal - 1920x1080 Ultra Preset | |
| Schenker Key 15 Comet Lake | |
| Acer Predator Triton 500 PT515-52-70N3 | |
| MSI GS66 10SGS | |
| Asus ROG Zephyrus M15 GU502L (Turbo) | |
| Genomsnitt NVIDIA GeForce RTX 2070 Max-Q (125.6 - 137.9, n=4) | |
| Asus ROG Zephyrus M15 GU502L | |
| Death Stranding - 1920x1080 Very High Preset | |
| Schenker Key 15 Comet Lake | |
| Asus ROG Zephyrus M15 GU502L (Turbo) | |
| Genomsnitt NVIDIA GeForce RTX 2070 Max-Q (81.3 - 97.9, n=2) | |
| Asus ROG Zephyrus M15 GU502L | |
| Flight Simulator 2020 - 1920x1080 Ultra AA:TAA AF:16x | |
| Asus ROG Zephyrus M15 GU502L (Turbo) | |
| Genomsnitt NVIDIA GeForce RTX 2070 Max-Q (32 - 35.5, n=2) | |
| Asus ROG Zephyrus M15 GU502L | |
| låg | med. | hög | ultra | QHD | 4K | |
|---|---|---|---|---|---|---|
| BioShock Infinite (2013) | 376.4 | 318.1 | 296.9 | 152.6 | ||
| The Witcher 3 (2015) | 291.2 | 212 | 127.4 | 70.7 | 46.7 | |
| Shadow of the Tomb Raider (2018) | 87 | 82 | 80 | 75 | 55 | 29 |
| Doom Eternal (2020) | 205.6 | 140.4 | 127.8 | 125.6 | 95.2 | 53.2 |
| Gears Tactics (2020) | 210.9 | 157.7 | 100.8 | 100.8 | 72.4 | 38.2 |
| F1 2020 (2020) | 225 | 146 | 129 | 101 | 75 | 43 |
| Death Stranding (2020) | 99.6 | 96.5 | 89 | 81.3 | 61.1 | 36.6 |
| Horizon Zero Dawn (2020) | 125 | 92 | 77 | 60 | 47 | 27 |
| Flight Simulator 2020 (2020) | 54.7 | 45.2 | 38.9 | 32 | 24.6 | 16 |
| Serious Sam 4 (2020) | 127 | 84.3 | 75.3 | 59.9 | 48.2 | 31 |
| Mafia Definitive Edition (2020) | 126.4 | 83.8 | 77.5 | 52.2 | 27.2 |
Ljudnivå
| Låg belastning |
| 31 / 32 / 36 dB(A) |
| Hög belastning |
| 55 / 57 dB(A) |
 | ||
30 dB tyst 40 dB(A) hörbar 50 dB(A) högt ljud |
||
min: | ||
| Asus ROG Zephyrus M15 GU502L i7-10750H, GeForce RTX 2070 Max-Q | Asus ROG Zephyrus M15 GU502GU-XB74 i7-9750H, GeForce GTX 1660 Ti Mobile | Schenker Key 15 Comet Lake i7-10875H, GeForce RTX 2080 Super Max-Q | Razer Blade 15 RTX 2070 Super Max-Q i7-10875H, GeForce RTX 2070 Super Max-Q | Gigabyte Aero 15 OLED XB-8DE51B0SP i7-10875H, GeForce RTX 2070 Super Max-Q | Acer Predator Triton 500 PT515-52-70N3 i7-10750H, GeForce RTX 2080 Super Max-Q | MSI GS66 10SGS i7-10750H, GeForce RTX 2080 Super Max-Q | Genomsnitt av klass Gaming | |
|---|---|---|---|---|---|---|---|---|
| Noise | 5% | 4% | 10% | -4% | 1% | 6% | 13% | |
| av / miljö * (dB) | 25 | 28.2 -13% | 25 -0% | 27 -8% | 30 -20% | 30 -20% | 28.5 -14% | 24.1 ? 4% |
| Idle Minimum * (dB) | 31 | 28.7 7% | 26 16% | 27 13% | 34 -10% | 30 3% | 30 3% | 25.8 ? 17% |
| Idle Average * (dB) | 32 | 30.5 5% | 27 16% | 27 16% | 36 -13% | 33 -3% | 30 6% | 27.4 ? 14% |
| Idle Maximum * (dB) | 36 | 31 14% | 44 -22% | 27 25% | 41 -14% | 36 -0% | 30.9 14% | 30 ? 17% |
| Load Average * (dB) | 55 | 39 29% | 53 4% | 44.7 19% | 48 13% | 50 9% | 39.5 28% | 43 ? 22% |
| Witcher 3 ultra * (dB) | 53 | 54.2 -2% | 51 4% | 51.2 3% | 48 9% | 48 9% | 48 9% | |
| Load Maximum * (dB) | 57 | 59.6 -5% | 53 7% | 54 5% | 54 5% | 50 12% | 59.4 -4% | 54 ? 5% |
* ... mindre är bättre
(-) Den maximala temperaturen på ovansidan är 54 °C / 129 F, jämfört med genomsnittet av 40.4 °C / 105 F , allt från 21.2 till 68.8 °C för klassen Gaming.
(-) Botten värms upp till maximalt 63 °C / 145 F, jämfört med genomsnittet av 43.2 °C / 110 F
(+) Vid tomgångsbruk är medeltemperaturen för ovansidan 26.6 °C / 80 F, jämfört med enhetsgenomsnittet på 33.9 °C / ### class_avg_f### F.
(-) När du spelar The Witcher 3 är medeltemperaturen för ovansidan 44.6 °C / 112 F, jämfört med enhetsgenomsnittet på 33.9 °C / ## #class_avg_f### F.
(±) Handledsstöden och pekplattan kan bli väldigt varma vid beröring med maximalt 39 °C / 102.2 F.
(-) Medeltemperaturen för handledsstödsområdet på liknande enheter var 28.8 °C / 83.8 F (-10.2 °C / -18.4 F).
| Asus ROG Zephyrus M15 GU502L i7-10750H, GeForce RTX 2070 Max-Q | Asus ROG Zephyrus M15 GU502GU-XB74 i7-9750H, GeForce GTX 1660 Ti Mobile | Schenker Key 15 Comet Lake i7-10875H, GeForce RTX 2080 Super Max-Q | Razer Blade 15 RTX 2070 Super Max-Q i7-10875H, GeForce RTX 2070 Super Max-Q | Gigabyte Aero 15 OLED XB-8DE51B0SP i7-10875H, GeForce RTX 2070 Super Max-Q | Acer Predator Triton 500 PT515-52-70N3 i7-10750H, GeForce RTX 2080 Super Max-Q | MSI GS66 10SGS i7-10750H, GeForce RTX 2080 Super Max-Q | Genomsnitt av klass Gaming | |
|---|---|---|---|---|---|---|---|---|
| Heat | -11% | -8% | -17% | 1% | 5% | 1% | -1% | |
| Maximum Upper Side * (°C) | 54 | 49.8 8% | 52 4% | 50 7% | 49 9% | 44 19% | 47.8 11% | 45.2 ? 16% |
| Maximum Bottom * (°C) | 63 | 63.2 -0% | 62 2% | 52.2 17% | 61 3% | 50 21% | 54.4 14% | 48 ? 24% |
| Idle Upper Side * (°C) | 27 | 32 -19% | 31 -15% | 37.2 -38% | 27 -0% | 29 -7% | 27.4 -1% | 31.1 ? -15% |
| Idle Bottom * (°C) | 27 | 36.2 -34% | 33 -22% | 41.4 -53% | 29 -7% | 31 -15% | 32 -19% | 34.2 ? -27% |
* ... mindre är bättre
Asus ROG Zephyrus M15 GU502L ljudanalys
(+) | högtalare kan spela relativt högt (85 dB)
Bas 100 - 315 Hz
(±) | reducerad bas - i genomsnitt 10.4% lägre än medianen
(±) | linjäriteten för basen är genomsnittlig (9% delta till föregående frekvens)
Mellan 400 - 2000 Hz
(+) | balanserad mellan - endast 1.7% från medianen
(+) | mids är linjära (2.8% delta till föregående frekvens)
Högsta 2 - 16 kHz
(+) | balanserade toppar - endast 4% från medianen
(+) | toppar är linjära (6.1% delta till föregående frekvens)
Totalt 100 - 16 000 Hz
(+) | det totala ljudet är linjärt (8.6% skillnad mot median)
Jämfört med samma klass
» 2% av alla testade enheter i den här klassen var bättre, 1% liknande, 97% sämre
» Den bästa hade ett delta på 6%, genomsnittet var 18%, sämst var 132%
Jämfört med alla testade enheter
» 2% av alla testade enheter var bättre, 1% liknande, 97% sämre
» Den bästa hade ett delta på 4%, genomsnittet var 24%, sämst var 134%
| Av/Standby | |
| Låg belastning | |
| Hög belastning |
|
Förklaring:
min: | |
| Asus ROG Zephyrus M15 GU502L i7-10750H, GeForce RTX 2070 Max-Q | Asus ROG Zephyrus M15 GU502GU-XB74 i7-9750H, GeForce GTX 1660 Ti Mobile | Schenker Key 15 Comet Lake i7-10875H, GeForce RTX 2080 Super Max-Q | Razer Blade 15 RTX 2070 Super Max-Q i7-10875H, GeForce RTX 2070 Super Max-Q | Gigabyte Aero 15 OLED XB-8DE51B0SP i7-10875H, GeForce RTX 2070 Super Max-Q | Acer Predator Triton 500 PT515-52-70N3 i7-10750H, GeForce RTX 2080 Super Max-Q | MSI GS66 10SGS i7-10750H, GeForce RTX 2080 Super Max-Q | Genomsnitt av klass Gaming | |
|---|---|---|---|---|---|---|---|---|
| Power Consumption | -46% | 7% | -28% | -35% | 0% | -13% | -15% | |
| Idle Minimum * (Watt) | 10 | 17.6 -76% | 10 -0% | 14.3 -43% | 18 -80% | 11 -10% | 14.9 -49% | 13.2 ? -32% |
| Idle Average * (Watt) | 13 | 24.7 -90% | 14 -8% | 22.3 -72% | 21 -62% | 15 -15% | 17.5 -35% | 18.9 ? -45% |
| Idle Maximum * (Watt) | 23 | 56.3 -145% | 18 22% | 36.9 -60% | 38 -65% | 25 -9% | 29.5 -28% | 24.3 ? -6% |
| Load Average * (Watt) | 137 | 111.1 19% | 106 23% | 118.4 14% | 113 18% | 95 31% | 94.8 31% | 108 ? 21% |
| Witcher 3 ultra * (Watt) | 140 | 149 -6% | 142 -1% | 153.7 -10% | 149 -6% | 140 -0% | 146.1 -4% | |
| Load Maximum * (Watt) | 222 | 170 23% | 210 5% | 220.8 1% | 256 -15% | 211 5% | 210.9 5% | 254 ? -14% |
* ... mindre är bättre
| Asus ROG Zephyrus M15 GU502L i7-10750H, GeForce RTX 2070 Max-Q, 76 Wh | Asus ROG Zephyrus M15 GU502GU-XB74 i7-9750H, GeForce GTX 1660 Ti Mobile, 76 Wh | Schenker Key 15 Comet Lake i7-10875H, GeForce RTX 2080 Super Max-Q, 73 Wh | Razer Blade 15 RTX 2070 Super Max-Q i7-10875H, GeForce RTX 2070 Super Max-Q, 80 Wh | Gigabyte Aero 15 OLED XB-8DE51B0SP i7-10875H, GeForce RTX 2070 Super Max-Q, 94.2 Wh | Acer Predator Triton 500 PT515-52-70N3 i7-10750H, GeForce RTX 2080 Super Max-Q, 84 Wh | MSI GS66 10SGS i7-10750H, GeForce RTX 2080 Super Max-Q, 99.99 Wh | Genomsnitt av klass Gaming | |
|---|---|---|---|---|---|---|---|---|
| Batteridrifttid | -7% | -13% | 15% | 33% | -0% | 17% | 16% | |
| Reader / Idle (h) | 8.6 | 7.1 -17% | 7 -19% | 8.6 0% | 8.3 -3% | 10.2 19% | 8.71 ? 1% | |
| H.264 (h) | 6 | 5.7 -5% | 8.26 ? 38% | |||||
| WiFi v1.3 (h) | 5.5 | 4.5 -18% | 4.8 -13% | 6.3 15% | 6.1 11% | 6.3 15% | 6.9 25% | 7.02 ? 28% |
| Load (h) | 1.5 | 1.7 13% | 1.3 -13% | 2.8 87% | 1.3 -13% | 1.6 7% | 1.47 ? -2% |
För
Emot
Läs den fullständiga versionen av den här recensionen på engelska här.
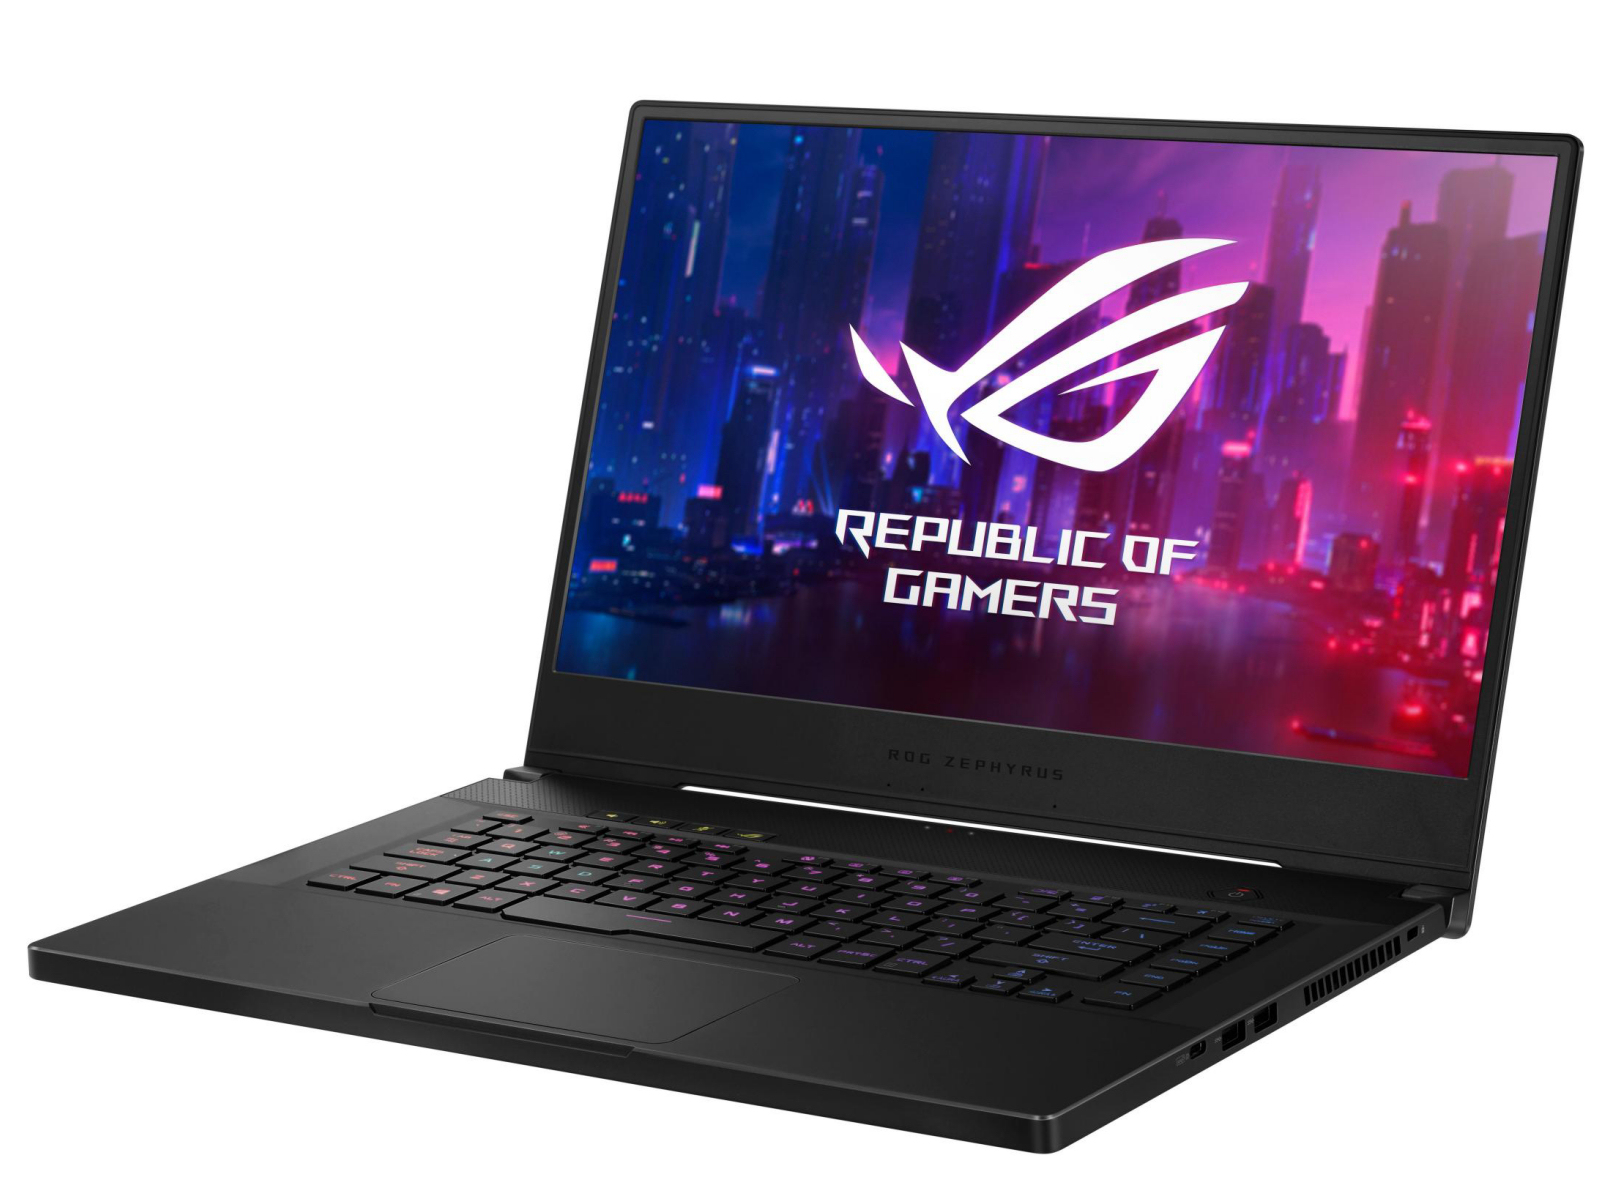
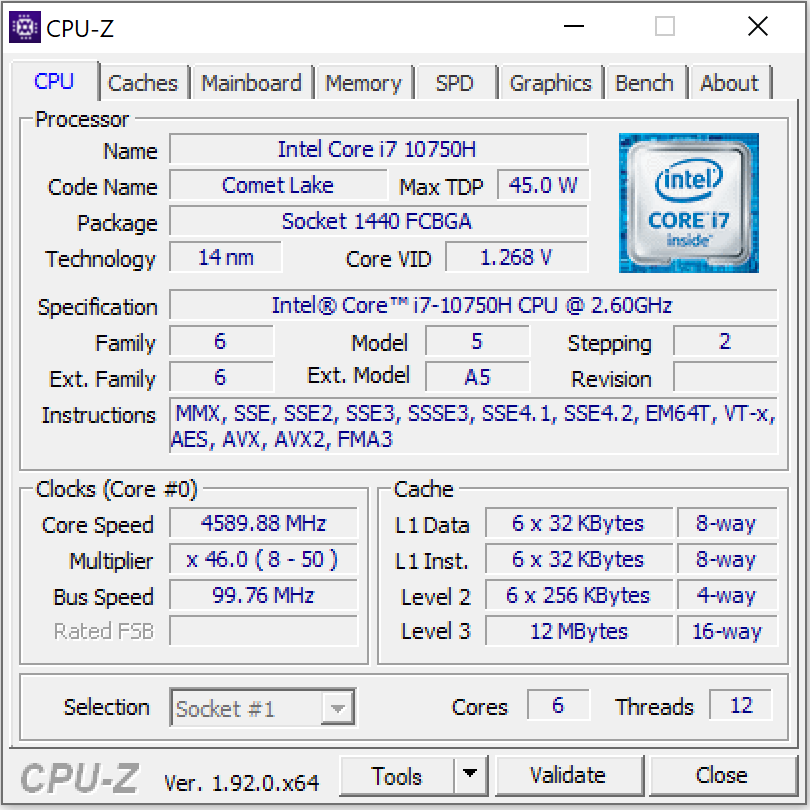
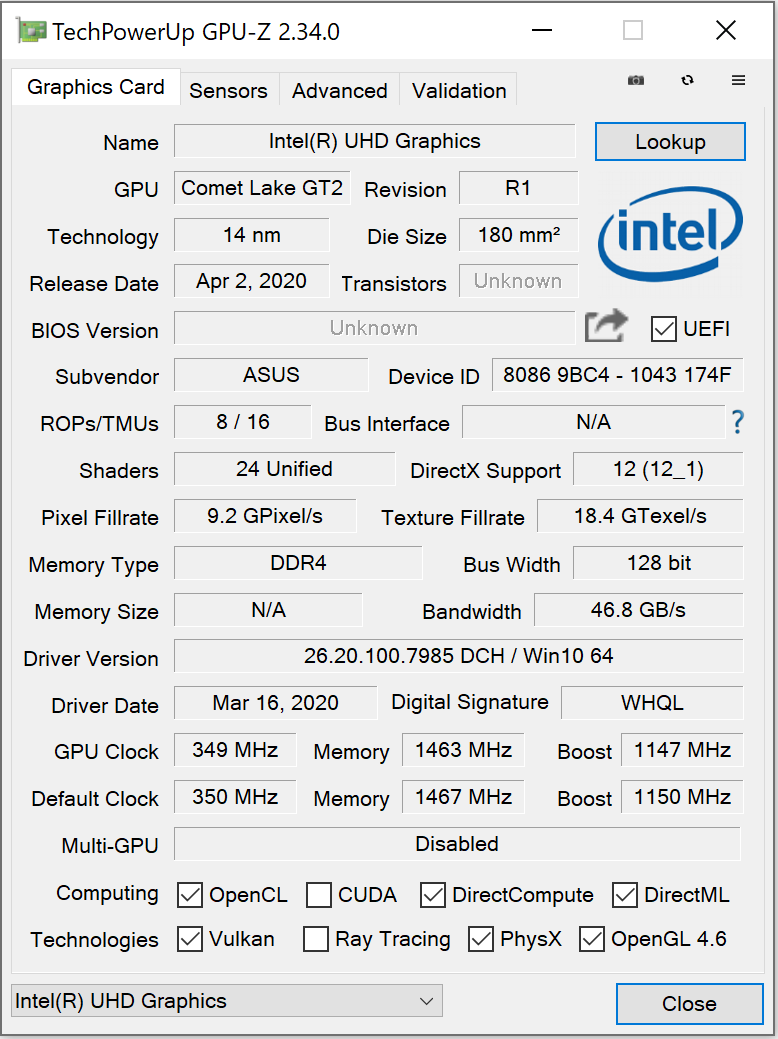
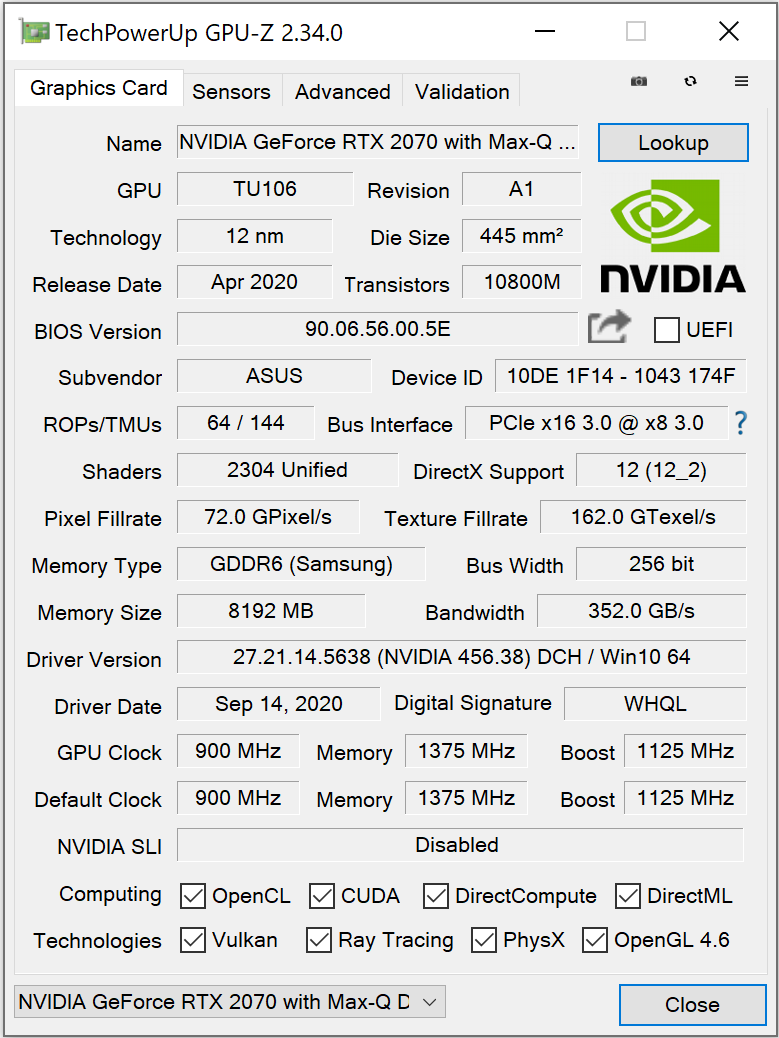
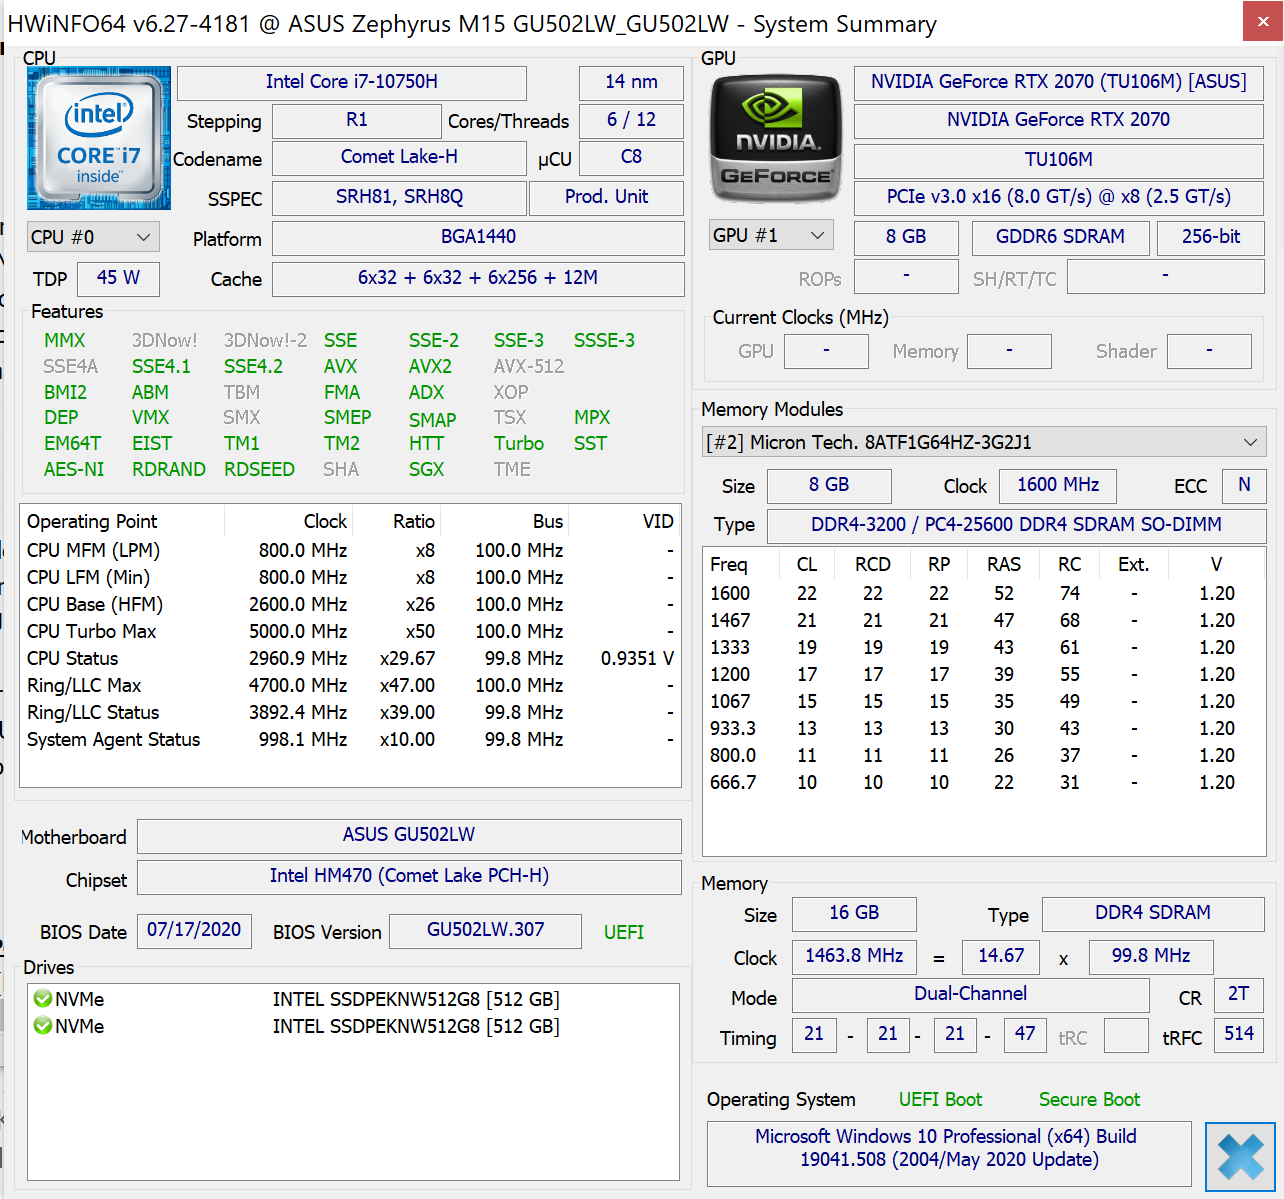
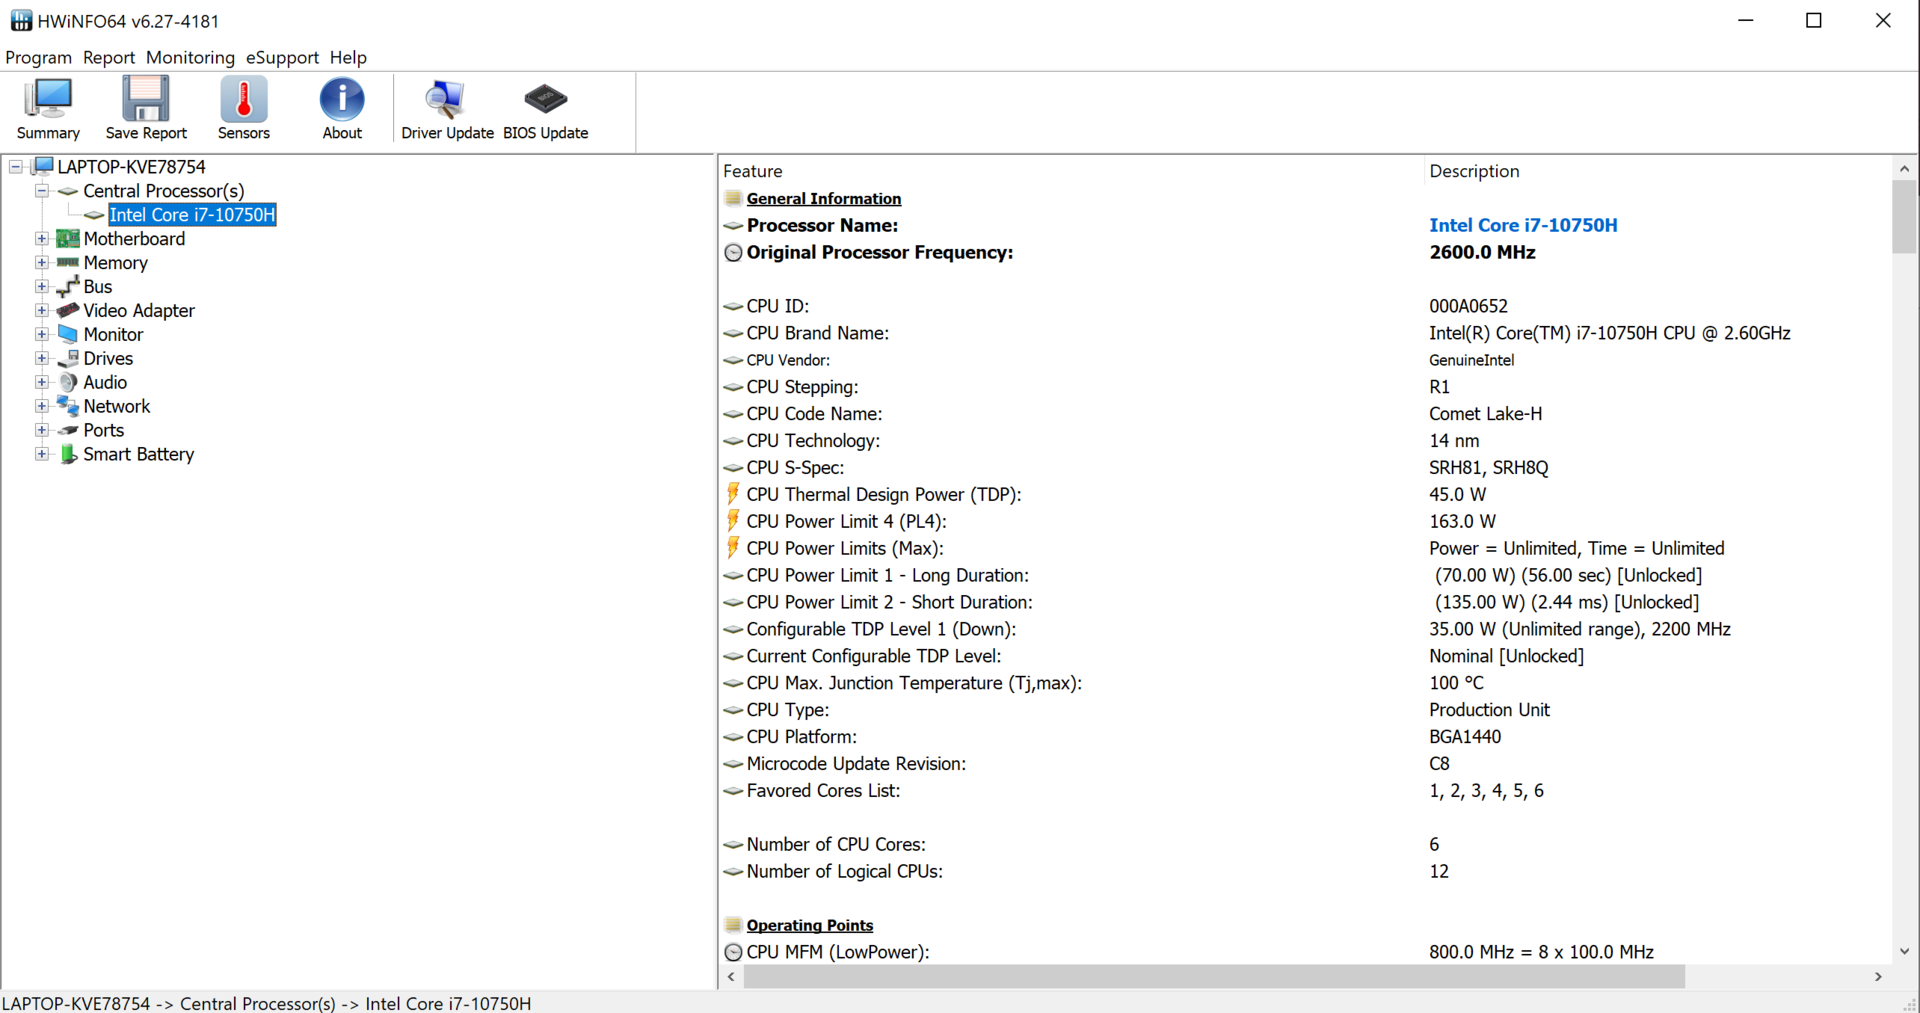
Med Zephyrus M15 erbjuder Asus en tunn och kompakt spellaptop på 15.6 tum som kan visa alla moderna datorspel smidigt på sin skärm. En Core i7-10750H CPU och en GeForce RTX 2070 Max-Q GPU gör detta möjligt.
Asus ROG Zephyrus M15 GU502L har gott om spelprestanda trots kompakta dimensioner.
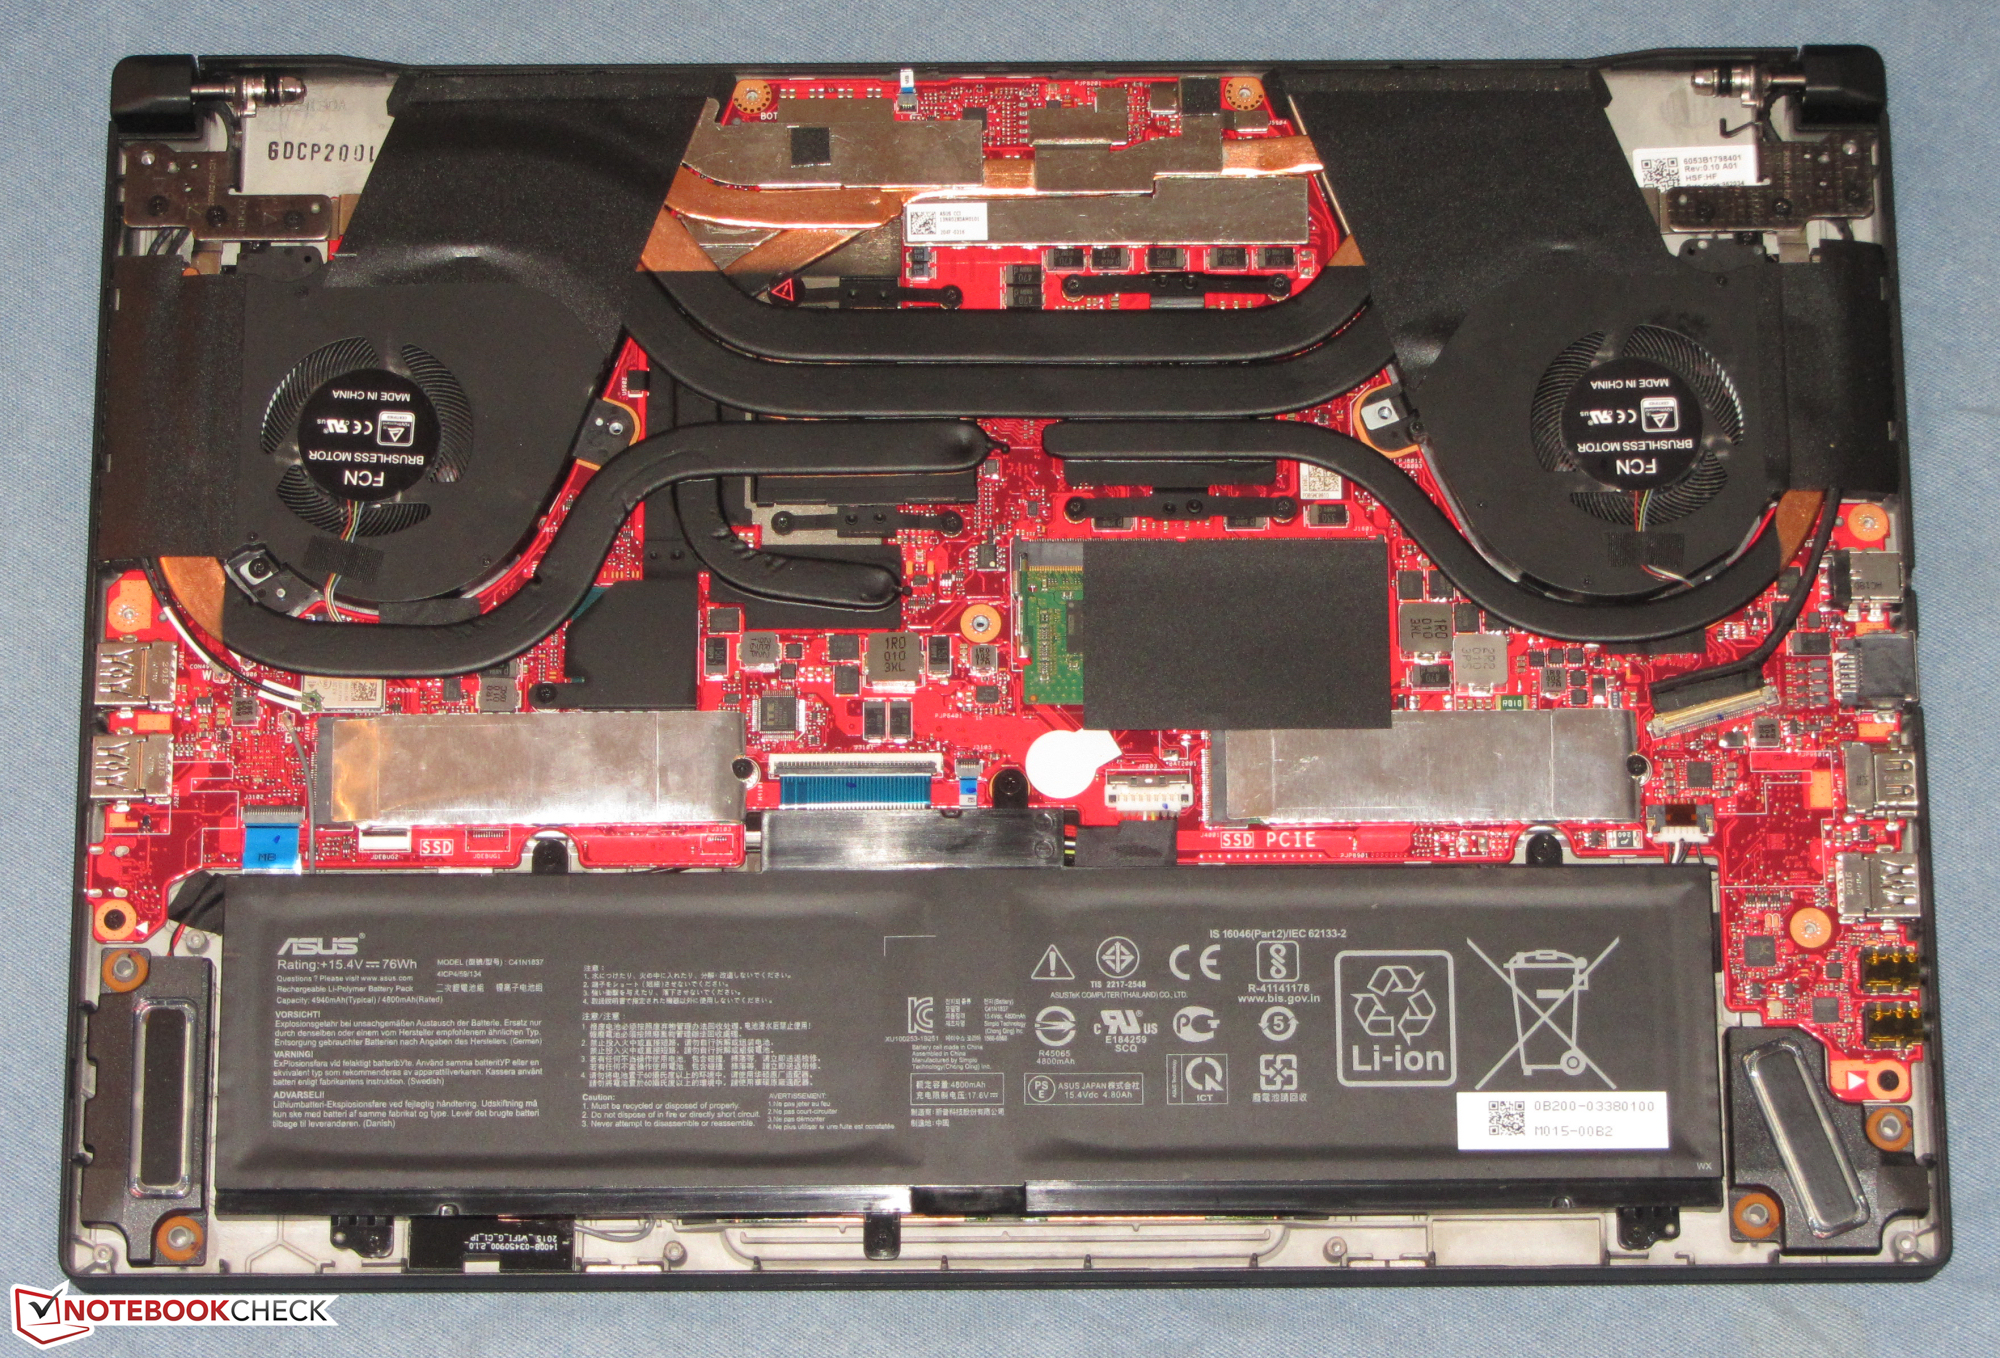
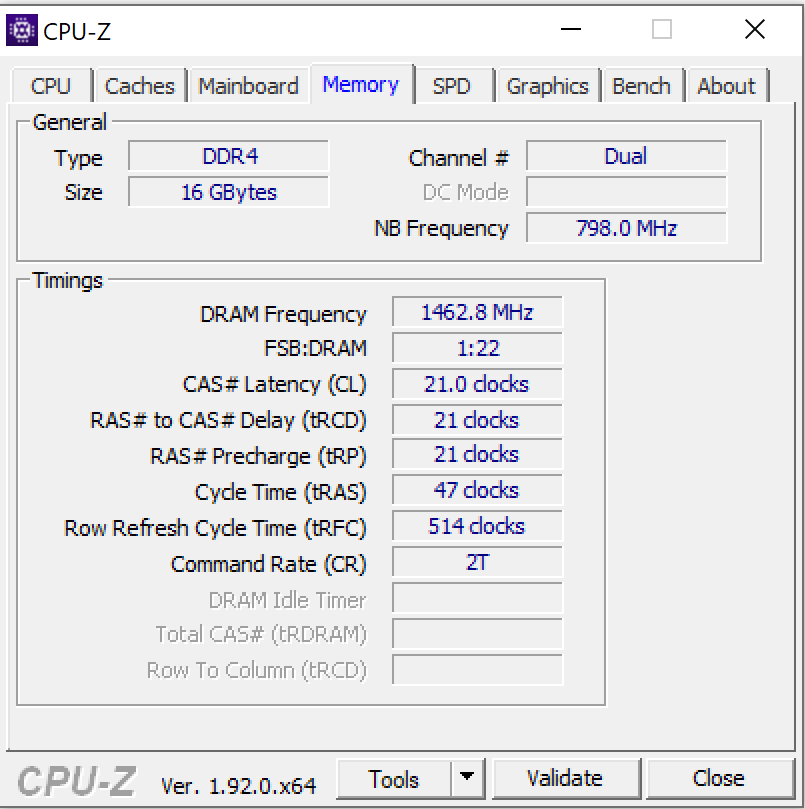
Lagringssystemet kan fortfarande bli bättre. Delar av datorns RAM (8 GB av totalt 16 GB; dubbla kanaler) är fastlött och det finns bara en minnesplats, så den maximala kapaciteten går bara till 38 GB. Många konkurrenter tillåter upp till 64 GB. RAID-0 gruppen (1 TB) är väldigt snabb, men når inte upp till samma överföringshastigheter vid enkel drift som andra tillverkares bästa SSD-enheter.
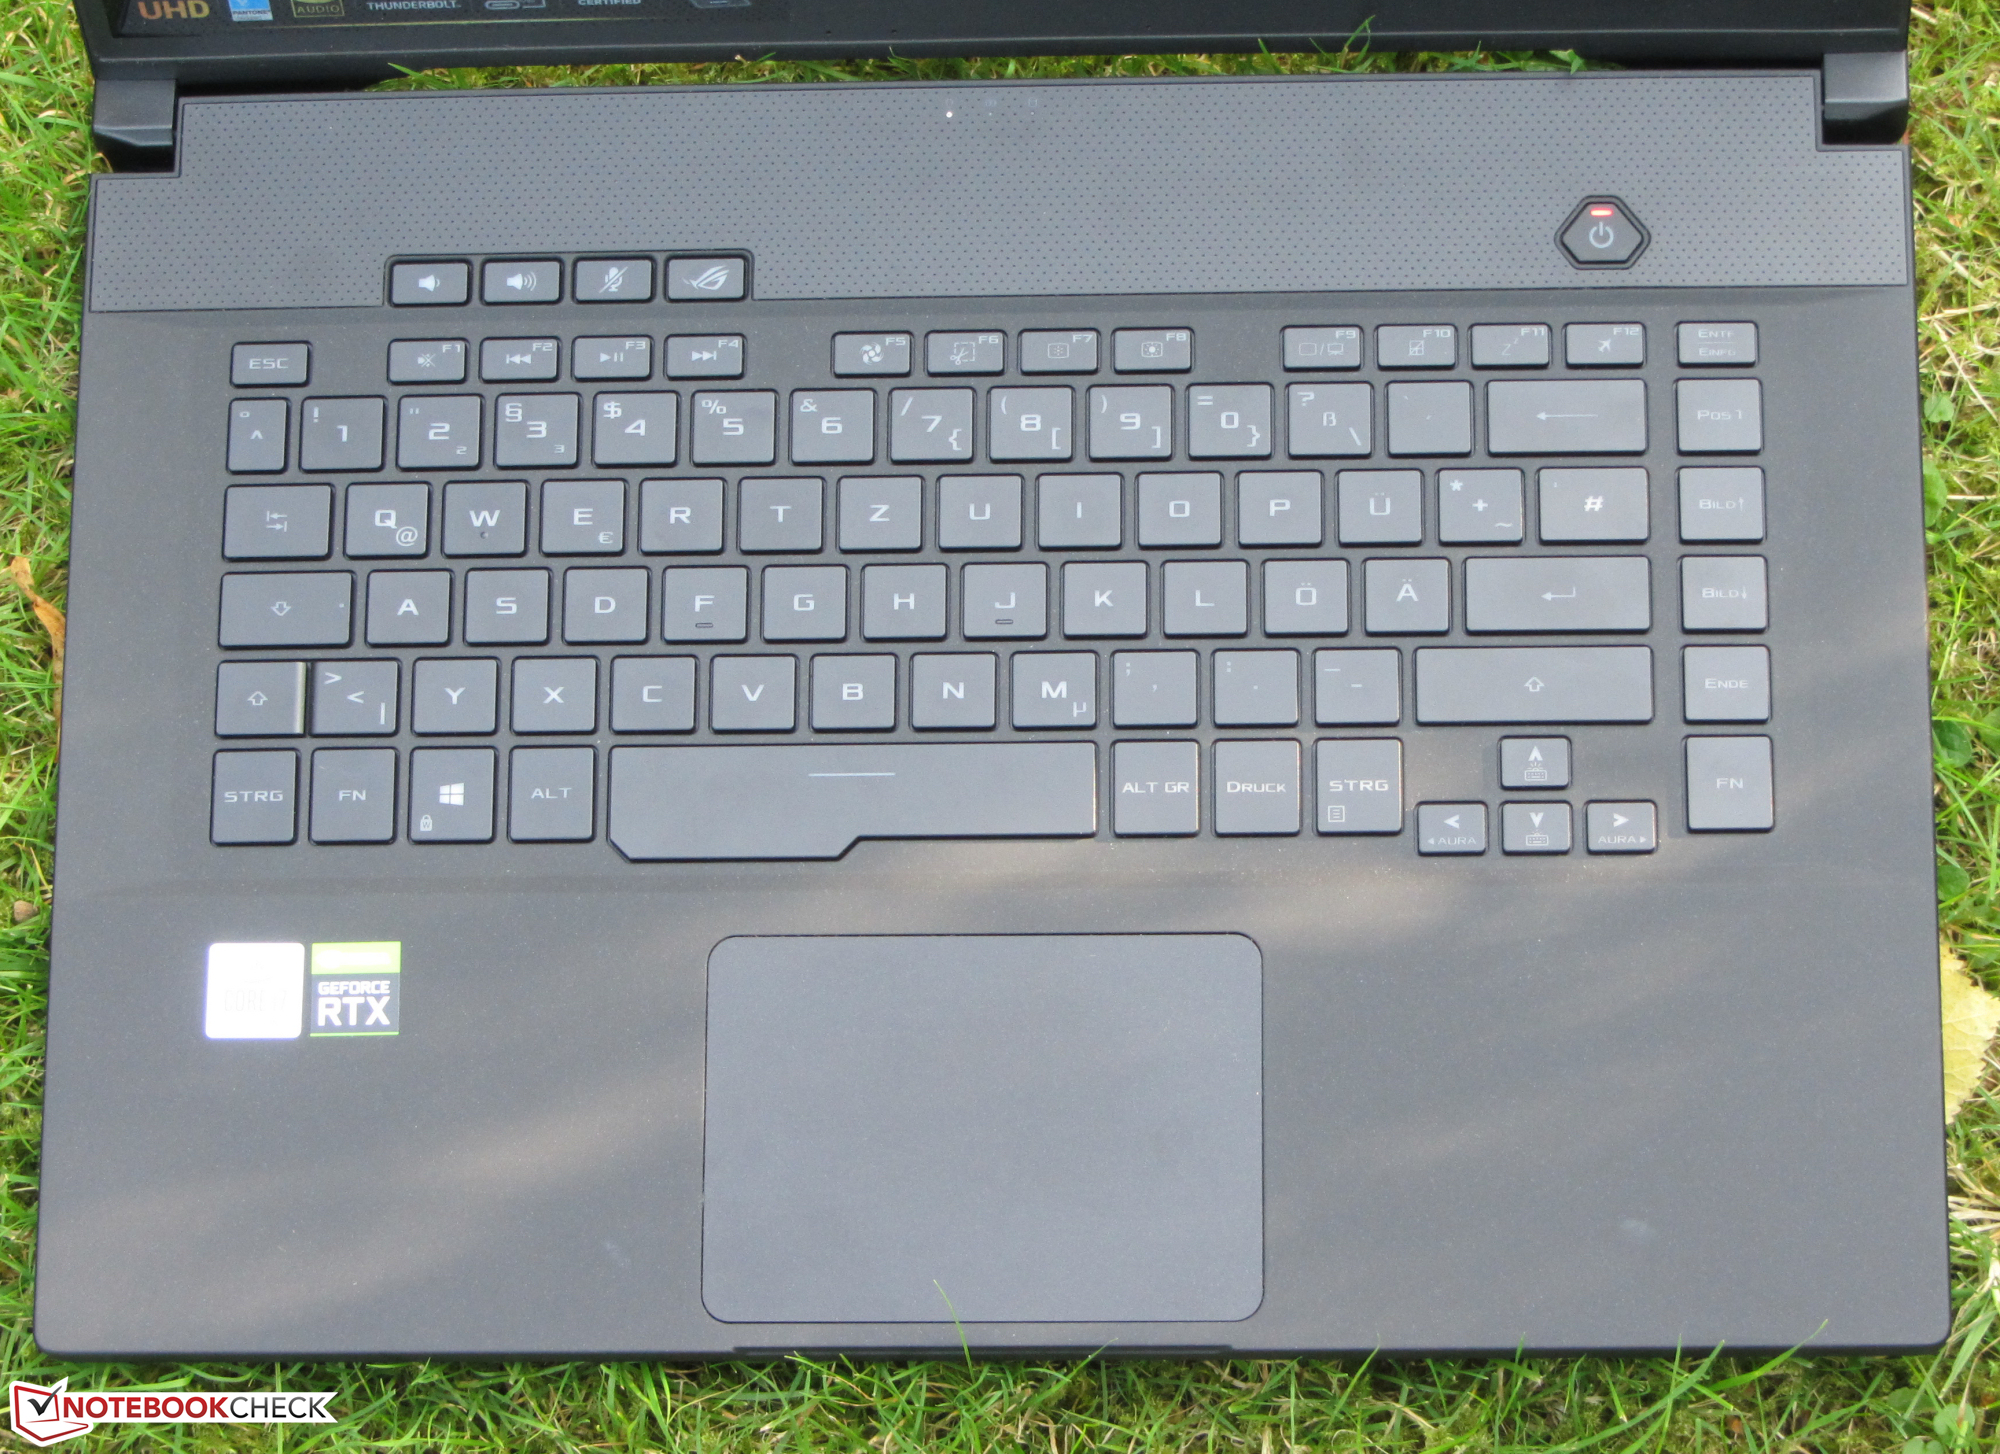
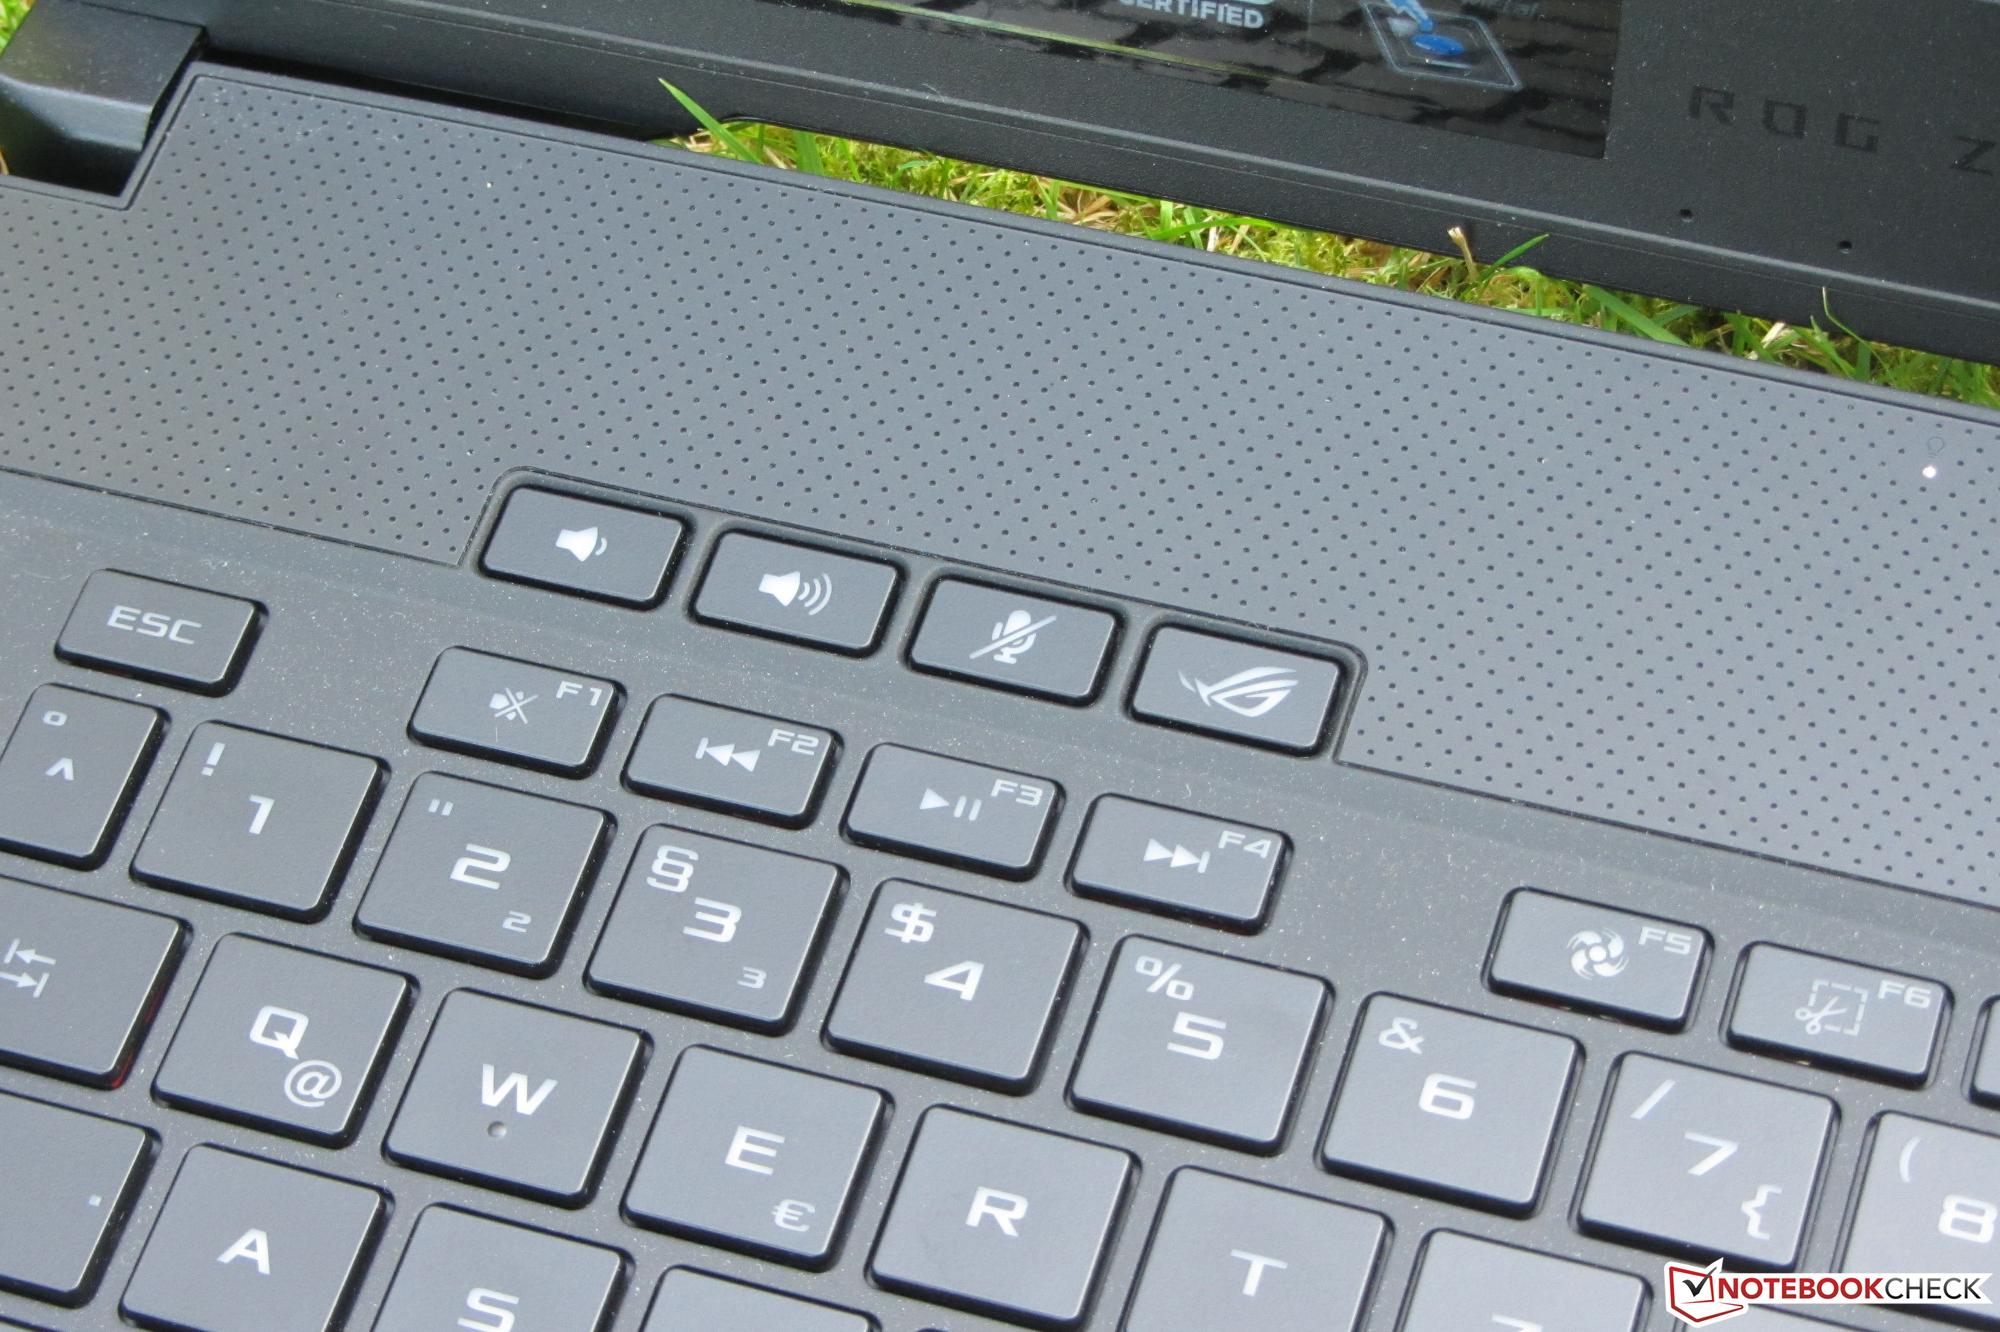
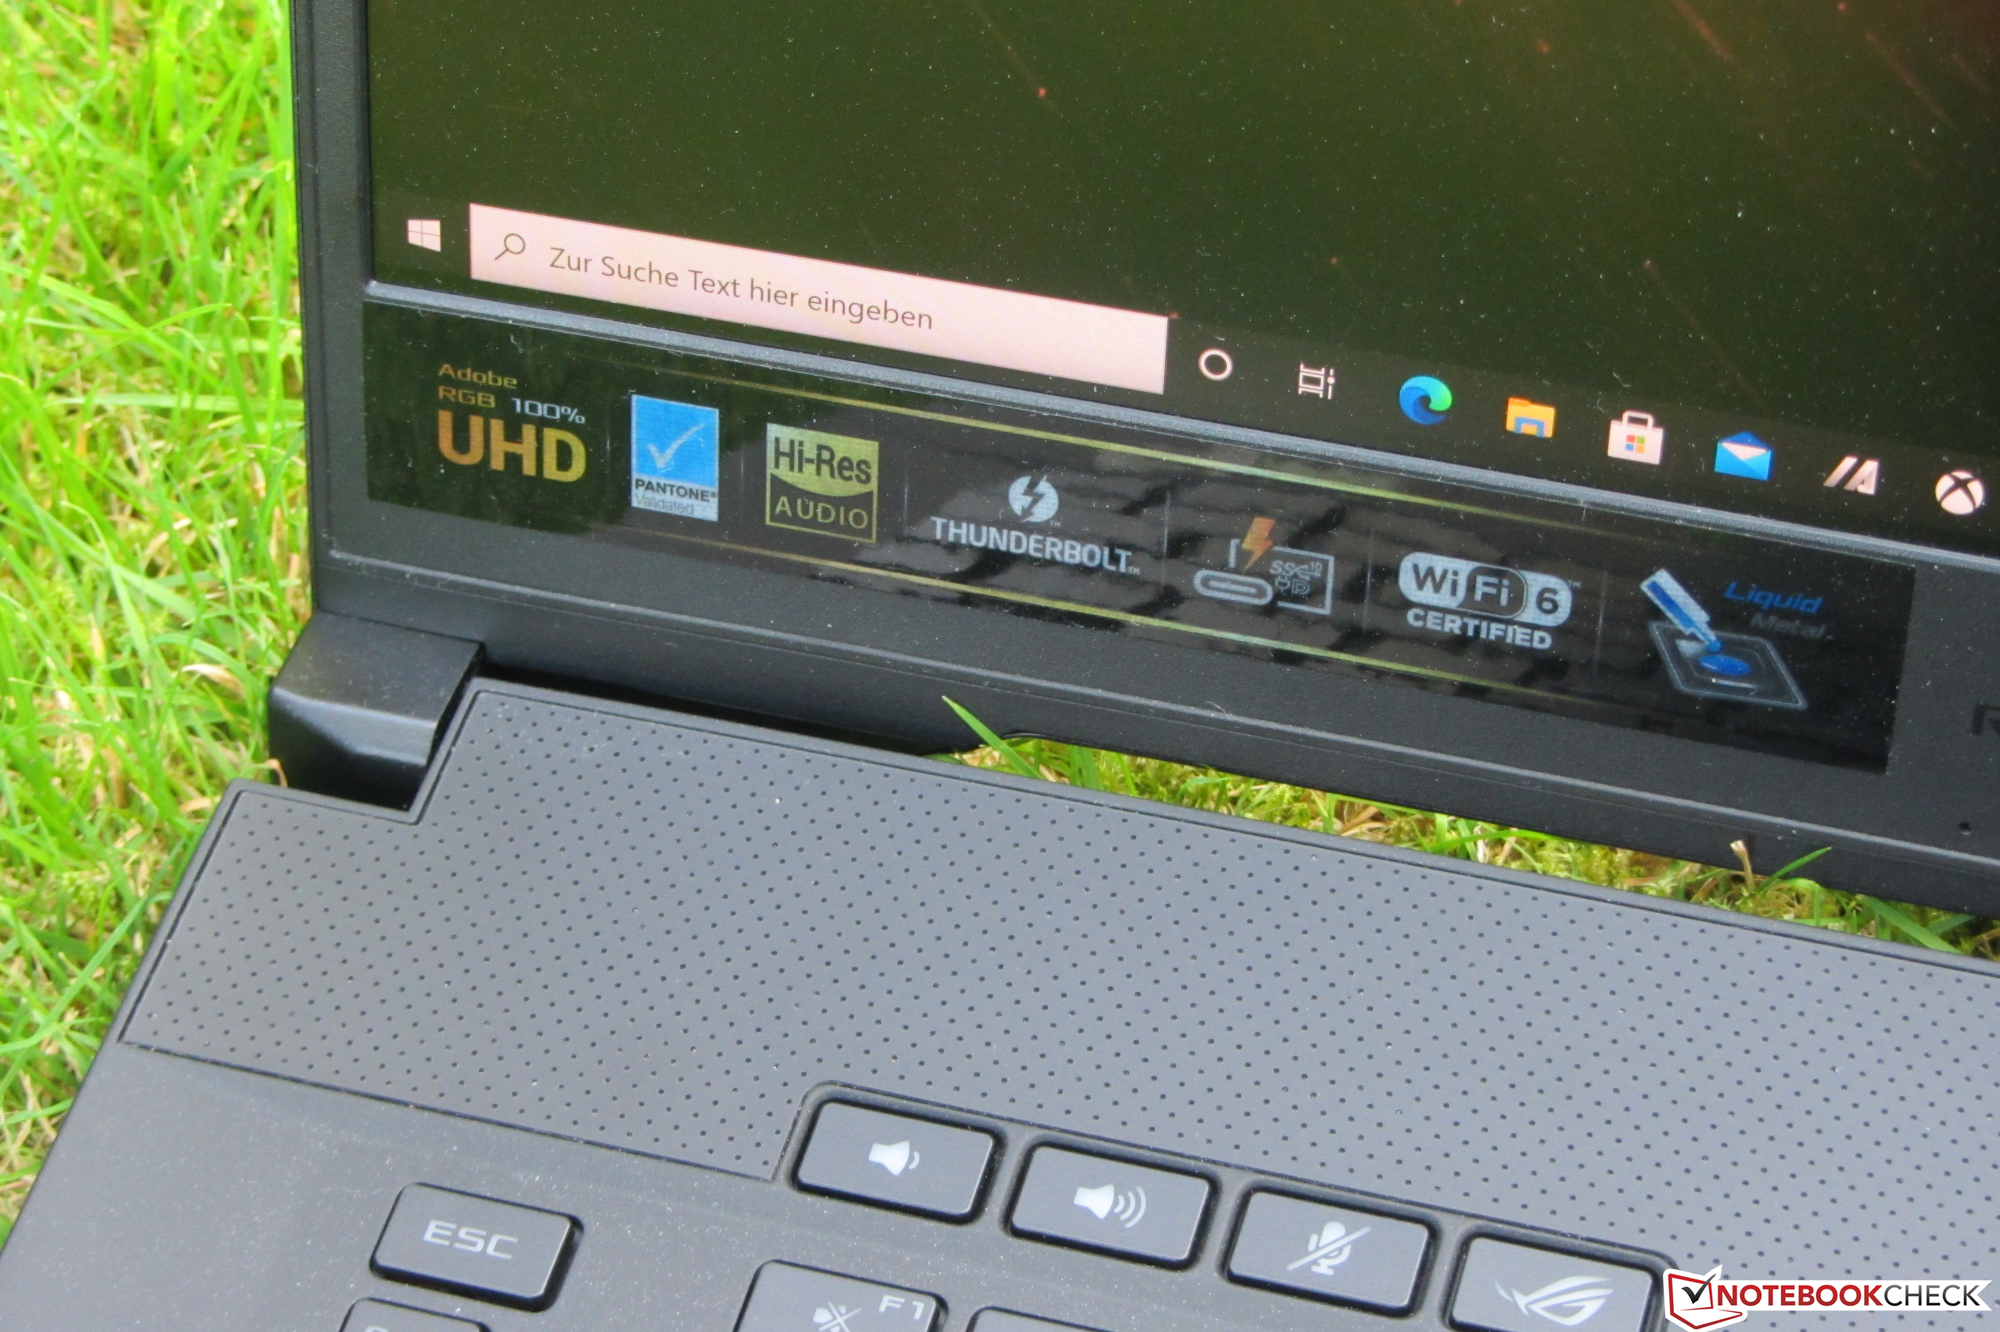
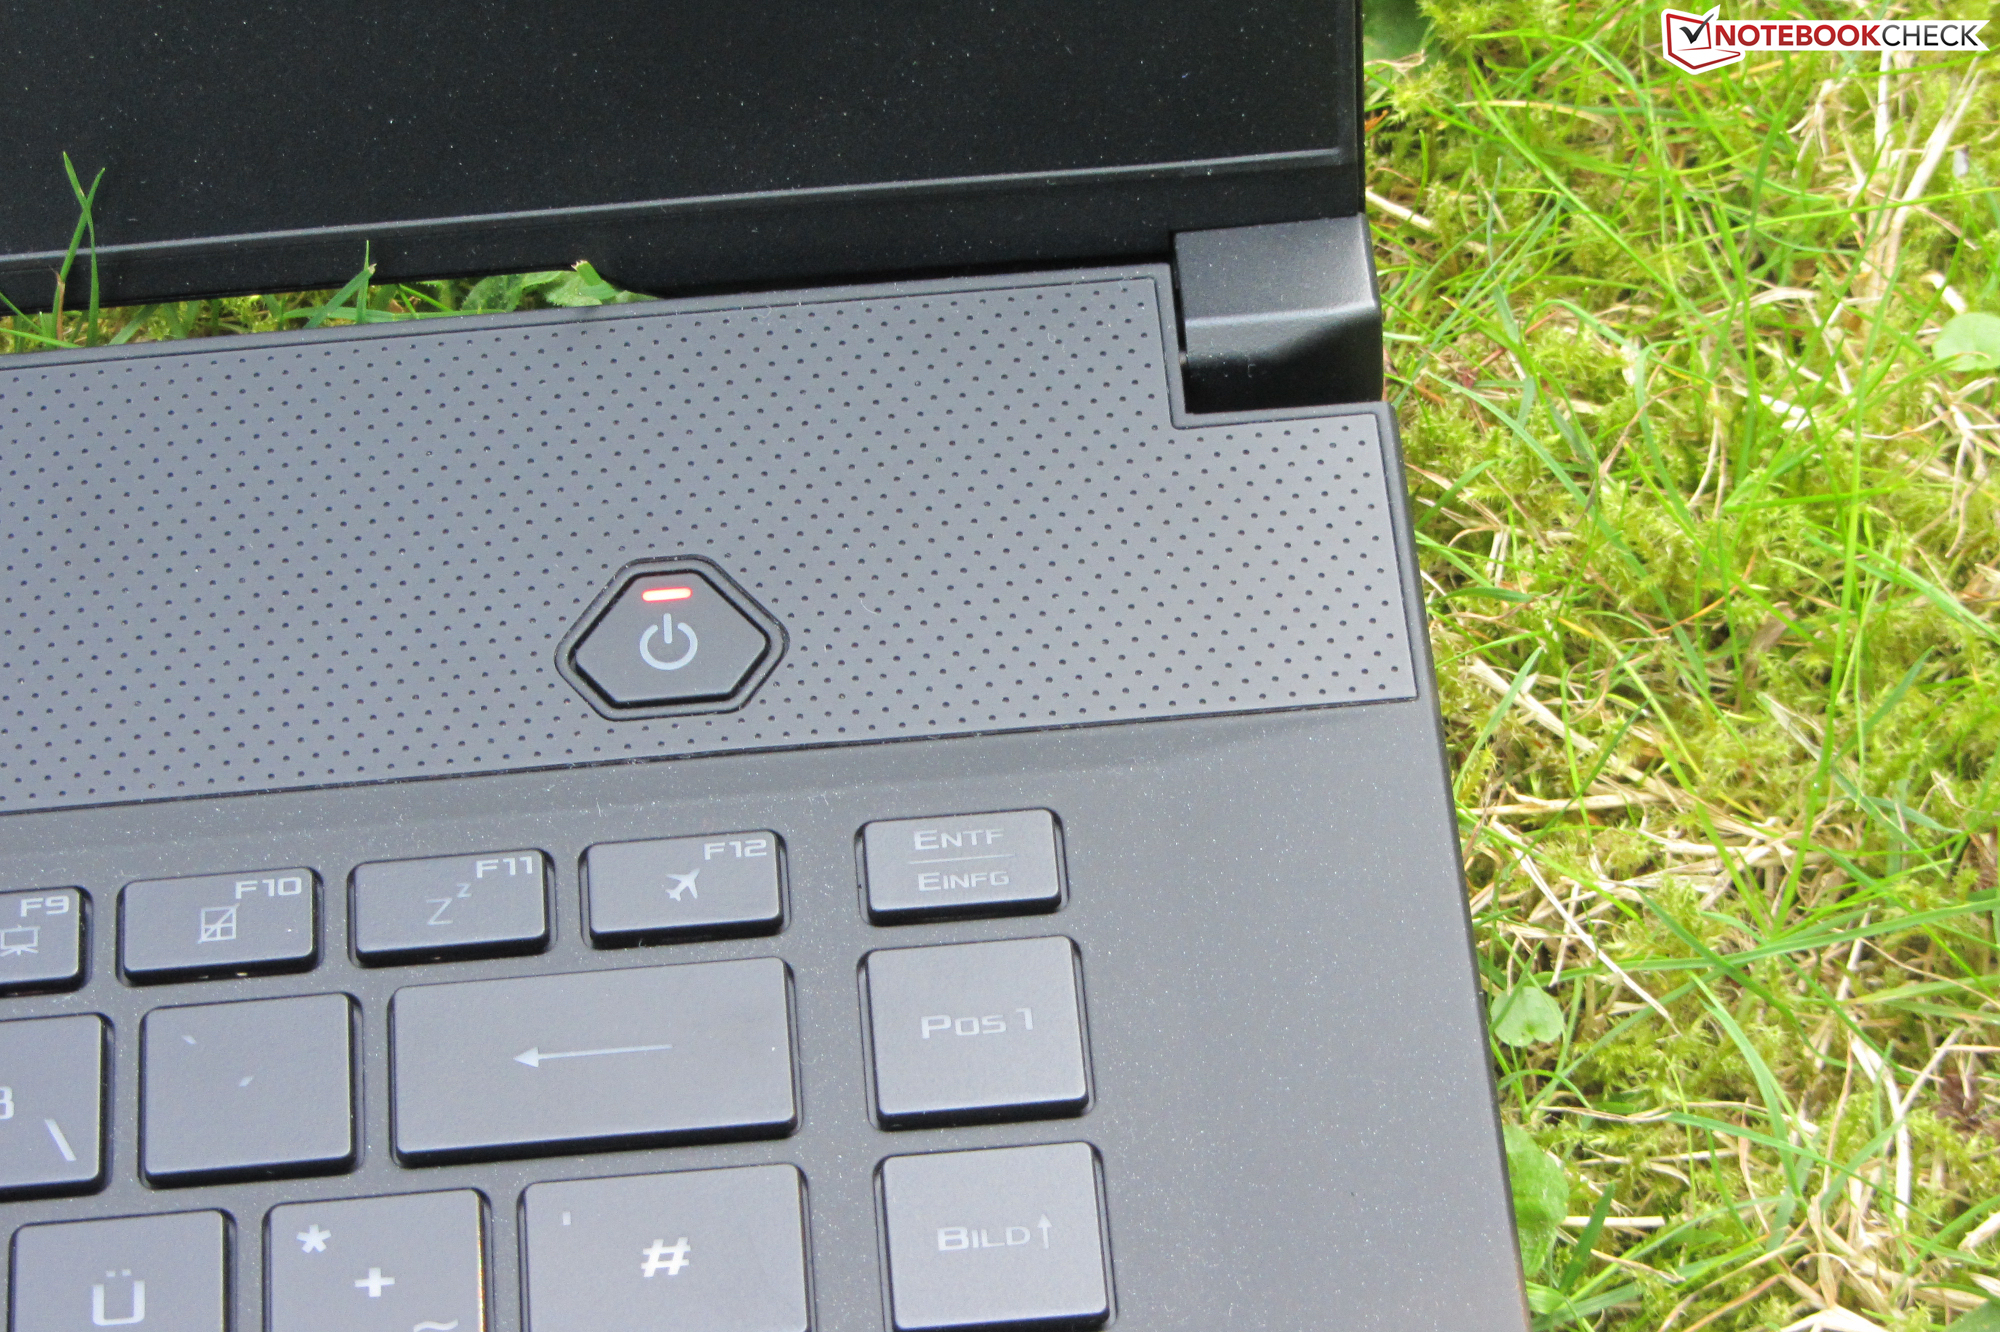
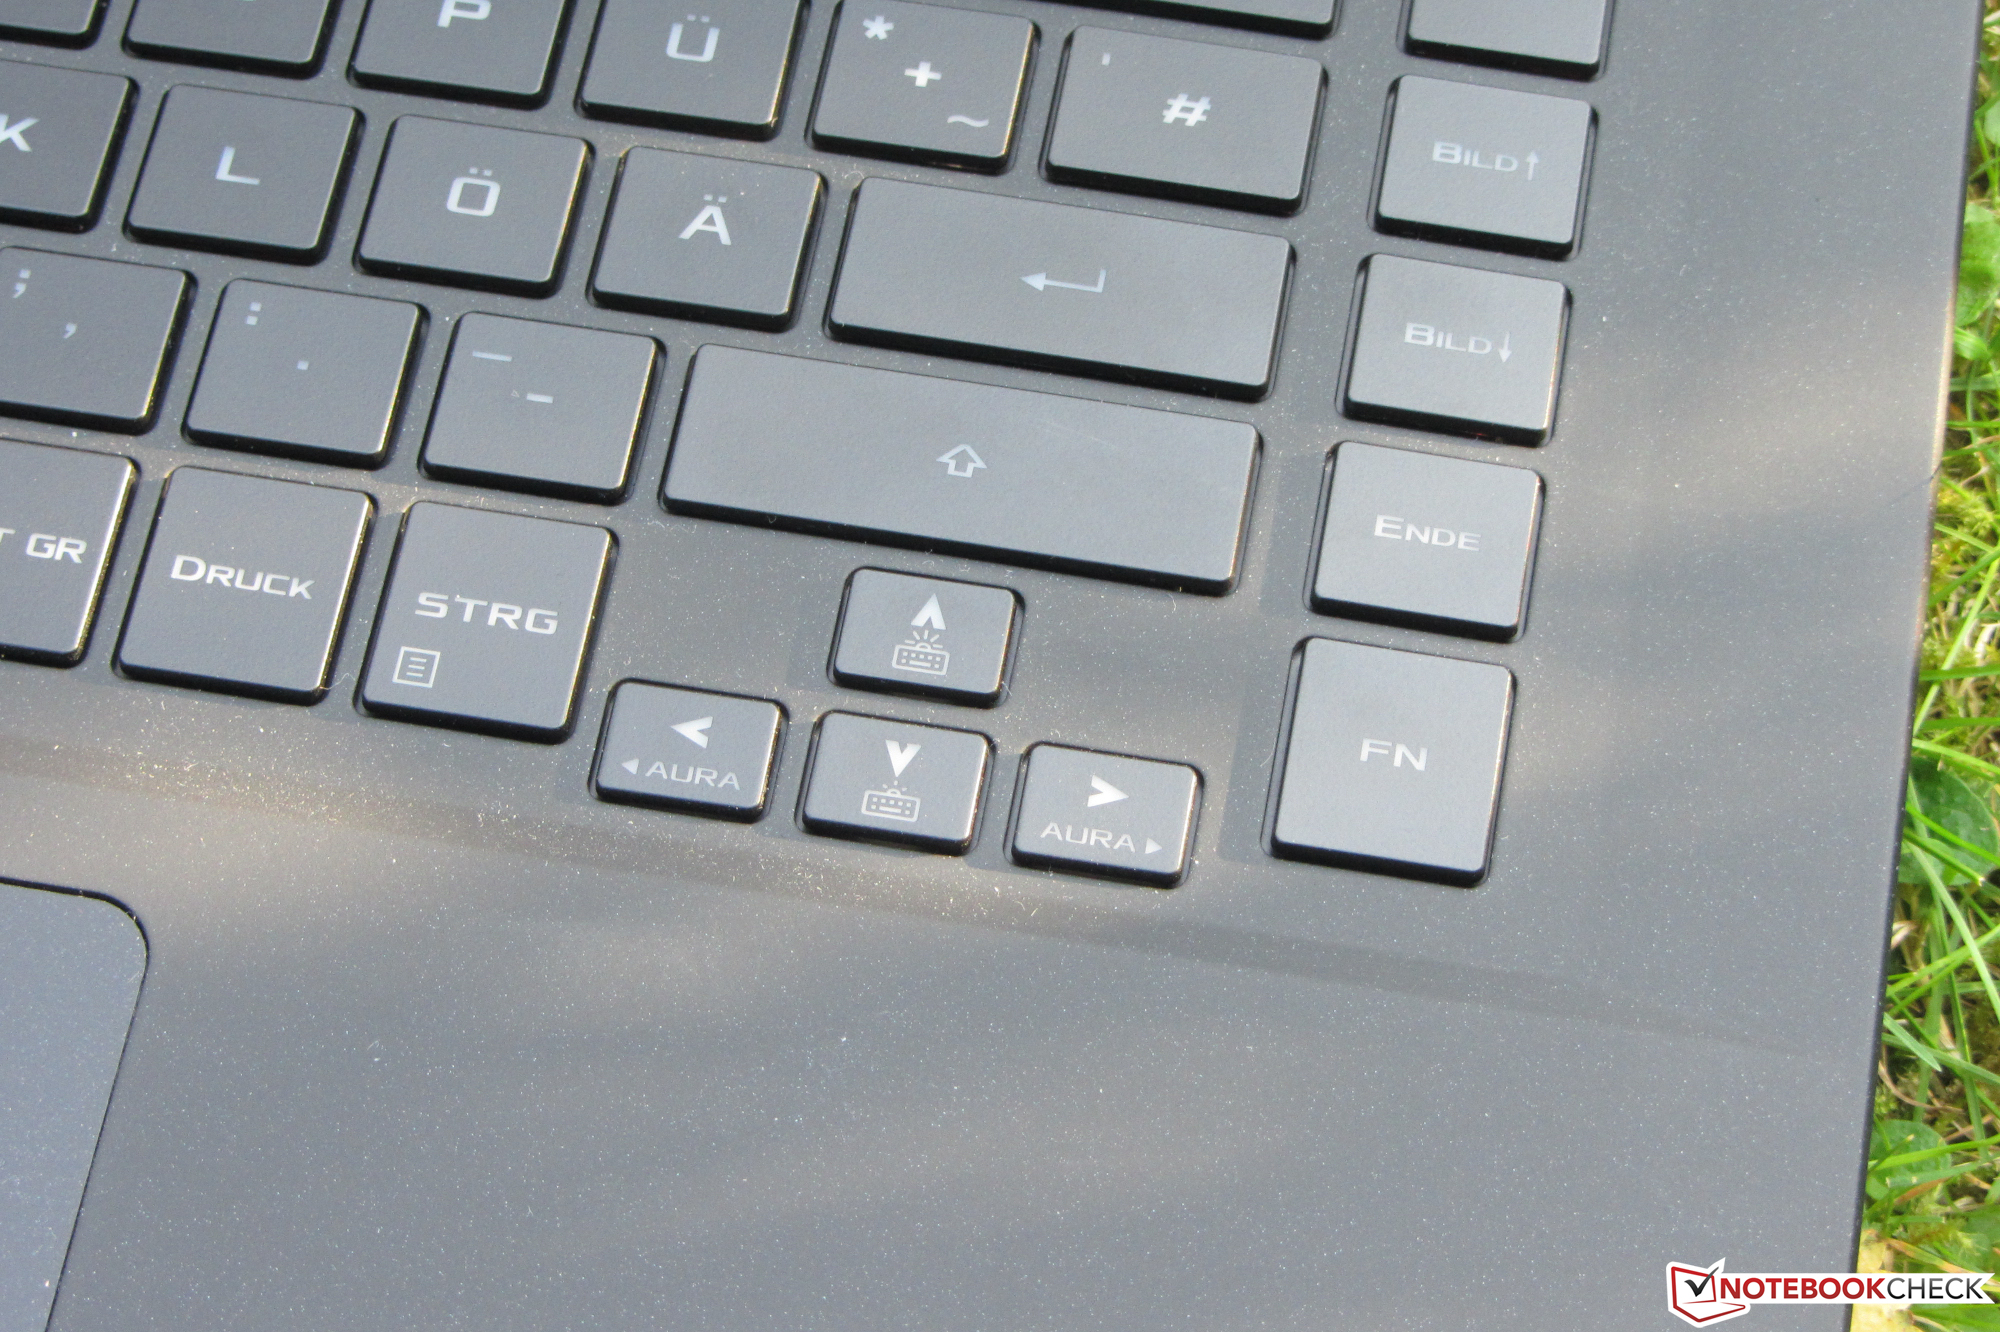
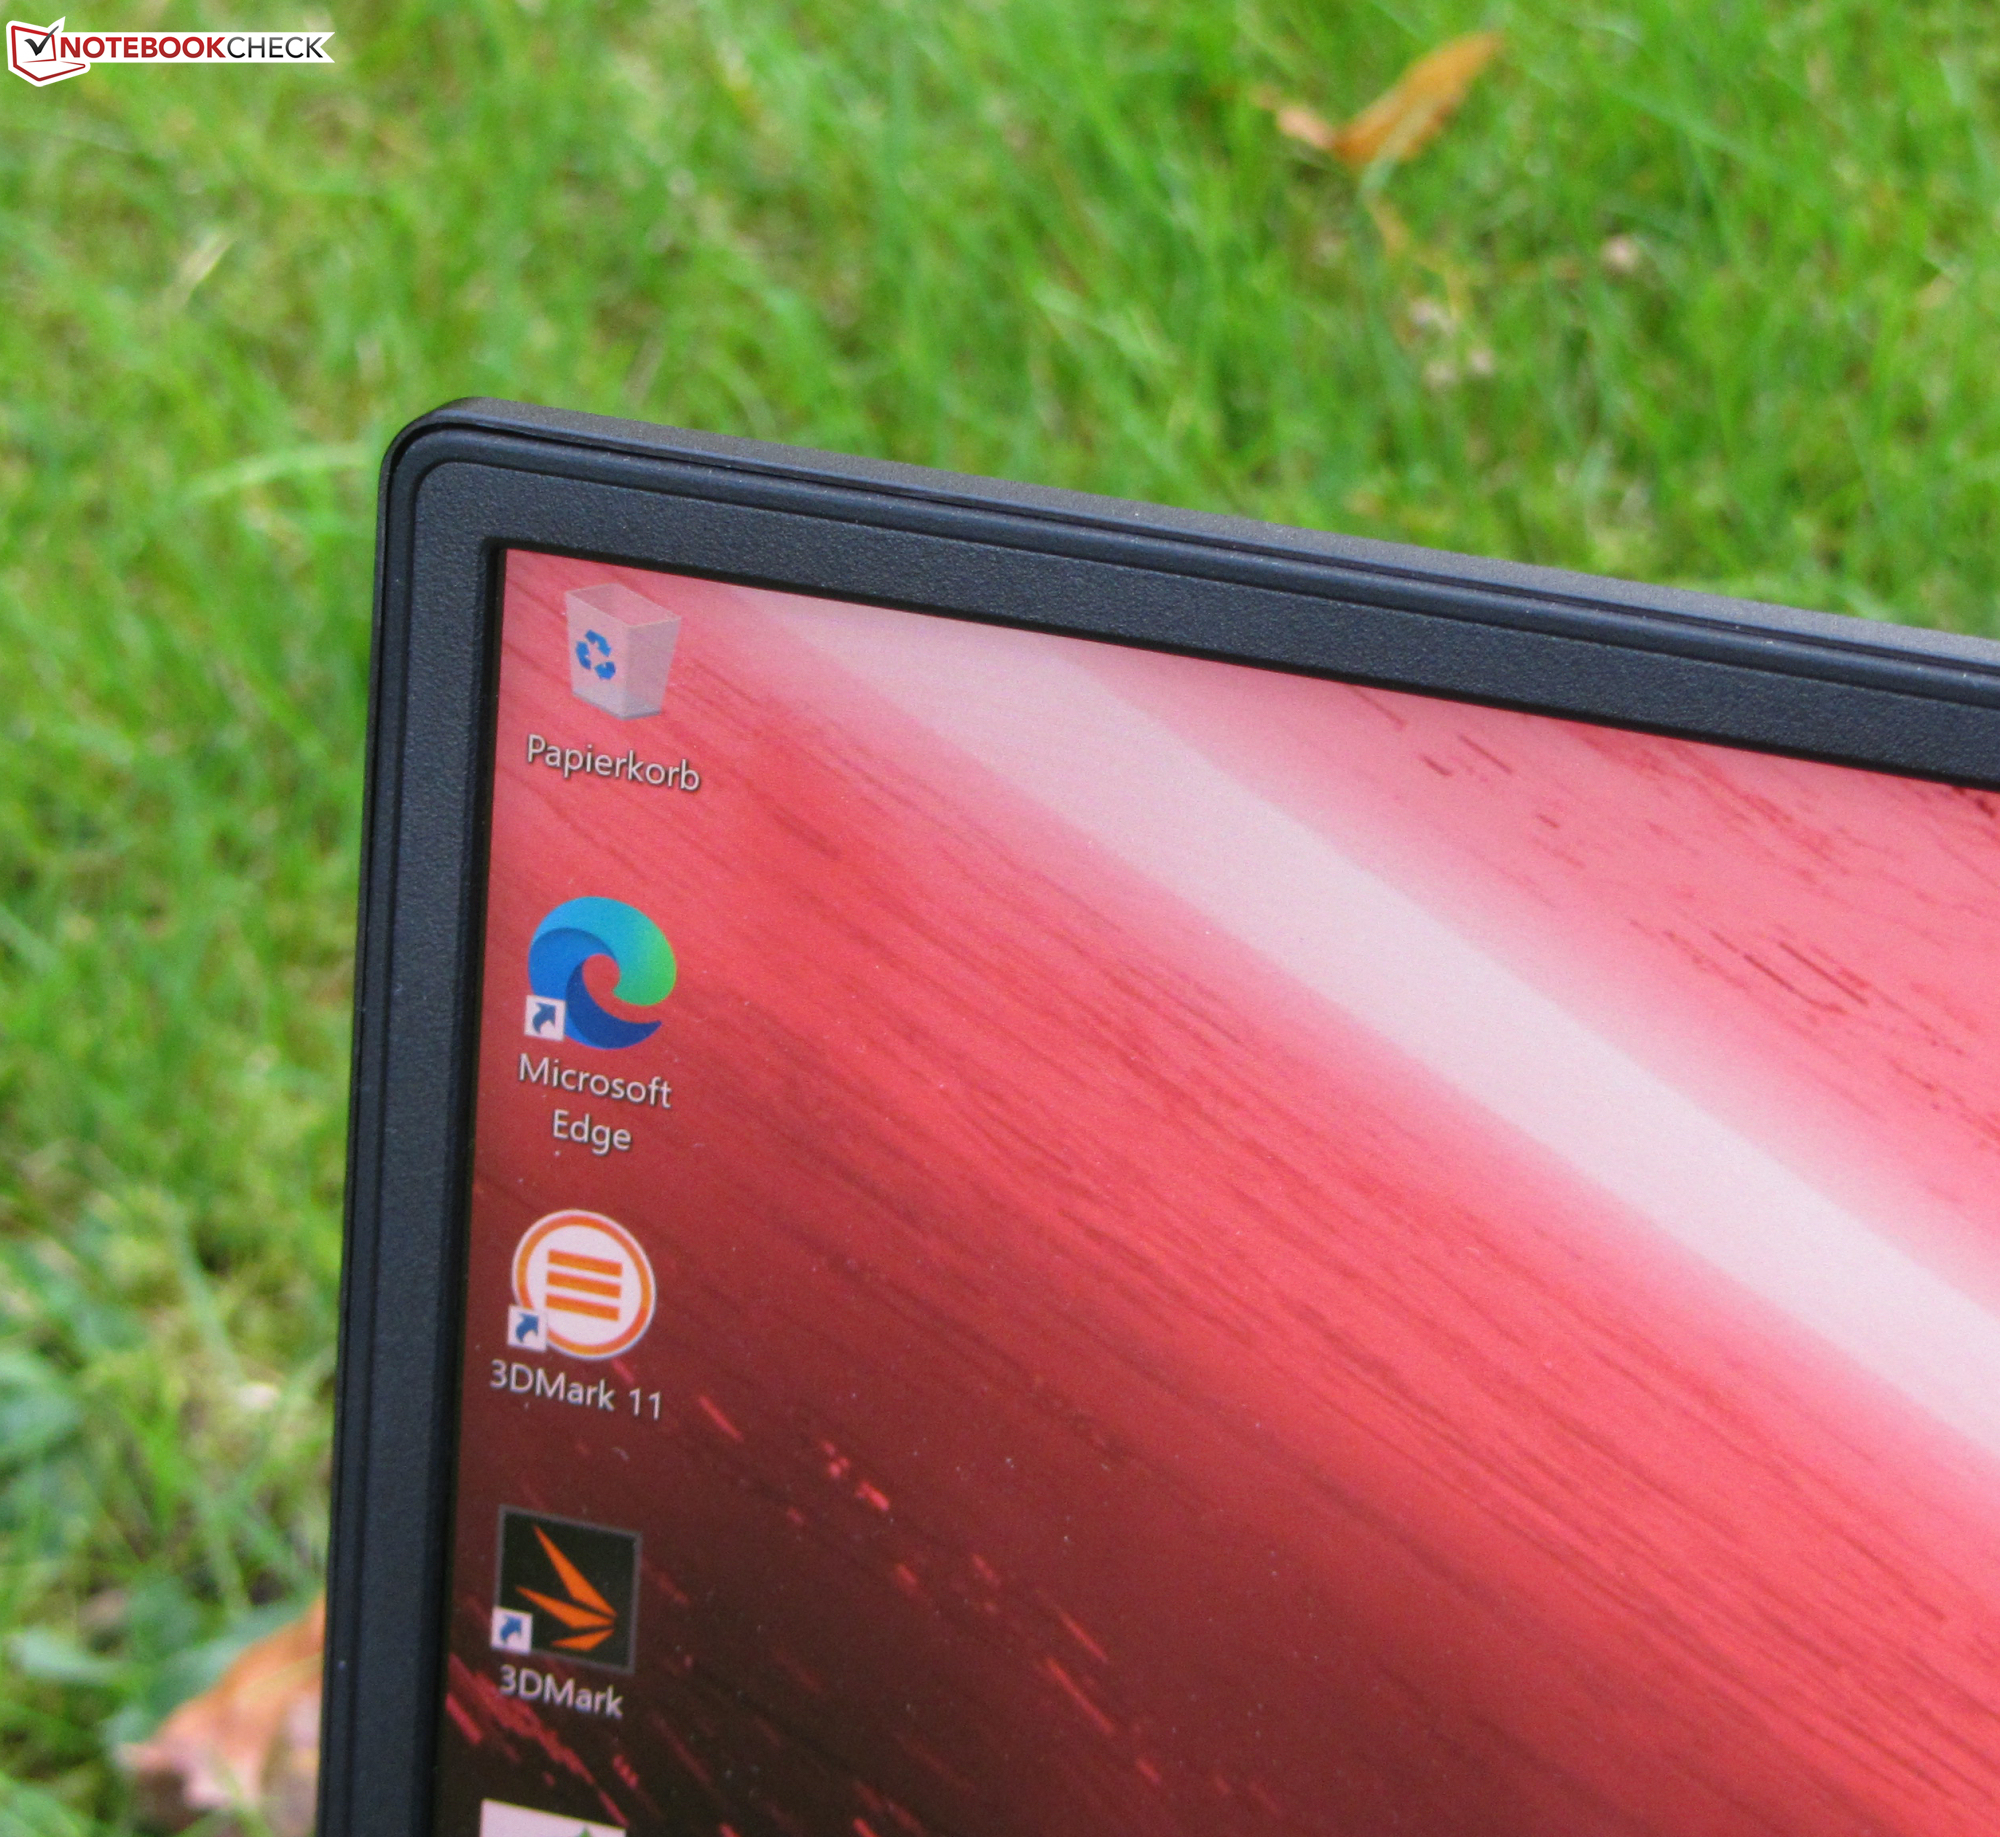
IPS-skärmen har 4K-upplösning och får poäng för en matt yta, hög ljusstyrka, bra kontrast, stabila betraktningsvinklar och - tack vare Pantone-certifiering - utmärkt färgåtergivning. Färgomfånget imponerar också. Batteritiden är dessutom bra för en spellaptop. Tangentbordet (med RGB-belysning) visade sig lämpligt för vardagsbruk.
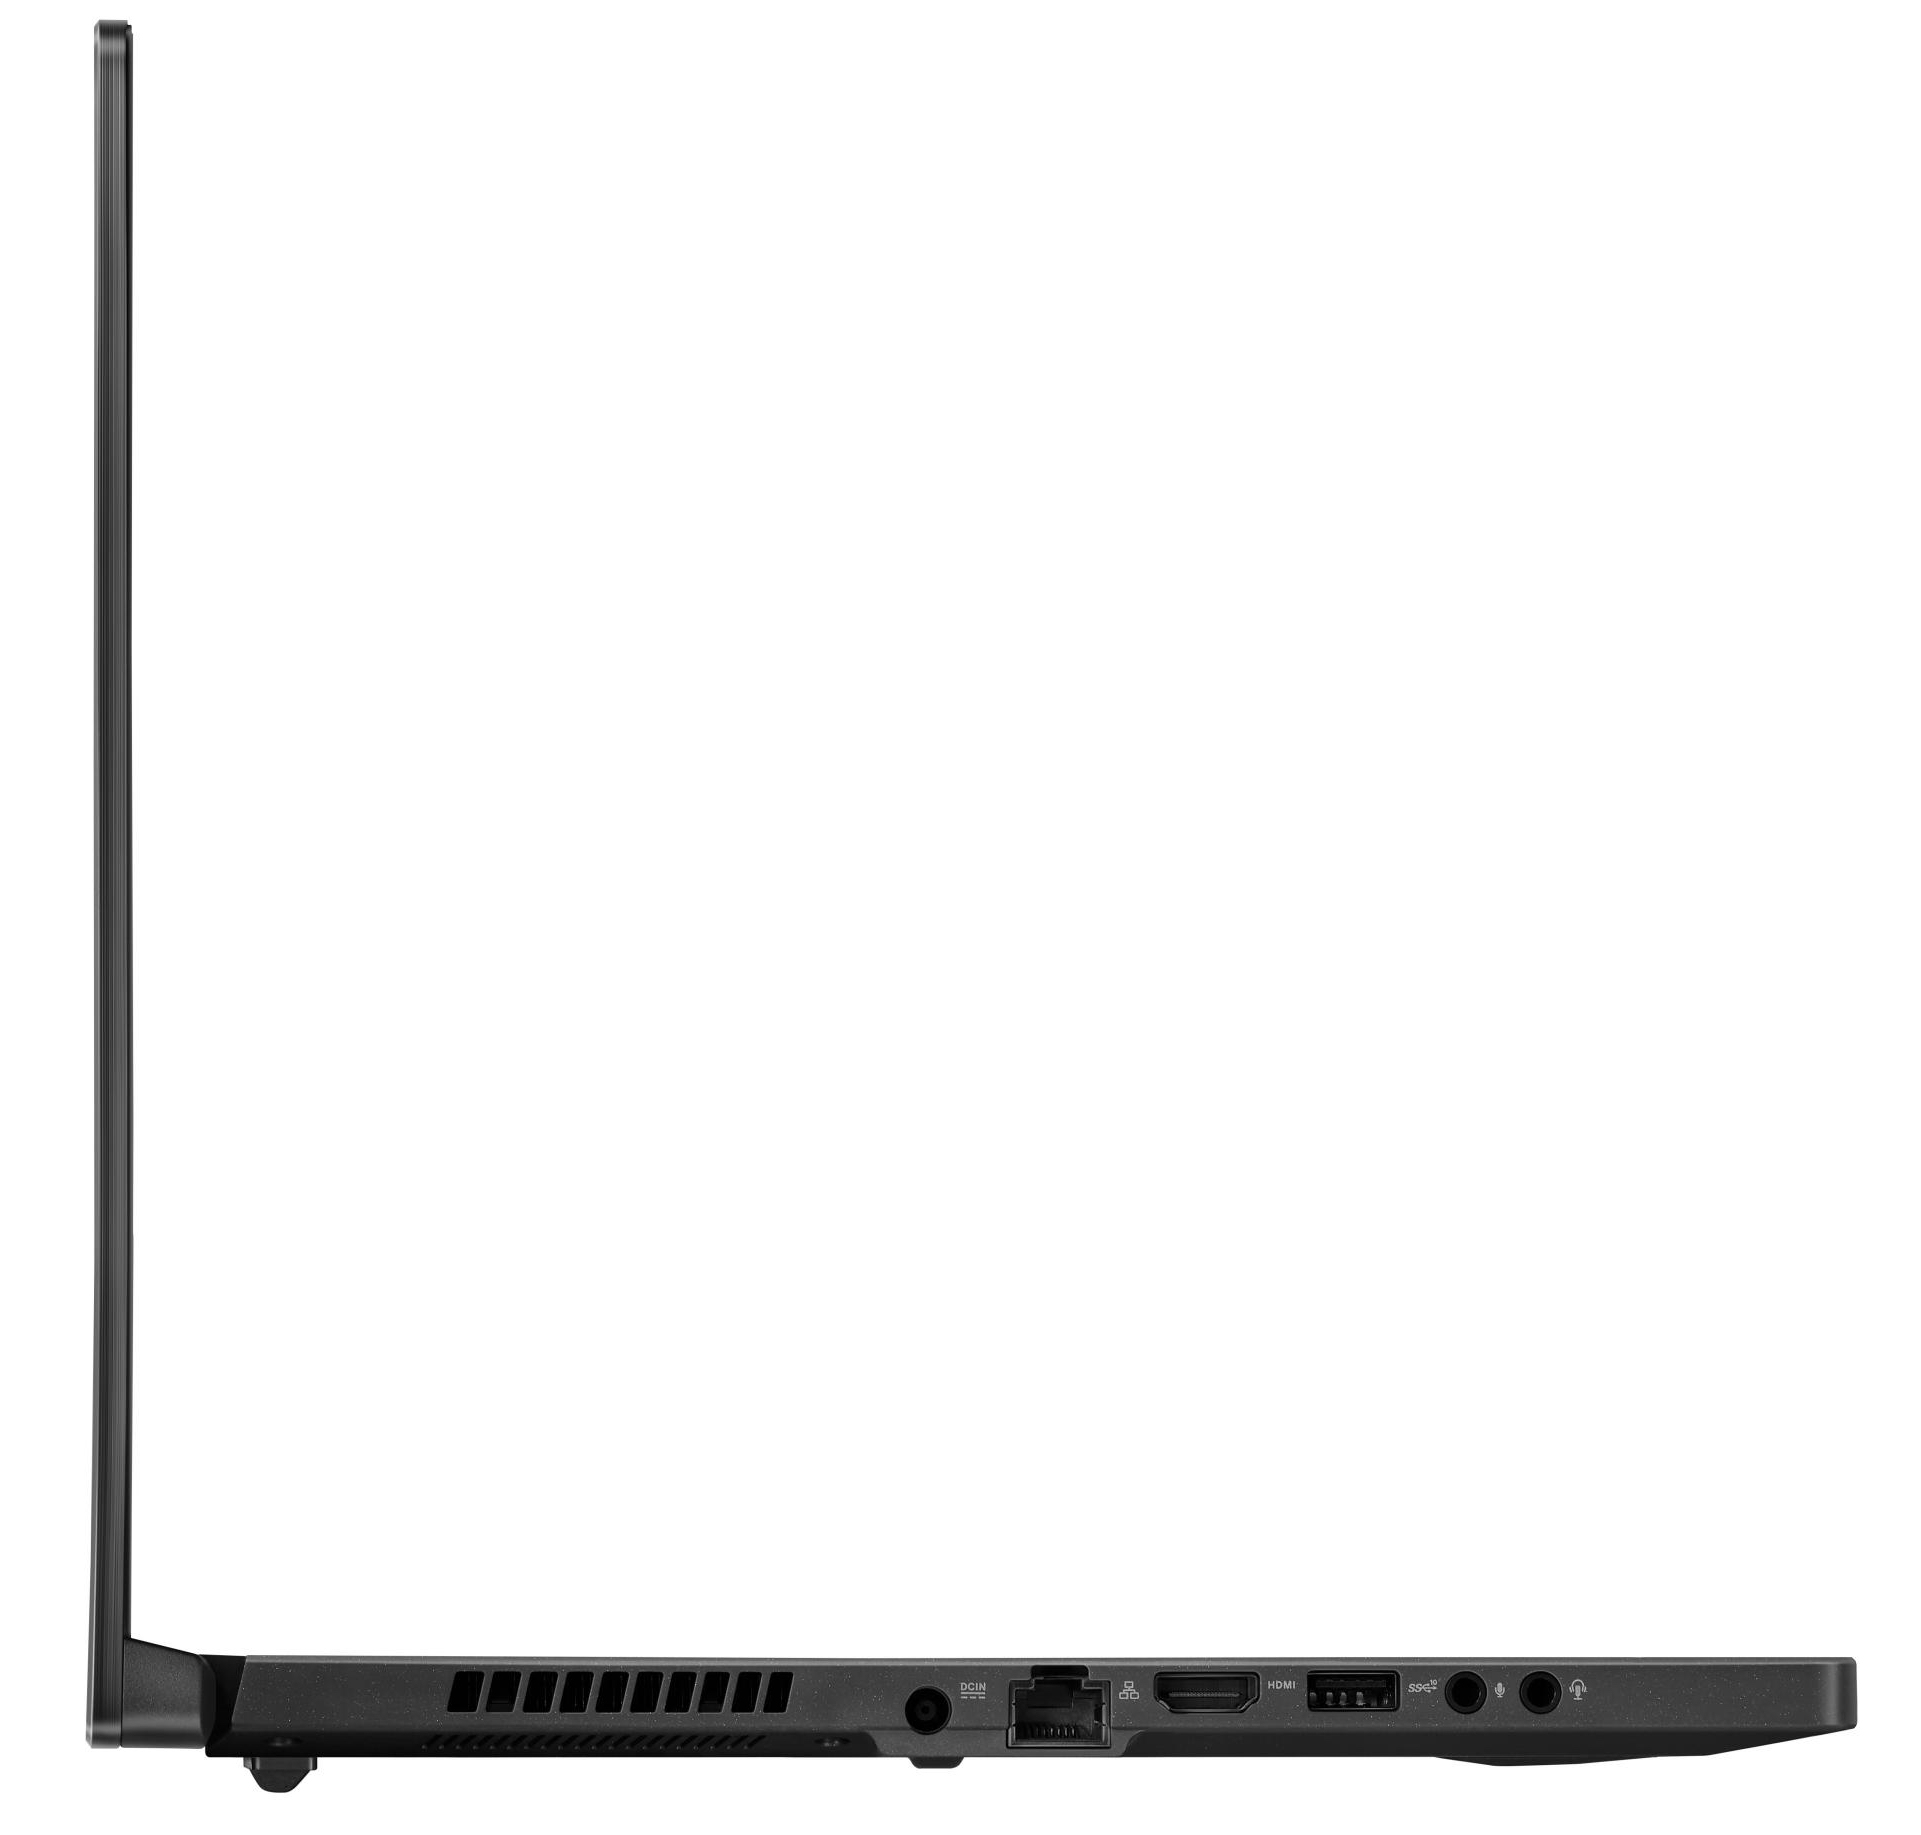
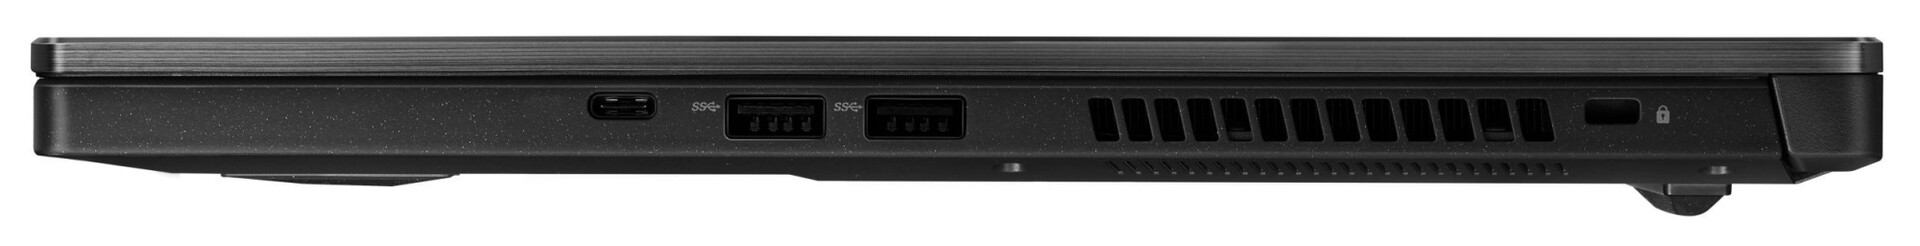
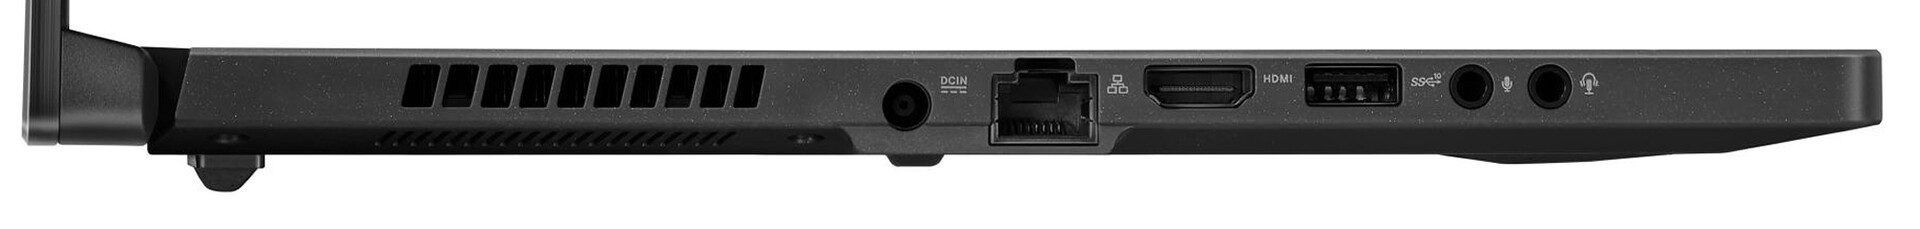
GU502L har en Thunderbolt 3-port som gör det möjligt att ansluta en dockningsstation eller en extern GPU. Den har också stöd för Displayport via USB-C och Power Delivery. Det sistnämnda gör det möjligt att driva datorn med en USB Nätadapter (65 watt) - men då med minskad datorkraft. Asus skickar med en sådan nätadapter.
Asus ROG Zephyrus M15 GU502L
- 09/30/2020 v7 (old)
Sascha Mölck
Price comparison
