Test: Apple iMac 27 Mid 2020 - Allt-i-ett som får en matt skärm (Sammanfattning)
| SD Card Reader | |
| average JPG Copy Test (av. of 3 runs) | |
| Apple iMac 27 Mid 2020 (Toshiba Exceria Pro SDXC 64 GB UHS-II) | |
| Dell XPS 17 9700 Core i7 RTX 2060 Max-Q (Toshiba Exceria Pro SDXC 64 GB UHS-II) | |
| Lenovo ThinkPad X1 Extreme 2019 20QV000WGE (Toshiba Exceria Pro SDXC 64 GB UHS-II) | |
| Apple iMac Pro (Toshiba Exceria Pro SDXC 64 GB UHS-II) | |
| maximum AS SSD Seq Read Test (1GB) | |
| Apple iMac 27 Mid 2020 (Toshiba Exceria Pro SDXC 64 GB UHS-II) | |
| Lenovo ThinkPad X1 Extreme 2019 20QV000WGE (Toshiba Exceria Pro SDXC 64 GB UHS-II) | |
| Dell XPS 17 9700 Core i7 RTX 2060 Max-Q (Toshiba Exceria Pro SDXC 64 GB UHS-II) | |
| Apple iMac Pro (Toshiba Exceria Pro SDXC 64 GB UHS-II) | |

, i9-10910, Apple SSD AP1024")
, i9-10910, Apple SSD AP1024")
| |||||||||||||||||||||||||
Distribution av ljusstyrkan: 88 %
Mitt på batteriet: 529 cd/m²
Kontrast: 1102:1 (Svärta: 0.48 cd/m²)
ΔE ColorChecker Calman: 1.4 | ∀{0.5-29.43 Ø4.73}
ΔE Greyscale Calman: 2.2 | ∀{0.09-98 Ø4.97}
100% sRGB (Argyll 1.6.3 3D)
80% AdobeRGB 1998 (Argyll 1.6.3 3D)
89.5% AdobeRGB 1998 (Argyll 3D)
100% sRGB (Argyll 3D)
98.7% Display P3 (Argyll 3D)
Gamma: 2.32
CCT: 6826 K
| Apple iMac 27 Mid 2020 APPAE32, IPS, 5120x2880, 27" | Apple iMac Pro APPAE1E, , 5120x2880, 27" | Apple iMac Retina 5K 27 Late 2015 3.2 GHz M390 MK472D/A 5120x2880, 27" | Apple iMac Retina 5K 27 Late 2014 i7-4790K M295X APPAE01, IPS, 5120x2880, 27" | |
|---|---|---|---|---|
| Display | -0% | 0% | ||
| Display P3 Coverage (%) | 98.7 | 99 0% | 99.3 1% | |
| sRGB Coverage (%) | 100 | 100 0% | 100 0% | |
| AdobeRGB 1998 Coverage (%) | 89.5 | 88.8 -1% | 88.2 -1% | |
| Response Times | -32% | -40% | -22% | |
| Response Time Grey 50% / Grey 80% * (ms) | 27.2 ? | 30.4 ? -12% | 30.4 ? -12% | 27 ? 1% |
| Response Time Black / White * (ms) | 12.4 ? | 18.8 ? -52% | 20.8 ? -68% | 18 ? -45% |
| PWM Frequency (Hz) | 22730 ? | 208.3 ? | ||
| Screen | -30% | -19% | -41% | |
| Brightness middle (cd/m²) | 529 | 496 -6% | 429 -19% | |
| Brightness (cd/m²) | 511 | 468 -8% | 424 -17% | |
| Brightness Distribution (%) | 88 | 87 -1% | 95 8% | |
| Black Level * (cd/m²) | 0.48 | 0.54 -13% | 0.58 -21% | |
| Contrast (:1) | 1102 | 919 -17% | 740 -33% | |
| Colorchecker dE 2000 * | 1.4 | 3 -114% | 2.8 -100% | 2.66 -90% |
| Colorchecker dE 2000 max. * | 2.6 | 5.8 -123% | ||
| Greyscale dE 2000 * | 2.2 | 2.5 -14% | 1.97 10% | 3.47 -58% |
| Gamma | 2.32 95% | 2.22 99% | 2.13 103% | 2.32 95% |
| CCT | 6826 95% | 6824 95% | 6889 94% | 7127 91% |
| Color Space (Percent of AdobeRGB 1998) (%) | 80 | 79.4 -1% | 79 -1% | 66.2 -17% |
| Color Space (Percent of sRGB) (%) | 100 | 100 0% | 99.97 0% | 99.62 0% |
| Colorchecker dE 2000 calibrated * | 0.9 | |||
| Totalt genomsnitt (program/inställningar) | -21% /
-24% | -20% /
-18% | -32% /
-35% |
* ... mindre är bättre
Visa svarstider
| ↔ Svarstid svart till vitt | ||
|---|---|---|
| 12.4 ms ... stiga ↗ och falla ↘ kombinerat | ↗ 4.8 ms stiga | 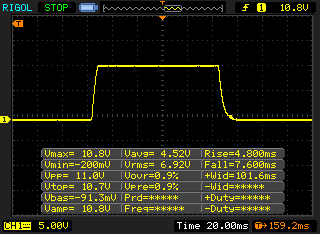 |
| ↘ 7.6 ms hösten | ||
| Skärmen visar bra svarsfrekvens i våra tester, men kan vara för långsam för konkurrenskraftiga spelare. I jämförelse sträcker sig alla testade enheter från 0.1 (minst) till 240 (maximalt) ms. » 33 % av alla enheter är bättre. Det betyder att den uppmätta svarstiden är bättre än genomsnittet av alla testade enheter (19.9 ms). | ||
| ↔ Svarstid 50 % grått till 80 % grått | ||
| 27.2 ms ... stiga ↗ och falla ↘ kombinerat | ↗ 12.4 ms stiga | 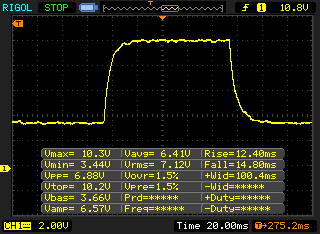 |
| ↘ 14.8 ms hösten | ||
| Skärmen visar relativt långsamma svarsfrekvenser i våra tester och kan vara för långsam för spelare. I jämförelse sträcker sig alla testade enheter från 0.165 (minst) till 636 (maximalt) ms. » 37 % av alla enheter är bättre. Det betyder att den uppmätta svarstiden är bättre än genomsnittet av alla testade enheter (31.1 ms). | ||
Skärmflimmer / PWM (Puls-Width Modulation)
| Skärmflimmer / PWM upptäckt | 22730 Hz | ≤ 66 % ljusstyrka inställning | 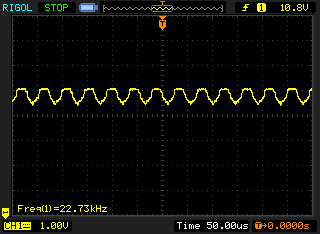 |
Displayens bakgrundsbelysning flimrar vid 22730 Hz (i värsta fall, t.ex. med PWM) Flimrande upptäckt vid en ljusstyrkeinställning på 66 % och lägre. Det ska inte finnas något flimmer eller PWM över denna ljusstyrkeinställning. Frekvensen för 22730 Hz är ganska hög, så de flesta användare som är känsliga för PWM bör inte märka något flimmer. Som jämförelse: 52 % av alla testade enheter använder inte PWM för att dämpa skärmen. Om PWM upptäcktes mättes ett medelvärde av 7798 (minst: 5 - maximum: 343500) Hz. | |||
Cinebench R15: CPU Single 64Bit | CPU Multi 64Bit
Blender: v2.79 BMW27 CPU
7-Zip 18.03: 7z b 4 -mmt1 | 7z b 4
Geekbench 5.5: Single-Core | Multi-Core
HWBOT x265 Benchmark v2.2: 4k Preset
LibreOffice : 20 Documents To PDF
R Benchmark 2.5: Overall mean
| Cinebench R20 / CPU (Single Core) | |
| Genomsnitt av klass Desktop (674 - 922, n=15, senaste 2 åren) | |
| AMD Ryzen 9 5900X | |
| AMD Ryzen 9 3950X | |
| Apple iMac 27 Mid 2020 | |
| Genomsnitt Intel Core i9-10910 (n=1) | |
| Dell XPS 17 9700 Core i7 RTX 2060 Max-Q | |
| Schenker XMG Core 15 GK5NR0O | |
| Apple MacBook Pro 16 2019 i9 5500M | |
| Apple MacBook Pro 16 2019 i9 5500M | |
| Cinebench R20 / CPU (Multi Core) | |
| Genomsnitt av klass Desktop (5710 - 17190, n=15, senaste 2 åren) | |
| AMD Ryzen 9 3950X | |
| AMD Ryzen 9 5900X | |
| Apple iMac 27 Mid 2020 | |
| Genomsnitt Intel Core i9-10910 (n=1) | |
| Schenker XMG Core 15 GK5NR0O | |
| Apple MacBook Pro 16 2019 i9 5500M | |
| Apple MacBook Pro 16 2019 i9 5500M | |
| Dell XPS 17 9700 Core i7 RTX 2060 Max-Q | |
| Cinebench R15 / CPU Single 64Bit | |
| Genomsnitt av klass Desktop (246 - 356, n=16, senaste 2 åren) | |
| AMD Ryzen 9 5900X | |
| Apple iMac 27 Mid 2020 | |
| Genomsnitt Intel Core i9-10910 (n=1) | |
| AMD Ryzen 9 3950X | |
| Dell XPS 17 9700 Core i7 RTX 2060 Max-Q | |
| Lenovo ThinkPad X1 Extreme 2019 20QV000WGE | |
| Schenker XMG Core 15 GK5NR0O | |
| Apple MacBook Pro 16 2019 i9 5500M | |
| Apple MacBook Pro 16 2019 i9 5500M | |
| Apple iMac Pro | |
| Apple iMac Retina 5K 27 Late 2014 i7-4790K M295X | |
| Apple iMac Retina 5K 27 Late 2015 3.2 GHz M390 MK472D/A | |
| Cinebench R15 / CPU Multi 64Bit | |
| Genomsnitt av klass Desktop (2652 - 6656, n=16, senaste 2 åren) | |
| AMD Ryzen 9 3950X | |
| AMD Ryzen 9 5900X | |
| Apple iMac 27 Mid 2020 | |
| Genomsnitt Intel Core i9-10910 (n=1) | |
| Schenker XMG Core 15 GK5NR0O | |
| Apple iMac Pro | |
| Apple iMac Pro | |
| Dell XPS 17 9700 Core i7 RTX 2060 Max-Q | |
| Apple MacBook Pro 16 2019 i9 5500M | |
| Apple MacBook Pro 16 2019 i9 5500M | |
| Lenovo ThinkPad X1 Extreme 2019 20QV000WGE | |
| Apple iMac Retina 5K 27 Late 2014 i7-4790K M295X | |
| Apple iMac Retina 5K 27 Late 2015 3.2 GHz M390 MK472D/A | |
| Blender / v2.79 BMW27 CPU | |
| Lenovo ThinkPad X1 Extreme 2019 20QV000WGE | |
| Apple MacBook Pro 16 2019 i9 5500M | |
| Dell XPS 17 9700 Core i7 RTX 2060 Max-Q | |
| Schenker XMG Core 15 GK5NR0O | |
| Apple iMac 27 Mid 2020 | |
| Genomsnitt Intel Core i9-10910 (n=1) | |
| AMD Ryzen 9 5900X | |
| AMD Ryzen 9 3950X | |
| Genomsnitt av klass Desktop (75 - 218, n=15, senaste 2 åren) | |
| 7-Zip 18.03 / 7z b 4 -mmt1 | |
| Genomsnitt av klass Desktop (5092 - 8790, n=17, senaste 2 åren) | |
| AMD Ryzen 9 5900X | |
| Apple iMac 27 Mid 2020 | |
| Genomsnitt Intel Core i9-10910 (n=1) | |
| AMD Ryzen 9 3950X | |
| Dell XPS 17 9700 Core i7 RTX 2060 Max-Q | |
| Apple MacBook Pro 16 2019 i9 5500M | |
| Schenker XMG Core 15 GK5NR0O | |
| Lenovo ThinkPad X1 Extreme 2019 20QV000WGE | |
| 7-Zip 18.03 / 7z b 4 | |
| Genomsnitt av klass Desktop (91898 - 163125, n=17, senaste 2 åren) | |
| AMD Ryzen 9 3950X | |
| AMD Ryzen 9 5900X | |
| Apple iMac 27 Mid 2020 | |
| Genomsnitt Intel Core i9-10910 (n=1) | |
| Schenker XMG Core 15 GK5NR0O | |
| Dell XPS 17 9700 Core i7 RTX 2060 Max-Q | |
| Apple MacBook Pro 16 2019 i9 5500M | |
| Lenovo ThinkPad X1 Extreme 2019 20QV000WGE | |
| Geekbench 5.5 / Single-Core | |
| Genomsnitt av klass Desktop (1755 - 2597, n=30, senaste 2 åren) | |
| AMD Ryzen 9 5900X | |
| Apple iMac 27 Mid 2020 | |
| Genomsnitt Intel Core i9-10910 (n=1) | |
| AMD Ryzen 9 3950X | |
| Dell XPS 17 9700 Core i7 RTX 2060 Max-Q | |
| Schenker XMG Core 15 GK5NR0O | |
| Apple MacBook Pro 16 2019 i9 5500M | |
| Geekbench 5.5 / Multi-Core | |
| Genomsnitt av klass Desktop (12626 - 28535, n=30, senaste 2 åren) | |
| AMD Ryzen 9 5900X | |
| AMD Ryzen 9 3950X | |
| Apple iMac 27 Mid 2020 | |
| Genomsnitt Intel Core i9-10910 (n=1) | |
| Dell XPS 17 9700 Core i7 RTX 2060 Max-Q | |
| Apple MacBook Pro 16 2019 i9 5500M | |
| Schenker XMG Core 15 GK5NR0O | |
| HWBOT x265 Benchmark v2.2 / 4k Preset | |
| Genomsnitt av klass Desktop (18.6 - 48.5, n=15, senaste 2 åren) | |
| AMD Ryzen 9 5900X | |
| Apple iMac 27 Mid 2020 | |
| Genomsnitt Intel Core i9-10910 (n=1) | |
| AMD Ryzen 9 3950X | |
| Schenker XMG Core 15 GK5NR0O | |
| Dell XPS 17 9700 Core i7 RTX 2060 Max-Q | |
| Apple MacBook Pro 16 2019 i9 5500M | |
| Lenovo ThinkPad X1 Extreme 2019 20QV000WGE | |
| LibreOffice / 20 Documents To PDF | |
| Apple iMac 27 Mid 2020 | |
| Genomsnitt Intel Core i9-10910 (n=1) | |
| Schenker XMG Core 15 GK5NR0O | |
| Apple MacBook Pro 16 2019 i9 5500M | |
| Apple MacBook Pro 16 2019 i9 5500M | |
| AMD Ryzen 9 3950X | |
| AMD Ryzen 9 5900X | |
| Dell XPS 17 9700 Core i7 RTX 2060 Max-Q | |
| Genomsnitt av klass Desktop (35.5 - 79.2, n=16, senaste 2 åren) | |
| R Benchmark 2.5 / Overall mean | |
| Apple MacBook Pro 16 2019 i9 5500M | |
| Apple MacBook Pro 16 2019 i9 5500M | |
| Dell XPS 17 9700 Core i7 RTX 2060 Max-Q | |
| Schenker XMG Core 15 GK5NR0O | |
| Apple iMac 27 Mid 2020 | |
| Genomsnitt Intel Core i9-10910 (n=1) | |
| AMD Ryzen 9 3950X | |
| AMD Ryzen 9 5900X | |
| Genomsnitt av klass Desktop (0.3299 - 0.4909, n=16, senaste 2 åren) | |
* ... mindre är bättre
| PCMark 8 Home Score Accelerated v2 | 4946 poäng | |
| PCMark 8 Creative Score Accelerated v2 | 8396 poäng | |
| PCMark 8 Work Score Accelerated v2 | 4550 poäng | |
| PCMark 10 Score | 5859 poäng | |
Hjälp | ||

DiskSpd Read Loop, Queue Depth 8
| 3DMark 11 - 1280x720 Performance GPU | |
| Genomsnitt av klass Desktop (3175 - 130697, n=34, senaste 2 åren) | |
| Nvidia GeForce RTX 2070 Super | |
| Genomsnitt AMD Radeon RX 5700 XT (Desktop) (27697 - 36522, n=6) | |
| Apple iMac 27 Mid 2020 | |
| Asus ROG Strix G15 G512LW | |
| Apple iMac Pro | |
| Schenker XMG Core 15 GK5NR0O | |
| Dell XPS 17 9700 Core i7 RTX 2060 Max-Q | |
| Apple MacBook Pro 16 2019 i9 5500M | |
| 3DMark 11 Performance | 24377 poäng | |
| 3DMark Fire Strike Score | 17390 poäng | |
| 3DMark Time Spy Score | 6525 poäng | |
Hjälp | ||
| låg | med. | hög | ultra | QHD | 4K | |
|---|---|---|---|---|---|---|
| The Witcher 3 (2015) | 331 | 130 | 71.6 | 44 | ||
| Dota 2 Reborn (2015) | 105 | 107 | 98.5 | 103 | 78.4 | |
| Rise of the Tomb Raider (2016) | 272 | 118 | 96 | 48 | ||
| X-Plane 11.11 (2018) | 79.2 | 65.6 | 55.7 | 41.5 | ||
| Far Cry 5 (2018) | 126 | 106 | 100 | 95 | 76 | 40 |
| Shadow of the Tomb Raider (2018) | 158 | 114 | 105 | 89 | 61 | 32 |
| The Division 2 (2019) | 119 | 98 | 69 | 49 | 26 | |
| GRID 2019 (2019) | 216 | 135 | 110 | 80 | 74 | 44 |
| Doom Eternal (2020) | 265 | 167 | 149 | 143 | 111 | 58 |
| Gears Tactics (2020) | 242 | 154 | 107 | 78.7 | 45.7 | 24.2 |
| F1 2020 (2020) | 283 | 214 | 169 | 108 | 80 | 47 |
| Horizon Zero Dawn (2020) | 160 | 107 | 89 | 67 | 48 | 25 |
Ljudnivå
| Låg belastning |
| 29.7 / 29.7 / 29.7 dB(A) |
| Hög belastning |
| 35 / 43.6 dB(A) |
 | ||
30 dB tyst 40 dB(A) hörbar 50 dB(A) högt ljud |
||
min: | ||
(+) Den maximala temperaturen på ovansidan är 39.9 °C / 104 F, jämfört med genomsnittet av 33.9 °C / 93 F , allt från 25 till 47 °C för klassen Desktop.
(-) Botten värms upp till maximalt 50.1 °C / 122 F, jämfört med genomsnittet av 33.6 °C / 92 F
(+) Vid tomgångsbruk är medeltemperaturen för ovansidan 24.8 °C / 77 F, jämfört med enhetsgenomsnittet på 29.5 °C / ### class_avg_f### F.
Apple iMac 27 Mid 2020 ljudanalys
(+) | högtalare kan spela relativt högt (82.9 dB)
Bas 100 - 315 Hz
(+) | bra bas - bara 2.6% från medianen
(+) | basen är linjär (4.2% delta till föregående frekvens)
Mellan 400 - 2000 Hz
(+) | balanserad mellan - endast 1.7% från medianen
(+) | mids är linjära (5% delta till föregående frekvens)
Högsta 2 - 16 kHz
(±) | reducerade toppar - i genomsnitt 7.3% lägre än medianen
(+) | toppar är linjära (5.1% delta till föregående frekvens)
Totalt 100 - 16 000 Hz
(+) | det totala ljudet är linjärt (8.7% skillnad mot median)
Jämfört med samma klass
» 22% av alla testade enheter i den här klassen var bättre, 11% liknande, 67% sämre
» Den bästa hade ett delta på 6%, genomsnittet var 16%, sämst var 46%
Jämfört med alla testade enheter
» 3% av alla testade enheter var bättre, 1% liknande, 97% sämre
» Den bästa hade ett delta på 4%, genomsnittet var 24%, sämst var 134%
Apple MacBook Pro 16 2019 i9 5500M ljudanalys
(+) | högtalare kan spela relativt högt (82.3 dB)
Bas 100 - 315 Hz
(+) | bra bas - bara 2.3% från medianen
(+) | basen är linjär (5% delta till föregående frekvens)
Mellan 400 - 2000 Hz
(+) | balanserad mellan - endast 2.7% från medianen
(+) | mids är linjära (3.4% delta till föregående frekvens)
Högsta 2 - 16 kHz
(+) | balanserade toppar - endast 2.1% från medianen
(+) | toppar är linjära (2.6% delta till föregående frekvens)
Totalt 100 - 16 000 Hz
(+) | det totala ljudet är linjärt (6.9% skillnad mot median)
Jämfört med samma klass
» 5% av alla testade enheter i den här klassen var bättre, 1% liknande, 94% sämre
» Den bästa hade ett delta på 5%, genomsnittet var 17%, sämst var 45%
Jämfört med alla testade enheter
» 1% av alla testade enheter var bättre, 0% liknande, 99% sämre
» Den bästa hade ett delta på 4%, genomsnittet var 24%, sämst var 134%
| Av/Standby | |
| Låg belastning | |
| Hög belastning |
|
Förklaring:
min: | |
| Apple iMac 27 Mid 2020 i9-10910, Radeon RX 5700 XT (Desktop), Apple SSD AP1024, IPS, 5120x2880, 27" | Apple iMac Pro W-2145, Pro Vega 56, , , 5120x2880, 27" | Apple iMac Retina 5K 27 Late 2015 3.2 GHz M390 MK472D/A 6500, Radeon R9 M390, Apple Fusion Drive 1TB (24 GB SSD + 1 TB HDD), , 5120x2880, 27" | Genomsnitt AMD Radeon RX 5700 XT (Desktop) | Genomsnitt av klass Desktop | |
|---|---|---|---|---|---|
| Power Consumption | -37% | 11% | 0% | 43% | |
| Idle Minimum * (Watt) | 27.6 | 49.5 -79% | 29.5 -7% | 27.6 ? -0% | 17.9 ? 35% |
| Idle Average * (Watt) | 64.7 | 86.7 -34% | 59.2 9% | 64.7 ? -0% | 37.2 ? 43% |
| Idle Maximum * (Watt) | 65.3 | 88.9 -36% | 68 -4% | 65.3 ? -0% | 41.3 ? 37% |
| Load Average * (Watt) | 162 | 150.1 7% | 126 22% | 162 ? -0% | 96.7 ? 40% |
| Witcher 3 ultra * (Watt) | 247 | ||||
| Load Maximum * (Watt) | 354 | 508.5 -44% | 231 35% | 354 ? -0% | 141.6 ? 60% |
* ... mindre är bättre
För
Emot
Omdöme - Bra desktop med ett högt pris
Läs den fullständiga versionen av den här recensionen på engelska här.
Apples iMac 27 är fortfarande ett bra allt-i-ett-system som har en trevlig design och en bra 5K-skärm. Dessutom är de inbyggda högtalarna utmärkta - många kommer inte behöva externa högtalare.
Problemen börjar märkas när vi tittar på komponenternas prestanda. På grund av den begränsade kylningen kan varken CPU:n eller GPU:n använda sina fulla potential. Med tanke på det är de extra komponenterna som finns som tillval inte riktigt värda pengarna. Jämför vi processorn med aktuella AMD-modeller ser vi ytterligare ett problem, för de sistnämnda har helt enkelt mycket högre prestanda. Vi gillade heller inte att fläktarna pulserade vid kombinerad belastning.
iMac 27 är även år 2020 ett bra allt-i-allo-system, men du får vara försiktig med vilka komponenter du väljer. Tillvalskomponenterna kan inte utnyttja sin prestanda särskilt bra.
Sen har vi det nya nanotexturerade glaset. Ja, den matta ytan fungerade bra och bildkvaliteten var bara en aning sämre än på de blanka modellerna, men prispåslaget på 6.000 kronor är väldigt högt. Om du är intresserad av en iMac är det bättre att du hoppar över tillval som rör processor och grafikkort och istället lägger pengarna på mer lagring eller RAM.
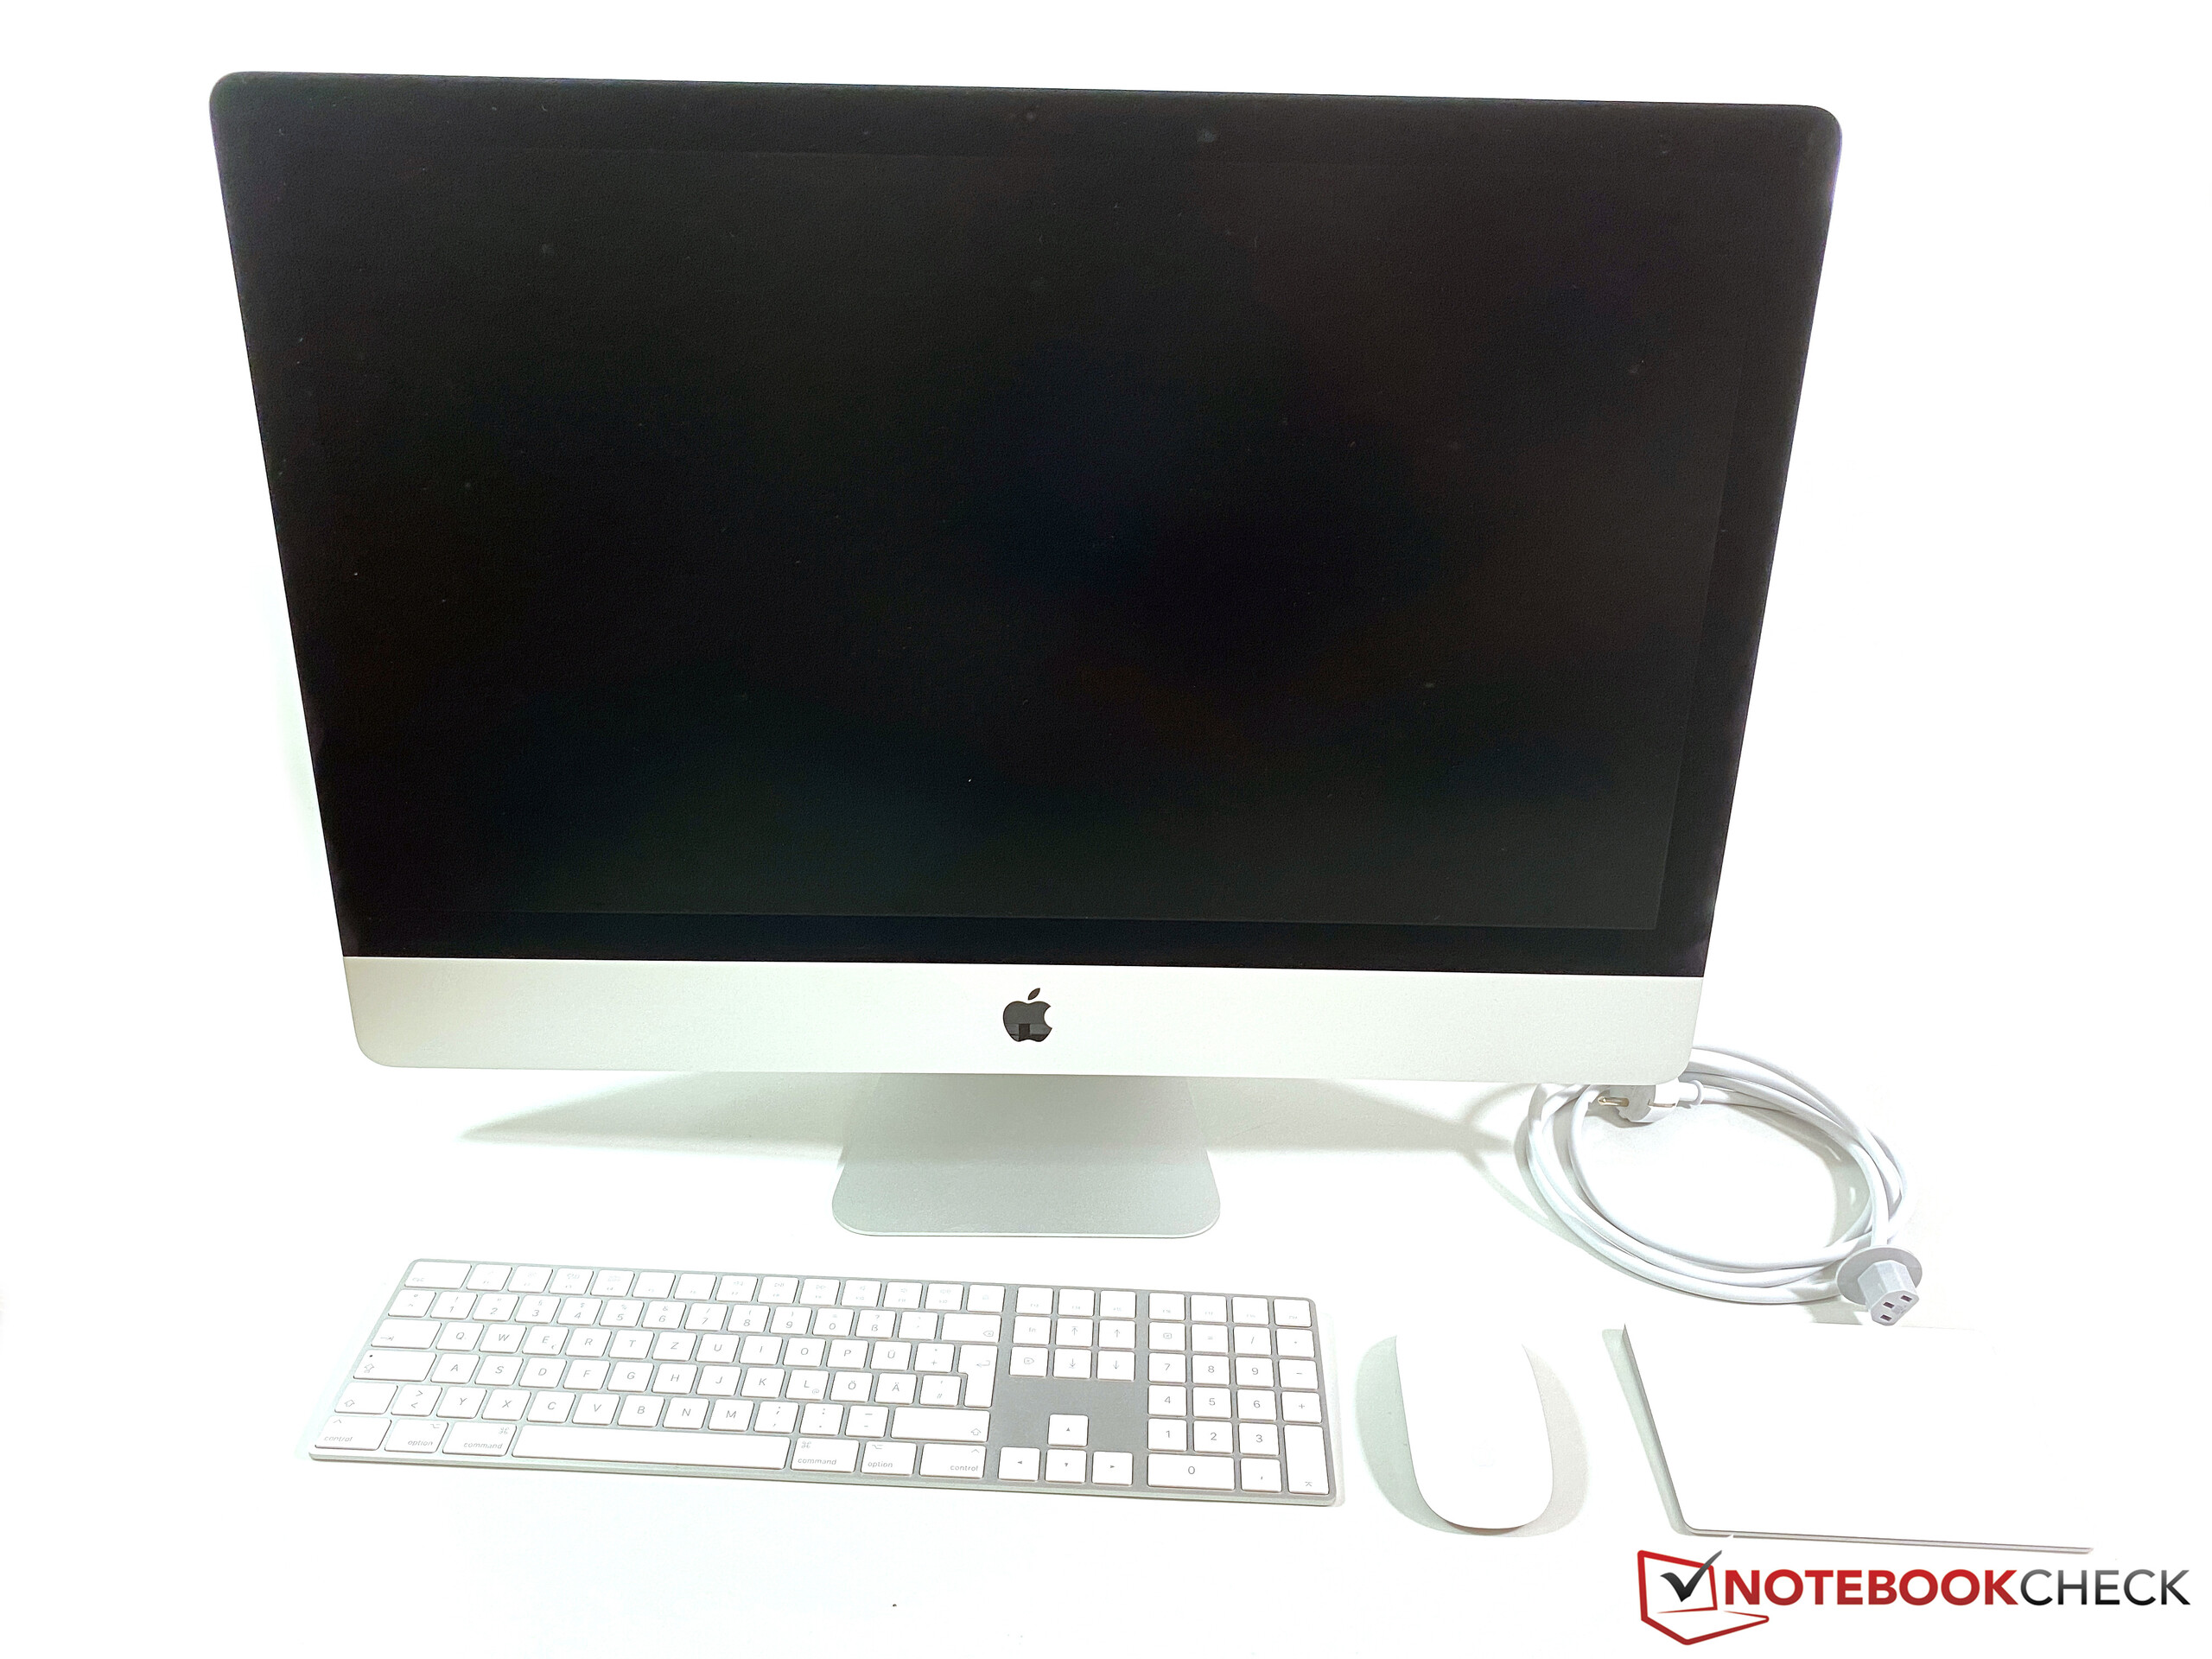
Apple iMac 27 Mid 2020
- 11/09/2020 v7 (old)
Andreas Osthoff
Price comparison
