RedMagic Titan 16 Pro recension: En spelbärbar dator tillverkad av en smarttelefontillverkare
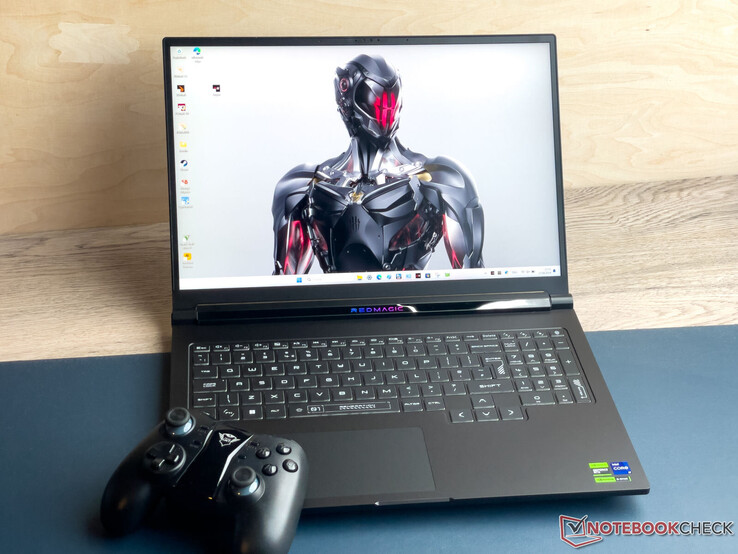
Regelbundna besökare på denna webbplats kanske redan känner till varumärket "RedMagic" från gaming-smarttelefonsegmentet (till exempel Nubia RedMagic 9 Pro). RedMagic Titan 16 Pro är Nubias första utflykt till den bärbara datorvärlden för spel. Dess datablad innehåller inga överraskningar: A Core i9-14900HX är ihopkopplad med en GeForce RTX 4060. Till detta kommer en 16-tumsskärm med bildförhållandet 16:10, Thunderbolt 4, DDR5 RAM och 2 SSD-platser.
Huruvida Nubia kan stå upp mot den redan väletablerade konkurrensen återstår att se. Titan konkurrerar mot följande enheter: Lenovo Legion Pro 5 16IRX9, HP Victus 16 (2024), Acer Predator Helios Neo 16 (2024), XMG Pro 16 Studio (Mid 24) och Gigabyte G6X 9KG (2024).
Potentiella konkurrenter i jämförelse
Gradering | Version | Datum | Modell | Vikt | Höjd | Storlek | Upplösning | Pris |
|---|---|---|---|---|---|---|---|---|
| 81.2 % | v8 | 08/2024 | Nubia RedMagic Titan 16 Pro i9-14900HX, GeForce RTX 4060 Laptop GPU | 2.4 kg | 23.9 mm | 16.00" | 2560x1600 | |
| 82.3 % | v8 | 07/2024 | Lenovo Legion Pro 5 16IRX9 G9 i7-14700HX, GeForce RTX 4060 Laptop GPU | 2.5 kg | 26.55 mm | 16.00" | 2560x1600 | |
| 84.3 % v7 (old) | v7 (old) | 05/2024 | HP Victus 16 (2024) i7-14700HX, GeForce RTX 4060 Laptop GPU | 2.4 kg | 23.9 mm | 16.10" | 1920x1080 | |
| 86.8 % v7 (old) | v7 (old) | 05/2024 | Acer Predator Helios Neo 16 (2024) i7-14700HX, GeForce RTX 4070 Laptop GPU | 2.6 kg | 25.95 mm | 16.00" | 2560x1600 | |
| 81.2 % | v8 | 07/2024 | Schenker XMG Pro 16 Studio (Mid 24) i9-14900HX, GeForce RTX 4070 Laptop GPU | 2.3 kg | 19.9 mm | 16.00" | 2560x1600 | |
| 83.2 % v7 (old) | v7 (old) | 03/2024 | Gigabyte G6X 9KG (2024) i7-13650HX, GeForce RTX 4060 Laptop GPU | 2.6 kg | 25.1 mm | 16.00" | 1920x1200 |
Topp 10...
» Topp 10: Bästa bärbara allround/multimediadatorerna
» Topp 10: Bästa bärbara speldatorerna
» Topp 10: Bärbara budget/kontorsdatorer
» Topp 10: Bästa bärbara kontors/premiumdatorerna
» Topp 10: Bärbara arbetsstationer
» Topp 10: De bästa små/kompakta bärbara datorerna
» Topp 10: Bästa ultrabooks
» Topp 10: Bästa hybriddatorerna
» Topp 10: Bästa surfplattorna
» Topp 10: Marknadens bästa smartphones
Observera: Vi har nyligen uppdaterat vårt betygssystem och resultaten från version 8 är inte jämförbara med resultaten från version 7. Mer information finns tillgänglig här.
Fodral - Nubia har valt ett aluminiumfodral
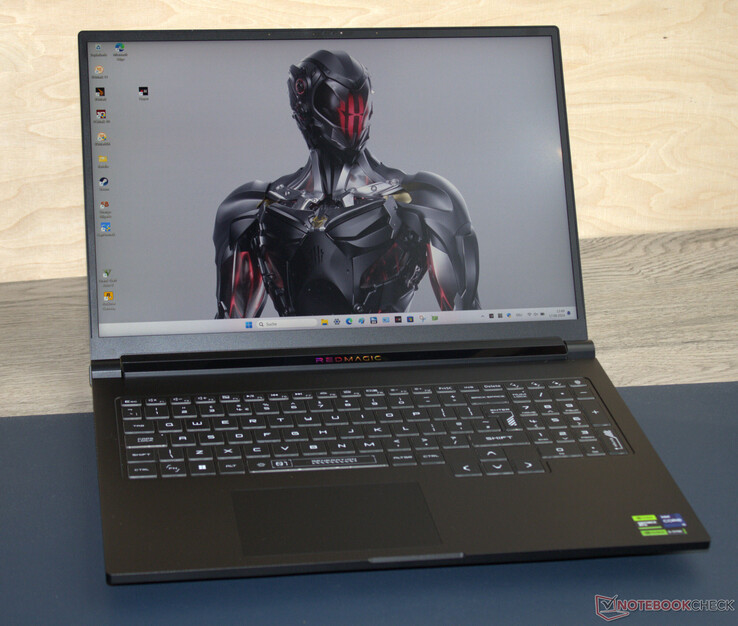
Du bör alltid ha en rengöringsduk i närheten: Det mattsvarta fodralets ytor är superkänsliga för att samla fingeravtrycksmärken. Aluminiumfodralets basenhet och lock kan bara vridas en liten bit och vi stötte inte på några byggfel. Att trycka på baksidan av locket resulterar inte i några bildförändringar. De mycket täta gångjärnen håller locket stadigt på plats och det vickar bara minimalt. Dess maximala öppningsvinkel är 130 grader och du kan öppna det med en hand.
Tillsammans med den bärbara datorns bakgrundsbelysta tangentbord ger två LED-element lite färg i mixen: RedMagic-bokstäverna på gångjärnskåpan och logotypen på locket lyser i regnbågens alla färger. Alla element kan styras individuellt. Bokstäverna fungerar också som en batteriindikator: ett rött blinkande ljus indikerar en låg laddningsnivå.
Inom jämförelsefältet visar sig Titan vara en av de mest kompakta och lätta enheterna. Ändå är skillnaderna jämfört med tävlingen ganska små.
Anslutningsmöjligheter - Titan har Thunderbolt 4
Titan är utrustad med tre USB-A-portar (2x USB 3.2 Gen 2, 1x USB 3.2 Gen 1) samt en USB-C-port (Thunderbolt 4). Den senare har stöd för Power Delivery och DP Alt-läge. Den har totalt två videoutgångar (1x HDMI, 1x DP). Ett ljuduttag och en ethernet-port (1 GBit/s) kompletterar det totala paketet.
Videoutgångarna, nätverksuttaget och strömanslutningen är alla placerade på enhetens baksida, så motsvarande kablar bör inte vara i vägen under användning. En positiv sak är att det finns en USB-A-port på vänster och höger sida av den bärbara datorn.
SD-kortläsare
SD-kortläsaren (referenskort: AV PRO microSD 128 GB V60) är inte en av de snabbaste i sitt slag, men den levererar stabila datahastigheter i det medelsnabba intervallet. Om man jämför detta med värdena för Blade 16 (2024) visar att betydligt högre överföringshastigheter skulle kunna vara möjliga.
| SD Card Reader | |
| average JPG Copy Test (av. of 3 runs) | |
| Razer Blade 16 2024, RTX 4090 | |
| Genomsnitt av klass Gaming (20 - 210, n=63, senaste 2 åren) | |
| Schenker XMG Pro 16 Studio (Mid 24) (AV PRO microSD 128 GB V60) | |
| Nubia RedMagic Titan 16 Pro (AV PRO microSD 128 GB V60) | |
| Acer Predator Helios Neo 16 (2024) (AV PRO microSD 128 GB V60) | |
| maximum AS SSD Seq Read Test (1GB) | |
| Razer Blade 16 2024, RTX 4090 | |
| Genomsnitt av klass Gaming (25.5 - 261, n=60, senaste 2 åren) | |
| Schenker XMG Pro 16 Studio (Mid 24) (AV PRO microSD 128 GB V60) | |
| Nubia RedMagic Titan 16 Pro (AV PRO microSD 128 GB V60) | |
| Acer Predator Helios Neo 16 (2024) (AV PRO microSD 128 GB V60) | |
Kommunikation
Det finns inga överraskningar när det gäller nätverksalternativen: Trådbundna anslutningar hanteras av en etablerad Gigabit Ethernet-kontroller (RTL8168/8111, 1 GBit/s) från Realtek. Intels WiFi 6E-chip (AX211) levererar bra till mycket bra datahastigheter under optimala förhållanden (inga WiFi-enheter i närheten, kort avstånd mellan bärbar dator och server).
Webbkamera
Webbkameran (2,1 MP) är av standardtyp, inklusive stöd för Windows Hello. Kameran har inget mekaniskt lock eller någon fysisk på/av-strömbrytare.
Tillbehör
Förutom de vanliga dokumenten (snabbstartsguide och garantiinformation) medföljer inga ytterligare tillbehör till den bärbara datorn.
Underhåll
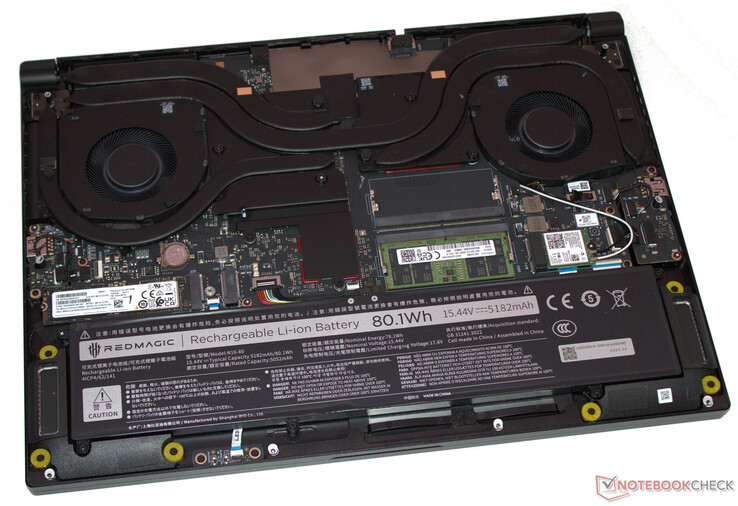
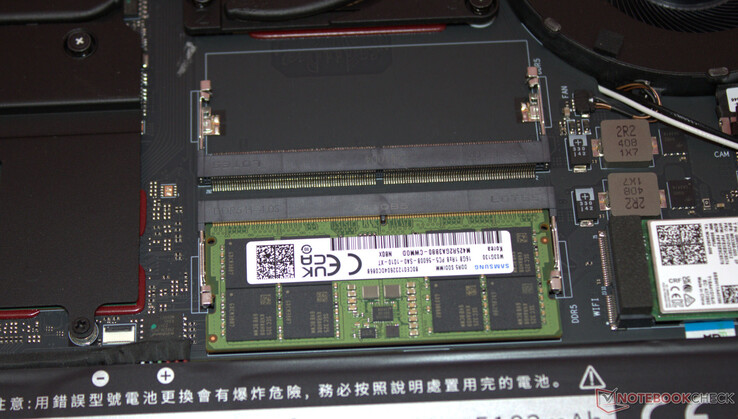
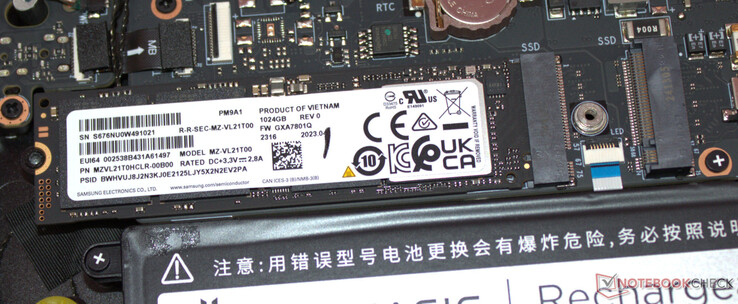
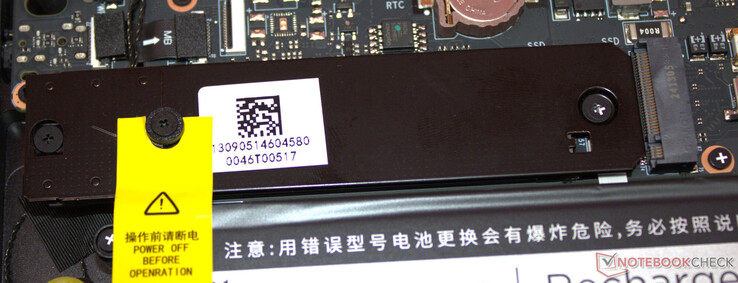
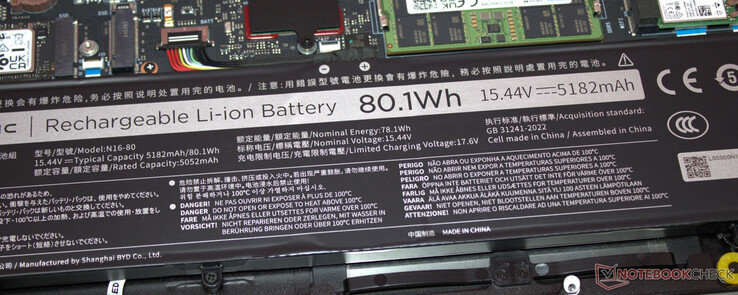
Efter att alla skruvar på undersidan av höljet har lossats kan den nedre delen av höljet tas bort med hjälp av ett plektrum eller en platt spatel. Då kommer man åt minnesbankerna (varav en är upptagen), SSD (PCIe 4, M.2-2280), andra SSD-platsen (PCIe 4, M.2-2280) WLAN-modul, BIOS-batteri, fläktar och batteri.
Hållbarhet
Mycket kartong, lite plast: Den bärbara datorn är omsluten av en film, medan en tunn skummatta skyddar enhetens ovansida. Den tryckta snabbstartsguiden ligger i en plastpåse. En löstagbar bottenplatta gör det möjligt att reparera den bärbara datorn - hela hårdvaran är åtkomlig. Mjukvaruuppdateringar borde inte vara något problem under de närmaste åren - Windows 11 används trots allt som operativsystem.
Det återstår att se hur Nubia kommer att hantera leverans av reservdelar och support för sin egen programvara. Vid testtillfället finns det fortfarande inget nedladdningsområde för Titan på Nubias webbplats.
Garanti
Vi kan inte ge någon information om garantin för den bärbara datorn - den är troligen cirka 12 månader, vilket är standard i USA. Vi anser att utökade garantier är osannolika.
Inmatningsenheter - RedMagic bärbar dator med RGB-belysning
Tangentbord
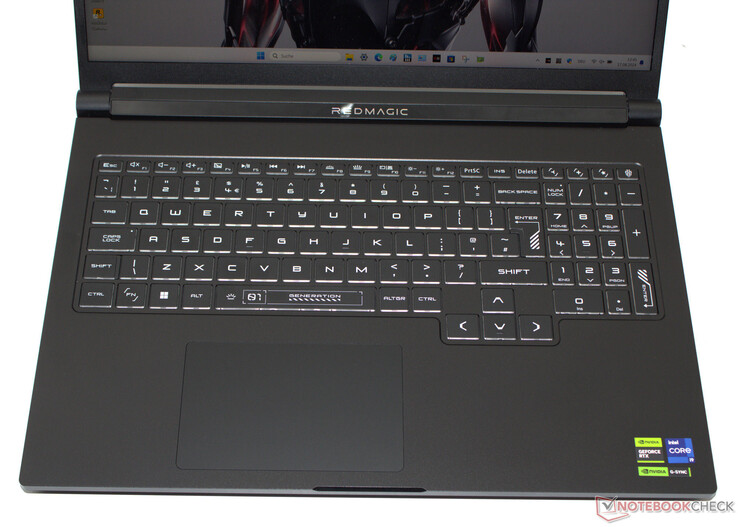
Nubia har valt ett chiclet-tangentbord med en numerisk knappsats. De jämnt upplysta tangenterna har en kort rörelse och en tydlig tryckpunkt. Tangentbordet ger inte efter när du skriver på det. En positiv sak är att de förskjutna piltangenterna är i full storlek. RGB-bakgrundsbelysningen är uppdelad i fyra zoner, och vår testenhet har en QWERTY-tangentbordslayout. Vi kan inte säga om tillverkaren erbjuder lokaliserade layouter.
Pekplatta
Skärm - En IPS-panel med DCI-P3-täckning
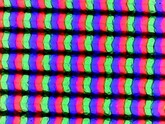
Det verkar som att det arbetsvänliga bildförhållandet 16:10 har etablerat sig, eftersom de flesta bärbara datorer i jämförelsefältet har skärmar med detta bildförhållande - inklusive Titan. Nubia har utrustat sin bärbara dator med en matt, betraktningsvinkelstabil IPS-skärm (2 560 x 1 600 pixlar) med en diagonal på 16 tum. Panelen är superljus och dess kontrast uppfyller målvärdet. Det är fullt möjligt att läsa på skärmen utomhus. Positivt är att 240-Hz-panelen inte visar några tecken på PWM-flimmer och stöder G-Sync. Alternativa skärmar är inte tillgängliga.
| |||||||||||||||||||||||||
Distribution av ljusstyrkan: 86 %
Mitt på batteriet: 543 cd/m²
Kontrast: 1065:1 (Svärta: 0.51 cd/m²)
ΔE ColorChecker Calman: 3.19 | ∀{0.5-29.43 Ø4.76}
calibrated: 0.69
ΔE Greyscale Calman: 4.2 | ∀{0.09-98 Ø5}
84.1% AdobeRGB 1998 (Argyll 3D)
100% sRGB (Argyll 3D)
96.3% Display P3 (Argyll 3D)
Gamma: 1.999
CCT: 7431 K
| Nubia RedMagic Titan 16 Pro BOE CQ NE160QDM-NZ2, IPS, 2560x1600, 16", 240 Hz | Lenovo Legion Pro 5 16IRX9 G9 BOE NE160QDM-NZB, IPS, 2560x1600, 16", 240 Hz | HP Victus 16 (2024) Chi Mei CMN163E, IPS, 1920x1080, 16.1", 144 Hz | Acer Predator Helios Neo 16 (2024) Chi Mei N160GME-GTB, LED, 2560x1600, 16", 240 Hz | Schenker XMG Pro 16 Studio (Mid 24) BOE CQ NE160QDM-NZ1, IPS, 2560x1600, 16", 240 Hz | Gigabyte G6X 9KG (2024) BOE NE160WUM-NX6, IPS, 1920x1200, 16", 165 Hz | |
|---|---|---|---|---|---|---|
| Display | 2% | -48% | 1% | -15% | -48% | |
| Display P3 Coverage (%) | 96.3 | 99.22 3% | 41.3 -57% | 95.9 0% | 68.8 -29% | 41.8 -57% |
| sRGB Coverage (%) | 100 | 99.93 0% | 61.7 -38% | 99.8 0% | 99.5 0% | 62.4 -38% |
| AdobeRGB 1998 Coverage (%) | 84.1 | 87.81 4% | 42.7 -49% | 86.4 3% | 70.8 -16% | 43.3 -49% |
| Response Times | -54% | -454% | -52% | -126% | -635% | |
| Response Time Grey 50% / Grey 80% * (ms) | 3.9 ? | 4.8 ? -23% | 28.6 ? -633% | 5 ? -28% | 12.7 ? -226% | 40.5 ? -938% |
| Response Time Black / White * (ms) | 5 ? | 9.2 ? -84% | 18.7 ? -274% | 8.8 ? -76% | 6.3 ? -26% | 21.6 ? -332% |
| PWM Frequency (Hz) | ||||||
| Screen | 4% | -74% | 18% | -2% | -68% | |
| Brightness middle (cd/m²) | 543 | 518 -5% | 287 -47% | 521 -4% | 416 -23% | 353 -35% |
| Brightness (cd/m²) | 516 | 491 -5% | 288 -44% | 506 -2% | 392 -24% | 318 -38% |
| Brightness Distribution (%) | 86 | 90 5% | 86 0% | 85 -1% | 86 0% | 81 -6% |
| Black Level * (cd/m²) | 0.51 | 0.36 29% | 0.19 63% | 0.44 14% | 0.38 25% | 0.21 59% |
| Contrast (:1) | 1065 | 1439 35% | 1511 42% | 1184 11% | 1095 3% | 1681 58% |
| Colorchecker dE 2000 * | 3.19 | 4.32 -35% | 5.46 -71% | 1.74 45% | 2.33 27% | 5.21 -63% |
| Colorchecker dE 2000 max. * | 7.09 | 6.37 10% | 20.36 -187% | 3.88 45% | 6.07 14% | 19.95 -181% |
| Colorchecker dE 2000 calibrated * | 0.69 | 0.75 -9% | 3.52 -410% | 0.52 25% | 1.02 -48% | 3.61 -423% |
| Greyscale dE 2000 * | 4.2 | 3.66 13% | 4.8 -14% | 3 29% | 3.7 12% | 3.6 14% |
| Gamma | 1.999 110% | 2.19 100% | 2.108 104% | 2.164 102% | 2.161 102% | 2.367 93% |
| CCT | 7431 87% | 6841 95% | 6442 101% | 6816 95% | 7102 92% | 7138 91% |
| Totalt genomsnitt (program/inställningar) | -16% /
-4% | -192% /
-123% | -11% /
4% | -48% /
-22% | -250% /
-145% |
* ... mindre är bättre
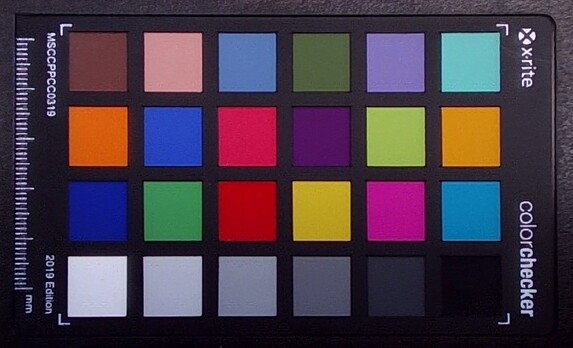
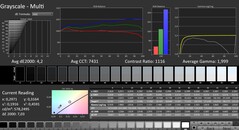
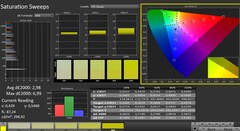
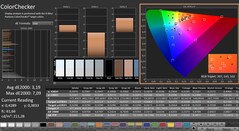
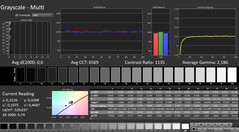
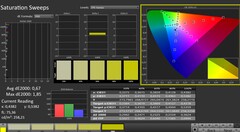
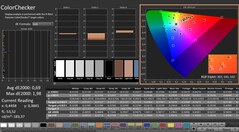
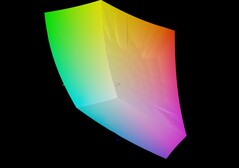
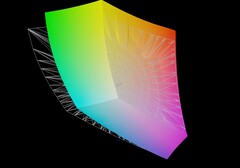
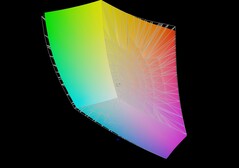
Panelen täcker sRGB- och DCI-P3-färgrymderna helt eller nästan helt, men inte AdobeRGB-färgrymden - detta liknar skärmarna hos de flesta konkurrenter. Dess anständiga färgåtergivning direkt ur lådan kan ökas till mycket bra genom att utföra en kalibrering: Då sjunker dess färgavvikelse från 3,19 till 0,69 (mål: DeltaE < 3). Samtidigt ser dess gråskaleavbildning mycket mer balanserad ut.
Vår färgprofil kan laddas ner och användas kostnadsfritt. En länk finns i informationsrutan på displayen.
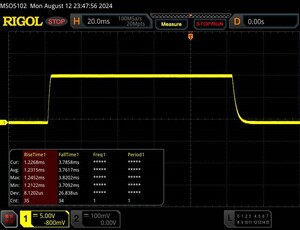
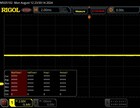
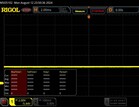
Visa svarstider
| ↔ Svarstid svart till vitt | ||
|---|---|---|
| 5 ms ... stiga ↗ och falla ↘ kombinerat | ↗ 1.2 ms stiga | |
| ↘ 3.8 ms hösten | ||
| Skärmen visar väldigt snabba svarsfrekvenser i våra tester och borde vara mycket väl lämpad för fartfyllt spel. I jämförelse sträcker sig alla testade enheter från 0.1 (minst) till 240 (maximalt) ms. » 16 % av alla enheter är bättre. Det betyder att den uppmätta svarstiden är bättre än genomsnittet av alla testade enheter (20.1 ms). | ||
| ↔ Svarstid 50 % grått till 80 % grått | ||
| 3.9 ms ... stiga ↗ och falla ↘ kombinerat | ↗ 1.7 ms stiga | |
| ↘ 2.2 ms hösten | ||
| Skärmen visar väldigt snabba svarsfrekvenser i våra tester och borde vara mycket väl lämpad för fartfyllt spel. I jämförelse sträcker sig alla testade enheter från 0.165 (minst) till 636 (maximalt) ms. » 14 % av alla enheter är bättre. Det betyder att den uppmätta svarstiden är bättre än genomsnittet av alla testade enheter (31.4 ms). | ||
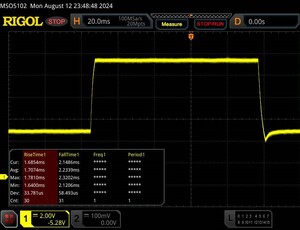
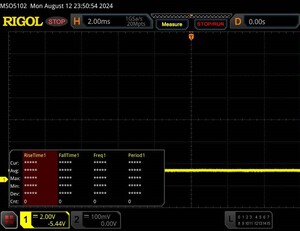
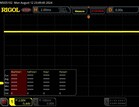
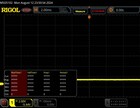
Skärmflimmer / PWM (Puls-Width Modulation)
| Skärmflimmer / PWM upptäcktes inte | |||
Som jämförelse: 53 % av alla testade enheter använder inte PWM för att dämpa skärmen. Om PWM upptäcktes mättes ett medelvärde av 8016 (minst: 5 - maximum: 343500) Hz. | |||
Prestanda - Raptor Lake och Ada Lovelace driver den bärbara datorn
Titan 16 Pro riktar sig till spelare och kreatörer, och fokus ligger förmodligen på det förstnämnda. A Core i9-14900HX och en GeForce RTX 4060 driver den bärbara datorn. Dess MRSP är US $ 1,699. Nubia erbjuder ytterligare varianter av den här enheten, men de kan ännu inte hittas globalt.
Testförhållanden
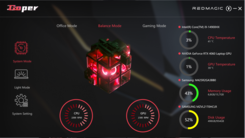
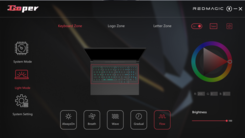
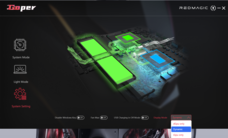
Tre tillverkarspecifika prestandaprofiler (se tabell) finns att välja mellan. Balanserat läge (benchmarks) och kontorsläge (batteritester) användes under vårt test. GPU-läget var inställt på dynamiskt (= Optimus). Varje profil kan hämtas direkt via en separat knapp i den övre raden på det numeriska tangentbordet. Alternativt kan du ändra dem via Goper-applikationen (den bärbara datorns kontrollcenter).
| Balanserat läge | Spelläge | Kontorsläge | |
|---|---|---|---|
| Effektgräns 1 (HWInfo) | 45 watt | 100 watt | 35 watt |
| Effektgräns 2 (HWInfo) | 140 watt | 140 watt | 140 watt |
| Buller (Cyberpunk 2077) | 50 dB(A) | 53 dB(A) | 47 dB(A) |
| Prestanda (Cyberpunk 2077) | 66 fps | 66 fps | 60 fps |
Processor
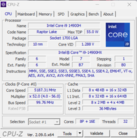
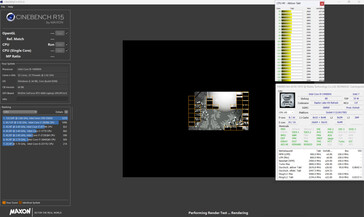
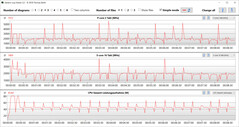
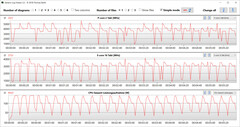
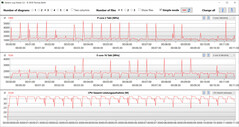
Titan har endast ett CPU-alternativ tillgängligt, nämligen Core i9-14900HX (Raptor Lake). Dess 24 CPU-kärnor (8P + 16E = 32 trådar) når maximala klockfrekvenser på 5,8 GHz (P) och 4,1 GHz (E). Kontinuerlig belastning med flera trådar (CB15-loop) fick CPU-klockan att sjunka avsevärt från första till tredje körningen. Därefter bibehölls en ganska konstant nivå. Profilen för spelläget säkerställer en betydligt högre prestandanivå.
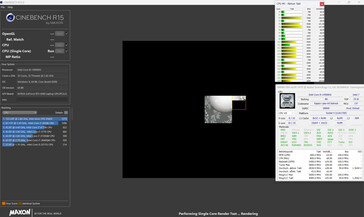
De tre strömlägena ger mycket likartad prestanda i enstaka trådar på ungefär samma nivå som CPU:ns genomsnitt. Prestandan i flera trådar skiljer sig åt i mycket större utsträckning: Endast gaming-läget resulterade i värden i nivå med CPU:ns genomsnitt under vårt test, medan de andra två lägena var betydligt lägre.
Mer information om Core i9 finns i vår analysartikel.
Cinebench R15 Multi continuous test
| CPU Performance rating - Percent | |
| Genomsnitt Intel Core i9-14900HX | |
| Lenovo Legion Pro 5 16IRX9 G9 | |
| Nubia RedMagic Titan 16 Pro | |
| Schenker XMG Pro 16 Studio (Mid 24) | |
| Acer Predator Helios Neo 16 (2024) | |
| Genomsnitt av klass Gaming | |
| Nubia RedMagic Titan 16 Pro | |
| HP Victus 16 (2024) | |
| Gigabyte G6X 9KG (2024) | |
| Cinebench R20 | |
| CPU (Multi Core) | |
| Nubia RedMagic Titan 16 Pro (Gaming Mode) | |
| Genomsnitt Intel Core i9-14900HX (6579 - 13832, n=37) | |
| Lenovo Legion Pro 5 16IRX9 G9 | |
| Schenker XMG Pro 16 Studio (Mid 24) | |
| Genomsnitt av klass Gaming (2179 - 16108, n=135, senaste 2 åren) | |
| HP Victus 16 (2024) | |
| Acer Predator Helios Neo 16 (2024) | |
| Gigabyte G6X 9KG (2024) | |
| Nubia RedMagic Titan 16 Pro | |
| CPU (Single Core) | |
| Nubia RedMagic Titan 16 Pro | |
| Genomsnitt Intel Core i9-14900HX (657 - 859, n=37) | |
| Lenovo Legion Pro 5 16IRX9 G9 | |
| Nubia RedMagic Titan 16 Pro (Gaming Mode) | |
| Acer Predator Helios Neo 16 (2024) | |
| Schenker XMG Pro 16 Studio (Mid 24) | |
| Genomsnitt av klass Gaming (439 - 870, n=135, senaste 2 åren) | |
| Gigabyte G6X 9KG (2024) | |
| HP Victus 16 (2024) | |
| Cinebench R15 | |
| CPU Multi 64Bit | |
| Nubia RedMagic Titan 16 Pro (Gaming Mode) | |
| Genomsnitt Intel Core i9-14900HX (3263 - 5589, n=38) | |
| Schenker XMG Pro 16 Studio (Mid 24) | |
| Lenovo Legion Pro 5 16IRX9 G9 | |
| Genomsnitt av klass Gaming (1537 - 6271, n=135, senaste 2 åren) | |
| HP Victus 16 (2024) | |
| Acer Predator Helios Neo 16 (2024) | |
| Nubia RedMagic Titan 16 Pro | |
| Gigabyte G6X 9KG (2024) | |
| CPU Single 64Bit | |
| Nubia RedMagic Titan 16 Pro | |
| Nubia RedMagic Titan 16 Pro (Gaming Mode) | |
| Genomsnitt Intel Core i9-14900HX (247 - 323, n=37) | |
| Lenovo Legion Pro 5 16IRX9 G9 | |
| Acer Predator Helios Neo 16 (2024) | |
| Genomsnitt av klass Gaming (188.8 - 343, n=134, senaste 2 åren) | |
| Schenker XMG Pro 16 Studio (Mid 24) | |
| Gigabyte G6X 9KG (2024) | |
| HP Victus 16 (2024) | |
| Blender - v2.79 BMW27 CPU | |
| Gigabyte G6X 9KG (2024) | |
| Nubia RedMagic Titan 16 Pro | |
| HP Victus 16 (2024) | |
| Genomsnitt av klass Gaming (80 - 517, n=132, senaste 2 åren) | |
| Acer Predator Helios Neo 16 (2024) | |
| Schenker XMG Pro 16 Studio (Mid 24) | |
| Nubia RedMagic Titan 16 Pro (Gaming Mode) | |
| Lenovo Legion Pro 5 16IRX9 G9 | |
| Genomsnitt Intel Core i9-14900HX (91 - 206, n=37) | |
| Geekbench 6.5 | |
| Multi-Core | |
| Lenovo Legion Pro 5 16IRX9 G9 (6.2.1) | |
| Genomsnitt Intel Core i9-14900HX (13158 - 19665, n=37) | |
| Acer Predator Helios Neo 16 (2024) (6.2.1) | |
| Schenker XMG Pro 16 Studio (Mid 24) (6.2.1) | |
| Genomsnitt av klass Gaming (5340 - 22104, n=134, senaste 2 åren) | |
| HP Victus 16 (2024) (6.2.1) | |
| Nubia RedMagic Titan 16 Pro (6.2.1, Gaming Mode) | |
| Gigabyte G6X 9KG (2024) (6.2.1) | |
| Nubia RedMagic Titan 16 Pro (6.2.1) | |
| Single-Core | |
| Nubia RedMagic Titan 16 Pro (6.2.1) | |
| Nubia RedMagic Titan 16 Pro (6.2.1, Gaming Mode) | |
| Acer Predator Helios Neo 16 (2024) (6.2.1) | |
| Genomsnitt Intel Core i9-14900HX (2419 - 3129, n=37) | |
| Lenovo Legion Pro 5 16IRX9 G9 (6.2.1) | |
| Genomsnitt av klass Gaming (1490 - 3259, n=134, senaste 2 åren) | |
| Schenker XMG Pro 16 Studio (Mid 24) (6.2.1) | |
| Gigabyte G6X 9KG (2024) (6.2.1) | |
| HP Victus 16 (2024) (6.2.1) | |
| HWBOT x265 Benchmark v2.2 - 4k Preset | |
| Nubia RedMagic Titan 16 Pro (Gaming Mode) | |
| Genomsnitt Intel Core i9-14900HX (16.8 - 38.9, n=37) | |
| Lenovo Legion Pro 5 16IRX9 G9 | |
| Genomsnitt av klass Gaming (7.7 - 44.3, n=133, senaste 2 åren) | |
| Schenker XMG Pro 16 Studio (Mid 24) | |
| Acer Predator Helios Neo 16 (2024) | |
| HP Victus 16 (2024) | |
| Gigabyte G6X 9KG (2024) | |
| Nubia RedMagic Titan 16 Pro | |
| LibreOffice - 20 Documents To PDF | |
| HP Victus 16 (2024) (6.3.4.2) | |
| Lenovo Legion Pro 5 16IRX9 G9 (6.3.4.2) | |
| Genomsnitt av klass Gaming (19 - 88.8, n=133, senaste 2 åren) | |
| Schenker XMG Pro 16 Studio (Mid 24) (6.3.4.2) | |
| Genomsnitt Intel Core i9-14900HX (19 - 85.1, n=37) | |
| Acer Predator Helios Neo 16 (2024) (6.3.4.2) | |
| Nubia RedMagic Titan 16 Pro (6.3.4.2, Gaming Mode) | |
| Gigabyte G6X 9KG (2024) (6.3.4.2) | |
| Nubia RedMagic Titan 16 Pro (6.3.4.2) | |
| R Benchmark 2.5 - Overall mean | |
| HP Victus 16 (2024) | |
| Gigabyte G6X 9KG (2024) | |
| Genomsnitt av klass Gaming (0.3439 - 0.759, n=134, senaste 2 åren) | |
| Schenker XMG Pro 16 Studio (Mid 24) | |
| Lenovo Legion Pro 5 16IRX9 G9 | |
| Genomsnitt Intel Core i9-14900HX (0.3604 - 0.4859, n=37) | |
| Acer Predator Helios Neo 16 (2024) | |
| Nubia RedMagic Titan 16 Pro | |
| Nubia RedMagic Titan 16 Pro (Gaming Mode) | |
* ... mindre är bättre
AIDA64: FP32 Ray-Trace | FPU Julia | CPU SHA3 | CPU Queen | FPU SinJulia | FPU Mandel | CPU AES | CPU ZLib | FP64 Ray-Trace | CPU PhotoWorxx
| Performance rating | |
| Genomsnitt Intel Core i9-14900HX | |
| Nubia RedMagic Titan 16 Pro | |
| Genomsnitt av klass Gaming | |
| Lenovo Legion Pro 5 16IRX9 G9 | |
| Schenker XMG Pro 16 Studio (Mid 24) | |
| Acer Predator Helios Neo 16 (2024) | |
| HP Victus 16 (2024) | |
| Nubia RedMagic Titan 16 Pro | |
| Gigabyte G6X 9KG (2024) | |
| AIDA64 / FP32 Ray-Trace | |
| Genomsnitt av klass Gaming (7192 - 85542, n=133, senaste 2 åren) | |
| Genomsnitt Intel Core i9-14900HX (13098 - 33474, n=36) | |
| Nubia RedMagic Titan 16 Pro (v6.92.6600, Gaming Mode) | |
| Lenovo Legion Pro 5 16IRX9 G9 (v6.92.6600) | |
| Acer Predator Helios Neo 16 (2024) (v6.92.6600) | |
| Schenker XMG Pro 16 Studio (Mid 24) (v6.92.6600) | |
| HP Victus 16 (2024) (v6.92.6600) | |
| Gigabyte G6X 9KG (2024) (v6.92.6600) | |
| Nubia RedMagic Titan 16 Pro (v6.92.6600) | |
| AIDA64 / FPU Julia | |
| Genomsnitt av klass Gaming (35040 - 238426, n=133, senaste 2 åren) | |
| Genomsnitt Intel Core i9-14900HX (67573 - 166040, n=36) | |
| Nubia RedMagic Titan 16 Pro (v6.92.6600, Gaming Mode) | |
| Lenovo Legion Pro 5 16IRX9 G9 (v6.92.6600) | |
| Schenker XMG Pro 16 Studio (Mid 24) (v6.92.6600) | |
| Acer Predator Helios Neo 16 (2024) (v6.92.6600) | |
| HP Victus 16 (2024) (v6.92.6600) | |
| Gigabyte G6X 9KG (2024) (v6.92.6600) | |
| Nubia RedMagic Titan 16 Pro (v6.92.6600) | |
| AIDA64 / CPU SHA3 | |
| Nubia RedMagic Titan 16 Pro (v6.92.6600, Gaming Mode) | |
| Genomsnitt Intel Core i9-14900HX (3589 - 7979, n=36) | |
| Genomsnitt av klass Gaming (1728 - 9817, n=133, senaste 2 åren) | |
| Schenker XMG Pro 16 Studio (Mid 24) (v6.92.6600) | |
| Lenovo Legion Pro 5 16IRX9 G9 (v6.92.6600) | |
| Acer Predator Helios Neo 16 (2024) (v6.92.6600) | |
| HP Victus 16 (2024) (v6.92.6600) | |
| Nubia RedMagic Titan 16 Pro (v6.92.6600) | |
| Gigabyte G6X 9KG (2024) (v6.92.6600) | |
| AIDA64 / CPU Queen | |
| Lenovo Legion Pro 5 16IRX9 G9 (v6.92.6600) | |
| Acer Predator Helios Neo 16 (2024) (v6.92.6600) | |
| Nubia RedMagic Titan 16 Pro (v6.92.6600, Gaming Mode) | |
| Genomsnitt Intel Core i9-14900HX (118405 - 148966, n=36) | |
| Schenker XMG Pro 16 Studio (Mid 24) (v6.92.6600) | |
| HP Victus 16 (2024) (v6.92.6600) | |
| Nubia RedMagic Titan 16 Pro (v6.92.6600) | |
| Genomsnitt av klass Gaming (49785 - 173351, n=133, senaste 2 åren) | |
| Gigabyte G6X 9KG (2024) (v6.92.6600) | |
| AIDA64 / FPU SinJulia | |
| Nubia RedMagic Titan 16 Pro (v6.92.6600, Gaming Mode) | |
| Genomsnitt Intel Core i9-14900HX (10475 - 18517, n=36) | |
| Lenovo Legion Pro 5 16IRX9 G9 (v6.92.6600) | |
| Genomsnitt av klass Gaming (4424 - 33636, n=133, senaste 2 åren) | |
| Schenker XMG Pro 16 Studio (Mid 24) (v6.92.6600) | |
| Acer Predator Helios Neo 16 (2024) (v6.92.6600) | |
| HP Victus 16 (2024) (v6.92.6600) | |
| Nubia RedMagic Titan 16 Pro (v6.92.6600) | |
| Gigabyte G6X 9KG (2024) (v6.92.6600) | |
| AIDA64 / FPU Mandel | |
| Genomsnitt av klass Gaming (17585 - 128721, n=133, senaste 2 åren) | |
| Genomsnitt Intel Core i9-14900HX (32543 - 83662, n=36) | |
| Nubia RedMagic Titan 16 Pro (v6.92.6600, Gaming Mode) | |
| Lenovo Legion Pro 5 16IRX9 G9 (v6.92.6600) | |
| Acer Predator Helios Neo 16 (2024) (v6.92.6600) | |
| Schenker XMG Pro 16 Studio (Mid 24) (v6.92.6600) | |
| HP Victus 16 (2024) (v6.92.6600) | |
| Gigabyte G6X 9KG (2024) (v6.92.6600) | |
| Nubia RedMagic Titan 16 Pro | |
| AIDA64 / CPU AES | |
| Nubia RedMagic Titan 16 Pro (v6.92.6600, Gaming Mode) | |
| Genomsnitt Intel Core i9-14900HX (86964 - 241777, n=36) | |
| Nubia RedMagic Titan 16 Pro (v6.92.6600) | |
| Lenovo Legion Pro 5 16IRX9 G9 (v6.92.6600) | |
| Genomsnitt av klass Gaming (19065 - 247074, n=133, senaste 2 åren) | |
| Schenker XMG Pro 16 Studio (Mid 24) (v6.92.6600) | |
| Acer Predator Helios Neo 16 (2024) (v6.92.6600) | |
| HP Victus 16 (2024) (v6.92.6600) | |
| Gigabyte G6X 9KG (2024) (v6.92.6600) | |
| AIDA64 / CPU ZLib | |
| Nubia RedMagic Titan 16 Pro (v6.92.6600, Gaming Mode) | |
| Genomsnitt Intel Core i9-14900HX (1054 - 2292, n=36) | |
| Lenovo Legion Pro 5 16IRX9 G9 (v6.92.6600) | |
| Schenker XMG Pro 16 Studio (Mid 24) (v6.92.6600) | |
| Genomsnitt av klass Gaming (373 - 2531, n=133, senaste 2 åren) | |
| Acer Predator Helios Neo 16 (2024) (v6.92.6600) | |
| HP Victus 16 (2024) (v6.92.6600) | |
| Gigabyte G6X 9KG (2024) (v6.92.6600) | |
| Nubia RedMagic Titan 16 Pro (v6.92.6600) | |
| AIDA64 / FP64 Ray-Trace | |
| Genomsnitt av klass Gaming (3856 - 45446, n=133, senaste 2 åren) | |
| Genomsnitt Intel Core i9-14900HX (6809 - 18349, n=36) | |
| Lenovo Legion Pro 5 16IRX9 G9 (v6.92.6600) | |
| Nubia RedMagic Titan 16 Pro (v6.92.6600, Gaming Mode) | |
| Schenker XMG Pro 16 Studio (Mid 24) (v6.92.6600) | |
| Acer Predator Helios Neo 16 (2024) (v6.92.6600) | |
| HP Victus 16 (2024) (v6.92.6600) | |
| Gigabyte G6X 9KG (2024) (v6.92.6600) | |
| Nubia RedMagic Titan 16 Pro (v6.92.6600) | |
| AIDA64 / CPU PhotoWorxx | |
| Lenovo Legion Pro 5 16IRX9 G9 (v6.92.6600) | |
| Schenker XMG Pro 16 Studio (Mid 24) (v6.92.6600) | |
| Genomsnitt Intel Core i9-14900HX (23903 - 54702, n=36) | |
| Acer Predator Helios Neo 16 (2024) (v6.92.6600) | |
| Genomsnitt av klass Gaming (10805 - 62916, n=133, senaste 2 åren) | |
| HP Victus 16 (2024) (v6.92.6600) | |
| Gigabyte G6X 9KG (2024) (v6.92.6600) | |
| Nubia RedMagic Titan 16 Pro (v6.92.6600) | |
| Nubia RedMagic Titan 16 Pro (v6.92.6600, Gaming Mode) | |
Systemets prestanda
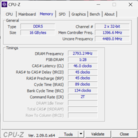
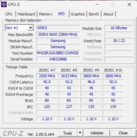
Det välfungerande systemet ger tillräckligt med kraft för krävande applikationer som spel, rendering och streaming. En del av datorkraften förblir dock oanvänd eftersom RAM-minnet (16 GB, DDR5-5600) endast körs i enkanaligt läge - den bärbara datorns låga minnesöverföringshastigheter jämfört med konkurrenterna bekräftar detta. Att installera en andra minnesmodul (= dual-channel mode aktivt) skulle kunna råda bot på detta.
CrossMark: Overall | Productivity | Creativity | Responsiveness
WebXPRT 3: Overall
WebXPRT 4: Overall
Mozilla Kraken 1.1: Total
| PCMark 10 / Score | |
| Acer Predator Helios Neo 16 (2024) | |
| Lenovo Legion Pro 5 16IRX9 G9 | |
| Schenker XMG Pro 16 Studio (Mid 24) | |
| Genomsnitt av klass Gaming (5776 - 10060, n=113, senaste 2 åren) | |
| Genomsnitt Intel Core i9-14900HX, NVIDIA GeForce RTX 4060 Laptop GPU (7830 - 8322, n=2) | |
| Nubia RedMagic Titan 16 Pro | |
| Gigabyte G6X 9KG (2024) | |
| HP Victus 16 (2024) | |
| PCMark 10 / Essentials | |
| Acer Predator Helios Neo 16 (2024) | |
| Genomsnitt Intel Core i9-14900HX, NVIDIA GeForce RTX 4060 Laptop GPU (11022 - 11413, n=2) | |
| Lenovo Legion Pro 5 16IRX9 G9 | |
| Nubia RedMagic Titan 16 Pro | |
| HP Victus 16 (2024) | |
| Schenker XMG Pro 16 Studio (Mid 24) | |
| Genomsnitt av klass Gaming (8810 - 12600, n=117, senaste 2 åren) | |
| Gigabyte G6X 9KG (2024) | |
| PCMark 10 / Productivity | |
| Schenker XMG Pro 16 Studio (Mid 24) | |
| Acer Predator Helios Neo 16 (2024) | |
| Gigabyte G6X 9KG (2024) | |
| Genomsnitt Intel Core i9-14900HX, NVIDIA GeForce RTX 4060 Laptop GPU (9776 - 10558, n=2) | |
| Genomsnitt av klass Gaming (6662 - 16716, n=115, senaste 2 åren) | |
| HP Victus 16 (2024) | |
| Lenovo Legion Pro 5 16IRX9 G9 | |
| Nubia RedMagic Titan 16 Pro | |
| PCMark 10 / Digital Content Creation | |
| Lenovo Legion Pro 5 16IRX9 G9 | |
| Genomsnitt av klass Gaming (7440 - 19351, n=115, senaste 2 åren) | |
| Acer Predator Helios Neo 16 (2024) | |
| Genomsnitt Intel Core i9-14900HX, NVIDIA GeForce RTX 4060 Laptop GPU (12091 - 12979, n=2) | |
| Schenker XMG Pro 16 Studio (Mid 24) | |
| Nubia RedMagic Titan 16 Pro | |
| Gigabyte G6X 9KG (2024) | |
| HP Victus 16 (2024) | |
| CrossMark / Overall | |
| Acer Predator Helios Neo 16 (2024) | |
| Genomsnitt Intel Core i9-14900HX, NVIDIA GeForce RTX 4060 Laptop GPU (2103 - 2184, n=2) | |
| Lenovo Legion Pro 5 16IRX9 G9 | |
| Nubia RedMagic Titan 16 Pro | |
| Schenker XMG Pro 16 Studio (Mid 24) | |
| Genomsnitt av klass Gaming (1247 - 2344, n=113, senaste 2 åren) | |
| Gigabyte G6X 9KG (2024) | |
| HP Victus 16 (2024) | |
| CrossMark / Productivity | |
| Acer Predator Helios Neo 16 (2024) | |
| Nubia RedMagic Titan 16 Pro | |
| Genomsnitt Intel Core i9-14900HX, NVIDIA GeForce RTX 4060 Laptop GPU (2040 - 2042, n=2) | |
| Lenovo Legion Pro 5 16IRX9 G9 | |
| Schenker XMG Pro 16 Studio (Mid 24) | |
| Gigabyte G6X 9KG (2024) | |
| Genomsnitt av klass Gaming (1299 - 2211, n=113, senaste 2 åren) | |
| HP Victus 16 (2024) | |
| CrossMark / Creativity | |
| Acer Predator Helios Neo 16 (2024) | |
| Lenovo Legion Pro 5 16IRX9 G9 | |
| Schenker XMG Pro 16 Studio (Mid 24) | |
| Genomsnitt Intel Core i9-14900HX, NVIDIA GeForce RTX 4060 Laptop GPU (2240 - 2472, n=2) | |
| Nubia RedMagic Titan 16 Pro | |
| Genomsnitt av klass Gaming (1275 - 2729, n=113, senaste 2 åren) | |
| HP Victus 16 (2024) | |
| Gigabyte G6X 9KG (2024) | |
| CrossMark / Responsiveness | |
| Acer Predator Helios Neo 16 (2024) | |
| Gigabyte G6X 9KG (2024) | |
| Nubia RedMagic Titan 16 Pro | |
| Lenovo Legion Pro 5 16IRX9 G9 | |
| Genomsnitt Intel Core i9-14900HX, NVIDIA GeForce RTX 4060 Laptop GPU (1849 - 1899, n=2) | |
| HP Victus 16 (2024) | |
| Schenker XMG Pro 16 Studio (Mid 24) | |
| Genomsnitt av klass Gaming (1030 - 2330, n=113, senaste 2 åren) | |
| WebXPRT 3 / Overall | |
| Genomsnitt Intel Core i9-14900HX, NVIDIA GeForce RTX 4060 Laptop GPU (329 - 339, n=2) | |
| Nubia RedMagic Titan 16 Pro | |
| Acer Predator Helios Neo 16 (2024) | |
| Schenker XMG Pro 16 Studio (Mid 24) | |
| Genomsnitt av klass Gaming (237 - 532, n=115, senaste 2 åren) | |
| Gigabyte G6X 9KG (2024) | |
| Lenovo Legion Pro 5 16IRX9 G9 | |
| HP Victus 16 (2024) | |
| WebXPRT 4 / Overall | |
| Genomsnitt Intel Core i9-14900HX, NVIDIA GeForce RTX 4060 Laptop GPU (309 - 319, n=2) | |
| Nubia RedMagic Titan 16 Pro | |
| Acer Predator Helios Neo 16 (2024) | |
| Schenker XMG Pro 16 Studio (Mid 24) | |
| Genomsnitt av klass Gaming (176.4 - 345, n=114, senaste 2 åren) | |
| Lenovo Legion Pro 5 16IRX9 G9 | |
| Gigabyte G6X 9KG (2024) | |
| HP Victus 16 (2024) | |
| Mozilla Kraken 1.1 / Total | |
| HP Victus 16 (2024) | |
| Gigabyte G6X 9KG (2024) | |
| Genomsnitt av klass Gaming (397 - 674, n=124, senaste 2 åren) | |
| Lenovo Legion Pro 5 16IRX9 G9 | |
| Schenker XMG Pro 16 Studio (Mid 24) | |
| Acer Predator Helios Neo 16 (2024) | |
| Nubia RedMagic Titan 16 Pro | |
| Genomsnitt Intel Core i9-14900HX, NVIDIA GeForce RTX 4060 Laptop GPU (430 - 439, n=2) | |
* ... mindre är bättre
| PCMark 10 Score | 7830 poäng | |
Hjälp | ||
| AIDA64 / Memory Copy | |
| Schenker XMG Pro 16 Studio (Mid 24) | |
| Lenovo Legion Pro 5 16IRX9 G9 | |
| Acer Predator Helios Neo 16 (2024) | |
| Genomsnitt Intel Core i9-14900HX (38028 - 83392, n=36) | |
| Genomsnitt av klass Gaming (21750 - 108104, n=133, senaste 2 åren) | |
| HP Victus 16 (2024) | |
| Gigabyte G6X 9KG (2024) | |
| Nubia RedMagic Titan 16 Pro | |
| AIDA64 / Memory Read | |
| Lenovo Legion Pro 5 16IRX9 G9 | |
| Schenker XMG Pro 16 Studio (Mid 24) | |
| Acer Predator Helios Neo 16 (2024) | |
| Genomsnitt Intel Core i9-14900HX (43306 - 87568, n=36) | |
| HP Victus 16 (2024) | |
| Genomsnitt av klass Gaming (22956 - 104349, n=133, senaste 2 åren) | |
| Gigabyte G6X 9KG (2024) | |
| Nubia RedMagic Titan 16 Pro | |
| AIDA64 / Memory Write | |
| Lenovo Legion Pro 5 16IRX9 G9 | |
| Schenker XMG Pro 16 Studio (Mid 24) | |
| Genomsnitt av klass Gaming (22297 - 133486, n=133, senaste 2 åren) | |
| Genomsnitt Intel Core i9-14900HX (37146 - 80589, n=36) | |
| Acer Predator Helios Neo 16 (2024) | |
| HP Victus 16 (2024) | |
| Gigabyte G6X 9KG (2024) | |
| Nubia RedMagic Titan 16 Pro | |
| AIDA64 / Memory Latency | |
| Genomsnitt av klass Gaming (59.5 - 259, n=133, senaste 2 åren) | |
| HP Victus 16 (2024) | |
| Acer Predator Helios Neo 16 (2024) | |
| Gigabyte G6X 9KG (2024) | |
| Genomsnitt Intel Core i9-14900HX (76.1 - 105, n=36) | |
| Schenker XMG Pro 16 Studio (Mid 24) | |
| Lenovo Legion Pro 5 16IRX9 G9 | |
| Nubia RedMagic Titan 16 Pro | |
* ... mindre är bättre
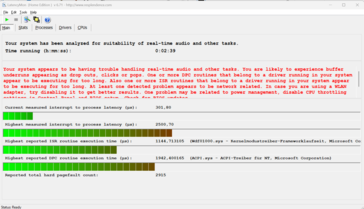
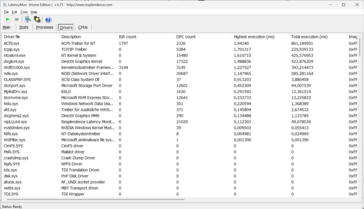
DPC-latenstider
| DPC Latencies / LatencyMon - interrupt to process latency (max), Web, Youtube, Prime95 | |
| Nubia RedMagic Titan 16 Pro | |
| Gigabyte G6X 9KG (2024) | |
| Schenker XMG Pro 16 Studio (Mid 24) | |
| Acer Predator Helios Neo 16 (2024) | |
| Lenovo Legion Pro 5 16IRX9 G9 | |
| HP Victus 16 (2024) | |
* ... mindre är bättre
Lagringsenheter
PCIe 4 SSD (M.2-2280) från Samsung erbjuder en lagringskapacitet på 1 TB och levererar mycket bra datahastigheter. Positivt: Vi observerade ingen termiskt inducerad strypning. Den bärbara datorn har plats för en andra PCIe 4 SSD.
* ... mindre är bättre
Reading continuous performance: DiskSpd Read Loop, Queue Depth 8
Grafikkort
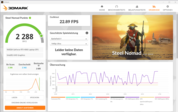
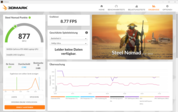
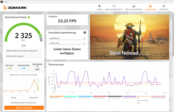
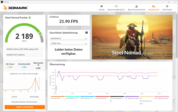
Den nya GeForce RTX 4060 (3 072 shaders, 128-bitars buss, 8 GB GDDR6) är för närvarande en spel-GPU i (lägre) mellanklassen. Nubia ger den en maximal TGP på 140 watt - mer är inte möjligt. Dess benchmarkresultat ligger något över genomsnittetför RTX-4060(balanserat läge). Spelläget resulterar inte i en ökning. Att växla mellan dGPU och Optimus kräver ingen omstart - avancerad Optimus stöds.
| 3DMark Performance rating - Percent | |
| Genomsnitt av klass Gaming | |
| Acer Predator Helios Neo 16 (2024) | |
| Schenker XMG Pro 16 Studio (Mid 24) | |
| Lenovo Legion Pro 5 16IRX9 G9 | |
| Nubia RedMagic Titan 16 Pro | |
| Nubia RedMagic Titan 16 Pro | |
| Gigabyte G6X 9KG (2024) | |
| HP Victus 16 (2024) | |
| Genomsnitt NVIDIA GeForce RTX 4060 Laptop GPU | |
| 3DMark 11 - 1280x720 Performance GPU | |
| Genomsnitt av klass Gaming (16033 - 80022, n=129, senaste 2 åren) | |
| Acer Predator Helios Neo 16 (2024) | |
| Schenker XMG Pro 16 Studio (Mid 24) | |
| Lenovo Legion Pro 5 16IRX9 G9 | |
| Nubia RedMagic Titan 16 Pro (Gaming Mode) | |
| Nubia RedMagic Titan 16 Pro | |
| Gigabyte G6X 9KG (2024) | |
| HP Victus 16 (2024) | |
| Genomsnitt NVIDIA GeForce RTX 4060 Laptop GPU (28136 - 38912, n=57) | |
| 3DMark | |
| 1920x1080 Fire Strike Graphics | |
| Genomsnitt av klass Gaming (12242 - 62849, n=143, senaste 2 åren) | |
| Acer Predator Helios Neo 16 (2024) | |
| Schenker XMG Pro 16 Studio (Mid 24) | |
| Lenovo Legion Pro 5 16IRX9 G9 | |
| Gigabyte G6X 9KG (2024) | |
| HP Victus 16 (2024) | |
| Nubia RedMagic Titan 16 Pro (Gaming Mode) | |
| Nubia RedMagic Titan 16 Pro | |
| Genomsnitt NVIDIA GeForce RTX 4060 Laptop GPU (20533 - 29656, n=54) | |
| 2560x1440 Time Spy Graphics | |
| Genomsnitt av klass Gaming (4310 - 25984, n=140, senaste 2 åren) | |
| Acer Predator Helios Neo 16 (2024) | |
| Schenker XMG Pro 16 Studio (Mid 24) | |
| Lenovo Legion Pro 5 16IRX9 G9 | |
| Nubia RedMagic Titan 16 Pro (Gaming Mode) | |
| Nubia RedMagic Titan 16 Pro | |
| Genomsnitt NVIDIA GeForce RTX 4060 Laptop GPU (7484 - 11451, n=56) | |
| HP Victus 16 (2024) | |
| Gigabyte G6X 9KG (2024) | |
| 3DMark 06 Standard Score | 55770 poäng | |
| 3DMark 11 Performance | 28427 poäng | |
| 3DMark Fire Strike Score | 22307 poäng | |
| 3DMark Time Spy Score | 10789 poäng | |
| 3DMark Steel Nomad Score | 2288 poäng | |
Hjälp | ||
| Geekbench 6.5 | |
| GPU OpenCL | |
| Genomsnitt av klass Gaming (42333 - 253130, n=130, senaste 2 åren) | |
| Acer Predator Helios Neo 16 (2024) (6.2.1) | |
| Schenker XMG Pro 16 Studio (Mid 24) (6.2.1) | |
| Nubia RedMagic Titan 16 Pro (6.2.1, Gaming Mode) | |
| Nubia RedMagic Titan 16 Pro (6.2.1) | |
| Gigabyte G6X 9KG (2024) (6.2.1) | |
| HP Victus 16 (2024) (6.2.1) | |
| Genomsnitt NVIDIA GeForce RTX 4060 Laptop GPU (76525 - 100831, n=39) | |
| Lenovo Legion Pro 5 16IRX9 G9 (6.2.1) | |
| GPU Vulkan | |
| Genomsnitt av klass Gaming (28528 - 231659, n=80, senaste 2 åren) | |
| Schenker XMG Pro 16 Studio (Mid 24) (6.2.1) | |
| Nubia RedMagic Titan 16 Pro (6.2.1, Gaming Mode) | |
| Gigabyte G6X 9KG (2024) (6.2.1) | |
| Acer Predator Helios Neo 16 (2024) (6.2.1) | |
| Genomsnitt NVIDIA GeForce RTX 4060 Laptop GPU (75631 - 101001, n=24) | |
| HP Victus 16 (2024) (6.2.1) | |
| Nubia RedMagic Titan 16 Pro (6.2.1) | |
| Lenovo Legion Pro 5 16IRX9 G9 (6.2.1) | |
| V-Ray Benchmark Next 4.10 | |
| GPU | |
| Genomsnitt av klass Gaming (54 - 1333, n=125, senaste 2 åren) | |
| Lenovo Legion Pro 5 16IRX9 G9 (v4.10.07 ) | |
| Acer Predator Helios Neo 16 (2024) (v4.10.07 ) | |
| Gigabyte G6X 9KG (2024) (v4.10.07 ) | |
| Nubia RedMagic Titan 16 Pro (v4.10.07 ) | |
| Nubia RedMagic Titan 16 Pro (v4.10.07, Gaming Mode ) | |
| Genomsnitt NVIDIA GeForce RTX 4060 Laptop GPU (483 - 715, n=46) | |
| HP Victus 16 (2024) (v4.10.07 ) | |
| Schenker XMG Pro 16 Studio (Mid 24) (v4.10.07 ) | |
| CPU | |
| Nubia RedMagic Titan 16 Pro (v4.10.07, Gaming Mode) | |
| Lenovo Legion Pro 5 16IRX9 G9 (v4.10.07 ) | |
| Schenker XMG Pro 16 Studio (Mid 24) (v4.10.07 ) | |
| Genomsnitt av klass Gaming (6122 - 45327, n=125, senaste 2 åren) | |
| Acer Predator Helios Neo 16 (2024) (v4.10.07 ) | |
| HP Victus 16 (2024) (v4.10.07 ) | |
| Genomsnitt NVIDIA GeForce RTX 4060 Laptop GPU (12680 - 32360, n=46) | |
| Gigabyte G6X 9KG (2024) (v4.10.07 ) | |
| Nubia RedMagic Titan 16 Pro (v4.10.07 ) | |
* ... mindre är bättre
Prestanda för spel
Titan är designat för QHD-spel med höga till maximala inställningar. Den installerade hårdvaran genererar bildfrekvensersom ligger något över genomsnittetför RTX 4060(balanserat läge). Gaming-läget resulterar i ett plus när du kör spel som drar nytta av högre CPU-prestanda - till exempel Dota 2 Reborn och X-Plane 11. Dess grafikprestanda är i övrigt identisk.
| Cyberpunk 2077 - 1920x1080 Ultra Preset (FSR off) | |
| Genomsnitt av klass Gaming (17.7 - 169.9, n=142, senaste 2 åren) | |
| Acer Predator Helios Neo 16 (2024) (2.02) | |
| Schenker XMG Pro 16 Studio (Mid 24) (2.12) | |
| Lenovo Legion Pro 5 16IRX9 G9 (2.12) | |
| Nubia RedMagic Titan 16 Pro (2.12, Gaming Mode) | |
| Nubia RedMagic Titan 16 Pro (2.12) | |
| Genomsnitt NVIDIA GeForce RTX 4060 Laptop GPU (56.4 - 93.1, n=31) | |
| Gigabyte G6X 9KG (2024) (2.02) | |
| HP Victus 16 (2024) (2.02) | |
| Final Fantasy XV Benchmark - 1920x1080 High Quality | |
| Genomsnitt av klass Gaming (37.9 - 215, n=125, senaste 2 åren) | |
| Acer Predator Helios Neo 16 (2024) (1.3) | |
| Schenker XMG Pro 16 Studio (Mid 24) (1.3) | |
| Lenovo Legion Pro 5 16IRX9 G9 (1.3) | |
| Nubia RedMagic Titan 16 Pro (1.3) | |
| Nubia RedMagic Titan 16 Pro (1.3, Gaming Mode ) | |
| Gigabyte G6X 9KG (2024) (1.3) | |
| HP Victus 16 (2024) (1.3) | |
| Genomsnitt NVIDIA GeForce RTX 4060 Laptop GPU (75.1 - 109.8, n=51) | |
| Strange Brigade - 1920x1080 ultra AA:ultra AF:16 | |
| Genomsnitt av klass Gaming (76.3 - 456, n=115, senaste 2 åren) | |
| Acer Predator Helios Neo 16 (2024) (1.47.22.14 D3D12) | |
| Schenker XMG Pro 16 Studio (Mid 24) (1.47.22.14 D3D12) | |
| Lenovo Legion Pro 5 16IRX9 G9 (1.47.22.14 D3D12) | |
| Nubia RedMagic Titan 16 Pro (1.47.22.14 D3D12, Gaming Mode ) | |
| Nubia RedMagic Titan 16 Pro (1.47.22.14 D3D12) | |
| Gigabyte G6X 9KG (2024) (1.47.22.14 D3D12) | |
| Genomsnitt NVIDIA GeForce RTX 4060 Laptop GPU (135.3 - 210, n=50) | |
| HP Victus 16 (2024) (1.47.22.14 D3D12) | |
| Dota 2 Reborn - 1920x1080 ultra (3/3) best looking | |
| Lenovo Legion Pro 5 16IRX9 G9 | |
| Acer Predator Helios Neo 16 (2024) | |
| Nubia RedMagic Titan 16 Pro (Gaming Mode) | |
| Schenker XMG Pro 16 Studio (Mid 24) | |
| Genomsnitt av klass Gaming (65.1 - 248, n=133, senaste 2 åren) | |
| HP Victus 16 (2024) | |
| Nubia RedMagic Titan 16 Pro | |
| Genomsnitt NVIDIA GeForce RTX 4060 Laptop GPU (115 - 183.8, n=53) | |
| Gigabyte G6X 9KG (2024) | |
| X-Plane 11.11 - 1920x1080 high (fps_test=3) | |
| Nubia RedMagic Titan 16 Pro (Gaming Mode) | |
| Lenovo Legion Pro 5 16IRX9 G9 | |
| Acer Predator Helios Neo 16 (2024) | |
| Schenker XMG Pro 16 Studio (Mid 24) | |
| Nubia RedMagic Titan 16 Pro | |
| Gigabyte G6X 9KG (2024) | |
| Genomsnitt av klass Gaming (33.4 - 150.2, n=136, senaste 2 åren) | |
| Genomsnitt NVIDIA GeForce RTX 4060 Laptop GPU (60.7 - 141.1, n=54) | |
| HP Victus 16 (2024) | |
| Once Human | |
| 1920x1080 Very High Preset | |
| Nubia RedMagic Titan 16 Pro | |
| Genomsnitt NVIDIA GeForce RTX 4060 Laptop GPU (88.7 - 94.2, n=2) | |
| Genomsnitt av klass Gaming (14.2 - 94.2, n=2, senaste 2 åren) | |
| 2560x1440 Very High Preset | |
| Nubia RedMagic Titan 16 Pro | |
| Genomsnitt av klass Gaming (n=1senaste 2 åren) | |
| Genomsnitt NVIDIA GeForce RTX 4060 Laptop GPU (59.1 - 62.3, n=2) | |
| 2560x1440 Very High Preset + Quality FSR | |
| Nubia RedMagic Titan 16 Pro | |
| Genomsnitt NVIDIA GeForce RTX 4060 Laptop GPU (n=1) | |
| Genomsnitt av klass Gaming (n=1senaste 2 åren) | |
| F1 24 | |
| 1920x1080 Ultra High Preset AA:T AF:16x | |
| Genomsnitt av klass Gaming (46.1 - 157.8, n=59, senaste 2 åren) | |
| Schenker XMG Pro 16 Studio (Mid 24) | |
| Lenovo Legion Pro 5 16IRX9 G9 | |
| Nubia RedMagic Titan 16 Pro | |
| Genomsnitt NVIDIA GeForce RTX 4060 Laptop GPU (47.5 - 61.6, n=10) | |
| 2560x1440 Ultra High Preset AA:T AF:16x | |
| Genomsnitt av klass Gaming (29.8 - 106.9, n=57, senaste 2 åren) | |
| Schenker XMG Pro 16 Studio (Mid 24) | |
| Nubia RedMagic Titan 16 Pro | |
| Genomsnitt NVIDIA GeForce RTX 4060 Laptop GPU (24.3 - 38.8, n=6) | |
| 2560x1440 Ultra High Preset + Quality DLSS AF:16x | |
| Genomsnitt av klass Gaming (14.3 - 159.3, n=45, senaste 2 åren) | |
| Schenker XMG Pro 16 Studio (Mid 24) | |
| Nubia RedMagic Titan 16 Pro | |
| Genomsnitt NVIDIA GeForce RTX 4060 Laptop GPU (48.6 - 61, n=3) | |
| Ghost of Tsushima | |
| 1920x1080 Very High Preset AA:T | |
| Schenker XMG Pro 16 Studio (Mid 24) | |
| Genomsnitt av klass Gaming (28.5 - 108.1, n=18, senaste 2 åren) | |
| Nubia RedMagic Titan 16 Pro | |
| Genomsnitt NVIDIA GeForce RTX 4060 Laptop GPU (55.6 - 63.4, n=5) | |
| 2560x1440 Very High Preset AA:T | |
| Schenker XMG Pro 16 Studio (Mid 24) | |
| Genomsnitt av klass Gaming (22.7 - 100.3, n=14, senaste 2 åren) | |
| Nubia RedMagic Titan 16 Pro | |
| Genomsnitt NVIDIA GeForce RTX 4060 Laptop GPU (41.1 - 47.7, n=3) | |
| 2560x1440 Very High Preset + Quality DLSS | |
| Schenker XMG Pro 16 Studio (Mid 24) | |
| Genomsnitt av klass Gaming (55.2 - 105.2, n=11, senaste 2 åren) | |
| Nubia RedMagic Titan 16 Pro | |
| Genomsnitt NVIDIA GeForce RTX 4060 Laptop GPU (n=1) | |
| The First Descendant | |
| 1920x1080 Ultra Preset | |
| Schenker XMG Pro 16 Studio (Mid 24) | |
| Nubia RedMagic Titan 16 Pro | |
| Genomsnitt NVIDIA GeForce RTX 4060 Laptop GPU (67.6 - 69.4, n=3) | |
| Genomsnitt av klass Gaming (15.4 - 80, n=5, senaste 2 åren) | |
| 2560x1440 Ultra Preset | |
| Schenker XMG Pro 16 Studio (Mid 24) | |
| Genomsnitt av klass Gaming (43.7 - 51.2, n=3, senaste 2 åren) | |
| Nubia RedMagic Titan 16 Pro | |
| Genomsnitt NVIDIA GeForce RTX 4060 Laptop GPU (43.5 - 43.7, n=2) | |
| 2560x1440 Ultra Preset + Ultra Ray Tracing + DLSS Quality | |
| Schenker XMG Pro 16 Studio (Mid 24) | |
| Genomsnitt av klass Gaming (43.3 - 51.8, n=2, senaste 2 åren) | |
| Nubia RedMagic Titan 16 Pro | |
| Genomsnitt NVIDIA GeForce RTX 4060 Laptop GPU (n=1) | |
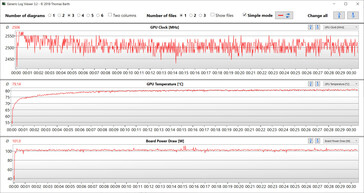
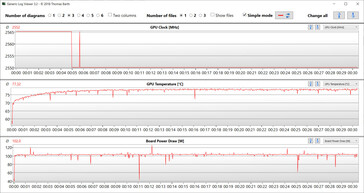
Cyberpunk 2077 Phantom Liberty levererade något fluktuerande bildfrekvenser på en ganska stabil nivå under vårt 30-minuterstest (max. inställningar, FHD). Vi noterade ingen märkbar nedgång i prestanda.
Cyberpunk 2077 ultra FPS diagram
| låg | med. | hög | ultra | QHD DLSS | QHD FSR | QHD | |
|---|---|---|---|---|---|---|---|
| GTA V (2015) | 186.1 | 184 | 177.7 | 118.4 | 89.3 | ||
| Dota 2 Reborn (2015) | 206 | 170.9 | 160.2 | 146.9 | |||
| Final Fantasy XV Benchmark (2018) | 199.7 | 146 | 105.4 | 76.9 | |||
| X-Plane 11.11 (2018) | 167 | 142.8 | 117.2 | ||||
| Strange Brigade (2018) | 480 | 277 | 219 | 189.2 | 126.9 | ||
| Baldur's Gate 3 (2023) | 140.3 | 110.8 | 97.5 | 96.5 | 65.9 | ||
| Cyberpunk 2077 (2023) | 121.4 | 101.1 | 86.2 | 74.7 | 46.9 | ||
| Dragon's Dogma 2 (2024) | 71.9 | 67.7 | 52.9 | ||||
| Ghost of Tsushima (2024) | 91.3 | 86.8 | 78.2 | 63.4 | 63.6 | 47.7 | |
| F1 24 (2024) | 243 | 225 | 175.8 | 58.8 | 59.2 | 36.7 | |
| The First Descendant (2024) | 159 | 100.9 | 80.6 | 69.4 | 43.7 | ||
| Once Human (2024) | 164.8 | 132.9 | 108.3 | 94.2 | 76.5 | 62.3 |
Utsläpp - För högt, för varmt
Bullerutsläpp
Titan är inte på något sätt en tystgående bärbar dator. Även i viloläge är de två fläktarna ständigt hörbara. Cyberpunk fick nivån att stiga till högljudda 50 dB(A)(balanserat läge) eller ännu mer högljudda 53 dB(A)(spelläge). Kontorsläget resulterade i ett bara något mer måttligt värde på 47 dB(A). Fläktarna är tystare i batteriläge och står ibland stilla.
Ljudnivå
| Låg belastning |
| 35 / 36 / 40 dB(A) |
| Hög belastning |
| 49 / 52 dB(A) |
 | ||
30 dB tyst 40 dB(A) hörbar 50 dB(A) högt ljud |
||
min: | ||
| Nubia RedMagic Titan 16 Pro GeForce RTX 4060 Laptop GPU, i9-14900HX, Samsung PM9A1 MZVL21T0HCLR | Lenovo Legion Pro 5 16IRX9 G9 GeForce RTX 4060 Laptop GPU, i7-14700HX, Samsung PM9A1 MZVL21T0HCLR | HP Victus 16 (2024) GeForce RTX 4060 Laptop GPU, i7-14700HX, Kioxia XG8 KXG80ZNV512G | Acer Predator Helios Neo 16 (2024) GeForce RTX 4070 Laptop GPU, i7-14700HX, Samsung PM9A1a MZVL21T0HDLU | Schenker XMG Pro 16 Studio (Mid 24) GeForce RTX 4070 Laptop GPU, i9-14900HX, Samsung 990 Pro 1 TB | Gigabyte G6X 9KG (2024) GeForce RTX 4060 Laptop GPU, i7-13650HX, Gigabyte AG450E1024-SI | |
|---|---|---|---|---|---|---|
| Noise | 17% | 13% | 10% | 5% | 5% | |
| av / miljö * (dB) | 26 | 23 12% | 25 4% | 25.2 3% | 25 4% | 26 -0% |
| Idle Minimum * (dB) | 35 | 23 34% | 28 20% | 27.8 21% | 28 20% | 30 14% |
| Idle Average * (dB) | 36 | 23 36% | 29 19% | 32 11% | 31 14% | 32 11% |
| Idle Maximum * (dB) | 40 | 25 37% | 33 17% | 29.6 26% | 35 12% | 35 12% |
| Load Average * (dB) | 49 | 45.18 8% | 45 8% | 45.2 8% | 52 -6% | 51 -4% |
| Cyberpunk 2077 ultra * (dB) | 50 | 52.69 -5% | 53 -6% | |||
| Load Maximum * (dB) | 52 | 53.13 -2% | 48 8% | 55.8 -7% | 52 -0% | 54 -4% |
| Witcher 3 ultra * (dB) | 43 | 51 |
* ... mindre är bättre
Temperatur
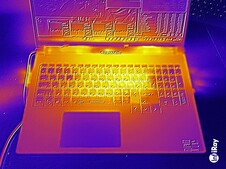
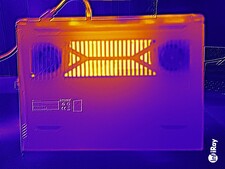
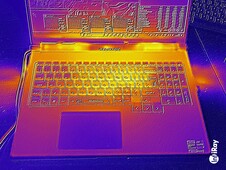
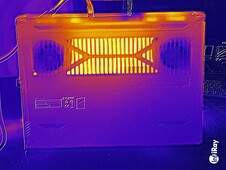
Den bärbara datorn värms upp avsevärt under belastning: Cyberpunk 2077 och stresstestet orsakade temperaturer på över 50 grader Celsius vid vissa tillfällen. Handledsstödets temperaturer var ibland nästan för varma. Vi noterade också värden över genomsnittet i viloläge.
(-) Den maximala temperaturen på ovansidan är 50 °C / 122 F, jämfört med genomsnittet av 40.4 °C / 105 F , allt från 21.2 till 68.8 °C för klassen Gaming.
(-) Botten värms upp till maximalt 58 °C / 136 F, jämfört med genomsnittet av 43.3 °C / 110 F
(+) Vid tomgångsbruk är medeltemperaturen för ovansidan 30.4 °C / 87 F, jämfört med enhetsgenomsnittet på 33.9 °C / ### class_avg_f### F.
(-) 3: The average temperature for the upper side is 45.1 °C / 113 F, compared to the average of 33.9 °C / 93 F for the class Gaming.
(-) Handledsstöden och pekplattan kan bli väldigt varma vid beröring med maximalt 40 °C / 104 F.
(-) Medeltemperaturen för handledsstödsområdet på liknande enheter var 28.8 °C / 83.8 F (-11.2 °C / -20.2 F).
| Nubia RedMagic Titan 16 Pro Intel Core i9-14900HX, NVIDIA GeForce RTX 4060 Laptop GPU | Lenovo Legion Pro 5 16IRX9 G9 Intel Core i7-14700HX, NVIDIA GeForce RTX 4060 Laptop GPU | HP Victus 16 (2024) Intel Core i7-14700HX, NVIDIA GeForce RTX 4060 Laptop GPU | Acer Predator Helios Neo 16 (2024) Intel Core i7-14700HX, NVIDIA GeForce RTX 4070 Laptop GPU | Schenker XMG Pro 16 Studio (Mid 24) Intel Core i9-14900HX, NVIDIA GeForce RTX 4070 Laptop GPU | Gigabyte G6X 9KG (2024) Intel Core i7-13650HX, NVIDIA GeForce RTX 4060 Laptop GPU | |
|---|---|---|---|---|---|---|
| Heat | -9% | 13% | -3% | -13% | 6% | |
| Maximum Upper Side * (°C) | 50 | 50 -0% | 50 -0% | 58 -16% | 51 -2% | 41 18% |
| Maximum Bottom * (°C) | 58 | 57 2% | 50 14% | 45.2 22% | 66 -14% | 43 26% |
| Idle Upper Side * (°C) | 31 | 36 -16% | 25 19% | 31.1 -0% | 35 -13% | 32 -3% |
| Idle Bottom * (°C) | 32 | 39 -22% | 26 19% | 37.2 -16% | 39 -22% | 37 -16% |
* ... mindre är bättre
Stresstest
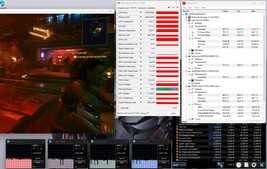
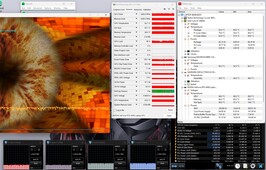
Det extrema stresstestscenariot (Prime95 och Furmark i kontinuerlig drift) kontrollerade systemets stabilitet under full belastning. CPU:n arbetade med höga klockfrekvenser i början av testet, men stryptes sedan till värden under 2 GHz. GPU:n arbetade med full effekt.
Högtalare
Stereohögtalarna ger ett ganska hyfsat ljud överlag. Basen skulle kunna vara lite mer uttalad.
Nubia RedMagic Titan 16 Pro ljudanalys
(+) | högtalare kan spela relativt högt (84 dB)
Bas 100 - 315 Hz
(±) | reducerad bas - i genomsnitt 14.3% lägre än medianen
(±) | linjäriteten för basen är genomsnittlig (11.3% delta till föregående frekvens)
Mellan 400 - 2000 Hz
(+) | balanserad mellan - endast 1.8% från medianen
(+) | mids är linjära (4.9% delta till föregående frekvens)
Högsta 2 - 16 kHz
(+) | balanserade toppar - endast 2.7% från medianen
(+) | toppar är linjära (5.4% delta till föregående frekvens)
Totalt 100 - 16 000 Hz
(+) | det totala ljudet är linjärt (11.5% skillnad mot median)
Jämfört med samma klass
» 10% av alla testade enheter i den här klassen var bättre, 3% liknande, 87% sämre
» Den bästa hade ett delta på 6%, genomsnittet var 18%, sämst var 132%
Jämfört med alla testade enheter
» 7% av alla testade enheter var bättre, 2% liknande, 91% sämre
» Den bästa hade ett delta på 4%, genomsnittet var 24%, sämst var 134%
Lenovo Legion Pro 5 16IRX9 G9 ljudanalys
(±) | högtalarljudstyrkan är genomsnittlig men bra (77.13 dB)
Bas 100 - 315 Hz
(-) | nästan ingen bas - i genomsnitt 18.3% lägre än medianen
(±) | linjäriteten för basen är genomsnittlig (12% delta till föregående frekvens)
Mellan 400 - 2000 Hz
(±) | högre mellan - i genomsnitt 6.9% högre än median
(+) | mids är linjära (4.9% delta till föregående frekvens)
Högsta 2 - 16 kHz
(+) | balanserade toppar - endast 4.5% från medianen
(±) | linjäriteten för toppar är genomsnittlig (9.5% delta till föregående frekvens)
Totalt 100 - 16 000 Hz
(±) | linjäriteten för det totala ljudet är genomsnittlig (21.6% skillnad mot median)
Jämfört med samma klass
» 77% av alla testade enheter i den här klassen var bättre, 5% liknande, 18% sämre
» Den bästa hade ett delta på 6%, genomsnittet var 18%, sämst var 132%
Jämfört med alla testade enheter
» 61% av alla testade enheter var bättre, 7% liknande, 32% sämre
» Den bästa hade ett delta på 4%, genomsnittet var 24%, sämst var 134%
Energihantering - Titan 16 ger medelmåttiga drifttider
Strömförbrukning
Dess strömförbrukning är normal för den installerade hårdvaran. Cyberpunk 2077 och stresstestet kördes med konstant strömförbrukning. Strömförsörjningen (280 watt) är tillräcklig i storlek.
| Av/Standby | |
| Låg belastning | |
| Hög belastning |
|
Förklaring:
min: | |
| Nubia RedMagic Titan 16 Pro i9-14900HX, GeForce RTX 4060 Laptop GPU | Lenovo Legion Pro 5 16IRX9 G9 i7-14700HX, GeForce RTX 4060 Laptop GPU | HP Victus 16 (2024) i7-14700HX, GeForce RTX 4060 Laptop GPU | Acer Predator Helios Neo 16 (2024) i7-14700HX, GeForce RTX 4070 Laptop GPU | Schenker XMG Pro 16 Studio (Mid 24) i9-14900HX, GeForce RTX 4070 Laptop GPU | Gigabyte G6X 9KG (2024) i7-13650HX, GeForce RTX 4060 Laptop GPU | Genomsnitt NVIDIA GeForce RTX 4060 Laptop GPU | Genomsnitt av klass Gaming | |
|---|---|---|---|---|---|---|---|---|
| Power Consumption | -4% | 16% | -23% | -35% | 17% | 21% | 4% | |
| Idle Minimum * (Watt) | 16 | 13.7 14% | 9 44% | 26.7 -67% | 31 -94% | 12 25% | 11.5 ? 28% | 13.8 ? 14% |
| Idle Average * (Watt) | 19 | 17.7 7% | 15 21% | 24.4 -28% | 33 -74% | 13 32% | 16 ? 16% | 19.5 ? -3% |
| Idle Maximum * (Watt) | 27 | 18.5 31% | 23 15% | 32.7 -21% | 41 -52% | 27 -0% | 20.3 ? 25% | 25.5 ? 6% |
| Load Average * (Watt) | 123 | 124 -1% | 123 -0% | 122.1 1% | 114 7% | 105 15% | 92.9 ? 24% | 110.6 ? 10% |
| Cyberpunk 2077 ultra external monitor * (Watt) | 174.2 | 224 -29% | 196.8 -13% | |||||
| Cyberpunk 2077 ultra * (Watt) | 184.3 | 229 -24% | 218 -18% | |||||
| Load Maximum * (Watt) | 240 | 297 -24% | 241 -0% | 241 -0% | 250 -4% | 210 12% | 210 ? 12% | 257 ? -7% |
| Witcher 3 ultra * (Watt) | 143.7 | 190.6 | 167.8 |
* ... mindre är bättre
Power consumption Cyberpunk / stress test
Power consumption with external monitor
Körtider
16-tumsenheten uppnådde körtider på 4:40 timmar under WiFi-testet (åtkomst till webbplatser med hjälp av ett skript) och 5:16 timmar under videotestet (kortfilmen Big Buck Bunny (H.264-kodning, FHD) i en loop) - inga fantastiska värden. Några av konkurrenterna kör betydligt längre.
| Nubia RedMagic Titan 16 Pro i9-14900HX, GeForce RTX 4060 Laptop GPU, 80.1 Wh | Lenovo Legion Pro 5 16IRX9 G9 i7-14700HX, GeForce RTX 4060 Laptop GPU, 80 Wh | HP Victus 16 (2024) i7-14700HX, GeForce RTX 4060 Laptop GPU, 83 Wh | Acer Predator Helios Neo 16 (2024) i7-14700HX, GeForce RTX 4070 Laptop GPU, 90.61 Wh | Schenker XMG Pro 16 Studio (Mid 24) i9-14900HX, GeForce RTX 4070 Laptop GPU, 73 Wh | Gigabyte G6X 9KG (2024) i7-13650HX, GeForce RTX 4060 Laptop GPU, 73 Wh | Genomsnitt av klass Gaming | |
|---|---|---|---|---|---|---|---|
| Batteridrifttid | 15% | 81% | -18% | 19% | 68% | 30% | |
| Reader / Idle (h) | 8 | 5.9 -26% | 9.06 ? 13% | ||||
| H.264 (h) | 5.3 | 5.2 -2% | 4 -25% | 7.93 ? 50% | |||
| WiFi v1.3 (h) | 4.7 | 5.1 9% | 8.5 81% | 3.8 -19% | 5.6 19% | 7.9 68% | 6.67 ? 42% |
| Load (h) | 1.3 | 1.8 38% | 1.3 0% | 1.483 ? 14% |
För
Emot
Utlåtande - Utrymme för förbättringar
A Core i9-14900HX och en GeForce RTX 4060 säkerställer QHD-spel vid höga till maximala inställningar. Den installerade hårdvaran används inte till sin fulla potential, eftersom RAM-minnet körs i enkanaligt läge. Det rekommenderas att en andra minnesmodul installeras.
Nubias debutprodukt gör vad den är utformad för att göra: Att få upp spel på skärmen på ett smidigt sätt. Men konkurrenterna behöver inte precis någon anledning att vara rädda.
Dess utsläppsvärden är extremt nedslående: Den bärbara datorn producerar (för) mycket buller över hela belastningsområdet - och den värms dessutom upp mycket. Den ljusa IPS-skärmen (16 tum, 2 560 x 1 600 pixlar, 240 Hz, G-Sync, DCI-P3) med äkta färger och ett arbetsvänligt bildförhållande på 16:10 gjorde däremot ett gott intryck på oss.
Den bärbara datorns batteritid kommer inte att få någon att tappa hakan. Man kan förvänta sig (något) mer av en bärbar speldator med ett 80 Wh-batteri. Åtminstone stöder den installerade USB-C-porten (Thunderbolt 4) Power Delivery (och DP Alt-läge). Detta innebär att du inte nödvändigtvis alltid behöver bära med dig den skrymmande egenutvecklade strömförsörjningen.
Ett faktum som du bör tänka på innan du köper enheten: I motsats till etablerade tillverkare som Acer, Lenovo eller HP har Nubia inte riktigt någon global närvaro. Därför är det inte möjligt att uppskatta hur situationen kommer att se ut när det gäller reservdelsförsörjning, support och reparationer.
Priset på 1 699 USD talar verkligen inte till den bärbara datorns fördel: Till exempel, en nästan identisk konfiguration av Acer Predator Helios Neo 16 (med undantag för RAM-minnet som är 32 GB istället för 16 GB) kostar för närvarande endast 1 350 USD. Ett annat alternativ skulle kunna vara XMG Pro 16 Studio (Mid 24). Priset för en jämförbar version av denna enhet är ca 2.000 US-dollar (med Windows 11) eller 1.950 US-dollar (utan Windows som operativsystem).
Pris och tillgänglighet
Nubia RedMagic Titan 16 Pro finns tillgänglig från och med 2024-08-29 och kan köpas för 1 699 USD via RedMagic-butiken på https://eu.redmagic.gg/de/pages/redmagic-titan-16-pro-launch.
Observera: Vi har nyligen uppdaterat vårt betygssystem och resultaten från version 8 är inte jämförbara med resultaten från version 7. Mer information finns tillgänglig på här.
Nubia RedMagic Titan 16 Pro
- 08/21/2024 v8
Sascha Mölck
Genomskinlighet
Valet av enheter som ska granskas görs av vår redaktion. Testprovet gavs till författaren som ett lån av tillverkaren eller återförsäljaren för denna recension. Långivaren hade inget inflytande på denna recension och inte heller fick tillverkaren en kopia av denna recension innan publiceringen. Det fanns ingen skyldighet att publicera denna recension. Som ett oberoende medieföretag är Notebookcheck inte föremål för auktoritet från tillverkare, återförsäljare eller förlag.
This is how Notebookcheck is testingEvery year, Notebookcheck independently reviews hundreds of laptops and smartphones using standardized procedures to ensure that all results are comparable. We have continuously developed our test methods for around 20 years and set industry standards in the process. In our test labs, high-quality measuring equipment is utilized by experienced technicians and editors. These tests involve a multi-stage validation process. Our complex rating system is based on hundreds of well-founded measurements and benchmarks, which maintains objectivity.













 Total Sustainability Score:
