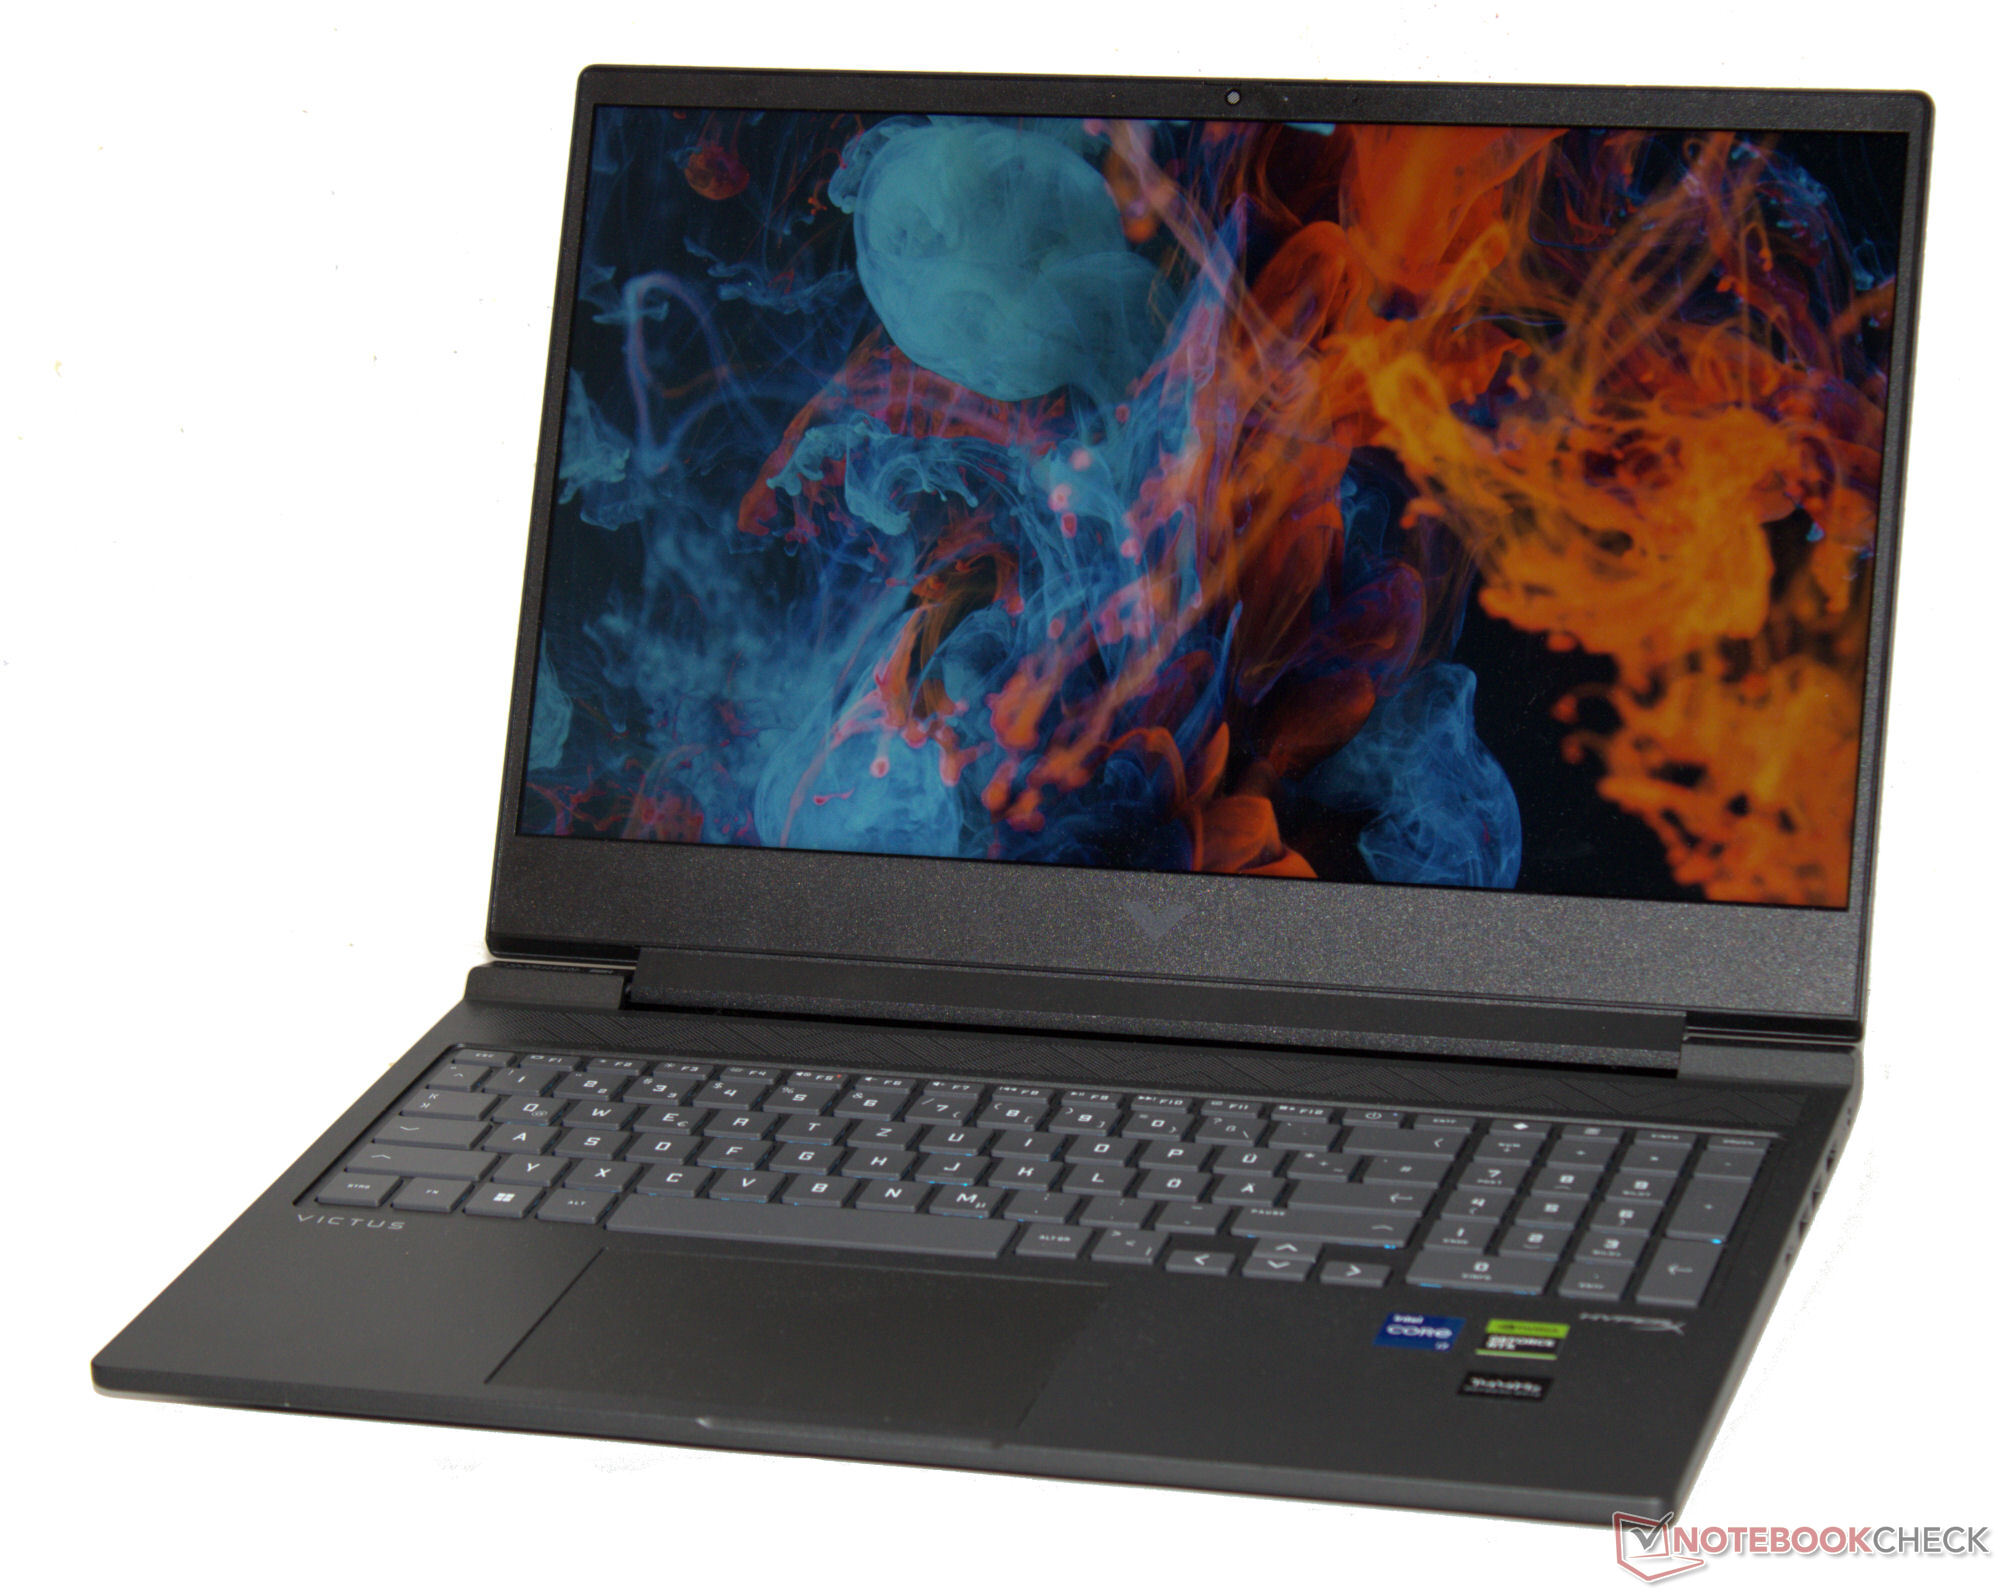
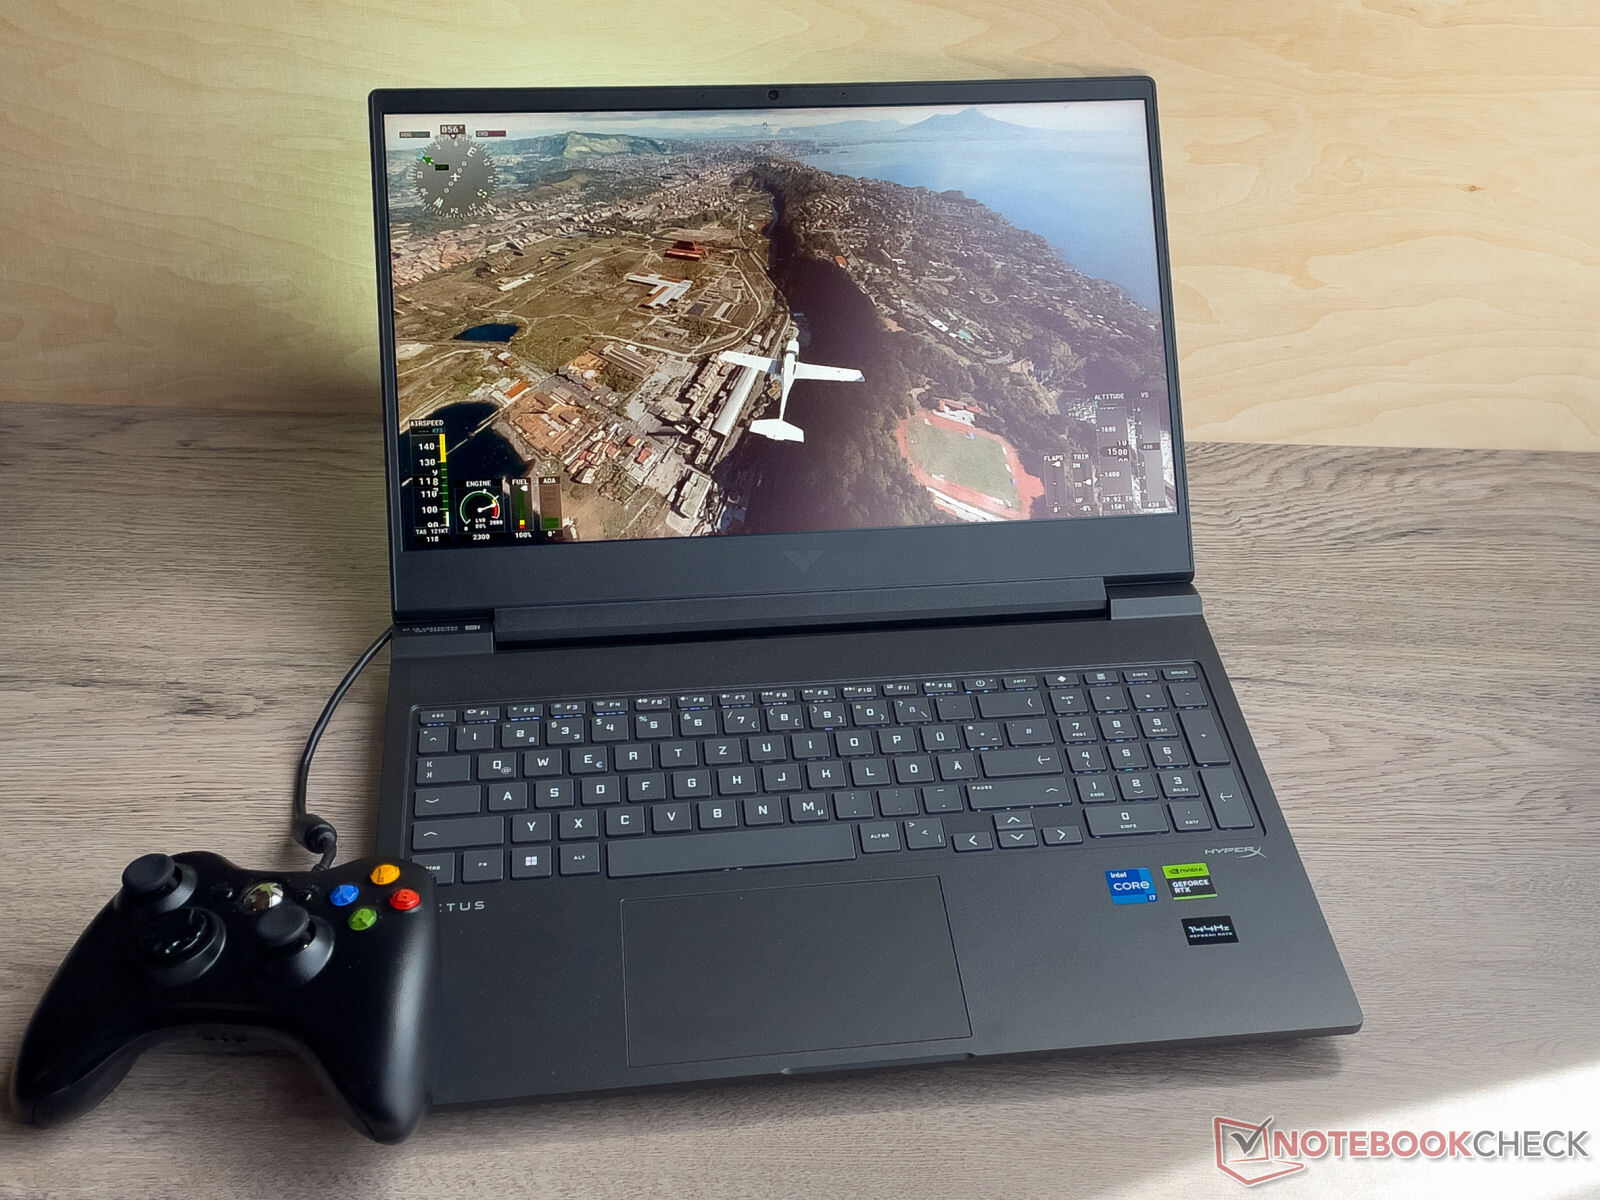
Recension av HP Victus 16 (2024) bärbar dator: RTX 4060-kraft i kombination med långa driftstider

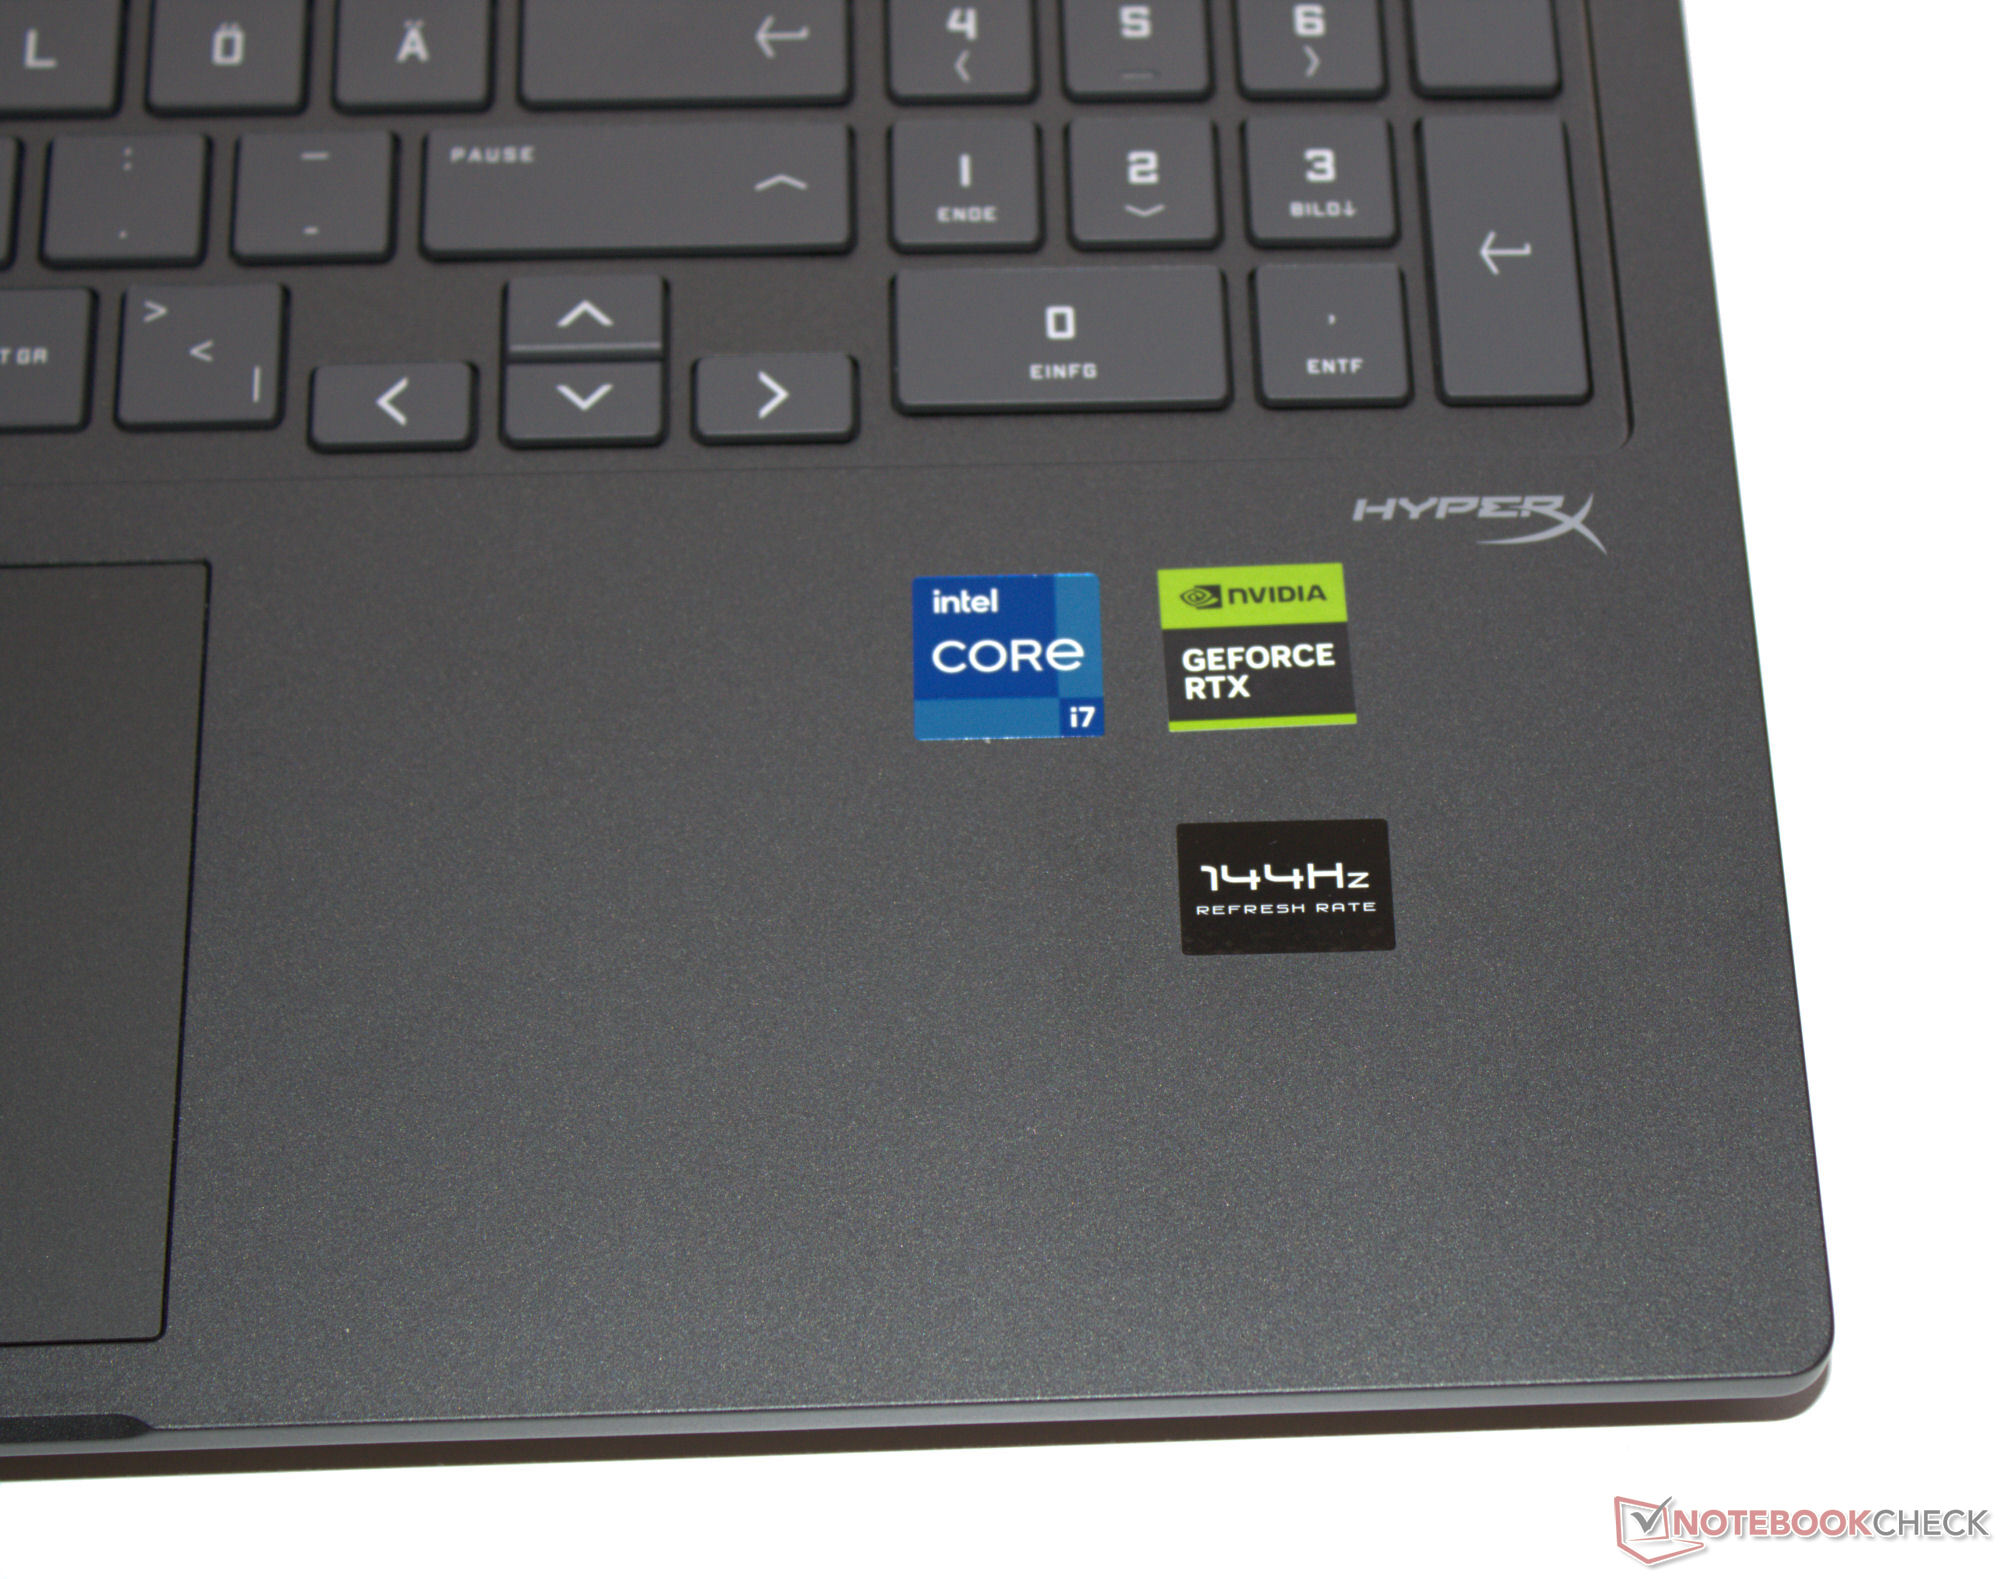
HP:s Victus-serie består av bärbara speldatorer i mellan- och nybörjarsegmentet - den här testenheten kan klassas som den senare: En Raptor Lake-processor, GeForce RTX 406016 GB RAM och en 512 GB SSD bidrar alla till ett totalt paket som kostar cirka 1 600 USD. Konkurrenter inkluderar enheter som Gigabyte G6X 9KG (2024), Dell G16, Asus TUF Gaming A16 FA617XS och Lenovo Legion 5 16IRX G9.
2024-versionen av Victus 16 är byggd identiskt med 2023-modellen. Vi har redan testat två inkarnationer av den senare (RTX 4050 och RTX 4070).
Potentiella konkurrenter i jämförelse
Gradering | Datum | Modell | Vikt | Höjd | Storlek | Upplösning | Pris |
|---|---|---|---|---|---|---|---|
| 84.3 % v7 (old) | 05/2024 | HP Victus 16 (2024) i7-14700HX, GeForce RTX 4060 Laptop GPU | 2.4 kg | 23.9 mm | 16.10" | 1920x1080 | |
| 83.2 % v7 (old) | 03/2024 | Gigabyte G6X 9KG (2024) i7-13650HX, GeForce RTX 4060 Laptop GPU | 2.6 kg | 25.1 mm | 16.00" | 1920x1200 | |
| 85.5 % v7 (old) | 02/2024 | Dell G16, i7-13650HX, RTX 4060 i7-13650HX, GeForce RTX 4060 Laptop GPU | 2.8 kg | 25.65 mm | 16.00" | 2560x1600 | |
| 89.1 % v7 (old) | 02/2024 | Lenovo Legion 5 16IRX G9 i7-14650HX, GeForce RTX 4060 Laptop GPU | 2.4 kg | 25.2 mm | 16.00" | 2560x1600 | |
| 86.9 % v7 (old) | 06/2023 | Asus TUF Gaming A16 FA617XS R9 7940HS, Radeon RX 7600S | 2.2 kg | 22.1 mm | 16.00" | 1920x1200 |
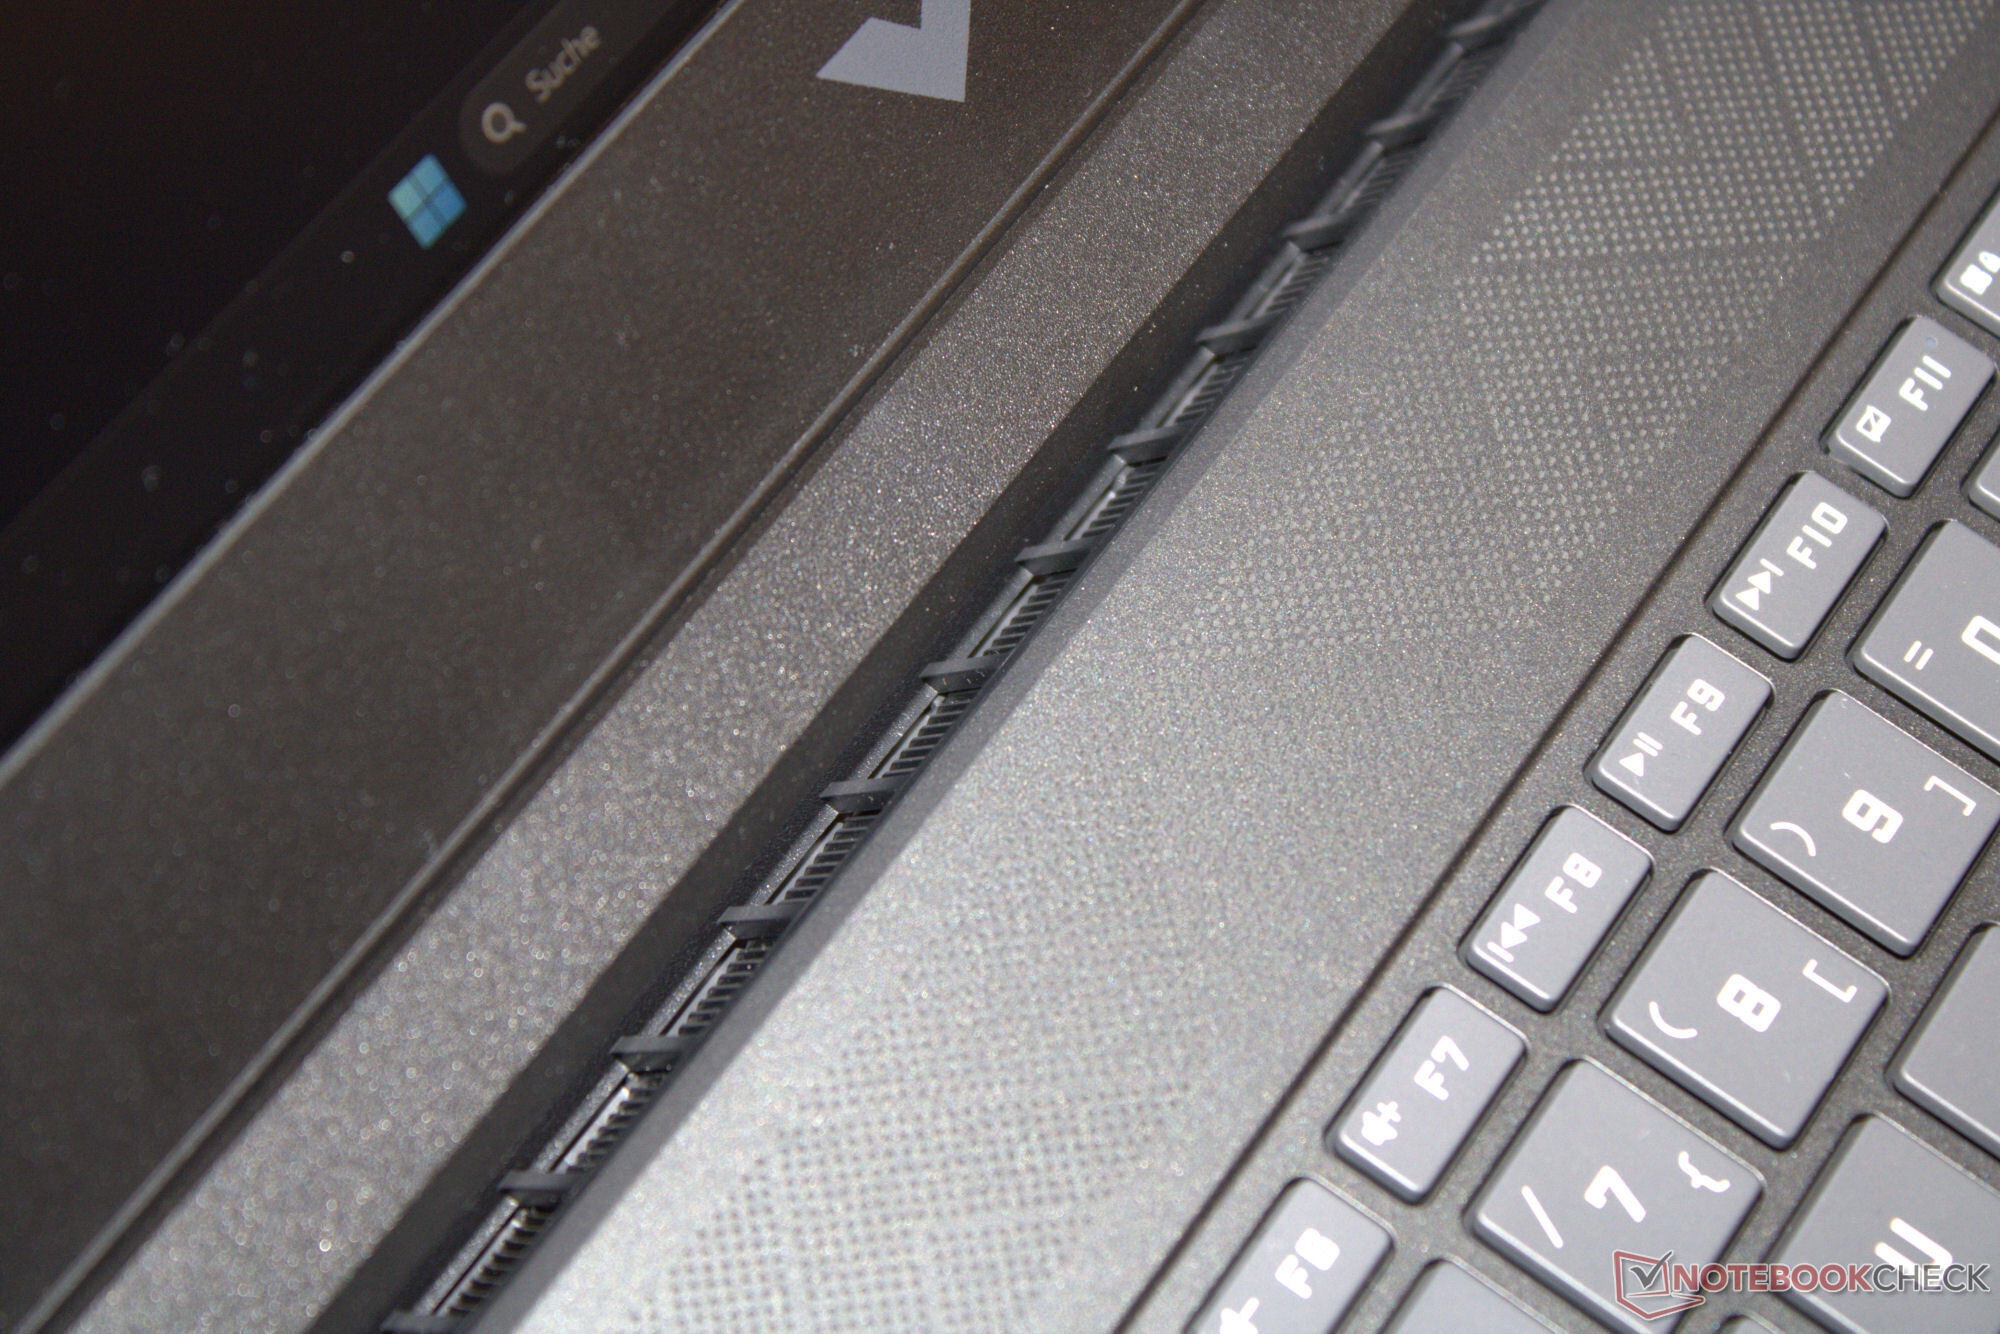
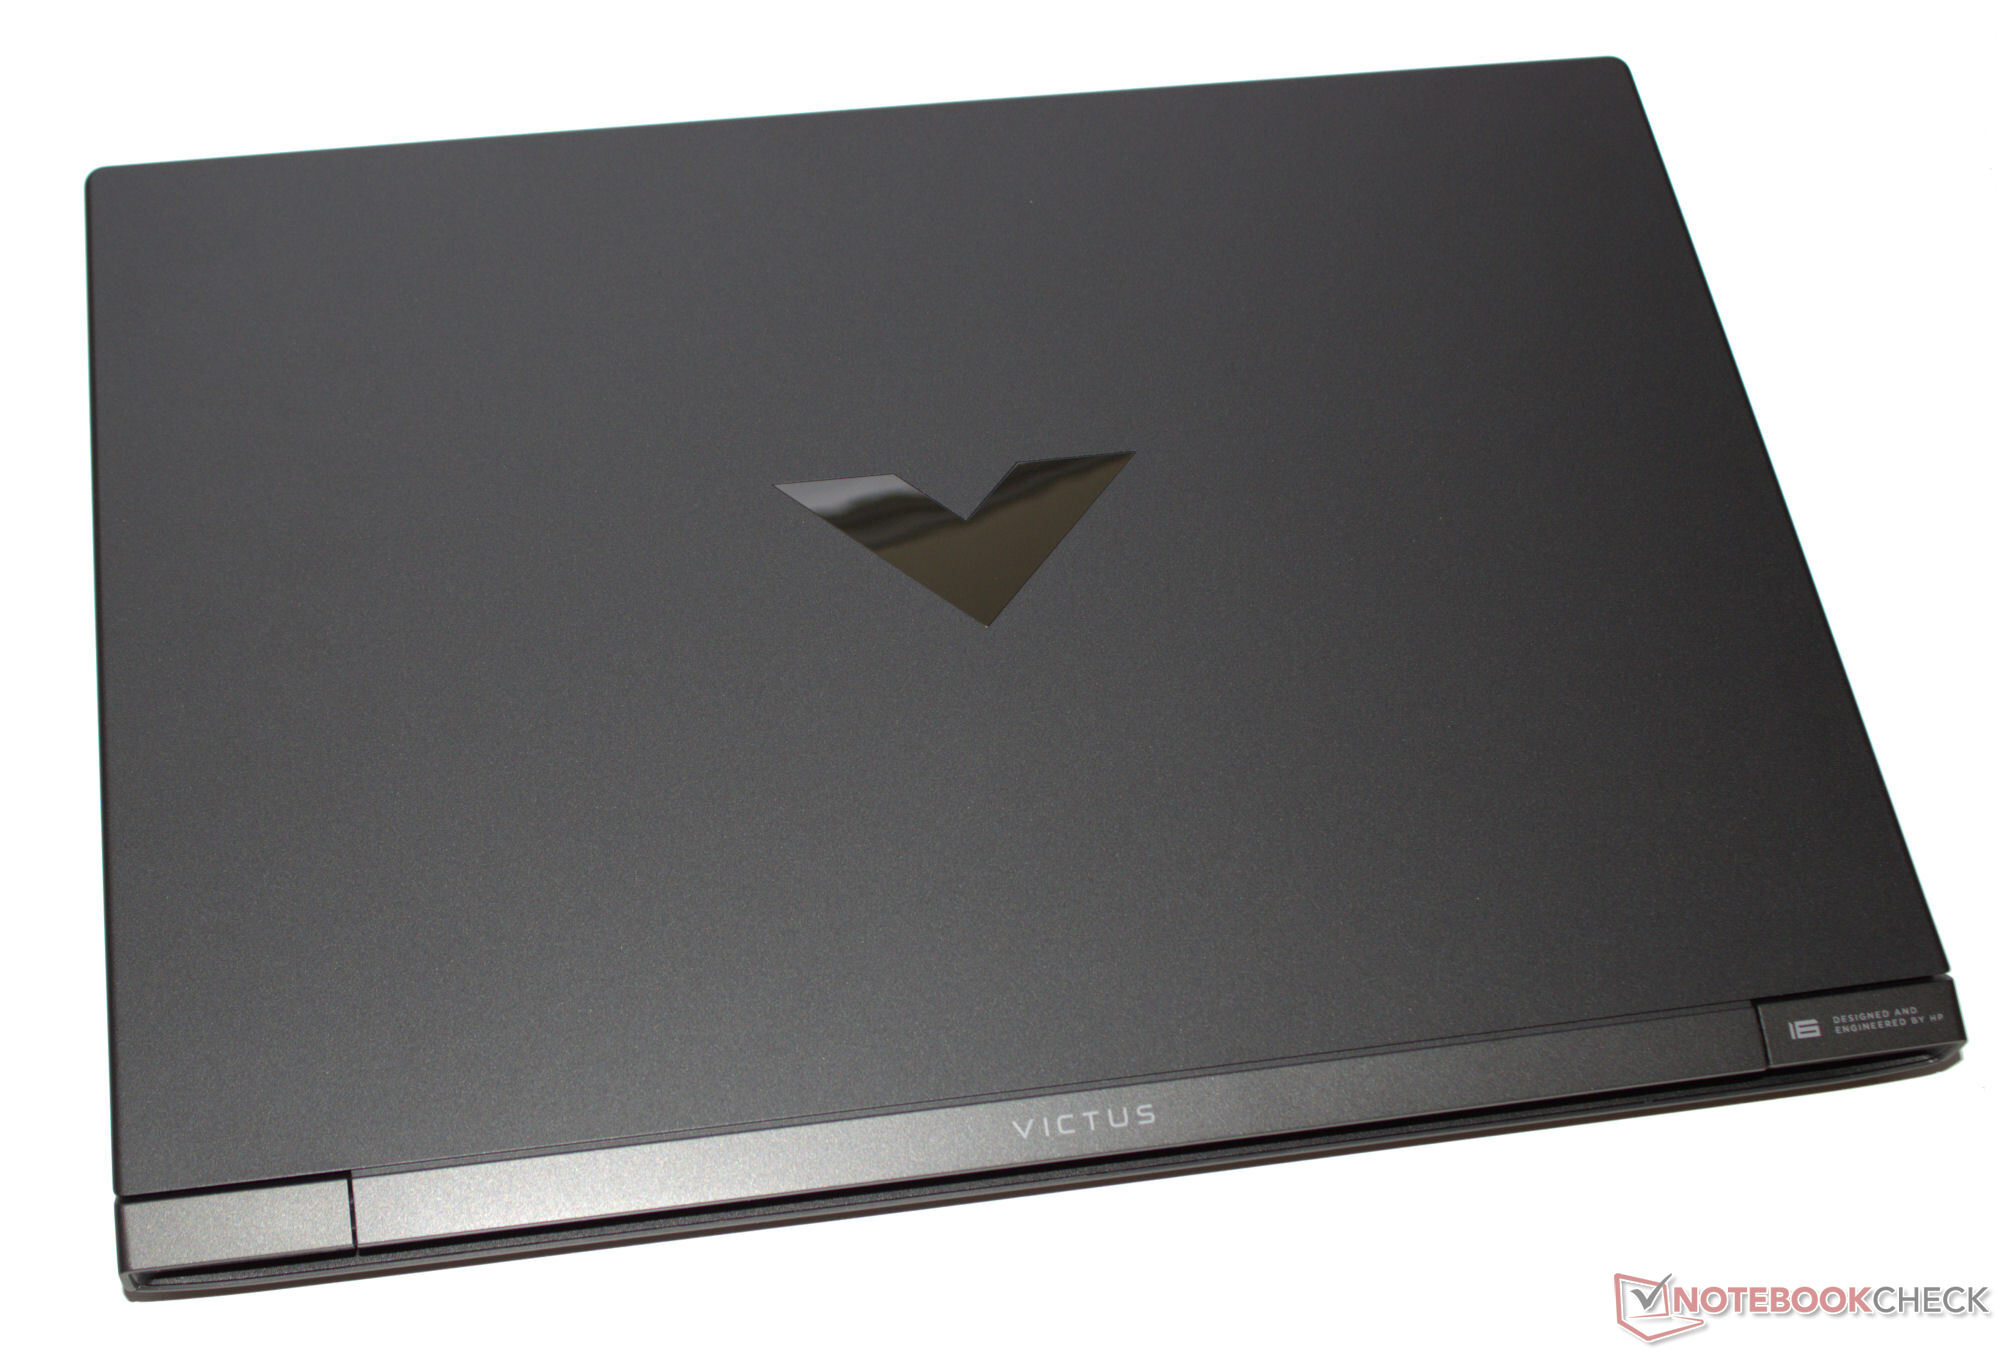
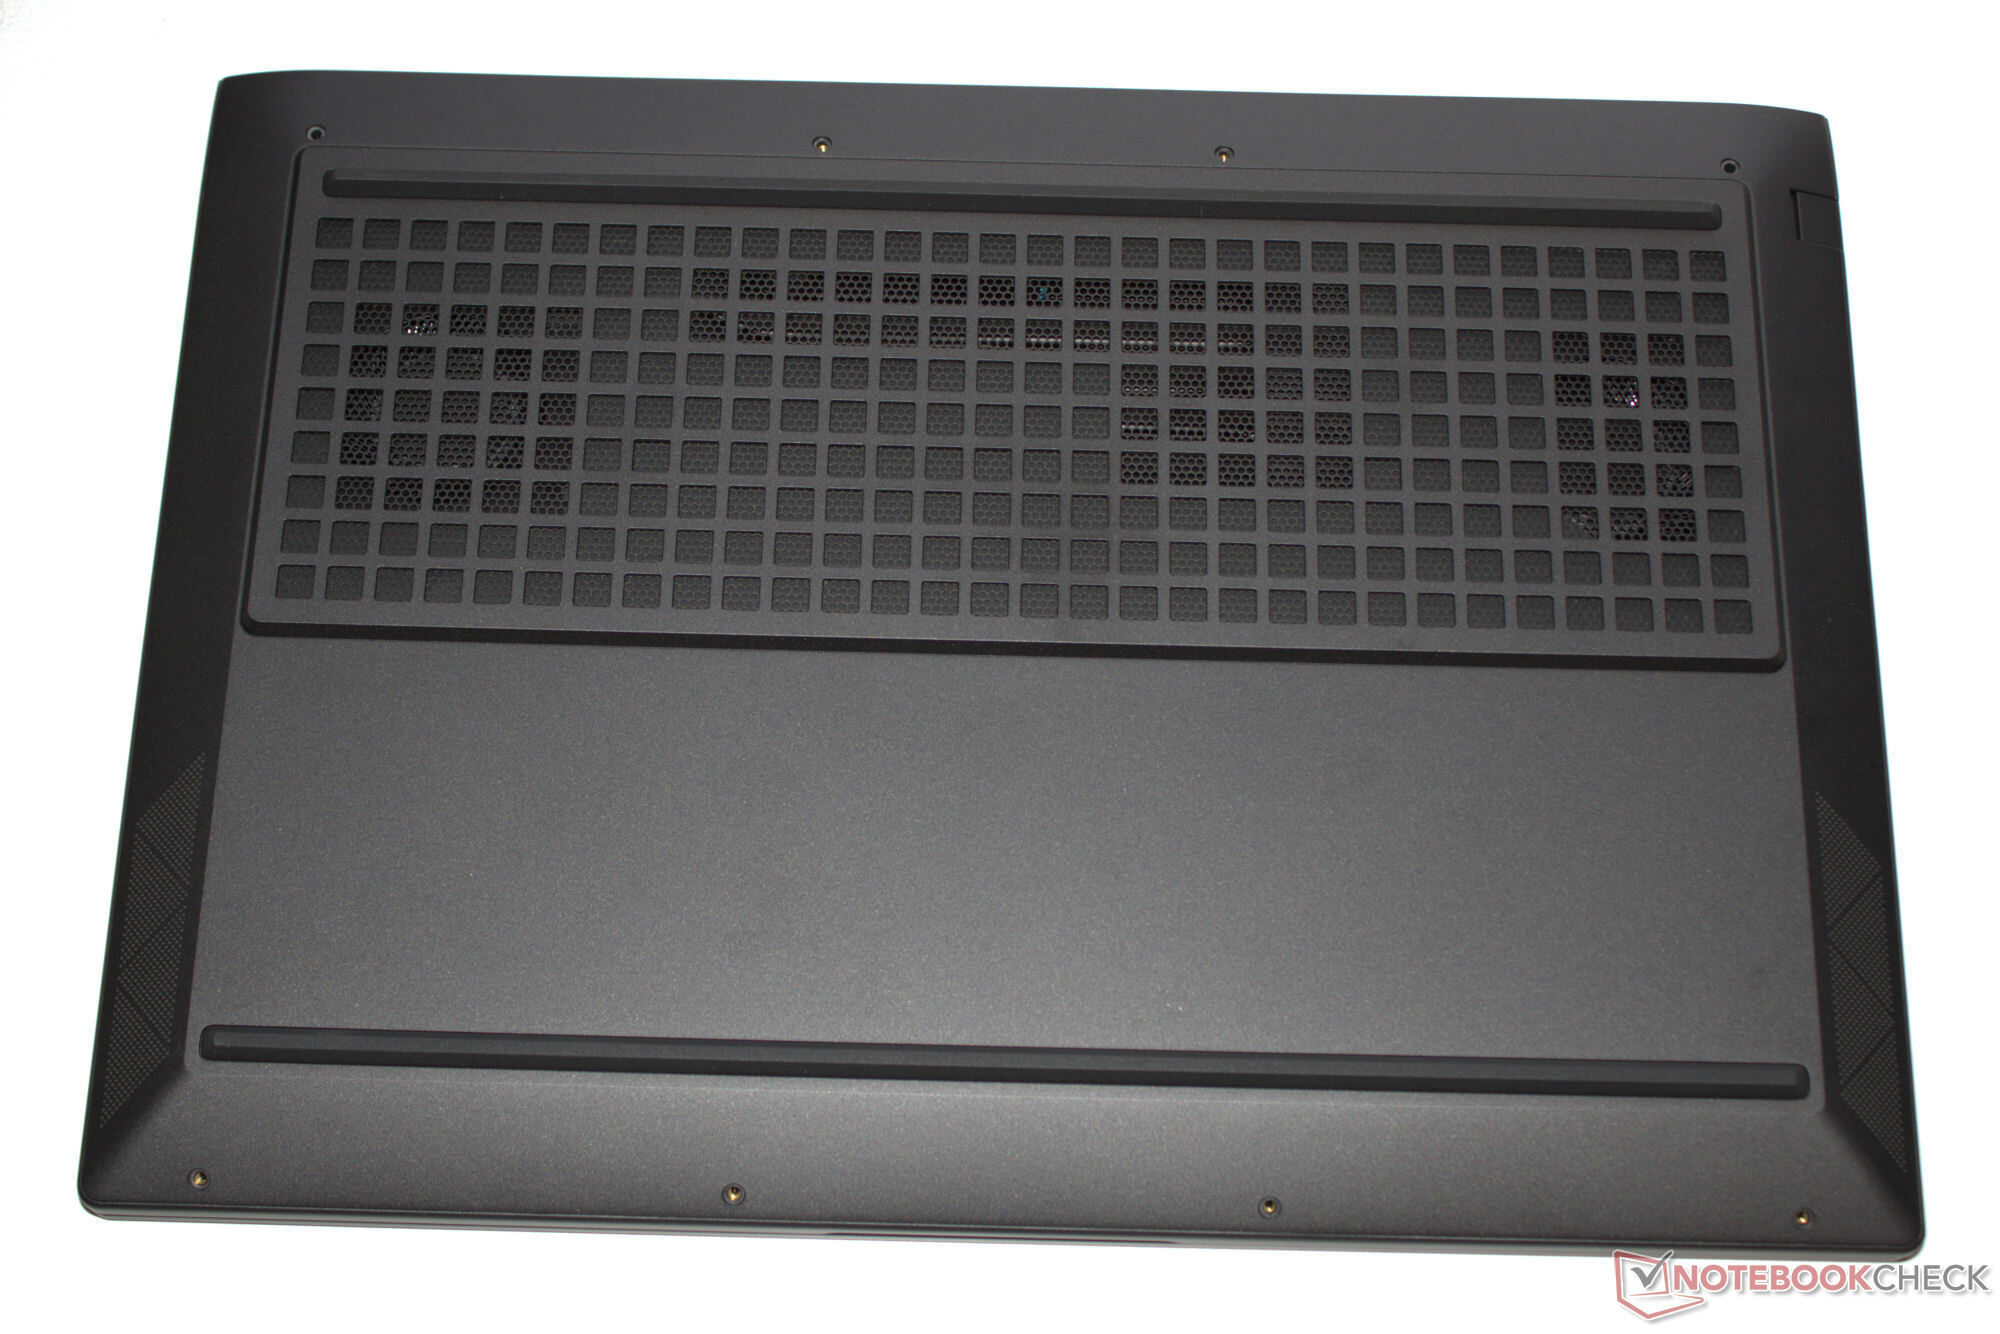
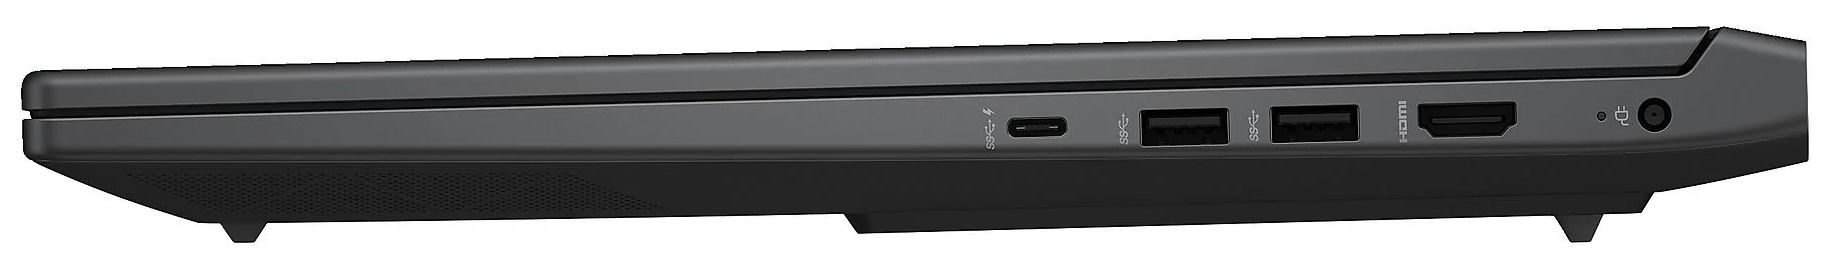
Fodral och anslutningsmöjligheter - HP Victus har Power Delivery
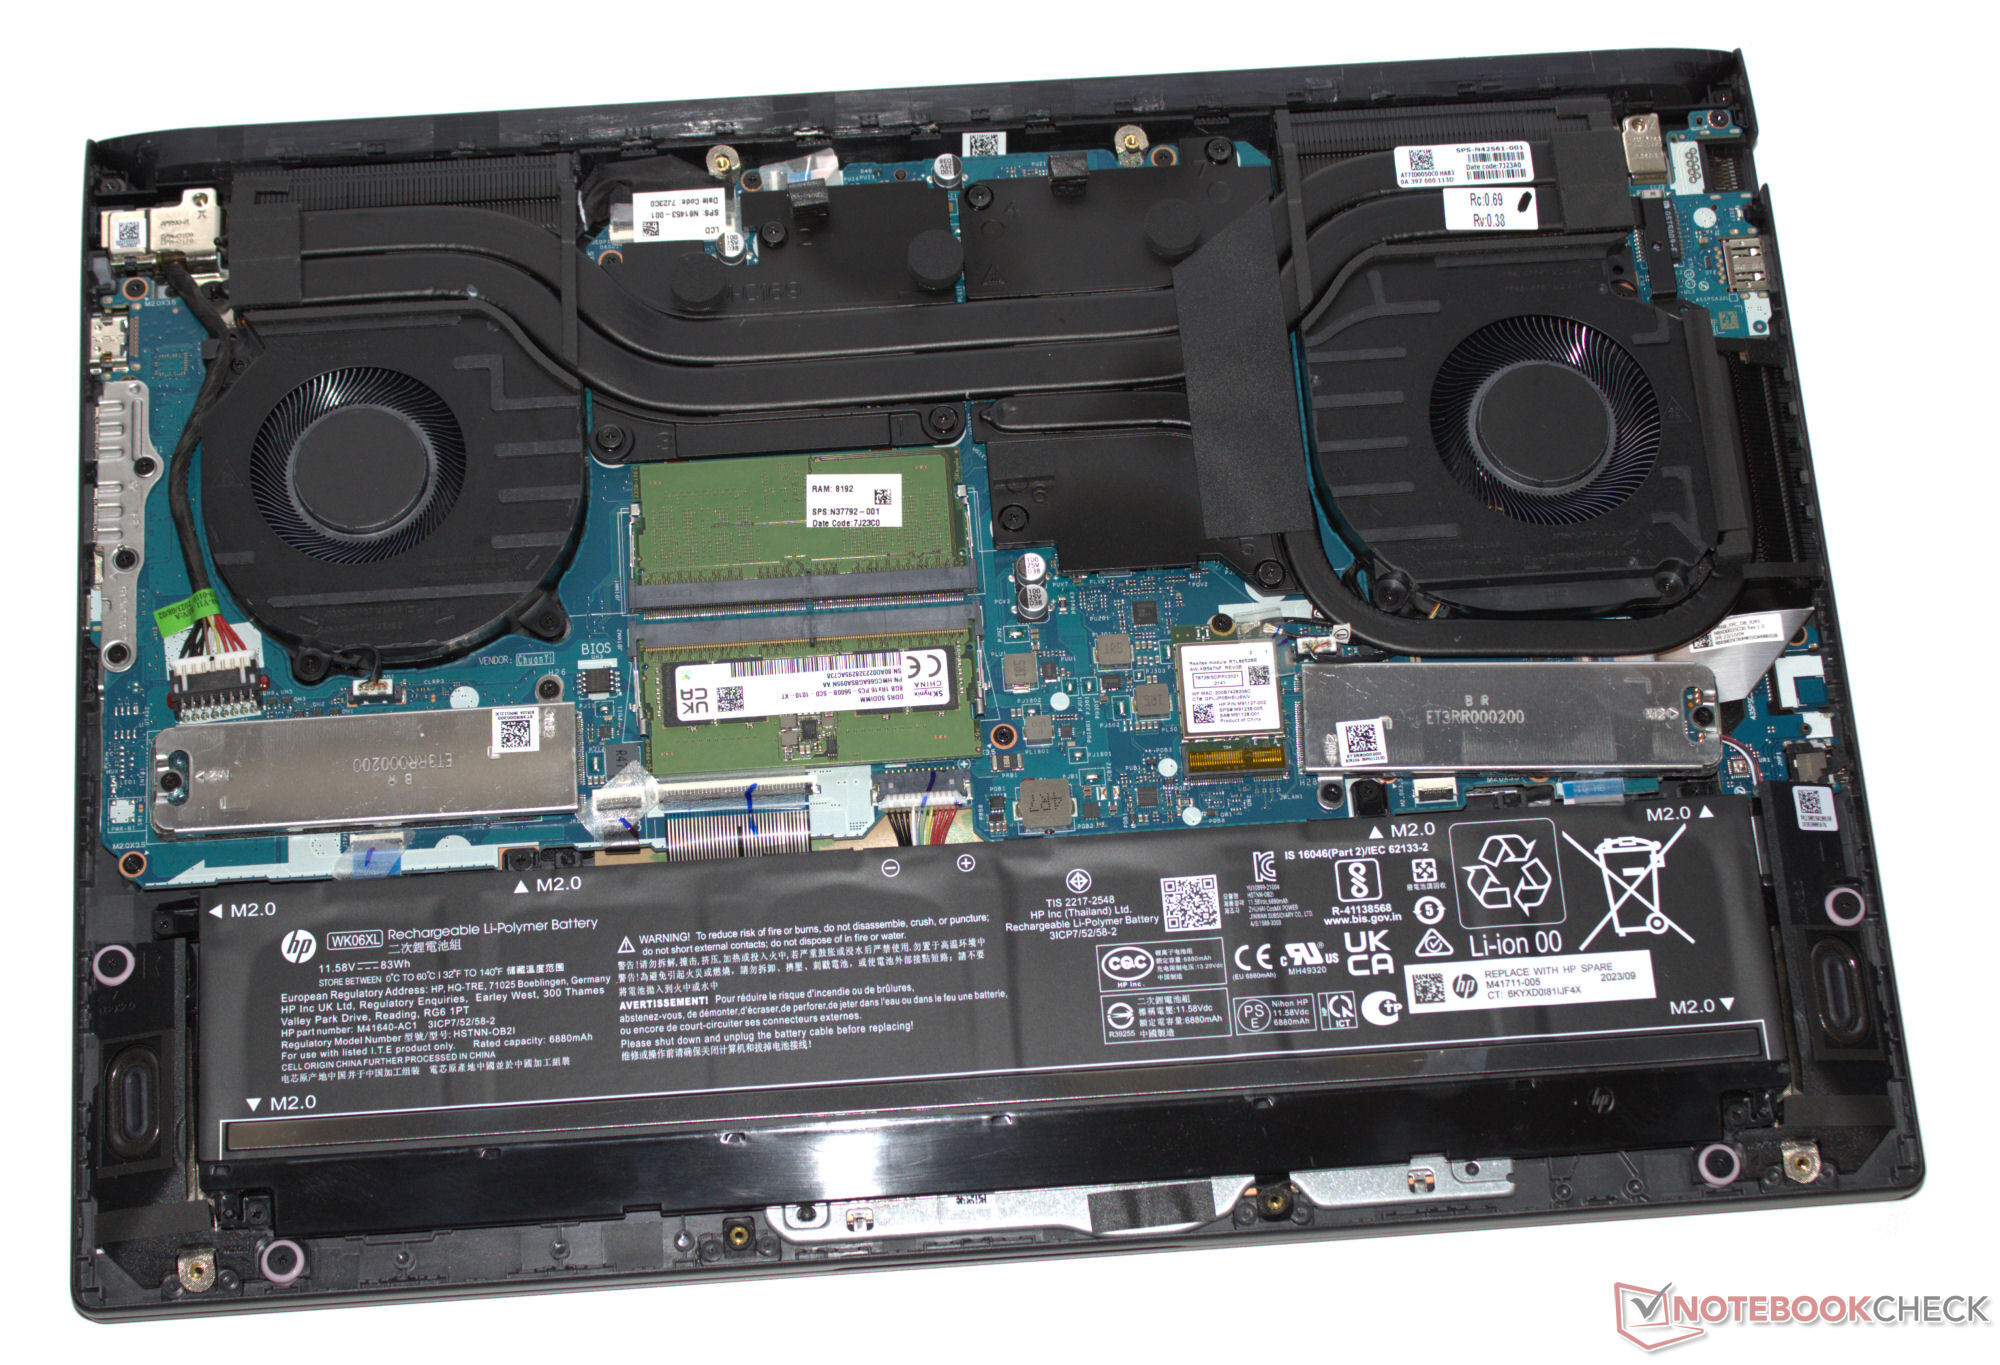
Du kan inte förvänta dig högkvalitativa material: Hela fodralet till den bärbara datorn är tillverkat av matt plast i färgställningen "Mica Silver" - en mörkgrå antracitsvart. Locket och basenheten kan vridas. Inga LED-element används på det avskalade höljet och det mest iögonfallande tillbehöret är Victus-logotypen på baksidan av enhetens lock. Batteriet (inskruvat, inte fastlimmat) och resten av hårdvaran kan nås efter att den nedre delen av höljet har tagits bort.
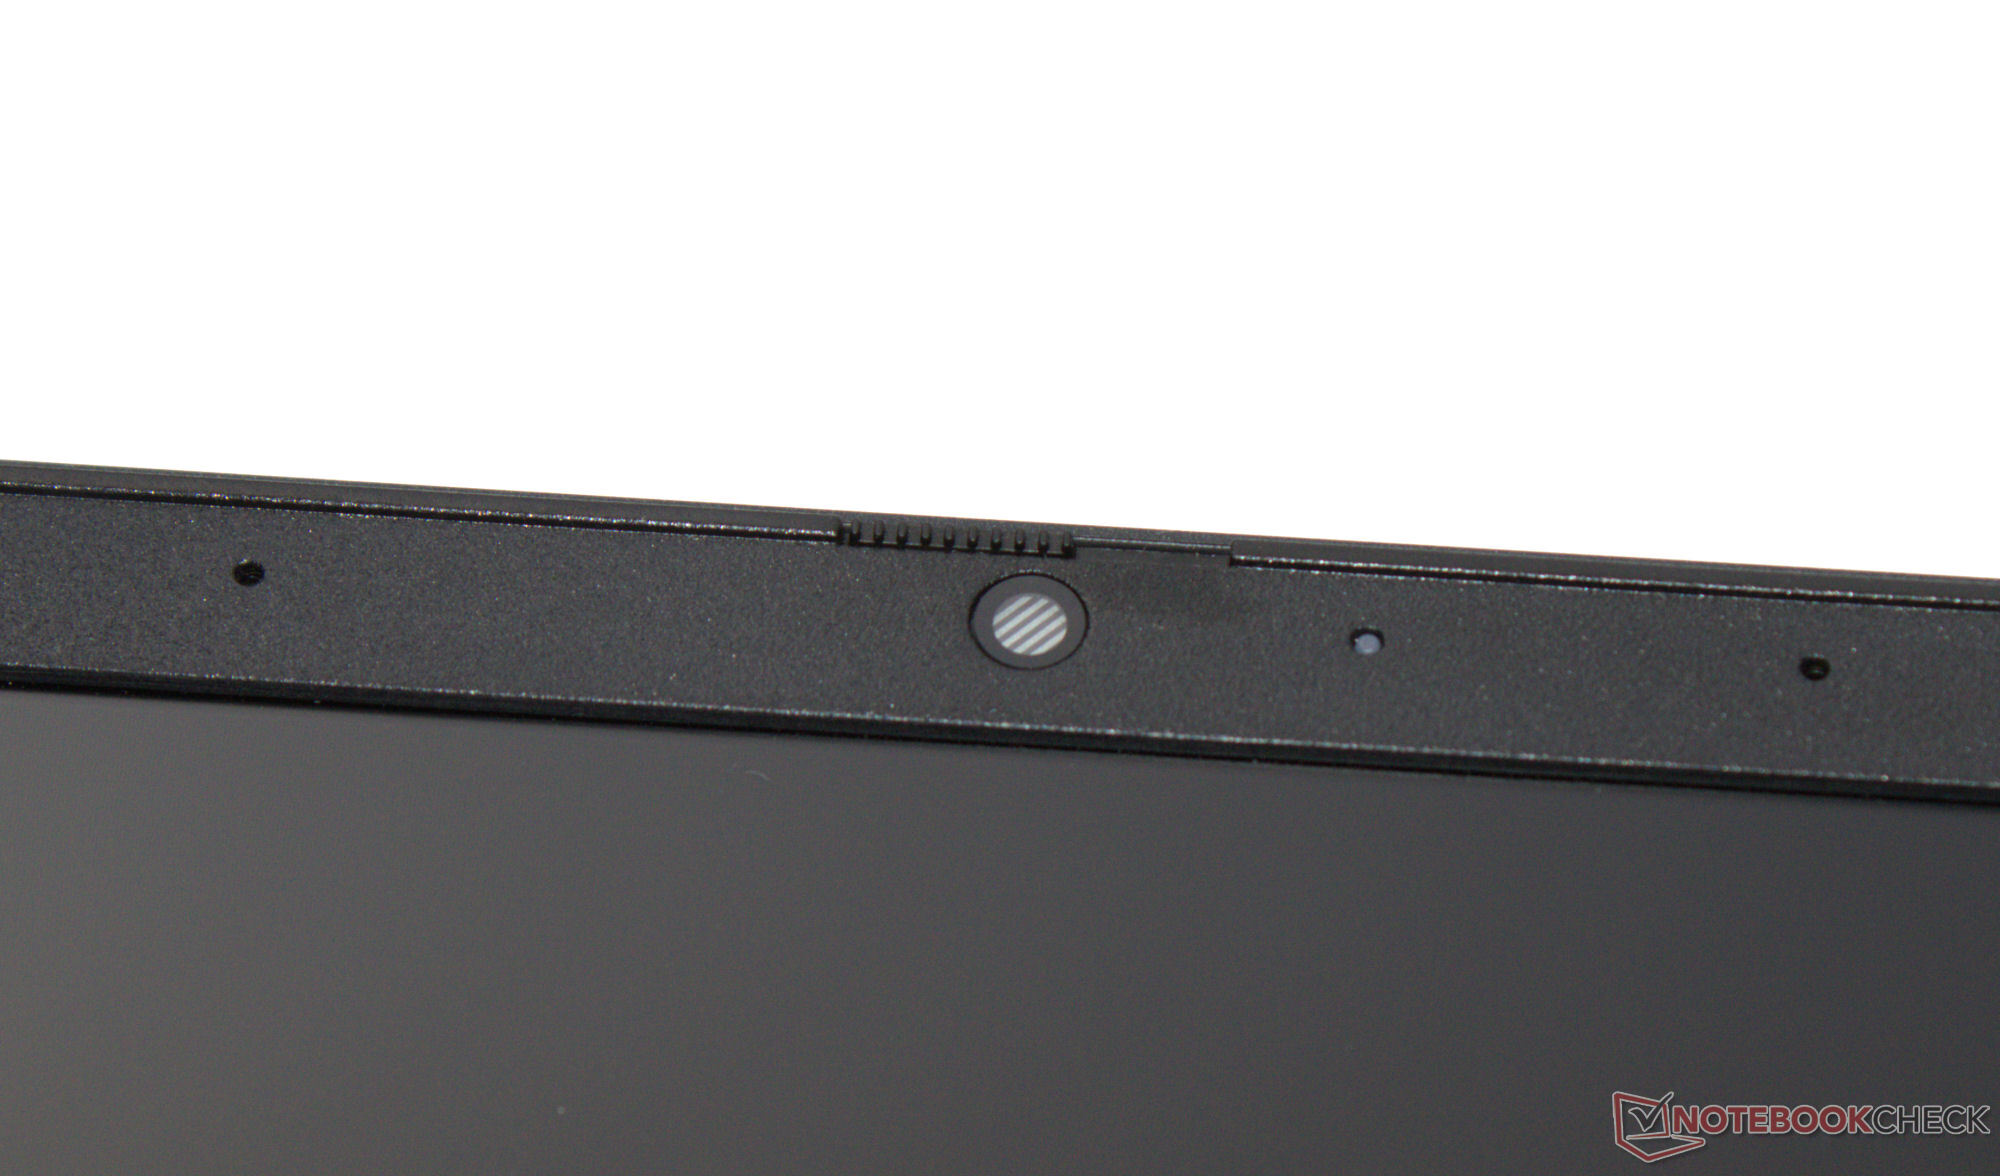
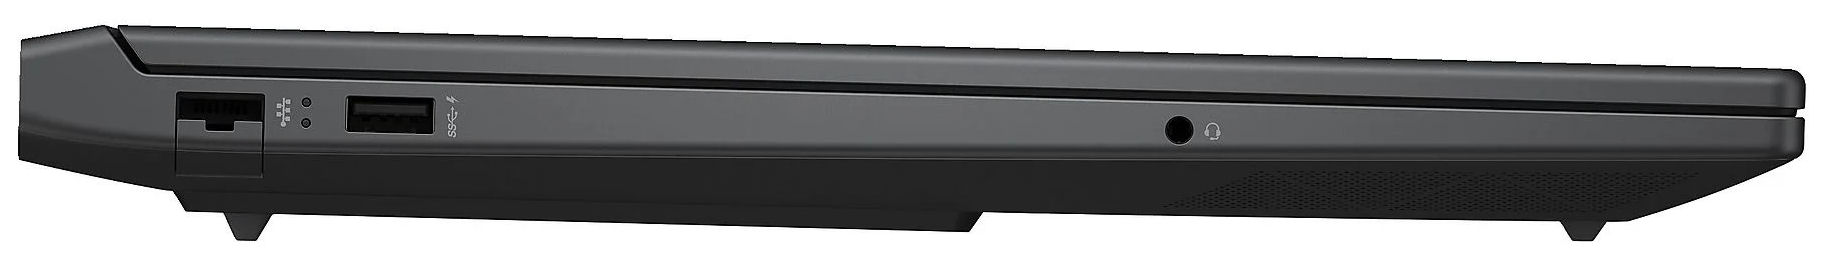
Du kommer att söka efter Thunderbolt och USB 4 förgäves: Alla fyra USB-portar (3x USB-A, 1x USB-C) följer USB 3.2 Gen 1-standarden. USB-C-porten har stöd för Power Delivery och kan mata ut en DisplayPort-signal. Totalt har den bärbara datorn två videoutgångar (1x HDMI, 1x DP). Dess webbkamera (2,1 MP, med skydd) levererar genomsnittliga resultat. Den är inte utrustad med en SD-kortläsare.
Victus är utrustad med ett Realtek WiFi 6-chip (RTL8852BE) som inte kan konkurrera med sina konkurrenters Intel-chip: De WiFi-datahastigheter vi mätte var hyfsade, men de når inte upp till dagens möjligheter.

 GeForce RTX 4060 Laptop GPU, i7-14700HX, Kioxia XG8 KXG80ZNV512G")
 GeForce RTX 4060 Laptop GPU, i7-14700HX, Kioxia XG8 KXG80ZNV512G")
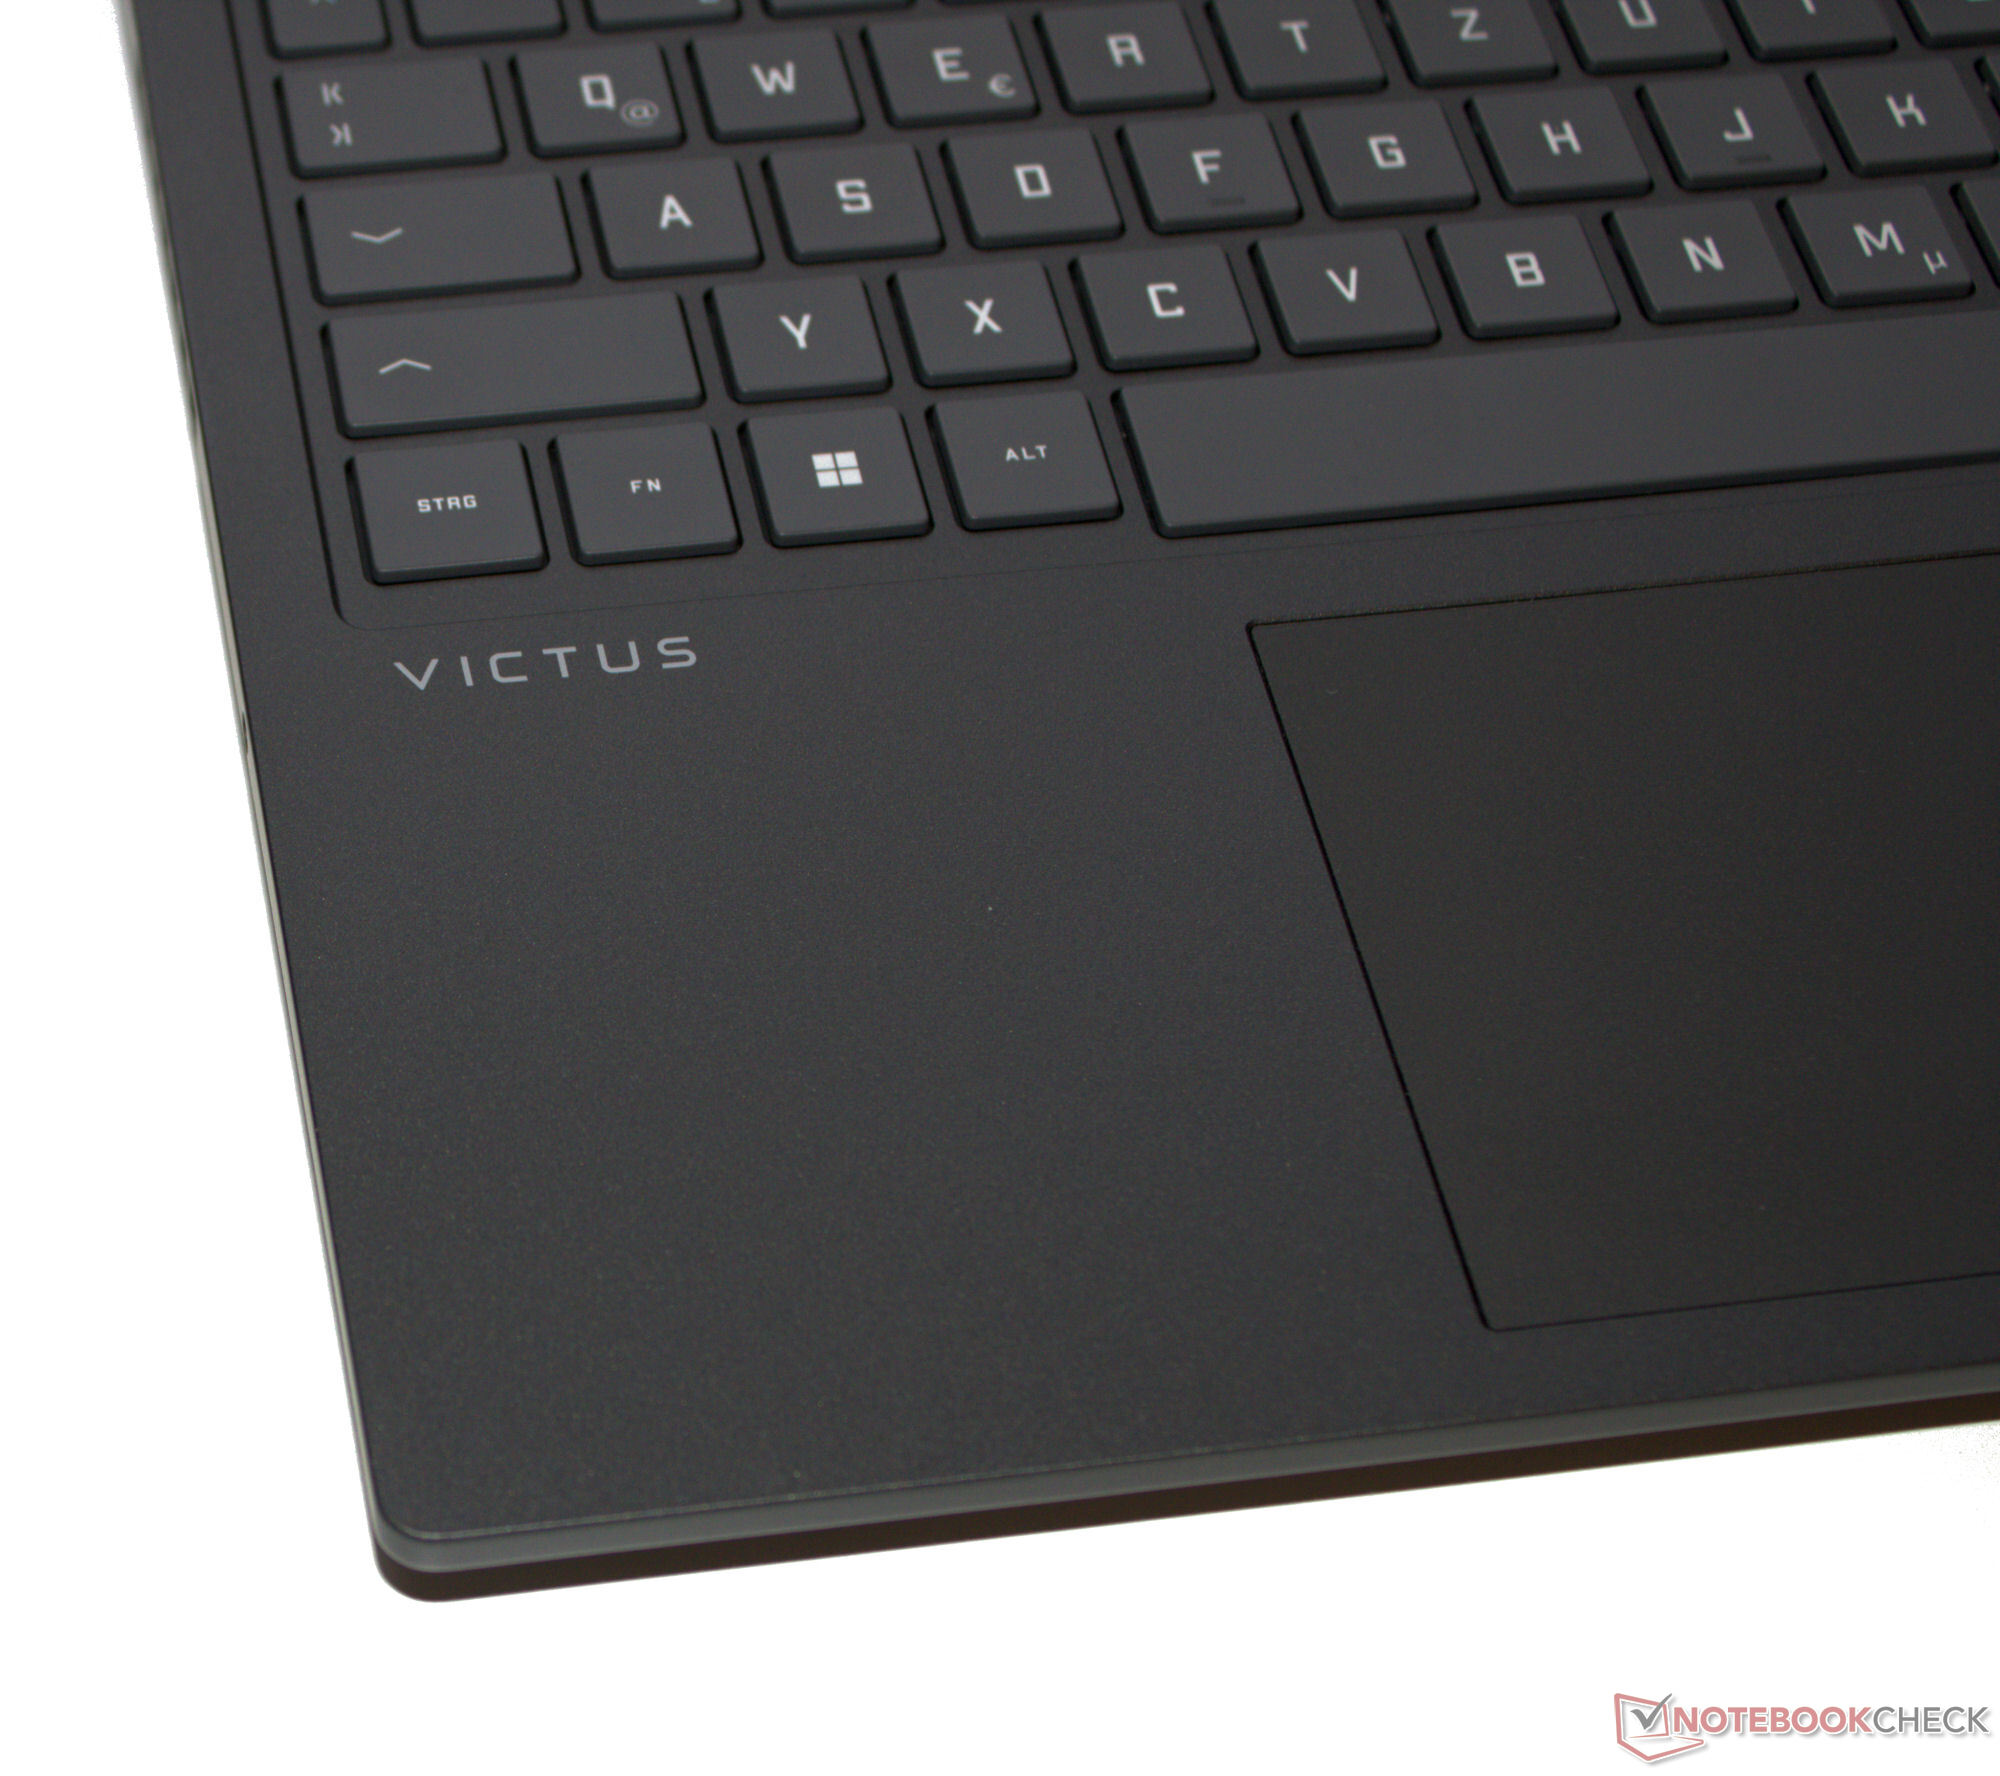
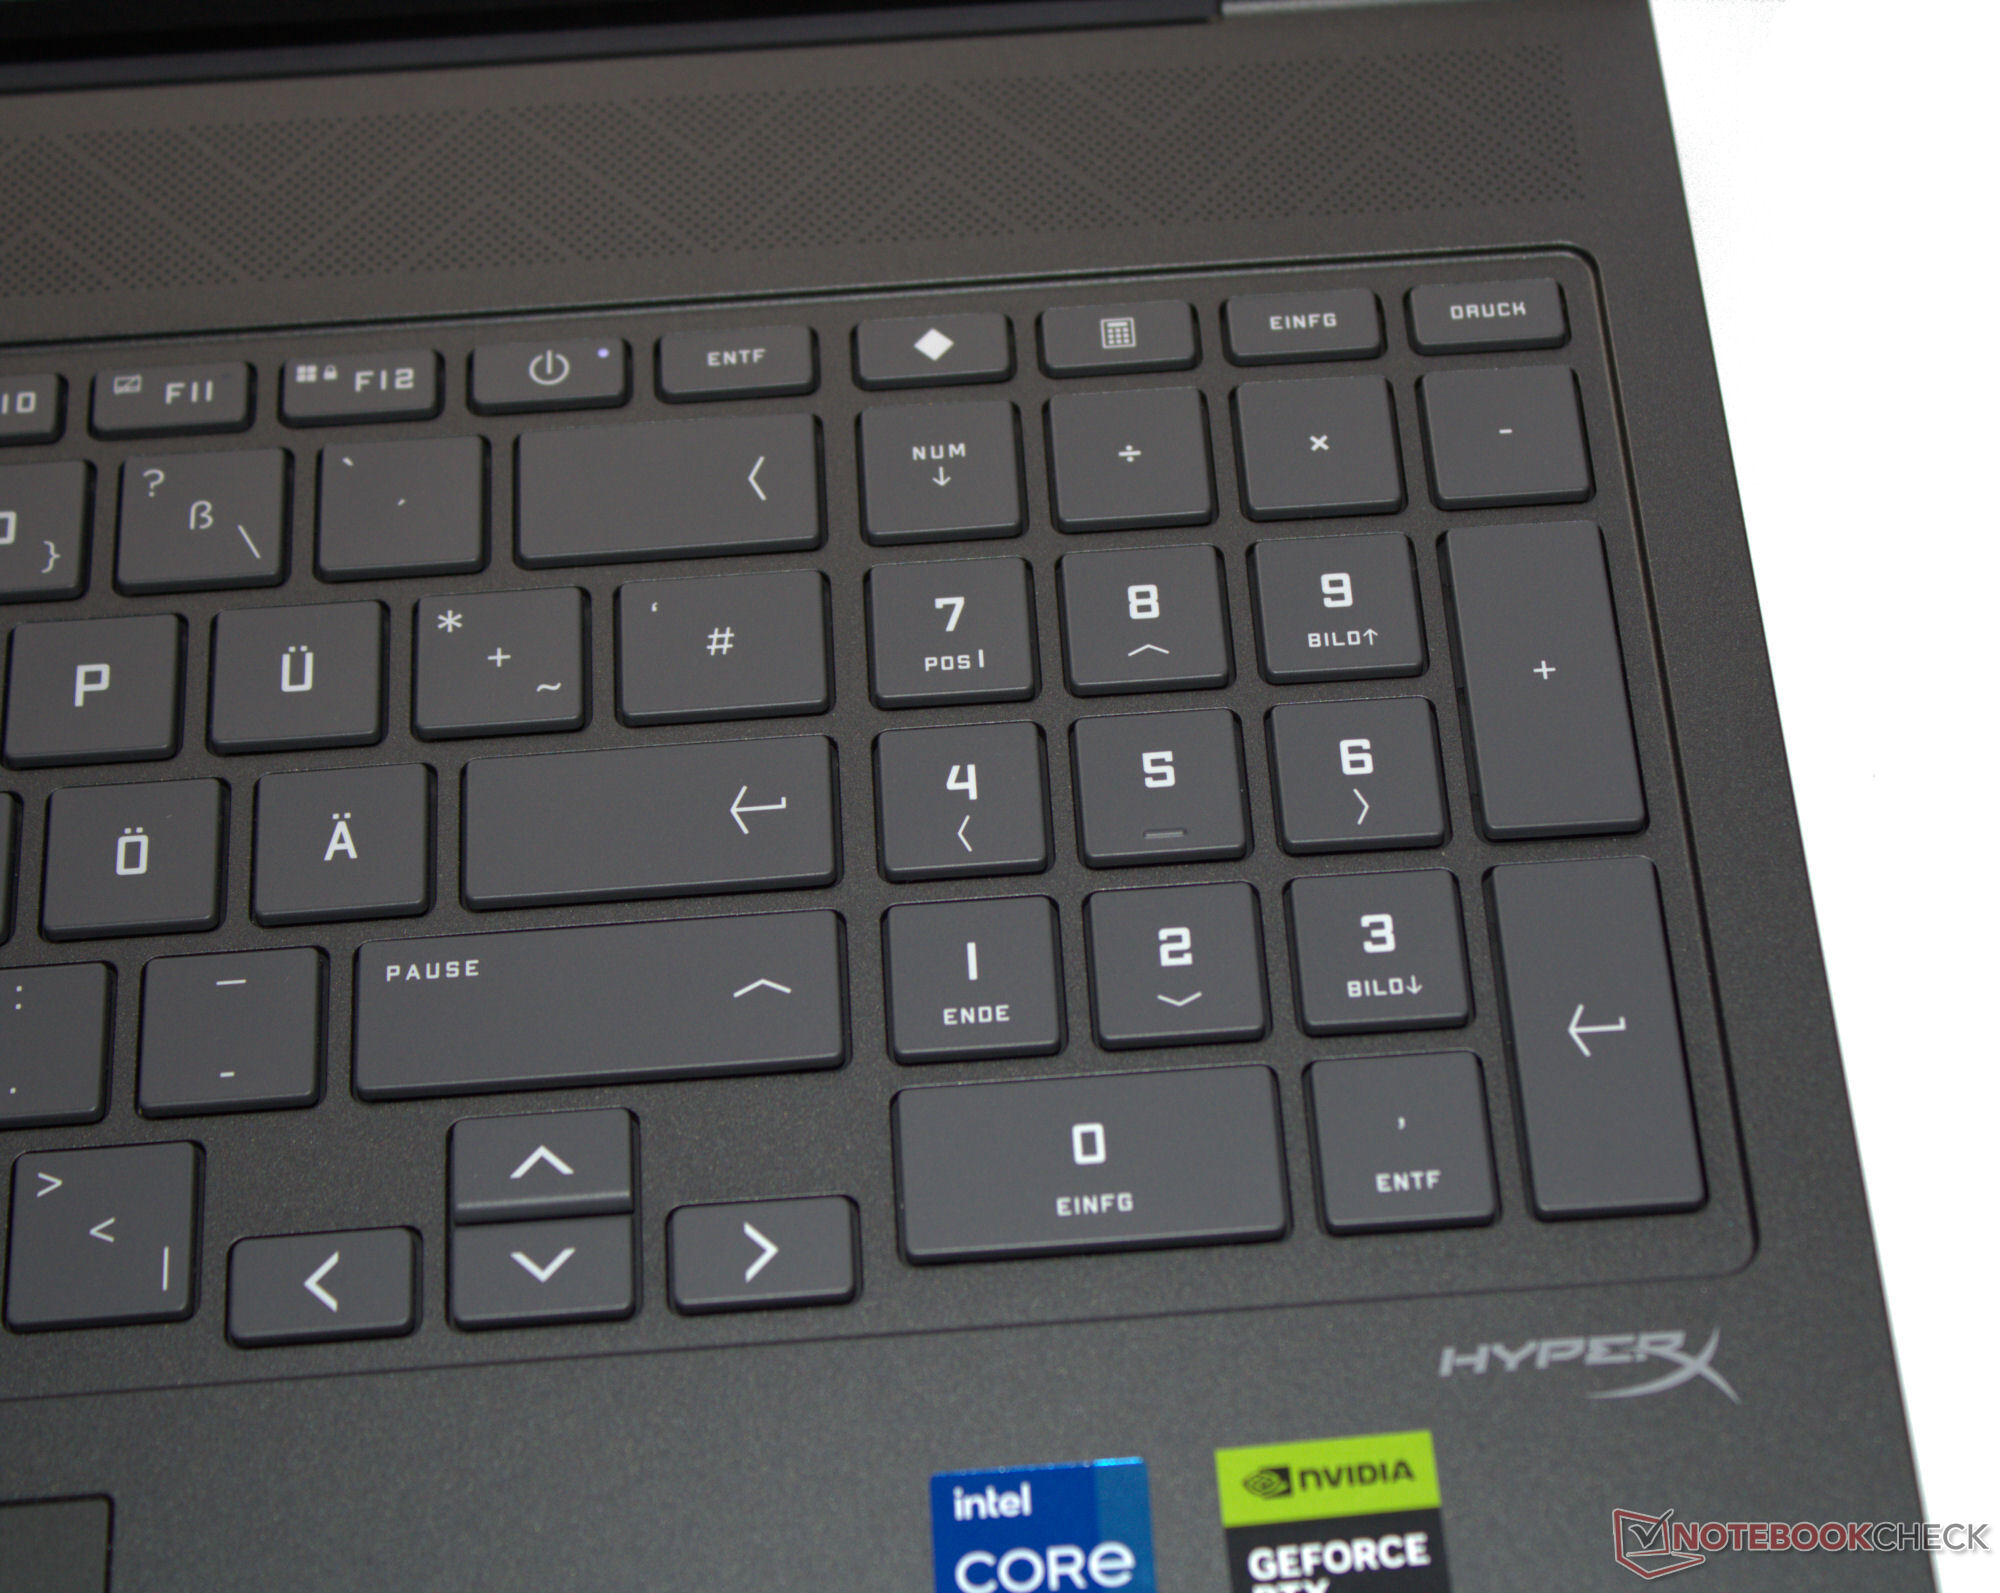
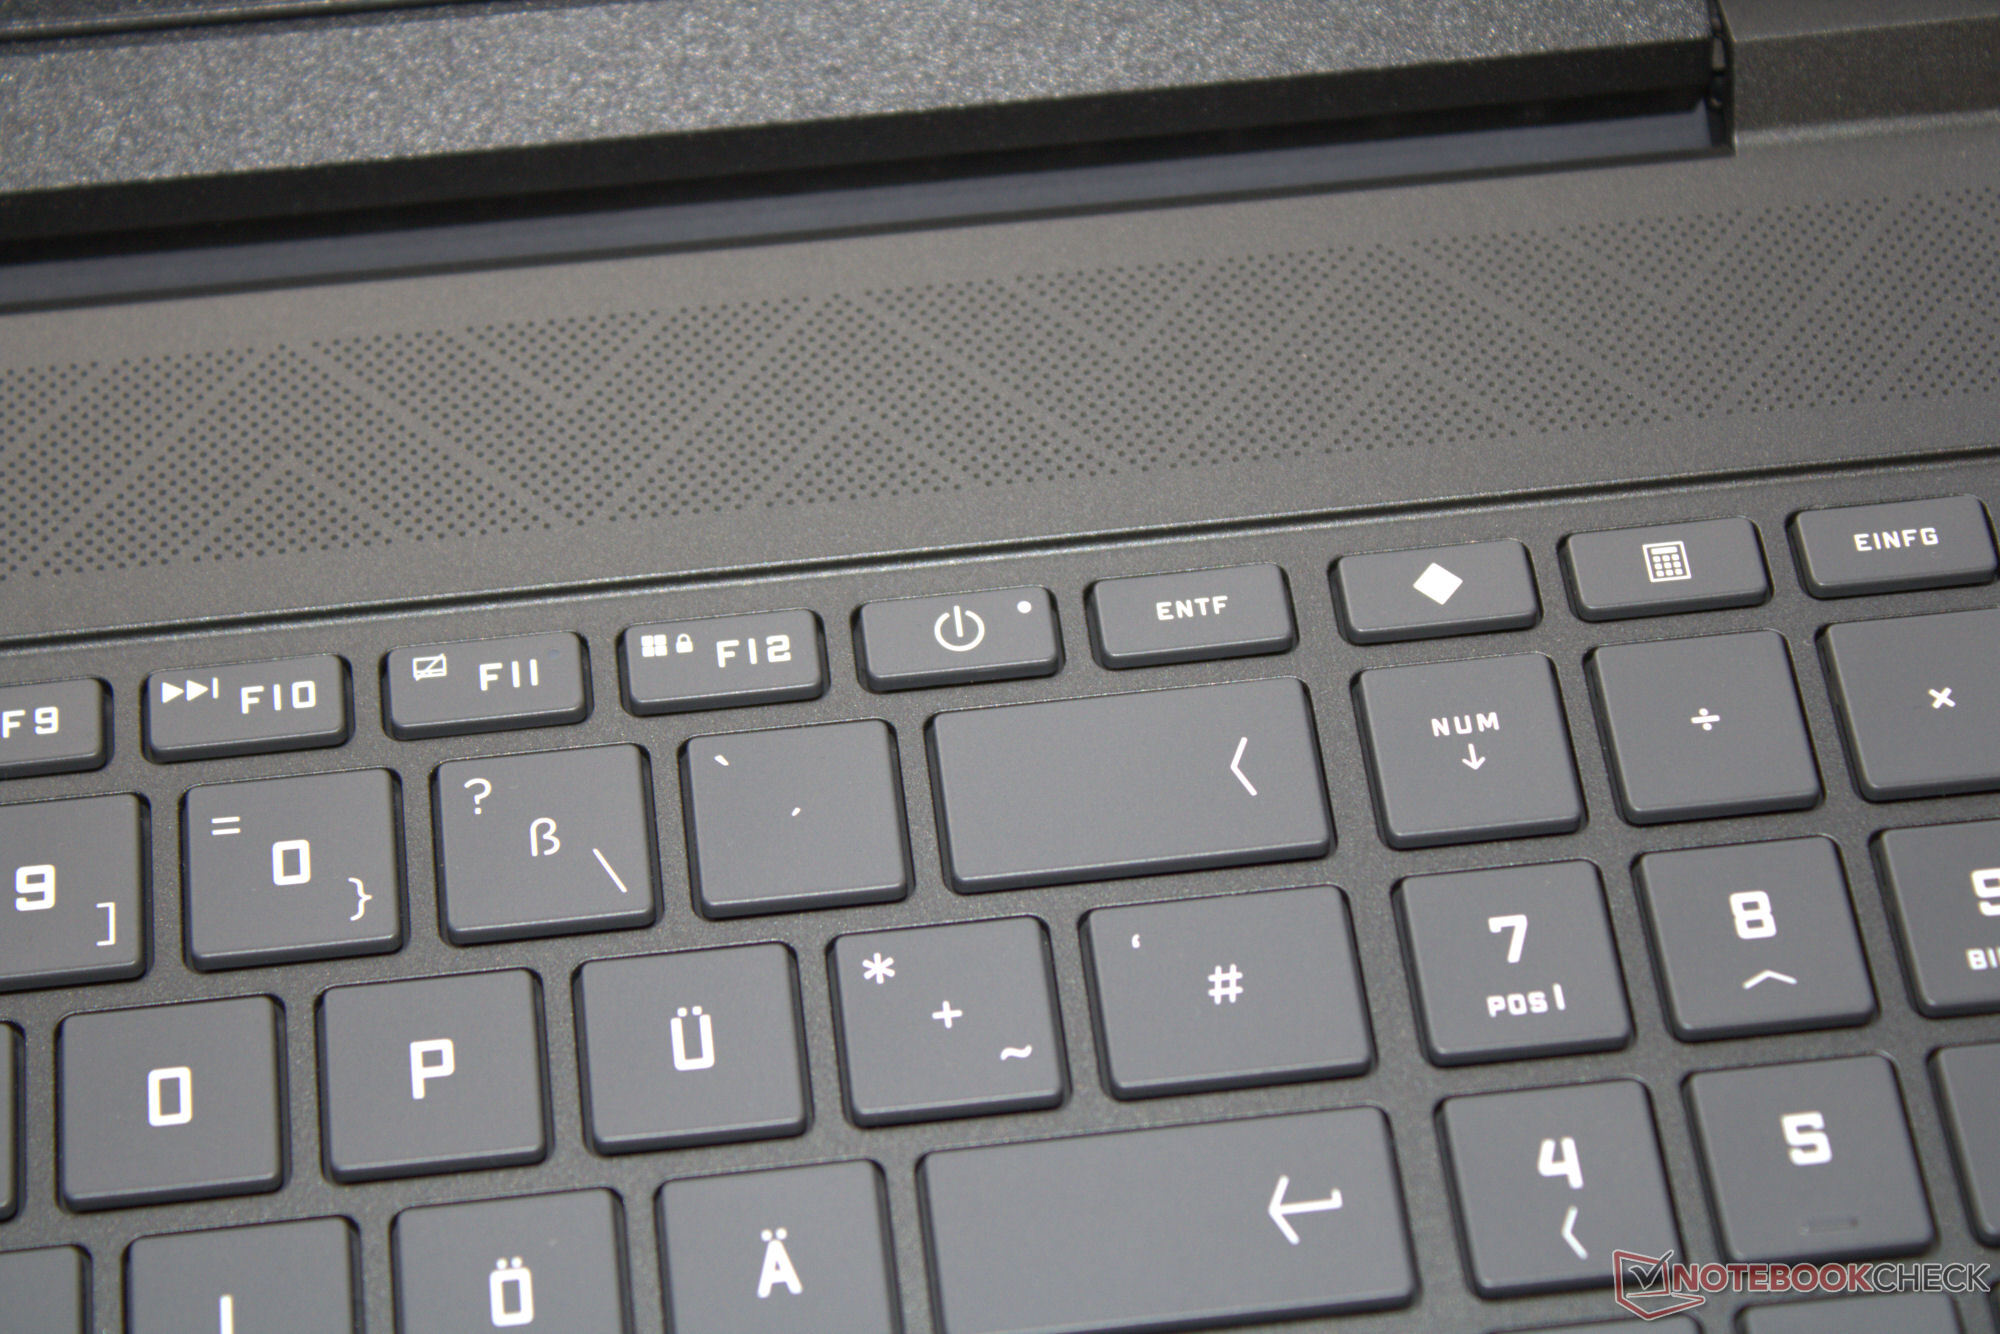
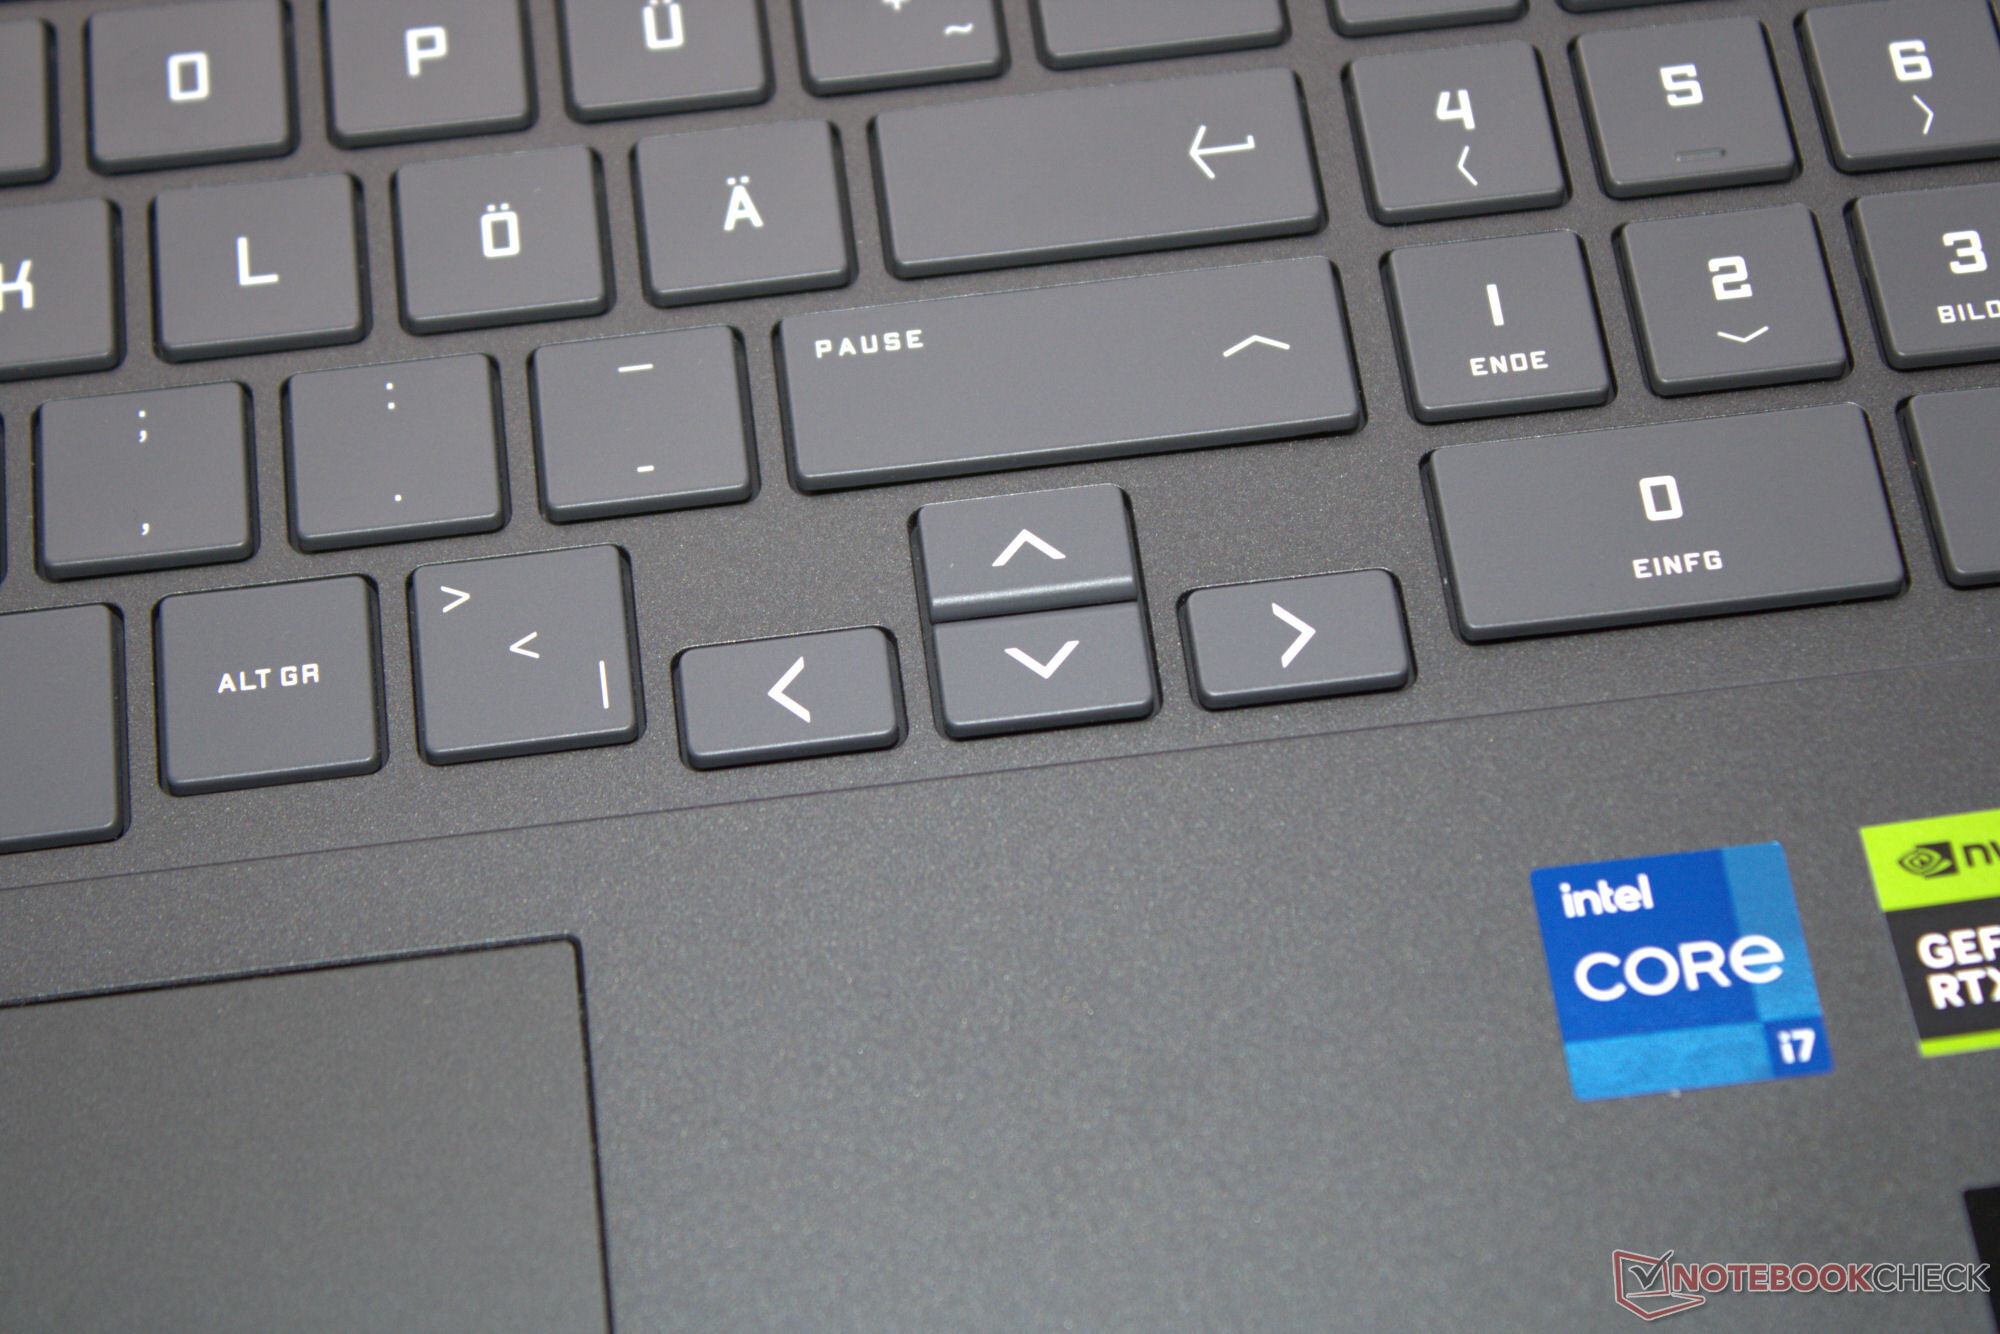
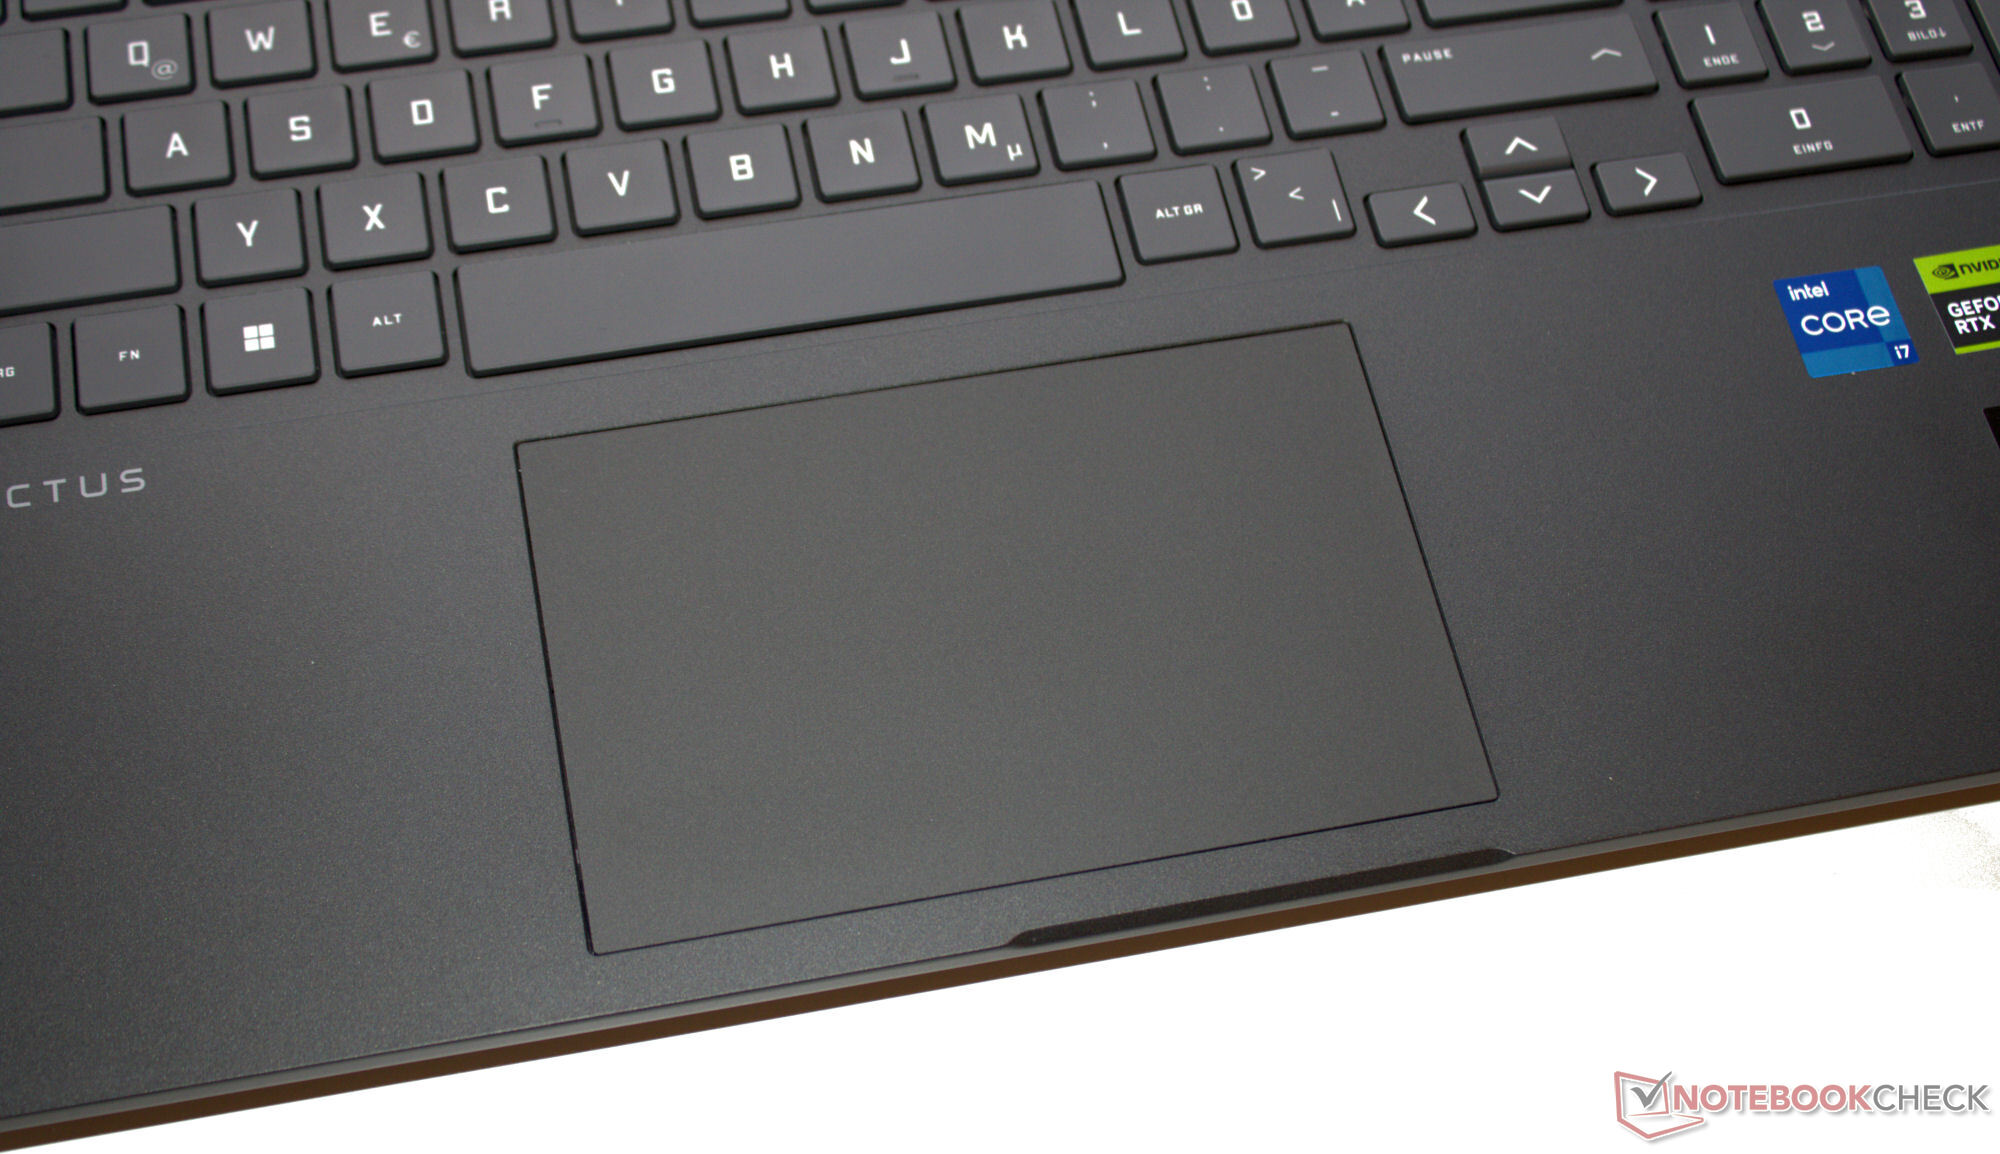
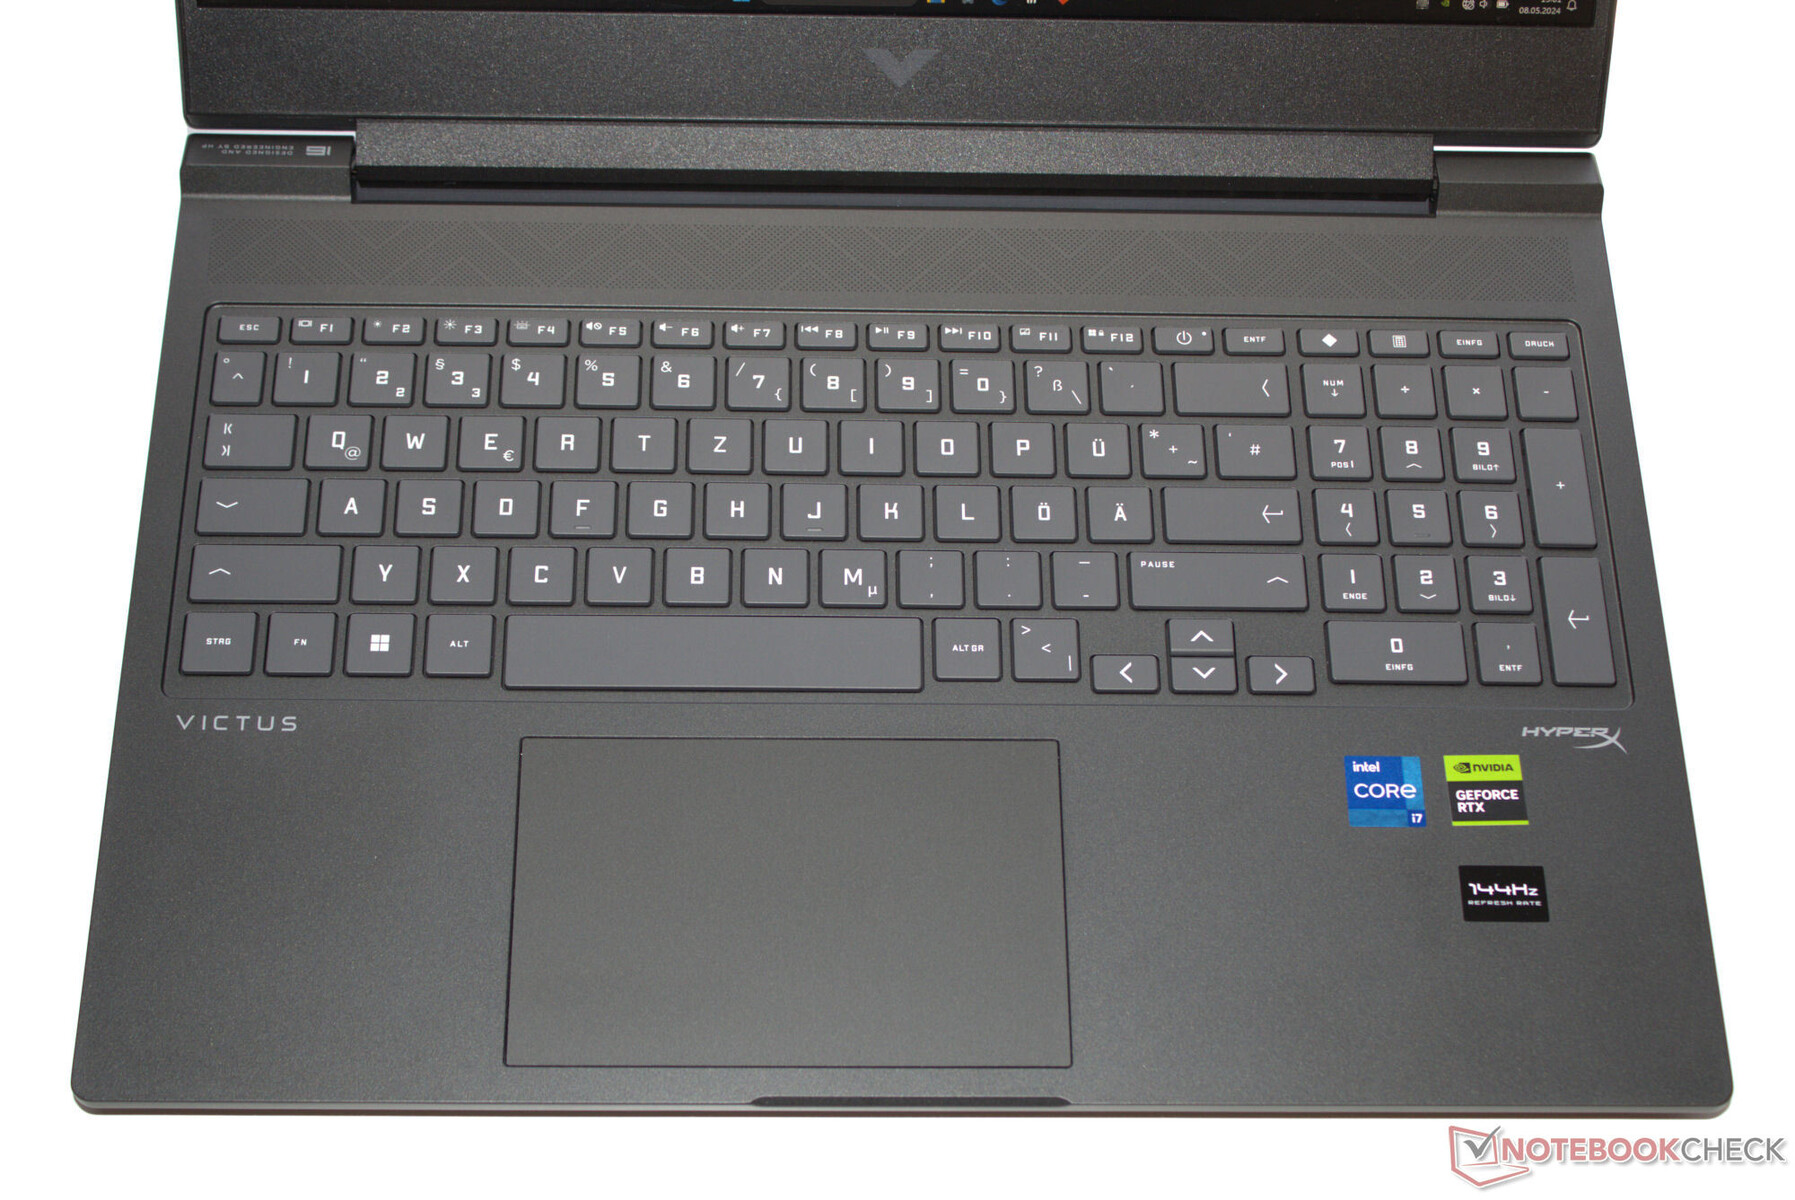
Inmatningsenheter - HP-laptop med små piltangenter
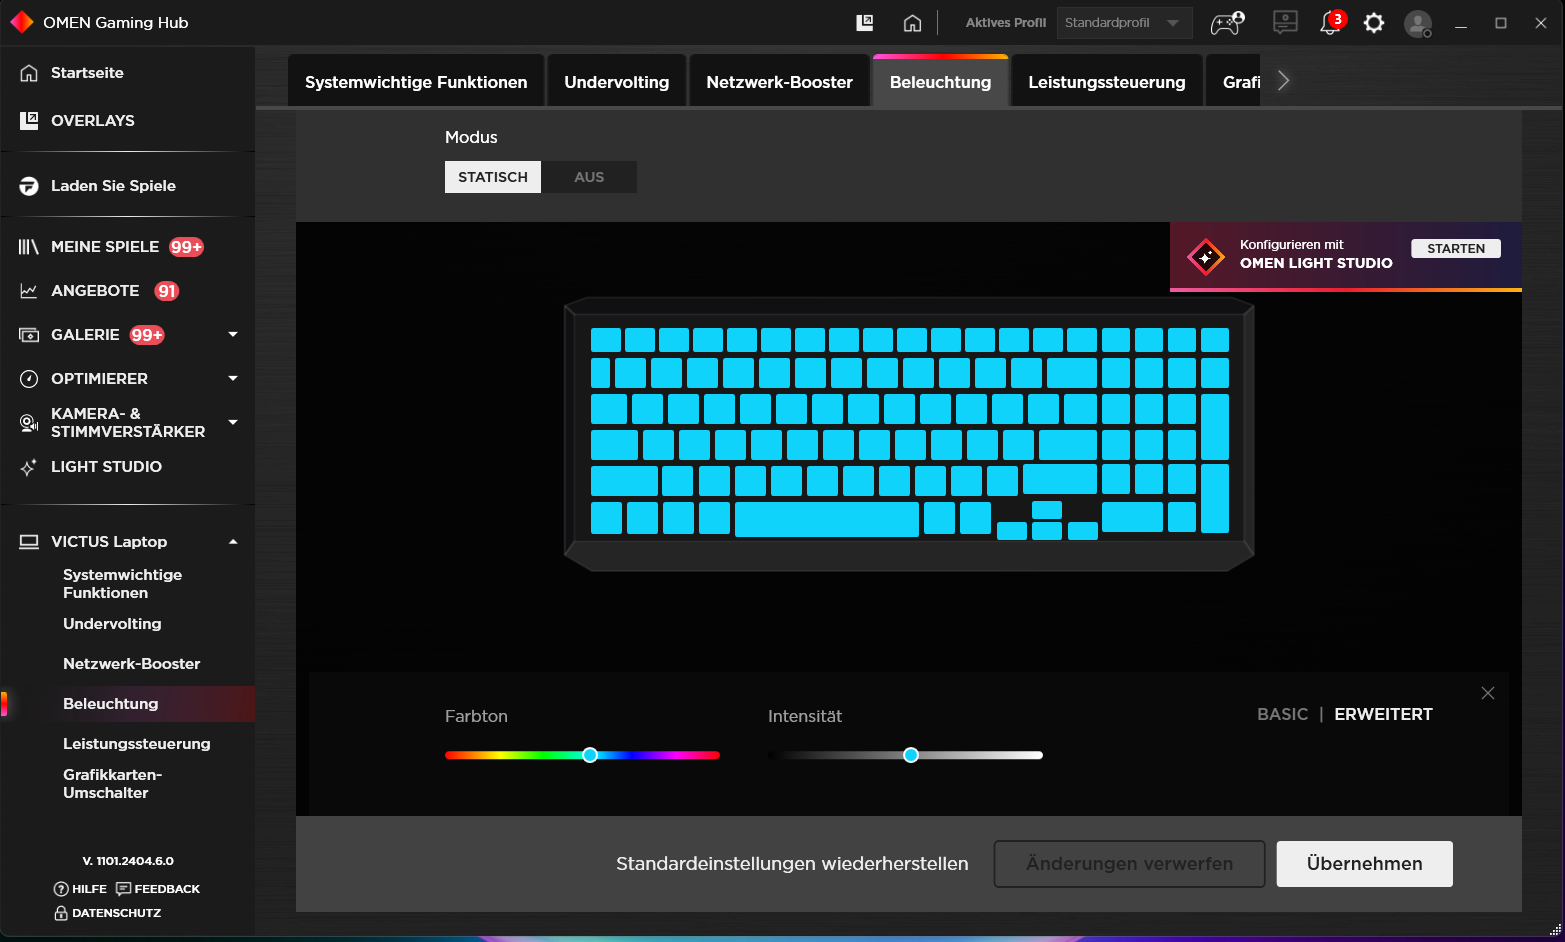
Chiclet-tangentbordets släta tangenter (RGB-belysning, siffertangentbord) har ett kort lyft och en tydlig tryckpunkt. Deras motstånd skulle kunna vara lite mer skarpt. Tangentbordet studsar något när du skriver. Negativt: Både piltangenterna och Enter-tangenten är jämförelsevis små. En clickpad (12,5 x 7,5 cm) med kort lyft och tydlig tryckpunkt fungerar som musersättning.
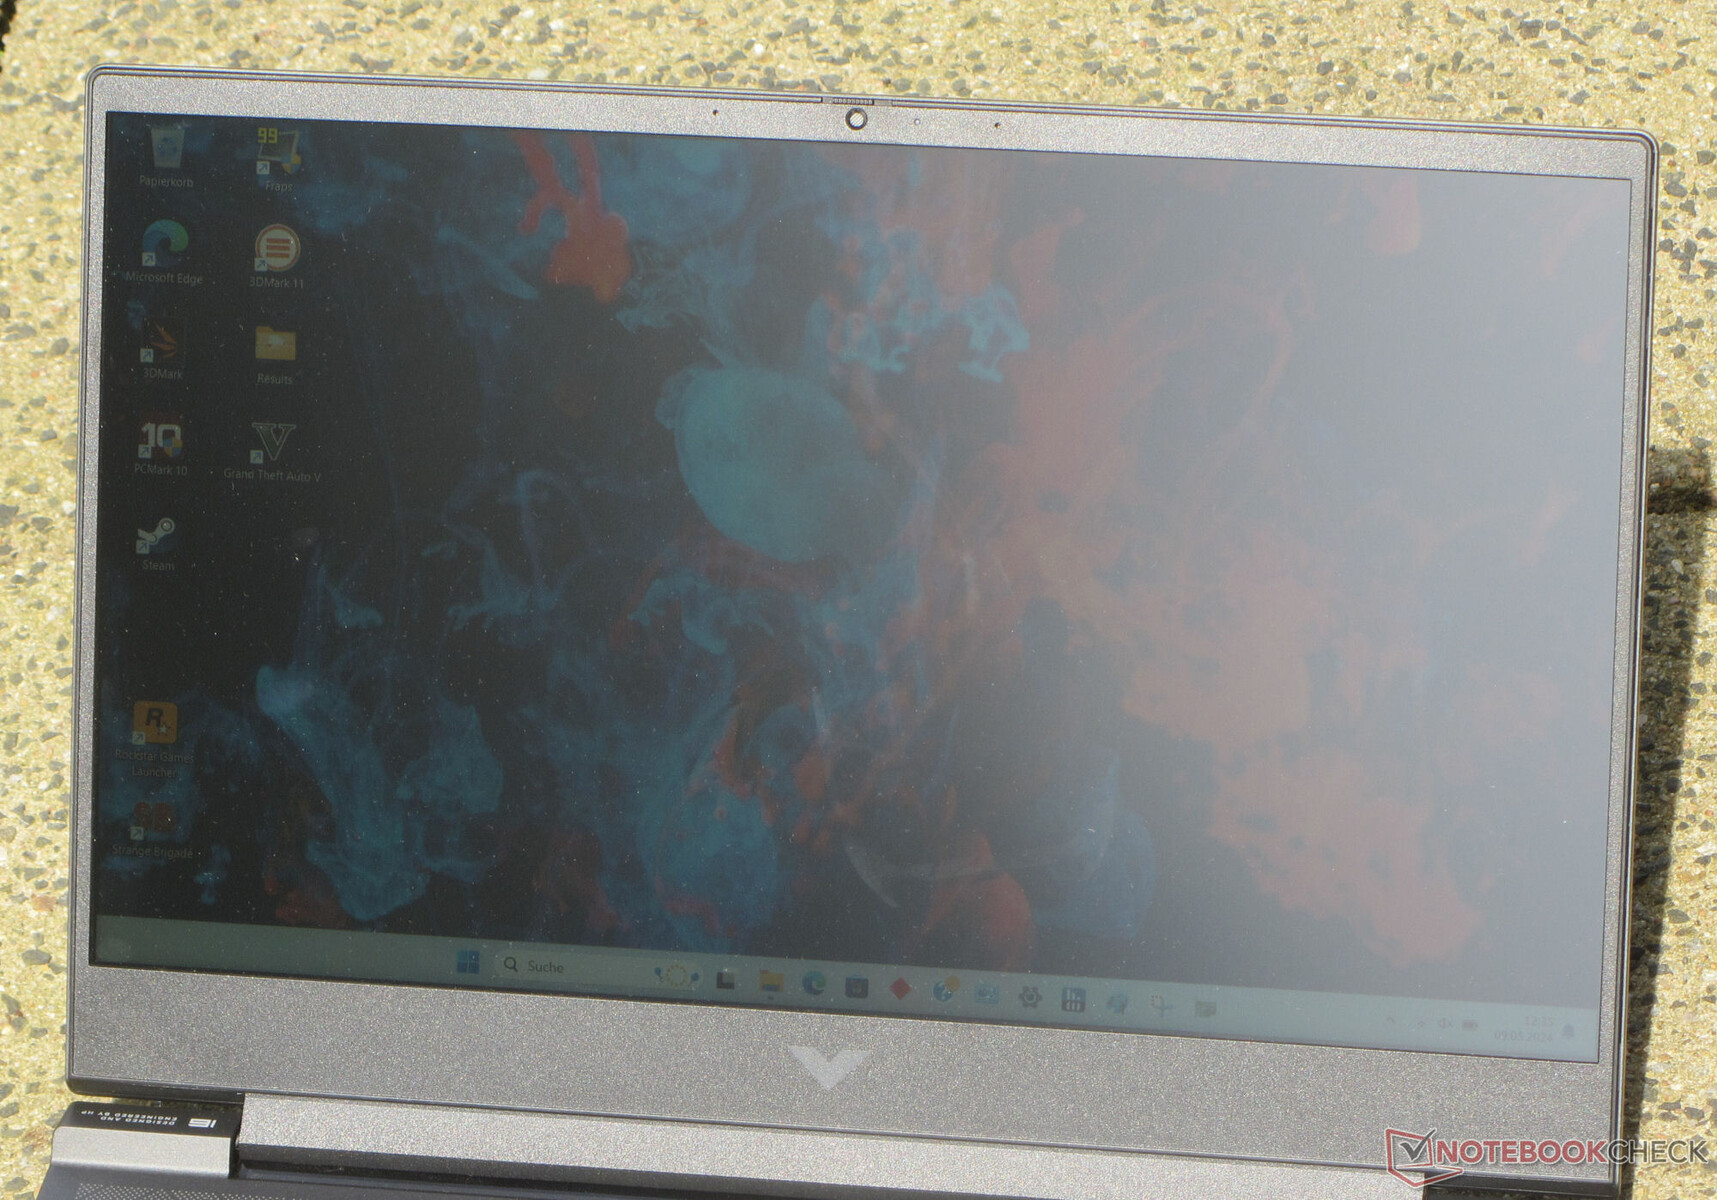
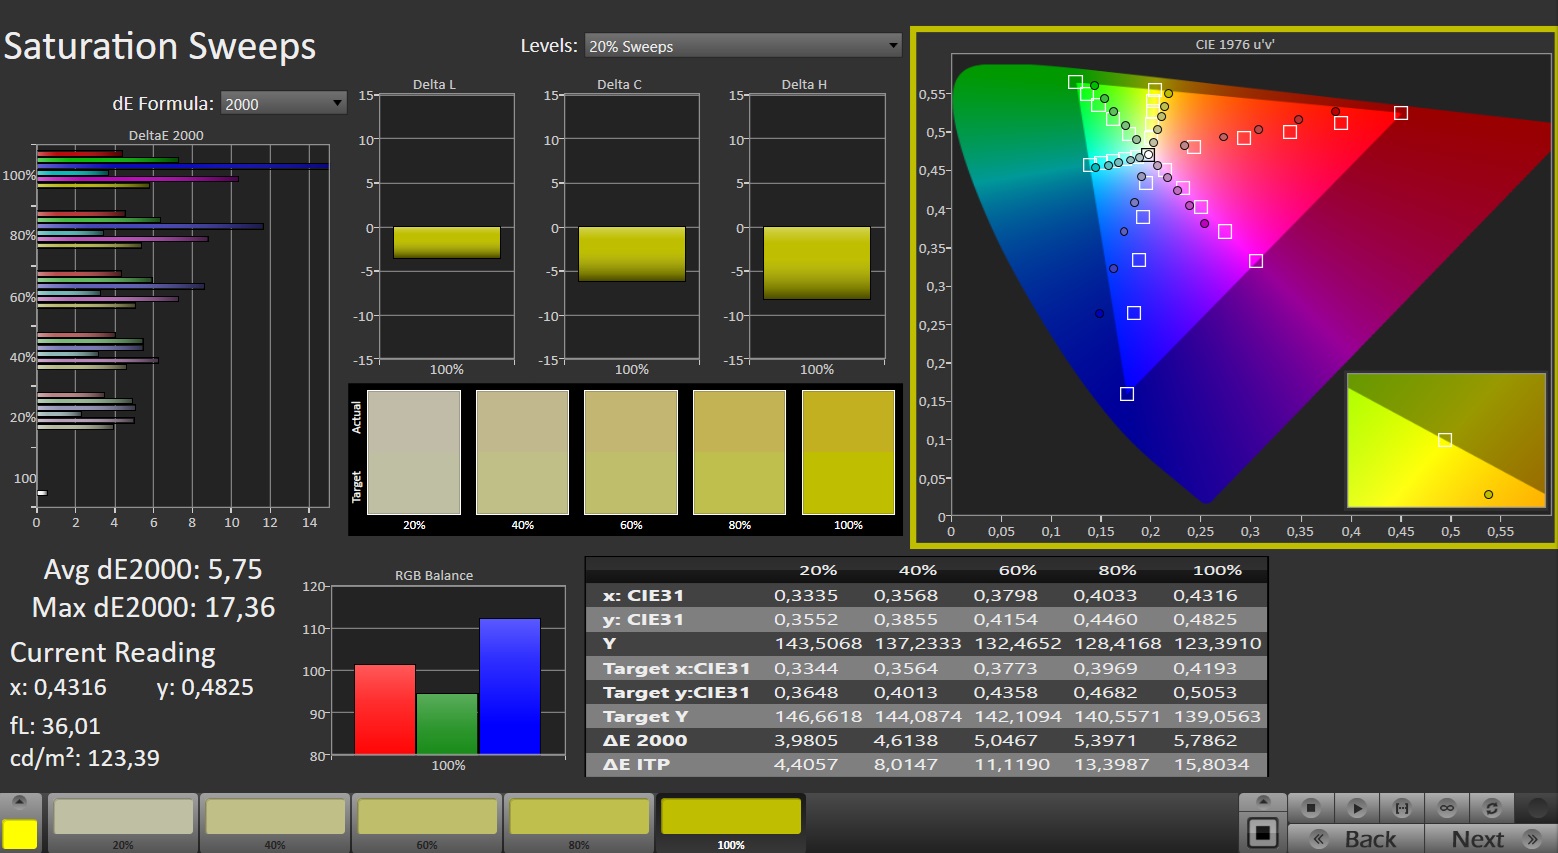
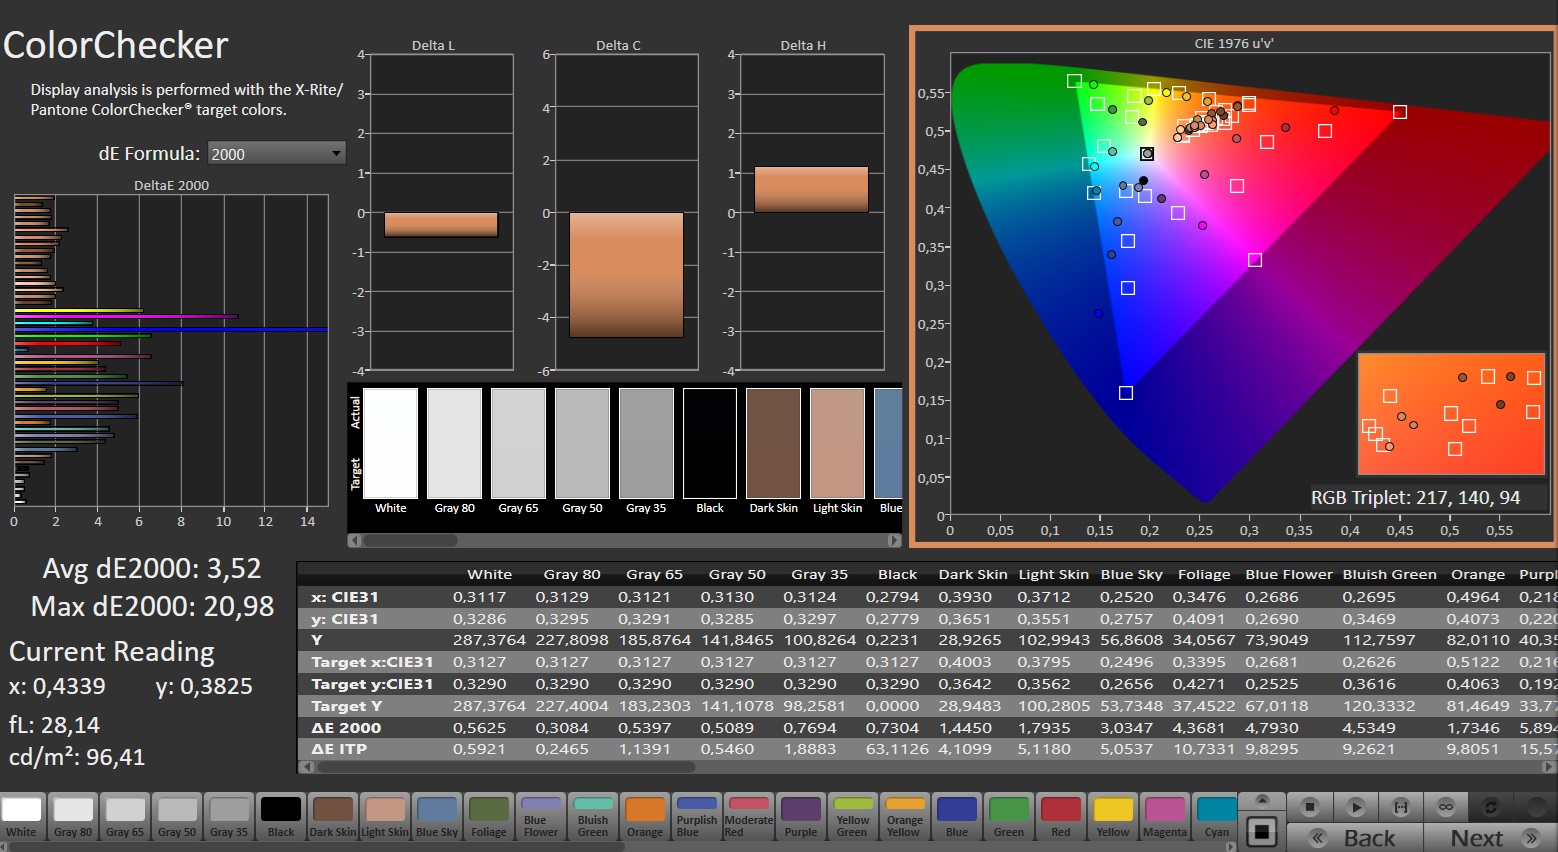
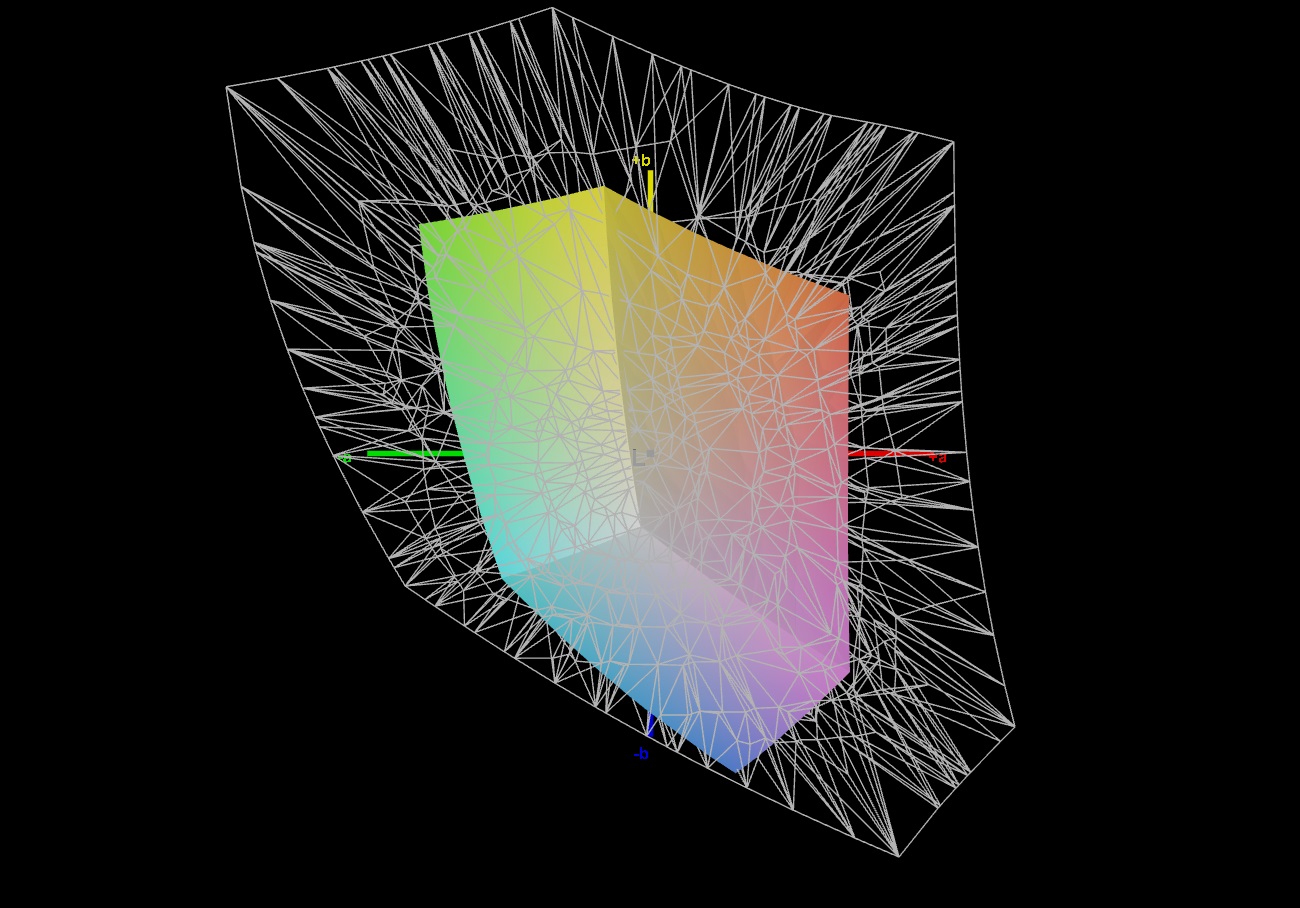
Skärm - IPS-panel med låg färgprecision
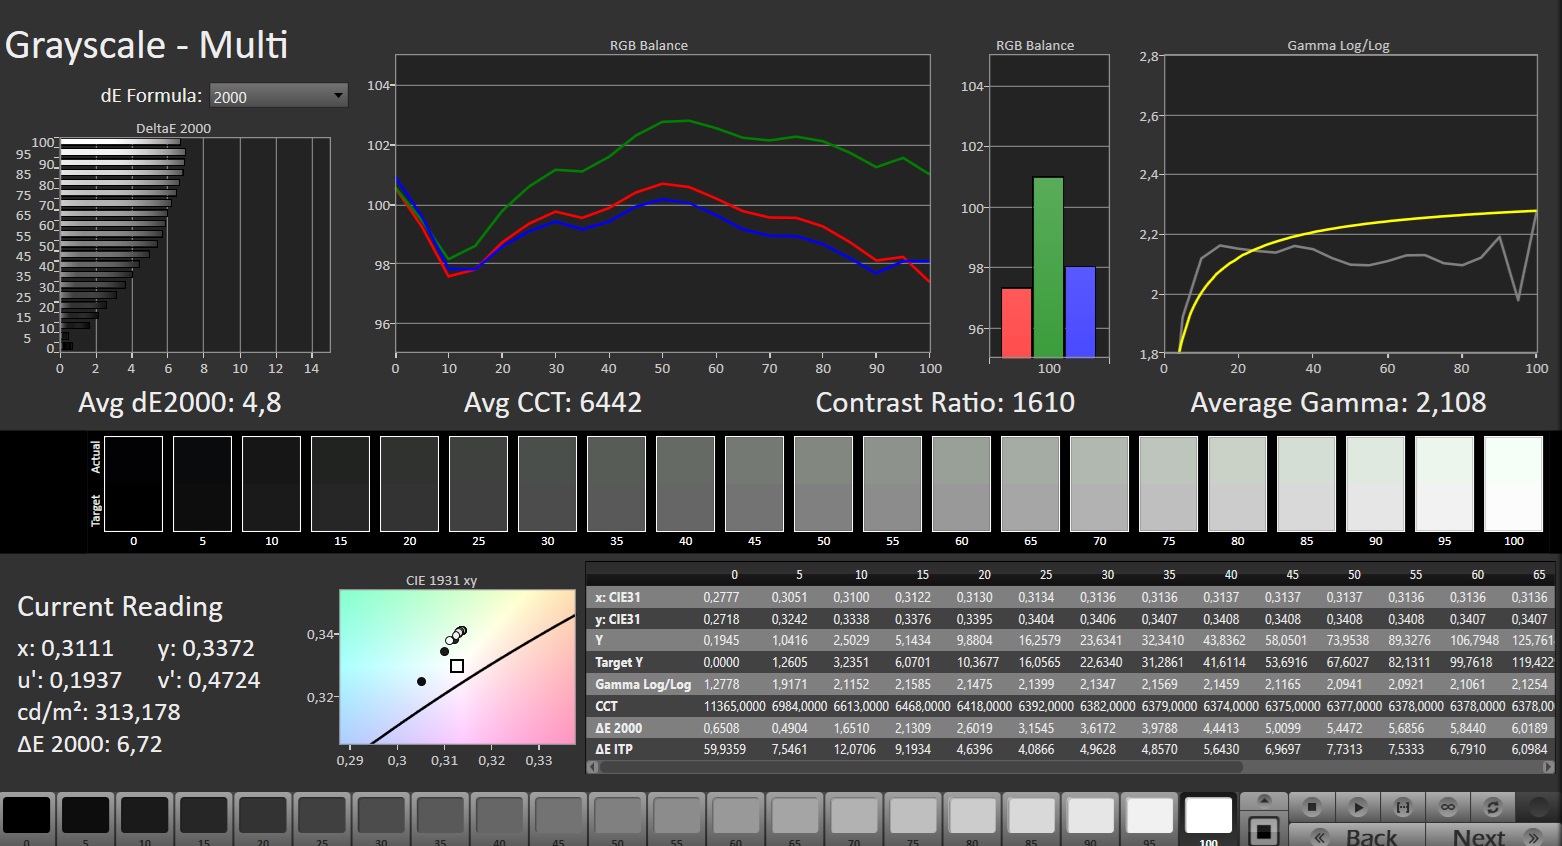
HP har utrustat Victus med en betraktningsvinkelstabil 144 Hz-panel (FHD, IPS) som har ett bildförhållande på 16:9. Den visar inget PWM-flimmer över alla ljusstyrkenivåer. Ljusstyrkan och kontrasten på 16,1-tumsskärmen är utformad för inomhusbruk - målvärdet (> 300 cd/m²) har inte riktigt uppnåtts. Du kan läsa på displayen utomhus så länge solen inte skiner alltför starkt.
| |||||||||||||||||||||||||
Distribution av ljusstyrkan: 86 %
Mitt på batteriet: 287 cd/m²
Kontrast: 1511:1 (Svärta: 0.19 cd/m²)
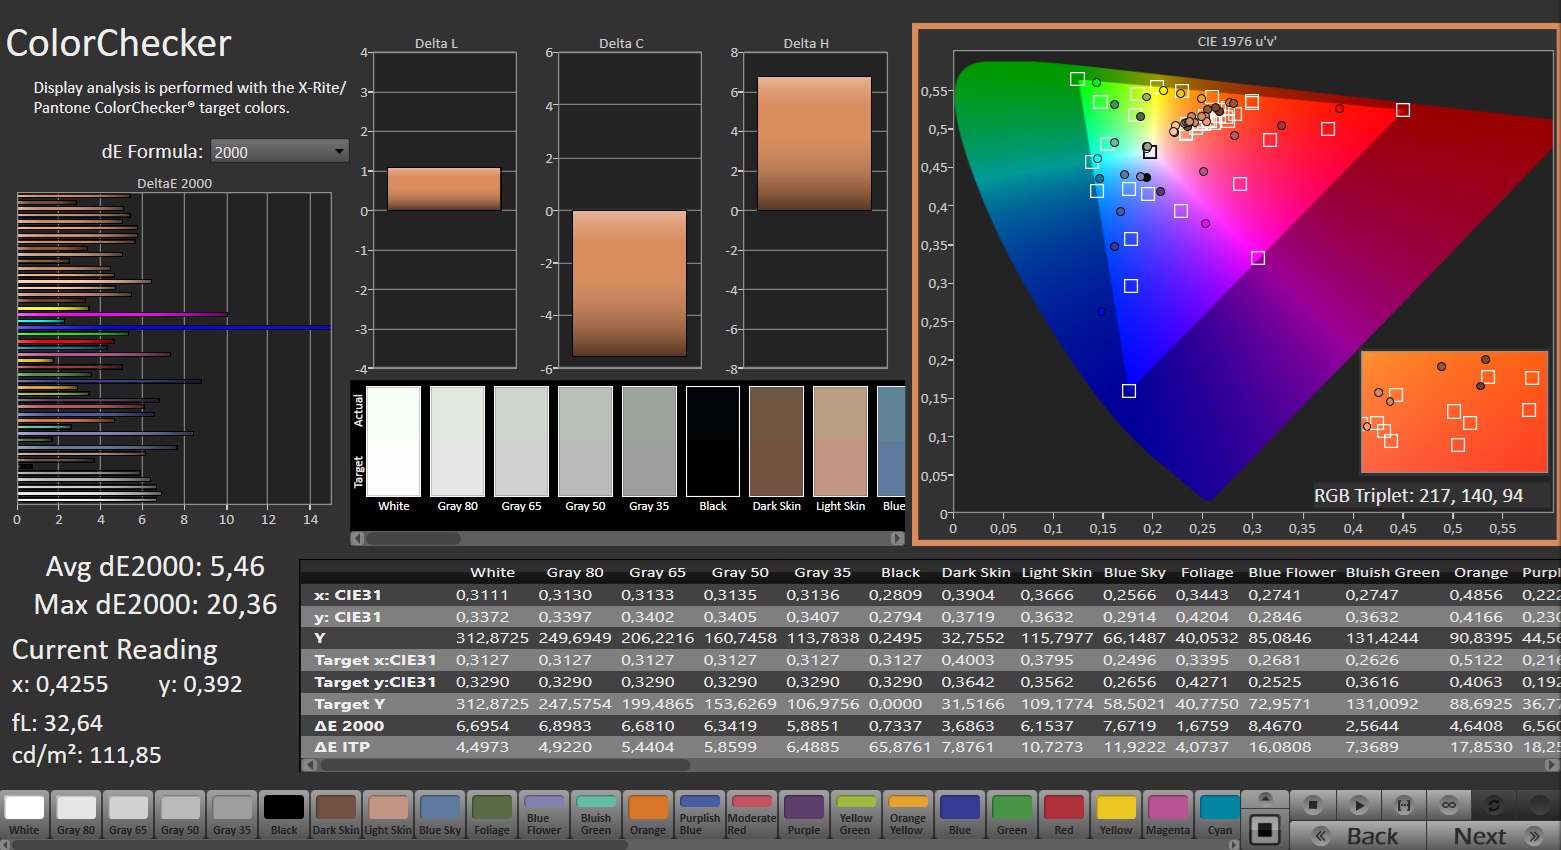
ΔE ColorChecker Calman: 5.46 | ∀{0.5-29.43 Ø4.71}
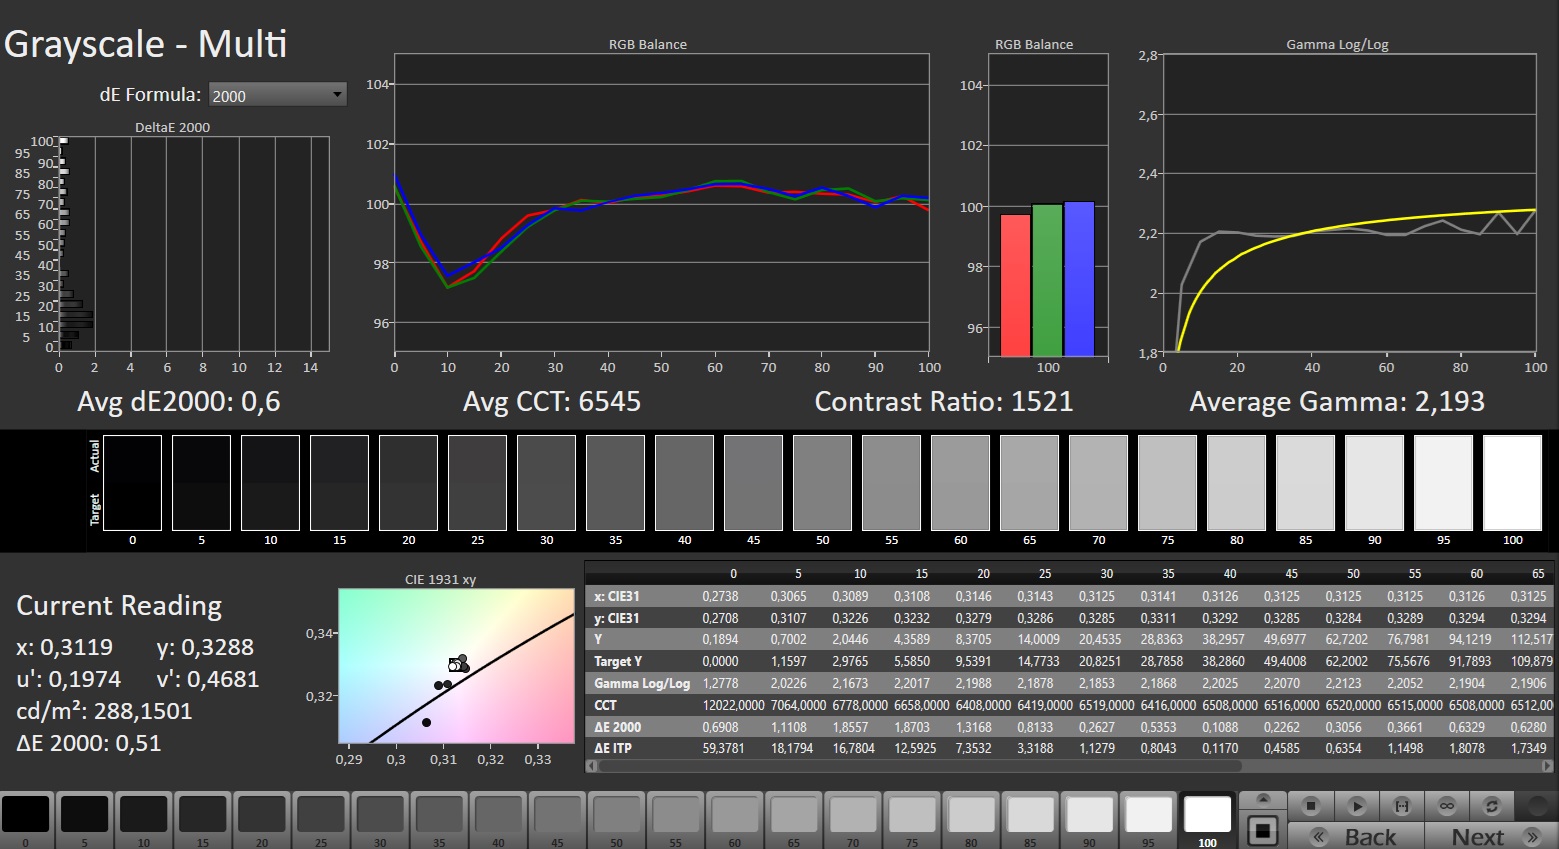
calibrated: 3.52
ΔE Greyscale Calman: 4.8 | ∀{0.09-98 Ø4.96}
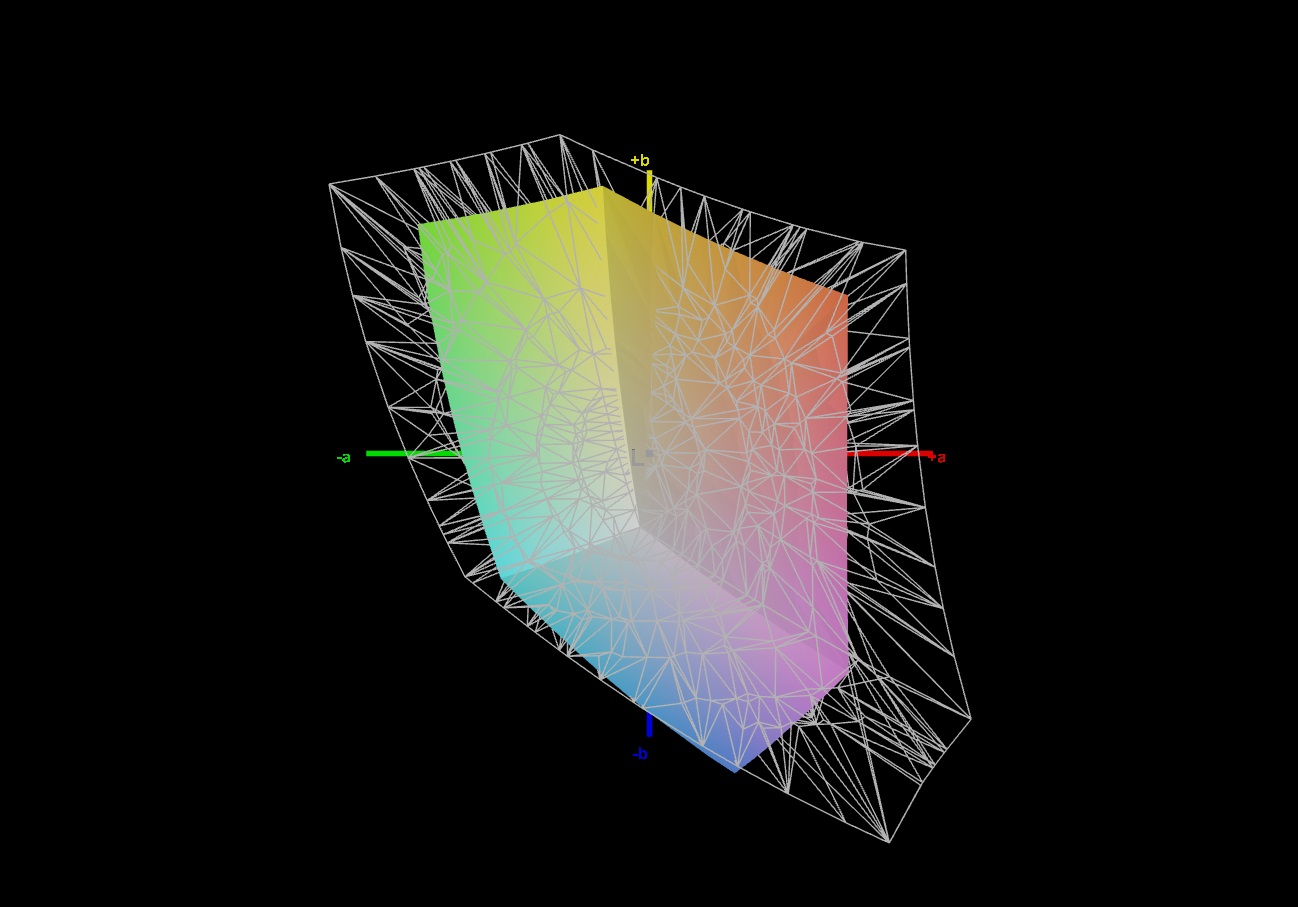
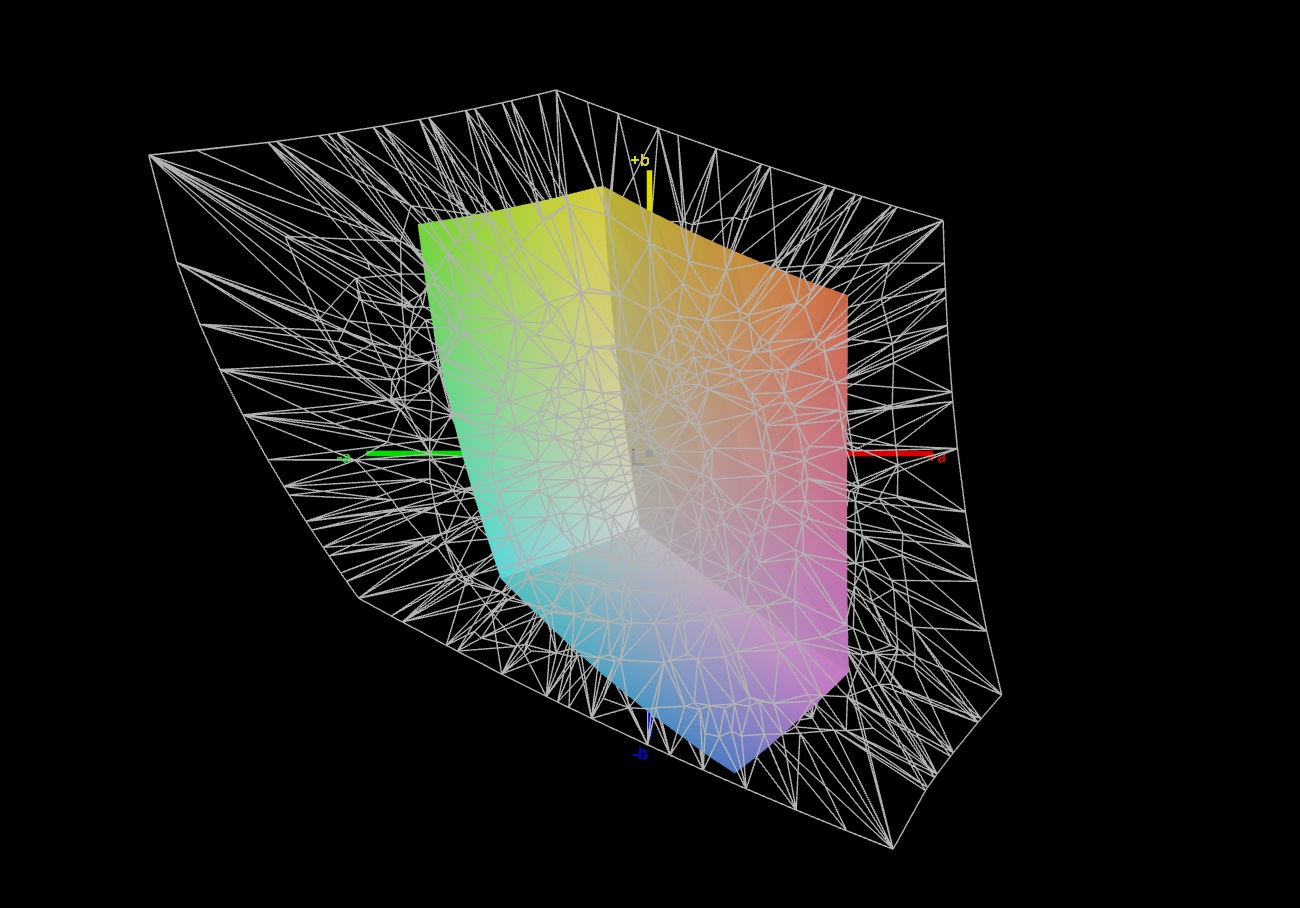
42.7% AdobeRGB 1998 (Argyll 3D)
61.7% sRGB (Argyll 3D)
41.3% Display P3 (Argyll 3D)
Gamma: 2.108
CCT: 6442 K
| HP Victus 16 (2024) Chi Mei CMN163E, IPS, 1920x1080, 16.1" | Gigabyte G6X 9KG (2024) BOE NE160WUM-NX6, IPS, 1920x1200, 16" | Dell G16, i7-13650HX, RTX 4060 Chi Mei CMN161D (160GME), IPS, 2560x1600, 16" | Lenovo Legion 5 16IRX G9 NE160QDM-NZ3, IPS, 2560x1600, 16" | Asus TUF Gaming A16 FA617XS BOE NE160WUM-NX2, IPS, 1920x1200, 16" | |
|---|---|---|---|---|---|
| Display | 1% | 62% | 70% | 64% | |
| Display P3 Coverage (%) | 41.3 | 41.8 1% | 67.5 63% | 72.4 75% | 69.3 68% |
| sRGB Coverage (%) | 61.7 | 62.4 1% | 98.5 60% | 100 62% | 97.3 58% |
| AdobeRGB 1998 Coverage (%) | 42.7 | 43.3 1% | 69.3 62% | 74.1 74% | 70.7 66% |
| Response Times | -29% | 59% | 55% | 46% | |
| Response Time Grey 50% / Grey 80% * (ms) | 28.6 ? | 40.5 ? -42% | 7.6 ? 73% | 12.5 ? 56% | 15.6 ? 45% |
| Response Time Black / White * (ms) | 18.7 ? | 21.6 ? -16% | 10.4 ? 44% | 8.7 ? 53% | 10 ? 47% |
| PWM Frequency (Hz) | |||||
| Screen | 6% | 21% | 45% | 29% | |
| Brightness middle (cd/m²) | 287 | 353 23% | 369 29% | 526 83% | 301 5% |
| Brightness (cd/m²) | 288 | 318 10% | 344 19% | 500 74% | 294 2% |
| Brightness Distribution (%) | 86 | 81 -6% | 89 3% | 87 1% | 94 9% |
| Black Level * (cd/m²) | 0.19 | 0.21 -11% | 0.26 -37% | 0.33 -74% | 0.21 -11% |
| Contrast (:1) | 1511 | 1681 11% | 1419 -6% | 1594 5% | 1433 -5% |
| Colorchecker dE 2000 * | 5.46 | 5.21 5% | 3.04 44% | 1.2 78% | 1.79 67% |
| Colorchecker dE 2000 max. * | 20.36 | 19.95 2% | 5.56 73% | 2.1 90% | 3.48 83% |
| Colorchecker dE 2000 calibrated * | 3.52 | 3.61 -3% | 2.35 33% | 1 72% | 1.2 66% |
| Greyscale dE 2000 * | 4.8 | 3.6 25% | 3.38 30% | 1.3 73% | 2.5 48% |
| Gamma | 2.108 104% | 2.367 93% | 2.47 89% | 2.23 99% | 2.265 97% |
| CCT | 6442 101% | 7138 91% | 6040 108% | 6391 102% | 6157 106% |
| Totalt genomsnitt (program/inställningar) | -7% /
0% | 47% /
35% | 57% /
52% | 46% /
39% |
* ... mindre är bättre
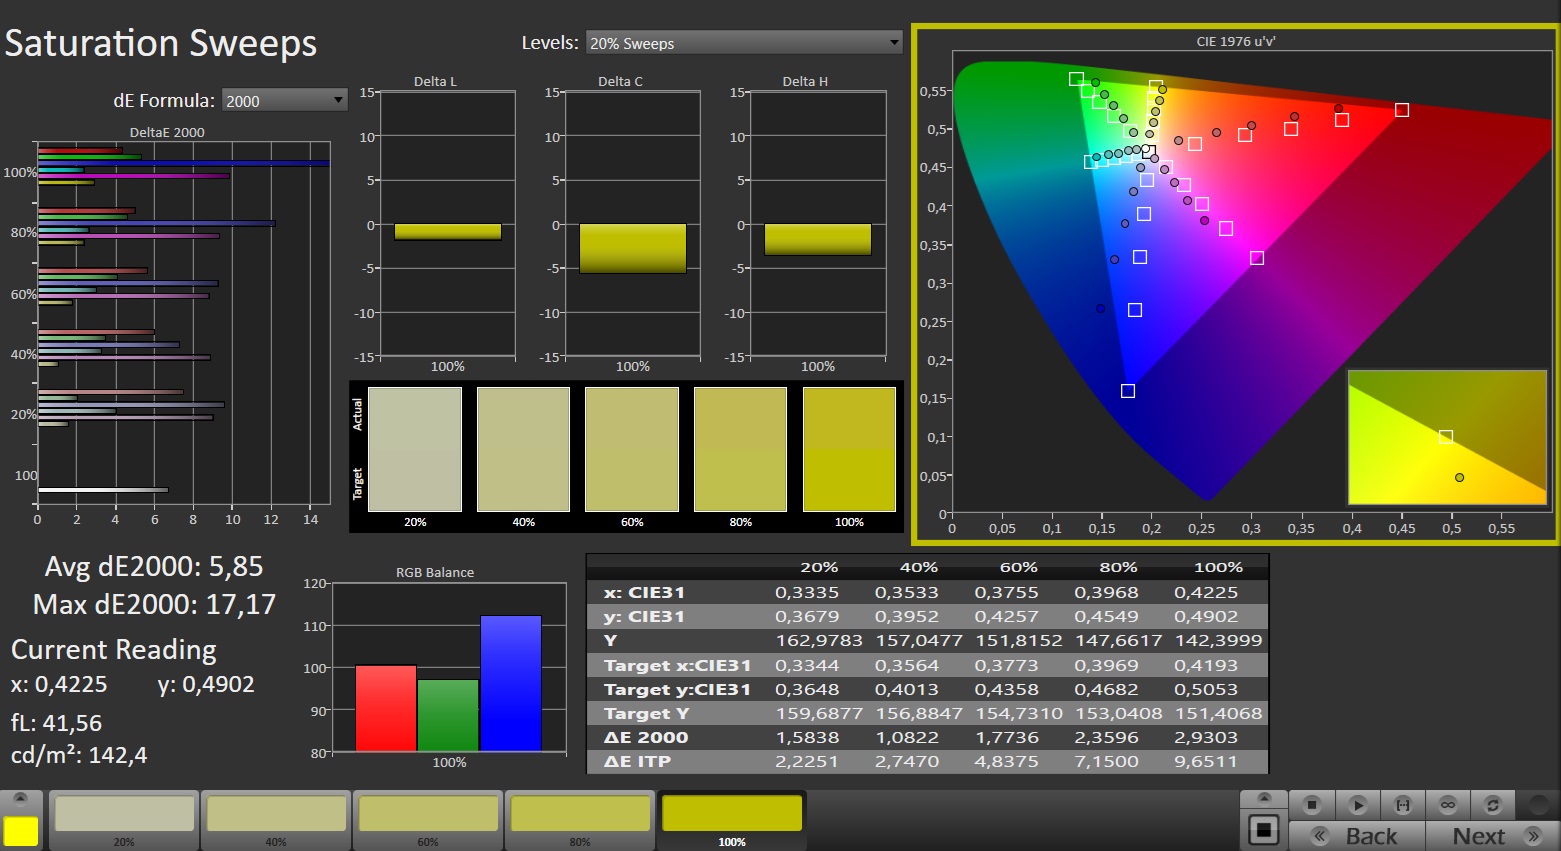
Panelen kan inte återge de vanliga färgrymderna (AdobeRGB, sRGB, DCI-P3). I detta avseende erbjuder skärmarna hos vissa konkurrenter mer. Dess färgåtergivning är inte heller den bästa: Fabriksavvikelsen är 5,5 och en kalibrering minskar värdet till cirka 3,5 - i vilket fall som helst har målet (DeltaE < 3) missats.
Visa svarstider
| ↔ Svarstid svart till vitt | ||
|---|---|---|
| 18.7 ms ... stiga ↗ och falla ↘ kombinerat | ↗ 9.6 ms stiga | 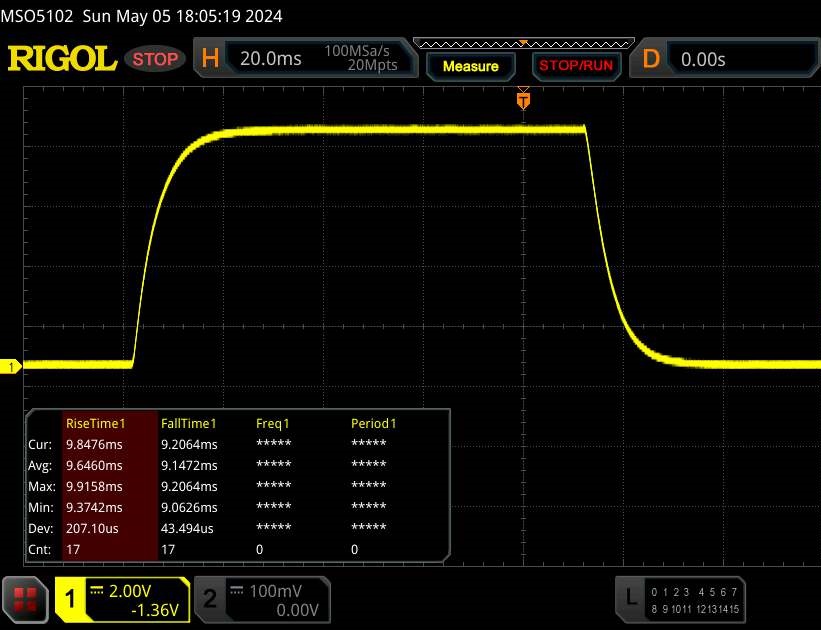 |
| ↘ 9.1 ms hösten | ||
| Skärmen visar bra svarsfrekvens i våra tester, men kan vara för långsam för konkurrenskraftiga spelare. I jämförelse sträcker sig alla testade enheter från 0.1 (minst) till 240 (maximalt) ms. » 42 % av alla enheter är bättre. Det betyder att den uppmätta svarstiden liknar genomsnittet av alla testade enheter (19.8 ms). | ||
| ↔ Svarstid 50 % grått till 80 % grått | ||
| 28.6 ms ... stiga ↗ och falla ↘ kombinerat | ↗ 13.3 ms stiga | 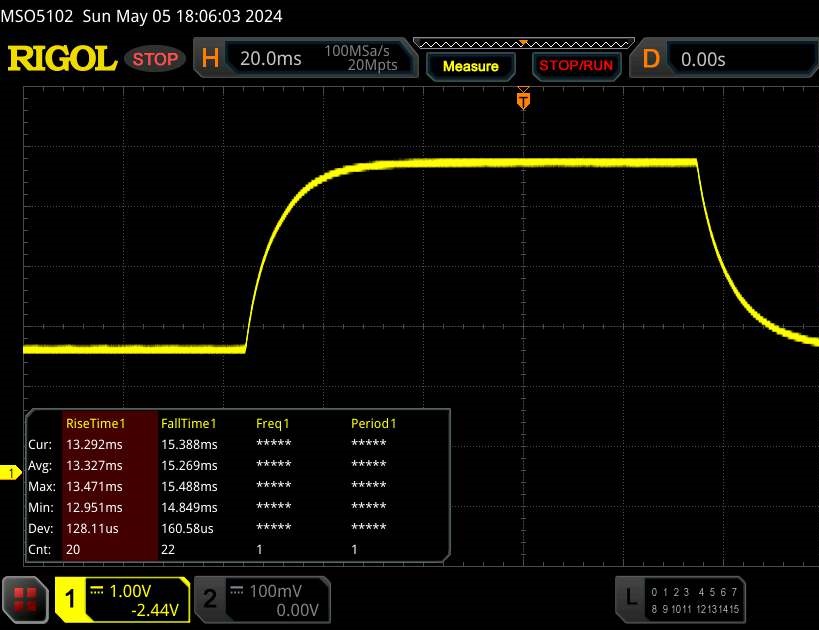 |
| ↘ 15.3 ms hösten | ||
| Skärmen visar relativt långsamma svarsfrekvenser i våra tester och kan vara för långsam för spelare. I jämförelse sträcker sig alla testade enheter från 0.165 (minst) till 636 (maximalt) ms. » 39 % av alla enheter är bättre. Det betyder att den uppmätta svarstiden liknar genomsnittet av alla testade enheter (30.9 ms). | ||
Skärmflimmer / PWM (Puls-Width Modulation)
| Skärmflimmer / PWM upptäcktes inte | 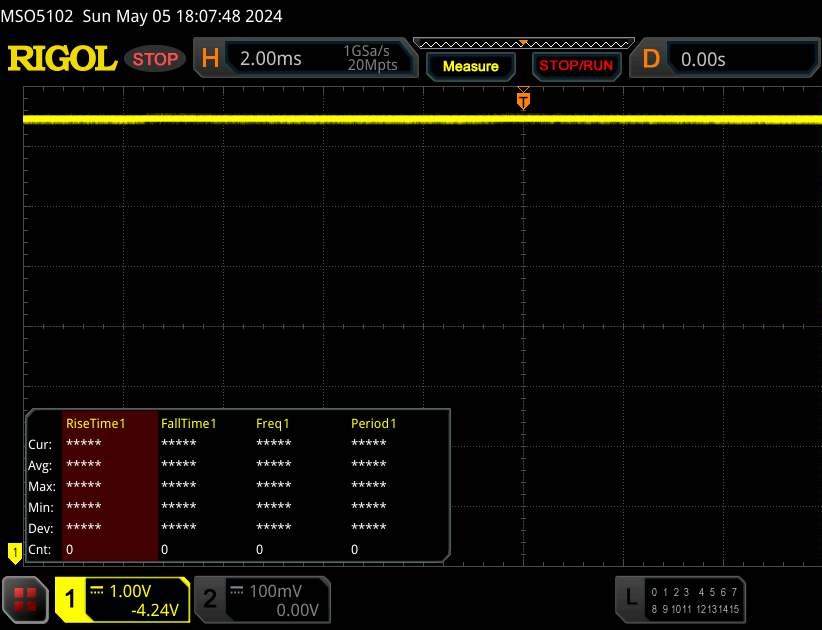 | ||
Som jämförelse: 52 % av alla testade enheter använder inte PWM för att dämpa skärmen. Om PWM upptäcktes mättes ett medelvärde av 7744 (minst: 5 - maximum: 343500) Hz. | |||
Prestanda - Raptor Lake och Ada Lovelace ger ånga
HP erbjuder olika konfigurationsvarianter av Victus 16. Den för närvarande billigaste versionen av Victus 16 r1000-serien finns för cirka 1 300 USD (Core i5-14500HX, GeForce RTX 4050, 16 GB RAM, 512 GB SSD, inget Windows). För den aktuella testenheten skulle du behöva spendera cirka 1 600 USD.
Testförhållanden
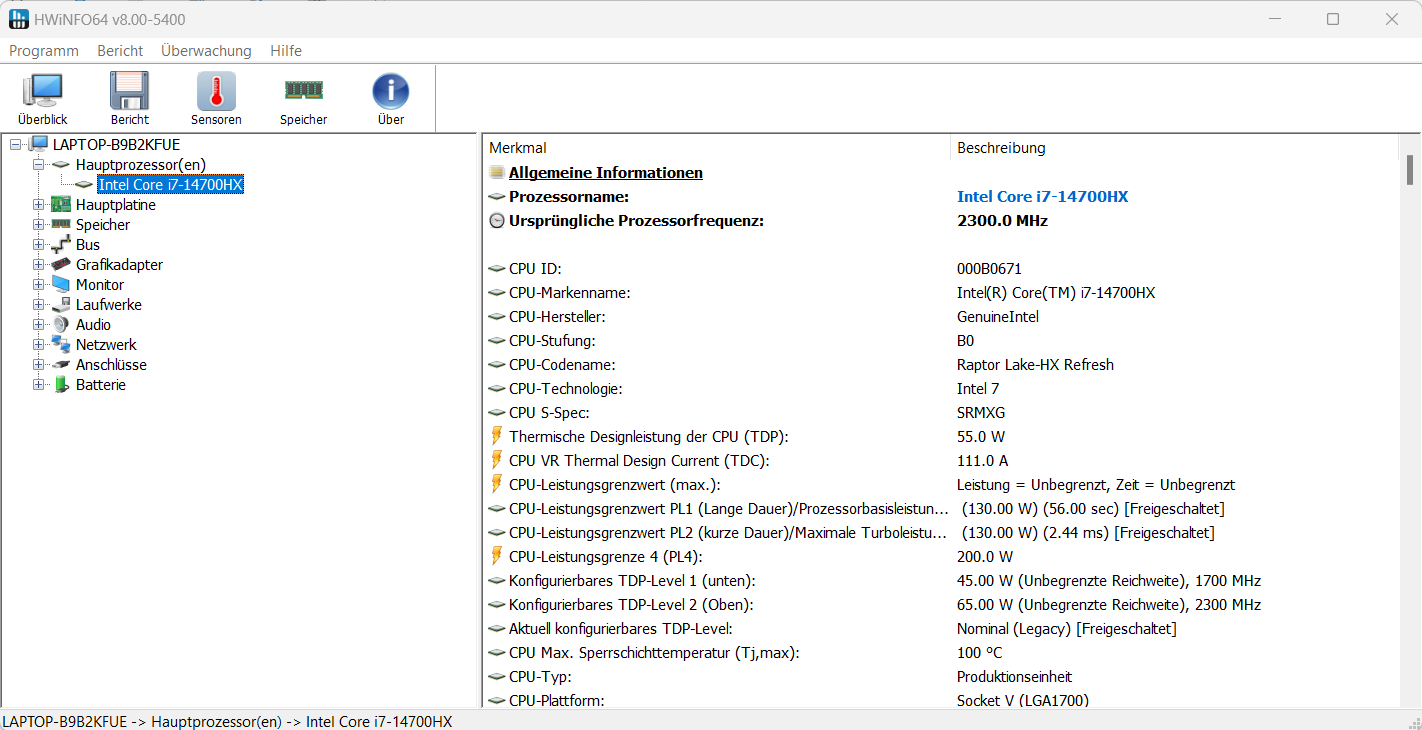
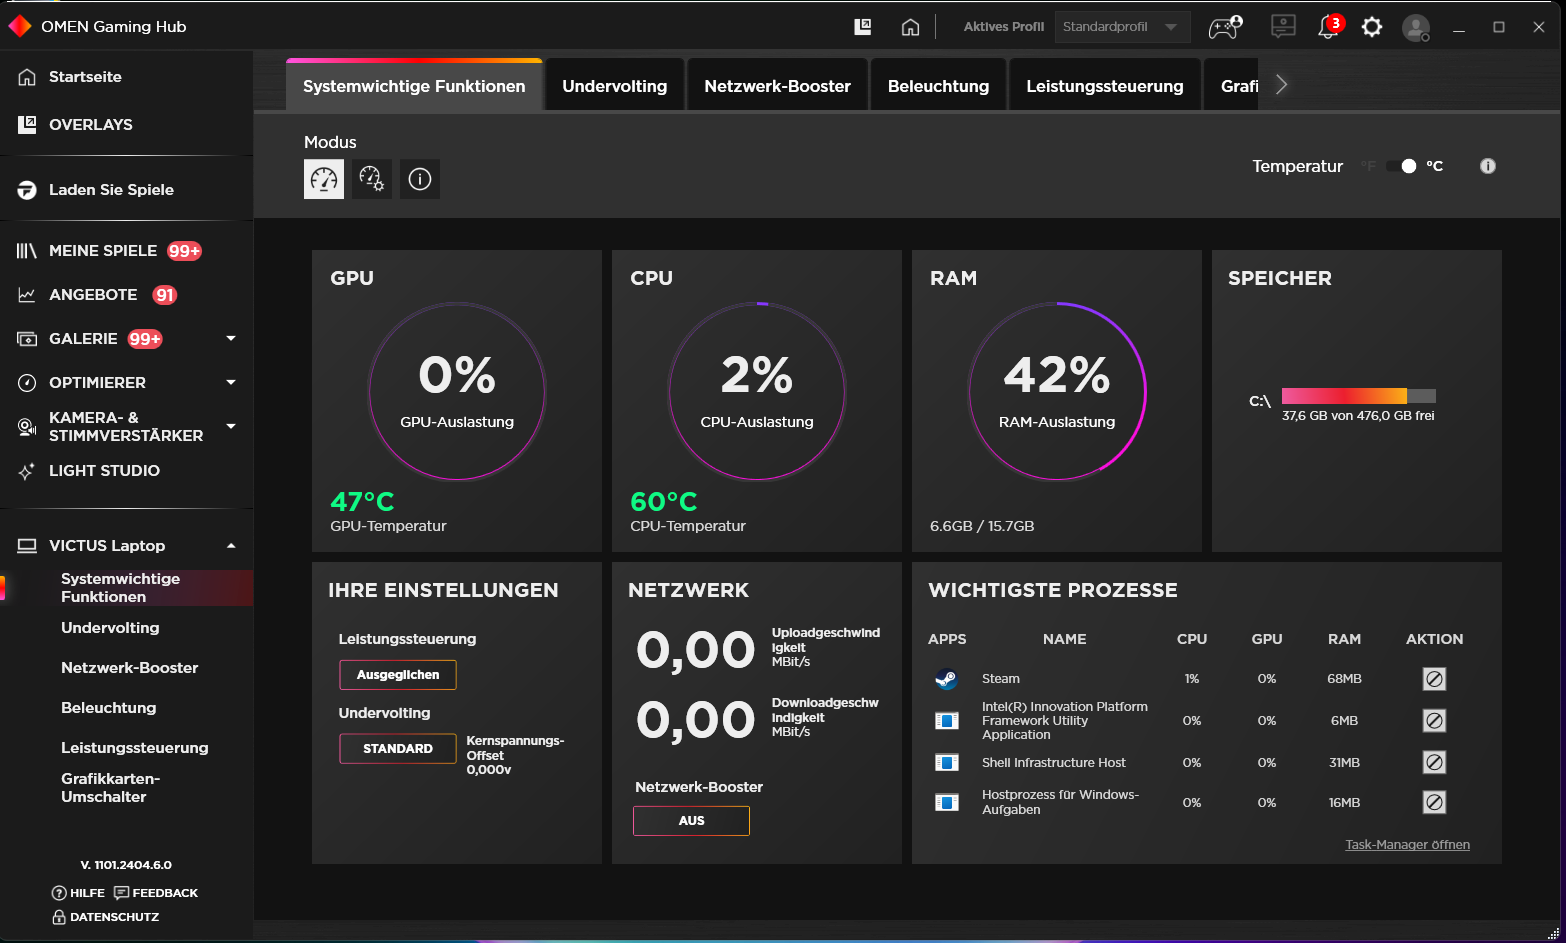
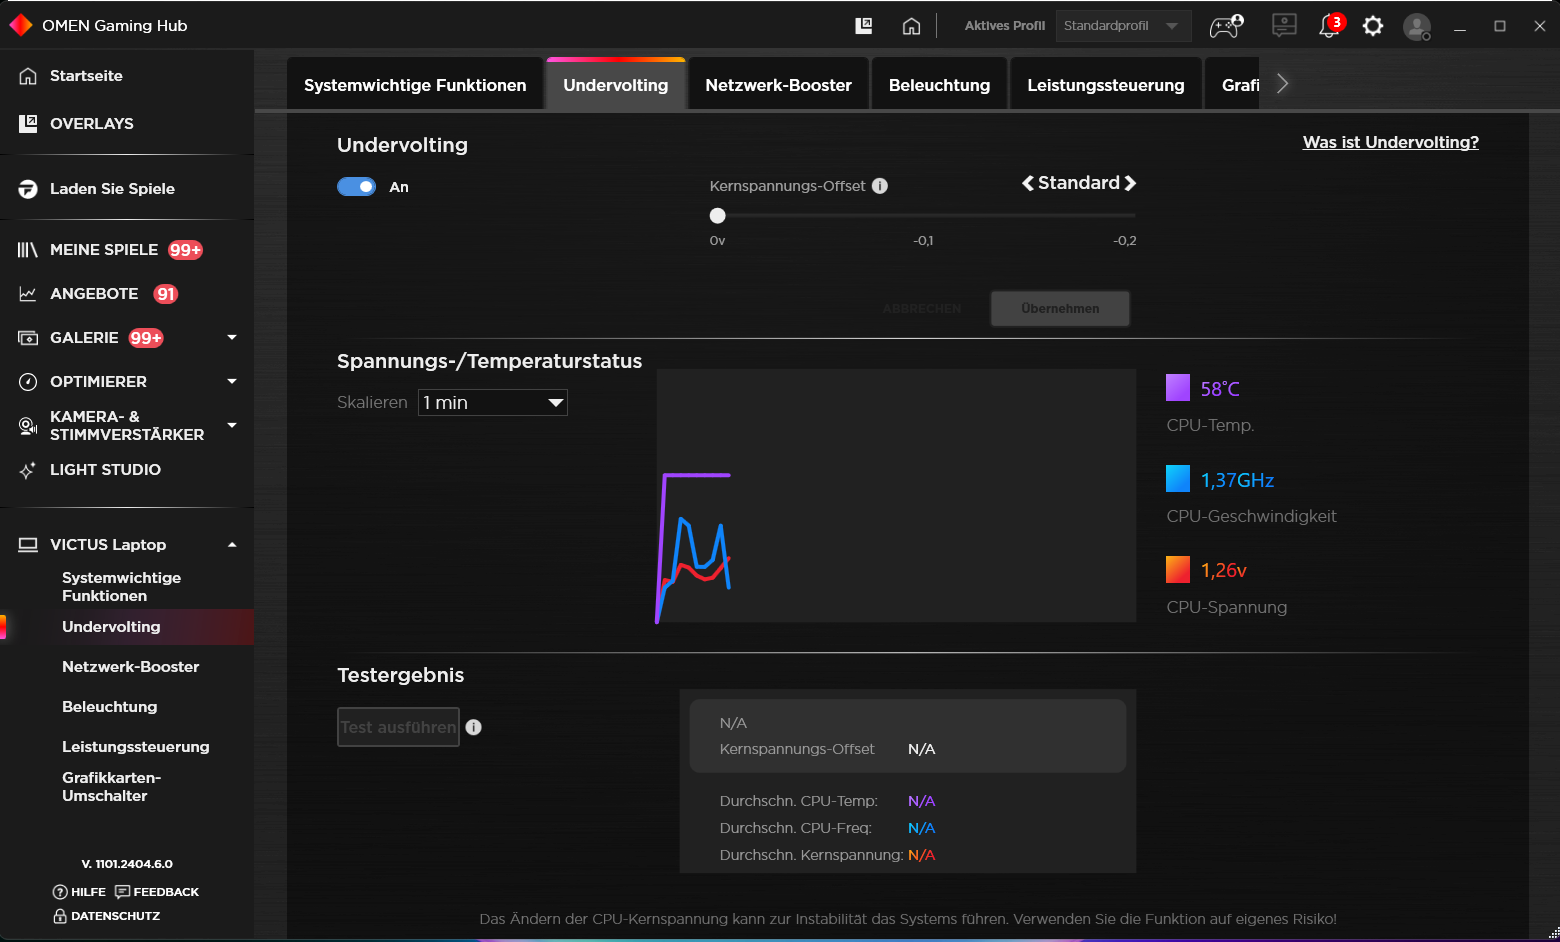
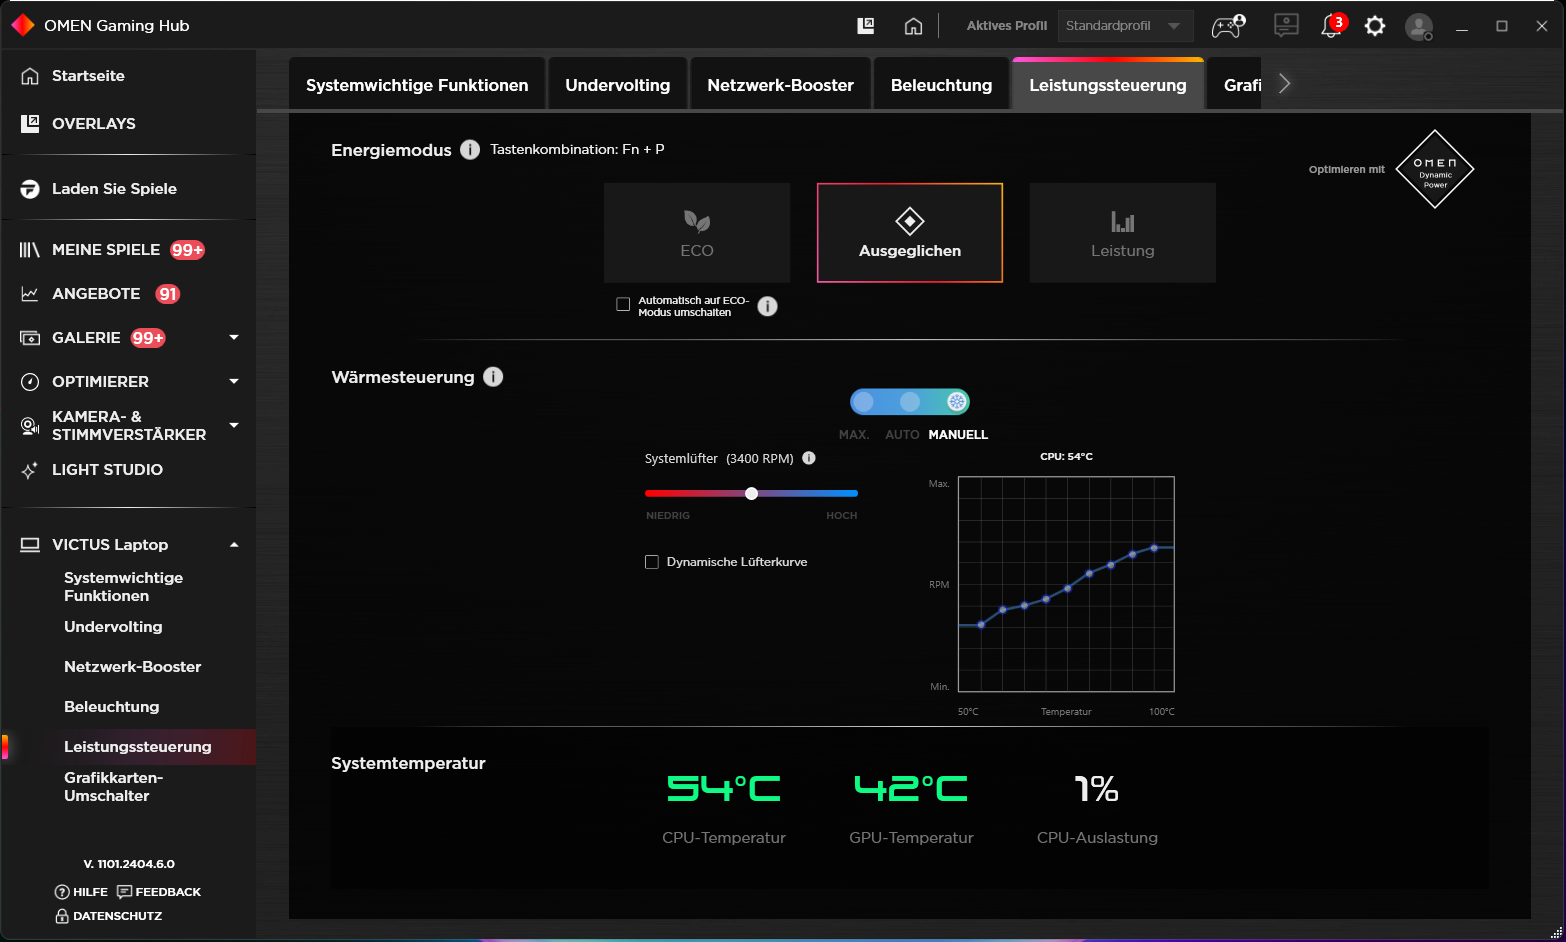
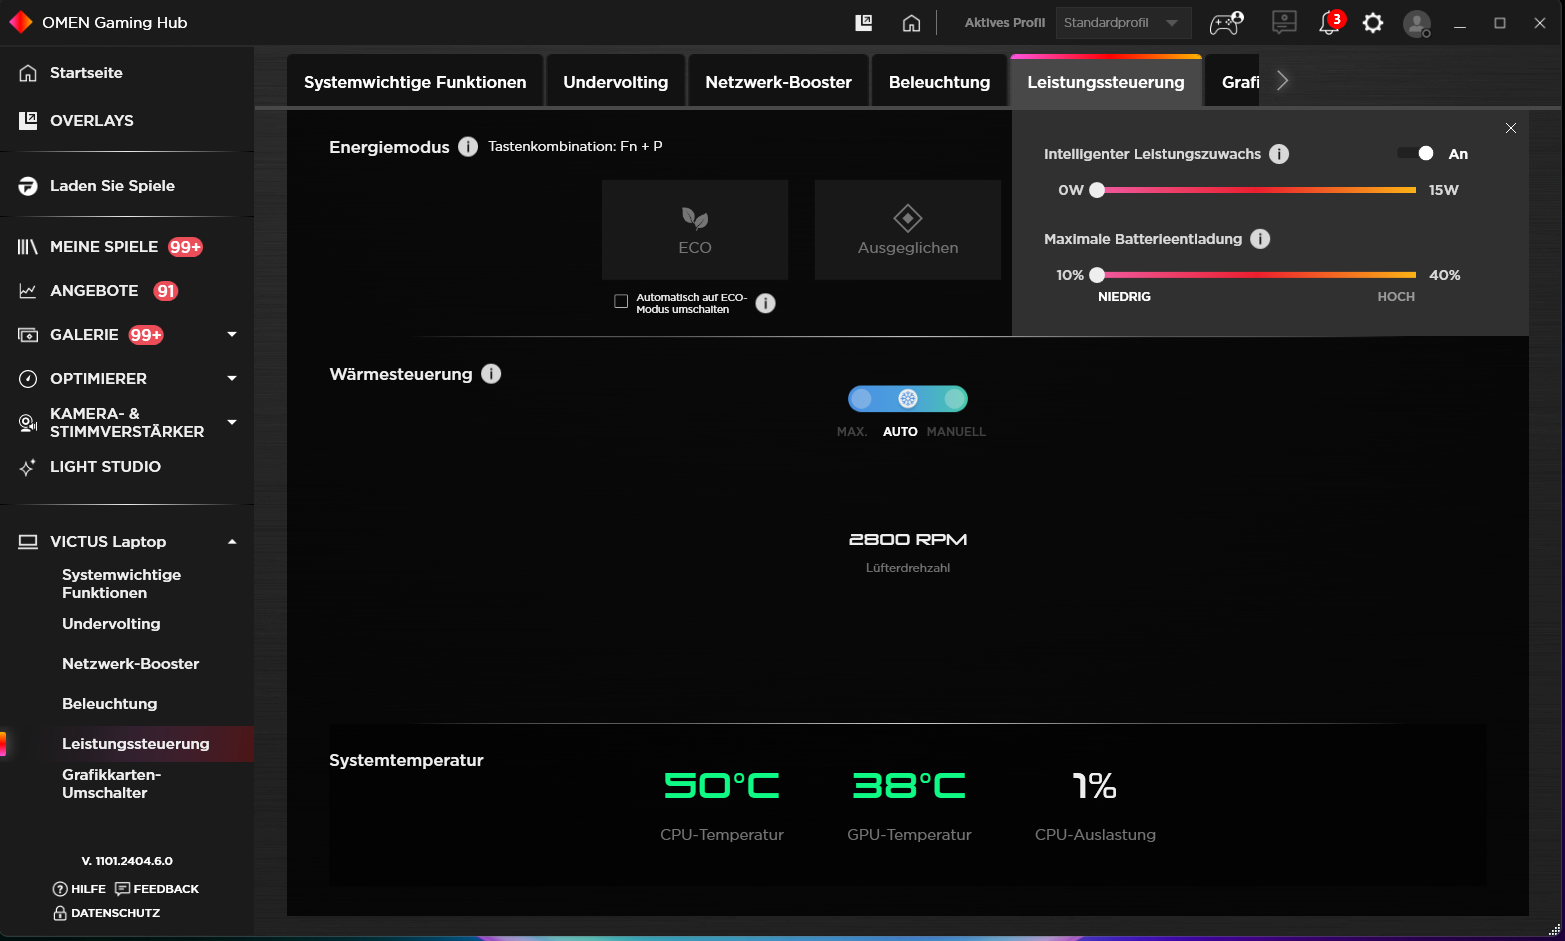
Tre HP-specifika systemlägen (se tabell) finns tillgängliga för användare att välja mellan. Lägena "Balanced" (benchmarks) och "ECO" (batteritester) användes under vårt test. Att snabbt byta läge kan göras via en tangentkombination (Fn + P). "Omen Gaming Hub" (den bärbara datorns kontrollcenter) låter dig också välja läge. Det gör det också möjligt att bland annat undervolta CPU:n och ställa in en individuell fläktkurva.
| Balanserad | Prestanda | Eco | |
|---|---|---|---|
| Power Limit 1 (HWInfo) | 130 watt | 130 watt | 130 watt |
| Power Limit 2 (HWInfo) | 130 watt | 130 watt | 130 watt |
| Prestanda (Witcher 3) | 98 fps | 100 fps | 60 fps (låst) |
| Buller (Witcher 3) | 43 dB(A) | 52 dB(A) | 38 dB(A) |
Processor
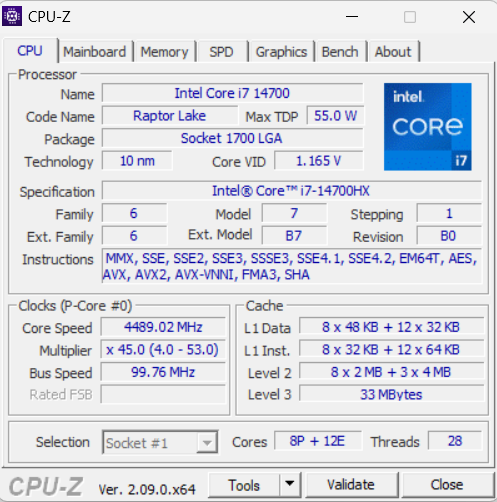
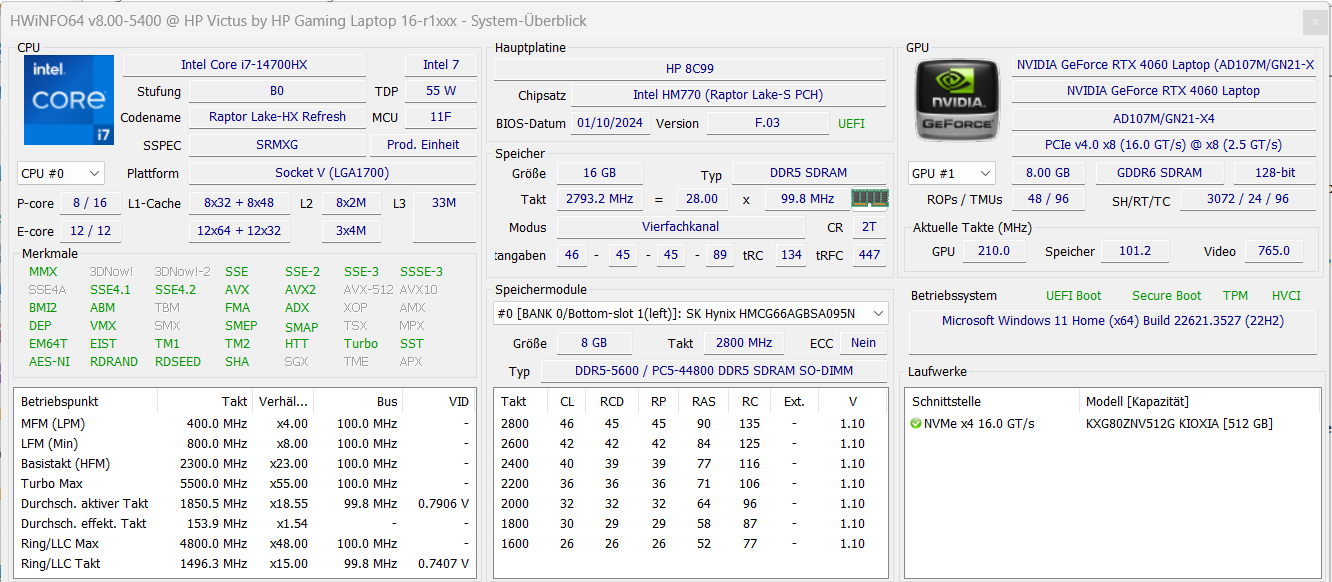
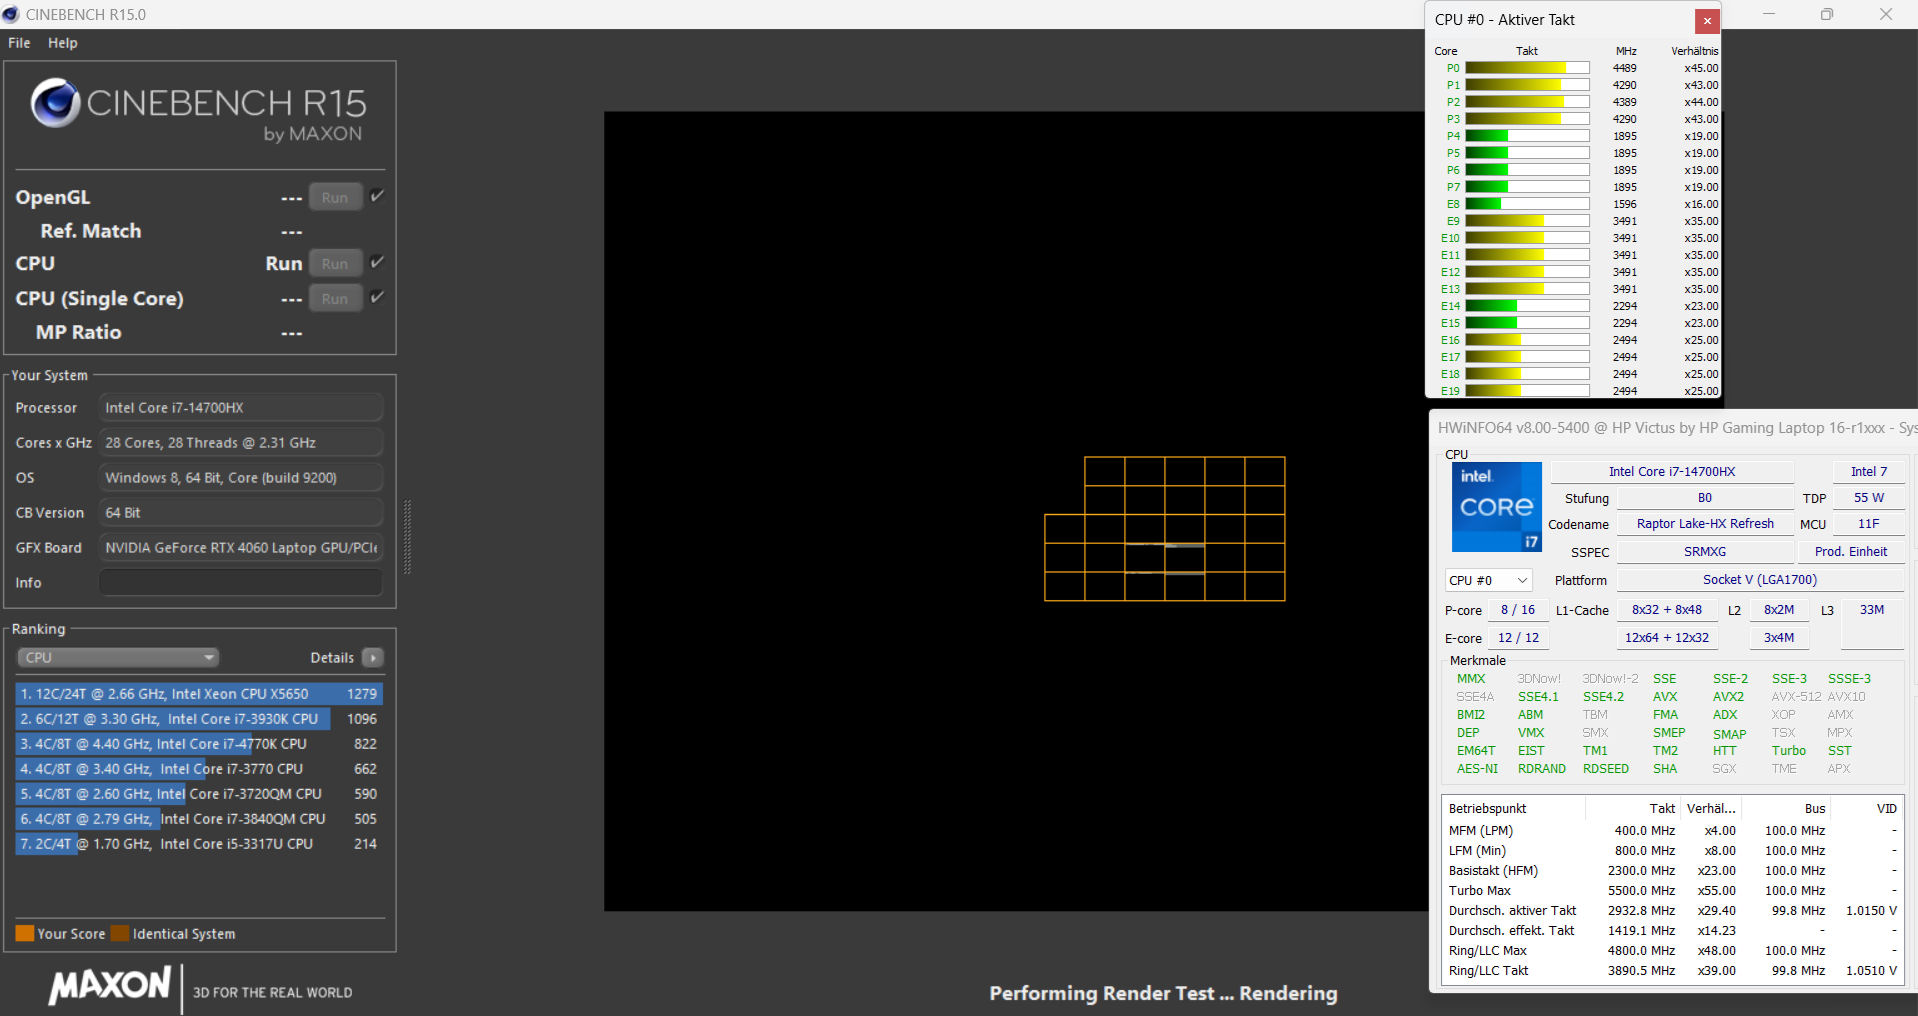
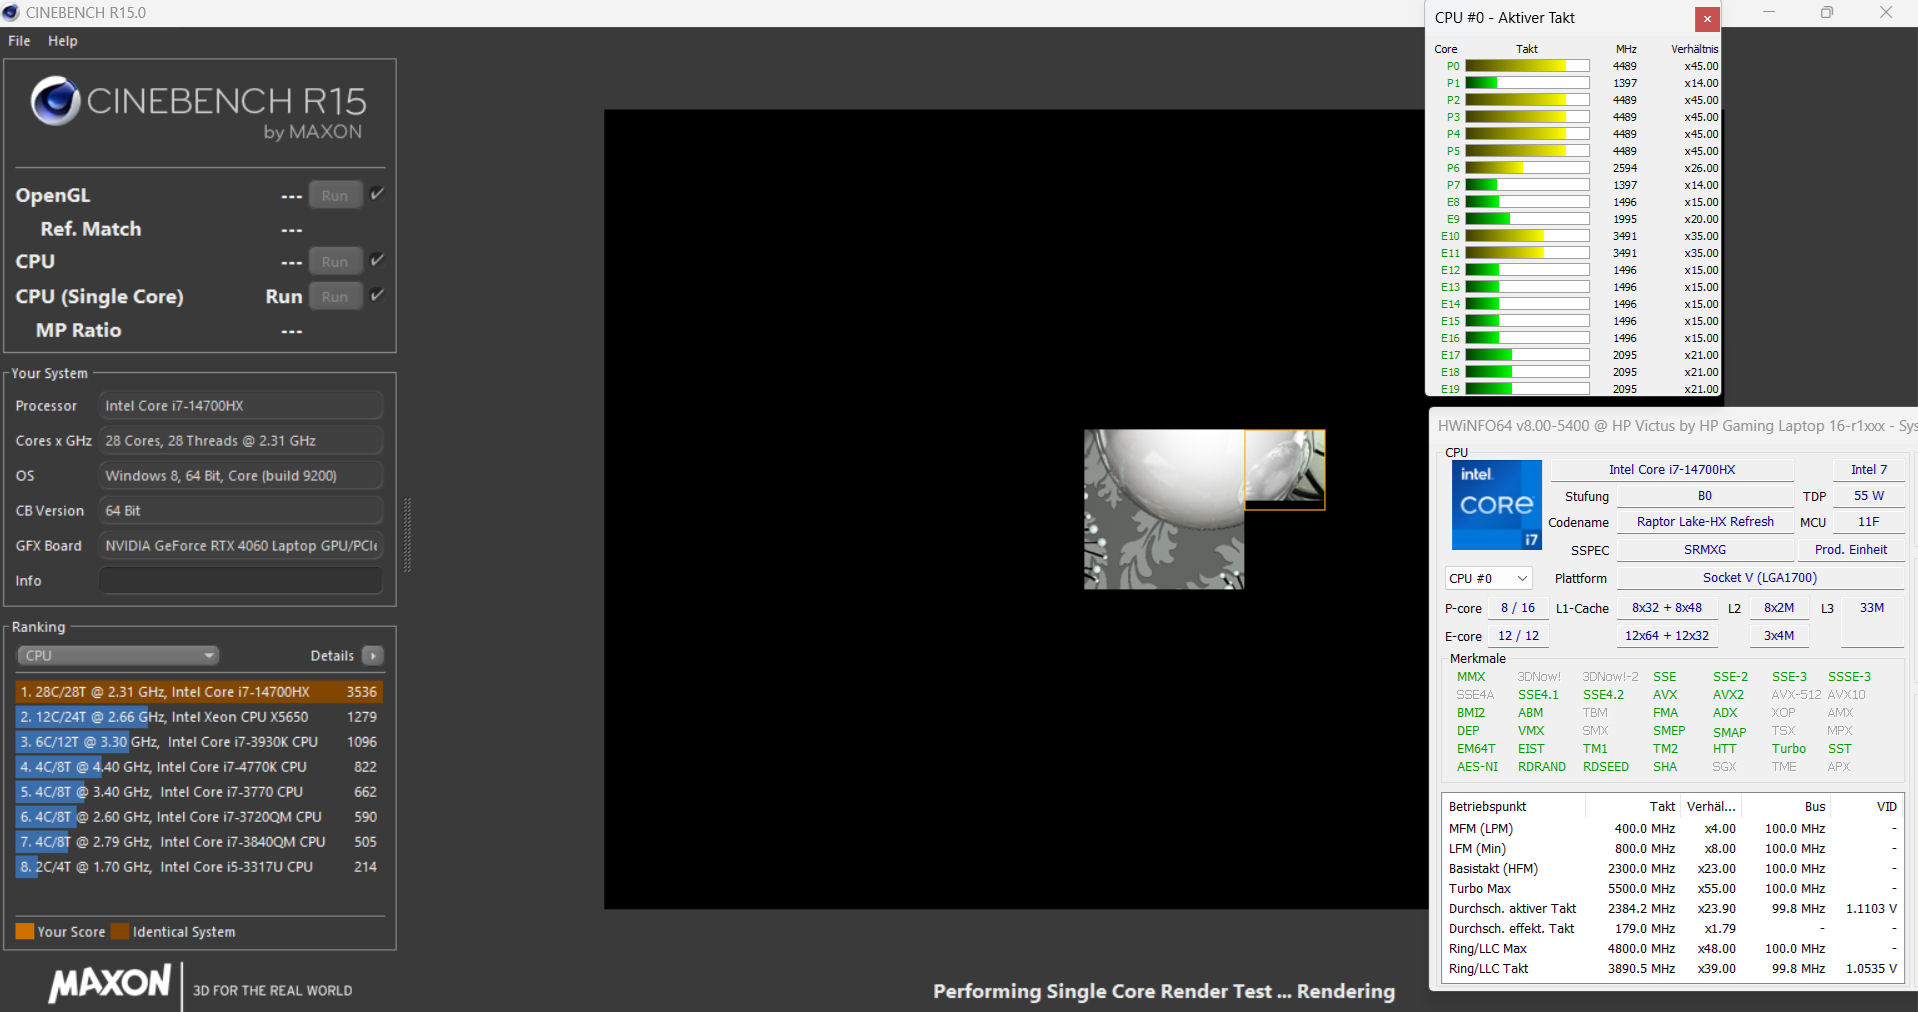
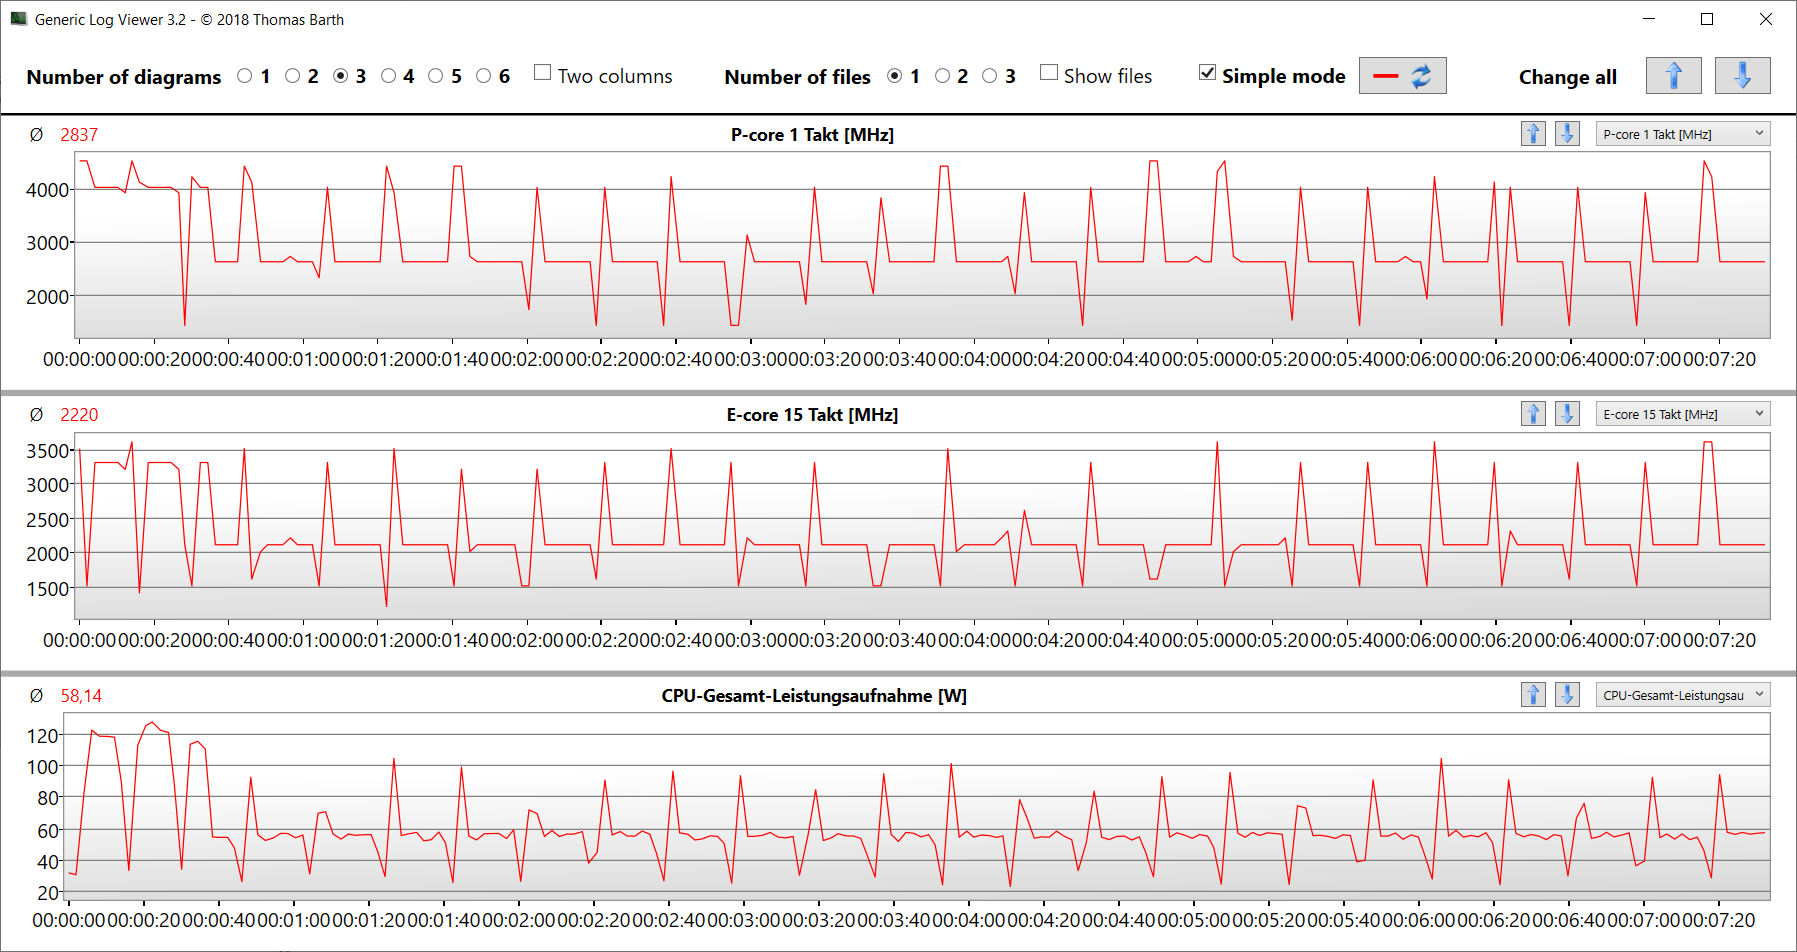
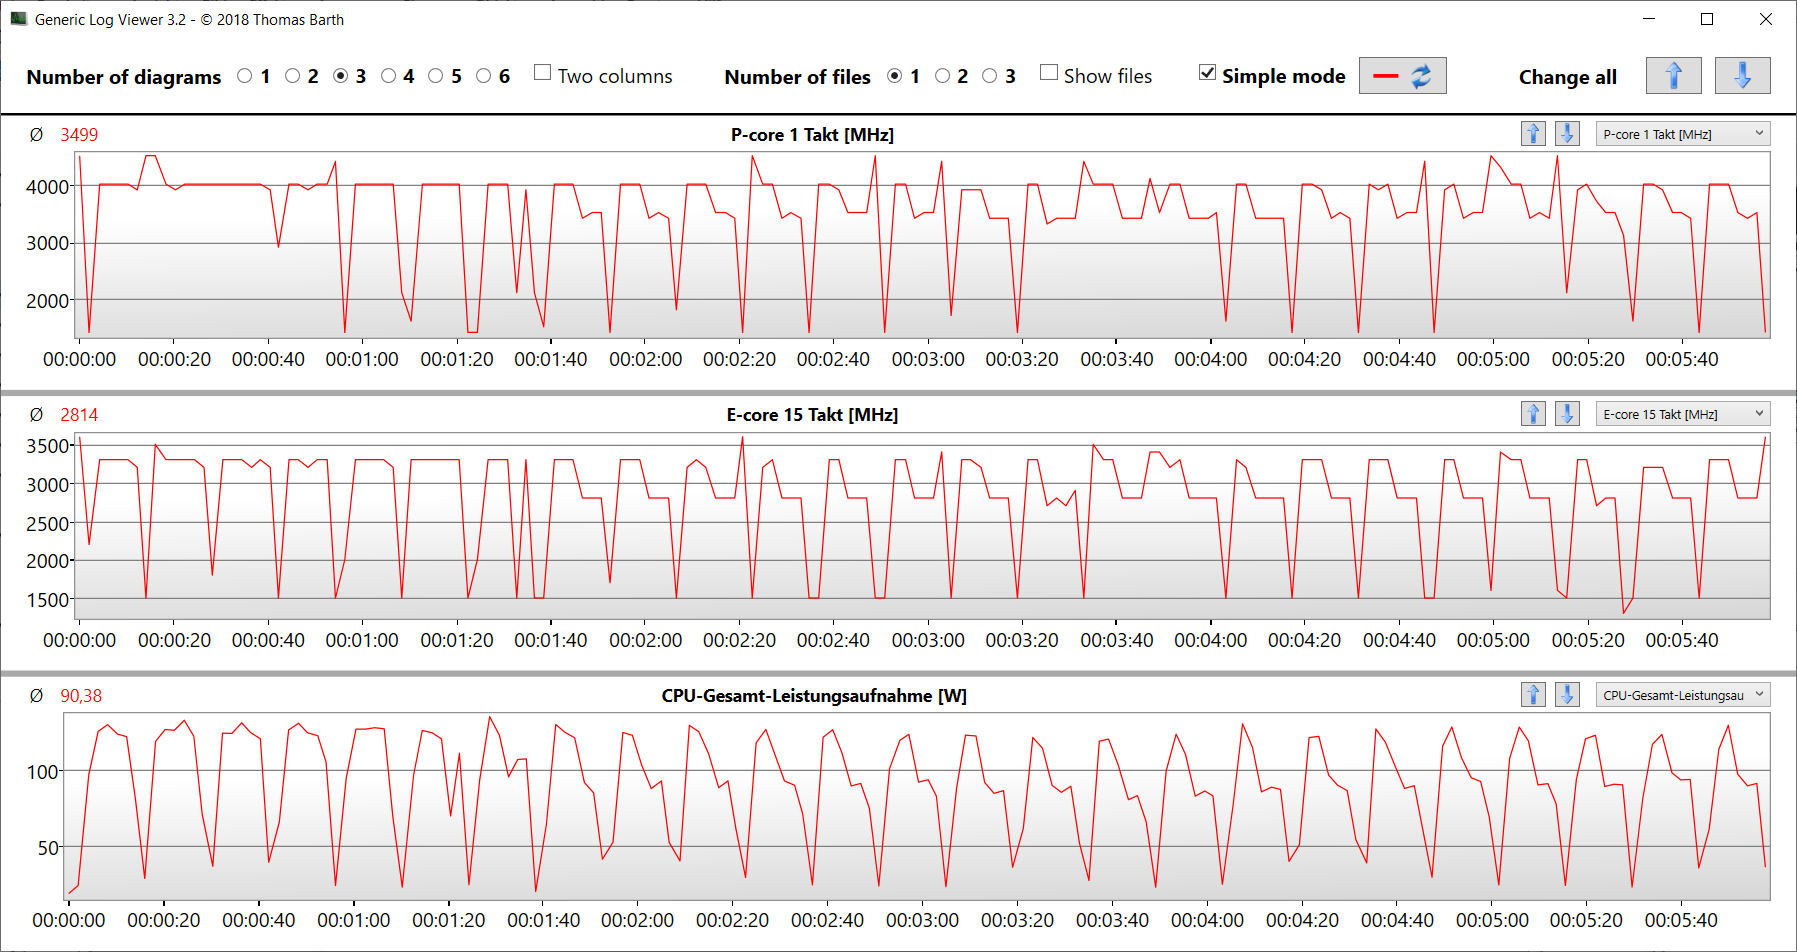
Core Core i7-14700HXs (Raptor Lake) 20 CPU-kärnor (8P + 12E = 28 trådar) uppnår maximala klockfrekvenser på 5,5 GHz (P) och 3,9 GHz (E). Permanent belastning med flera trådar (CB15 Loop) gör att klockfrekvensen sjunker från första till fjärde körningen ("Balanced"). Efter detta håller den en konstant nivå. "Performance" resulterar i en permanent högre klockfrekvens.
Benchmarkresultaten var en liten besvikelse: Trots fyra extra CPU-kärnor och högre klockfrekvenser kunde CPU:n inte distansera sig från Legion 5 16IRX G9's Core i7-14650HX. Dess multi-thread prestanda är praktiskt taget densamma, medan 14650HX är den klara vinnaren när det gäller single-thread prestanda.
Cinebench R15 Multi continuous test
| CPU Performance rating - Percent | |
| Genomsnitt av klass Gaming | |
| Lenovo Legion 5 16IRX G9 | |
| Genomsnitt Intel Core i7-14700HX | |
| HP Victus 16 (2024) | |
| HP Victus 16 (2024) | |
| Dell G16, i7-13650HX, RTX 4060 | |
| Gigabyte G6X 9KG (2024) | |
| Asus TUF Gaming A16 FA617XS -2! | |
| Cinebench R20 | |
| CPU (Multi Core) | |
| Genomsnitt av klass Gaming (4029 - 16433, n=103, senaste 2 åren) | |
| Lenovo Legion 5 16IRX G9 | |
| HP Victus 16 (2024) | |
| Genomsnitt Intel Core i7-14700HX (7988 - 10540, n=9) | |
| HP Victus 16 (2024) (Leistung) | |
| Dell G16, i7-13650HX, RTX 4060 | |
| Gigabyte G6X 9KG (2024) | |
| Asus TUF Gaming A16 FA617XS | |
| CPU (Single Core) | |
| Genomsnitt av klass Gaming (622 - 913, n=103, senaste 2 åren) | |
| Genomsnitt Intel Core i7-14700HX (651 - 821, n=9) | |
| Lenovo Legion 5 16IRX G9 | |
| Dell G16, i7-13650HX, RTX 4060 | |
| Asus TUF Gaming A16 FA617XS | |
| Gigabyte G6X 9KG (2024) | |
| HP Victus 16 (2024) (Leistung) | |
| HP Victus 16 (2024) | |
| Cinebench R15 | |
| CPU Multi 64Bit | |
| Genomsnitt av klass Gaming (1578 - 6330, n=102, senaste 2 åren) | |
| HP Victus 16 (2024) | |
| Genomsnitt Intel Core i7-14700HX (3328 - 4248, n=9) | |
| Lenovo Legion 5 16IRX G9 | |
| HP Victus 16 (2024) (Leistung) | |
| Dell G16, i7-13650HX, RTX 4060 | |
| Gigabyte G6X 9KG (2024) | |
| Asus TUF Gaming A16 FA617XS | |
| CPU Single 64Bit | |
| Genomsnitt av klass Gaming (188.8 - 350, n=103, senaste 2 åren) | |
| Lenovo Legion 5 16IRX G9 | |
| Genomsnitt Intel Core i7-14700HX (238 - 304, n=9) | |
| Asus TUF Gaming A16 FA617XS | |
| Dell G16, i7-13650HX, RTX 4060 | |
| Gigabyte G6X 9KG (2024) | |
| HP Victus 16 (2024) (Leistung) | |
| HP Victus 16 (2024) | |
| Blender - v2.79 BMW27 CPU | |
| Gigabyte G6X 9KG (2024) | |
| Asus TUF Gaming A16 FA617XS | |
| HP Victus 16 (2024) | |
| Dell G16, i7-13650HX, RTX 4060 | |
| Genomsnitt Intel Core i7-14700HX (126 - 212, n=9) | |
| Genomsnitt av klass Gaming (79 - 330, n=101, senaste 2 åren) | |
| Lenovo Legion 5 16IRX G9 | |
| HP Victus 16 (2024) (Leistung) | |
| Geekbench 6.7 | |
| Multi-Core | |
| Genomsnitt av klass Gaming (6625 - 22850, n=103, senaste 2 åren) | |
| Lenovo Legion 5 16IRX G9 (6.2.1) | |
| Genomsnitt Intel Core i7-14700HX (14163 - 17562, n=9) | |
| HP Victus 16 (2024) (6.2.1, Leistung) | |
| HP Victus 16 (2024) (6.2.1) | |
| Dell G16, i7-13650HX, RTX 4060 (6.2.1) | |
| Gigabyte G6X 9KG (2024) (6.2.1) | |
| Single-Core | |
| Genomsnitt av klass Gaming (1982 - 3259, n=103, senaste 2 åren) | |
| Genomsnitt Intel Core i7-14700HX (2378 - 2975, n=9) | |
| Lenovo Legion 5 16IRX G9 (6.2.1) | |
| Dell G16, i7-13650HX, RTX 4060 (6.2.1) | |
| Gigabyte G6X 9KG (2024) (6.2.1) | |
| HP Victus 16 (2024) (6.2.1, Leistung) | |
| HP Victus 16 (2024) (6.2.1) | |
| HWBOT x265 Benchmark v2.2 - 4k Preset | |
| Genomsnitt av klass Gaming (11.5 - 44.4, n=102, senaste 2 åren) | |
| HP Victus 16 (2024) (Leistung) | |
| Lenovo Legion 5 16IRX G9 | |
| Genomsnitt Intel Core i7-14700HX (19.5 - 27.4, n=9) | |
| HP Victus 16 (2024) | |
| Asus TUF Gaming A16 FA617XS | |
| Dell G16, i7-13650HX, RTX 4060 | |
| Gigabyte G6X 9KG (2024) | |
| LibreOffice - 20 Documents To PDF | |
| HP Victus 16 (2024) (6.3.4.2) | |
| Dell G16, i7-13650HX, RTX 4060 (6.3.4.2) | |
| Genomsnitt av klass Gaming (33.2 - 88.8, n=102, senaste 2 åren) | |
| Genomsnitt Intel Core i7-14700HX (41.9 - 55.3, n=9) | |
| Lenovo Legion 5 16IRX G9 (6.3.4.2) | |
| HP Victus 16 (2024) (6.3.4.2. Leistung) | |
| Asus TUF Gaming A16 FA617XS | |
| Gigabyte G6X 9KG (2024) (6.3.4.2) | |
| R Benchmark 2.5 - Overall mean | |
| HP Victus 16 (2024) | |
| HP Victus 16 (2024) (Leistung) | |
| Gigabyte G6X 9KG (2024) | |
| Asus TUF Gaming A16 FA617XS | |
| Genomsnitt av klass Gaming (0.3439 - 0.59, n=102, senaste 2 åren) | |
| Dell G16, i7-13650HX, RTX 4060 | |
| Dell G16, i7-13650HX, RTX 4060 | |
| Lenovo Legion 5 16IRX G9 | |
| Genomsnitt Intel Core i7-14700HX (0.3821 - 0.4896, n=9) | |
* ... mindre är bättre
AIDA64: FP32 Ray-Trace | FPU Julia | CPU SHA3 | CPU Queen | FPU SinJulia | FPU Mandel | CPU AES | CPU ZLib | FP64 Ray-Trace | CPU PhotoWorxx
| Performance rating | |
| Genomsnitt av klass Gaming | |
| HP Victus 16 (2024) | |
| Asus TUF Gaming A16 FA617XS | |
| Genomsnitt Intel Core i7-14700HX | |
| Lenovo Legion 5 16IRX G9 | |
| Dell G16, i7-13650HX, RTX 4060 | |
| HP Victus 16 (2024) | |
| Gigabyte G6X 9KG (2024) | |
| AIDA64 / FP32 Ray-Trace | |
| Genomsnitt av klass Gaming (10227 - 85542, n=102, senaste 2 åren) | |
| Asus TUF Gaming A16 FA617XS (v6.75.6100) | |
| HP Victus 16 (2024) (v6.92.6600, Leistung) | |
| Genomsnitt Intel Core i7-14700HX (14147 - 23676, n=9) | |
| Lenovo Legion 5 16IRX G9 (v6.92.6600) | |
| Dell G16, i7-13650HX, RTX 4060 (v6.92.6600) | |
| HP Victus 16 (2024) (v6.92.6600) | |
| Gigabyte G6X 9KG (2024) (v6.92.6600) | |
| AIDA64 / FPU Julia | |
| Genomsnitt av klass Gaming (51376 - 372155, n=102, senaste 2 åren) | |
| Asus TUF Gaming A16 FA617XS (v6.75.6100) | |
| HP Victus 16 (2024) (v6.92.6600, Leistung) | |
| Genomsnitt Intel Core i7-14700HX (71875 - 116556, n=9) | |
| Lenovo Legion 5 16IRX G9 (v6.92.6600) | |
| Dell G16, i7-13650HX, RTX 4060 (v6.92.6600) | |
| HP Victus 16 (2024) (v6.92.6600) | |
| Gigabyte G6X 9KG (2024) (v6.92.6600) | |
| AIDA64 / CPU SHA3 | |
| Genomsnitt av klass Gaming (2180 - 10115, n=102, senaste 2 åren) | |
| HP Victus 16 (2024) (v6.92.6600, Leistung) | |
| Genomsnitt Intel Core i7-14700HX (3388 - 5567, n=9) | |
| Asus TUF Gaming A16 FA617XS (v6.75.6100) | |
| Dell G16, i7-13650HX, RTX 4060 (v6.92.6600) | |
| Lenovo Legion 5 16IRX G9 (v6.92.6600) | |
| HP Victus 16 (2024) (v6.92.6600) | |
| Gigabyte G6X 9KG (2024) (v6.92.6600) | |
| AIDA64 / CPU Queen | |
| Genomsnitt Intel Core i7-14700HX (129134 - 152200, n=9) | |
| HP Victus 16 (2024) (v6.92.6600, Leistung) | |
| HP Victus 16 (2024) (v6.92.6600) | |
| Asus TUF Gaming A16 FA617XS (v6.75.6100) | |
| Genomsnitt av klass Gaming (49785 - 173351, n=86, senaste 2 åren) | |
| Gigabyte G6X 9KG (2024) (v6.92.6600) | |
| Dell G16, i7-13650HX, RTX 4060 (v6.92.6600) | |
| Lenovo Legion 5 16IRX G9 (v6.92.6600) | |
| AIDA64 / FPU SinJulia | |
| Asus TUF Gaming A16 FA617XS (v6.75.6100) | |
| Genomsnitt av klass Gaming (4424 - 33636, n=102, senaste 2 åren) | |
| HP Victus 16 (2024) (v6.92.6600, Leistung) | |
| Genomsnitt Intel Core i7-14700HX (10266 - 14434, n=9) | |
| Lenovo Legion 5 16IRX G9 (v6.92.6600) | |
| HP Victus 16 (2024) (v6.92.6600) | |
| Dell G16, i7-13650HX, RTX 4060 (v6.92.6600) | |
| Gigabyte G6X 9KG (2024) (v6.92.6600) | |
| AIDA64 / FPU Mandel | |
| Genomsnitt av klass Gaming (25115 - 196829, n=102, senaste 2 åren) | |
| Asus TUF Gaming A16 FA617XS (v6.75.6100) | |
| HP Victus 16 (2024) (v6.92.6600, Leistung) | |
| Genomsnitt Intel Core i7-14700HX (35155 - 58380, n=9) | |
| Lenovo Legion 5 16IRX G9 (v6.92.6600) | |
| Dell G16, i7-13650HX, RTX 4060 (v6.92.6600) | |
| HP Victus 16 (2024) (v6.92.6600) | |
| Gigabyte G6X 9KG (2024) (v6.92.6600) | |
| AIDA64 / CPU AES | |
| Genomsnitt av klass Gaming (39258 - 247074, n=102, senaste 2 åren) | |
| HP Victus 16 (2024) (v6.92.6600, Leistung) | |
| Genomsnitt Intel Core i7-14700HX (68616 - 113157, n=9) | |
| Lenovo Legion 5 16IRX G9 (v6.92.6600) | |
| Asus TUF Gaming A16 FA617XS (v6.75.6100) | |
| Dell G16, i7-13650HX, RTX 4060 (v6.92.6600) | |
| HP Victus 16 (2024) (v6.92.6600) | |
| Gigabyte G6X 9KG (2024) (v6.92.6600) | |
| AIDA64 / CPU ZLib | |
| HP Victus 16 (2024) (v6.92.6600, Leistung) | |
| Genomsnitt av klass Gaming (574 - 2531, n=102, senaste 2 åren) | |
| Genomsnitt Intel Core i7-14700HX (1003 - 1682, n=9) | |
| Lenovo Legion 5 16IRX G9 (v6.92.6600) | |
| Dell G16, i7-13650HX, RTX 4060 (v6.92.6600) | |
| HP Victus 16 (2024) (v6.92.6600) | |
| Gigabyte G6X 9KG (2024) (v6.92.6600) | |
| Asus TUF Gaming A16 FA617XS (v6.75.6100) | |
| AIDA64 / FP64 Ray-Trace | |
| Genomsnitt av klass Gaming (5509 - 45446, n=102, senaste 2 åren) | |
| Asus TUF Gaming A16 FA617XS (v6.75.6100) | |
| HP Victus 16 (2024) (v6.92.6600, Leistung) | |
| Genomsnitt Intel Core i7-14700HX (7585 - 12928, n=9) | |
| Dell G16, i7-13650HX, RTX 4060 (v6.92.6600) | |
| Lenovo Legion 5 16IRX G9 (v6.92.6600) | |
| HP Victus 16 (2024) (v6.92.6600) | |
| Gigabyte G6X 9KG (2024) (v6.92.6600) | |
| AIDA64 / CPU PhotoWorxx | |
| Genomsnitt av klass Gaming (12271 - 89891, n=102, senaste 2 åren) | |
| Genomsnitt Intel Core i7-14700HX (24276 - 49671, n=9) | |
| HP Victus 16 (2024) (v6.92.6600) | |
| HP Victus 16 (2024) (v6.92.6600, Leistung) | |
| Gigabyte G6X 9KG (2024) (v6.92.6600) | |
| Dell G16, i7-13650HX, RTX 4060 (v6.92.6600) | |
| Lenovo Legion 5 16IRX G9 (v6.92.6600) | |
| Asus TUF Gaming A16 FA617XS (v6.75.6100) | |
Systemets prestanda
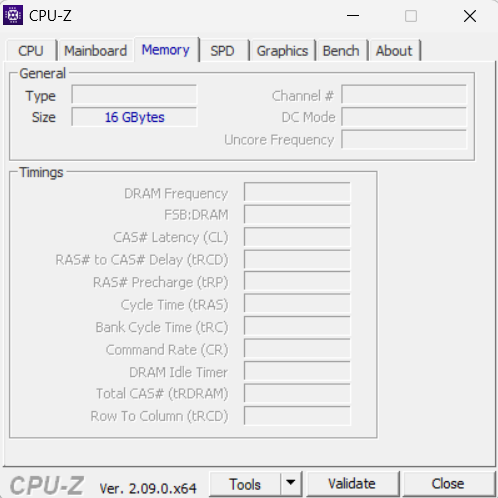
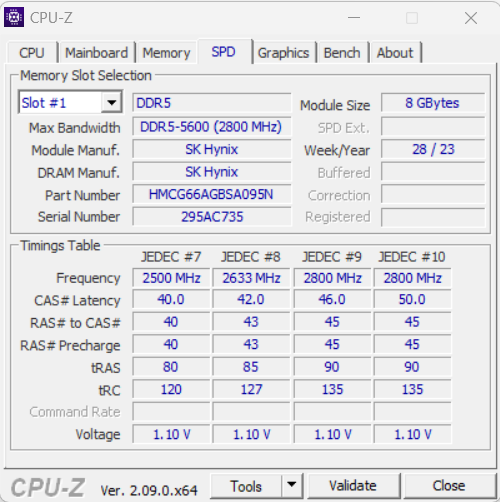
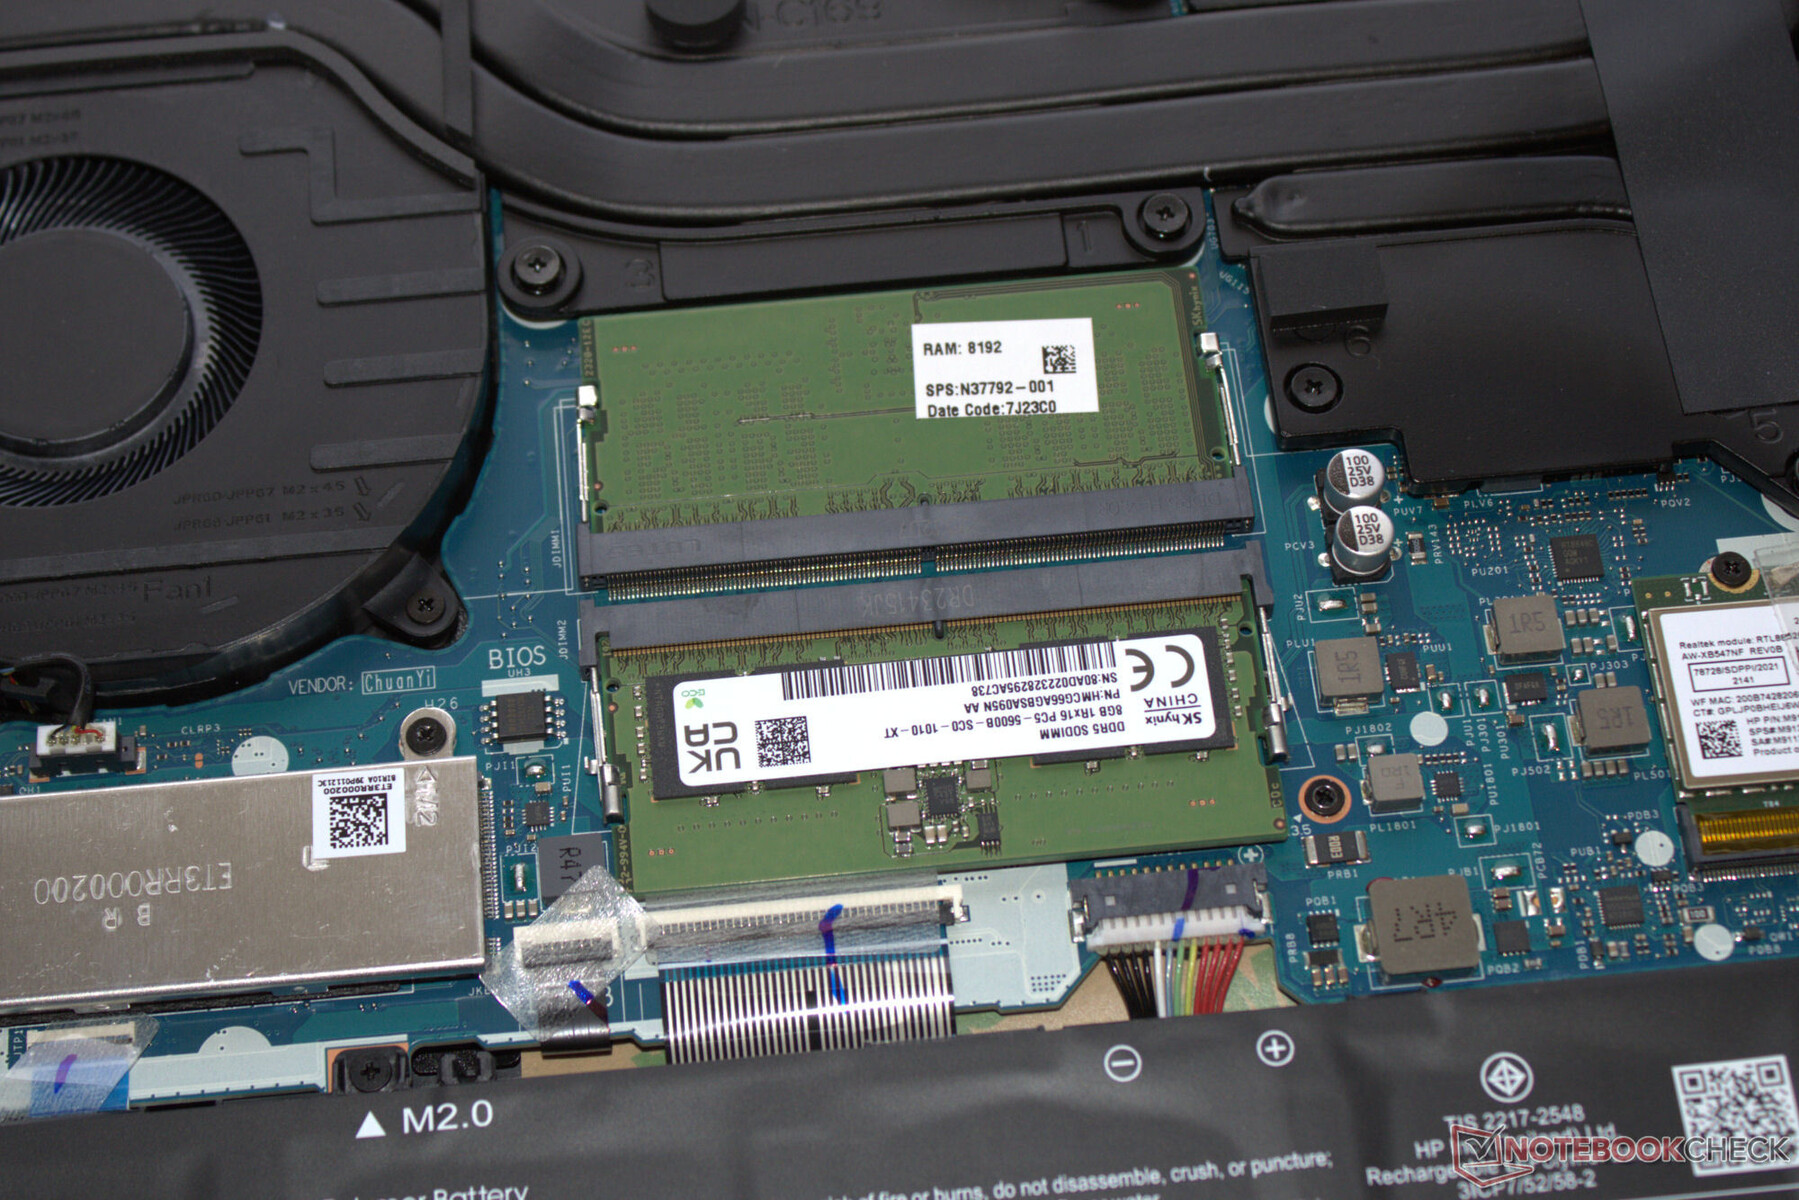
Det välfungerande systemet ger tillräckligt med prestanda för krävande applikationer som spel, rendering och streaming. RAM-minnets överföringshastigheter ligger på en normal nivå för DDR5-5600 RAM.
CrossMark: Overall | Productivity | Creativity | Responsiveness
WebXPRT 3: Overall
WebXPRT 4: Overall
Mozilla Kraken 1.1: Total
| PCMark 10 / Score | |
| Genomsnitt av klass Gaming (5828 - 12414, n=93, senaste 2 åren) | |
| Asus TUF Gaming A16 FA617XS | |
| Genomsnitt Intel Core i7-14700HX, NVIDIA GeForce RTX 4060 Laptop GPU (7528 - 8278, n=2) | |
| Lenovo Legion 5 16IRX G9 | |
| Gigabyte G6X 9KG (2024) | |
| HP Victus 16 (2024) | |
| Dell G16, i7-13650HX, RTX 4060 | |
| PCMark 10 / Essentials | |
| Genomsnitt Intel Core i7-14700HX, NVIDIA GeForce RTX 4060 Laptop GPU (10778 - 11087, n=2) | |
| Asus TUF Gaming A16 FA617XS | |
| Lenovo Legion 5 16IRX G9 | |
| HP Victus 16 (2024) | |
| Genomsnitt av klass Gaming (8810 - 11935, n=97, senaste 2 åren) | |
| Gigabyte G6X 9KG (2024) | |
| Dell G16, i7-13650HX, RTX 4060 | |
| PCMark 10 / Productivity | |
| Genomsnitt av klass Gaming (6845 - 25323, n=95, senaste 2 åren) | |
| Asus TUF Gaming A16 FA617XS | |
| Gigabyte G6X 9KG (2024) | |
| Dell G16, i7-13650HX, RTX 4060 | |
| HP Victus 16 (2024) | |
| Genomsnitt Intel Core i7-14700HX, NVIDIA GeForce RTX 4060 Laptop GPU (9823 - 9910, n=2) | |
| Lenovo Legion 5 16IRX G9 | |
| PCMark 10 / Digital Content Creation | |
| Genomsnitt av klass Gaming (7602 - 19954, n=95, senaste 2 åren) | |
| Genomsnitt Intel Core i7-14700HX, NVIDIA GeForce RTX 4060 Laptop GPU (10841 - 14135, n=2) | |
| Lenovo Legion 5 16IRX G9 | |
| Asus TUF Gaming A16 FA617XS | |
| Dell G16, i7-13650HX, RTX 4060 | |
| Gigabyte G6X 9KG (2024) | |
| HP Victus 16 (2024) | |
| CrossMark / Overall | |
| Lenovo Legion 5 16IRX G9 | |
| Genomsnitt Intel Core i7-14700HX, NVIDIA GeForce RTX 4060 Laptop GPU (1923 - 2132, n=2) | |
| Genomsnitt av klass Gaming (1366 - 2409, n=94, senaste 2 åren) | |
| Gigabyte G6X 9KG (2024) | |
| HP Victus 16 (2024) | |
| Dell G16, i7-13650HX, RTX 4060 | |
| Asus TUF Gaming A16 FA617XS | |
| CrossMark / Productivity | |
| Lenovo Legion 5 16IRX G9 | |
| Genomsnitt Intel Core i7-14700HX, NVIDIA GeForce RTX 4060 Laptop GPU (1782 - 1973, n=2) | |
| Gigabyte G6X 9KG (2024) | |
| Genomsnitt av klass Gaming (1386 - 2254, n=94, senaste 2 åren) | |
| HP Victus 16 (2024) | |
| Dell G16, i7-13650HX, RTX 4060 | |
| Asus TUF Gaming A16 FA617XS | |
| CrossMark / Creativity | |
| Lenovo Legion 5 16IRX G9 | |
| Genomsnitt Intel Core i7-14700HX, NVIDIA GeForce RTX 4060 Laptop GPU (2107 - 2399, n=2) | |
| Genomsnitt av klass Gaming (1343 - 2786, n=94, senaste 2 åren) | |
| HP Victus 16 (2024) | |
| Gigabyte G6X 9KG (2024) | |
| Dell G16, i7-13650HX, RTX 4060 | |
| Asus TUF Gaming A16 FA617XS | |
| CrossMark / Responsiveness | |
| Gigabyte G6X 9KG (2024) | |
| Lenovo Legion 5 16IRX G9 | |
| Genomsnitt Intel Core i7-14700HX, NVIDIA GeForce RTX 4060 Laptop GPU (1835 - 1885, n=2) | |
| HP Victus 16 (2024) | |
| Genomsnitt av klass Gaming (1226 - 2334, n=94, senaste 2 åren) | |
| Dell G16, i7-13650HX, RTX 4060 | |
| Asus TUF Gaming A16 FA617XS | |
| WebXPRT 3 / Overall | |
| Genomsnitt av klass Gaming (220 - 532, n=98, senaste 2 åren) | |
| Lenovo Legion 5 16IRX G9 | |
| Gigabyte G6X 9KG (2024) | |
| Genomsnitt Intel Core i7-14700HX, NVIDIA GeForce RTX 4060 Laptop GPU (276 - 301, n=2) | |
| HP Victus 16 (2024) | |
| Dell G16, i7-13650HX, RTX 4060 | |
| WebXPRT 4 / Overall | |
| Genomsnitt av klass Gaming (165 - 354, n=98, senaste 2 åren) | |
| Lenovo Legion 5 16IRX G9 | |
| Asus TUF Gaming A16 FA617XS | |
| Genomsnitt Intel Core i7-14700HX, NVIDIA GeForce RTX 4060 Laptop GPU (251 - 273, n=2) | |
| Gigabyte G6X 9KG (2024) | |
| HP Victus 16 (2024) | |
| Mozilla Kraken 1.1 / Total | |
| HP Victus 16 (2024) | |
| Gigabyte G6X 9KG (2024) | |
| Dell G16, i7-13650HX, RTX 4060 | |
| Genomsnitt Intel Core i7-14700HX, NVIDIA GeForce RTX 4060 Laptop GPU (467 - 542, n=2) | |
| Asus TUF Gaming A16 FA617XS | |
| Lenovo Legion 5 16IRX G9 | |
| Genomsnitt av klass Gaming (391 - 590, n=100, senaste 2 åren) | |
* ... mindre är bättre
| PCMark 10 Score | 7528 poäng | |
Hjälp | ||
| AIDA64 / Memory Copy | |
| Genomsnitt av klass Gaming (21750 - 129946, n=102, senaste 2 åren) | |
| Genomsnitt Intel Core i7-14700HX (41617 - 78742, n=9) | |
| HP Victus 16 (2024) | |
| Gigabyte G6X 9KG (2024) | |
| Lenovo Legion 5 16IRX G9 | |
| Asus TUF Gaming A16 FA617XS | |
| Dell G16, i7-13650HX, RTX 4060 | |
| AIDA64 / Memory Read | |
| HP Victus 16 (2024) | |
| Genomsnitt Intel Core i7-14700HX (46627 - 86175, n=9) | |
| Genomsnitt av klass Gaming (22956 - 118858, n=102, senaste 2 åren) | |
| Lenovo Legion 5 16IRX G9 | |
| Gigabyte G6X 9KG (2024) | |
| Dell G16, i7-13650HX, RTX 4060 | |
| Asus TUF Gaming A16 FA617XS | |
| AIDA64 / Memory Write | |
| Genomsnitt av klass Gaming (22297 - 135096, n=102, senaste 2 åren) | |
| Asus TUF Gaming A16 FA617XS | |
| Genomsnitt Intel Core i7-14700HX (39155 - 76976, n=9) | |
| HP Victus 16 (2024) | |
| Gigabyte G6X 9KG (2024) | |
| Dell G16, i7-13650HX, RTX 4060 | |
| Lenovo Legion 5 16IRX G9 | |
| AIDA64 / Memory Latency | |
| Genomsnitt av klass Gaming (75.3 - 165.4, n=102, senaste 2 åren) | |
| HP Victus 16 (2024) | |
| Dell G16, i7-13650HX, RTX 4060 | |
| Asus TUF Gaming A16 FA617XS | |
| Gigabyte G6X 9KG (2024) | |
| Lenovo Legion 5 16IRX G9 | |
| Genomsnitt Intel Core i7-14700HX (82.7 - 96.4, n=9) | |
* ... mindre är bättre
DPC-latenstider
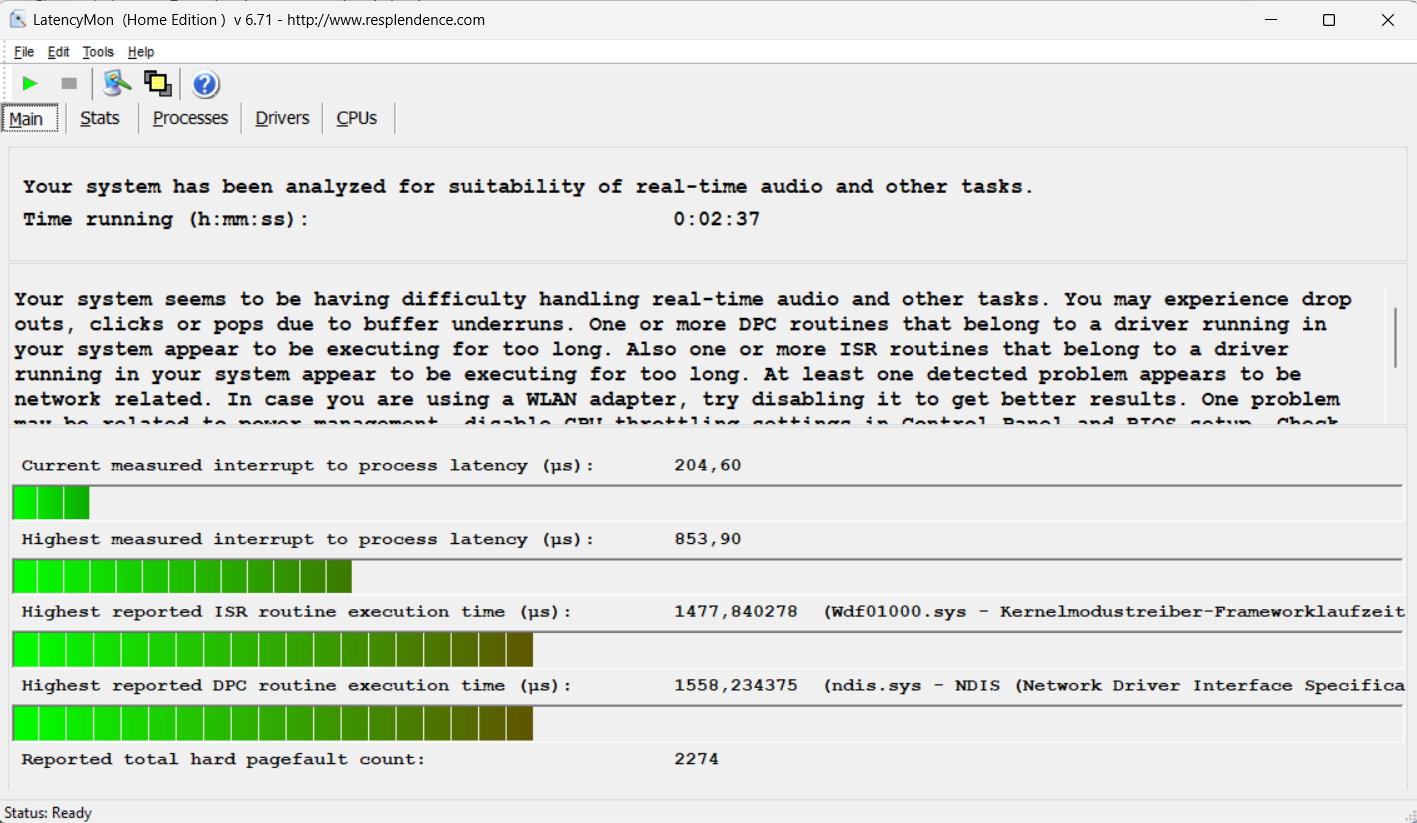
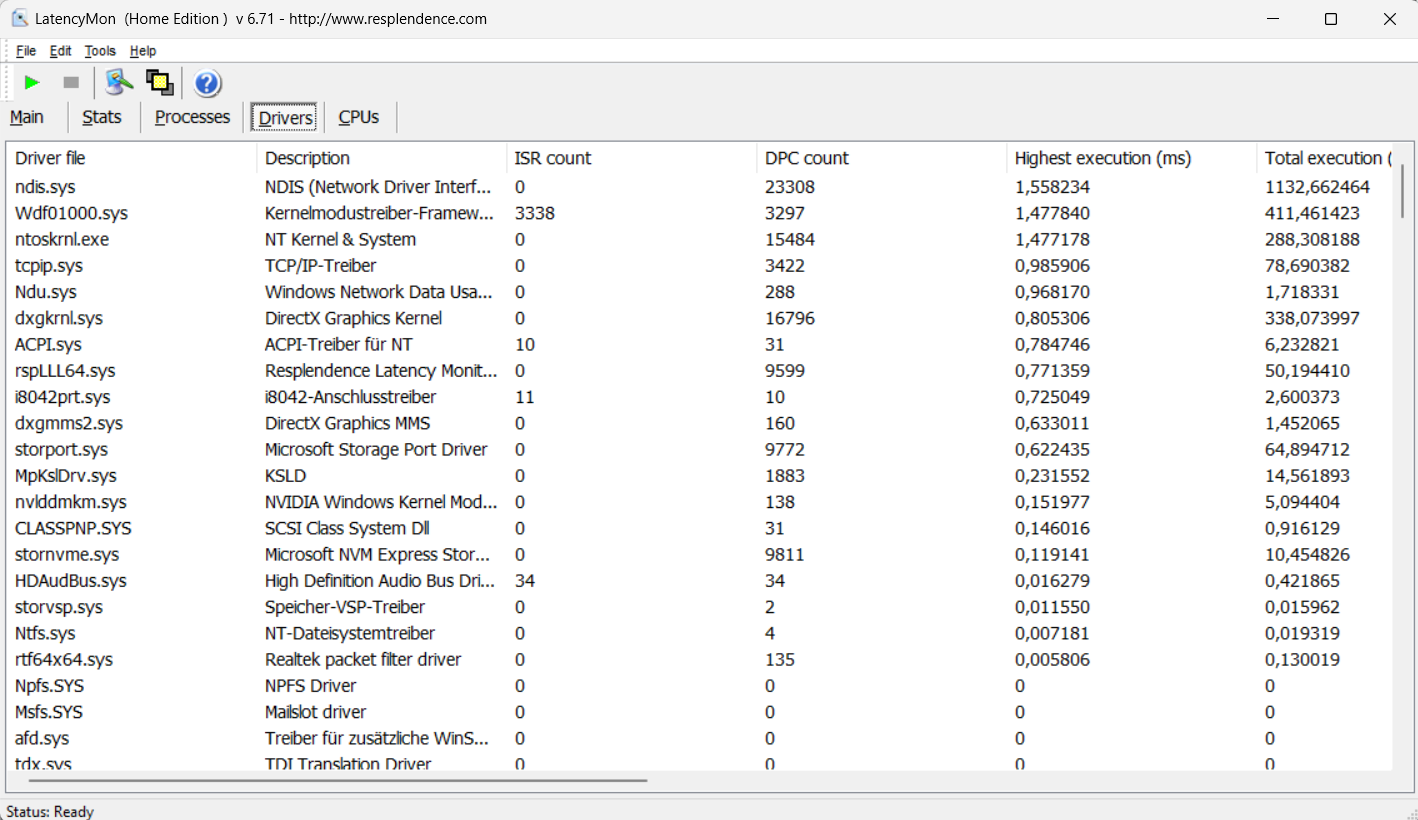
När jag kontrollerade den bärbara datorns latenser (webbsurfing, 4k-videouppspelning, Prime95 hög belastning) upptäcktes vissa avvikelser. Den nuvarande kombinationen av hårdvara och programvara verkar inte vara lämplig för video- och ljudredigering i realtid. Framtida programuppdateringar kan leda till förändringar.
| DPC Latencies / LatencyMon - interrupt to process latency (max), Web, Youtube, Prime95 | |
| Gigabyte G6X 9KG (2024) | |
| Lenovo Legion 5 16IRX G9 | |
| Asus TUF Gaming A16 FA617XS | |
| Dell G16, i7-13650HX, RTX 4060 | |
| HP Victus 16 (2024) | |
* ... mindre är bättre
Lagringsenheter
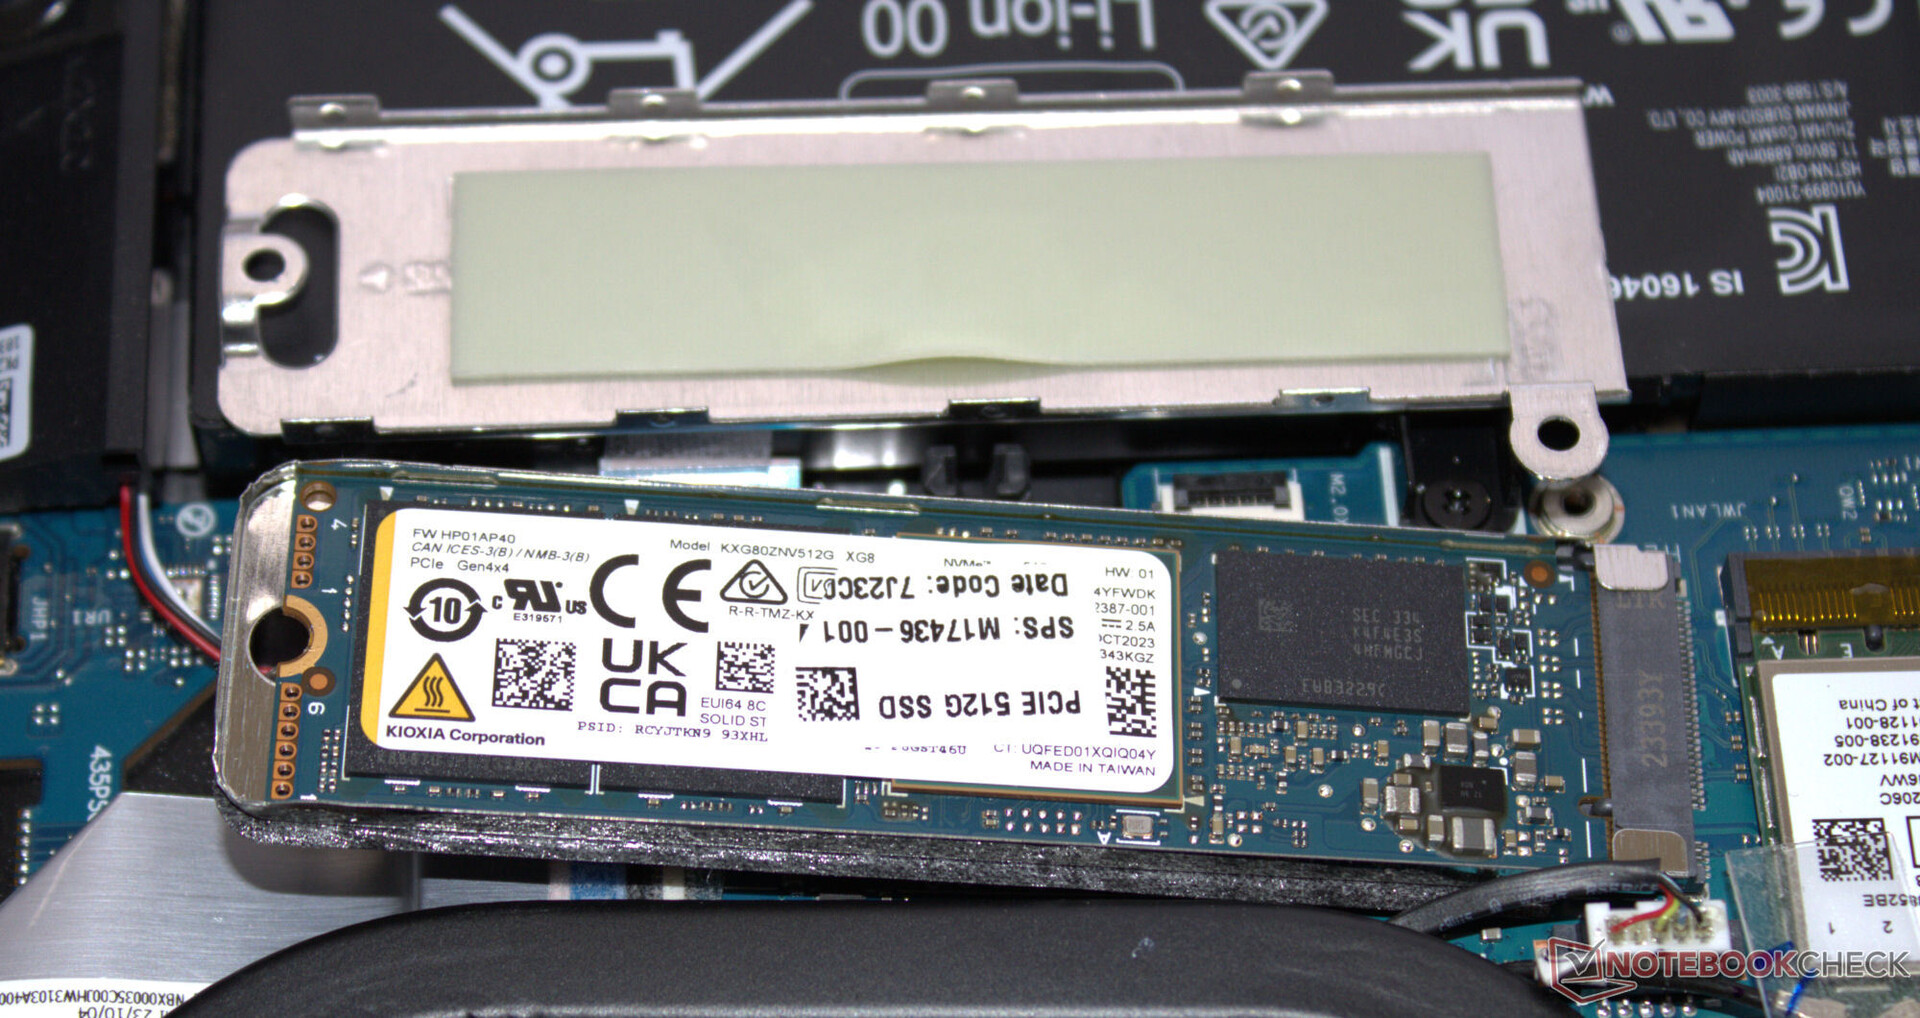
PCIe 4 SSD (M.2-2280) från Kioxia har en kapacitet på 512 GB och levererar bra överföringshastigheter. Under DiskSpd-loopen sjönk dess datahastigheter steg för steg till en lägre nivå till följd av termisk strypning. Den bärbara datorn har plats för en andra SSD.

* ... mindre är bättre
Reading continuous performance: DiskSpd Read Loop, Queue Depth 8
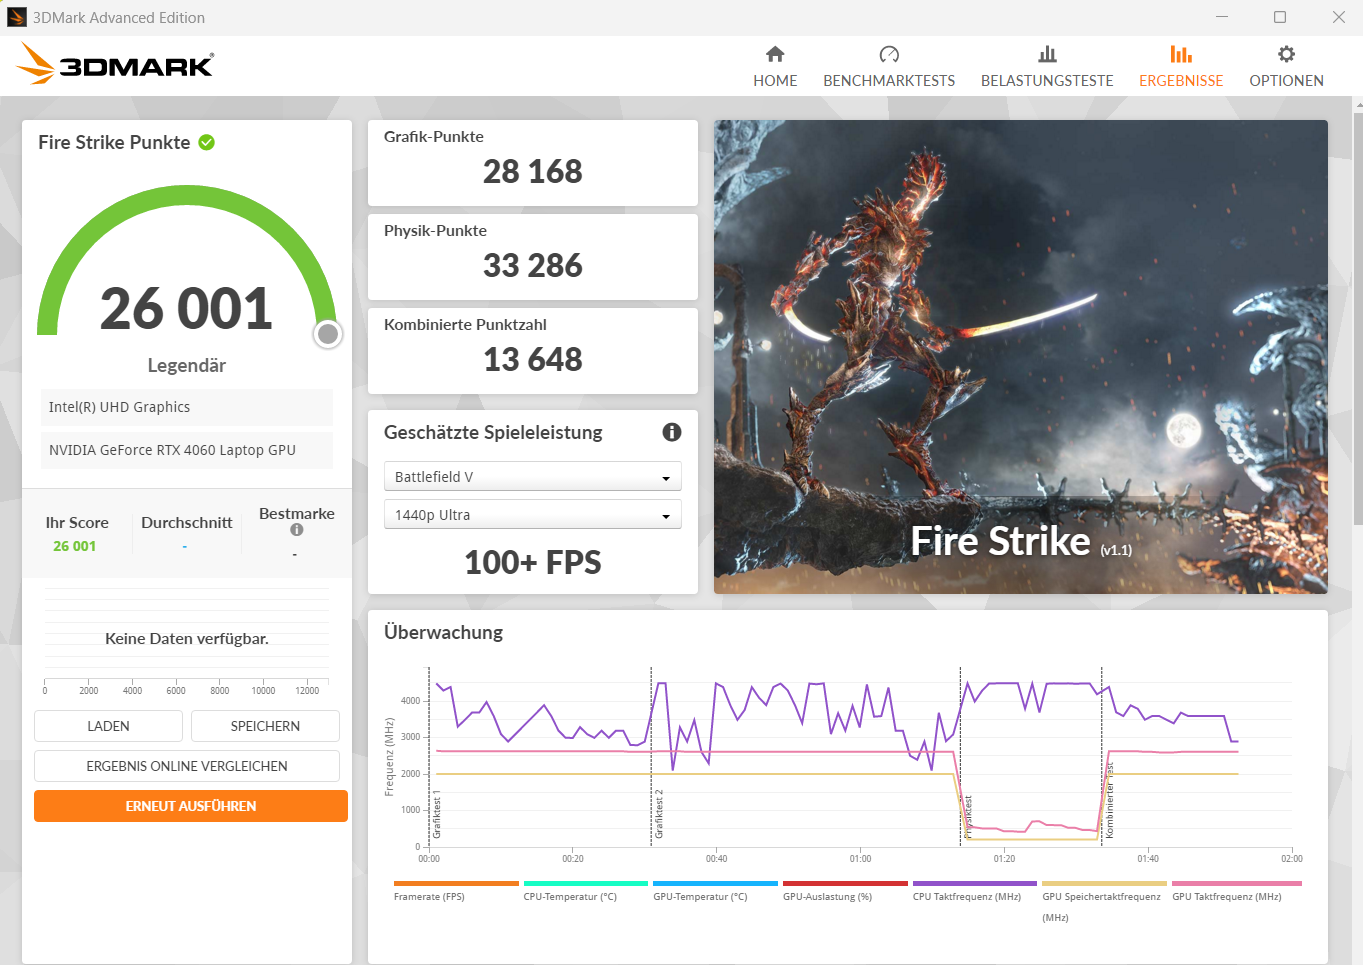
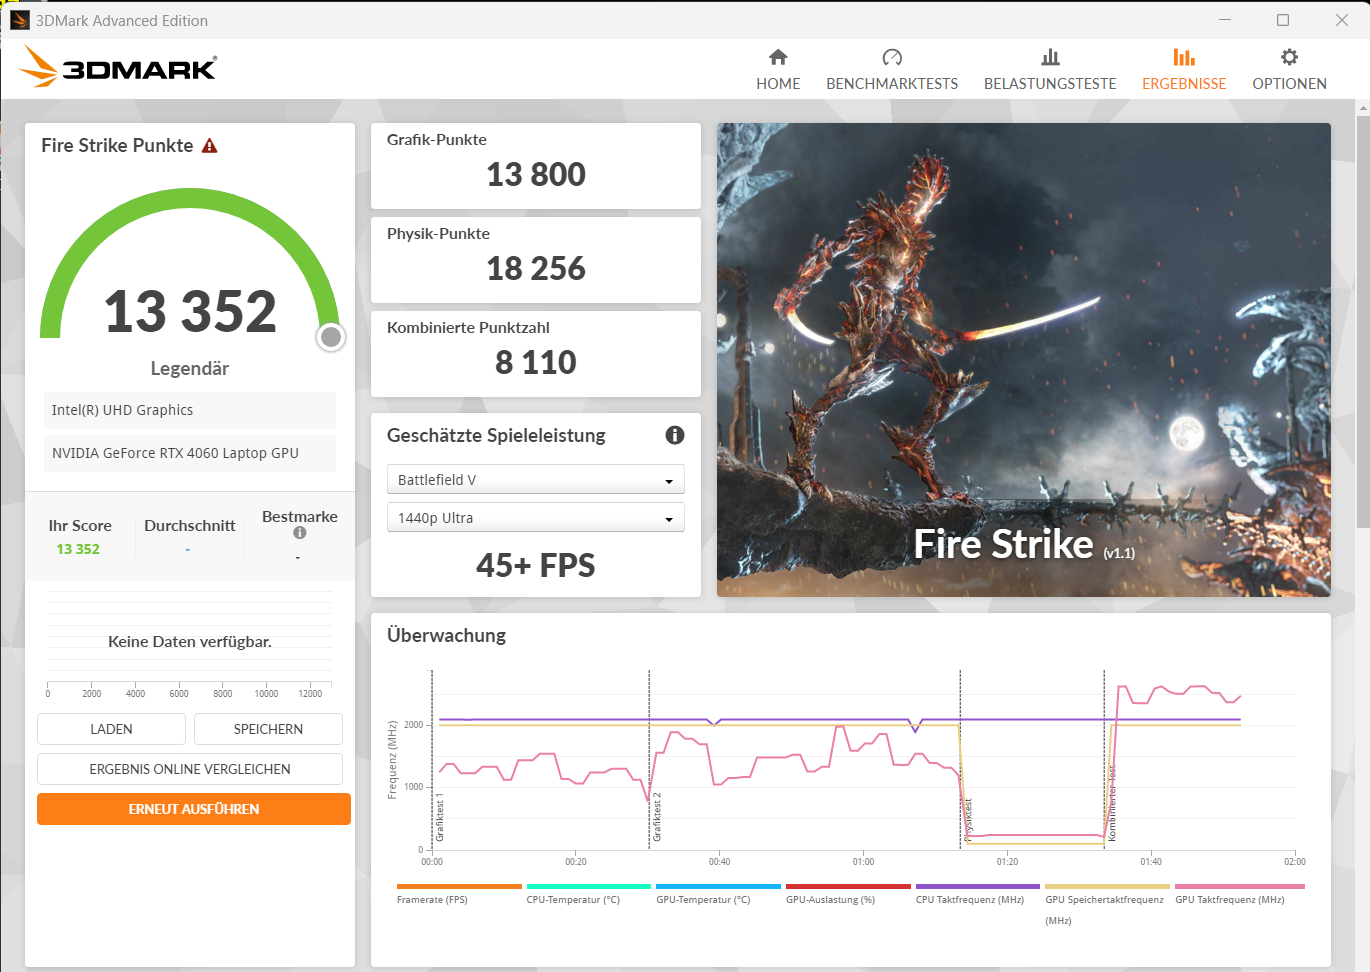
Grafikkort
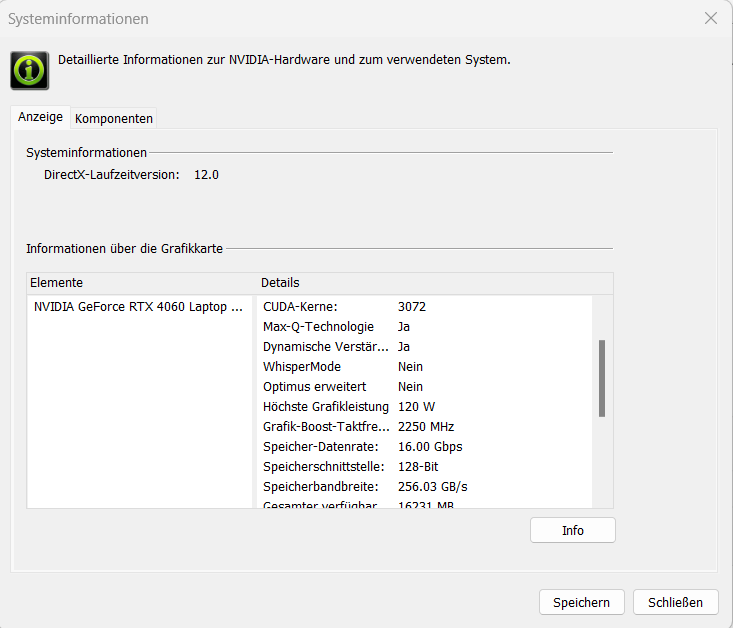
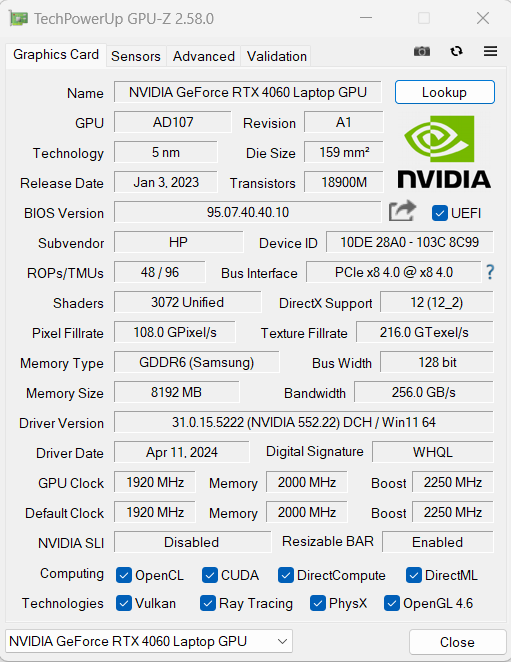
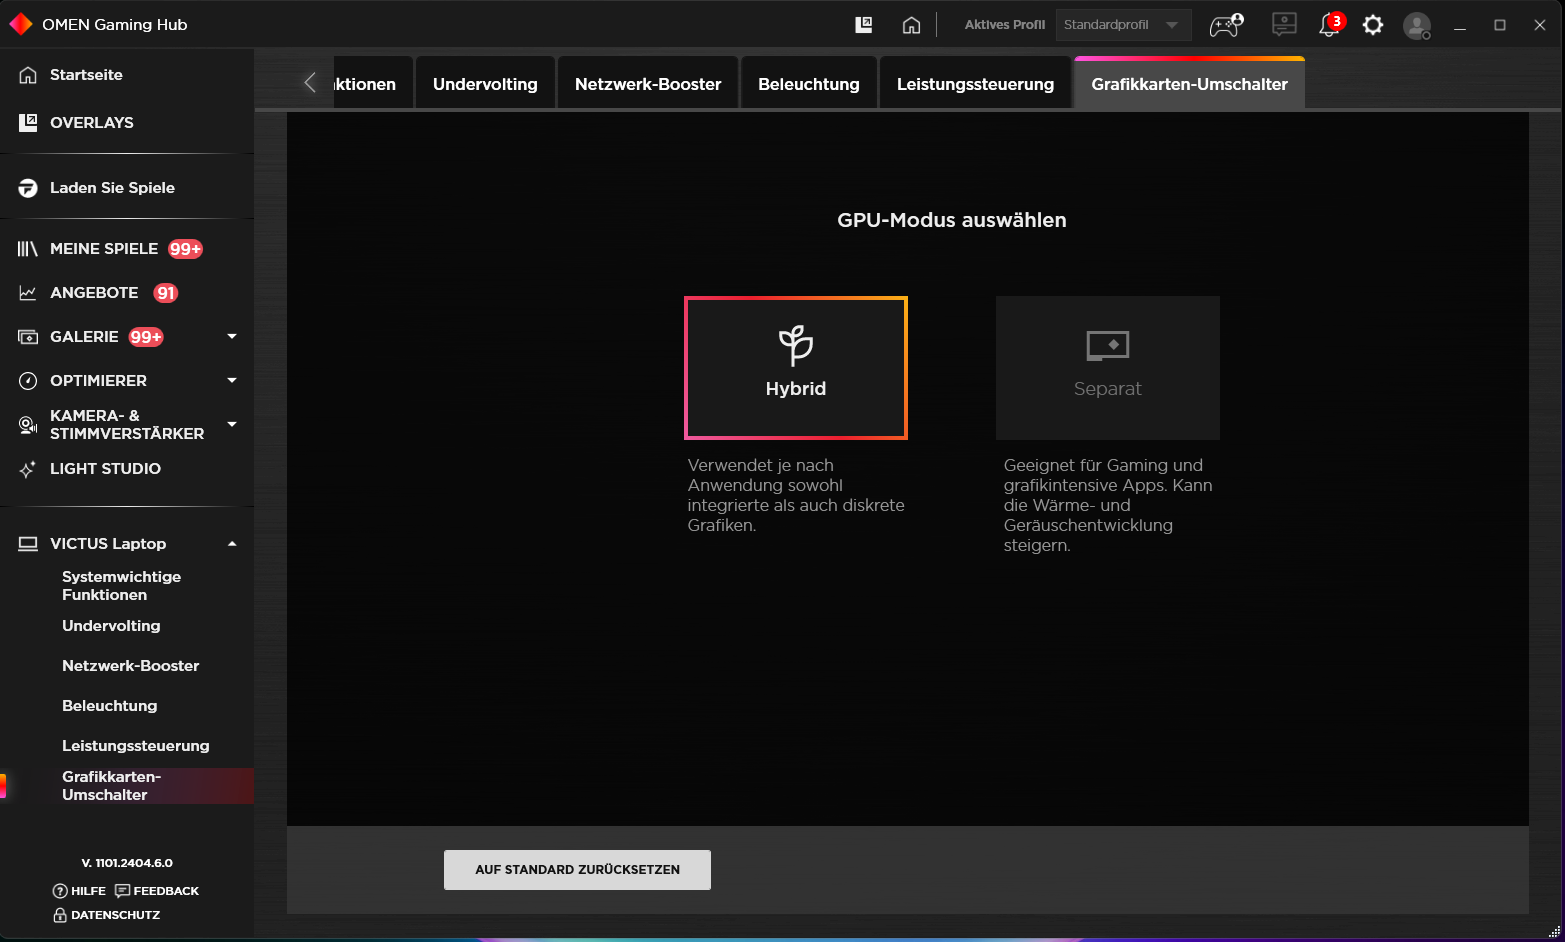
Mellanklassmodellen GeForce RTX 4060 GPU (3 072 shaders, 128 bitars buss, 8 GB GDDR6, 120 watt) möjliggör FHD-spel med höga till maximala inställningar. Dess benchmark-värden och bildfrekvenser låg något över RTX 4060:s genomsnitt ("Balanserad"). Profilen "Performance" resulterade i en mindre fördel. Avancerad Optimus stöds inte. Det innebär att det krävs en omstart för att växla mellan dGPU och Optimus.


| 3DMark Performance rating - Percent | |
| Genomsnitt av klass Gaming | |
| Lenovo Legion 5 16IRX G9 | |
| HP Victus 16 (2024) | |
| Dell G16, i7-13650HX, RTX 4060 | |
| Gigabyte G6X 9KG (2024) | |
| HP Victus 16 (2024) | |
| Genomsnitt NVIDIA GeForce RTX 4060 Laptop GPU | |
| Asus TUF Gaming A16 FA617XS | |
| 3DMark 11 - 1280x720 Performance GPU | |
| Genomsnitt av klass Gaming (21841 - 80022, n=103, senaste 2 åren) | |
| Lenovo Legion 5 16IRX G9 | |
| HP Victus 16 (2024) (Leistung) | |
| Dell G16, i7-13650HX, RTX 4060 | |
| Gigabyte G6X 9KG (2024) | |
| HP Victus 16 (2024) | |
| Genomsnitt NVIDIA GeForce RTX 4060 Laptop GPU (28136 - 38912, n=57) | |
| Asus TUF Gaming A16 FA617XS | |
| 3DMark | |
| 1920x1080 Fire Strike Graphics | |
| Genomsnitt av klass Gaming (18629 - 62849, n=112, senaste 2 åren) | |
| HP Victus 16 (2024) (Leistung) | |
| Lenovo Legion 5 16IRX G9 | |
| Gigabyte G6X 9KG (2024) | |
| Dell G16, i7-13650HX, RTX 4060 | |
| HP Victus 16 (2024) | |
| Asus TUF Gaming A16 FA617XS | |
| Genomsnitt NVIDIA GeForce RTX 4060 Laptop GPU (20533 - 29656, n=54) | |
| 2560x1440 Time Spy Graphics | |
| Genomsnitt av klass Gaming (6387 - 26212, n=112, senaste 2 åren) | |
| Lenovo Legion 5 16IRX G9 | |
| HP Victus 16 (2024) (Leistung) | |
| Dell G16, i7-13650HX, RTX 4060 | |
| Genomsnitt NVIDIA GeForce RTX 4060 Laptop GPU (7484 - 11451, n=56) | |
| HP Victus 16 (2024) | |
| Gigabyte G6X 9KG (2024) | |
| Asus TUF Gaming A16 FA617XS | |
| 3DMark 11 Performance | 30439 poäng | |
| 3DMark Fire Strike Score | 24569 poäng | |
| 3DMark Time Spy Score | 10542 poäng | |
Hjälp | ||
| Blender | |
| v3.3 Classroom OPTIX/RTX | |
| Dell G16, i7-13650HX, RTX 4060 (3.3.3) | |
| Lenovo Legion 5 16IRX G9 (3.3.3) | |
| Genomsnitt NVIDIA GeForce RTX 4060 Laptop GPU (19 - 28, n=53) | |
| HP Victus 16 (2024) (3.3.3) | |
| HP Victus 16 (2024) (3.3.3, Leistung) | |
| Gigabyte G6X 9KG (2024) (3.3.3) | |
| Genomsnitt av klass Gaming (9 - 32, n=103, senaste 2 åren) | |
| v3.3 Classroom CUDA | |
| Dell G16, i7-13650HX, RTX 4060 (3.3.3) | |
| Genomsnitt NVIDIA GeForce RTX 4060 Laptop GPU (39 - 53, n=53) | |
| Lenovo Legion 5 16IRX G9 (3.3.3) | |
| HP Victus 16 (2024) (3.3.3) | |
| HP Victus 16 (2024) (3.3.3, Leistung) | |
| Gigabyte G6X 9KG (2024) (3.3.3) | |
| Genomsnitt av klass Gaming (15 - 228, n=103, senaste 2 åren) | |
| v3.3 Classroom CPU | |
| Gigabyte G6X 9KG (2024) (3.3.3) | |
| HP Victus 16 (2024) (3.3.3) | |
| Genomsnitt NVIDIA GeForce RTX 4060 Laptop GPU (189 - 452, n=53) | |
| Asus TUF Gaming A16 FA617XS (3.3.3) | |
| Dell G16, i7-13650HX, RTX 4060 (3.3.3) | |
| Lenovo Legion 5 16IRX G9 (3.3.3) | |
| Genomsnitt av klass Gaming (122 - 565, n=99, senaste 2 åren) | |
| HP Victus 16 (2024) (3.3.3, Leistung) | |
| Geekbench 5.5 | |
| OpenCL Score | |
| Genomsnitt av klass Gaming (80702 - 277970, n=98, senaste 2 åren) | |
| HP Victus 16 (2024) (Leistung) | |
| Gigabyte G6X 9KG (2024) | |
| Dell G16, i7-13650HX, RTX 4060 | |
| HP Victus 16 (2024) | |
| Genomsnitt NVIDIA GeForce RTX 4060 Laptop GPU (5039 - 112238, n=53) | |
| Asus TUF Gaming A16 FA617XS | |
| Lenovo Legion 5 16IRX G9 | |
| Vulkan Score 5.5 | |
| Genomsnitt av klass Gaming (18857 - 246759, n=72, senaste 2 åren) | |
| HP Victus 16 (2024) (Leistung) | |
| Genomsnitt NVIDIA GeForce RTX 4060 Laptop GPU (46347 - 87612, n=30) | |
| HP Victus 16 (2024) | |
| Gigabyte G6X 9KG (2024) | |
| Asus TUF Gaming A16 FA617XS | |
| Geekbench 6.7 | |
| GPU OpenCL | |
| Genomsnitt av klass Gaming (67235 - 253130, n=100, senaste 2 åren) | |
| Gigabyte G6X 9KG (2024) (6.2.1) | |
| HP Victus 16 (2024) (6.2.1) | |
| Dell G16, i7-13650HX, RTX 4060 (6.2.1) | |
| Genomsnitt NVIDIA GeForce RTX 4060 Laptop GPU (76525 - 100831, n=39) | |
| HP Victus 16 (2024) (6.2.1, Leistung) | |
| GPU Vulkan | |
| Genomsnitt av klass Gaming (7562 - 244348, n=56, senaste 2 åren) | |
| Gigabyte G6X 9KG (2024) (6.2.1) | |
| HP Victus 16 (2024) (6.2.1, Leistung) | |
| Genomsnitt NVIDIA GeForce RTX 4060 Laptop GPU (75631 - 101001, n=24) | |
| HP Victus 16 (2024) (6.2.1) | |
| V-Ray 5 Benchmark | |
| GPU RTX | |
| Genomsnitt av klass Gaming (1524 - 4363, n=29, senaste 2 åren) | |
| Gigabyte G6X 9KG (2024) (5.0.1) | |
| HP Victus 16 (2024) (5.0.1) | |
| HP Victus 16 (2024) (5.0.1, Leistung) | |
| Dell G16, i7-13650HX, RTX 4060 (5.0.1) | |
| Genomsnitt NVIDIA GeForce RTX 4060 Laptop GPU (1387 - 1817, n=28) | |
| GPU CUDA | |
| Genomsnitt av klass Gaming (1202 - 3288, n=29, senaste 2 åren) | |
| Gigabyte G6X 9KG (2024) (5.0.1) | |
| HP Victus 16 (2024) (5.0.1) | |
| HP Victus 16 (2024) (5.0.1, Leistung) | |
| Genomsnitt NVIDIA GeForce RTX 4060 Laptop GPU (957 - 1294, n=29) | |
| Dell G16, i7-13650HX, RTX 4060 (5.0.1) | |
| Asus TUF Gaming A16 FA617XS (5.0.1) | |
| CPU | |
| Genomsnitt av klass Gaming (5864 - 30302, n=28, senaste 2 åren) | |
| HP Victus 16 (2024) (5.0.1) | |
| HP Victus 16 (2024) (5.0.1) | |
| Genomsnitt NVIDIA GeForce RTX 4060 Laptop GPU (8364 - 21065, n=28) | |
| Asus TUF Gaming A16 FA617XS (5.0.1) | |
| Gigabyte G6X 9KG (2024) (5.0.1) | |
| Dell G16, i7-13650HX, RTX 4060 (5.0.1) | |
| V-Ray Benchmark Next 4.10 | |
| GPU | |
| Genomsnitt av klass Gaming (427 - 1627, n=96, senaste 2 åren) | |
| Lenovo Legion 5 16IRX G9 (v4.10.07 ) | |
| Gigabyte G6X 9KG (2024) (v4.10.07 ) | |
| HP Victus 16 (2024) (v4.10.07, Leistung) | |
| Genomsnitt NVIDIA GeForce RTX 4060 Laptop GPU (483 - 715, n=46) | |
| HP Victus 16 (2024) (v4.10.07 ) | |
| Asus TUF Gaming A16 FA617XS (v4.10.07 ) | |
| CPU | |
| Genomsnitt av klass Gaming (10048 - 45327, n=94, senaste 2 åren) | |
| HP Victus 16 (2024) (v4.10.07, Leistung) | |
| Lenovo Legion 5 16IRX G9 (v4.10.07 ) | |
| HP Victus 16 (2024) (v4.10.07 ) | |
| Genomsnitt NVIDIA GeForce RTX 4060 Laptop GPU (12680 - 32360, n=46) | |
| Gigabyte G6X 9KG (2024) (v4.10.07 ) | |
| Asus TUF Gaming A16 FA617XS (v4.10.07 ) | |
* ... mindre är bättre
| The Witcher 3 - 1920x1080 Ultra Graphics & Postprocessing (HBAO+) | |
| Genomsnitt av klass Gaming (104.7 - 240, n=7, senaste 2 åren) | |
| Dell G16, i7-13650HX, RTX 4060 | |
| HP Victus 16 (2024) | |
| Genomsnitt NVIDIA GeForce RTX 4060 Laptop GPU (77 - 159.7, n=42) | |
| Gigabyte G6X 9KG (2024) | |
| HP Victus 16 (2024) | |
| Asus TUF Gaming A16 FA617XS | |
| Lenovo Legion 5 16IRX G9 | |
| GTA V - 1920x1080 Highest AA:4xMSAA + FX AF:16x | |
| Genomsnitt av klass Gaming (67.1 - 186.9, n=90, senaste 2 åren) | |
| Lenovo Legion 5 16IRX G9 | |
| Dell G16, i7-13650HX, RTX 4060 | |
| HP Victus 16 (2024) | |
| Gigabyte G6X 9KG (2024) | |
| HP Victus 16 (2024) | |
| Genomsnitt NVIDIA GeForce RTX 4060 Laptop GPU (76.9 - 126.3, n=48) | |
| Asus TUF Gaming A16 FA617XS | |
| Final Fantasy XV Benchmark - 1920x1080 High Quality | |
| Genomsnitt av klass Gaming (64.2 - 215, n=91, senaste 2 åren) | |
| Lenovo Legion 5 16IRX G9 | |
| HP Victus 16 (2024) | |
| Dell G16, i7-13650HX, RTX 4060 | |
| Gigabyte G6X 9KG (2024) | |
| HP Victus 16 (2024) | |
| Genomsnitt NVIDIA GeForce RTX 4060 Laptop GPU (75.1 - 109.8, n=51) | |
| Asus TUF Gaming A16 FA617XS | |
| Strange Brigade - 1920x1080 ultra AA:ultra AF:16 | |
| Genomsnitt av klass Gaming (113.6 - 458, n=83, senaste 2 åren) | |
| Lenovo Legion 5 16IRX G9 | |
| Dell G16, i7-13650HX, RTX 4060 | |
| HP Victus 16 (2024) | |
| Gigabyte G6X 9KG (2024) | |
| Genomsnitt NVIDIA GeForce RTX 4060 Laptop GPU (135.3 - 210, n=50) | |
| HP Victus 16 (2024) | |
| Asus TUF Gaming A16 FA617XS | |
| Dota 2 Reborn - 1920x1080 ultra (3/3) best looking | |
| Lenovo Legion 5 16IRX G9 | |
| HP Victus 16 (2024) | |
| Genomsnitt av klass Gaming (84.8 - 252, n=104, senaste 2 åren) | |
| HP Victus 16 (2024) | |
| Dell G16, i7-13650HX, RTX 4060 | |
| Genomsnitt NVIDIA GeForce RTX 4060 Laptop GPU (115 - 183.8, n=53) | |
| Gigabyte G6X 9KG (2024) | |
| Asus TUF Gaming A16 FA617XS | |
| X-Plane 11.11 - 1920x1080 high (fps_test=3) | |
| Lenovo Legion 5 16IRX G9 | |
| HP Victus 16 (2024) | |
| Dell G16, i7-13650HX, RTX 4060 | |
| Gigabyte G6X 9KG (2024) | |
| Genomsnitt NVIDIA GeForce RTX 4060 Laptop GPU (60.7 - 141.1, n=54) | |
| HP Victus 16 (2024) | |
| Genomsnitt av klass Gaming (55.5 - 148.5, n=106, senaste 2 åren) | |
| Asus TUF Gaming A16 FA617XS | |
| Cyberpunk 2077 | |
| 1920x1080 Ultra Preset (FSR off) | |
| Genomsnitt av klass Gaming (17.7 - 169.9, n=112, senaste 2 åren) | |
| Lenovo Legion 5 16IRX G9 (2.02) | |
| HP Victus 16 (2024) (2.02, Leistung) | |
| Genomsnitt NVIDIA GeForce RTX 4060 Laptop GPU (56.4 - 93.1, n=31) | |
| Dell G16, i7-13650HX, RTX 4060 (2.11) | |
| Gigabyte G6X 9KG (2024) (2.02) | |
| HP Victus 16 (2024) (2.02) | |
| 2560x1440 Ultra Preset (FSR off) | |
| Genomsnitt av klass Gaming (42.3 - 122.8, n=90, senaste 2 åren) | |
| Lenovo Legion 5 16IRX G9 (2.02) | |
| Dell G16, i7-13650HX, RTX 4060 (2.11) | |
| Genomsnitt NVIDIA GeForce RTX 4060 Laptop GPU (32.9 - 51.8, n=19) | |
| 1920x1080 Ray Tracing Ultra Preset (DLSS off) | |
| Genomsnitt av klass Gaming (19.8 - 84.9, n=32, senaste 2 åren) | |
| HP Victus 16 (2024) (2.02, Leistung) | |
| Genomsnitt NVIDIA GeForce RTX 4060 Laptop GPU (23.6 - 37.4, n=21) | |
| Gigabyte G6X 9KG (2024) (2.02) | |
| HP Victus 16 (2024) (2.02) | |
| Dragon's Dogma 2 - 1920x1080 High Preset | |
| Genomsnitt av klass Gaming (66 - 99.3, n=5, senaste 2 åren) | |
| HP Victus 16 (2024) | |
| Genomsnitt NVIDIA GeForce RTX 4060 Laptop GPU (57.2 - 67.7, n=5) | |
| Razer Blade 14 Mid 23 | |
| Palworld - 1920x1080 Epic Preset AA:TSR | |
| Razer Blade 14 Mid 23 | |
| Genomsnitt NVIDIA GeForce RTX 4060 Laptop GPU (83.9 - 87.8, n=2) | |
| HP Victus 16 (2024) | |
| Genomsnitt av klass Gaming (n=1senaste 2 åren) | |
| The Finals | |
| 1920x1080 Epic Preset | |
| Razer Blade 14 Mid 23 | |
| Genomsnitt NVIDIA GeForce RTX 4060 Laptop GPU (122.3 - 126, n=2) | |
| HP Victus 16 (2024) | |
| Genomsnitt av klass Gaming (n=1senaste 2 åren) | |
| 1920x1080 Epic Preset + Epic RTX Global Illumination | |
| Razer Blade 14 Mid 23 | |
| Genomsnitt NVIDIA GeForce RTX 4060 Laptop GPU (116.8 - 121.1, n=2) | |
| HP Victus 16 (2024) | |
| EA Sports WRC - 1920x1080 Ultra Preset AA:Epic AF:16x | |
| HP Victus 16 (2024) | |
| Genomsnitt NVIDIA GeForce RTX 4060 Laptop GPU (78.4 - 79.6, n=2) | |
| Razer Blade 14 Mid 23 | |
| Genomsnitt av klass Gaming (n=1senaste 2 åren) | |
| Enshrouded - 1920x1080 Max. Quality AA:FX | |
| HP Victus 16 (2024) | |
| Genomsnitt NVIDIA GeForce RTX 4060 Laptop GPU (43 - 51.1, n=2) | |
| Razer Blade 14 Mid 23 | |
| Genomsnitt av klass Gaming (n=1senaste 2 åren) | |
Witcher 3 FPS diagram
| låg | med. | hög | ultra | |
|---|---|---|---|---|
| GTA V (2015) | 185.8 | 181.2 | 176.1 | 110.2 |
| The Witcher 3 (2015) | 448.6 | 297.7 | 181.9 | 99.9 |
| Dota 2 Reborn (2015) | 198.1 | 177.8 | 168.4 | 149.7 |
| Final Fantasy XV Benchmark (2018) | 208 | 135.3 | 98.1 | |
| X-Plane 11.11 (2018) | 154.4 | 129.2 | 100.3 | |
| Strange Brigade (2018) | 406 | 253 | 205 | 179 |
| Cyberpunk 2077 (2023) | 113.6 | 90 | 76.9 | 67.1 |
| EA Sports WRC (2023) | 129.3 | 93.7 | 85.2 | 79.6 |
| The Finals (2023) | 196.7 | 161.7 | 155.9 | 122.3 |
| Palworld (2024) | 139.2 | 116.3 | 91.8 | 83.9 |
| Enshrouded (2024) | 85.5 | 71.2 | 59.7 | 51.1 |
| Dragon's Dogma 2 (2024) | 67.1 | 63.3 |
Utsläpp & effekt - Den bärbara gamingdatorn med imponerande drifttider
Bullerutsläpp
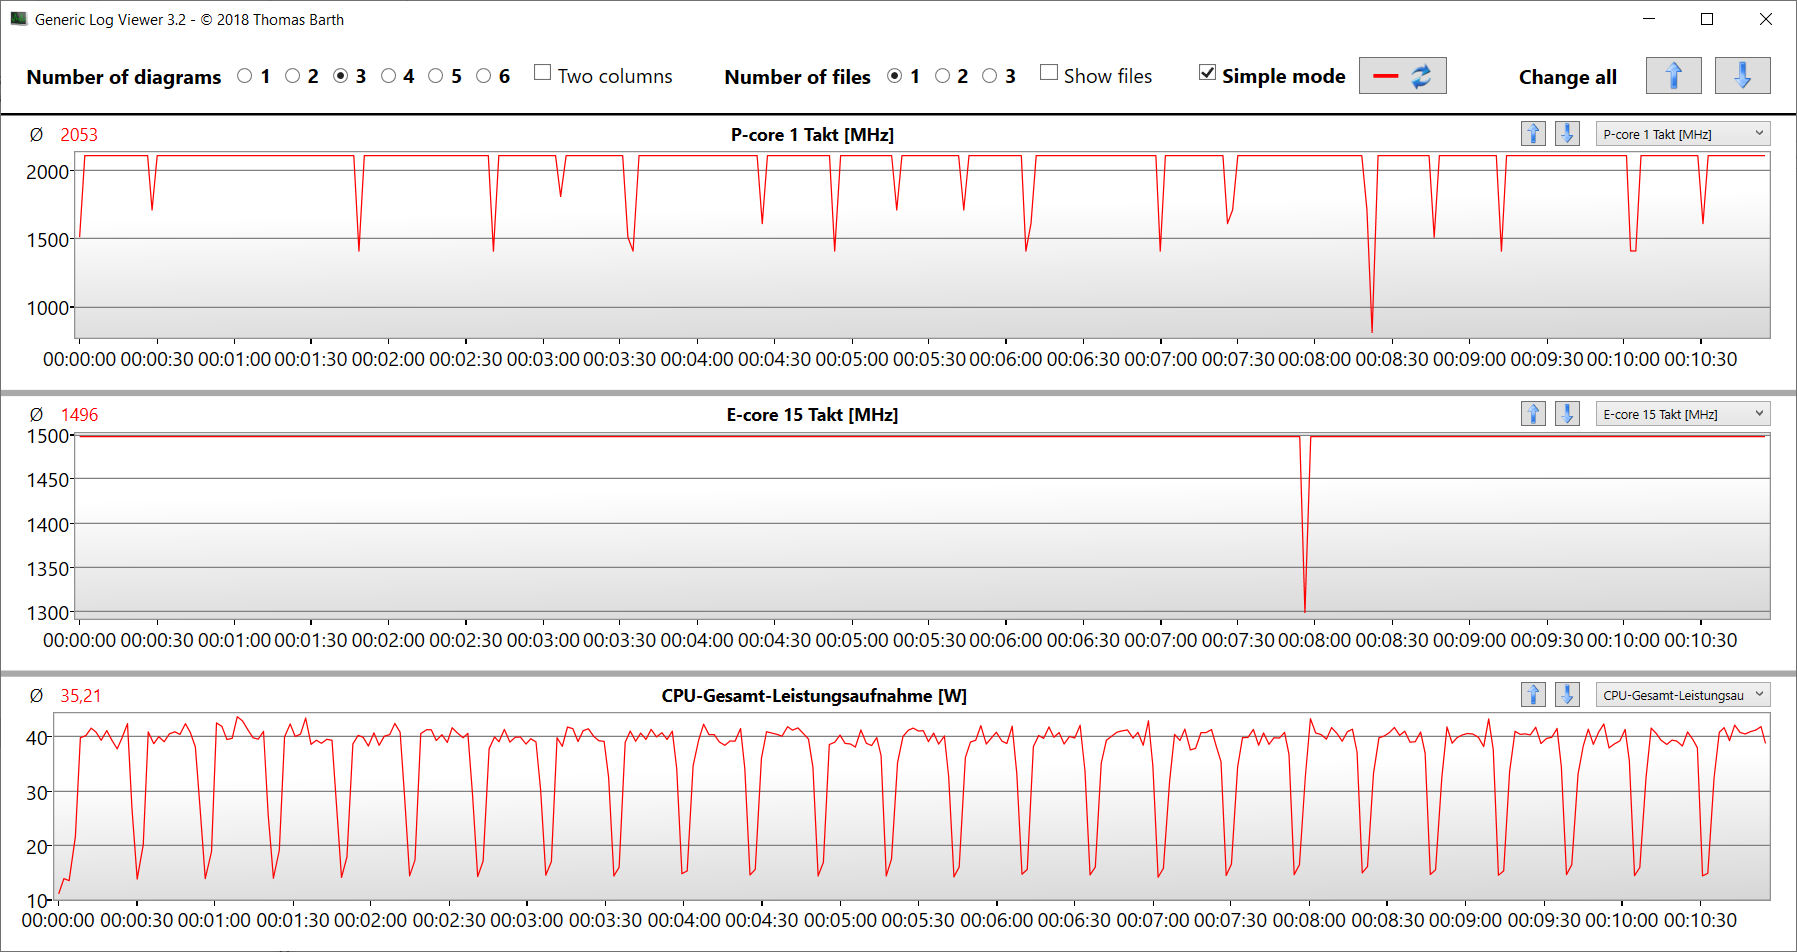
Fläktarna hålls vanligtvis så låga som möjligt och snurrar bara snabbare när det inte finns något annat alternativ. Trots detta stiger enhetens bulleremissioner till upp till 48 dB(A) vid full belastning ("Balanced"). "Performance" resulterar i ännu högre värden. En betydligt tystare användning kan uppnås med hjälp av "Eco"-läget.
I viloläge eller under låg belastning är det möjligt att fläktarna står helt stilla. HP Bios-alternativet "fan always on" (som är aktivt som standard) måste dock avaktiveras för detta. Annars säkerställer det att fläktarna alltid är igång.
Ljudnivå
| Låg belastning |
| 28 / 29 / 33 dB(A) |
| Hög belastning |
| 45 / 48 dB(A) |
 | ||
30 dB tyst 40 dB(A) hörbar 50 dB(A) högt ljud |
||
min: | ||
| HP Victus 16 (2024) GeForce RTX 4060 Laptop GPU, i7-14700HX, Kioxia XG8 KXG80ZNV512G | Gigabyte G6X 9KG (2024) GeForce RTX 4060 Laptop GPU, i7-13650HX, Gigabyte AG450E1024-SI | Dell G16, i7-13650HX, RTX 4060 GeForce RTX 4060 Laptop GPU, i7-13650HX, WD PC SN740 SDDPNQD-1T00 | Lenovo Legion 5 16IRX G9 GeForce RTX 4060 Laptop GPU, i7-14650HX, Samsung PM9A1 MZVL21T0HCLR | Asus TUF Gaming A16 FA617XS Radeon RX 7600S, R9 7940HS, Micron 2400 MTFDKBA512QFM | |
|---|---|---|---|---|---|
| Noise | -10% | 13% | -3% | 2% | |
| av / miljö * (dB) | 25 | 26 -4% | 23 8% | 24 4% | 25 -0% |
| Idle Minimum * (dB) | 28 | 30 -7% | 23 18% | 24 14% | 25 11% |
| Idle Average * (dB) | 29 | 32 -10% | 23 21% | 28.8 1% | 26 10% |
| Idle Maximum * (dB) | 33 | 35 -6% | 27.96 15% | 32 3% | 28 15% |
| Load Average * (dB) | 45 | 51 -13% | 27.96 38% | 45.5 -1% | 43 4% |
| Witcher 3 ultra * (dB) | 43 | 51 -19% | 47.89 -11% | 53.1 -23% | 51 -19% |
| Load Maximum * (dB) | 48 | 54 -13% | 47.89 -0% | 55.7 -16% | 53 -10% |
* ... mindre är bättre
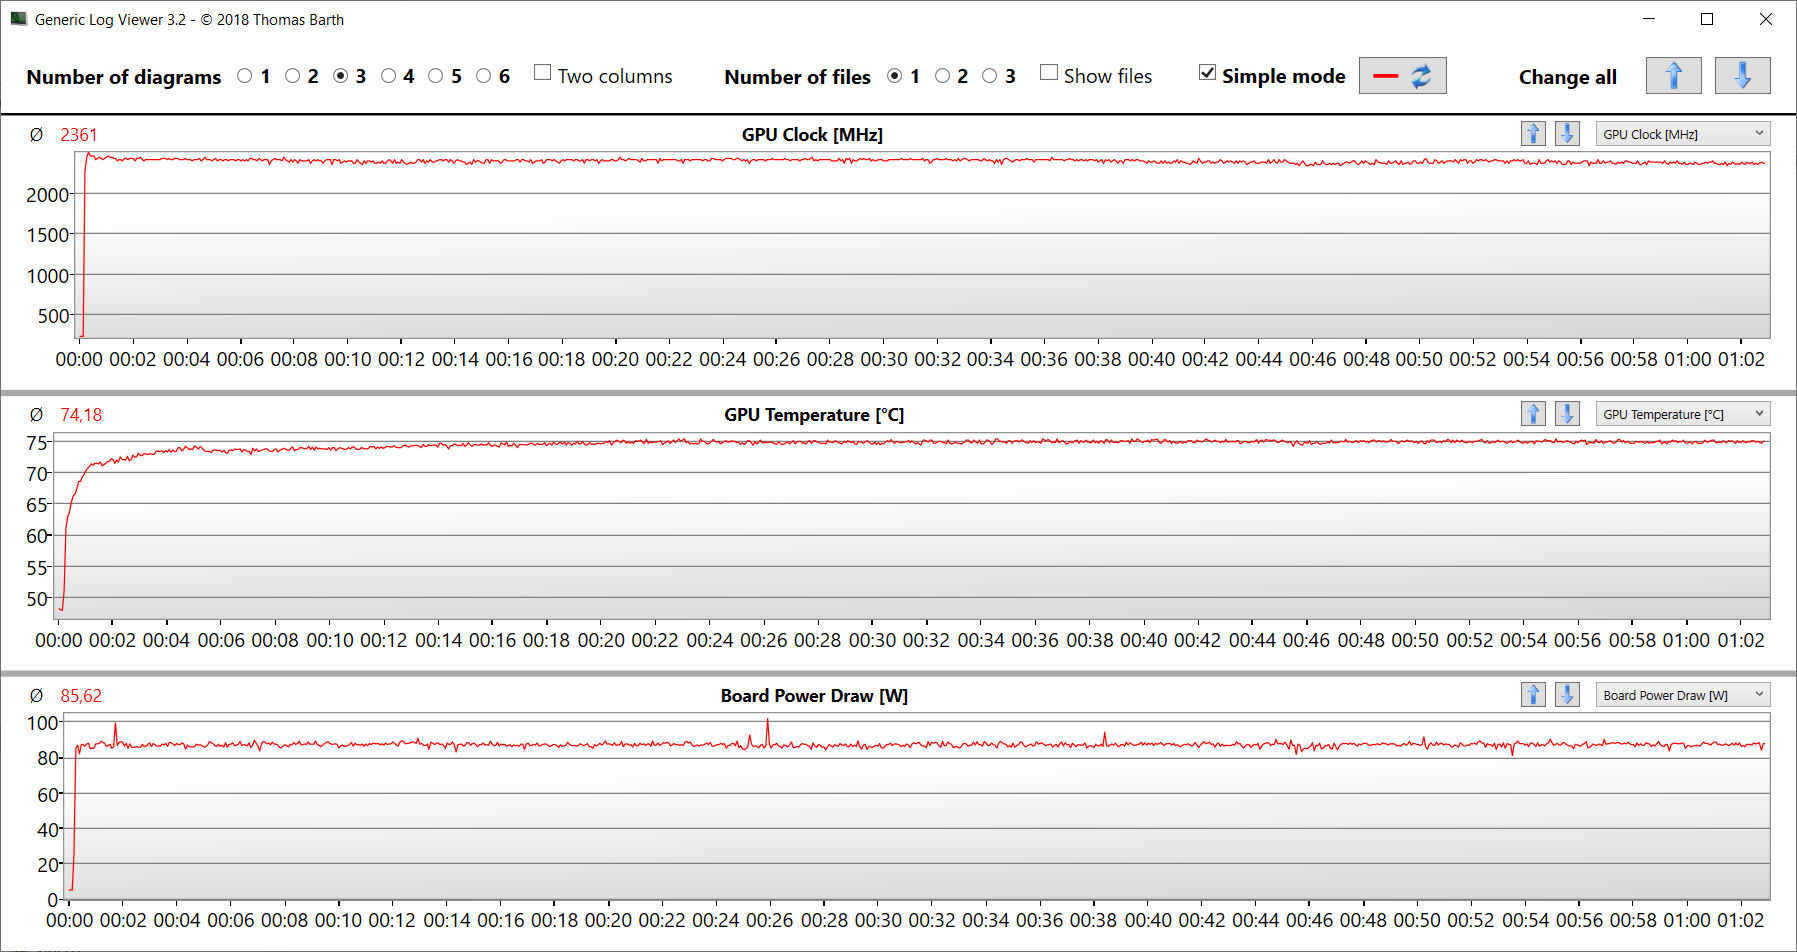
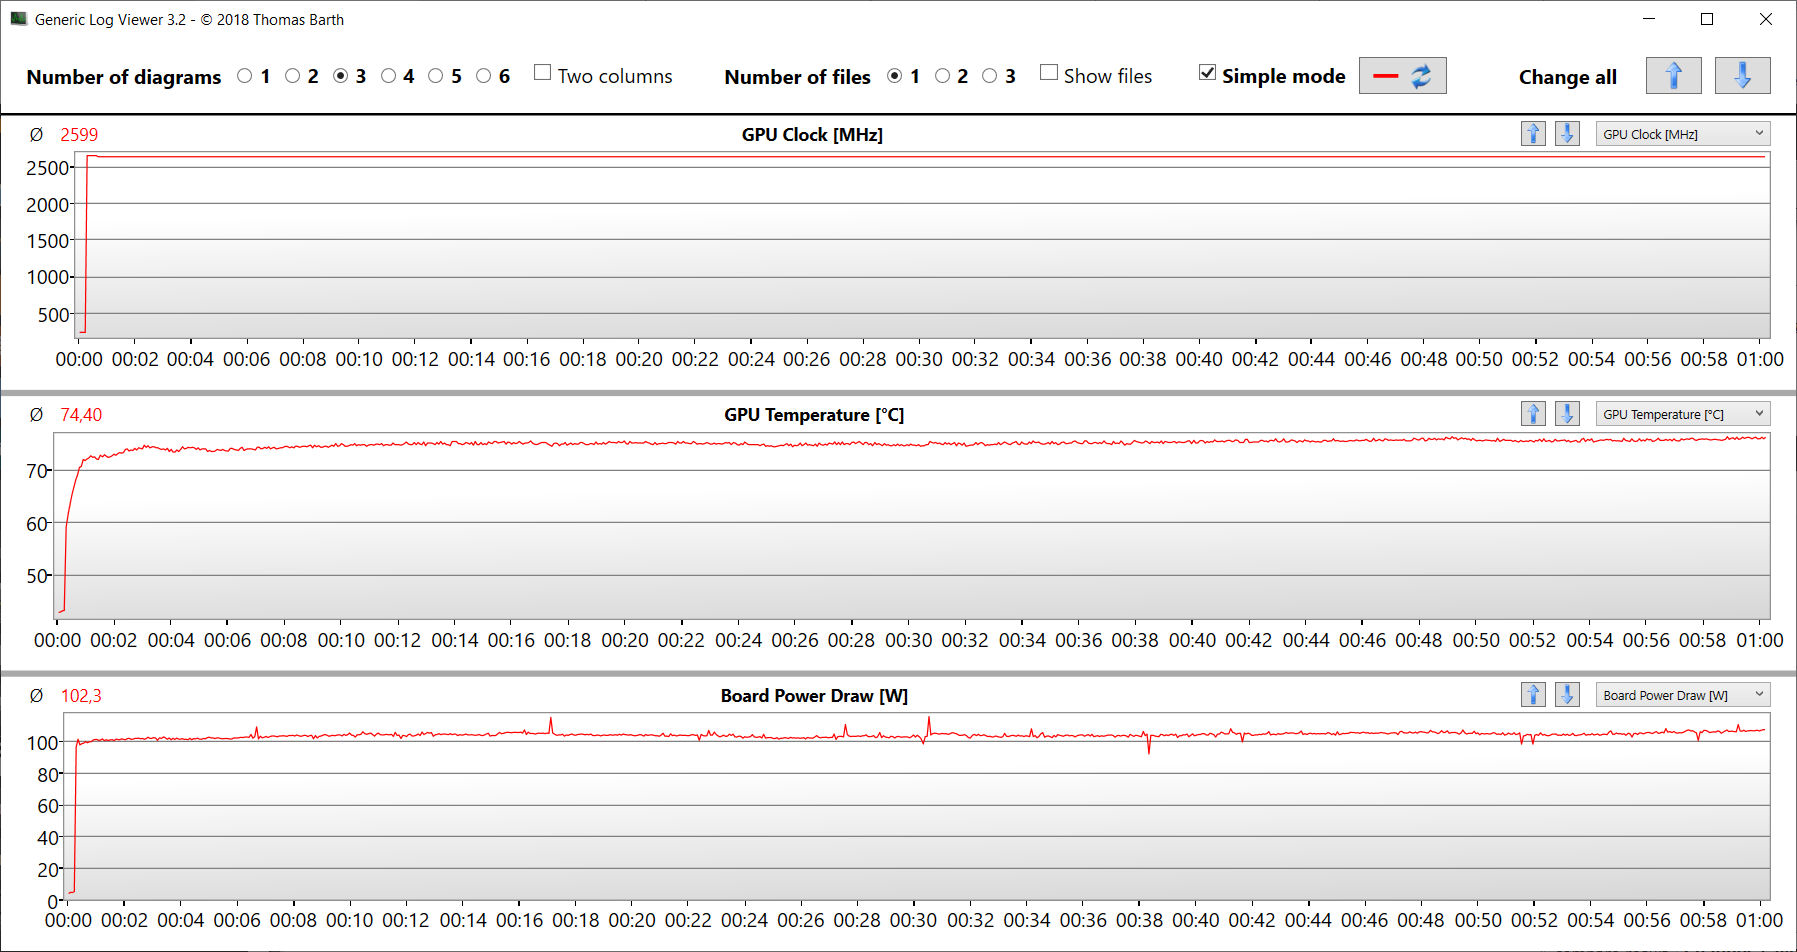
Temperatur
Stresstestet och Witcher 3 gör att den bärbara datorn värms upp märkbart. Temperaturer på 50 °C uppnåddes vid vissa tillfällen under testerna. Vid vardaglig användning (kontor, internet) ligger värdena i allmänhet inom det gröna området.
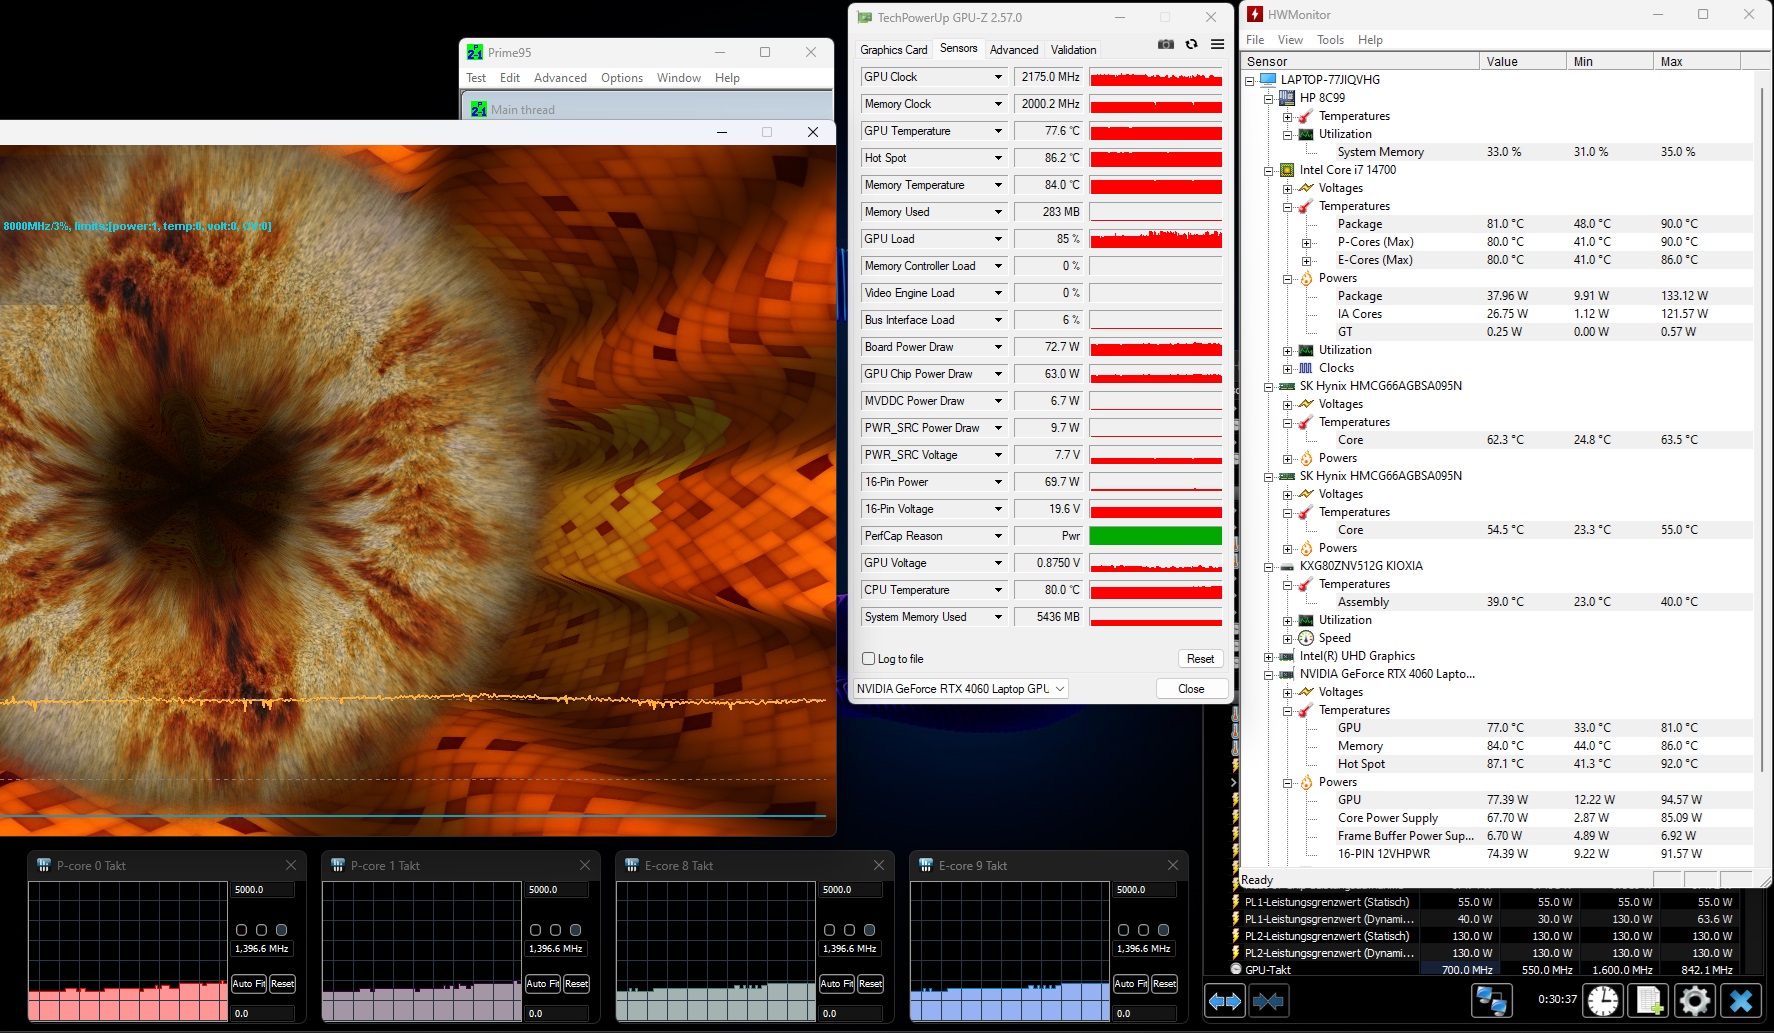
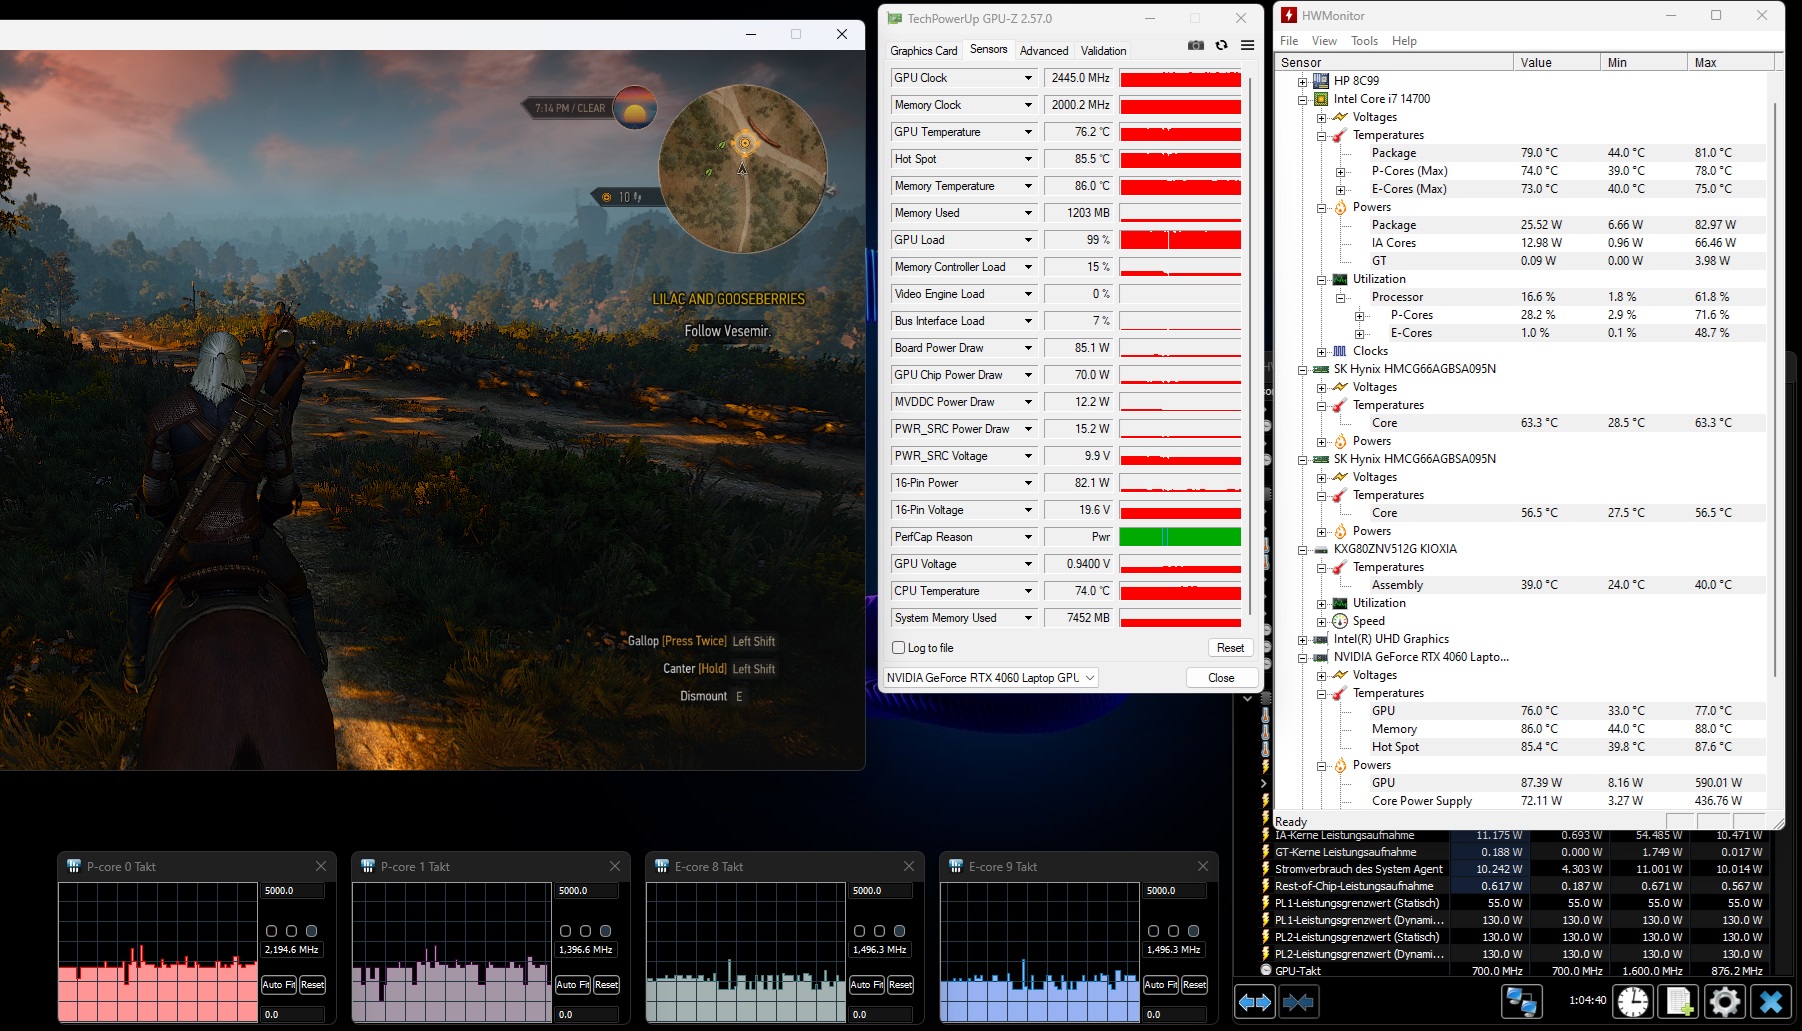
Det extrema stresstestscenariot (Prime95 och Furmark i kontinuerlig drift) kontrollerar systemets stabilitet under full belastning. CPU-klockan fluktuerade i början, men stabiliserades sedan på en låg nivå senare. GPU:n arbetade med nästan full effekt.
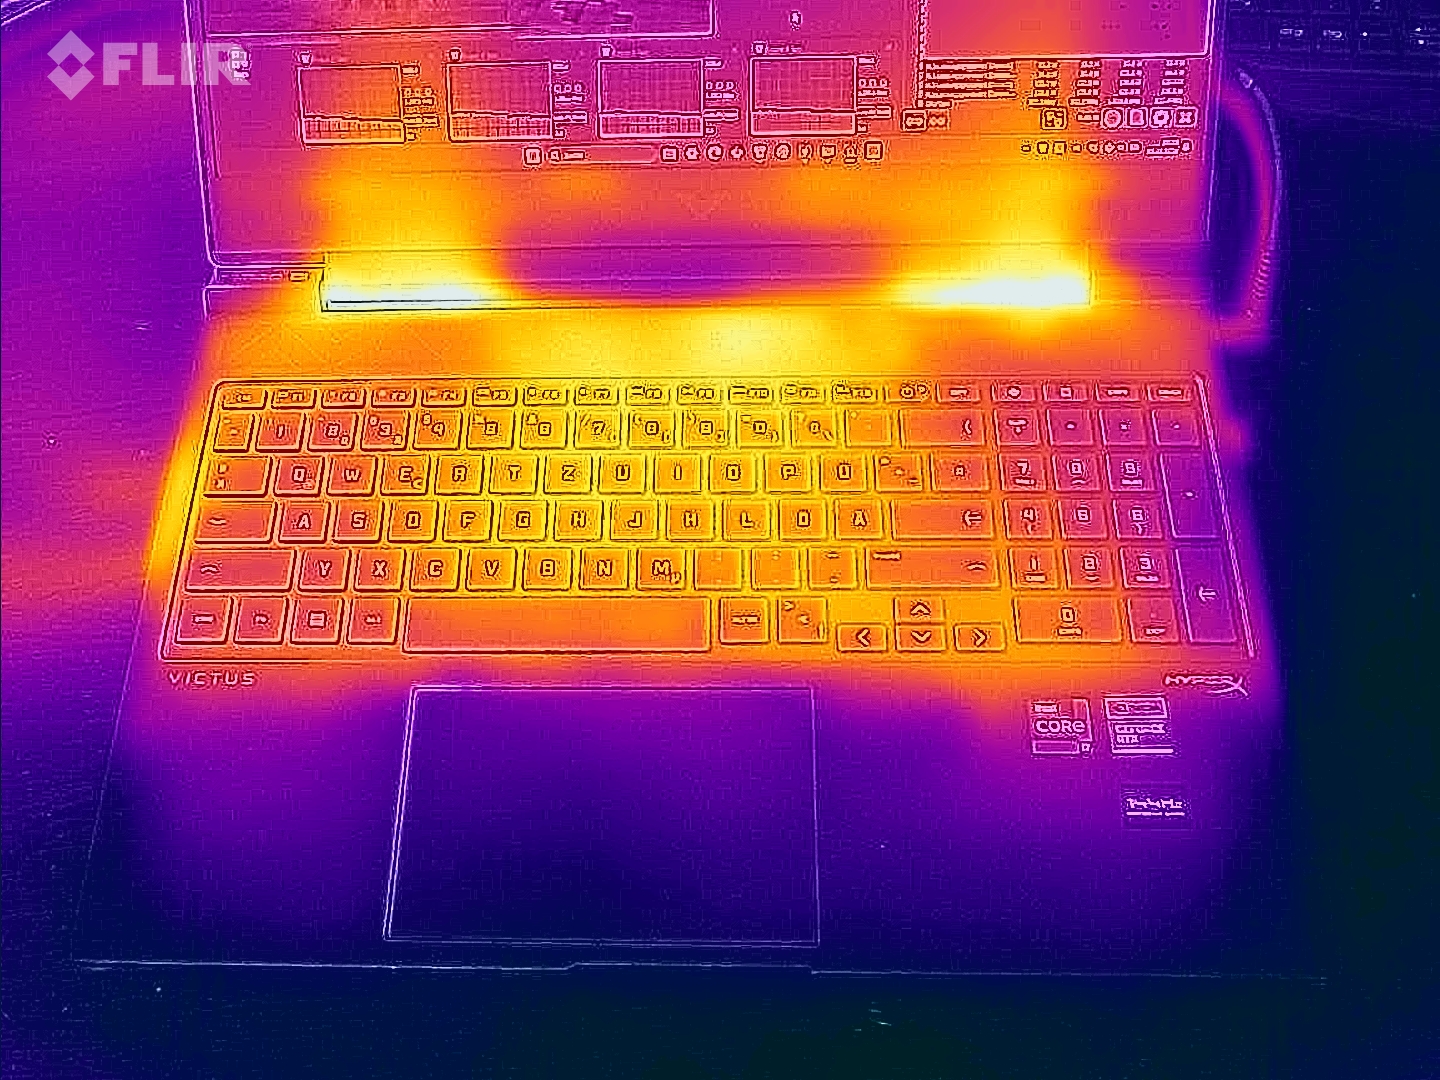
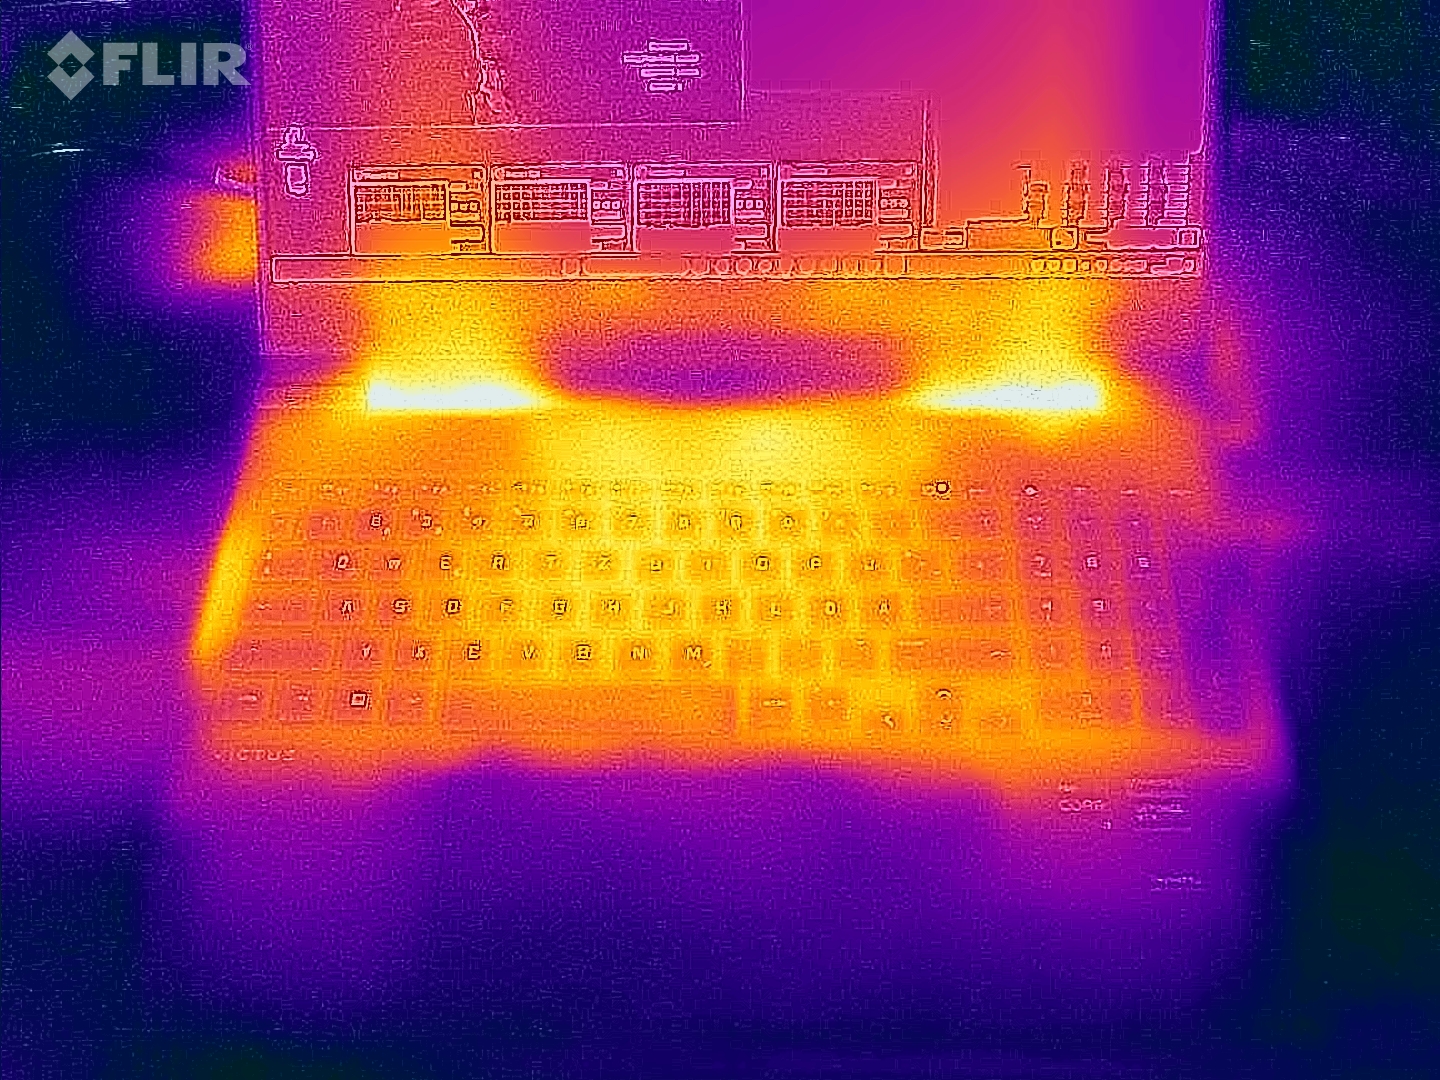
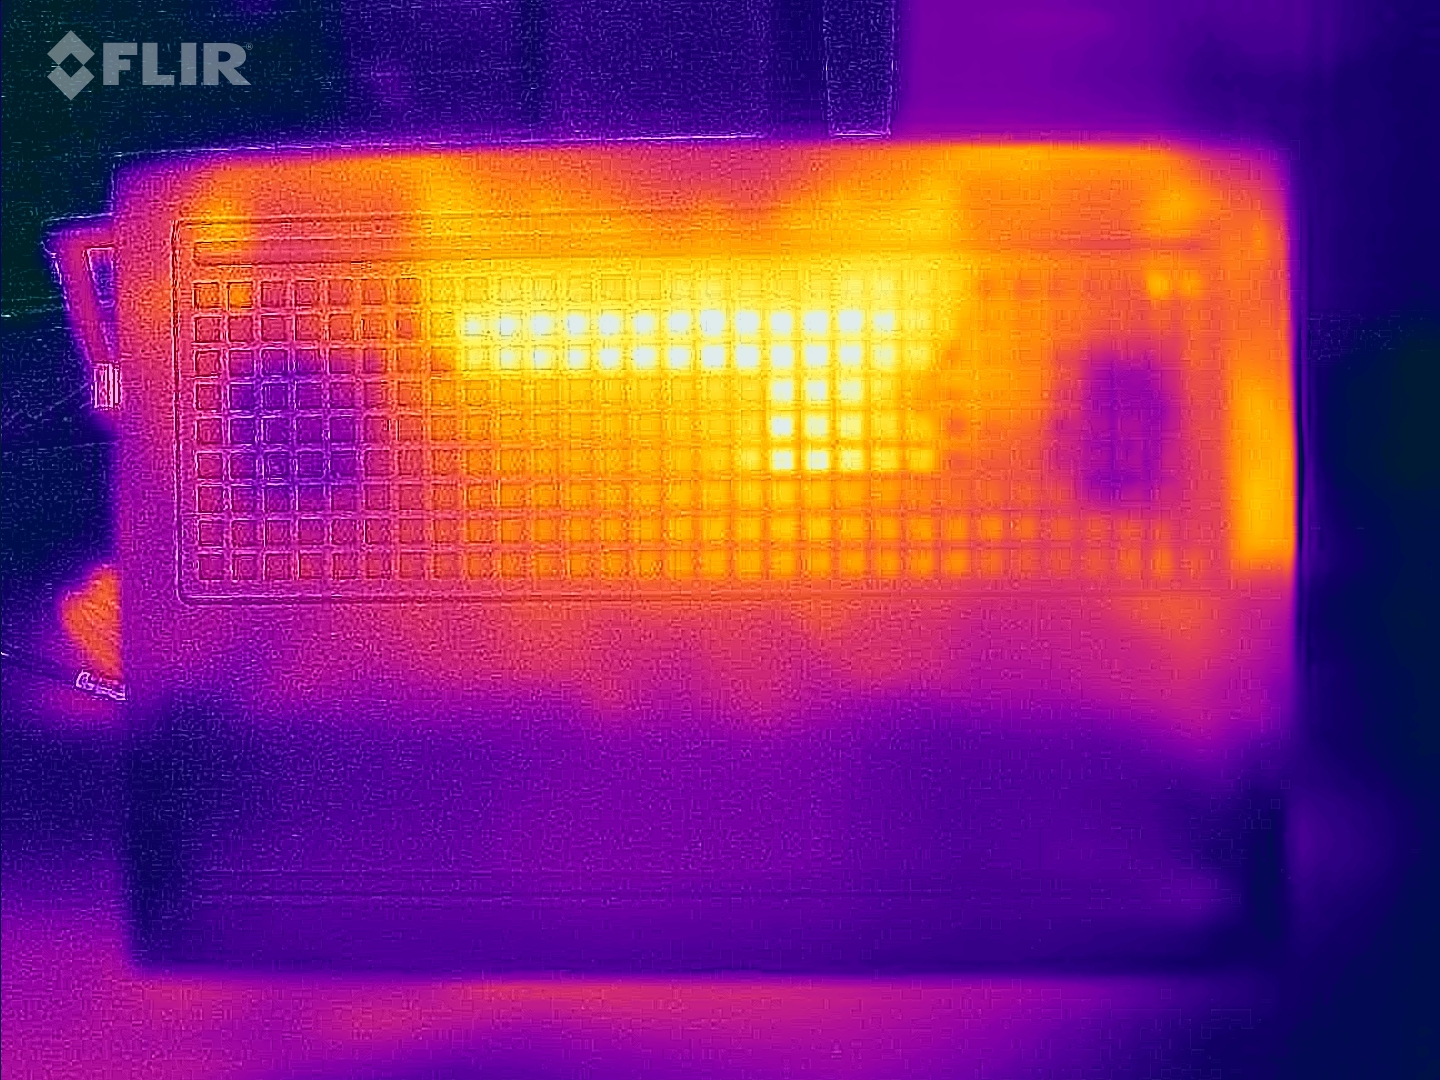
(-) Den maximala temperaturen på ovansidan är 50 °C / 122 F, jämfört med genomsnittet av 40.4 °C / 105 F , allt från 21.2 till 68.8 °C för klassen Gaming.
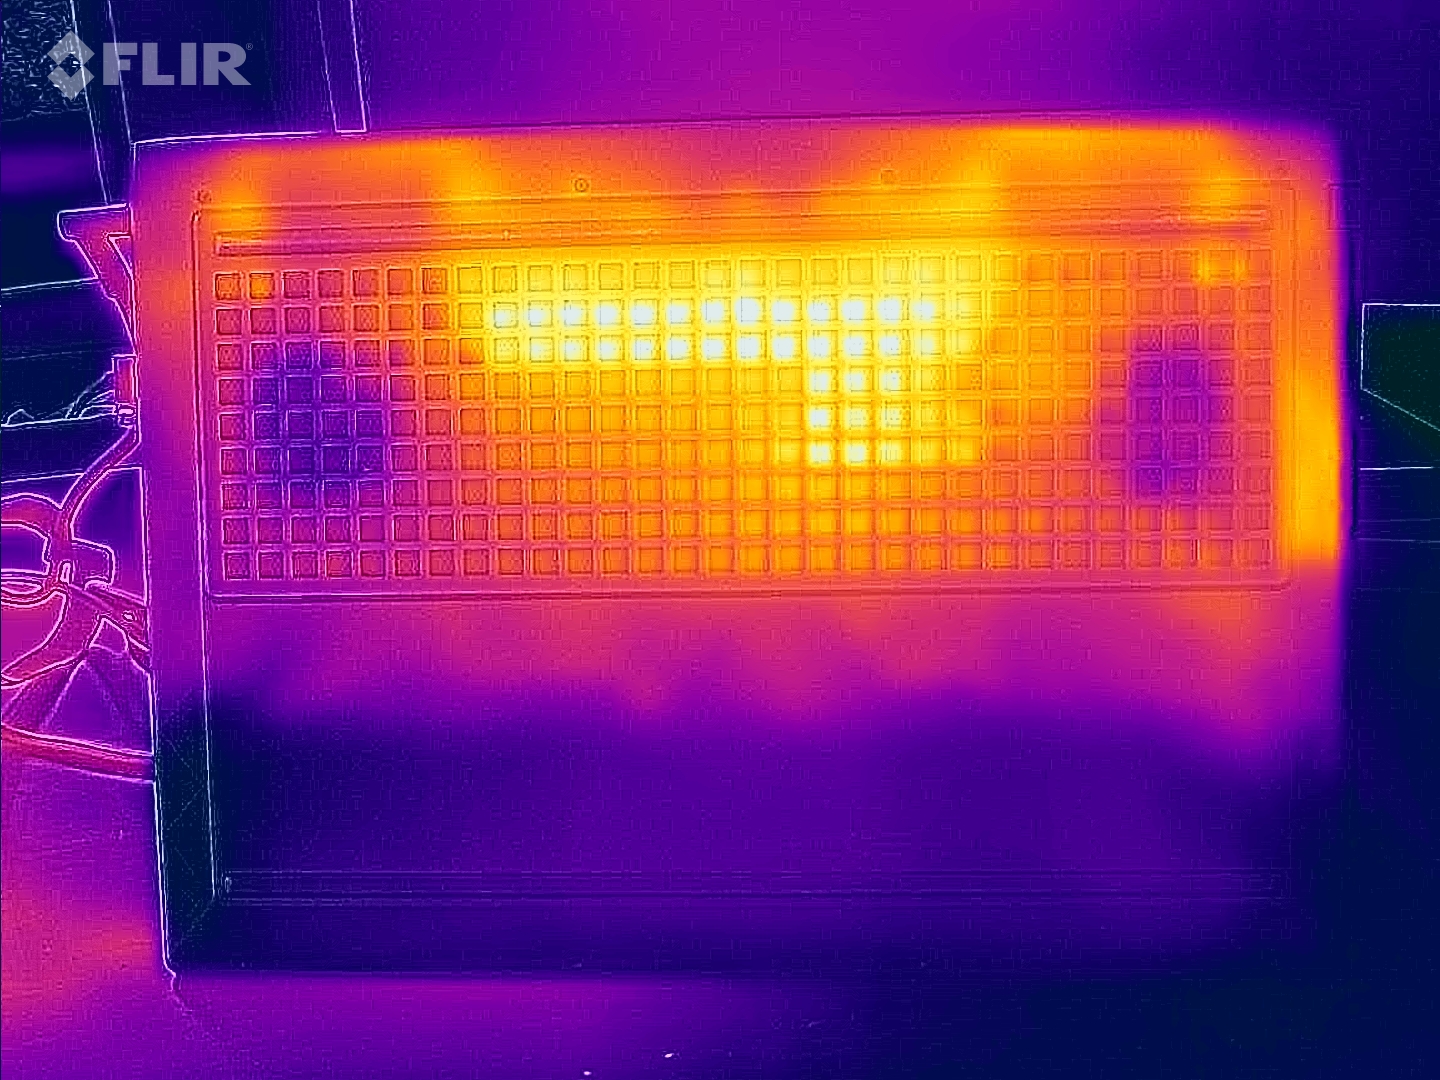
(-) Botten värms upp till maximalt 50 °C / 122 F, jämfört med genomsnittet av 43.2 °C / 110 F
(+) Vid tomgångsbruk är medeltemperaturen för ovansidan 24.7 °C / 76 F, jämfört med enhetsgenomsnittet på 33.9 °C / ### class_avg_f### F.
(-) När du spelar The Witcher 3 är medeltemperaturen för ovansidan 38.3 °C / 101 F, jämfört med enhetsgenomsnittet på 33.9 °C / ## #class_avg_f### F.
(+) Handledsstöden och pekplattan är kallare än hudtemperaturen med maximalt 31 °C / 87.8 F och är därför svala att ta på.
(-) Medeltemperaturen för handledsstödsområdet på liknande enheter var 28.8 °C / 83.8 F (-2.2 °C / -4 F).
| HP Victus 16 (2024) Intel Core i7-14700HX, NVIDIA GeForce RTX 4060 Laptop GPU | Gigabyte G6X 9KG (2024) Intel Core i7-13650HX, NVIDIA GeForce RTX 4060 Laptop GPU | Dell G16, i7-13650HX, RTX 4060 Intel Core i7-13650HX, NVIDIA GeForce RTX 4060 Laptop GPU | Lenovo Legion 5 16IRX G9 Intel Core i7-14650HX, NVIDIA GeForce RTX 4060 Laptop GPU | Asus TUF Gaming A16 FA617XS AMD Ryzen 9 7940HS, AMD Radeon RX 7600S | |
|---|---|---|---|---|---|
| Heat | -10% | -22% | -7% | -9% | |
| Maximum Upper Side * (°C) | 50 | 41 18% | 49 2% | 40.4 19% | 53 -6% |
| Maximum Bottom * (°C) | 50 | 43 14% | 58 -16% | 43.8 12% | 48 4% |
| Idle Upper Side * (°C) | 25 | 32 -28% | 35 -40% | 30.3 -21% | 30 -20% |
| Idle Bottom * (°C) | 26 | 37 -42% | 35 -35% | 35.3 -36% | 30 -15% |
* ... mindre är bättre
Högtalare
Den bärbara datorns stereohögtalare ger överlag ett hyfsat ljud, även om det skulle behöva mer bas.
HP Victus 16 (2024) ljudanalys
(+) | högtalare kan spela relativt högt (82 dB)
Bas 100 - 315 Hz
(-) | nästan ingen bas - i genomsnitt 20.3% lägre än medianen
(±) | linjäriteten för basen är genomsnittlig (13.3% delta till föregående frekvens)
Mellan 400 - 2000 Hz
(+) | balanserad mellan - endast 1.6% från medianen
(+) | mids är linjära (3.3% delta till föregående frekvens)
Högsta 2 - 16 kHz
(+) | balanserade toppar - endast 3.1% från medianen
(+) | toppar är linjära (4.7% delta till föregående frekvens)
Totalt 100 - 16 000 Hz
(+) | det totala ljudet är linjärt (14% skillnad mot median)
Jämfört med samma klass
» 23% av alla testade enheter i den här klassen var bättre, 7% liknande, 70% sämre
» Den bästa hade ett delta på 6%, genomsnittet var 18%, sämst var 132%
Jämfört med alla testade enheter
» 16% av alla testade enheter var bättre, 4% liknande, 80% sämre
» Den bästa hade ett delta på 4%, genomsnittet var 23%, sämst var 134%
Gigabyte G6X 9KG (2024) ljudanalys
(+) | högtalare kan spela relativt högt (82 dB)
Bas 100 - 315 Hz
(-) | nästan ingen bas - i genomsnitt 24.9% lägre än medianen
(±) | linjäriteten för basen är genomsnittlig (13.7% delta till föregående frekvens)
Mellan 400 - 2000 Hz
(+) | balanserad mellan - endast 4.1% från medianen
(+) | mids är linjära (5.4% delta till föregående frekvens)
Högsta 2 - 16 kHz
(+) | balanserade toppar - endast 2.2% från medianen
(±) | linjäriteten för toppar är genomsnittlig (7.4% delta till föregående frekvens)
Totalt 100 - 16 000 Hz
(±) | linjäriteten för det totala ljudet är genomsnittlig (17.2% skillnad mot median)
Jämfört med samma klass
» 47% av alla testade enheter i den här klassen var bättre, 11% liknande, 42% sämre
» Den bästa hade ett delta på 6%, genomsnittet var 18%, sämst var 132%
Jämfört med alla testade enheter
» 32% av alla testade enheter var bättre, 8% liknande, 60% sämre
» Den bästa hade ett delta på 4%, genomsnittet var 23%, sämst var 134%
Strömförbrukning
Dess strömförbrukning är ganska normal för den installerade hårdvaran. Medan testet Witcher 3 testet kördes med konstant strömförbrukning, varierade den bärbara datorns efterfrågan i början av stresstestet. Strömförsörjningsenheten (230 watt) är tillräckligt stor.
| Av/Standby | |
| Låg belastning | |
| Hög belastning |
|
Förklaring:
min: | |
Power consumption Witcher 3 / stress test
Power consumption with external monitor
Körtider
Den 16,1-tums stora enheten uppnådde en drifttid på 8:31 timmar under vårt praktiska WLAN-test (som illustrerar belastningen när man besöker webbplatser med hjälp av ett skript) - ett mycket bra värde. Inom jämförelsefältet är det bara Asus TUF Gaming A16 gjorde bättre ifrån sig.
För
Emot
Omdöme - En solid bärbar dator för gaming i mellanklassen
Victus möjliggör FHD-spel med höga till maximala inställningar. Den kraft som krävs levereras av Core i7-14700HX och GeForce RTX 4060. Det är synd och skam: CPU: ns enkelkärniga prestanda ligger något under vad som skulle kunna vara möjligt. Som standard för klassen kan dess utsläpp sänkas till måttliga värden genom att avstå från viss prestanda. Positivt: Under full belastning är den bärbara datorns bullerutsläpp acceptabla.
HP är giriga när det gäller lagring: En bärbar speldator för 1 600 USD måste erbjuda mer lagringsutrymme.
HP har inte hoppat på 16:10-tåget - istället har man hållit sig till bildförhållandet 16:9: Den installerade 16,1-tumspanelen (FHD, 144 Hz) är bra - men med tanke på enhetens pris på cirka 1 600 USD borde den verkligen erbjuda bättre färgrymdstäckning. Dess 512 GB lagringsutrymme är inte mycket för en bärbar speldator. Du skulle förvänta dig mer för priset i denna aspekt också.
HP har inte gett den här bärbara datorn moderna anslutningar som Thunderbolt 4/USB 4, men trots det har man inte glömt bort användbara funktioner som Power Delivery - batteriet kan laddas via en USB-C-strömförsörjning (100 watt). Positivt: Det fulladdade batteriet räcker för WiFi-körtider på cirka 8,5 timmar - ett värde som många andra bärbara speldatorer bara kan drömma om att uppnå.
Ett lönsamt alternativ kan vara Gigabyte G6X 9KG (2024). Denna bärbara dator erbjuder jämförbar datorkraft och lika bra drifttider, men istället för en 16:9-panel har den en 16:10-panel.
Pris och tillgänglighet
HP Victus 16 (2024) kan för närvarande köpas på Amazon för cirka 1.333 US-dollar. Detta är varianten med Core i7-13700HX, NVIDIA GeForce RTX 4060, 64 GB DDR5 RAM och en 2 TB SSD.
Du kan också konfigurera en anpassad variant via HP:s webbplats.
HP Victus 16 (2024)
- 05/14/2024 v7 (old)
Sascha Mölck
Genomskinlighet
Valet av enheter som ska granskas görs av vår redaktion. Testprovet gavs till författaren som ett lån av tillverkaren eller återförsäljaren för denna recension. Långivaren hade inget inflytande på denna recension och inte heller fick tillverkaren en kopia av denna recension innan publiceringen. Det fanns ingen skyldighet att publicera denna recension. Som ett oberoende medieföretag är Notebookcheck inte föremål för auktoritet från tillverkare, återförsäljare eller förlag.
This is how Notebookcheck is testingEvery year, Notebookcheck independently reviews hundreds of laptops and smartphones using standardized procedures to ensure that all results are comparable. We have continuously developed our test methods for around 20 years and set industry standards in the process. In our test labs, high-quality measuring equipment is utilized by experienced technicians and editors. These tests involve a multi-stage validation process. Our complex rating system is based on hundreds of well-founded measurements and benchmarks, which maintains objectivity.
Price comparison

