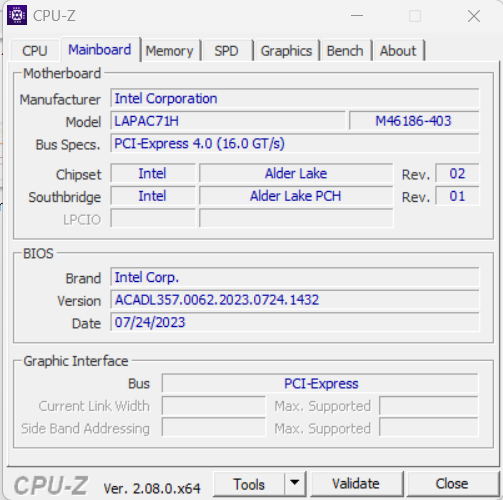
Intel NUC X15 LAPAC71H recension: Bärbar multimediadator med Intel Arc A730M från 1 050 USD
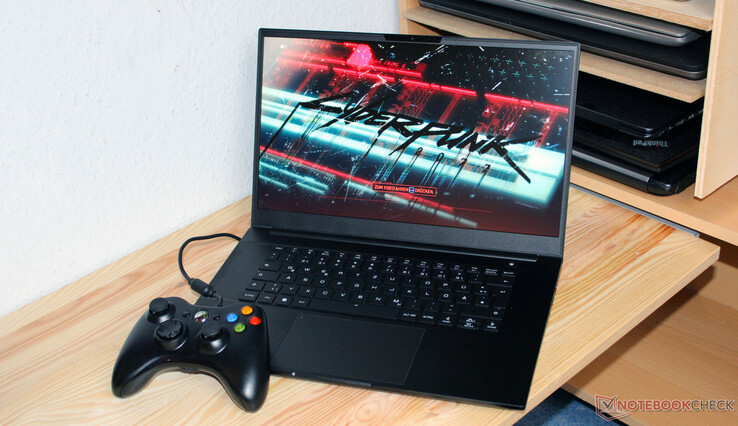
Efter att ha tillkännagivits för hösten 2022 ser Intel NUC X15 - en bärbar dator för spelare och skapare - äntligen dagens ljus ett år senare. Detta borde mestadels vara ett fall av att bli av med varor: X15 och NUC-serien som helhet har redan utgått ur sortimentet hos Intel. Den Schenker-distribuerade bärbara datorns Core i7-12700H, Arc A730Moch FHD-panel är inställda, medan RAM-minne och SSD(s) kan väljas.
Bland konkurrenterna finns enheter som Asus TUF A15 FA507, Gigabyte G5 KE, MSI Cyborg 15 A12VF, Dell Inspiron 16 Plus 7630 och Asus VivoBook Pro 16.
Potentiella konkurrenter i jämförelse
Gradering | Datum | Modell | Vikt | Höjd | Storlek | Upplösning | Pris |
|---|---|---|---|---|---|---|---|
| 84.4 % v7 (old) | 10/2023 | Intel NUC X15 LAPAC71H i7-12700H, A730M | 2.2 kg | 26.7 mm | 15.60" | 1920x1080 | |
| 86.3 % v7 (old) | 06/2023 | Asus TUF A15 FA507 R7 7735HS, GeForce RTX 4050 Laptop GPU | 2.2 kg | 24.9 mm | 15.60" | 1920x1080 | |
| 81.8 % v7 (old) | 04/2023 | Gigabyte G5 KE i5-12500H, GeForce RTX 3060 Laptop GPU | 2 kg | 23.9 mm | 15.60" | 1920x1080 | |
| 87.1 % v7 (old) | 08/2023 | Dell Inspiron 16 Plus 7630 i7-13700H, GeForce RTX 4060 Laptop GPU | 2.2 kg | 19.95 mm | 16.00" | 2560x1600 | |
| 86.3 % v7 (old) | 05/2023 | Asus VivoBook Pro 16 i7-12700H, GeForce RTX 3050 Ti Laptop GPU | 1.9 kg | 20 mm | 16.00" | 2560x1600 | |
| 82.4 % v7 (old) | 04/2023 | MSI Cyborg 15 A12VF i7-12650H, GeForce RTX 4060 Laptop GPU | 2 kg | 22.9 mm | 15.60" | 1920x1080 |
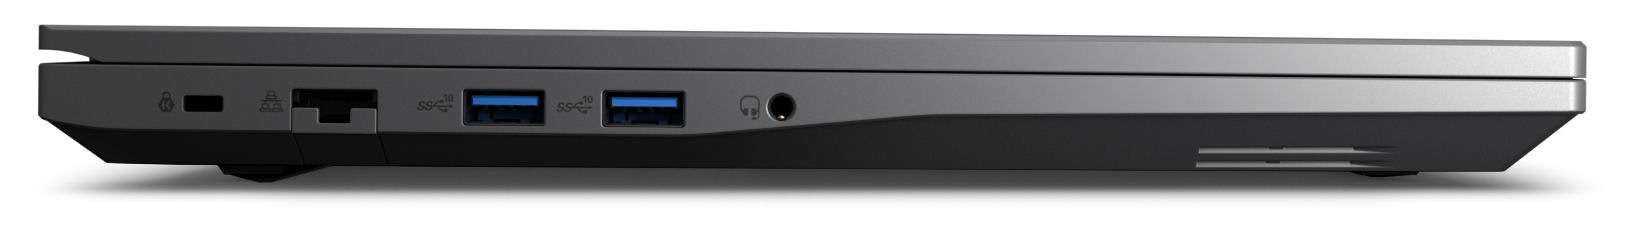
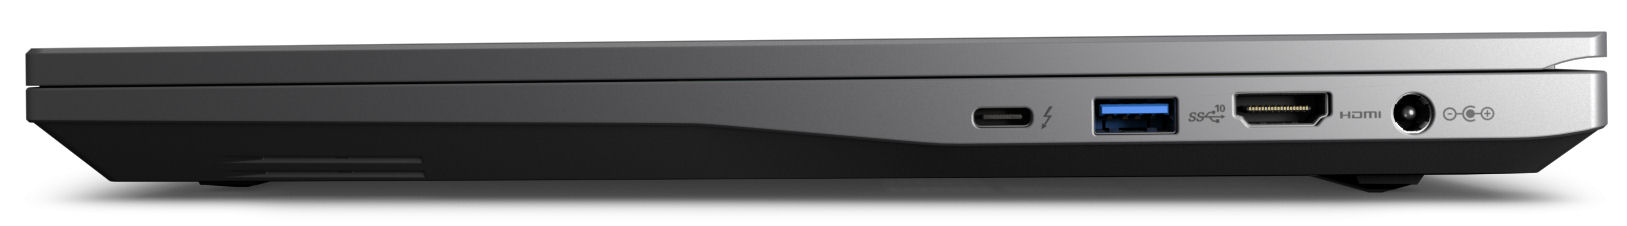
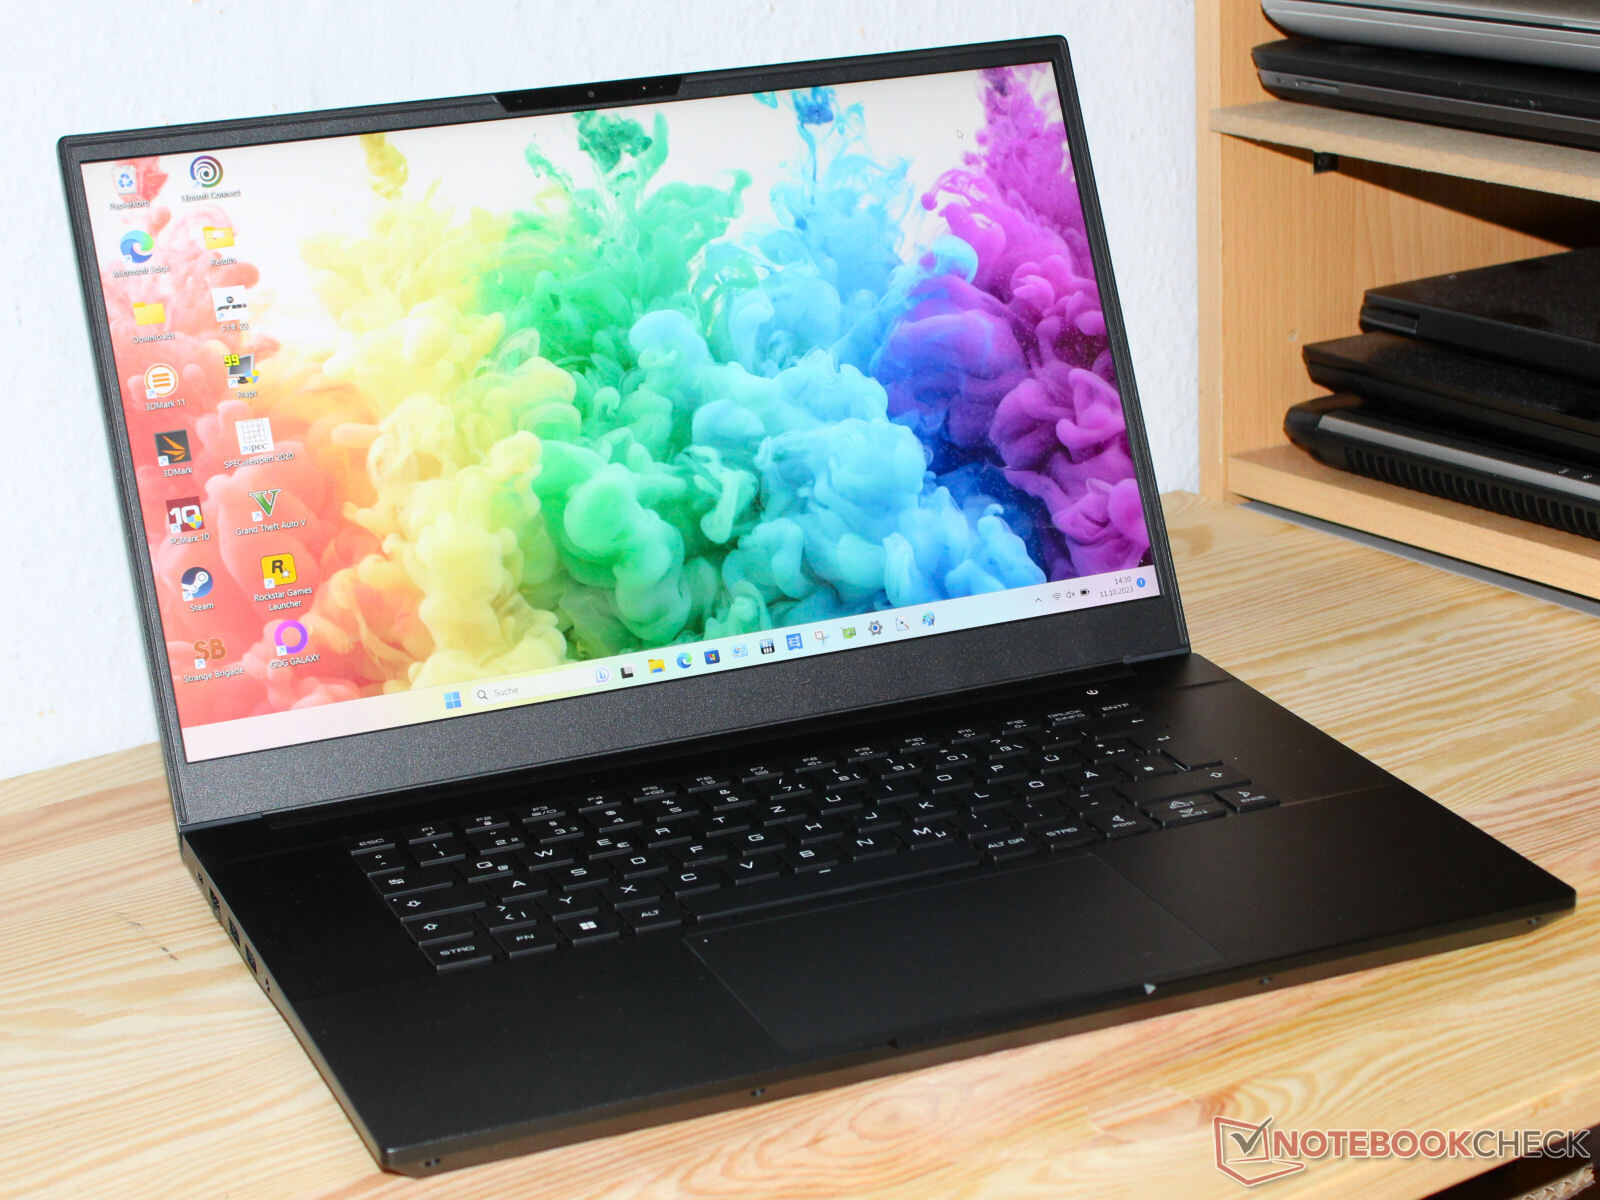
Fodral och anslutningsmöjligheter - Intel NUC har Thunderbolt 4
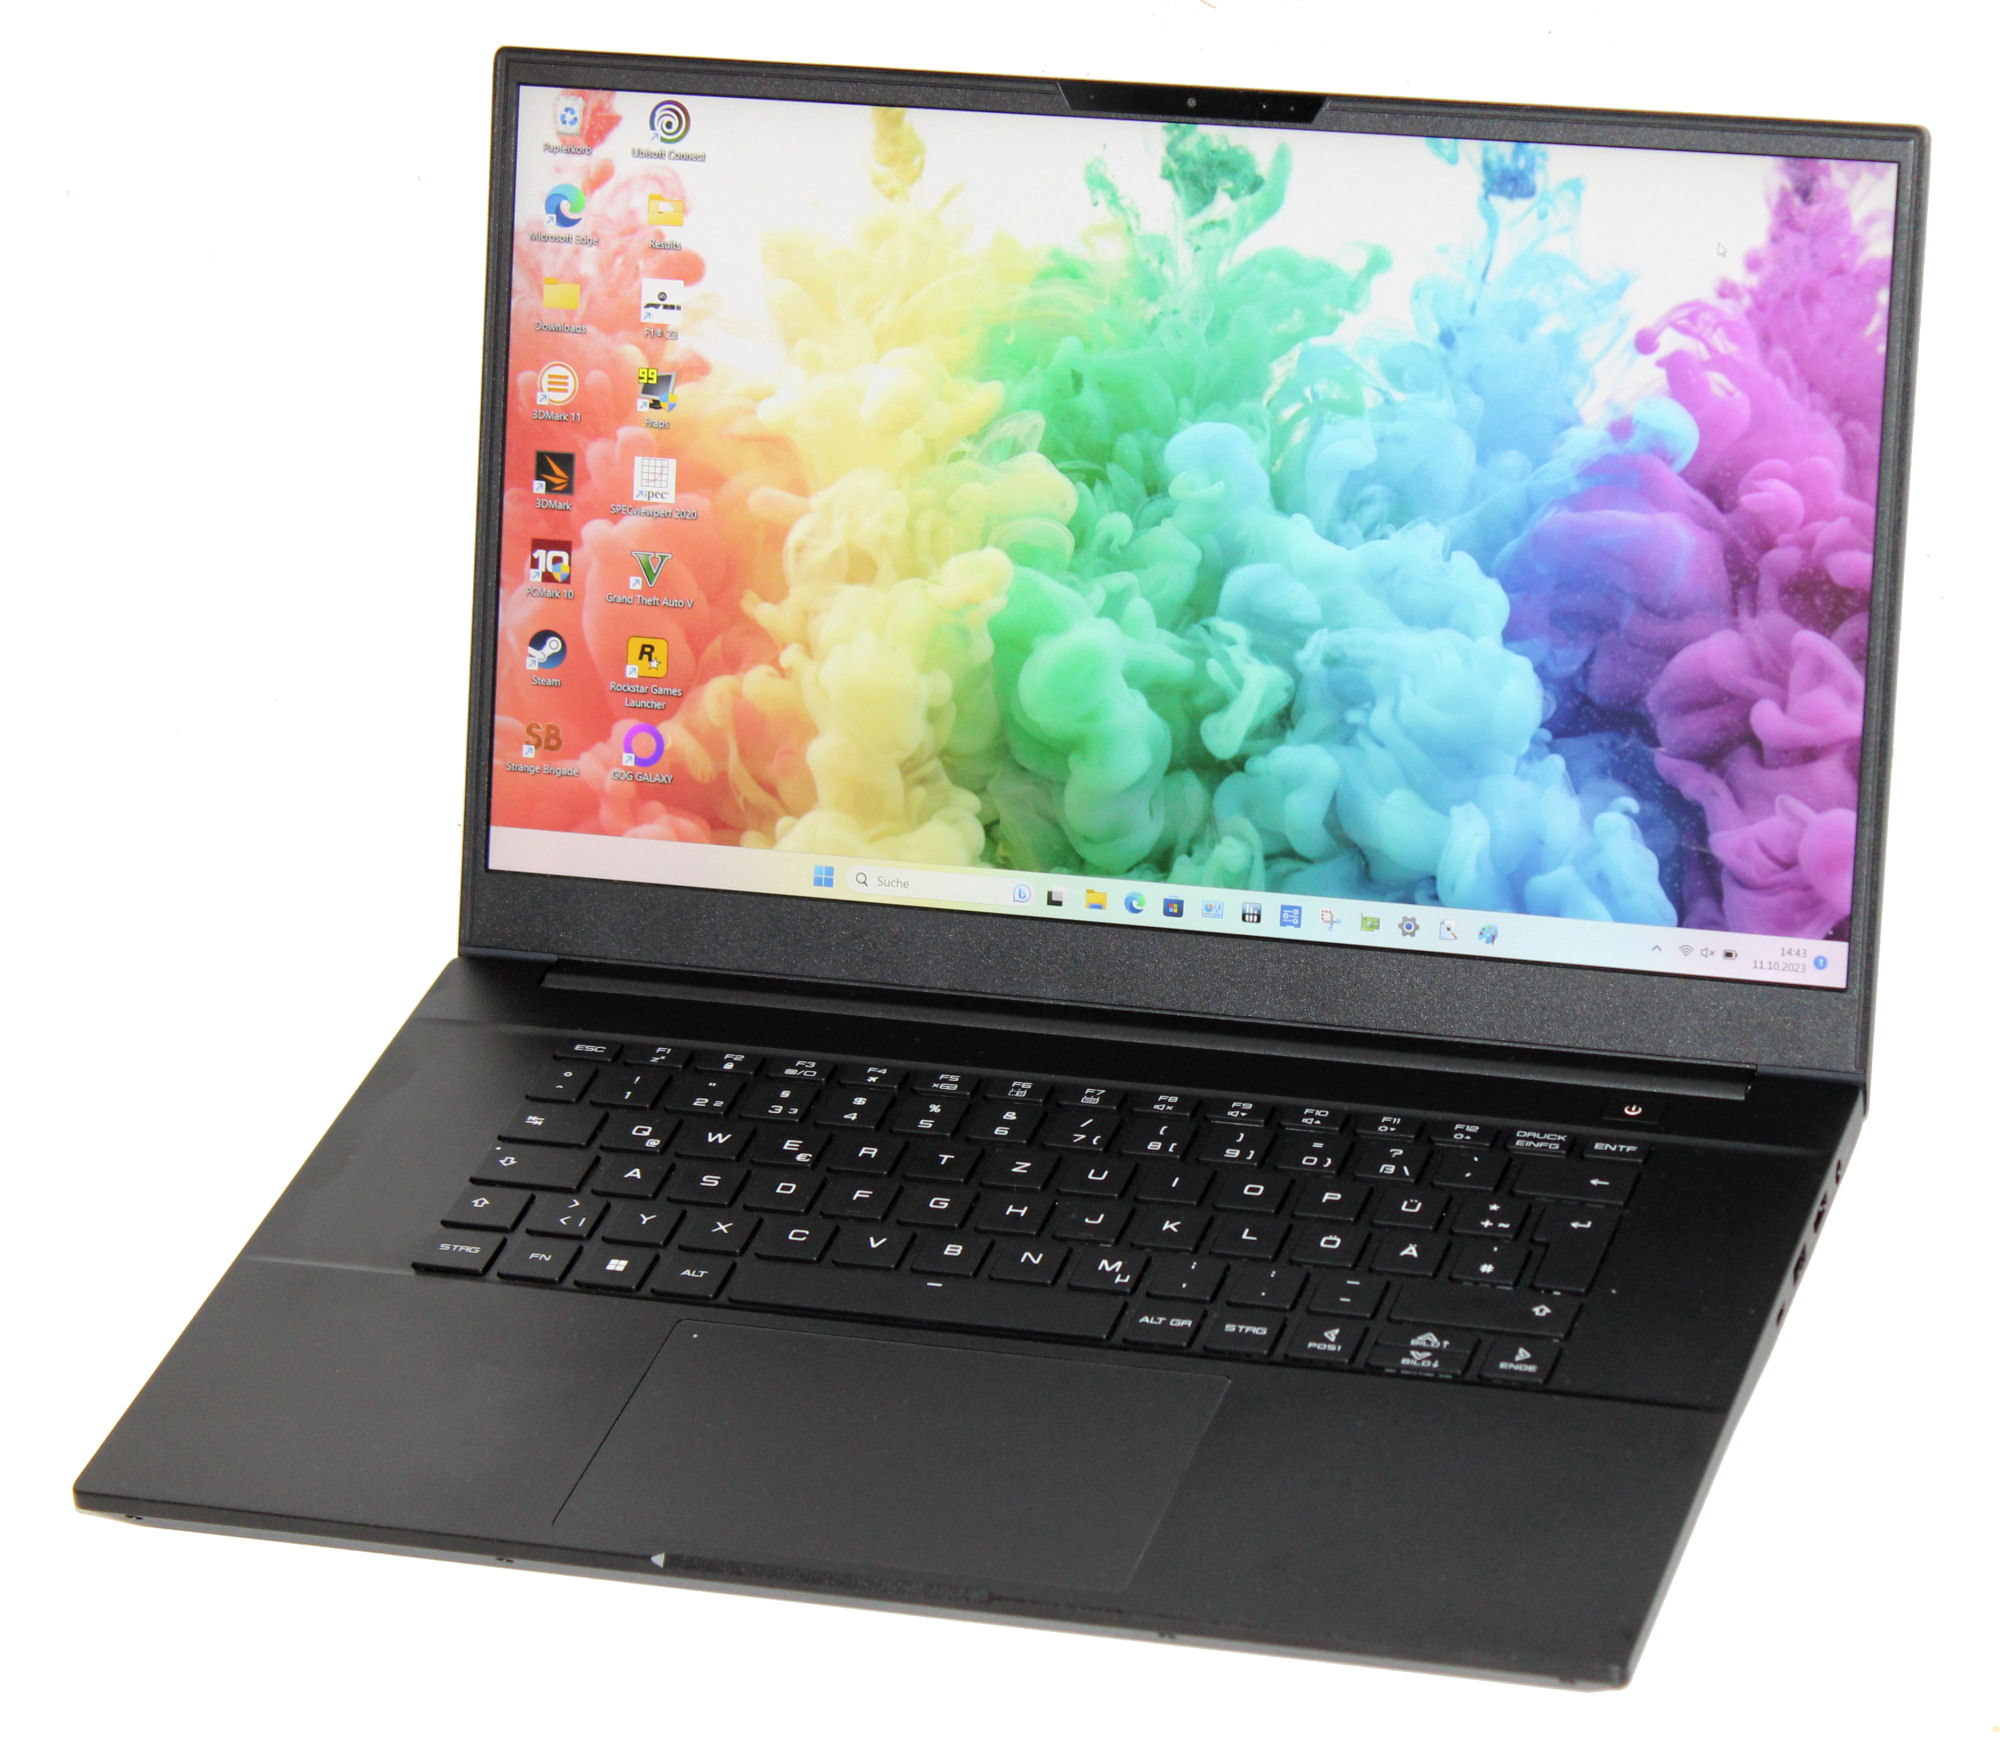
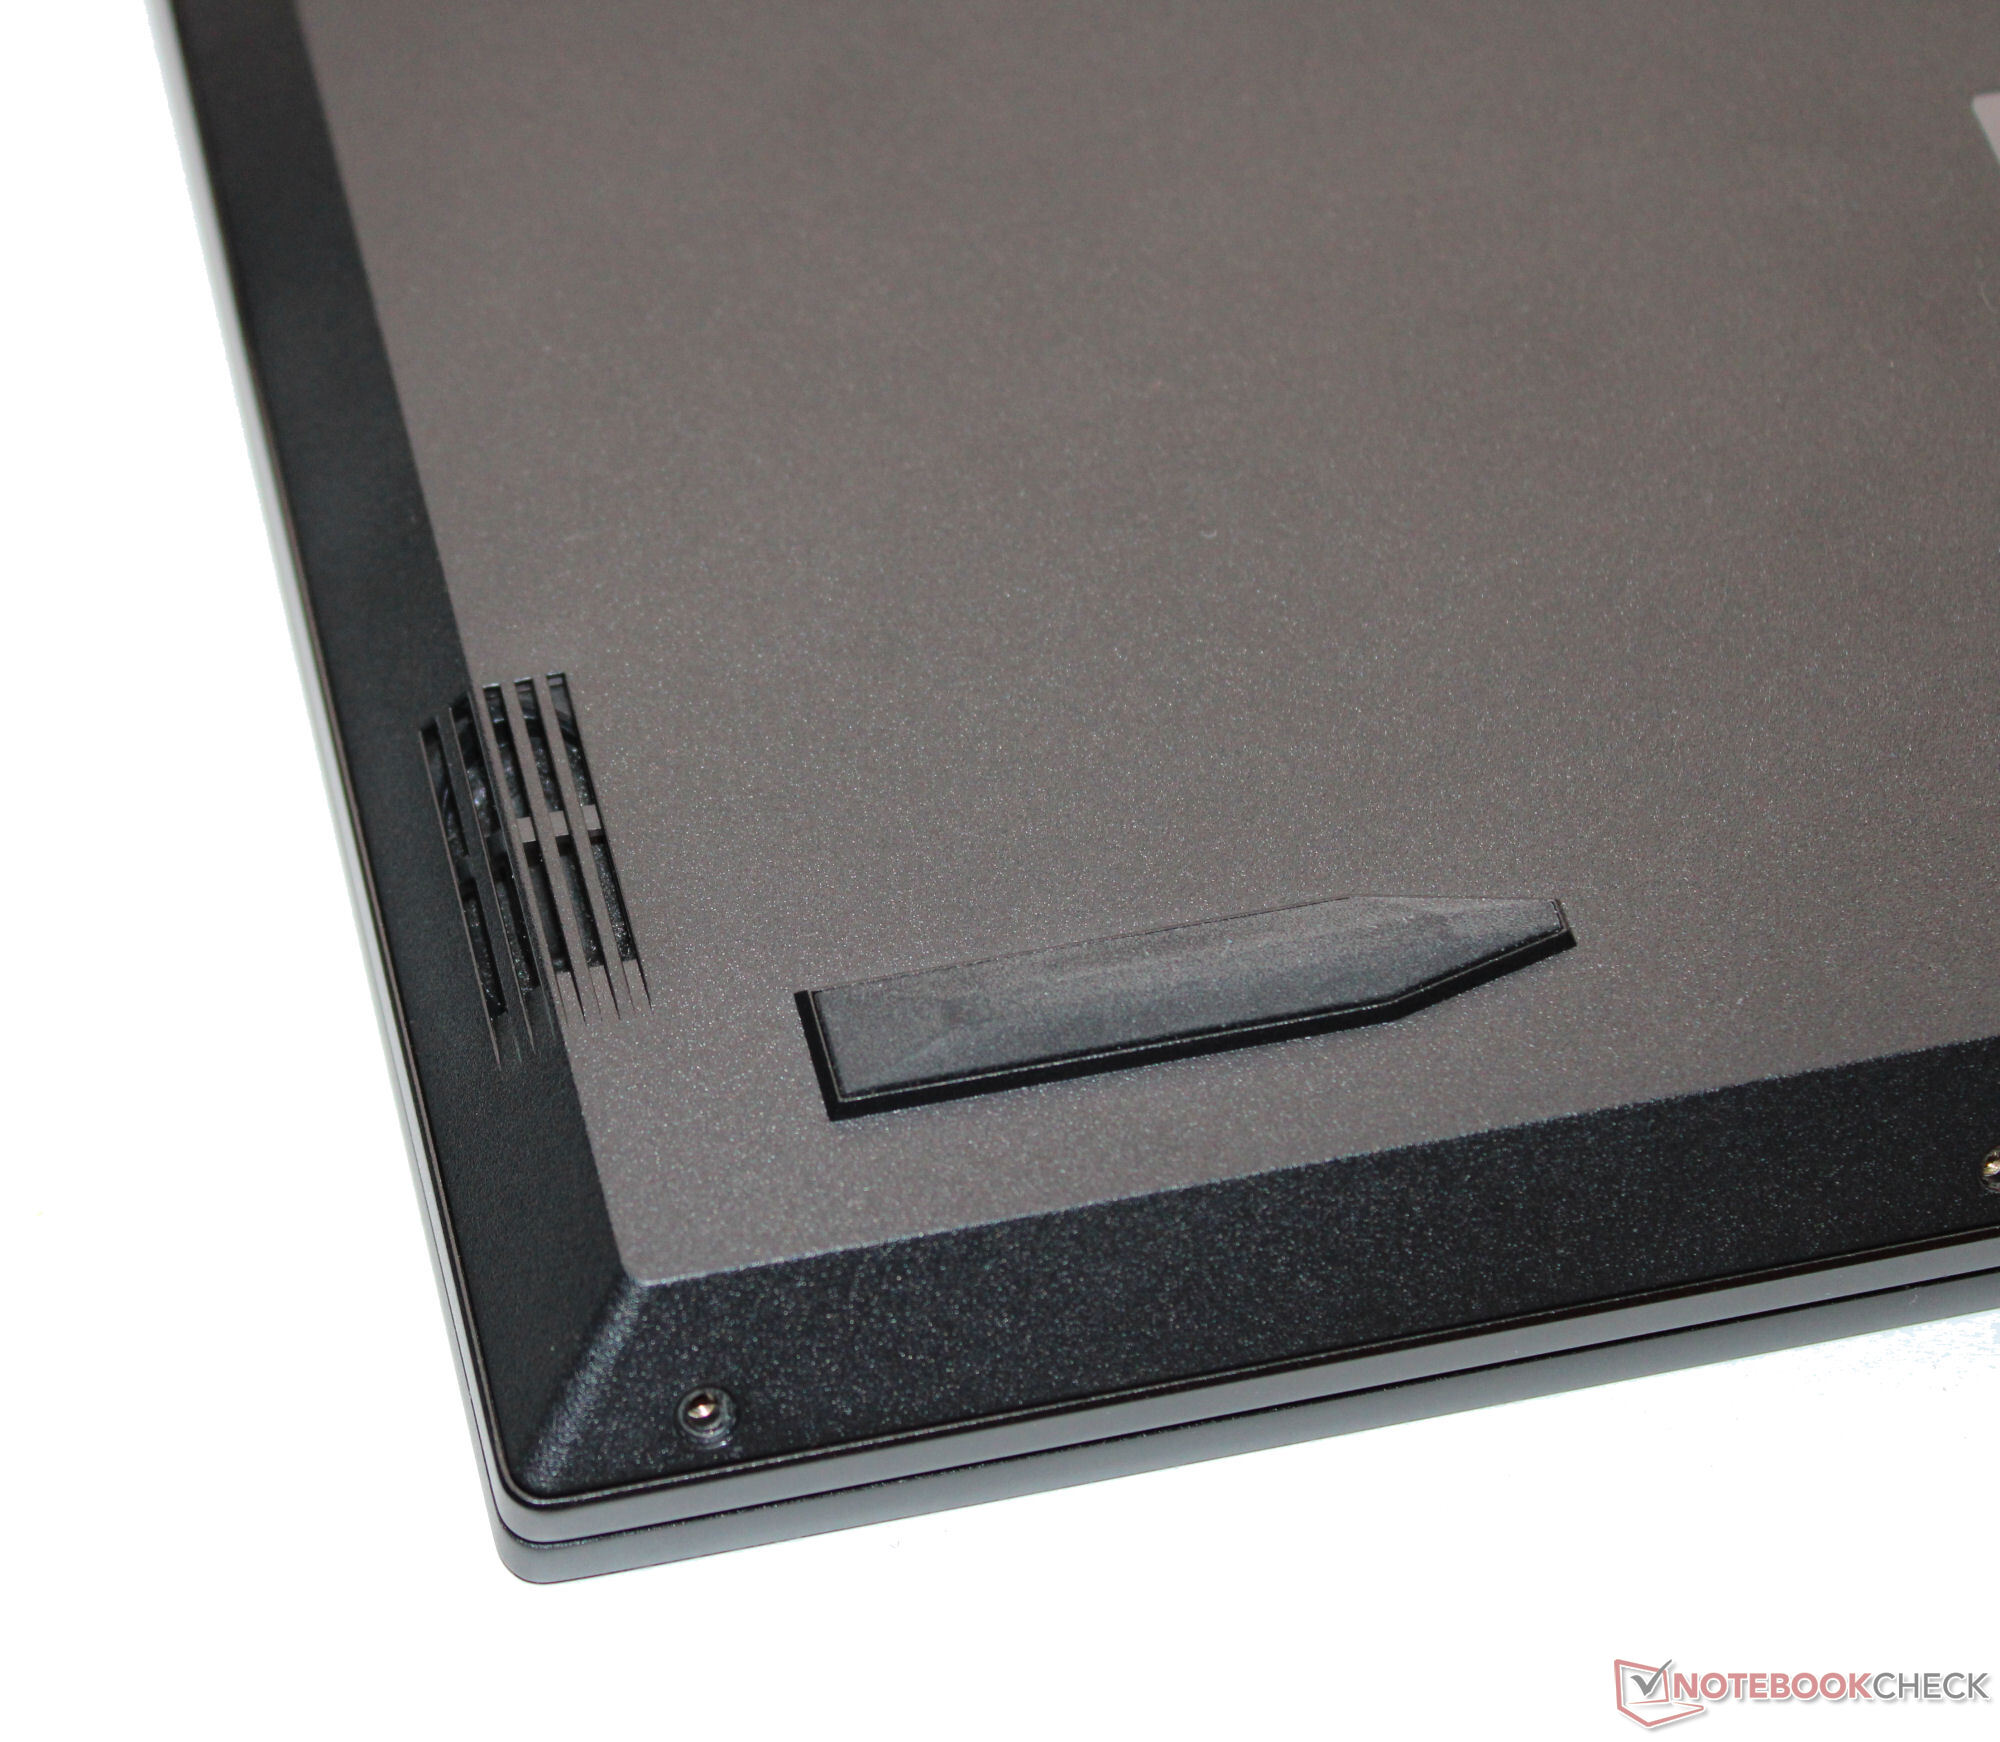
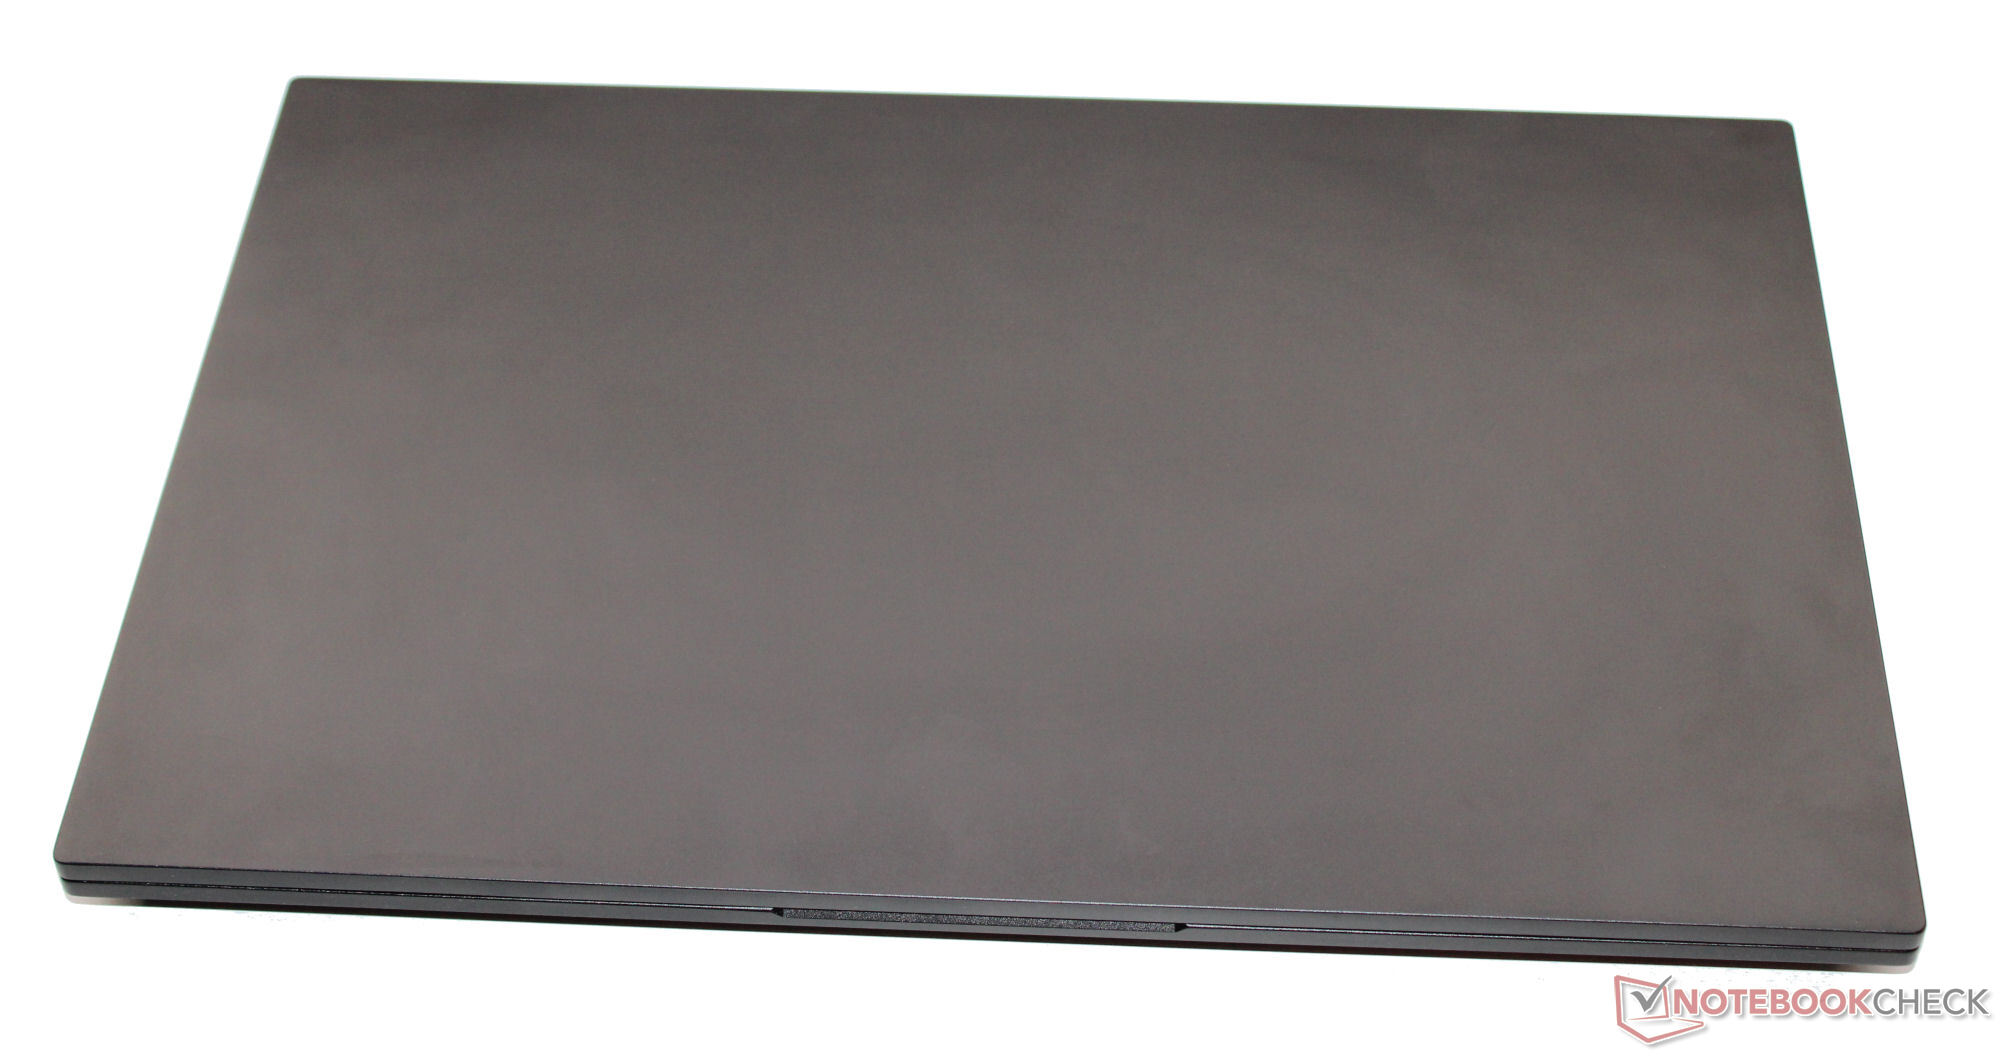
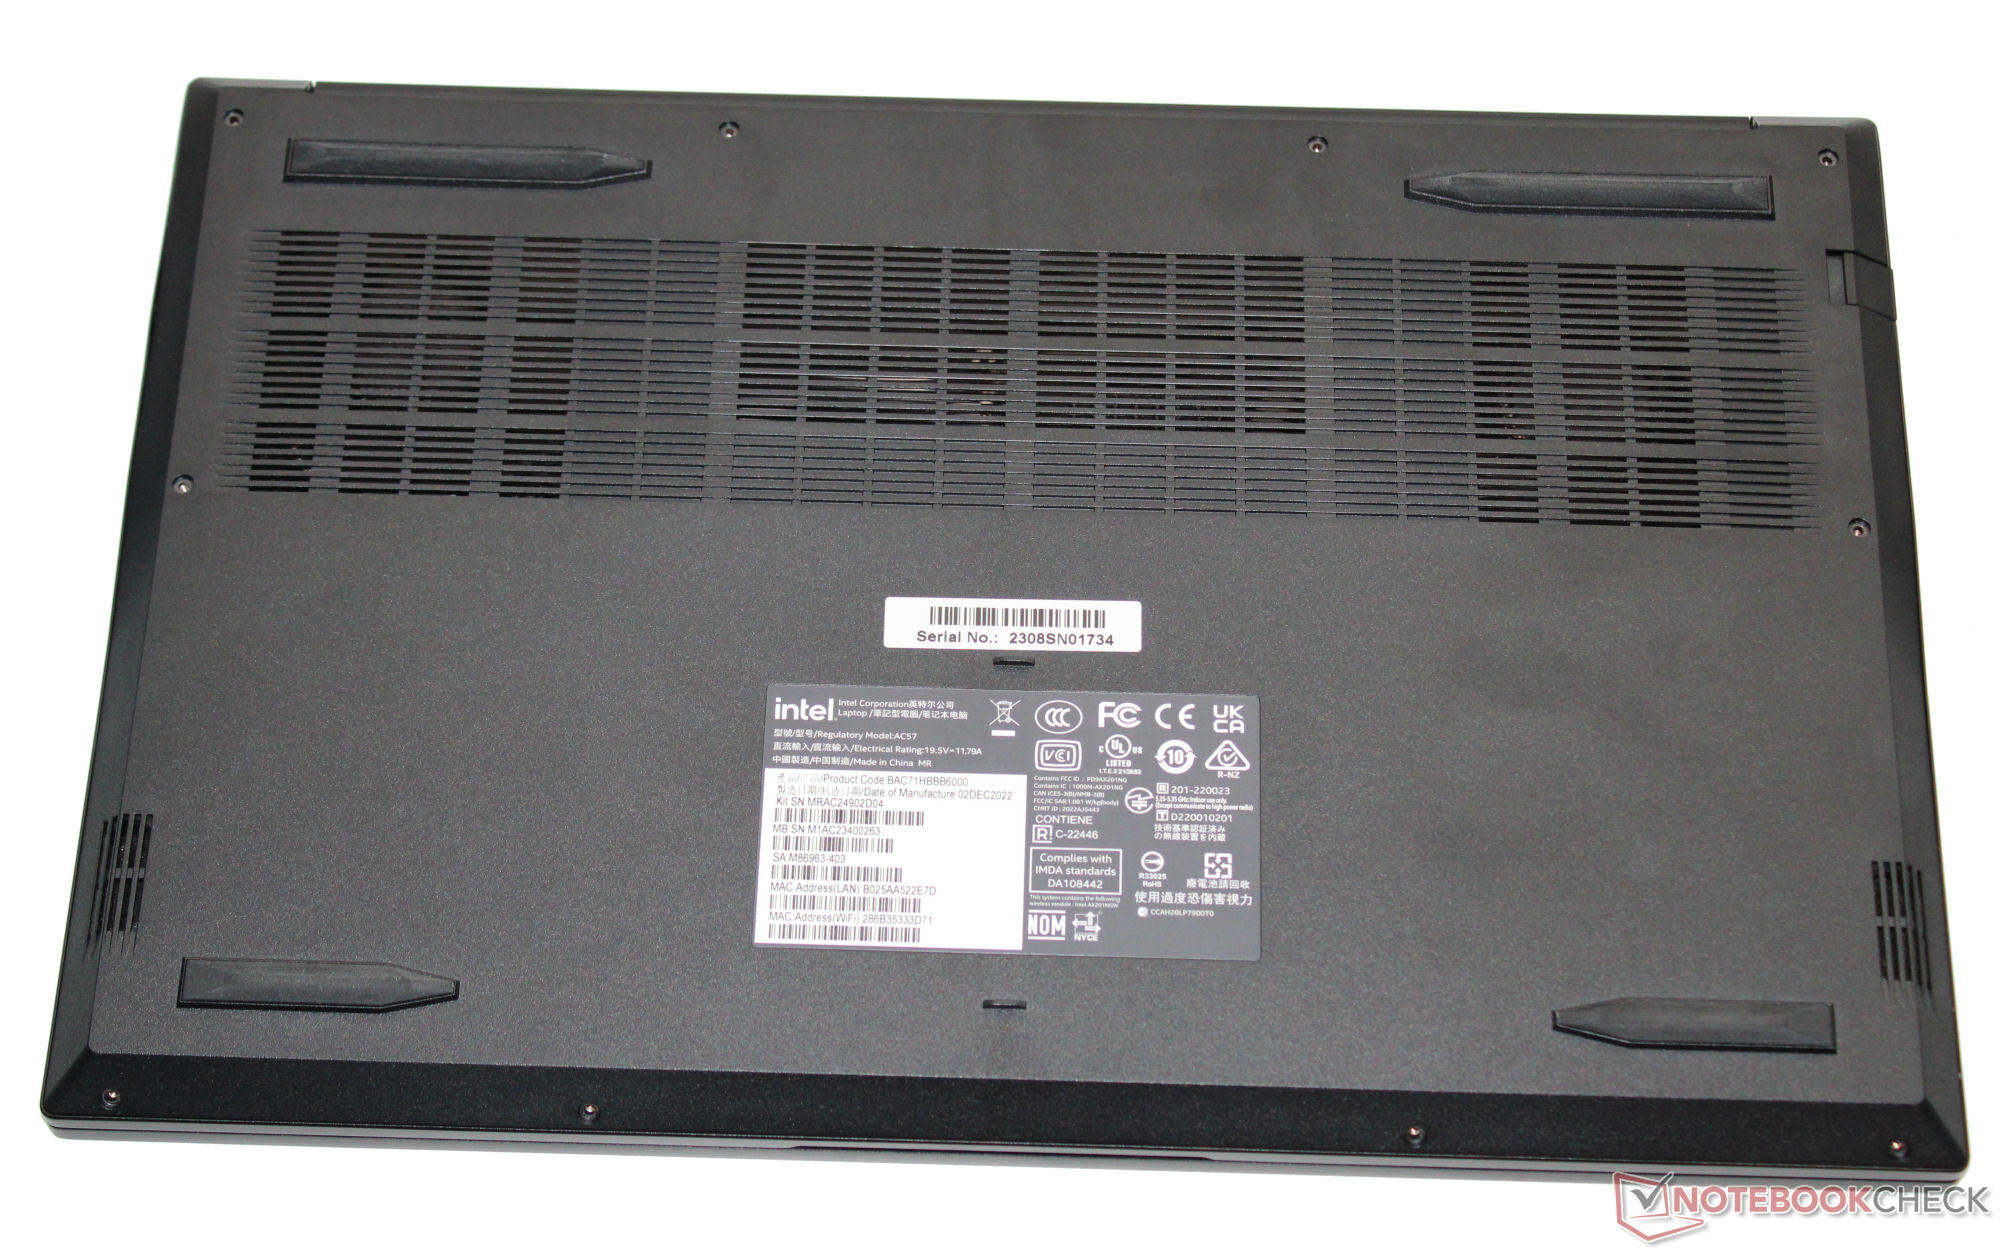
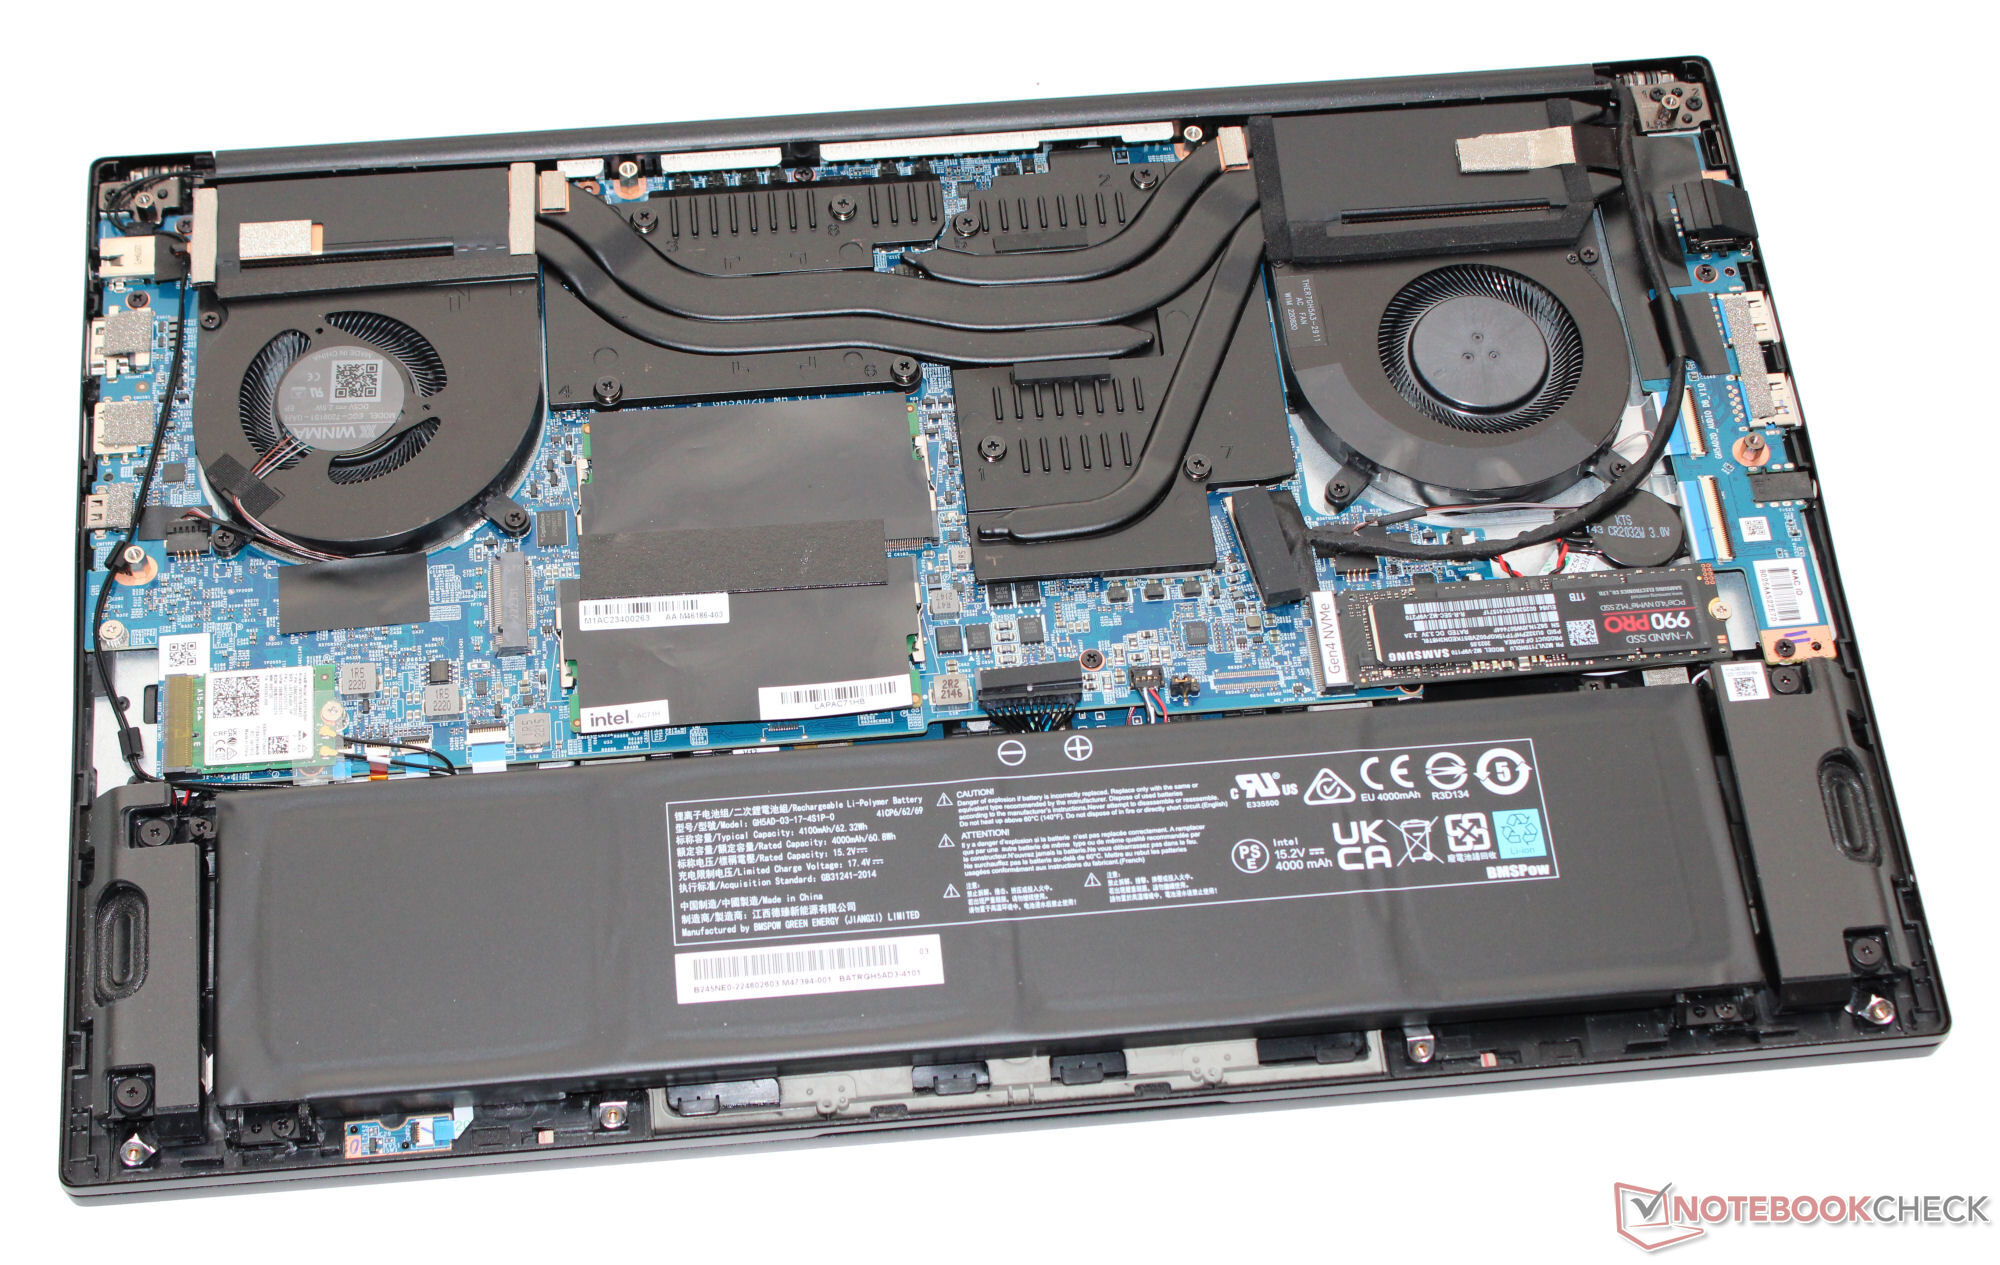
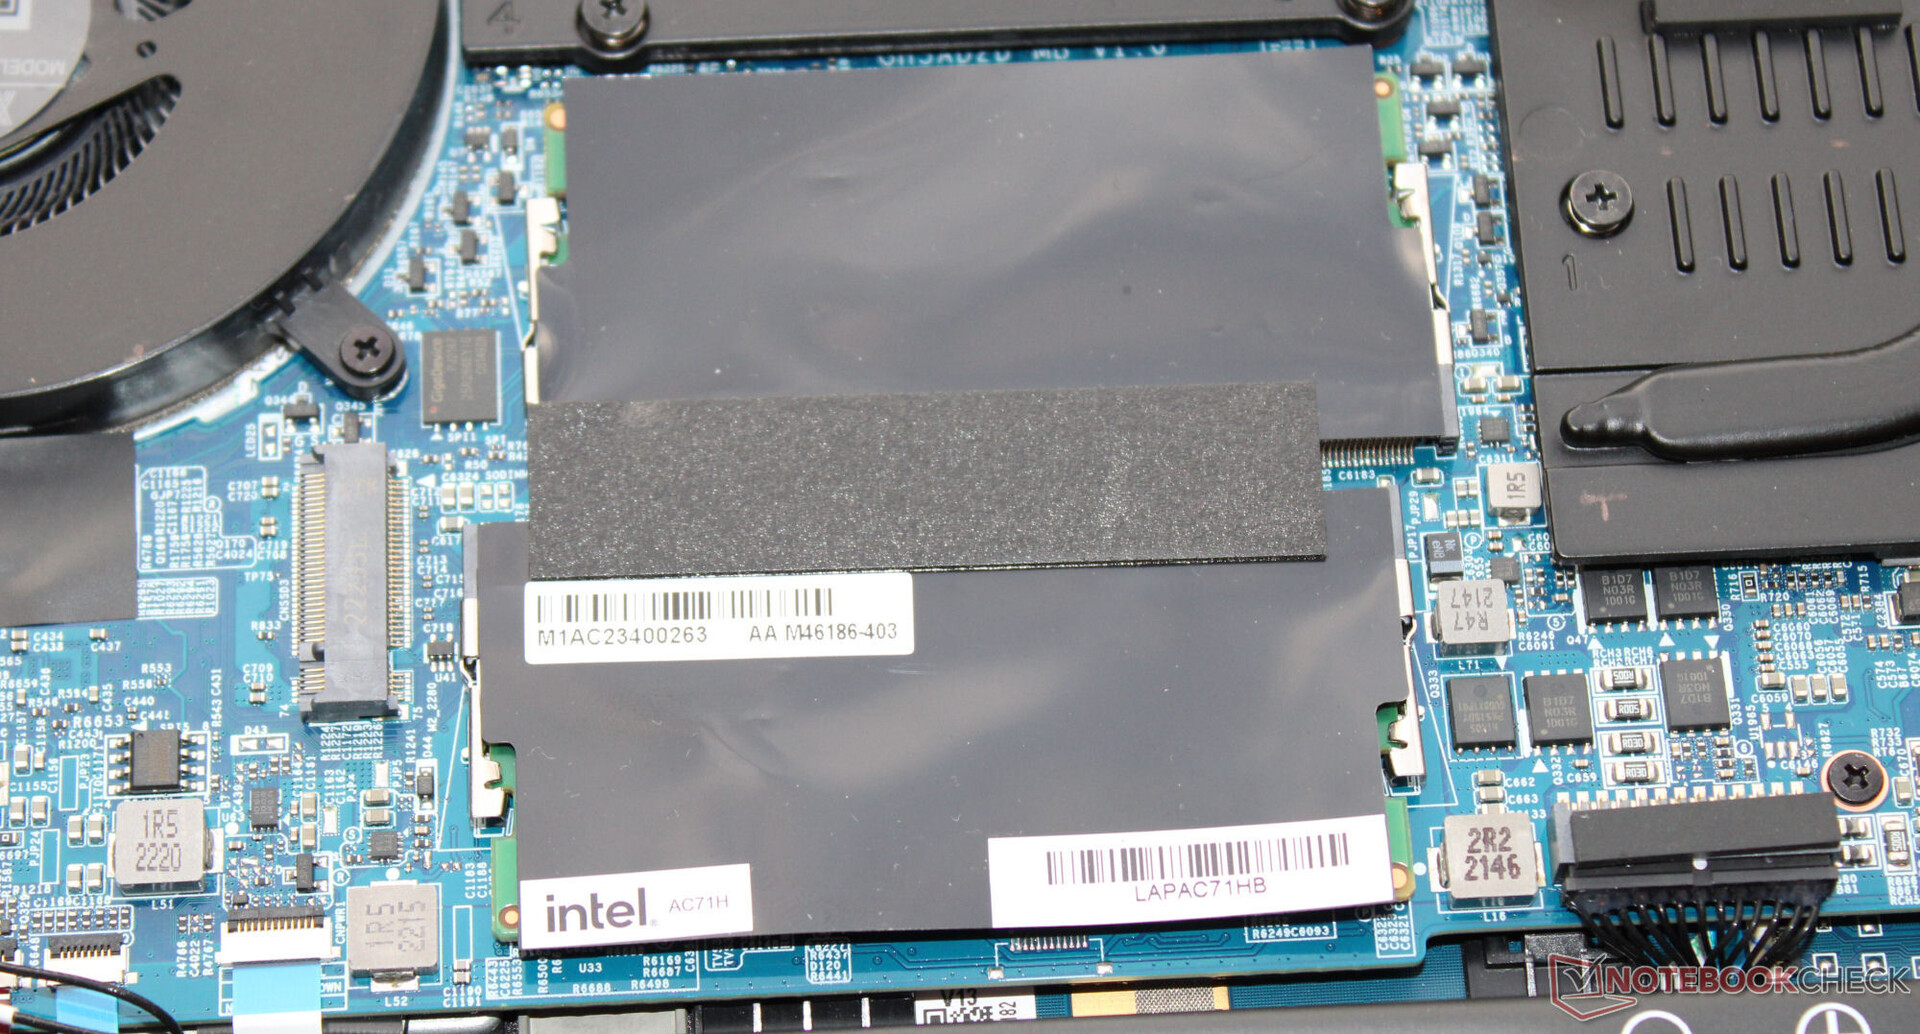
Baksidan av locket och den övre delen av det mattsvarta fodralet är tillverkade av aluminium, och den nedre delen av displayramen är tillverkad av plast. Vi noterade inga problem med byggandet. Intel förlitar sig på ett elegant, avskalat hölje som inte bör dra för mycket uppmärksamhet till sig i professionella miljöer. Efter att ha demonterat den nedre delen av höljet kan du komma åt batteriet (skruvat i, inte limmat på) samt resten av den bärbara datorns innandöme.
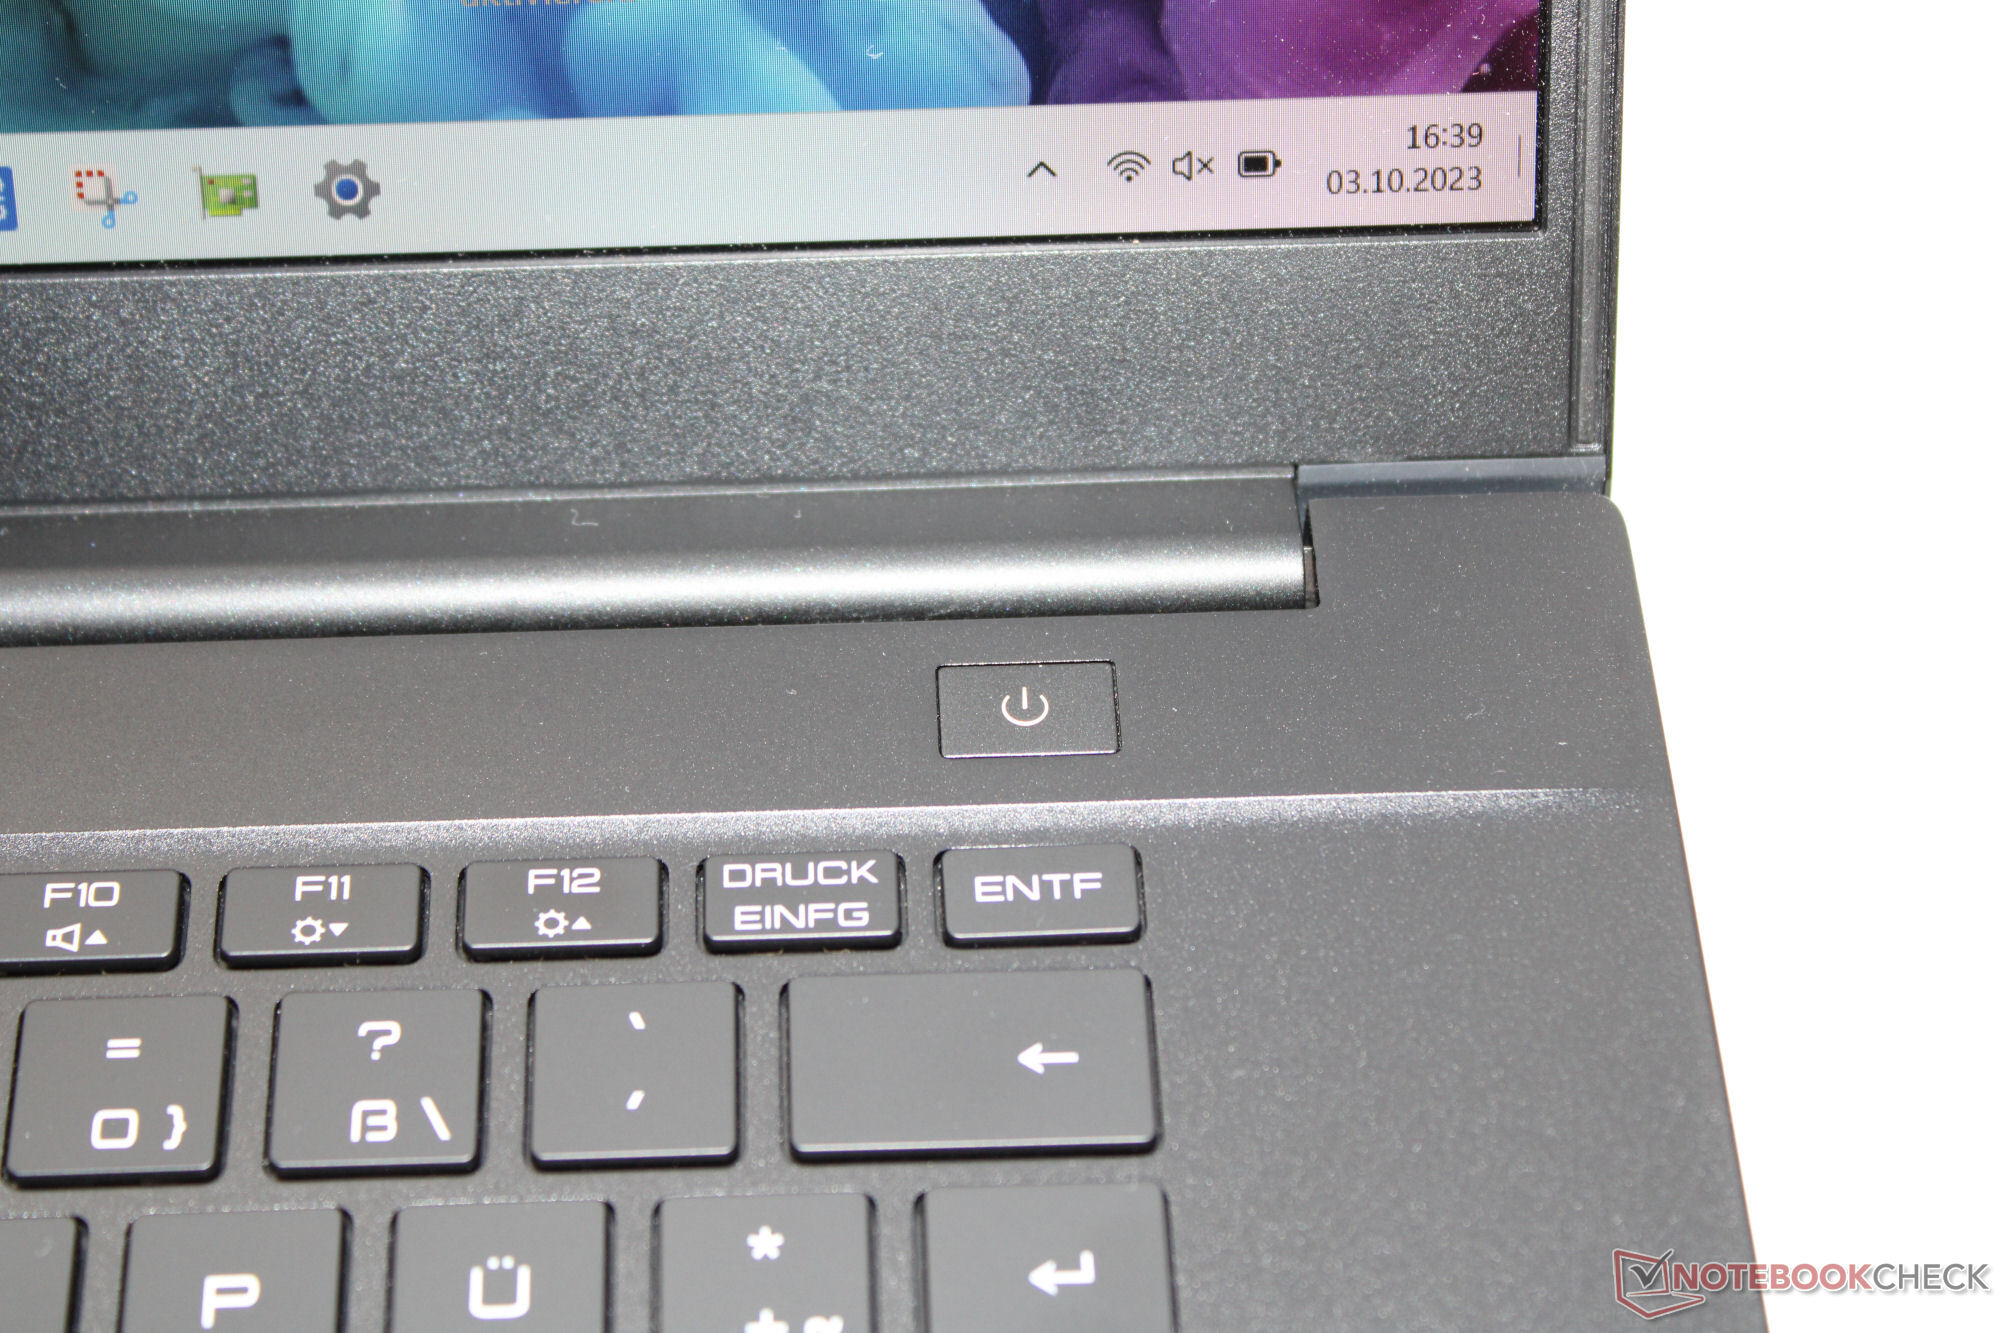
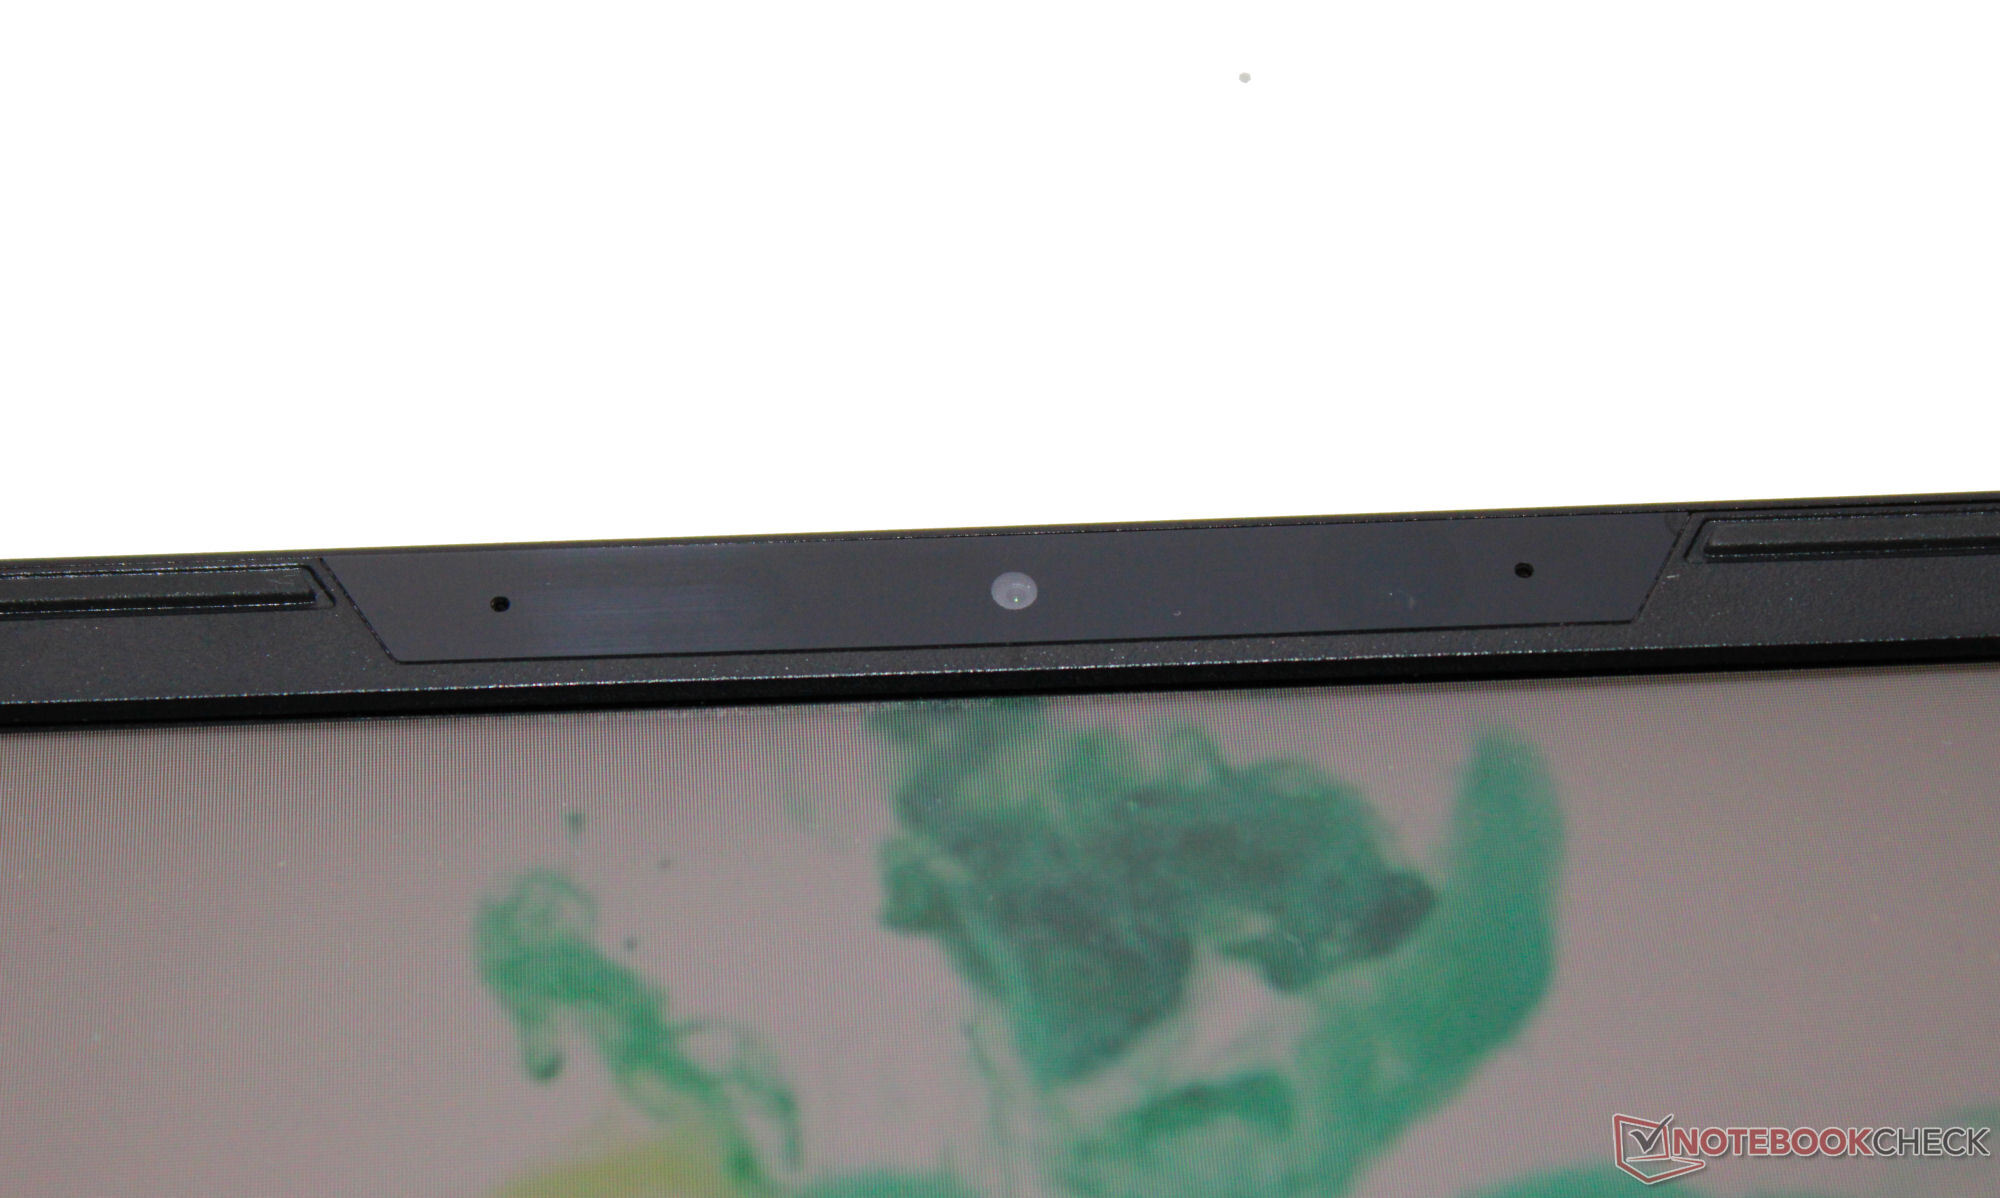
LAPAC71H har tre USB-A-portar (USB 3.2 Gen 1) och en USB-C-port (Thunderbolt 4/USB 4). Den senare har inte stöd för Power Delivery men kan mata ut en DisplayPort-signal. Totalt har den bärbara datorn två videoutgångar (1x HDMI, 1x DP). Intel har inte försett enheten med en SD-ortläsare. Webbkameran (0,9 MP, max. 1 280 x 720 pixlar, inget skydd) levererar ganska standardmässiga resultat.
Under optimala förhållanden (inga WiFi-enheter i närheten, kort avstånd mellan den bärbara datorn och serverdatorn) kan den uppnå utmärkta WiFi-datahastigheter. Den bärbara datorn använder ett WiFi 6E-chip (Intel AX201). Kabelanslutningarna sköts också av en Intel-kontroller (I225-V; 2,5 GBit/s).
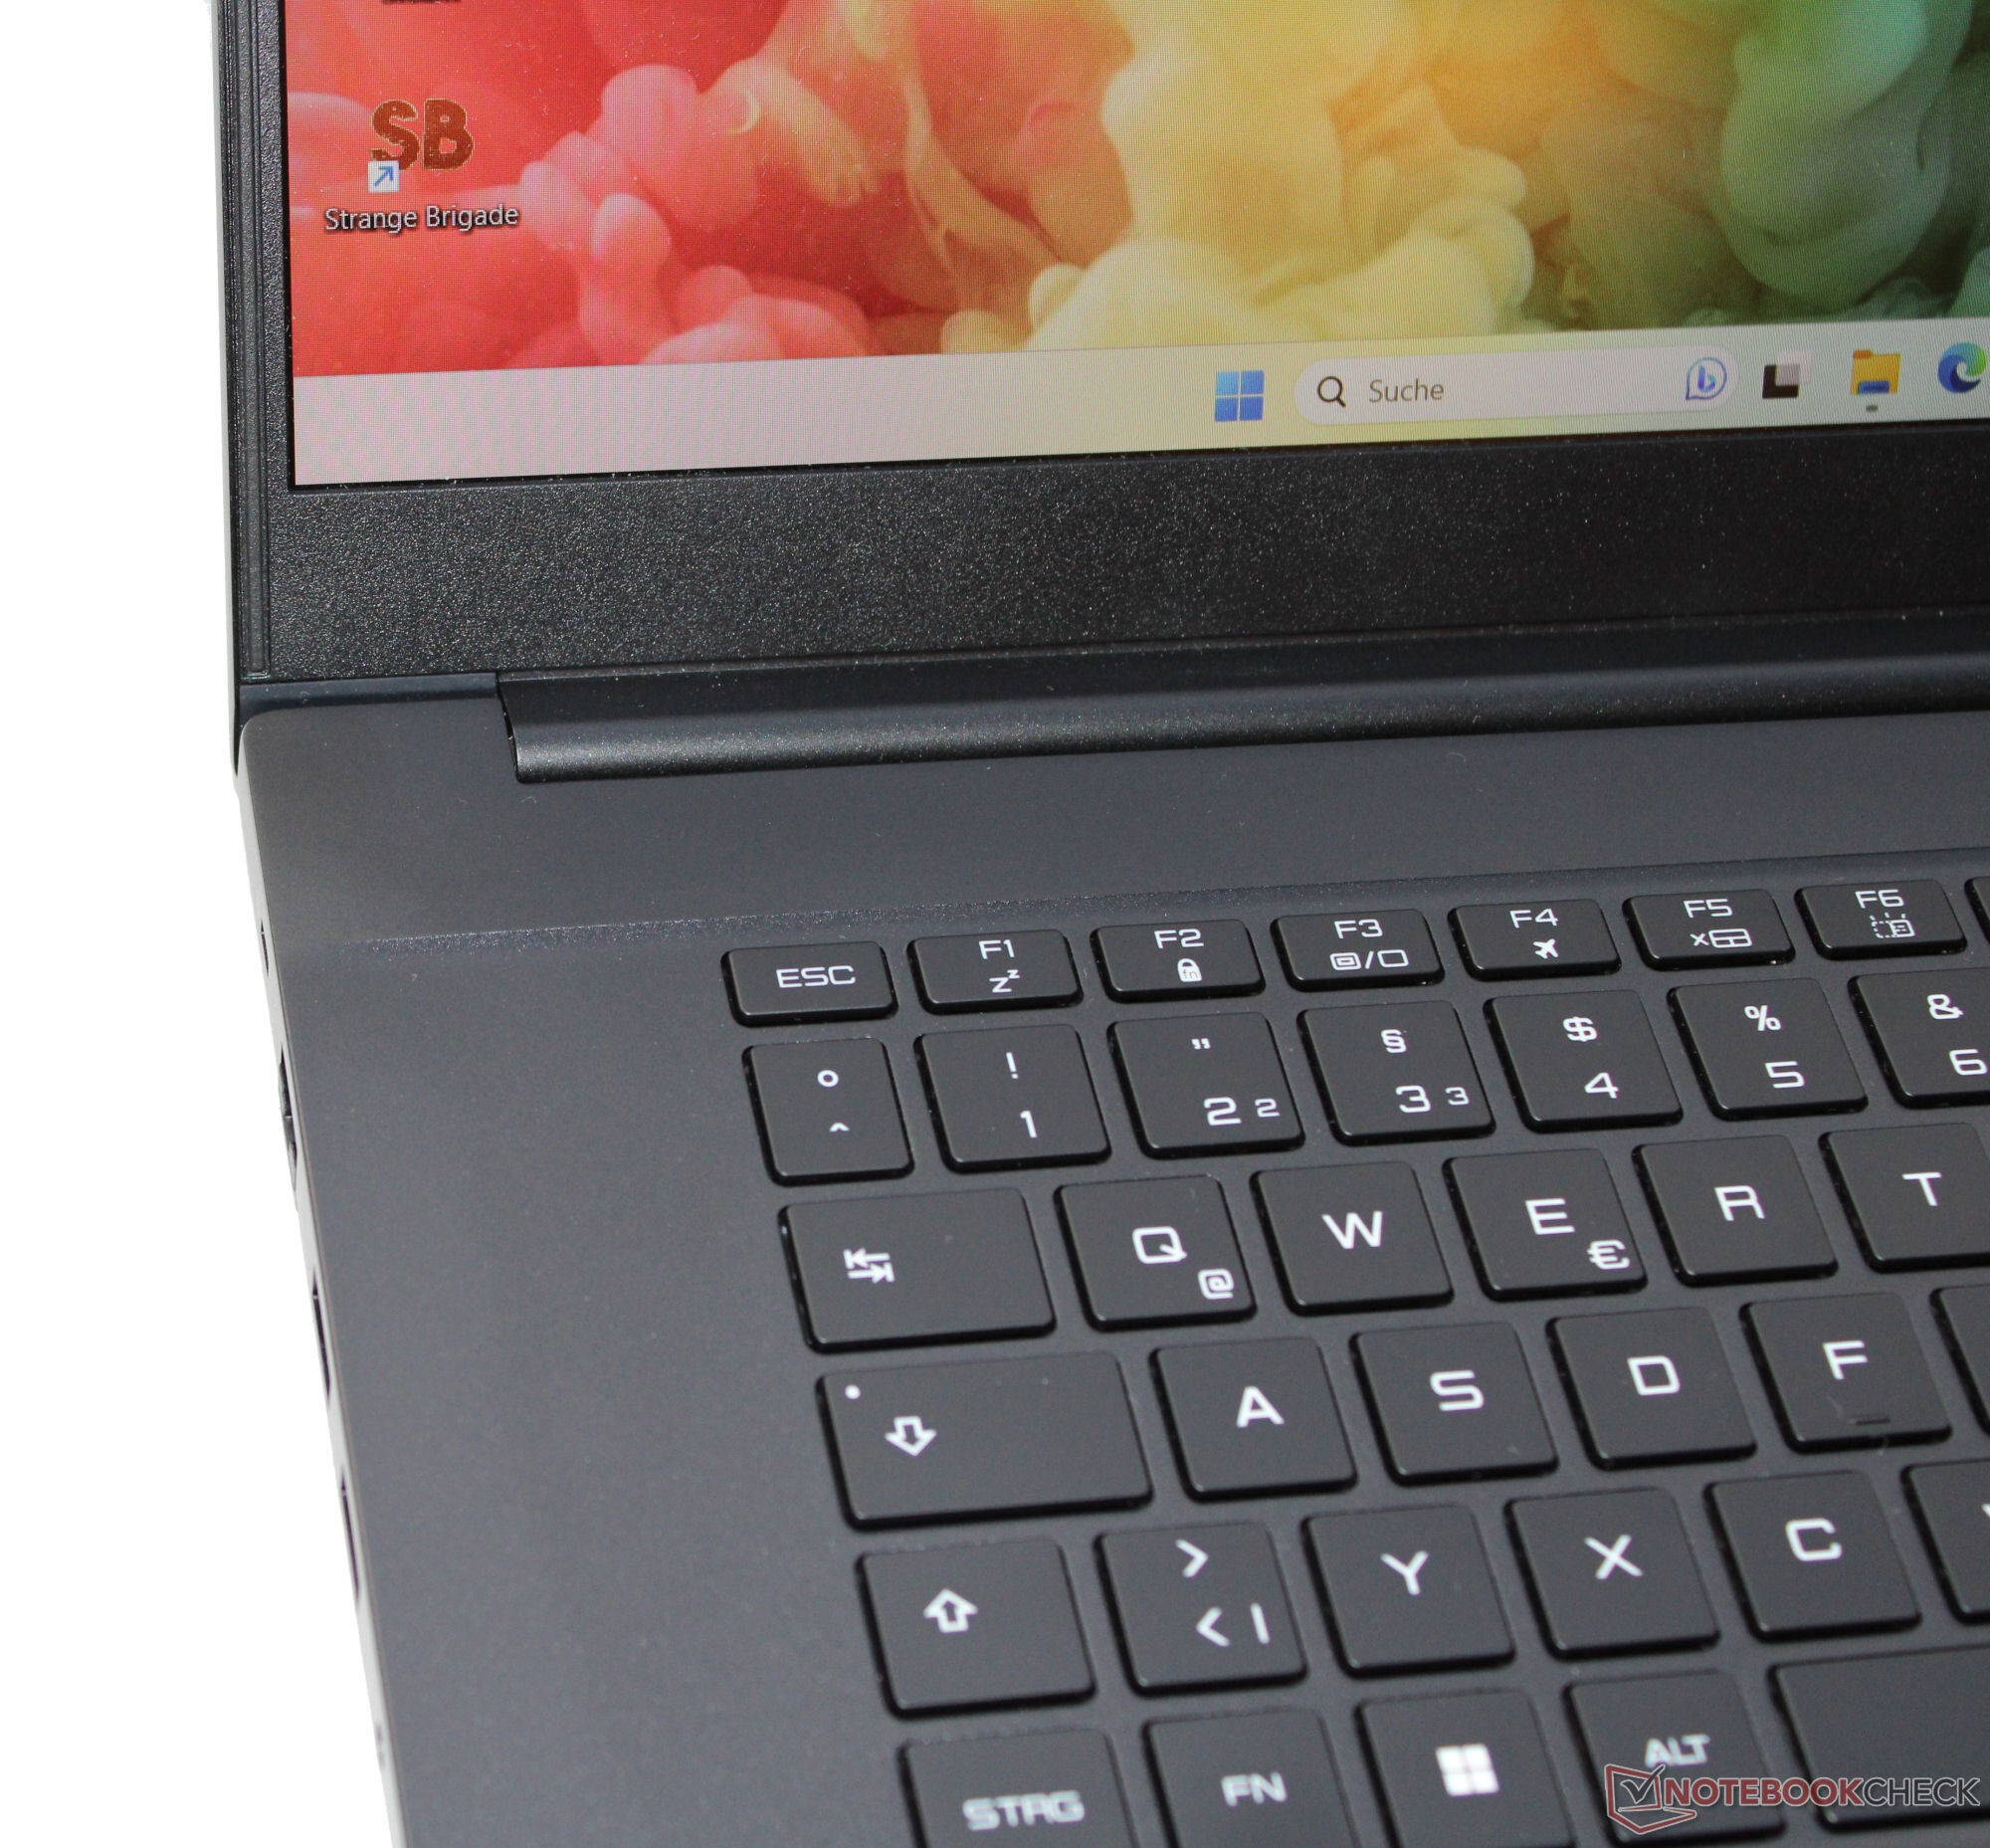
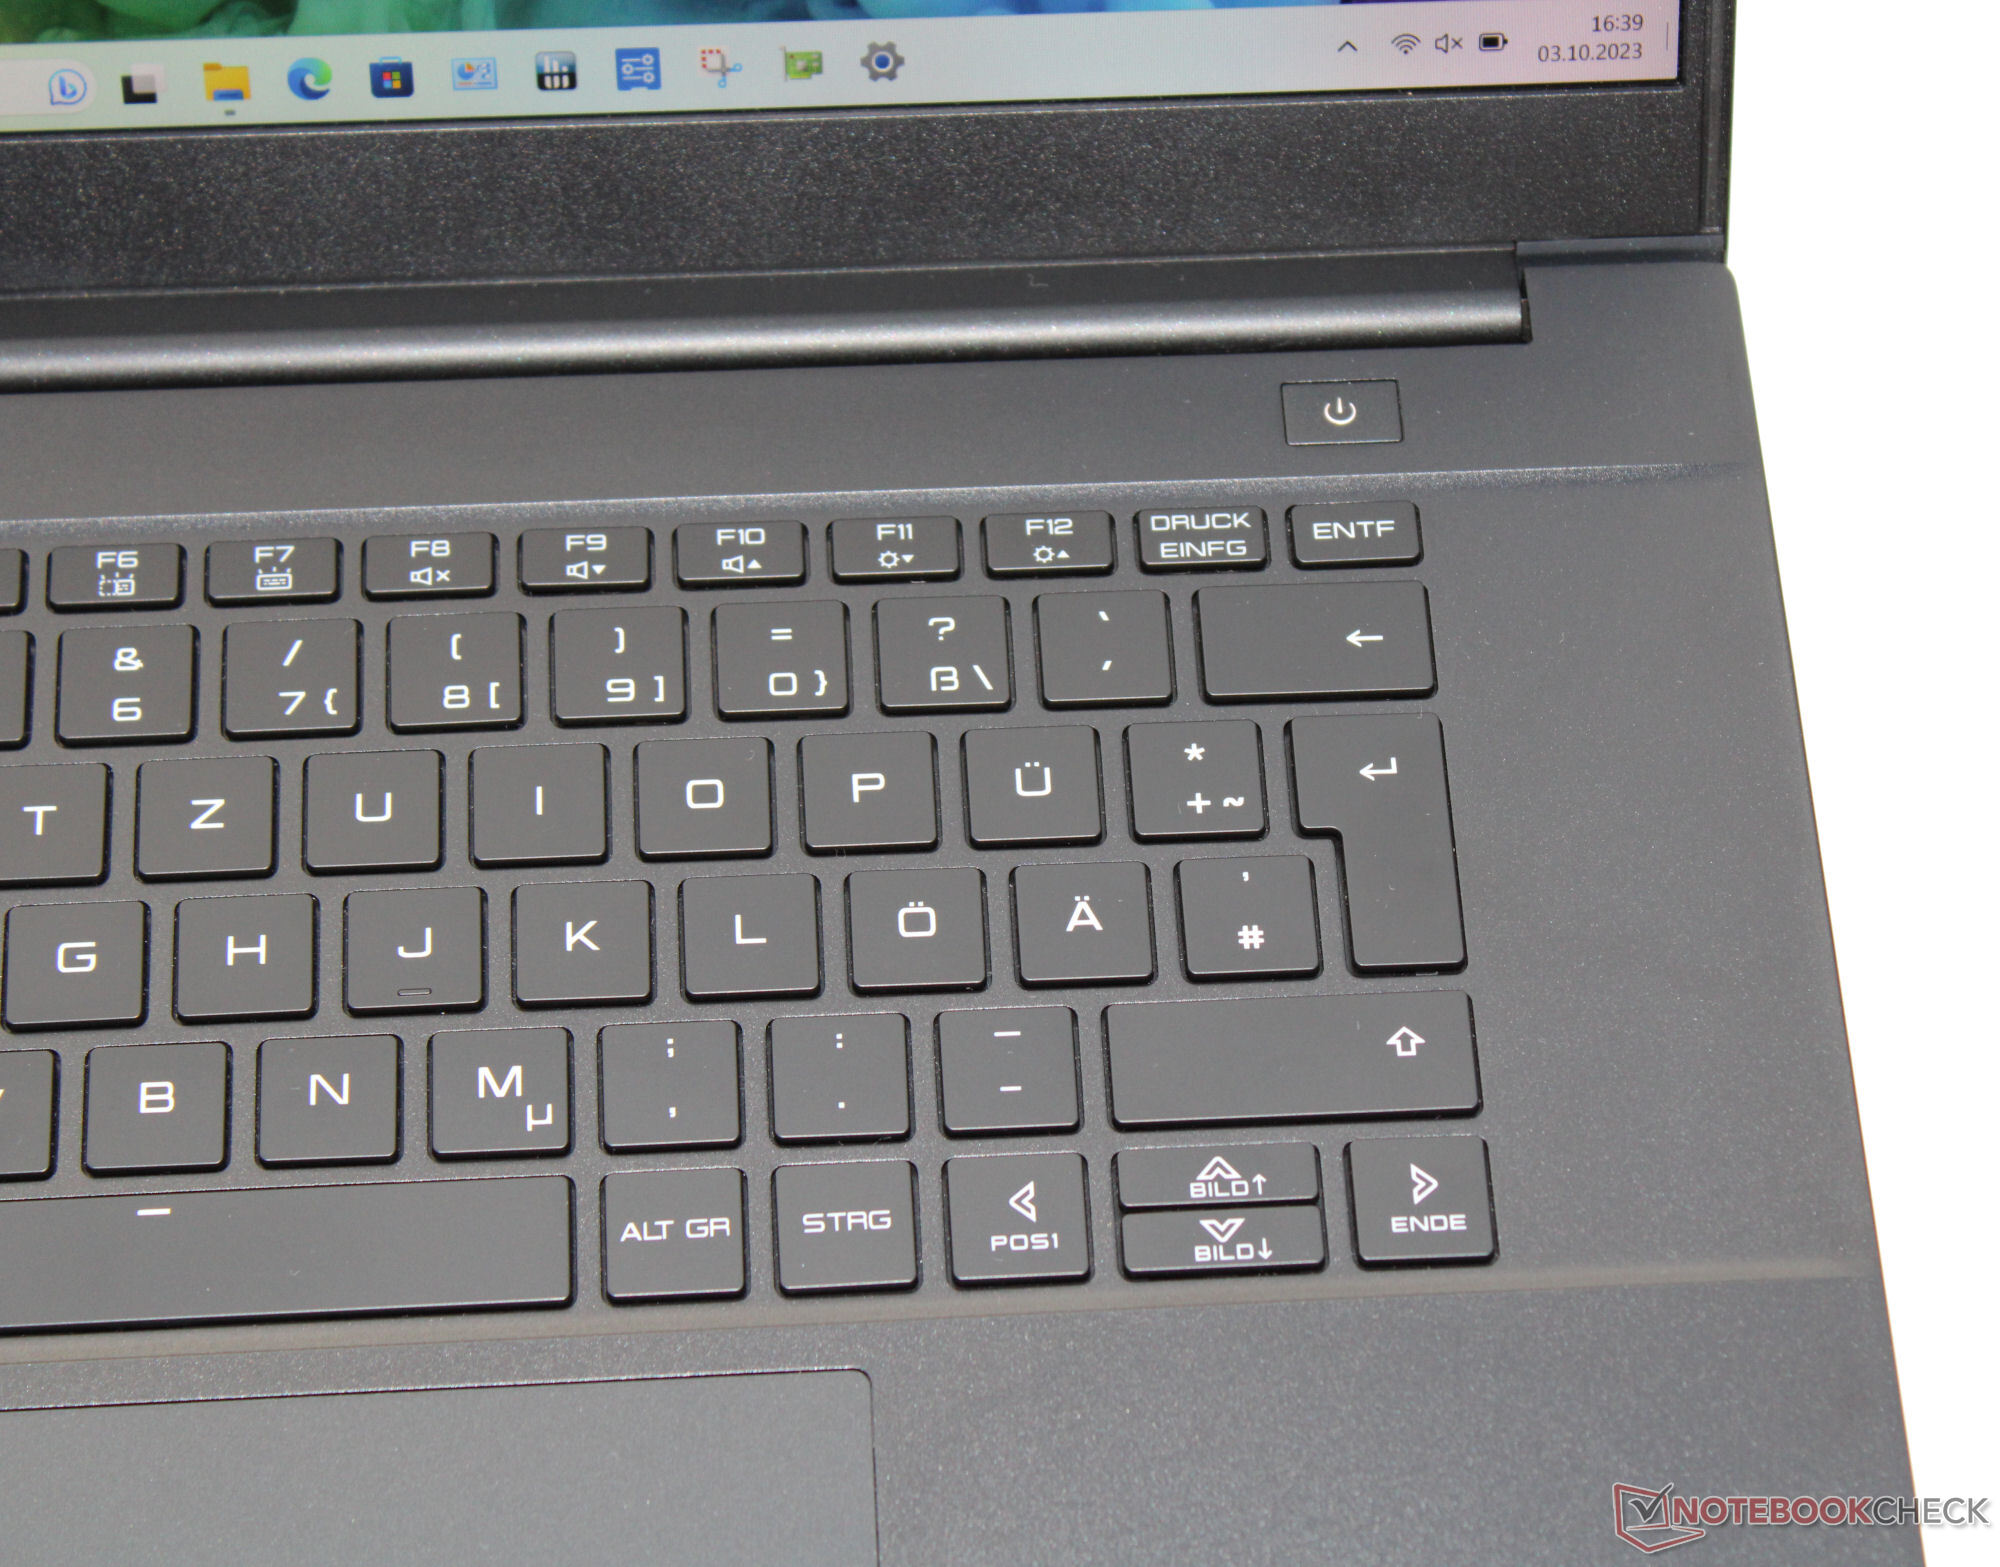


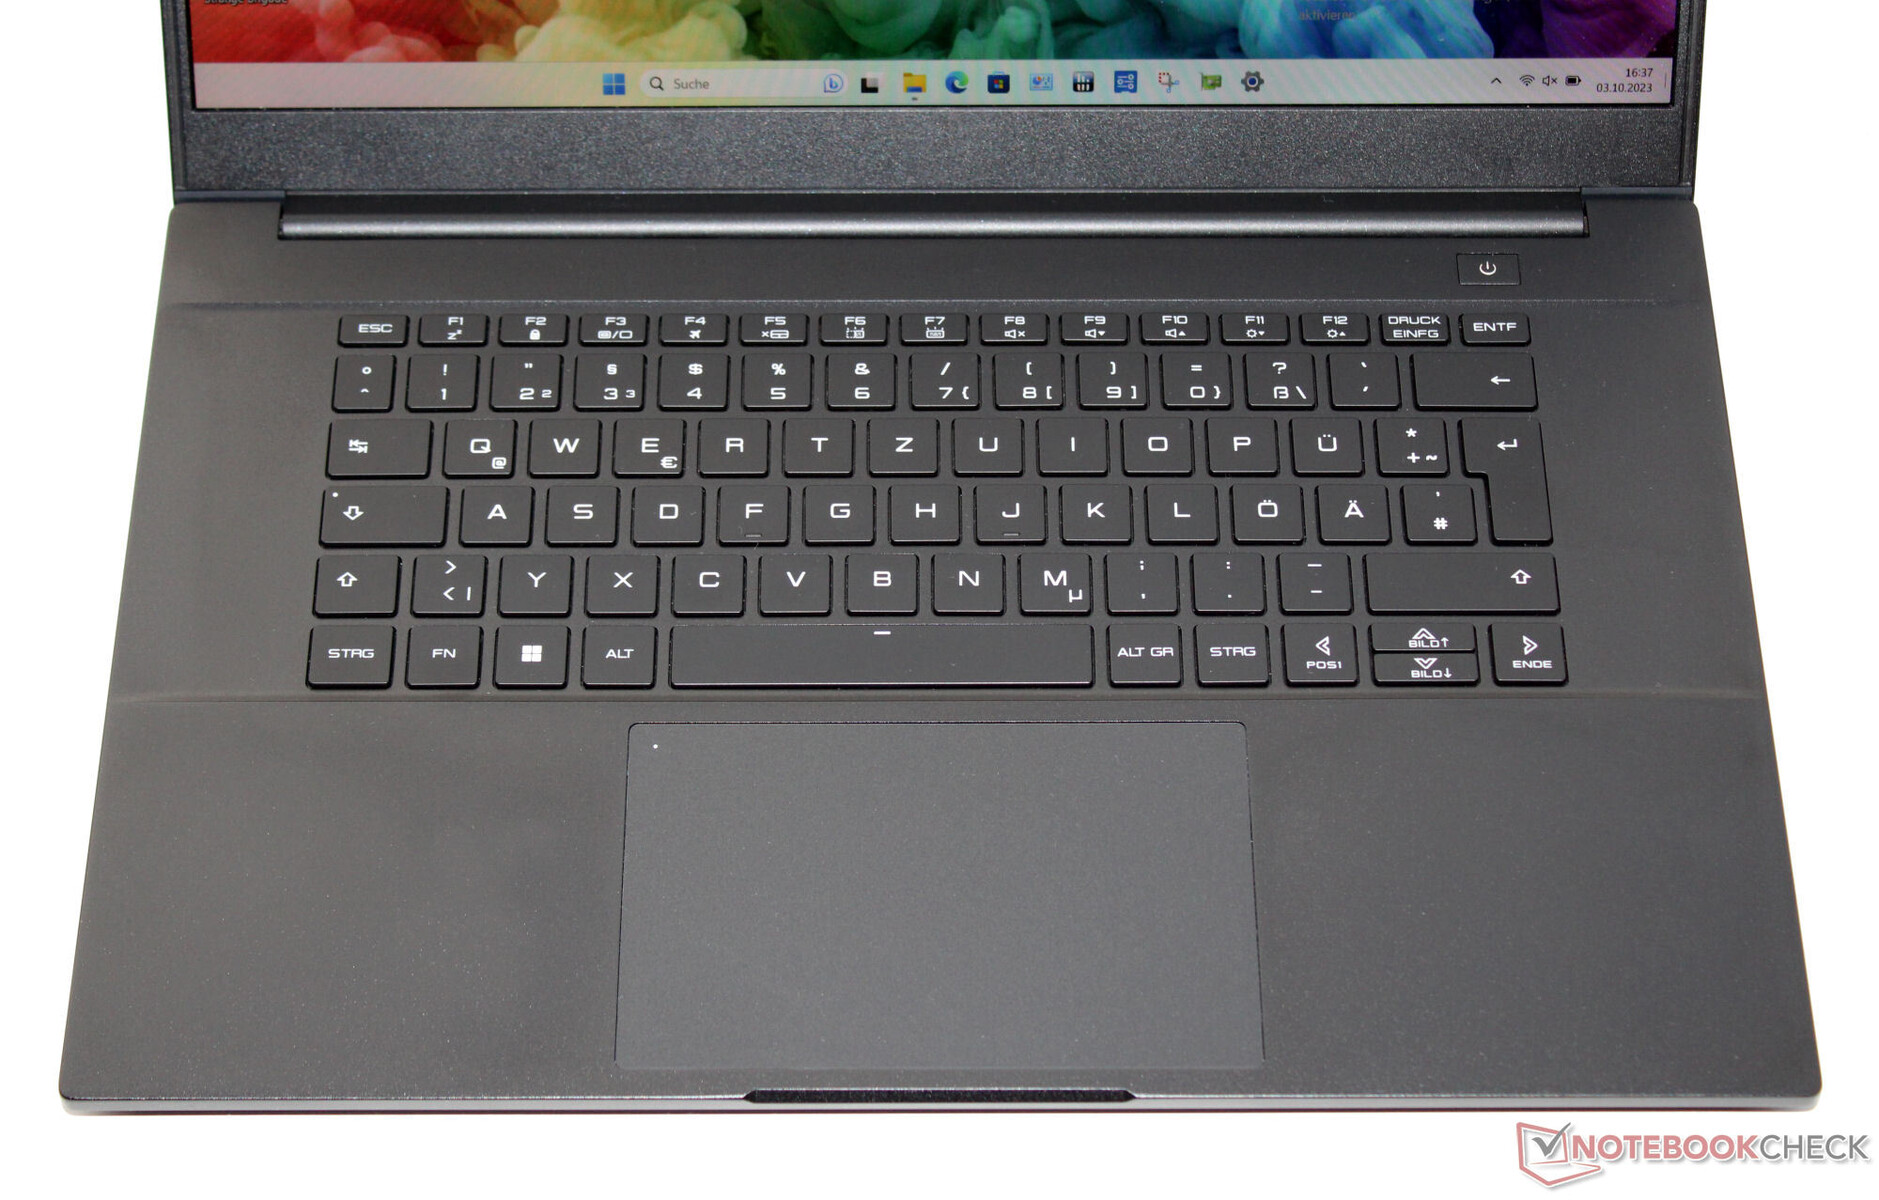
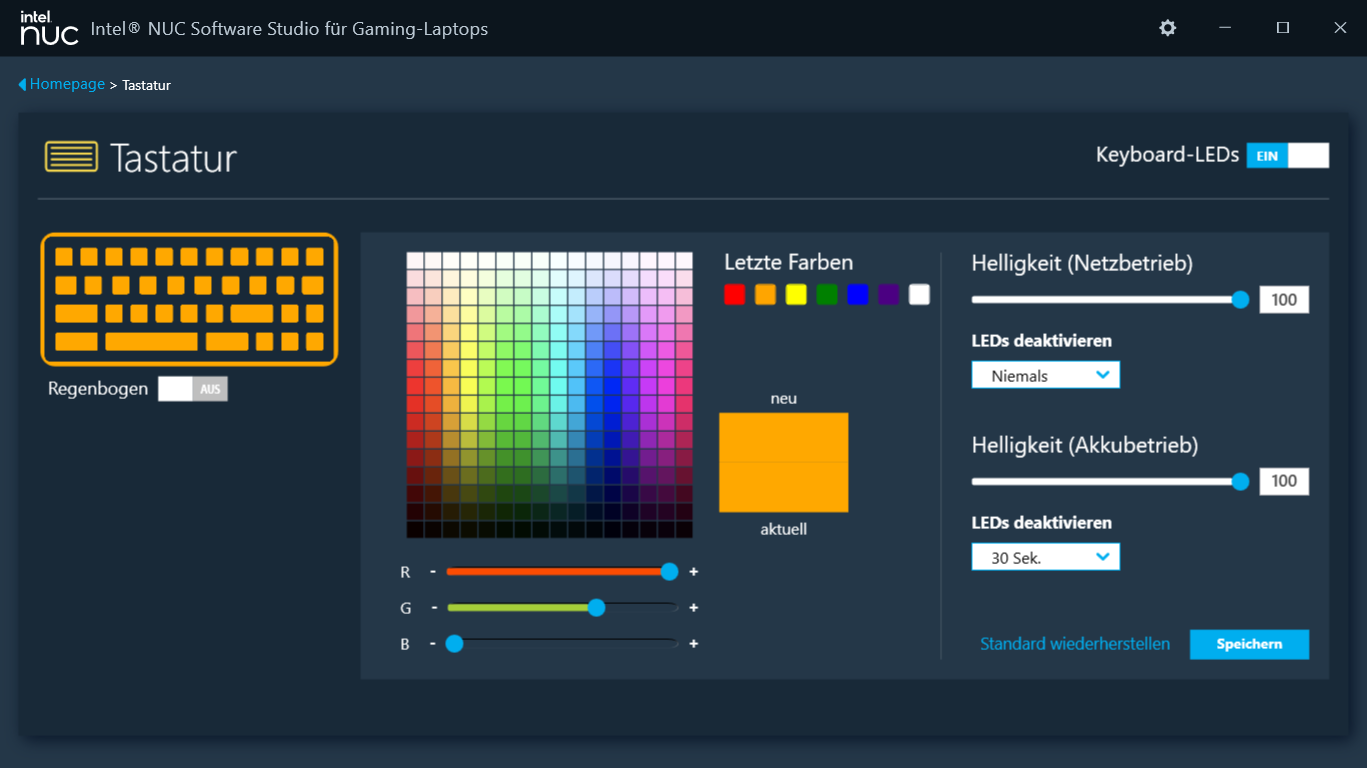
Inmatningsenheter - Tangentbord med RGB-belysning
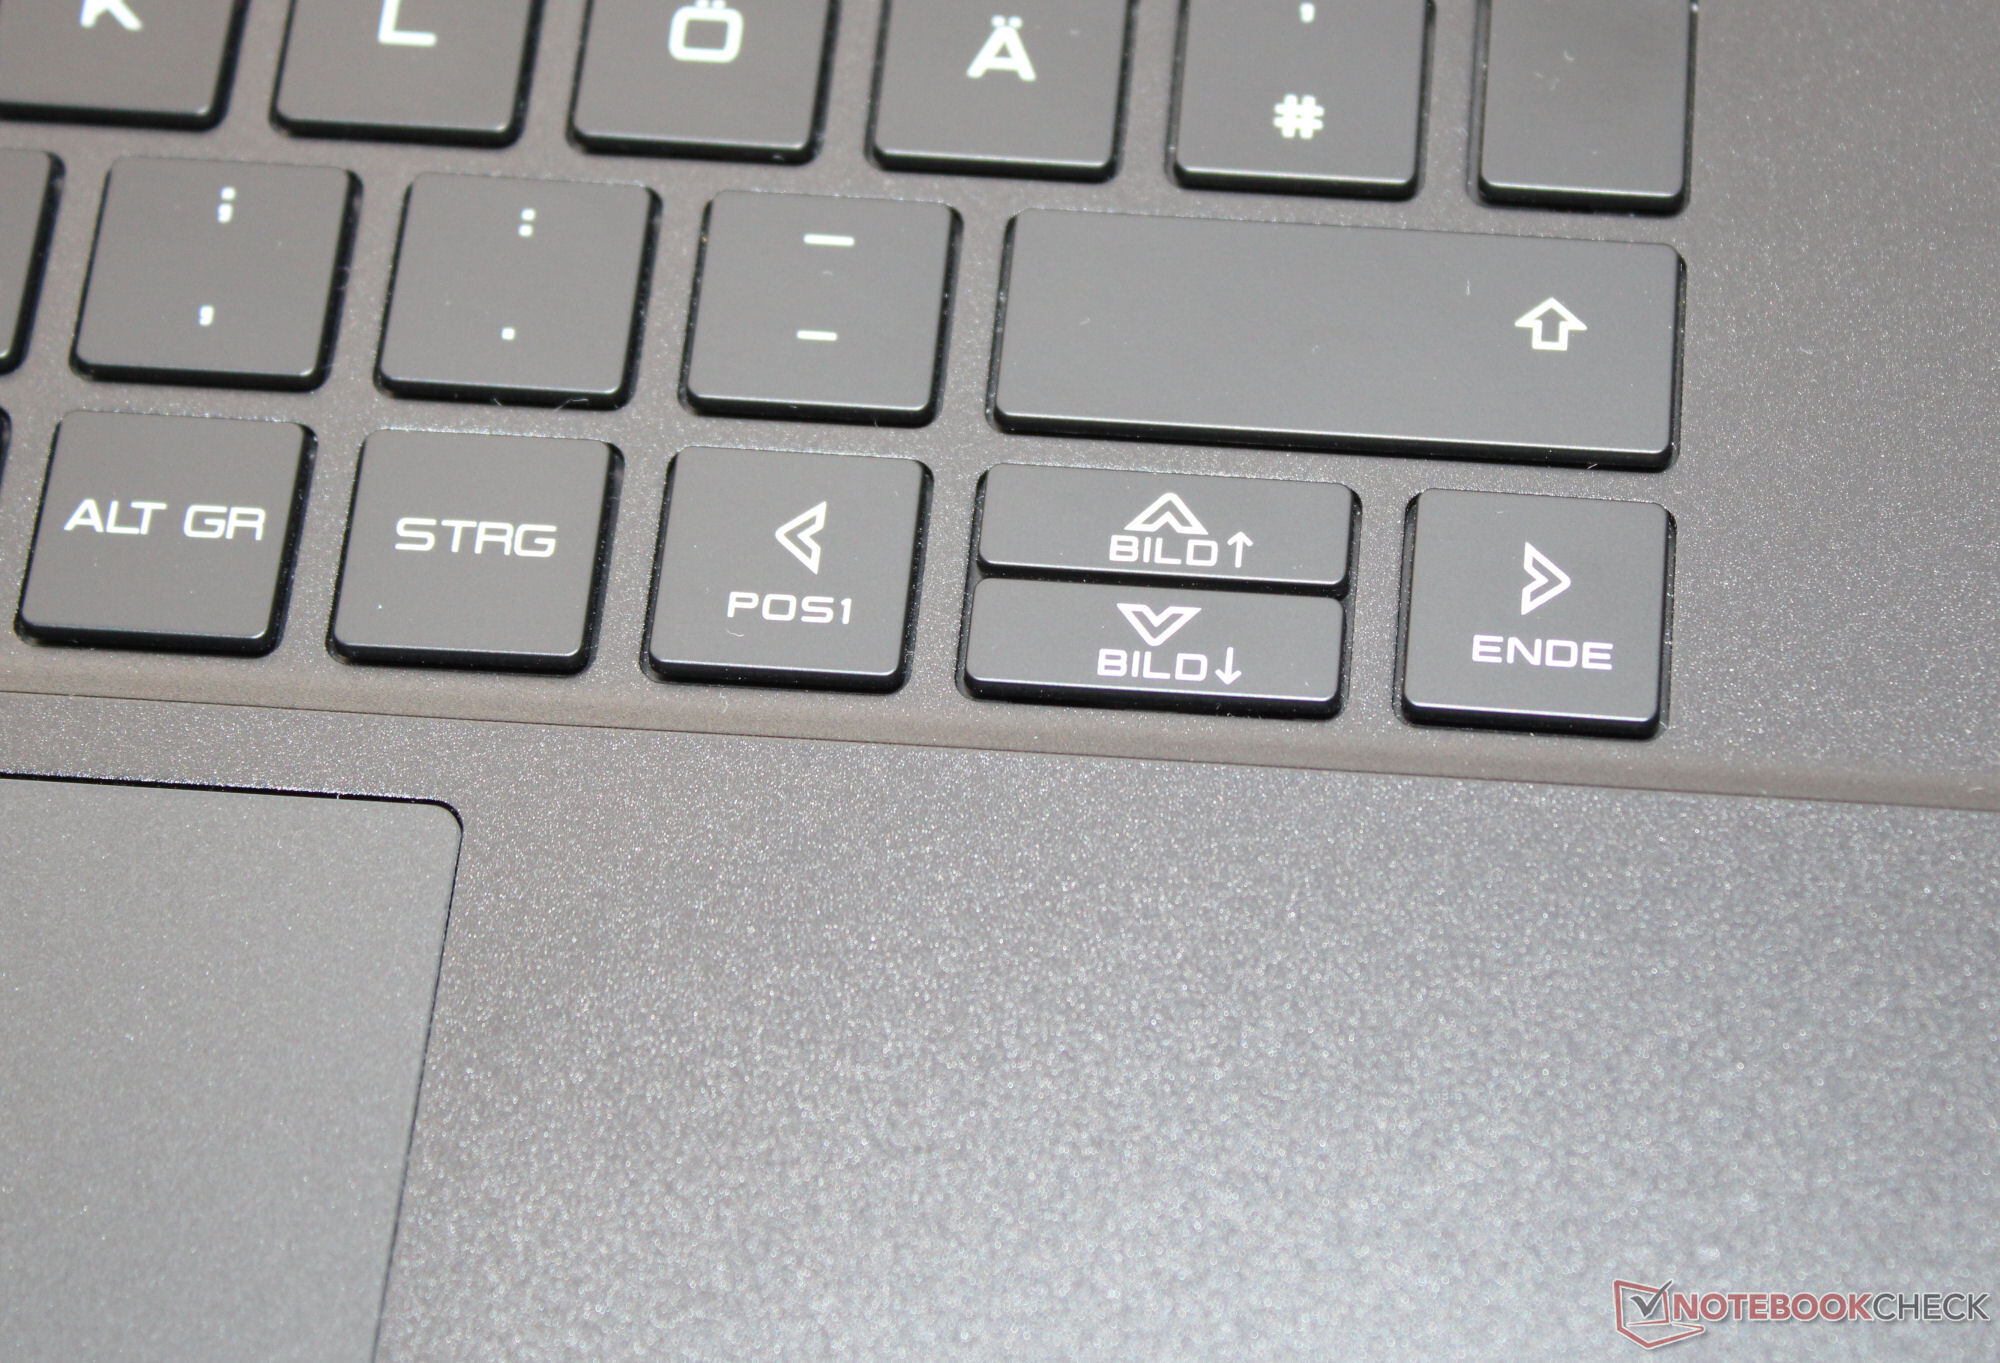
Den bärbara datorns chiclet-tangentbord (RGB-belysning) har ingen numerisk knappsats, även om det skulle finnas tillräckligt med utrymme för en sådan. De jämna, släta tangenterna har en medelhög lyftkraft och en tydlig tryckpunkt. Tangenternas motstånd skulle behöva vara lite mer skarpt. Tangentbordet vrider sig inte när du skriver på det. Totalt sett har Intel levererat ett tangentbord som passar för daglig användning. En klickplatta (ca. 13,3 x 8,3 cm) är installerad som en musersättning och den har en kort lyftning och en tydlig tryckpunkt.
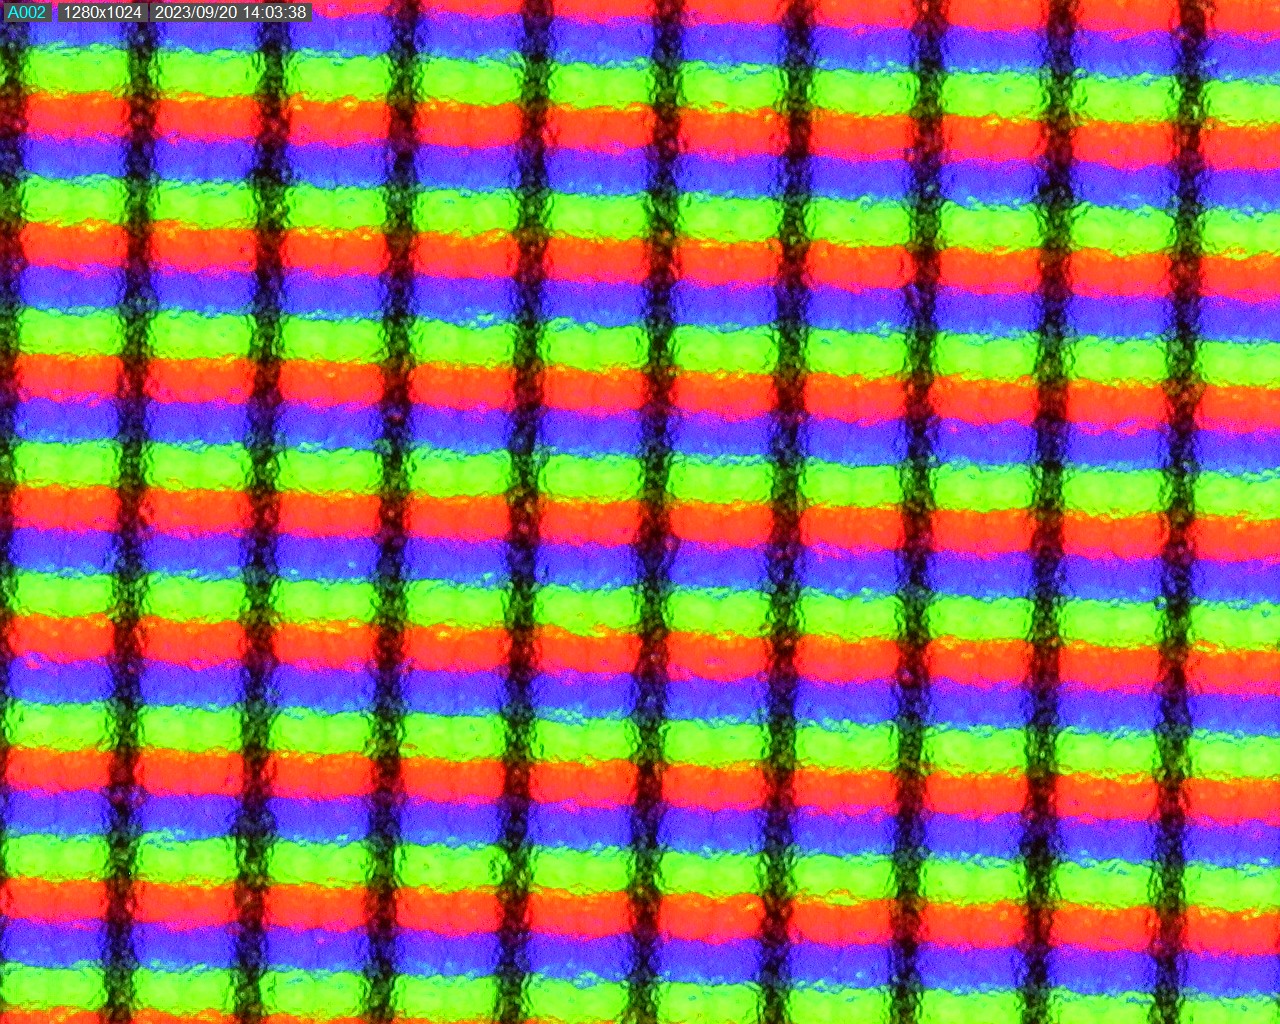
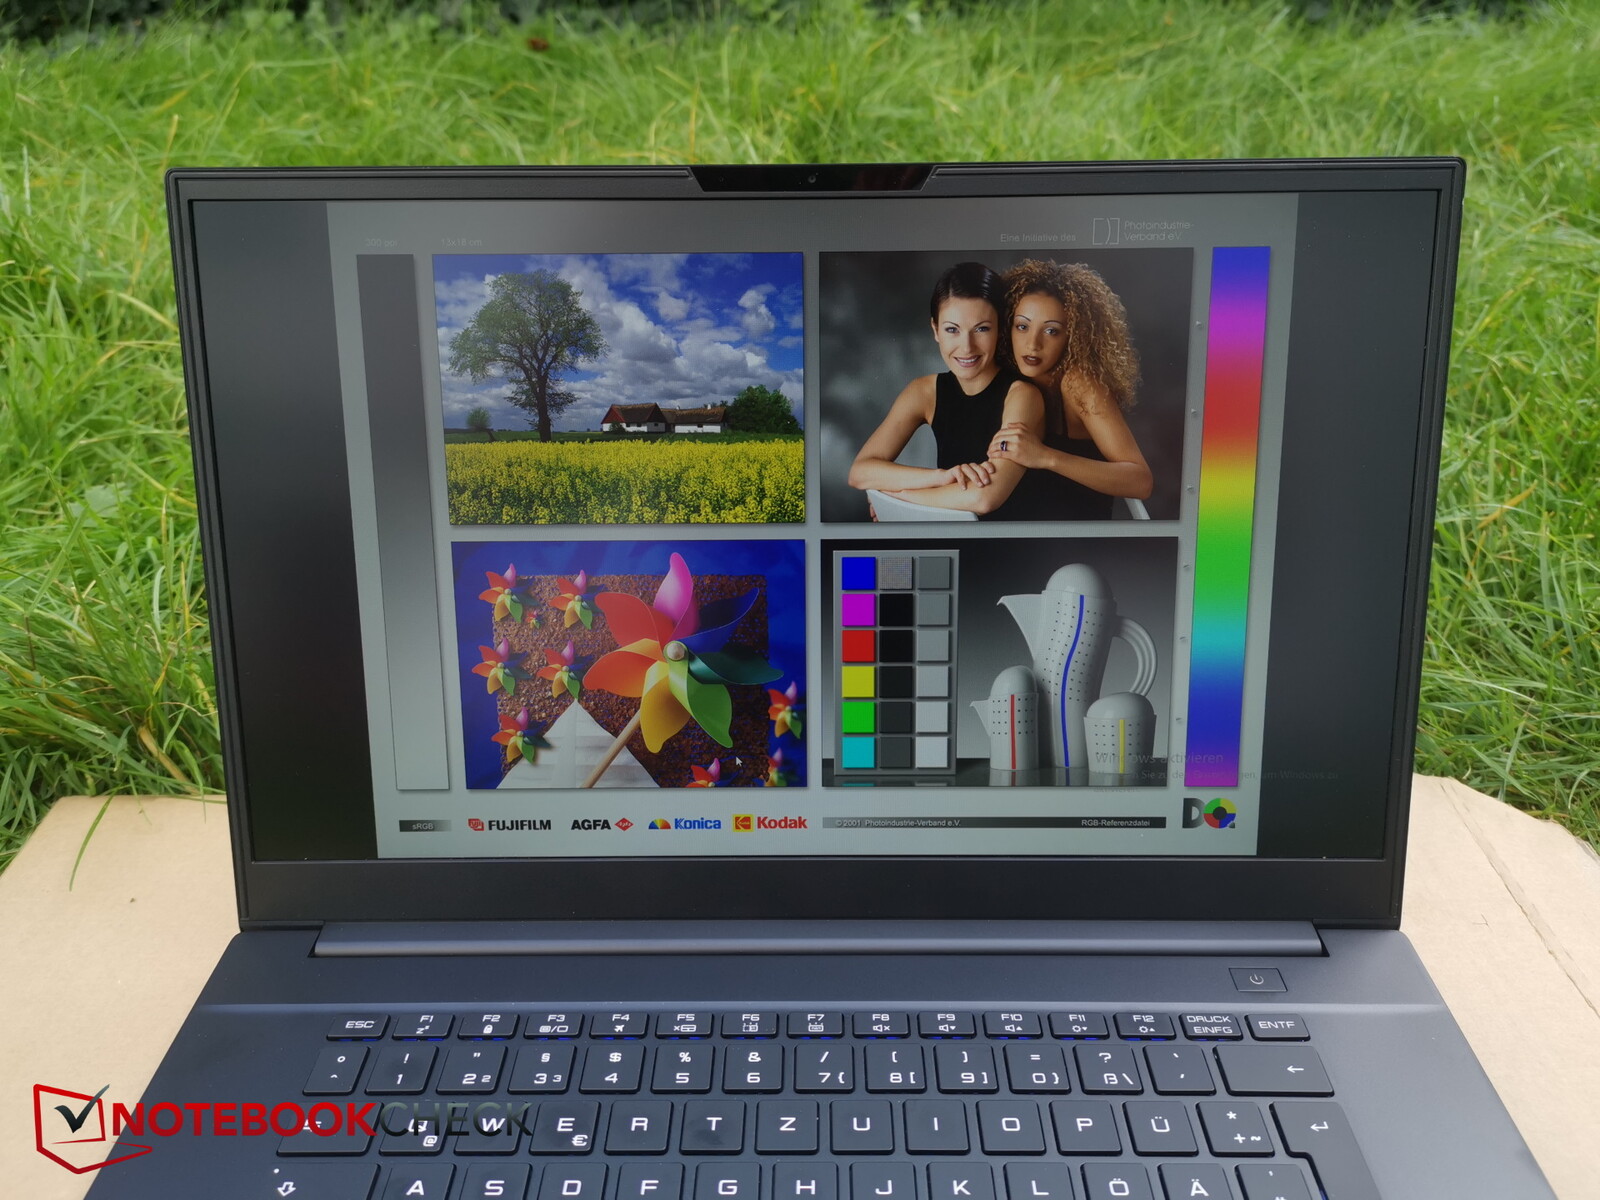
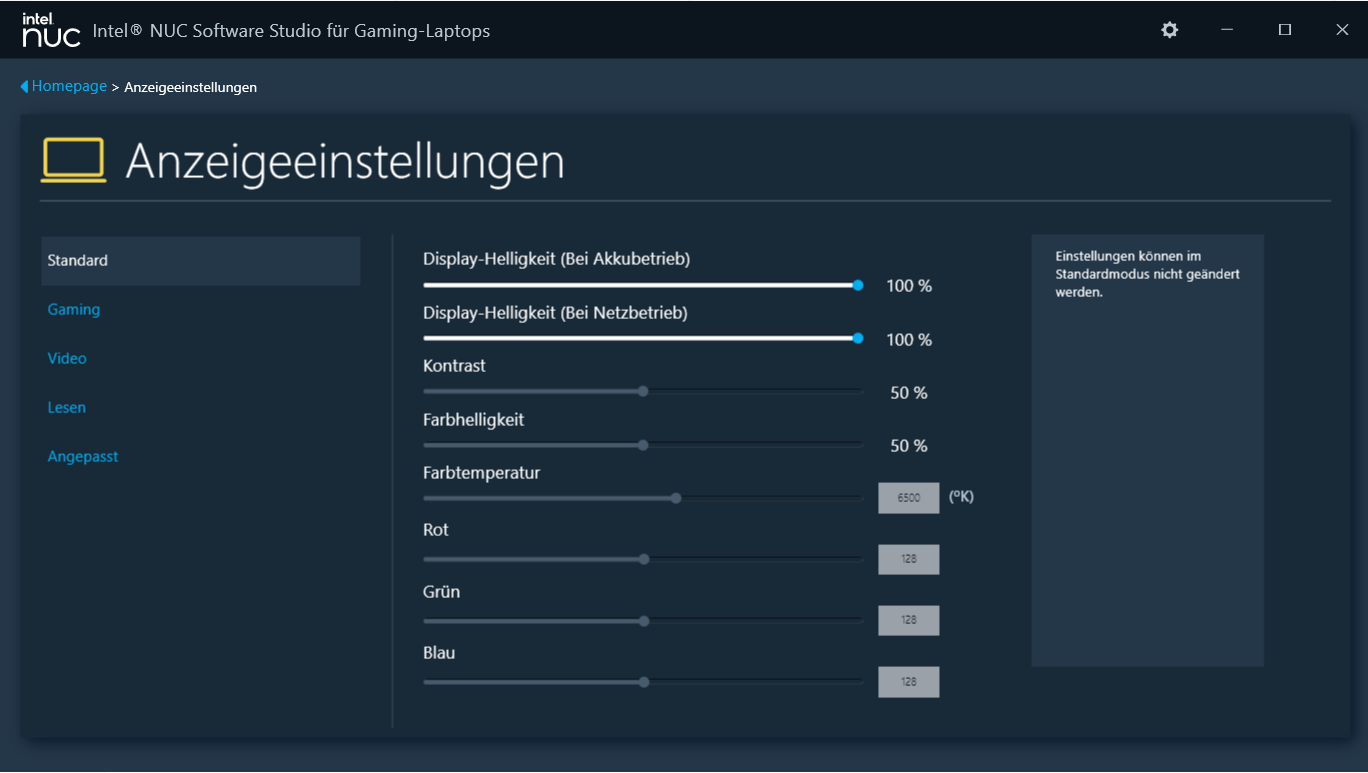
Display - LAPAC71H har en FHD-panel med hög kontrast
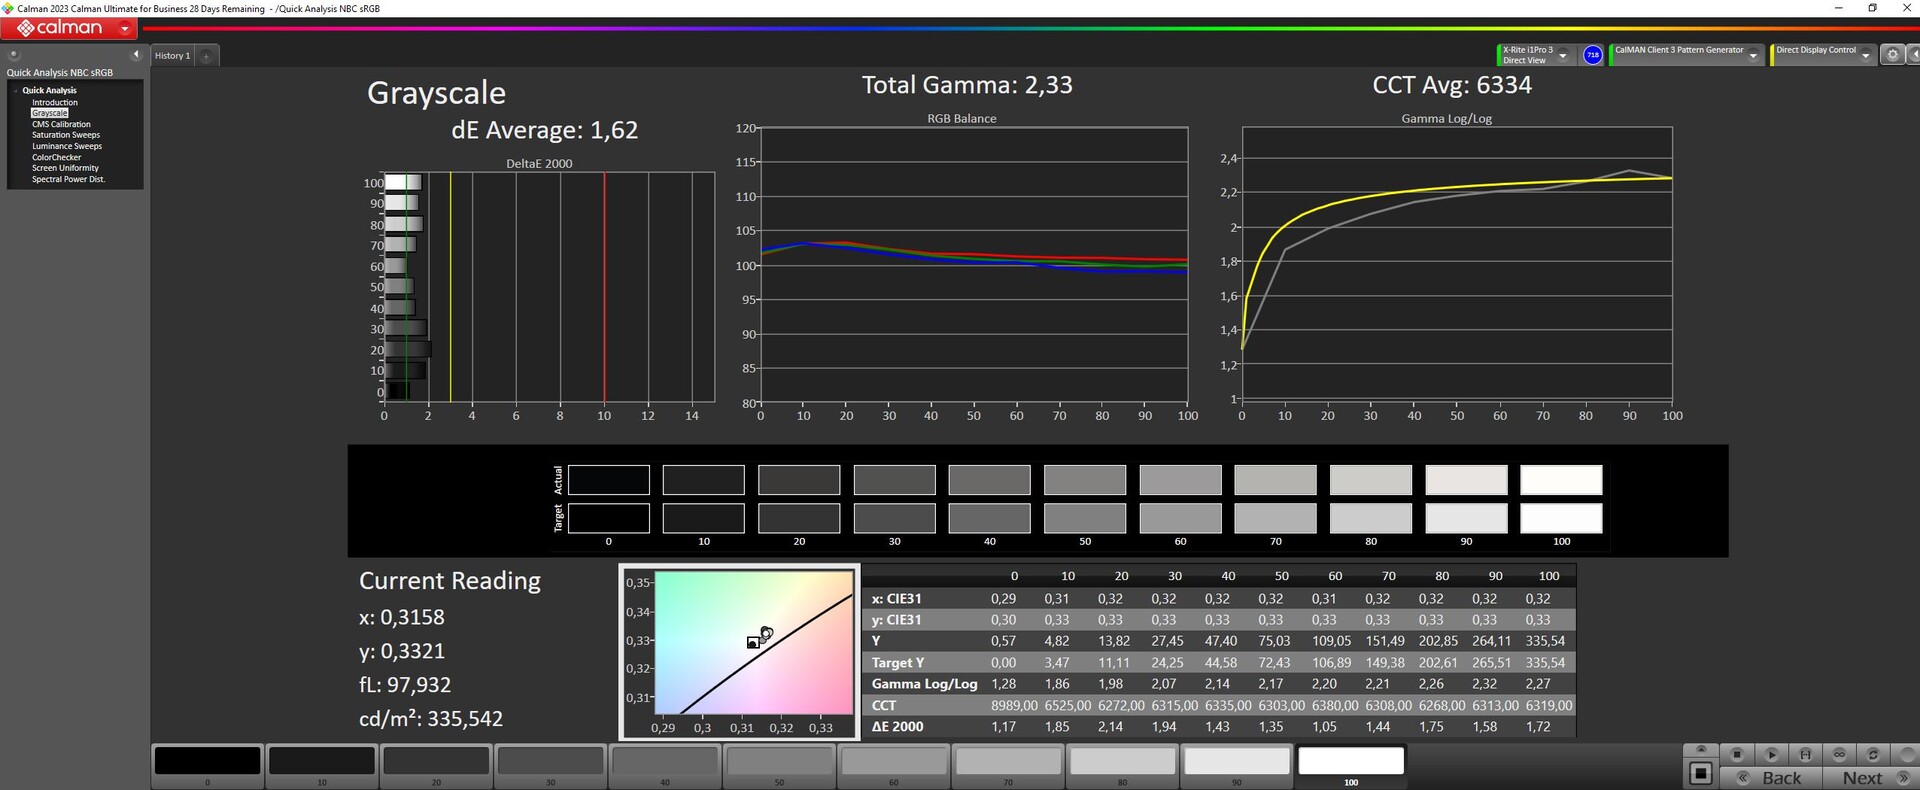
Den snabbreagerande 144 Hz-panelen med ett bildförhållande på 16:9 visar inget PWM-flimmer vid någon ljusstyrka. 15,6-tumsskärmens (1.920 x 1.080 pixlar) mål för ljusstyrka och kontrast har uppnåtts (> 300 cd/m² och 1.000:1). Det relativt höga kontrastvärdet förtjänar att nämnas. Andra displayalternativ är inte tillgängliga.
| |||||||||||||||||||||||||
Distribution av ljusstyrkan: 86 %
Mitt på batteriet: 366 cd/m²
Kontrast: 2147:1 (Svärta: 0.17 cd/m²)
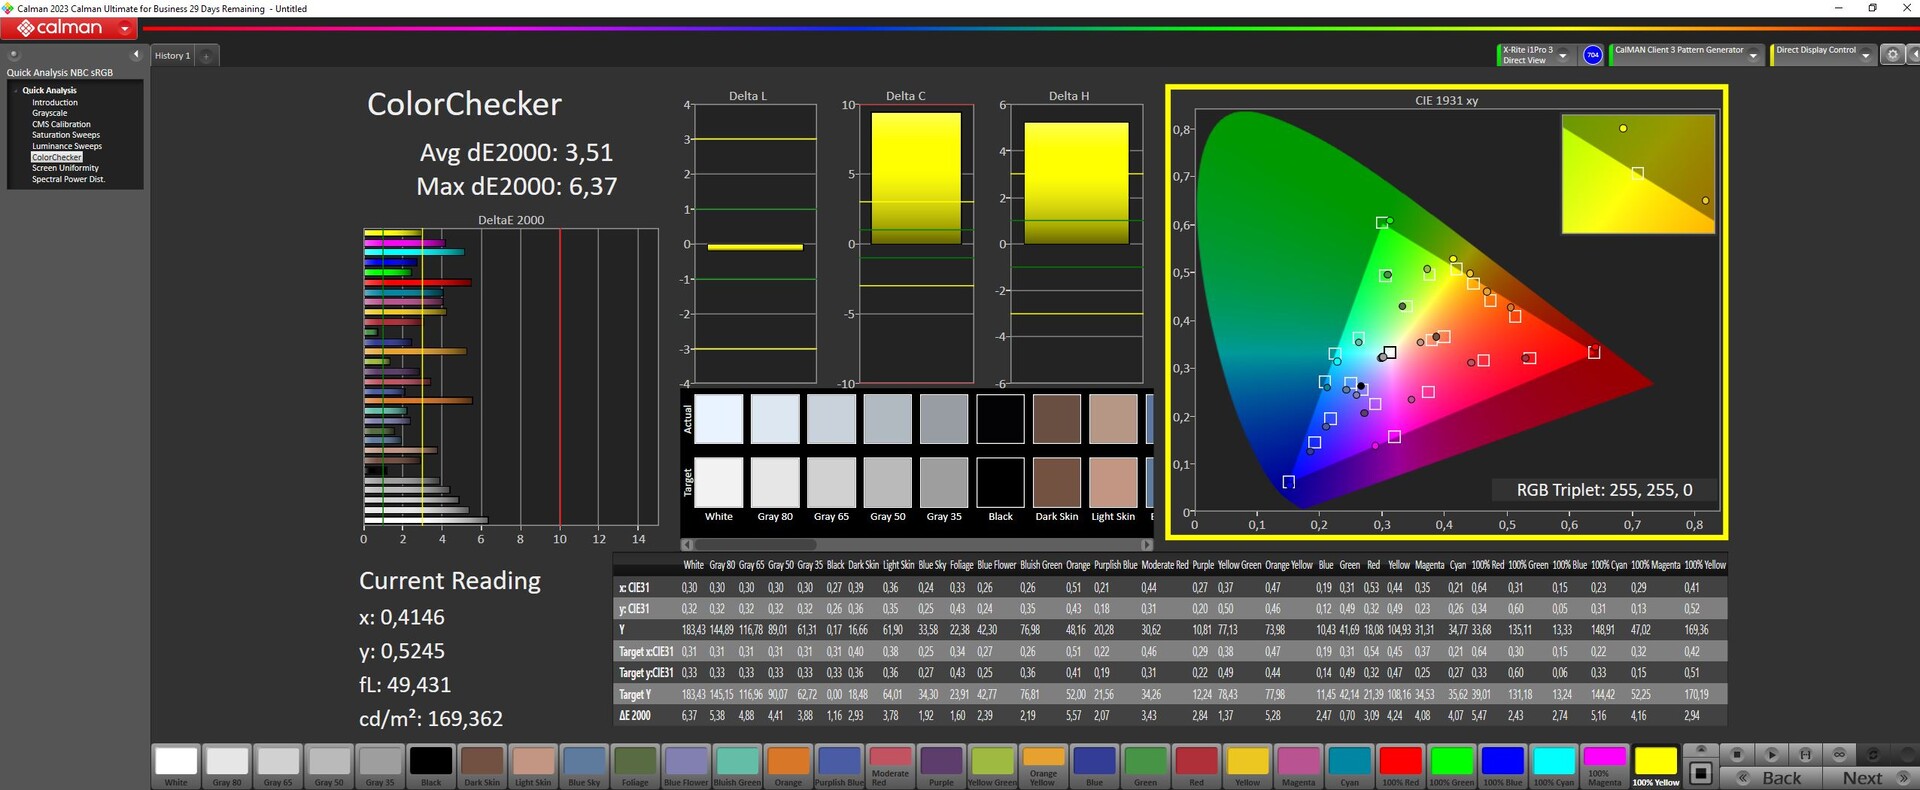
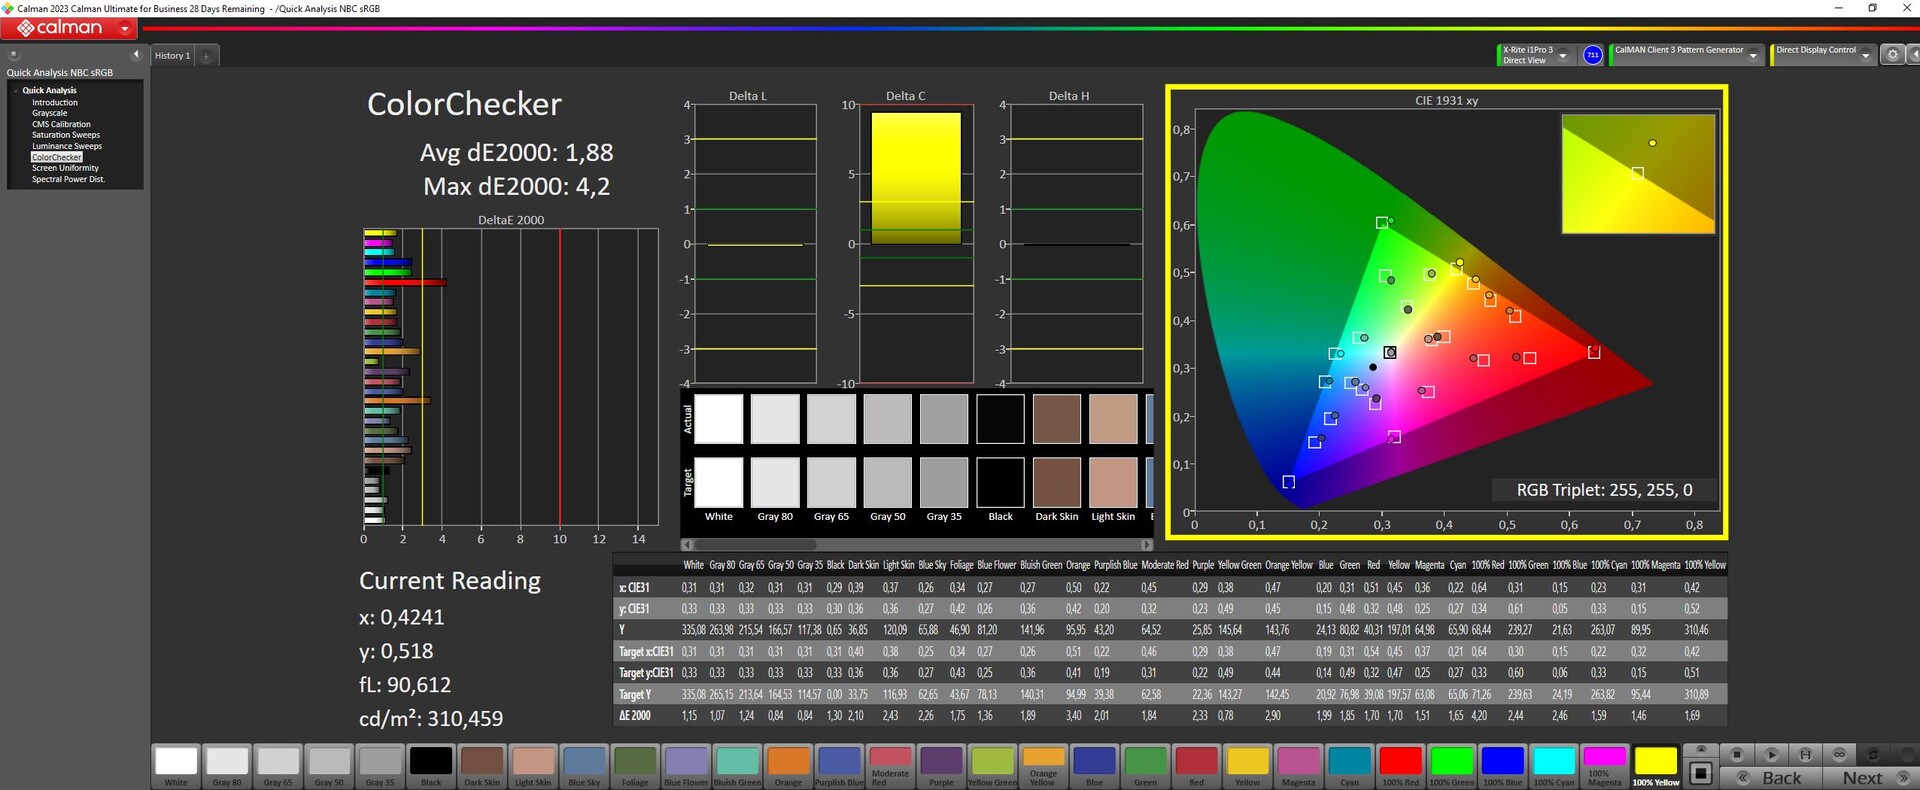
ΔE ColorChecker Calman: 3.51 | ∀{0.5-29.43 Ø4.71}
calibrated: 1.88
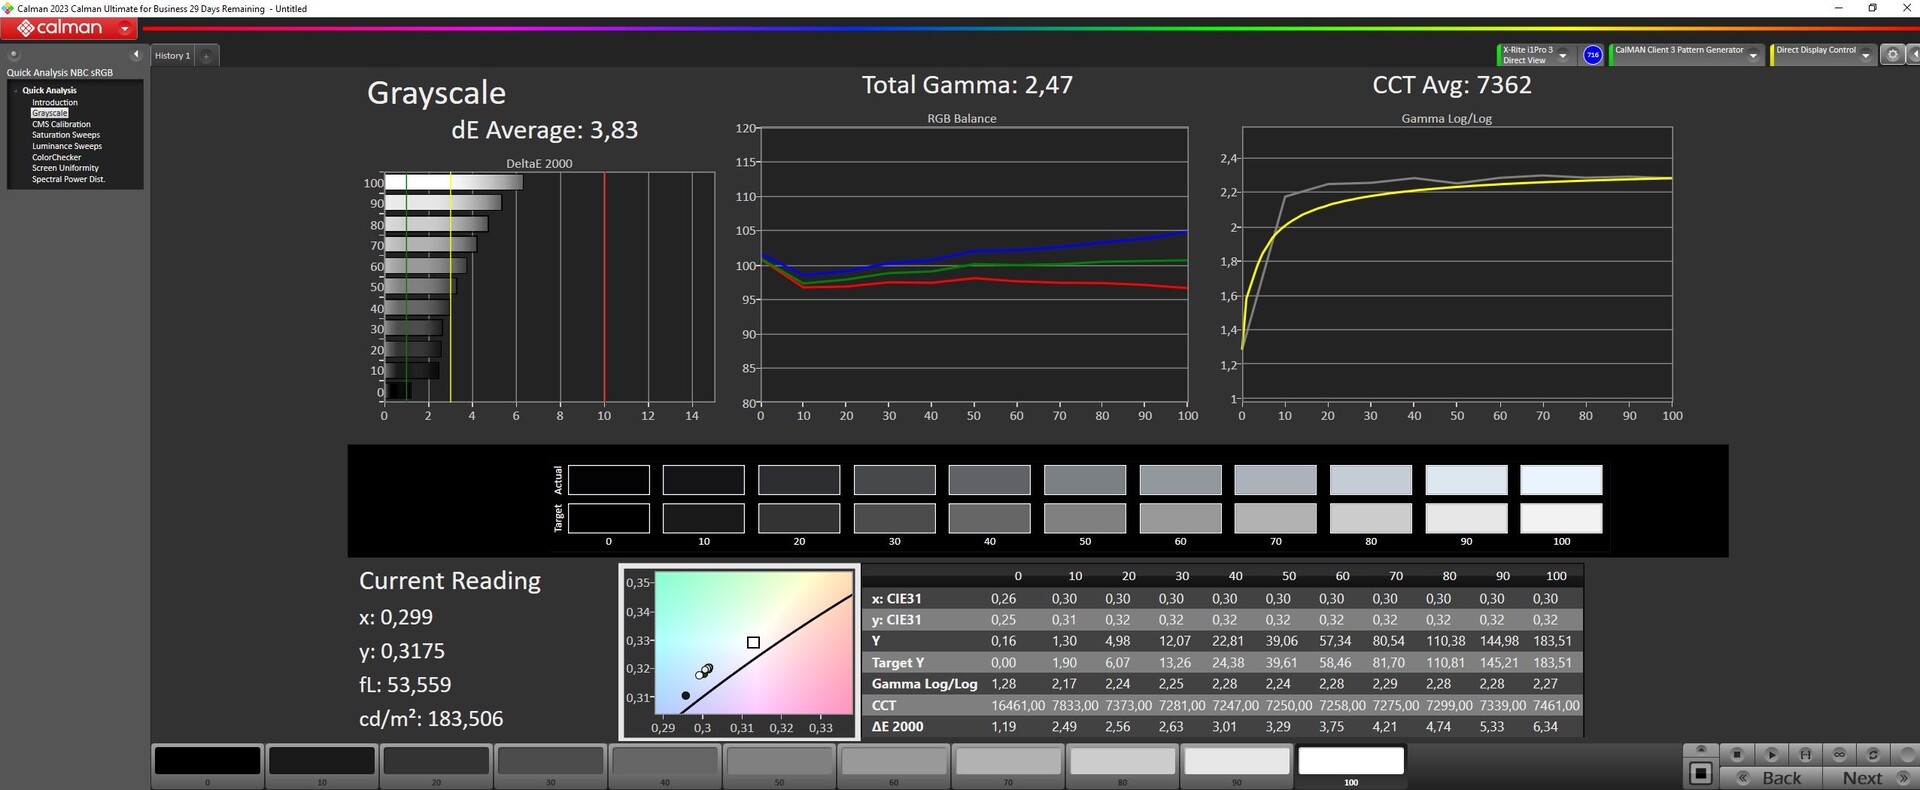
ΔE Greyscale Calman: 3.83 | ∀{0.09-98 Ø4.96}
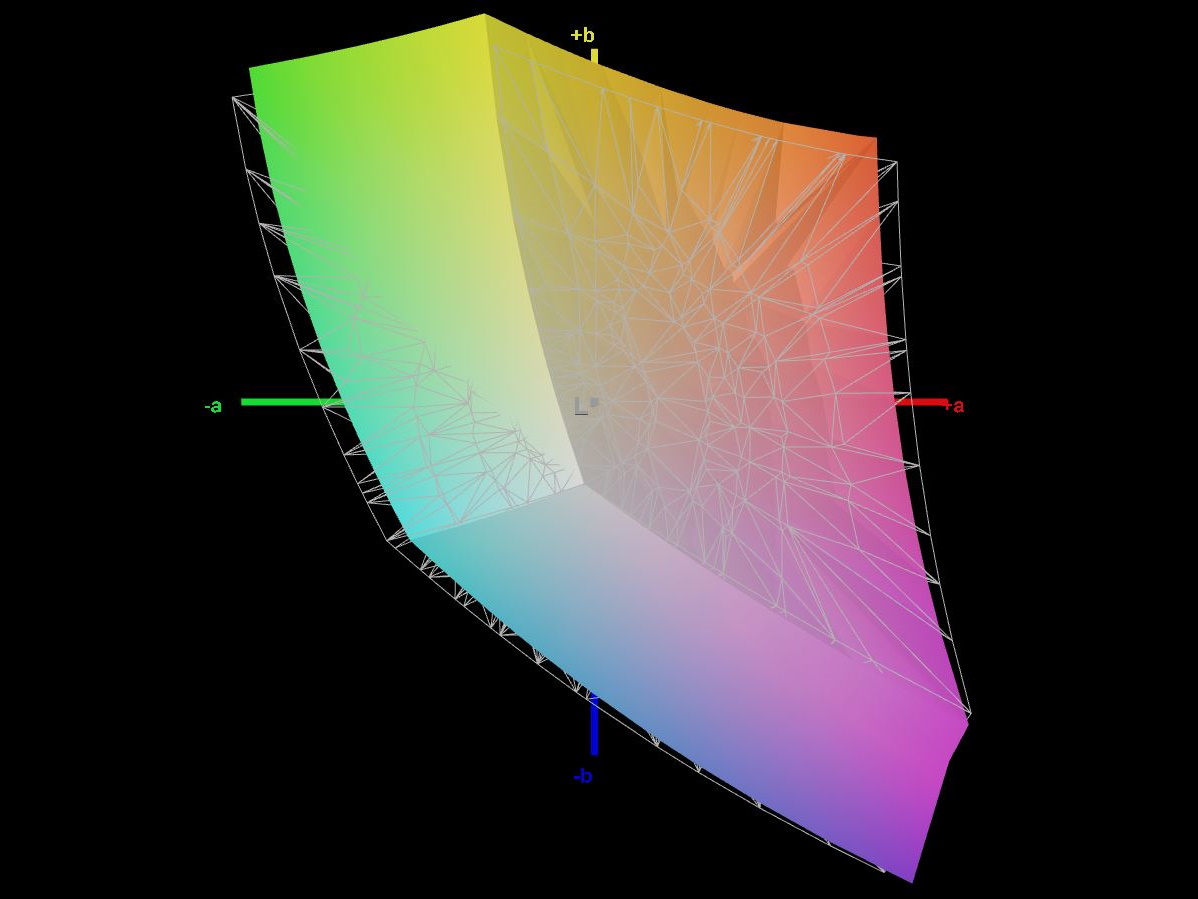
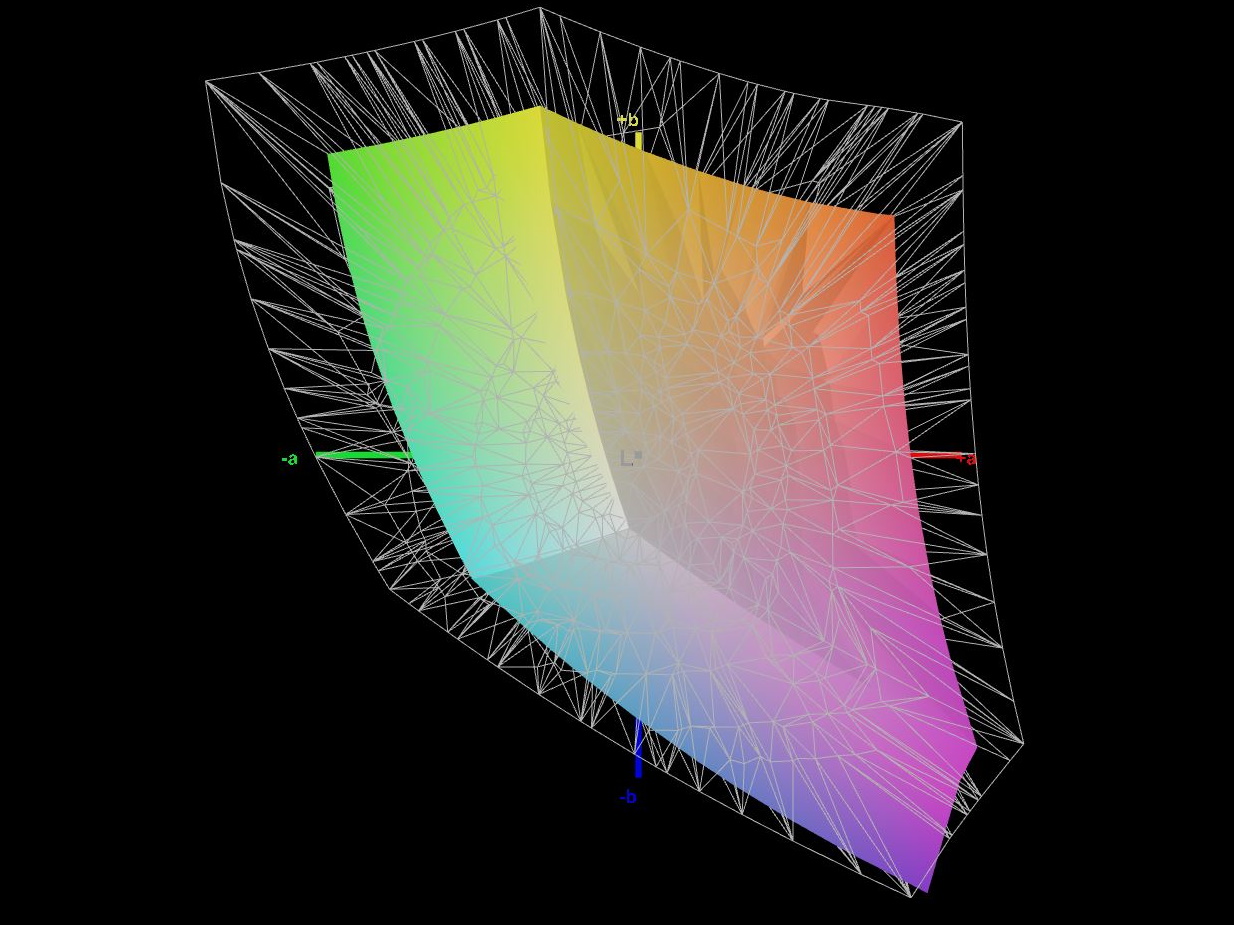
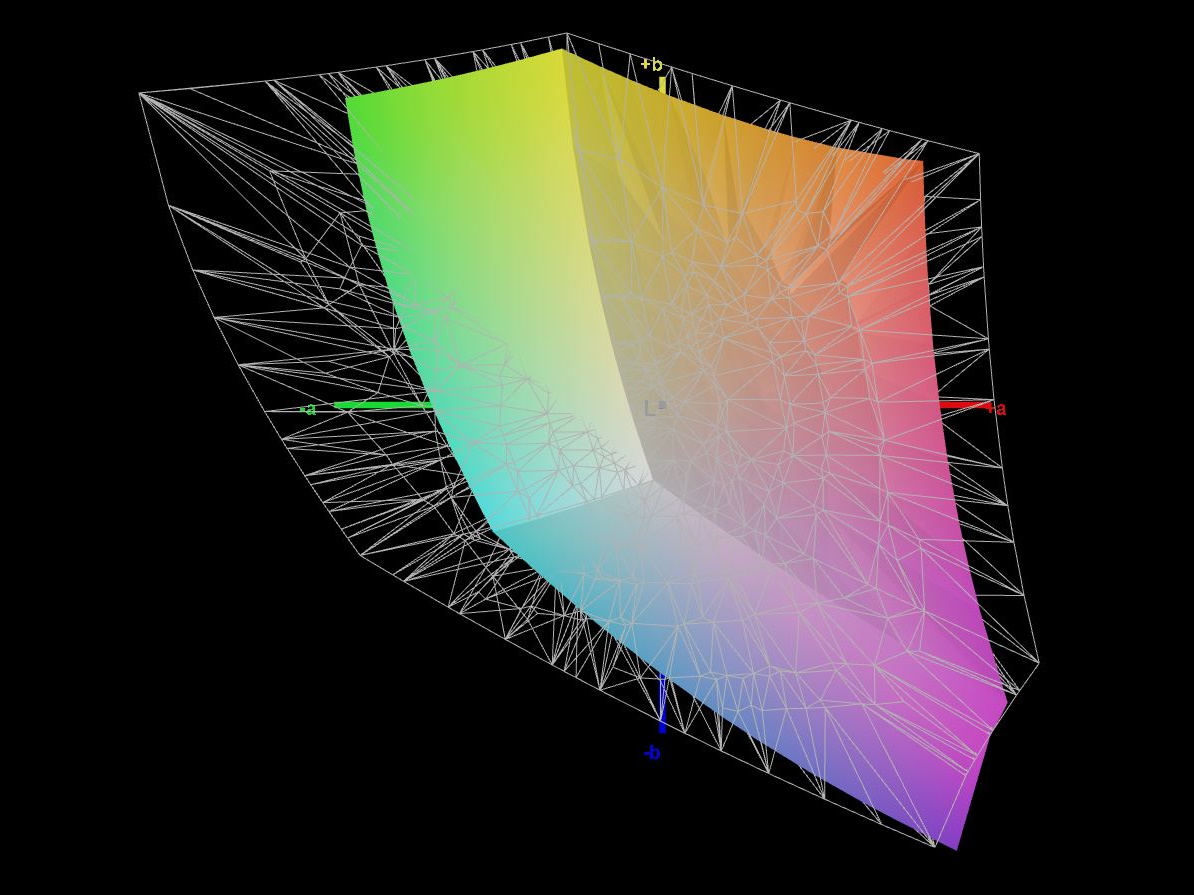
66.3% AdobeRGB 1998 (Argyll 3D)
92.6% sRGB (Argyll 3D)
64.9% Display P3 (Argyll 3D)
Gamma: 2.47
CCT: 7362 K
| Intel NUC X15 LAPAC71H BOE HF NV156FHM-N4G, IPS, 1920x1080, 15.6" | Asus TUF A15 FA507 N156HMA-GA1, IPS, 1920x1080, 15.6" | Gigabyte G5 KE Chi Mei N156HRA-EA1, IPS, 1920x1080, 15.6" | Dell Inspiron 16 Plus 7630 LG Philips 160WQ2, IPS, 2560x1600, 16" | Asus VivoBook Pro 16 Au Optronics B160QAN02.L, IPS, 2560x1600, 16" | MSI Cyborg 15 A12VF AU Optronics B156HAN15.1, IPS, 1920x1080, 15.6" | |
|---|---|---|---|---|---|---|
| Display | 1% | -36% | 8% | 30% | -34% | |
| Display P3 Coverage (%) | 64.9 | 64.9 0% | 40.7 -37% | 70.1 8% | 98.5 52% | 42.3 -35% |
| sRGB Coverage (%) | 92.6 | 96.5 4% | 61 -34% | 99.6 8% | 99.9 8% | 62.6 -32% |
| AdobeRGB 1998 Coverage (%) | 66.3 | 66.6 0% | 42.1 -37% | 72.3 9% | 86.1 30% | 43.7 -34% |
| Response Times | -238% | -199% | -291% | 32% | -137% | |
| Response Time Grey 50% / Grey 80% * (ms) | 7.8 ? | 30.4 ? -290% | 26.64 ? -242% | 35 ? -349% | 2 ? 74% | 22 ? -182% |
| Response Time Black / White * (ms) | 7.3 ? | 20.8 ? -185% | 18.65 ? -155% | 24.2 ? -232% | 8 ? -10% | 14 ? -92% |
| PWM Frequency (Hz) | ||||||
| Screen | 13% | -67% | -10% | 5% | -27% | |
| Brightness middle (cd/m²) | 365 | 288 -21% | 269 -26% | 299.4 -18% | 504 38% | 247 -32% |
| Brightness (cd/m²) | 356 | 271 -24% | 248 -30% | 290 -19% | 465 31% | 234 -34% |
| Brightness Distribution (%) | 86 | 91 6% | 85 -1% | 92 7% | 87 1% | 89 3% |
| Black Level * (cd/m²) | 0.17 | 0.17 -0% | 0.5 -194% | 0.21 -24% | 0.35 -106% | 0.25 -47% |
| Contrast (:1) | 2147 | 1694 -21% | 538 -75% | 1426 -34% | 1440 -33% | 988 -54% |
| Colorchecker dE 2000 * | 3.51 | 1.9 46% | 4.54 -29% | 4.25 -21% | 1.83 48% | 3.78 -8% |
| Colorchecker dE 2000 max. * | 6.37 | 3.3 48% | 17.28 -171% | 6.71 -5% | 5.51 14% | 6.42 -1% |
| Colorchecker dE 2000 calibrated * | 1.88 | 0.9 52% | 3.34 -78% | 0.52 72% | 1.34 29% | 3.94 -110% |
| Greyscale dE 2000 * | 3.83 | 2.7 30% | 3.8 1% | 5.5 -44% | 3.02 21% | 2.16 44% |
| Gamma | 2.47 89% | 2.32 95% | 2.17 101% | 2.35 94% | 2.39 92% | 2.33 94% |
| CCT | 7362 88% | 6535 99% | 7408 88% | 6368 102% | 6688 97% | 6906 94% |
| Totalt genomsnitt (program/inställningar) | -75% /
-25% | -101% /
-79% | -98% /
-46% | 22% /
14% | -66% /
-44% |
* ... mindre är bättre
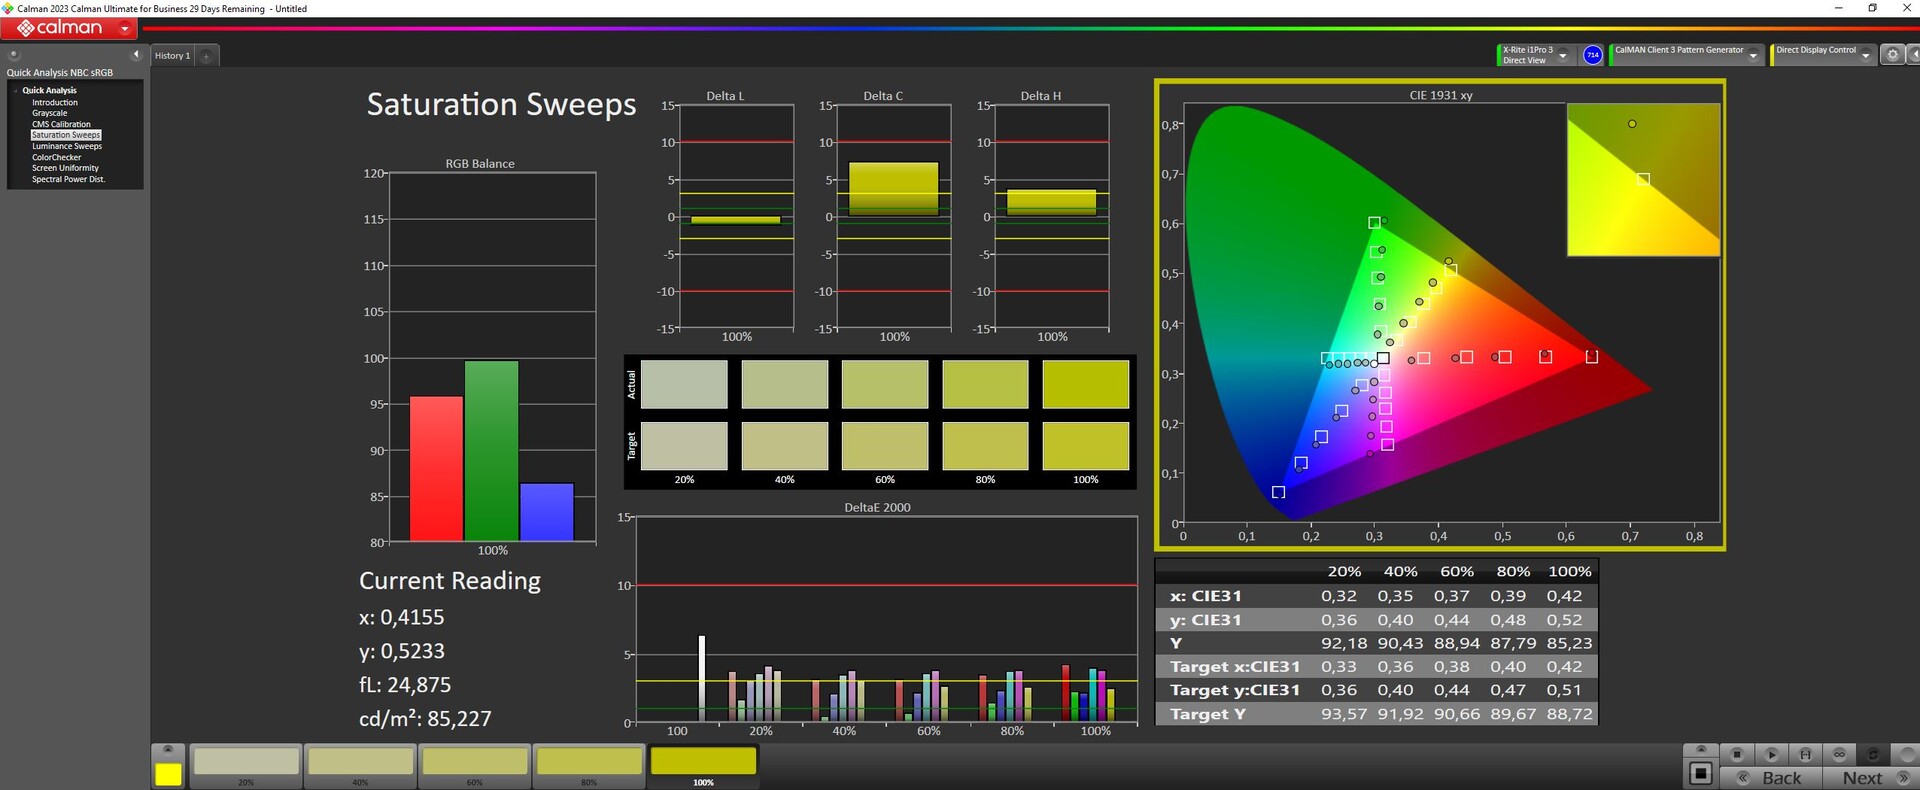
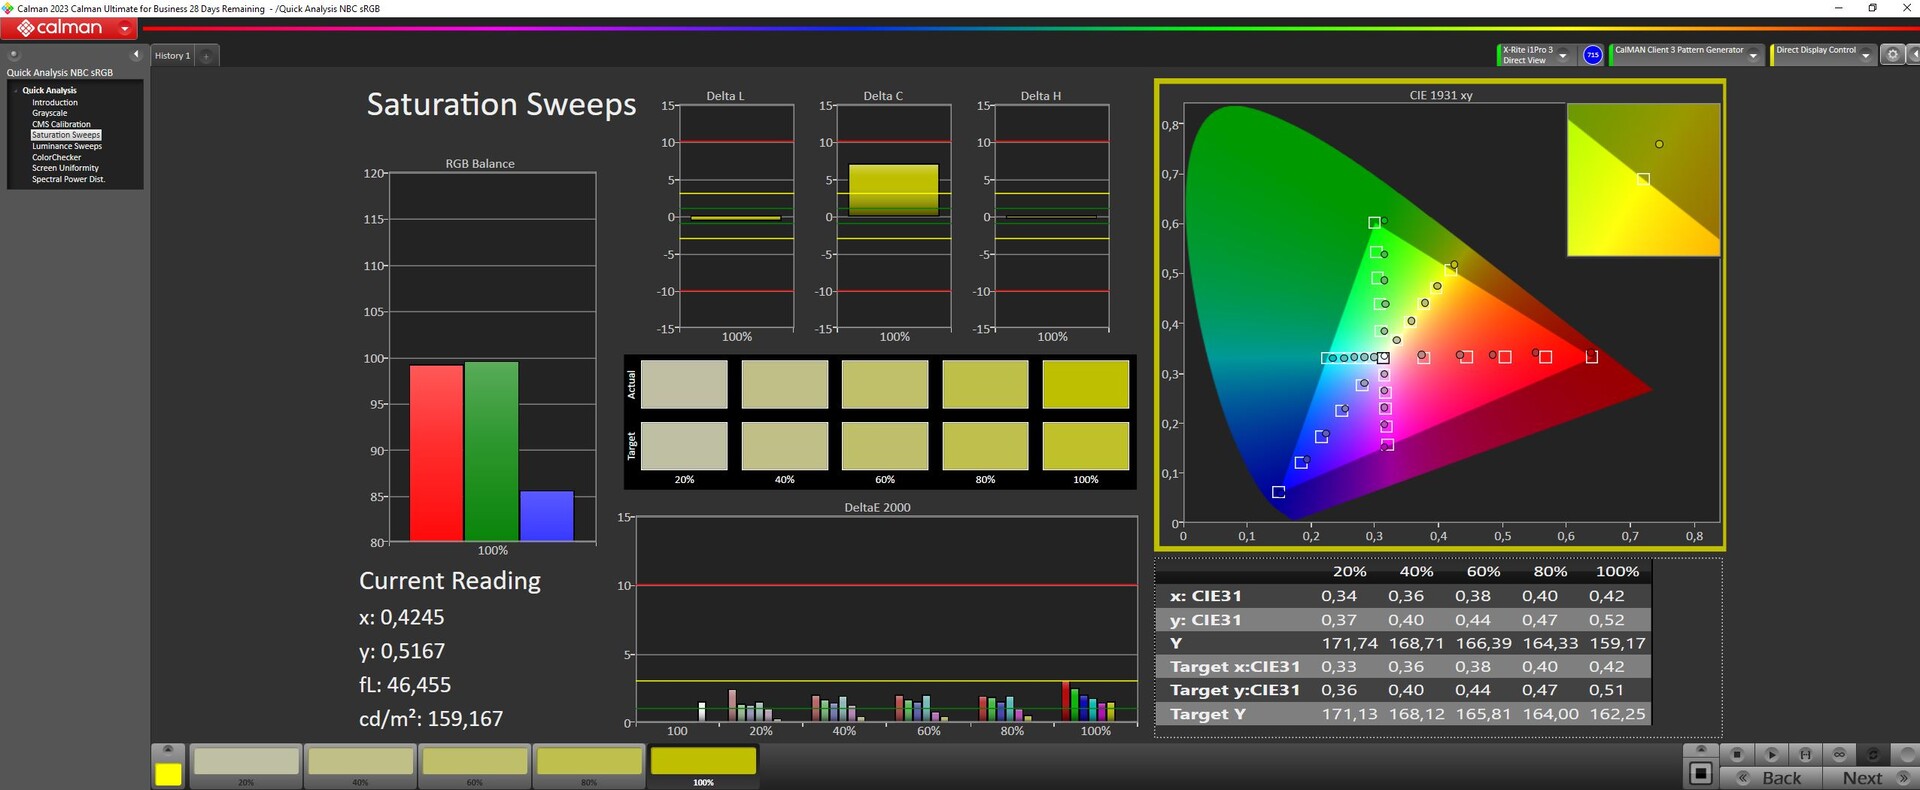
Ex works, displayen visar relativt bra färgåtergivning: Med en avvikelse på cirka 3,5 missades målet (DeltaE < 3) precis. Kalibrering av skärmen sänker avvikelsen till 1,9 och leder till mer balanserade gråtoner. Panelen kan nästan helt täcka sRGB-färgrymden, men inte AdobeRGB eller DCI P3. De flesta av konkurrenternas paneler ger en liknande bild. EndastVivoBookkan täcka P3-färgrymden.
Visa svarstider
| ↔ Svarstid svart till vitt | ||
|---|---|---|
| 7.3 ms ... stiga ↗ och falla ↘ kombinerat | ↗ 3.3 ms stiga | 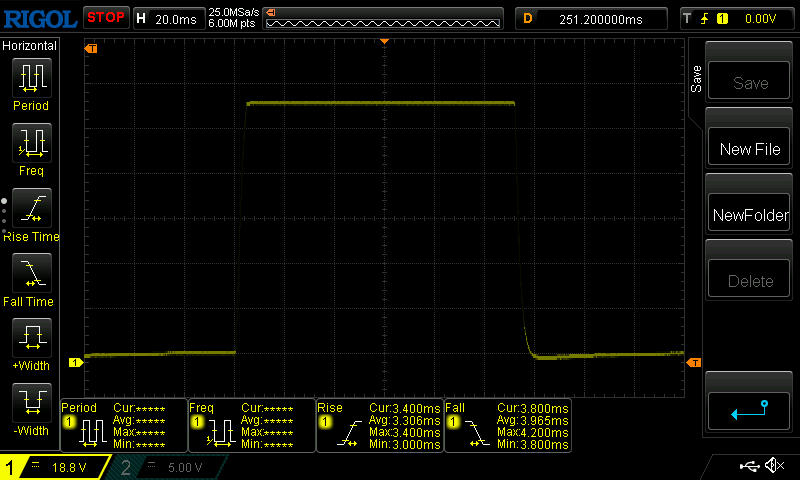 |
| ↘ 4 ms hösten | ||
| Skärmen visar väldigt snabba svarsfrekvenser i våra tester och borde vara mycket väl lämpad för fartfyllt spel. I jämförelse sträcker sig alla testade enheter från 0.1 (minst) till 240 (maximalt) ms. » 22 % av alla enheter är bättre. Det betyder att den uppmätta svarstiden är bättre än genomsnittet av alla testade enheter (19.8 ms). | ||
| ↔ Svarstid 50 % grått till 80 % grått | ||
| 7.8 ms ... stiga ↗ och falla ↘ kombinerat | ↗ 3.9 ms stiga | 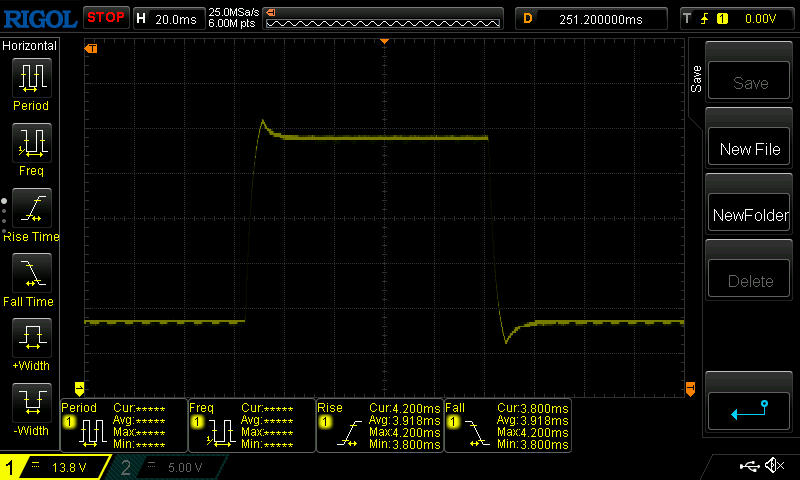 |
| ↘ 3.9 ms hösten | ||
| Skärmen visar väldigt snabba svarsfrekvenser i våra tester och borde vara mycket väl lämpad för fartfyllt spel. I jämförelse sträcker sig alla testade enheter från 0.165 (minst) till 636 (maximalt) ms. » 21 % av alla enheter är bättre. Det betyder att den uppmätta svarstiden är bättre än genomsnittet av alla testade enheter (30.9 ms). | ||
Skärmflimmer / PWM (Puls-Width Modulation)
| Skärmflimmer / PWM upptäcktes inte |  | ||
Som jämförelse: 52 % av alla testade enheter använder inte PWM för att dämpa skärmen. Om PWM upptäcktes mättes ett medelvärde av 7748 (minst: 5 - maximum: 343500) Hz. | |||
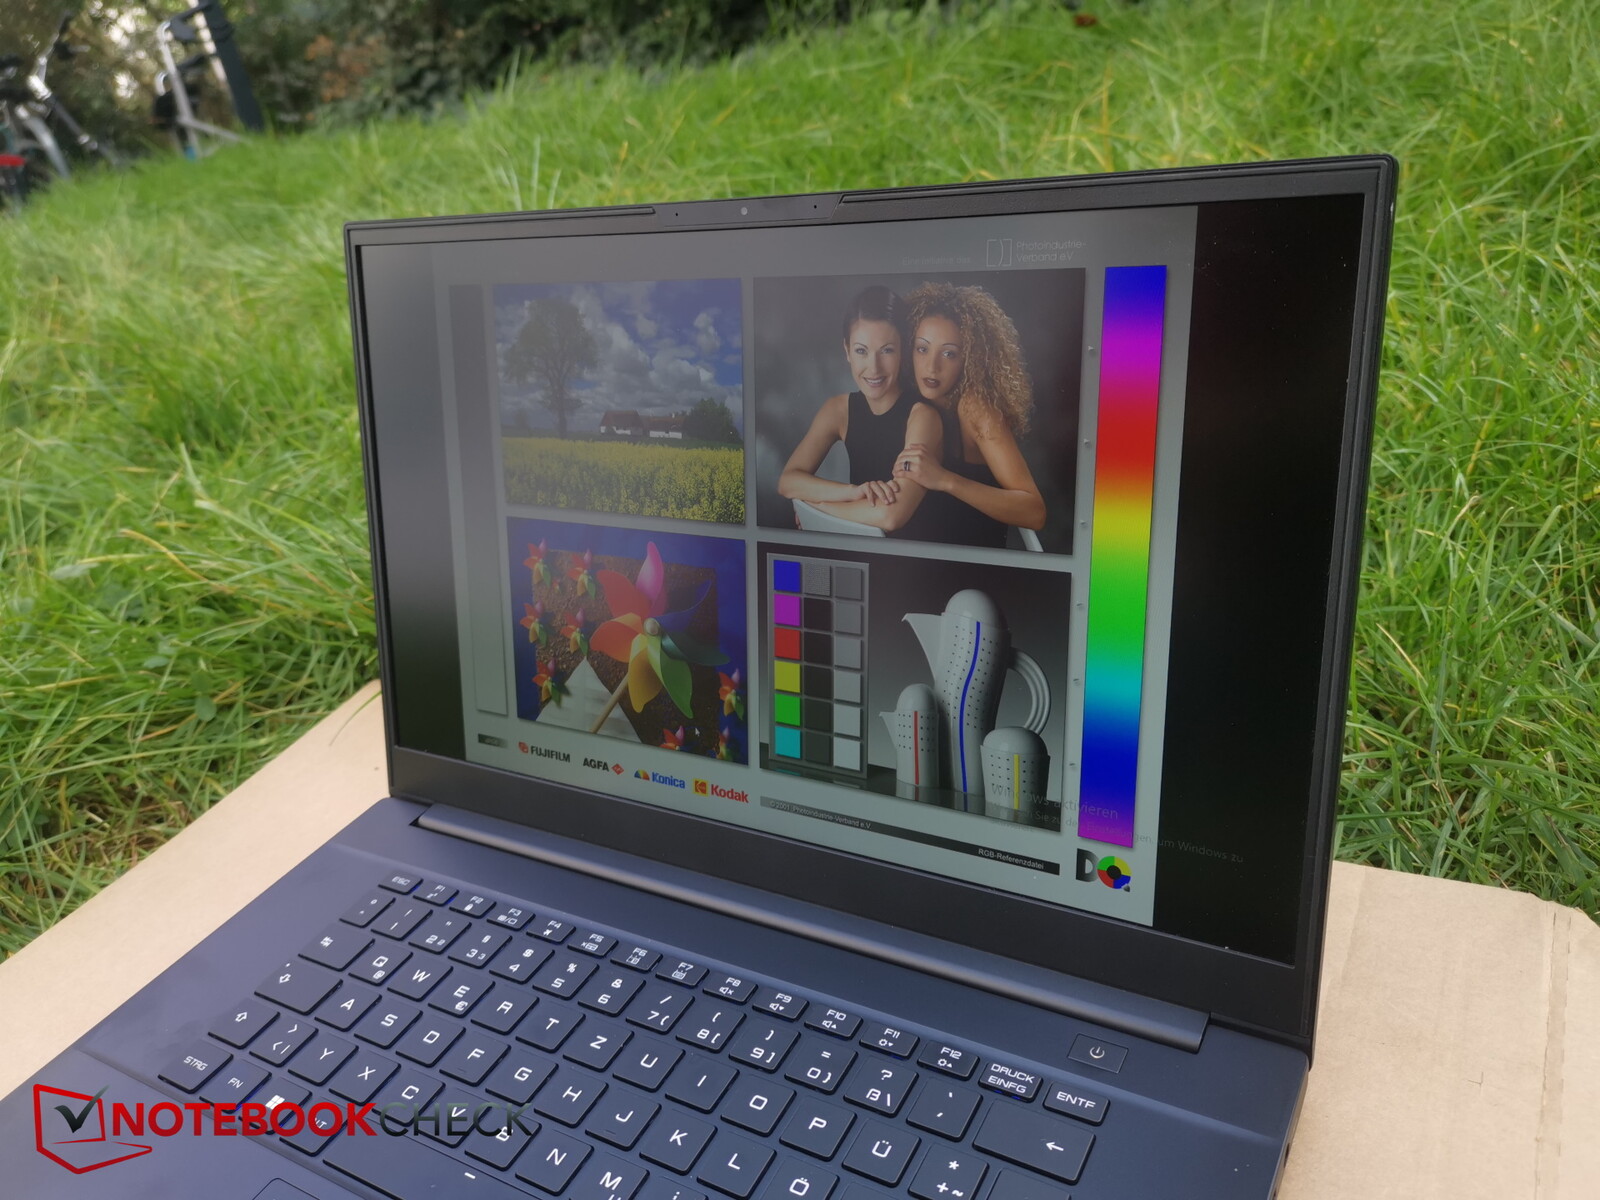
Den betraktningsvinkelstabila IPS-panelen är läsbar från alla vinklar. Utomhus kan du läsa på displayen så länge solen inte skiner för starkt.

Prestanda - Ett Intel-team driver den bärbara speldatorn
ACore i7-12700Hoch Arc A730Mdriver Intel NUC X15 LAPAC71H som är inriktad på spelare och kreatörer. Andra alternativ är inte tillgängliga. Den bärbara datorn kan för närvarande hittas från cirka 1 050 USD. Den nuvarande varianten kostar cirka 1 280 USD. Du kommer eventuellt att behöva räkna med ytterligare kostnader för en Windows-licens.
Villkor för testning
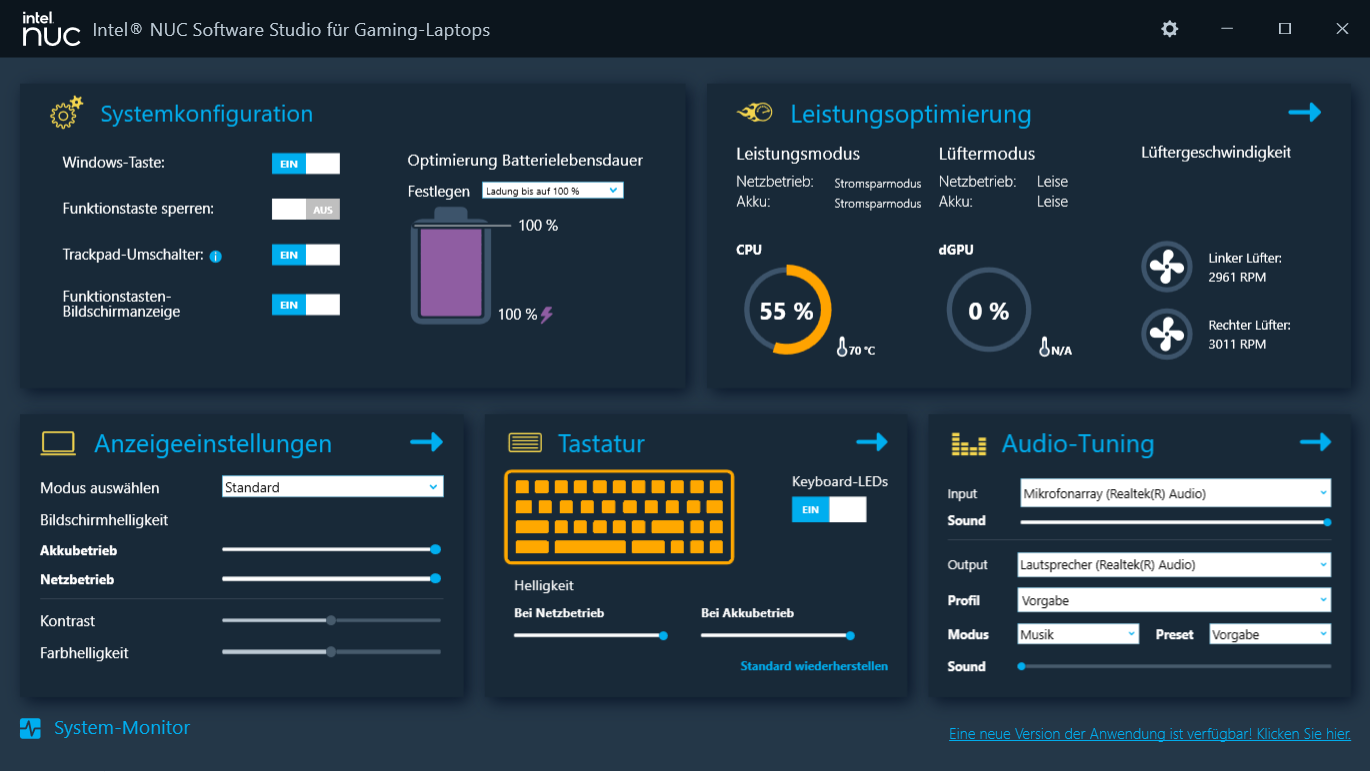
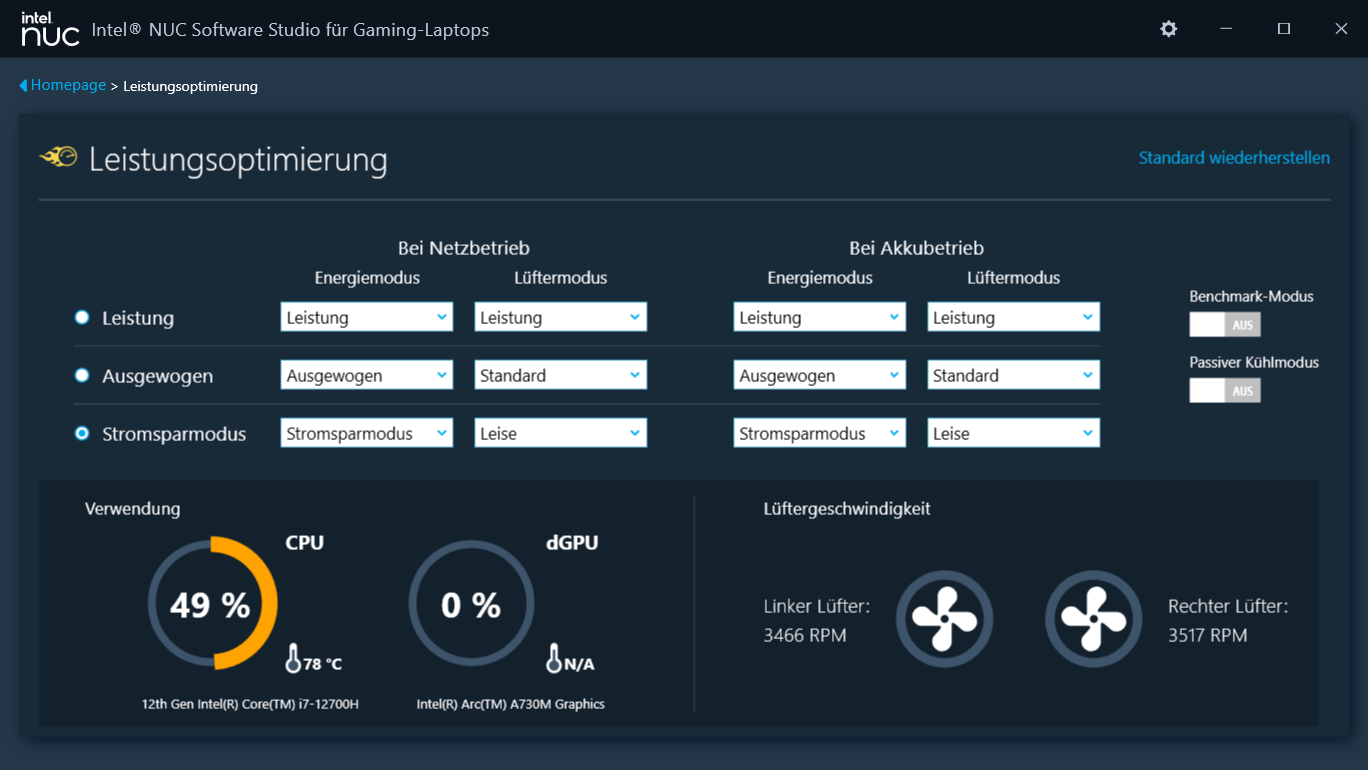
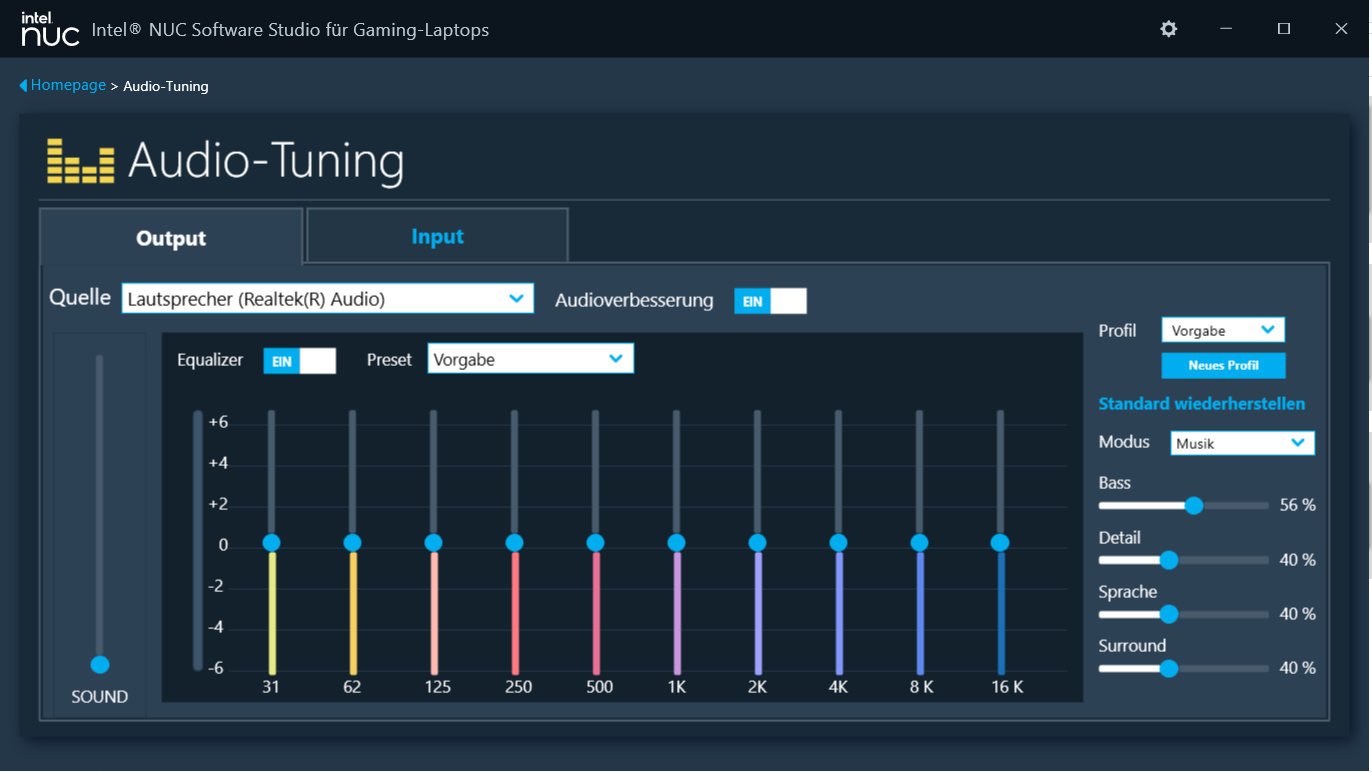
Intel NUC Software Studio (Control Center) tillhandahåller tre profiler för att påverka dess prestanda och fläktstyrning (se tabell). Profilerna "Performance" (benchmarks) och "Power Saving Mode" (batteritester) användes för att utföra detta test. Dess maximala prestanda är endast tillgänglig efter aktivering av alternativet "Benchmark Mode". Men fläktarna körs då också permanent på full effekt.
| Prestanda | Balanserad | Energisparläge | Benchmarkläge | |
|---|---|---|---|---|
| Effektgräns 1 (HWInfo) | 45 watt | 35 watt | 35 watt | 45 watt |
| Effektgräns 2 (HWInfo) | 90 watt | 80 watt | 65 watt | 90 watt |
| TGP (Arc Control) | 75 watt | 65 watt | 55 watt | 85 watt |
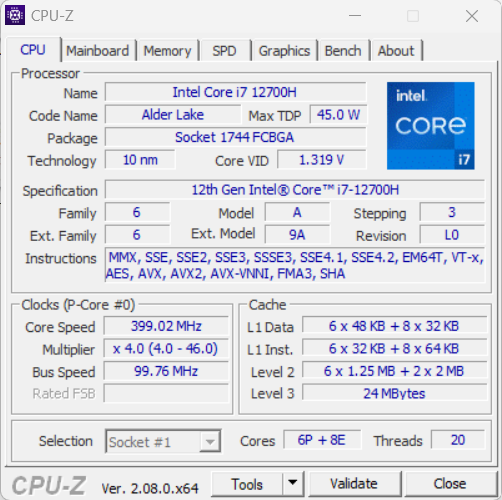
Processor
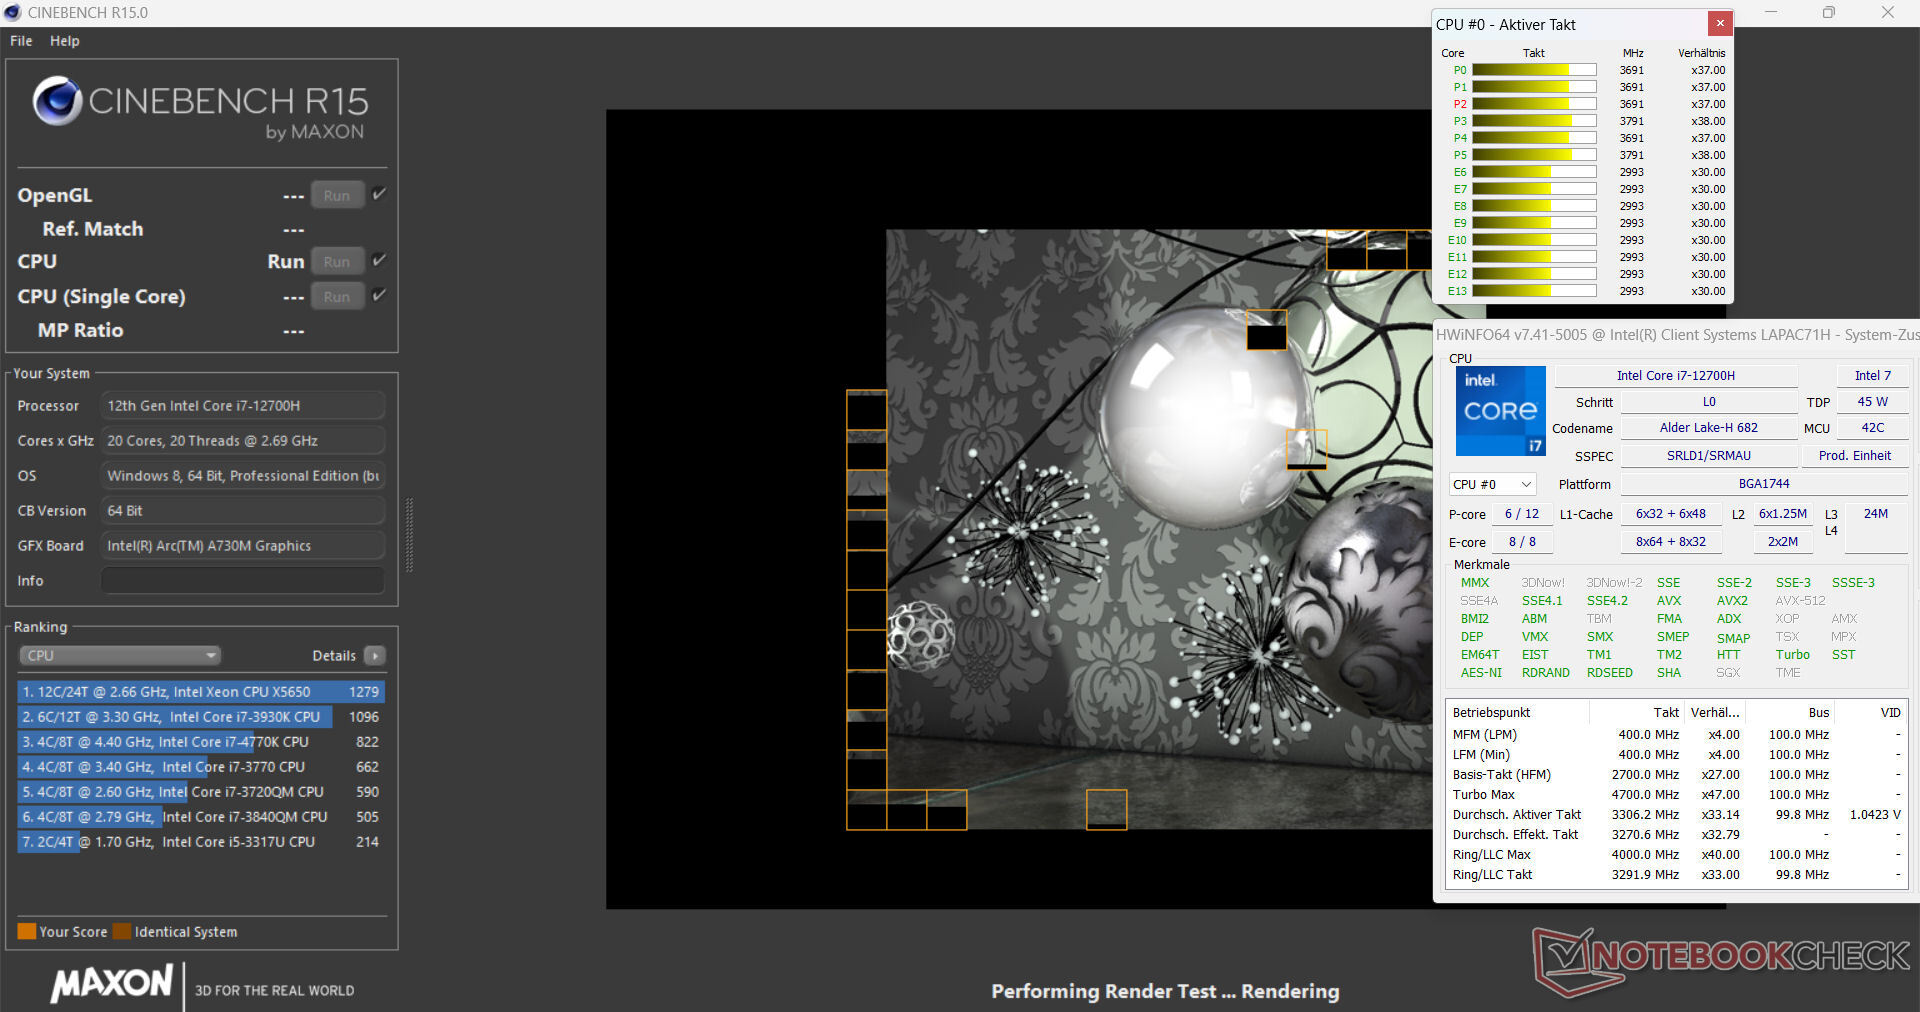
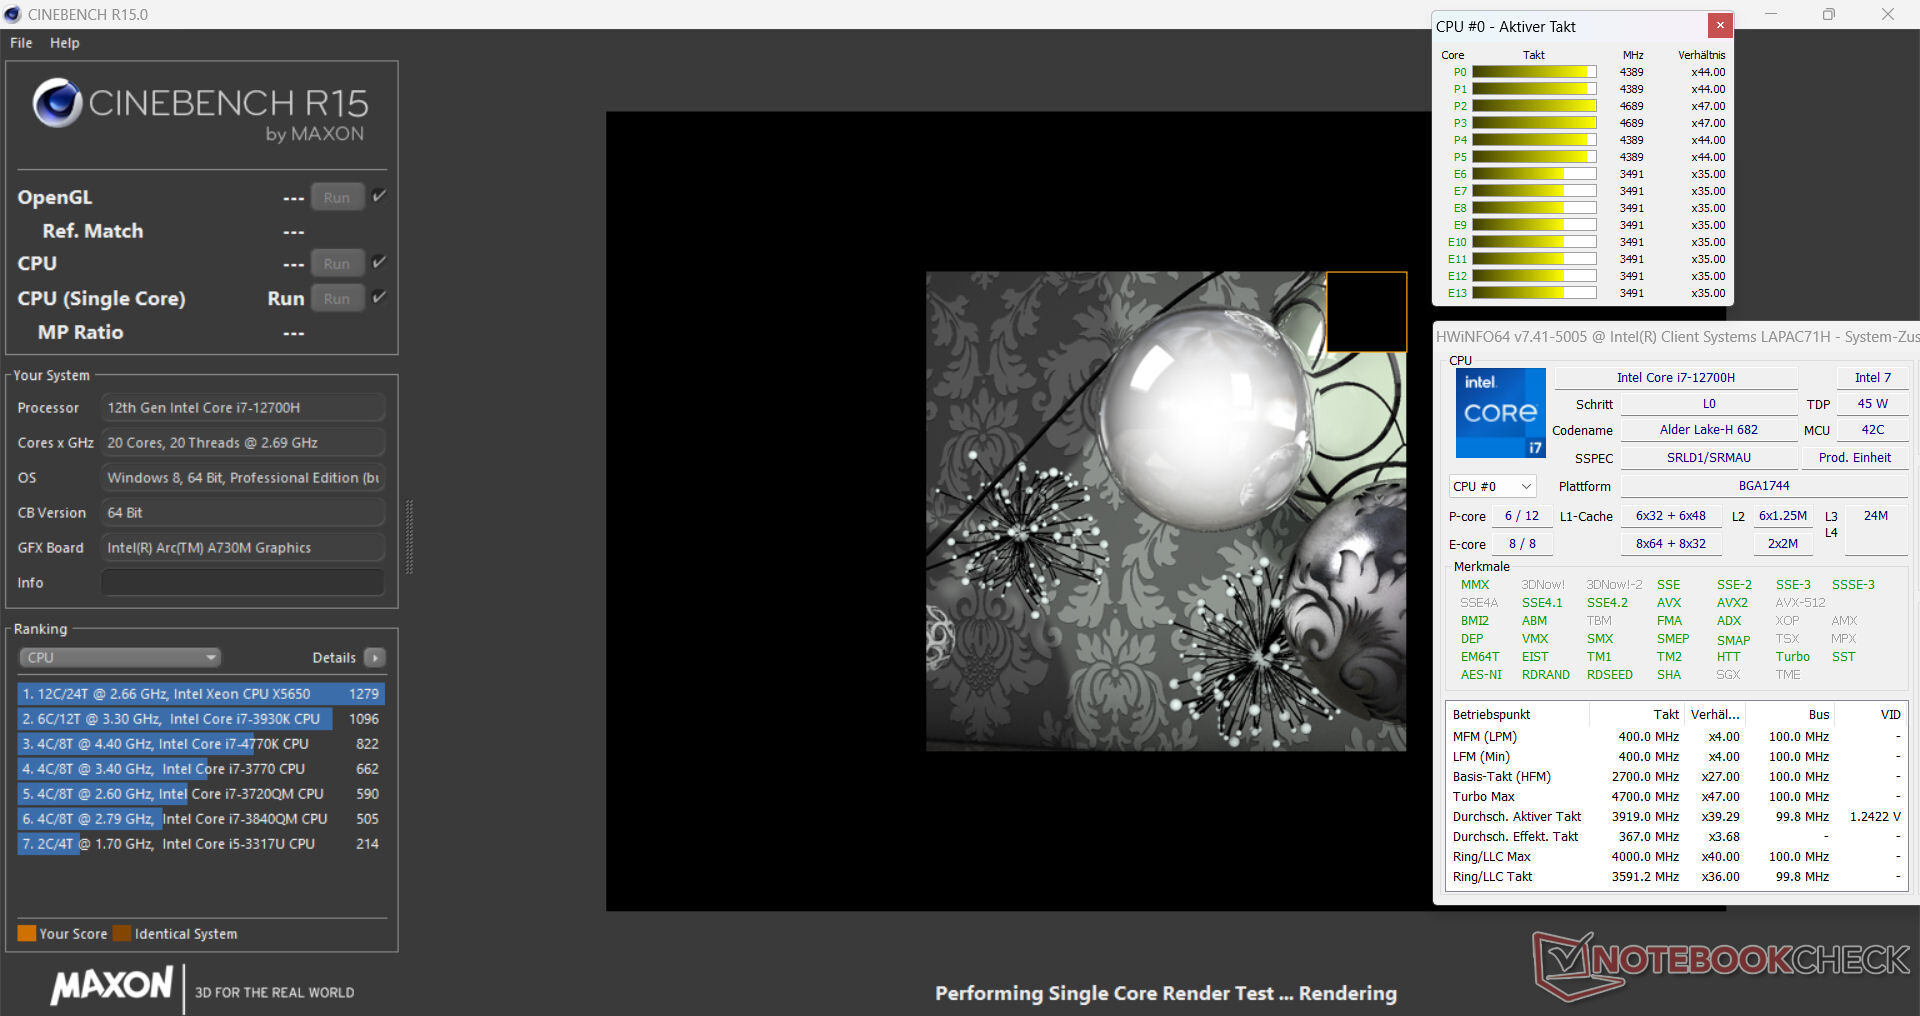
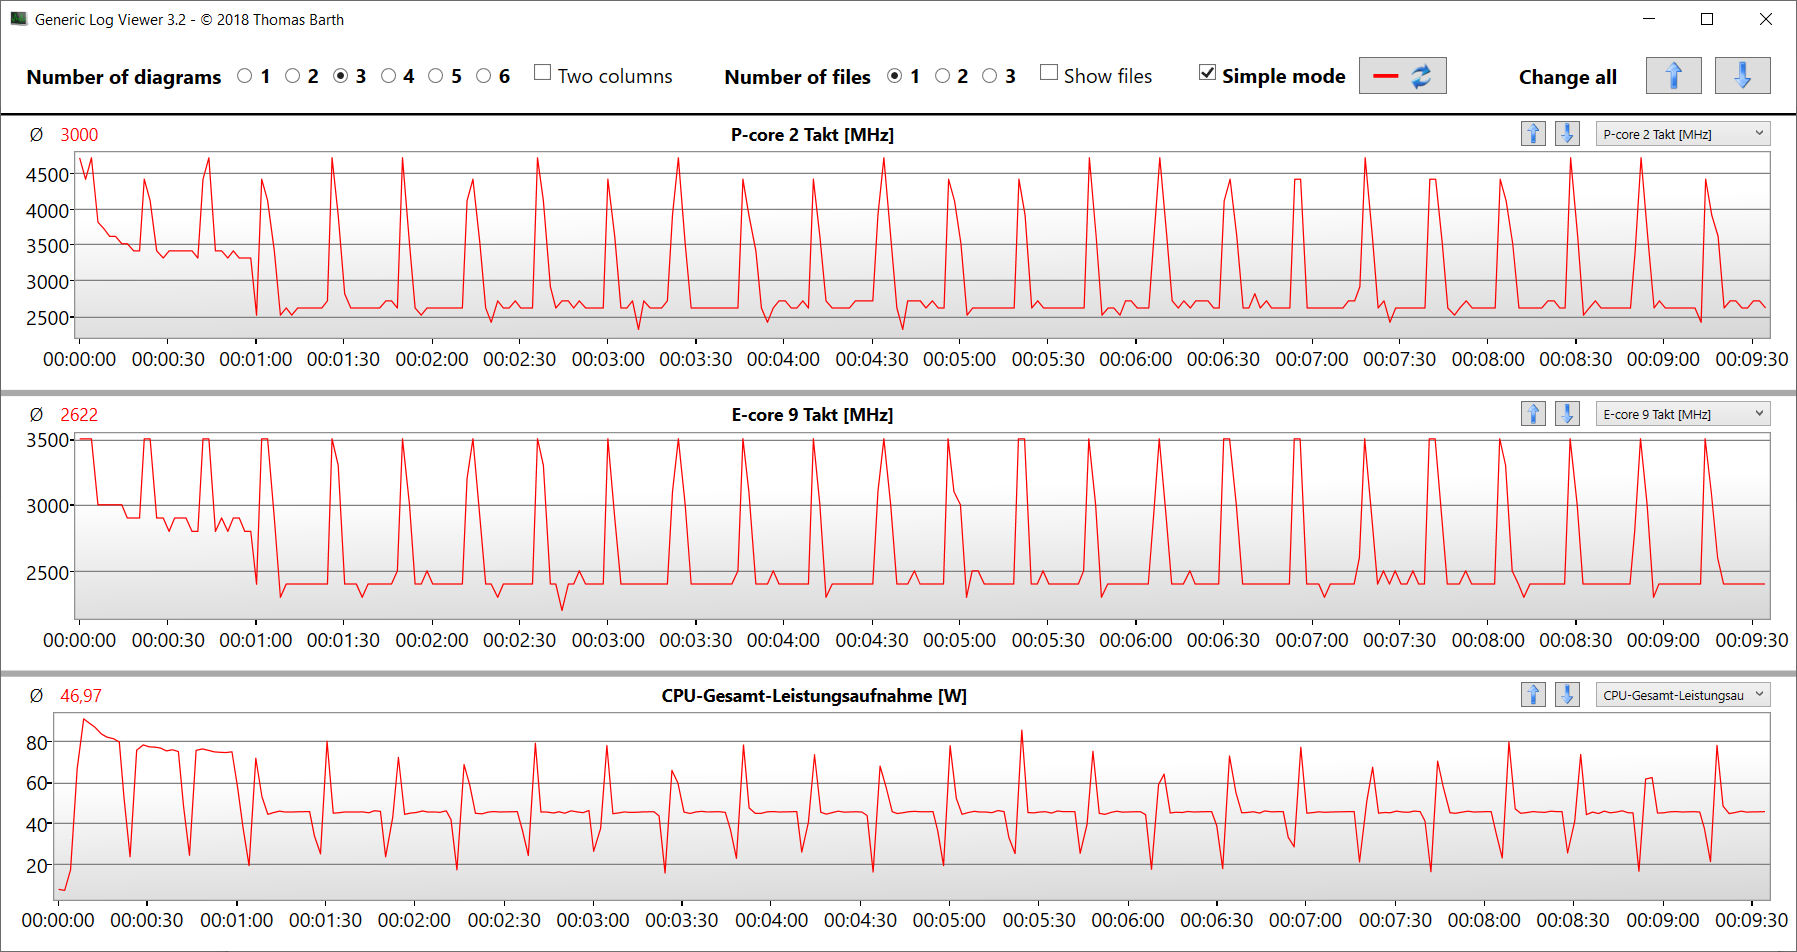
Core i7-12700H:s 14 CPU-kärnor (6P, 8E) uppnår maximala klockfrekvenser på 4,7 GHz (P) och 3,5 GHz (E). Kontinuerlig flertrådsprestanda (CB15 Loop) fick turboklockan att sjunka från den första till den andra körningen. Efter detta förblev den stabil.
Benchmarkresultaten låg något över CPU-genomsnittet när datorn var ansluten till elnätet. I batteriläge sjönk den mer relevanta single-thread-prestandan (213 poäng) i mindre utsträckning än multi-thread-prestandan (1 012 poäng).
Cinebench R15 Multi continuous test
* ... mindre är bättre
AIDA64: FP32 Ray-Trace | FPU Julia | CPU SHA3 | CPU Queen | FPU SinJulia | FPU Mandel | CPU AES | CPU ZLib | FP64 Ray-Trace | CPU PhotoWorxx
| Performance rating | |
| Asus TUF A15 FA507 | |
| Genomsnitt av klass Multimedia | |
| Intel NUC X15 LAPAC71H | |
| Dell Inspiron 16 Plus 7630 | |
| Gigabyte G5 KE | |
| Asus VivoBook Pro 16 | |
| MSI Cyborg 15 A12VF | |
| Genomsnitt Intel Core i7-12700H | |
| AIDA64 / FP32 Ray-Trace | |
| Genomsnitt av klass Multimedia (2214 - 50388, n=53, senaste 2 åren) | |
| Asus TUF A15 FA507 | |
| Asus VivoBook Pro 16 | |
| Dell Inspiron 16 Plus 7630 | |
| Intel NUC X15 LAPAC71H | |
| MSI Cyborg 15 A12VF | |
| Gigabyte G5 KE | |
| Genomsnitt Intel Core i7-12700H (2585 - 17957, n=64) | |
| AIDA64 / FPU Julia | |
| Asus TUF A15 FA507 | |
| Genomsnitt av klass Multimedia (12867 - 201874, n=53, senaste 2 åren) | |
| Asus VivoBook Pro 16 | |
| MSI Cyborg 15 A12VF | |
| Dell Inspiron 16 Plus 7630 | |
| Gigabyte G5 KE | |
| Intel NUC X15 LAPAC71H | |
| Genomsnitt Intel Core i7-12700H (12439 - 90760, n=64) | |
| AIDA64 / CPU SHA3 | |
| Genomsnitt av klass Multimedia (626 - 8623, n=53, senaste 2 åren) | |
| Asus TUF A15 FA507 | |
| Asus VivoBook Pro 16 | |
| Gigabyte G5 KE | |
| Genomsnitt Intel Core i7-12700H (833 - 4242, n=64) | |
| Dell Inspiron 16 Plus 7630 | |
| Intel NUC X15 LAPAC71H | |
| MSI Cyborg 15 A12VF | |
| AIDA64 / CPU Queen | |
| Dell Inspiron 16 Plus 7630 | |
| Asus TUF A15 FA507 | |
| Asus VivoBook Pro 16 | |
| Intel NUC X15 LAPAC71H | |
| Genomsnitt Intel Core i7-12700H (57923 - 103202, n=63) | |
| MSI Cyborg 15 A12VF | |
| Gigabyte G5 KE | |
| Genomsnitt av klass Multimedia (13483 - 181505, n=40, senaste 2 åren) | |
| AIDA64 / FPU SinJulia | |
| Asus TUF A15 FA507 | |
| Genomsnitt Intel Core i7-12700H (3249 - 9939, n=64) | |
| Asus VivoBook Pro 16 | |
| Dell Inspiron 16 Plus 7630 | |
| Genomsnitt av klass Multimedia (886 - 28794, n=53, senaste 2 åren) | |
| MSI Cyborg 15 A12VF | |
| Intel NUC X15 LAPAC71H | |
| Gigabyte G5 KE | |
| AIDA64 / FPU Mandel | |
| Asus TUF A15 FA507 | |
| Genomsnitt av klass Multimedia (6395 - 105740, n=53, senaste 2 åren) | |
| Asus VivoBook Pro 16 | |
| Dell Inspiron 16 Plus 7630 | |
| Gigabyte G5 KE | |
| Intel NUC X15 LAPAC71H | |
| MSI Cyborg 15 A12VF | |
| Genomsnitt Intel Core i7-12700H (7135 - 44760, n=64) | |
| AIDA64 / CPU AES | |
| Intel NUC X15 LAPAC71H | |
| Gigabyte G5 KE | |
| Genomsnitt Intel Core i7-12700H (31839 - 144360, n=64) | |
| Asus TUF A15 FA507 | |
| Asus VivoBook Pro 16 | |
| MSI Cyborg 15 A12VF | |
| Genomsnitt av klass Multimedia (8171 - 126790, n=53, senaste 2 åren) | |
| Dell Inspiron 16 Plus 7630 | |
| AIDA64 / CPU ZLib | |
| Genomsnitt Intel Core i7-12700H (305 - 1171, n=64) | |
| Genomsnitt av klass Multimedia (143.8 - 2022, n=53, senaste 2 åren) | |
| Asus VivoBook Pro 16 | |
| Gigabyte G5 KE | |
| MSI Cyborg 15 A12VF | |
| Intel NUC X15 LAPAC71H | |
| Dell Inspiron 16 Plus 7630 | |
| Asus TUF A15 FA507 | |
| AIDA64 / FP64 Ray-Trace | |
| Genomsnitt av klass Multimedia (1014 - 26875, n=53, senaste 2 åren) | |
| Asus TUF A15 FA507 | |
| Asus VivoBook Pro 16 | |
| Dell Inspiron 16 Plus 7630 | |
| Gigabyte G5 KE | |
| Intel NUC X15 LAPAC71H | |
| MSI Cyborg 15 A12VF | |
| Genomsnitt Intel Core i7-12700H (1437 - 9692, n=64) | |
| AIDA64 / CPU PhotoWorxx | |
| Genomsnitt av klass Multimedia (8187 - 88154, n=53, senaste 2 åren) | |
| Intel NUC X15 LAPAC71H | |
| Dell Inspiron 16 Plus 7630 | |
| MSI Cyborg 15 A12VF | |
| Genomsnitt Intel Core i7-12700H (12863 - 52207, n=64) | |
| Gigabyte G5 KE | |
| Asus TUF A15 FA507 | |
| Asus VivoBook Pro 16 | |
Systemets prestanda
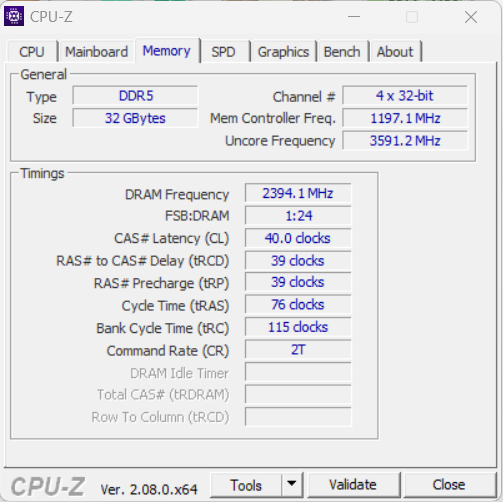
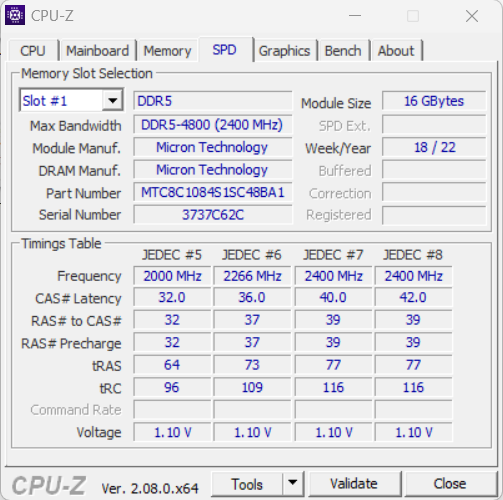
Det smidigt fungerande systemet saknar inte datorkraft. Den bärbara datorn hanterar spel, streaming och rendering utan problem. RAM-minnets överföringshastigheter ligger på en normal nivå för DDR5-4800 RAM-minne.
CrossMark: Overall | Productivity | Creativity | Responsiveness
| PCMark 10 / Score | |
| Genomsnitt av klass Multimedia (4325 - 10386, n=51, senaste 2 åren) | |
| Dell Inspiron 16 Plus 7630 | |
| Asus TUF A15 FA507 | |
| Gigabyte G5 KE | |
| MSI Cyborg 15 A12VF | |
| Intel NUC X15 LAPAC71H | |
| Genomsnitt Intel Core i7-12700H, Intel Arc A730M (6830 - 6845, n=2) | |
| Asus VivoBook Pro 16 | |
| PCMark 10 / Essentials | |
| Dell Inspiron 16 Plus 7630 | |
| Gigabyte G5 KE | |
| Genomsnitt Intel Core i7-12700H, Intel Arc A730M (10529 - 11116, n=2) | |
| MSI Cyborg 15 A12VF | |
| Asus TUF A15 FA507 | |
| Intel NUC X15 LAPAC71H | |
| Genomsnitt av klass Multimedia (8025 - 11664, n=50, senaste 2 åren) | |
| Asus VivoBook Pro 16 | |
| PCMark 10 / Productivity | |
| Genomsnitt av klass Multimedia (7323 - 18233, n=50, senaste 2 åren) | |
| MSI Cyborg 15 A12VF | |
| Gigabyte G5 KE | |
| Dell Inspiron 16 Plus 7630 | |
| Asus TUF A15 FA507 | |
| Asus VivoBook Pro 16 | |
| Genomsnitt Intel Core i7-12700H, Intel Arc A730M (7070 - 7260, n=2) | |
| Intel NUC X15 LAPAC71H | |
| PCMark 10 / Digital Content Creation | |
| Intel NUC X15 LAPAC71H | |
| Dell Inspiron 16 Plus 7630 | |
| Genomsnitt Intel Core i7-12700H, Intel Arc A730M (10714 - 11691, n=2) | |
| Genomsnitt av klass Multimedia (3651 - 16240, n=50, senaste 2 åren) | |
| Asus TUF A15 FA507 | |
| Gigabyte G5 KE | |
| Asus VivoBook Pro 16 | |
| MSI Cyborg 15 A12VF | |
| CrossMark / Overall | |
| Intel NUC X15 LAPAC71H | |
| Genomsnitt Intel Core i7-12700H, Intel Arc A730M (n=1) | |
| Genomsnitt av klass Multimedia (866 - 2728, n=59, senaste 2 åren) | |
| Dell Inspiron 16 Plus 7630 | |
| MSI Cyborg 15 A12VF | |
| Gigabyte G5 KE | |
| Asus VivoBook Pro 16 | |
| Asus TUF A15 FA507 | |
| CrossMark / Productivity | |
| Intel NUC X15 LAPAC71H | |
| Genomsnitt Intel Core i7-12700H, Intel Arc A730M (n=1) | |
| Genomsnitt av klass Multimedia (931 - 2489, n=59, senaste 2 åren) | |
| Dell Inspiron 16 Plus 7630 | |
| Gigabyte G5 KE | |
| MSI Cyborg 15 A12VF | |
| Asus VivoBook Pro 16 | |
| Asus TUF A15 FA507 | |
| CrossMark / Creativity | |
| Genomsnitt av klass Multimedia (907 - 3465, n=59, senaste 2 åren) | |
| Dell Inspiron 16 Plus 7630 | |
| Intel NUC X15 LAPAC71H | |
| Genomsnitt Intel Core i7-12700H, Intel Arc A730M (n=1) | |
| MSI Cyborg 15 A12VF | |
| Gigabyte G5 KE | |
| Asus TUF A15 FA507 | |
| Asus VivoBook Pro 16 | |
| CrossMark / Responsiveness | |
| Intel NUC X15 LAPAC71H | |
| Genomsnitt Intel Core i7-12700H, Intel Arc A730M (n=1) | |
| Gigabyte G5 KE | |
| Asus VivoBook Pro 16 | |
| MSI Cyborg 15 A12VF | |
| Dell Inspiron 16 Plus 7630 | |
| Genomsnitt av klass Multimedia (605 - 2024, n=59, senaste 2 åren) | |
| Asus TUF A15 FA507 | |
| PCMark 10 Score | 6845 poäng | |
Hjälp | ||
| AIDA64 / Memory Copy | |
| Genomsnitt av klass Multimedia (11299 - 132135, n=53, senaste 2 åren) | |
| Intel NUC X15 LAPAC71H | |
| Dell Inspiron 16 Plus 7630 | |
| MSI Cyborg 15 A12VF | |
| Genomsnitt Intel Core i7-12700H (25615 - 80511, n=64) | |
| Asus TUF A15 FA507 | |
| Gigabyte G5 KE | |
| Asus VivoBook Pro 16 | |
| AIDA64 / Memory Read | |
| Genomsnitt av klass Multimedia (11624 - 174586, n=53, senaste 2 åren) | |
| Dell Inspiron 16 Plus 7630 | |
| Intel NUC X15 LAPAC71H | |
| MSI Cyborg 15 A12VF | |
| Genomsnitt Intel Core i7-12700H (25586 - 79442, n=64) | |
| Asus TUF A15 FA507 | |
| Gigabyte G5 KE | |
| Asus VivoBook Pro 16 | |
| AIDA64 / Memory Write | |
| Genomsnitt av klass Multimedia (11755 - 134998, n=53, senaste 2 åren) | |
| Intel NUC X15 LAPAC71H | |
| Dell Inspiron 16 Plus 7630 | |
| MSI Cyborg 15 A12VF | |
| Asus TUF A15 FA507 | |
| Genomsnitt Intel Core i7-12700H (23679 - 88660, n=64) | |
| Gigabyte G5 KE | |
| Asus VivoBook Pro 16 | |
| AIDA64 / Memory Latency | |
| Genomsnitt av klass Multimedia (7 - 535, n=52, senaste 2 åren) | |
| Gigabyte G5 KE | |
| Dell Inspiron 16 Plus 7630 | |
| Asus VivoBook Pro 16 | |
| MSI Cyborg 15 A12VF | |
| Intel NUC X15 LAPAC71H | |
| Asus TUF A15 FA507 | |
| Genomsnitt Intel Core i7-12700H (76.2 - 133.9, n=62) | |
* ... mindre är bättre
DPC-fördröjning
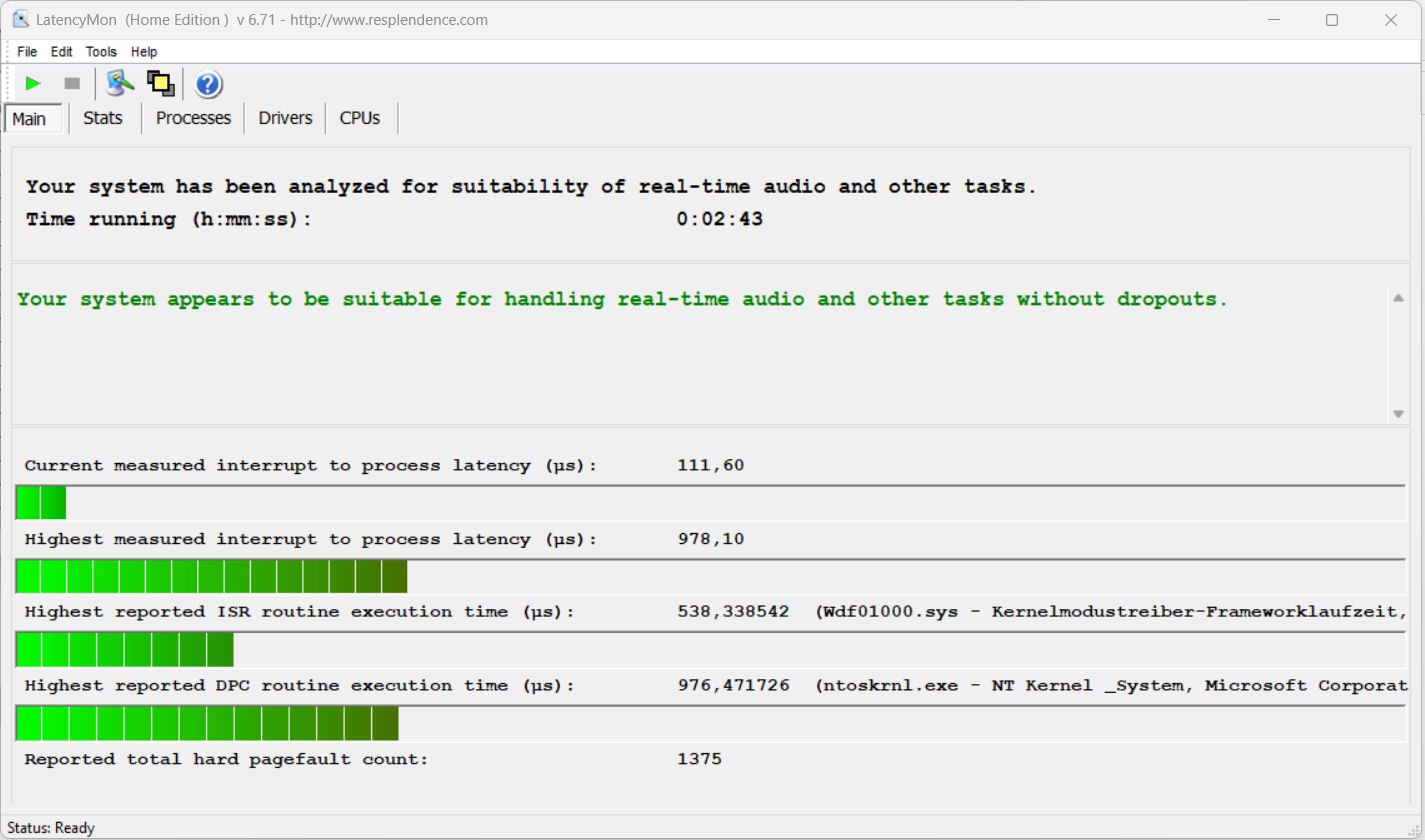
Det standardiserade latency monitor-testet (webbsurfning, uppspelning av 4k-video, Prime95 high-load) visade inte på några avvikelser. Systemet verkar vara lämpligt för video- och ljudredigering i realtid. Framtida programuppdateringar kan leda till förbättringar eller till och med försämringar.
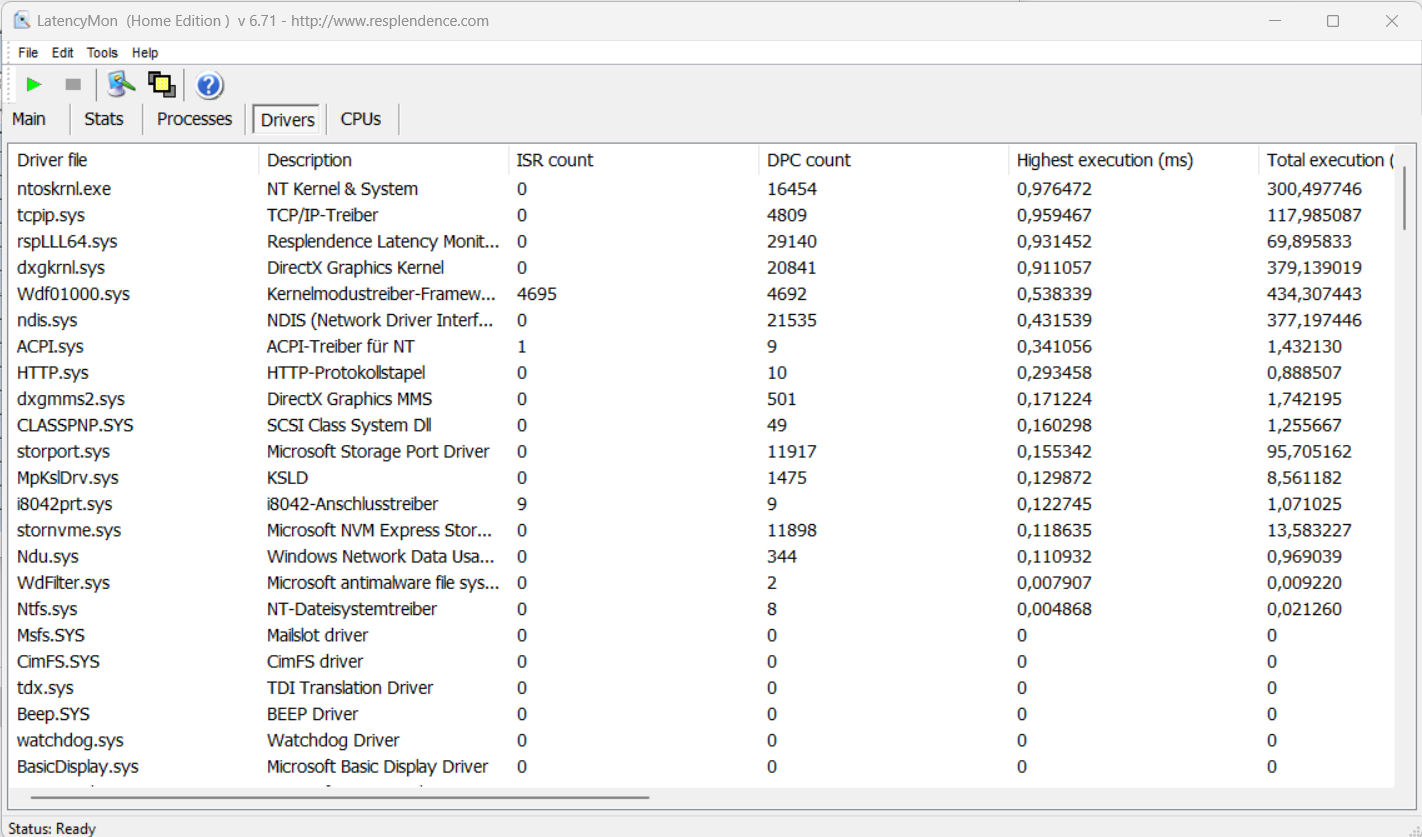
| DPC Latencies / LatencyMon - interrupt to process latency (max), Web, Youtube, Prime95 | |
| Asus VivoBook Pro 16 | |
| MSI Cyborg 15 A12VF | |
| Dell Inspiron 16 Plus 7630 | |
| Gigabyte G5 KE | |
| Intel NUC X15 LAPAC71H | |
* ... mindre är bättre
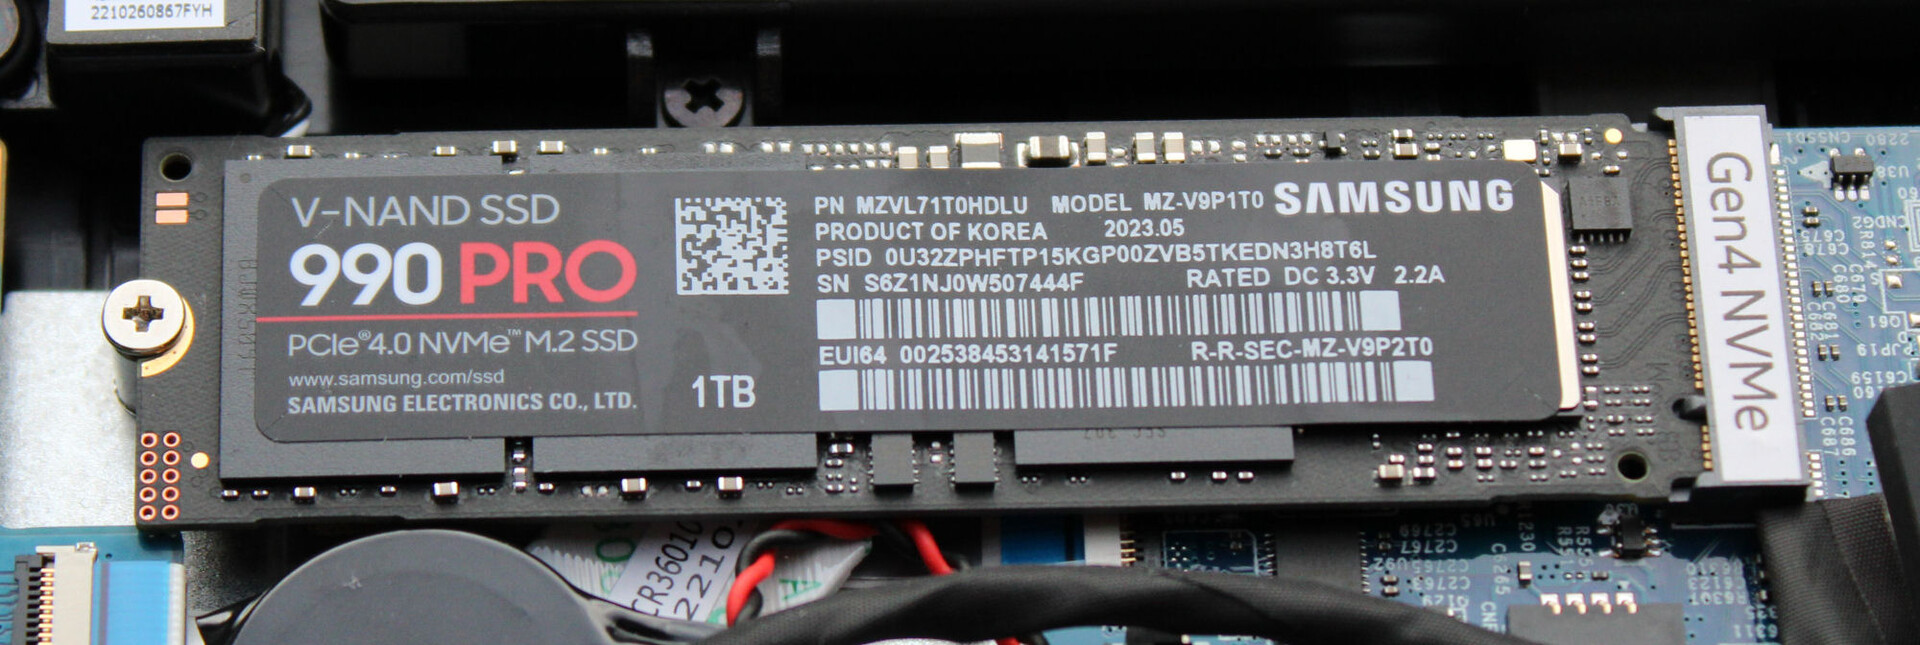
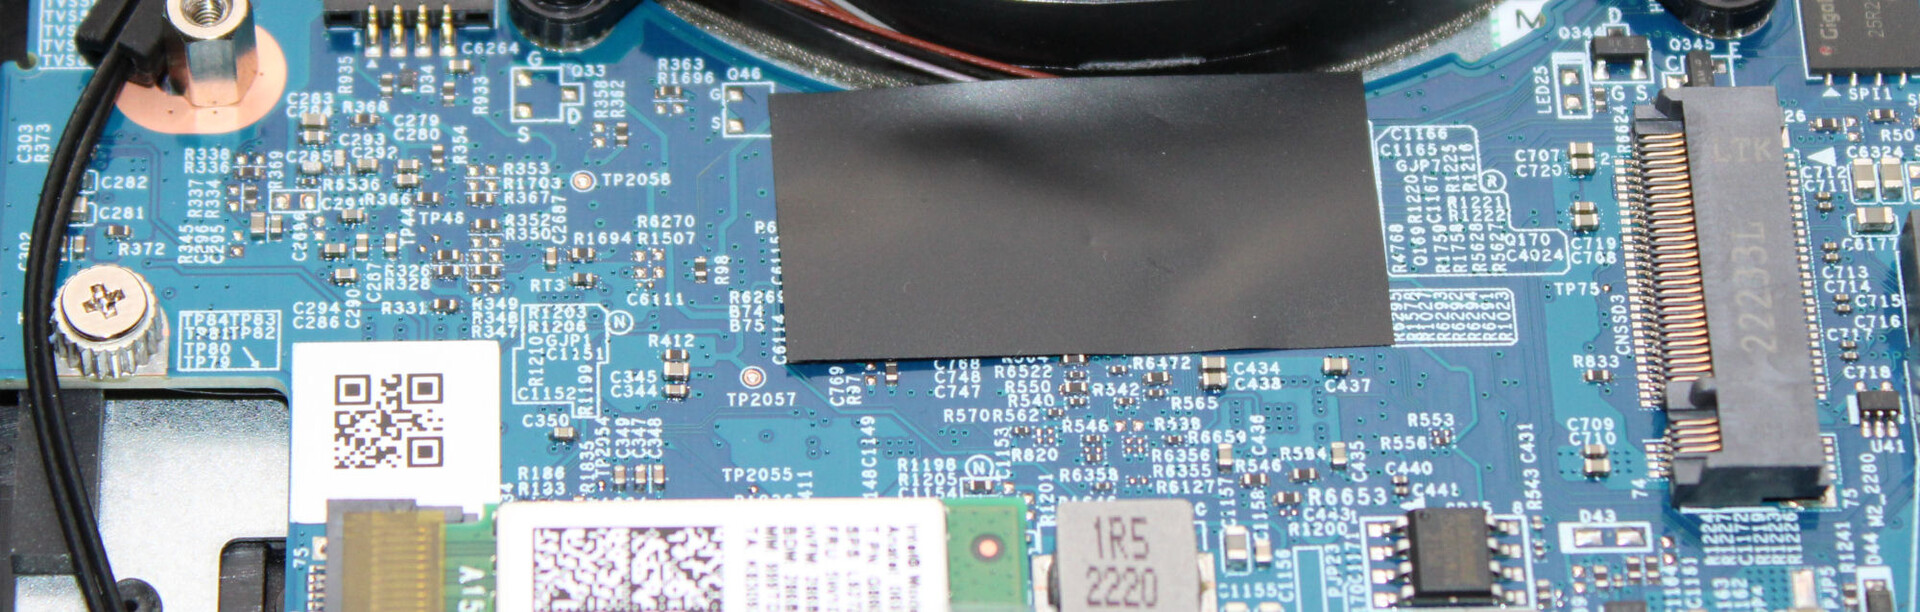
Lagringsenheter
Den bärbara datorn har plats för två M.2-2280 SSD-enheter (1x PCIe 4.0, 1x PCIe 3.0/SATA). RAID-0/1 stöds. Samsung SSD (1 TB, PCIe 4, M.2-2280) i vår testenhet levererade utmärkta överföringshastigheter. Positivt: Termisk strypning förekom inte.

* ... mindre är bättre
Reading continuous performance: DiskSpd Read Loop, Queue Depth 8
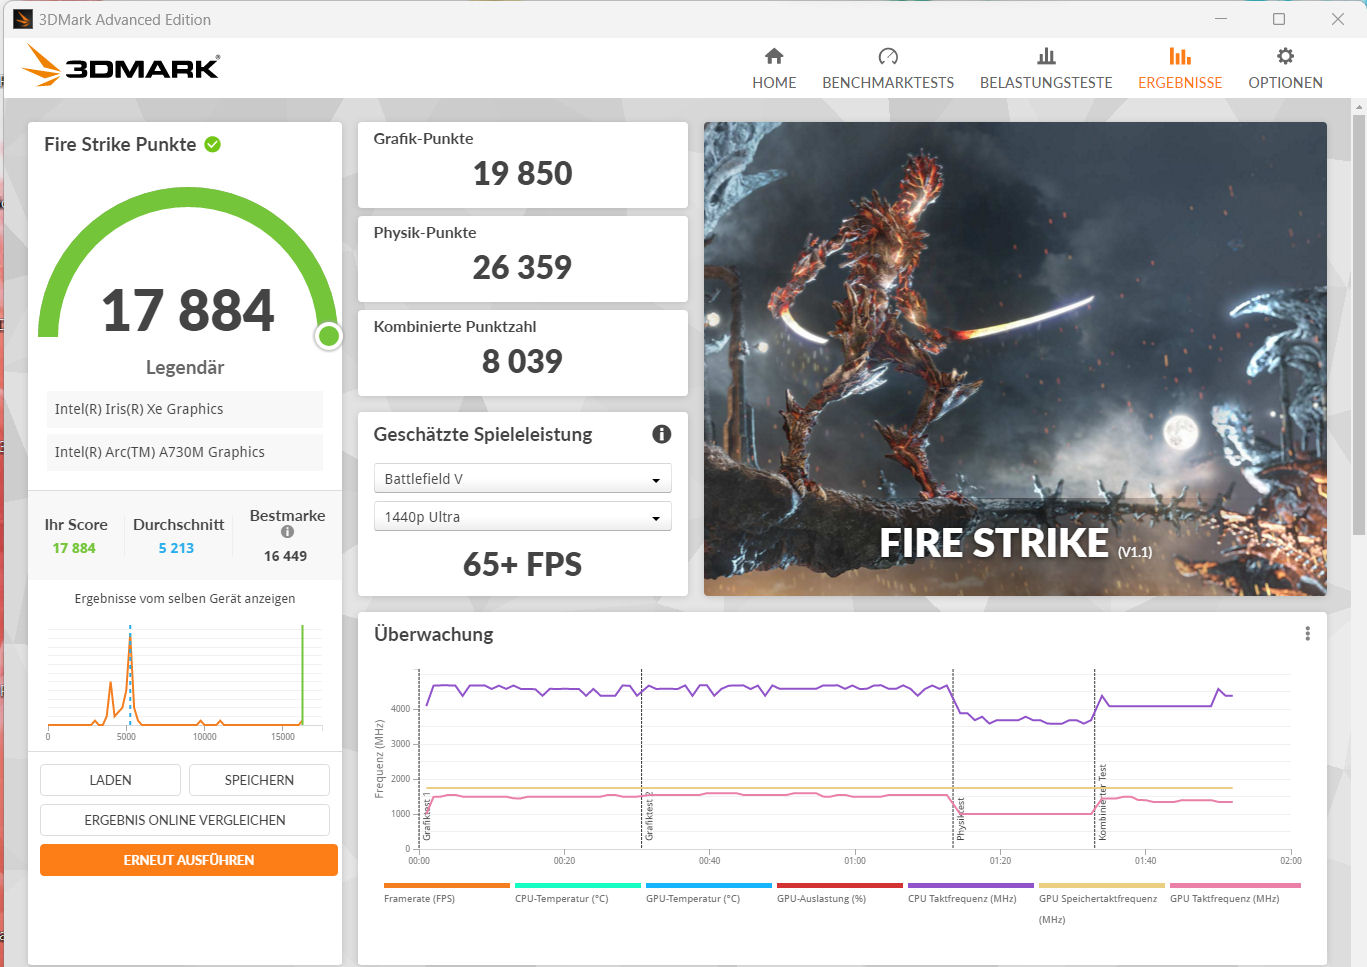
Grafikkort
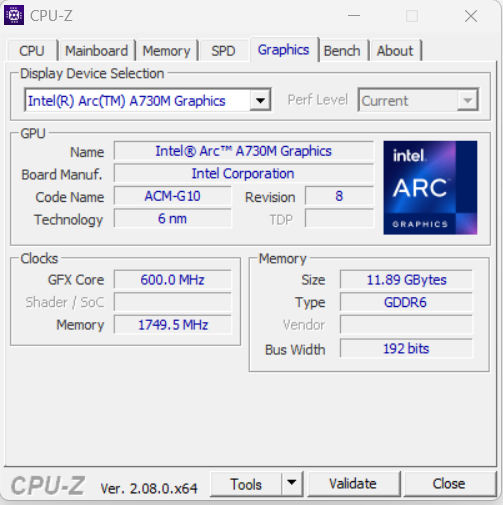
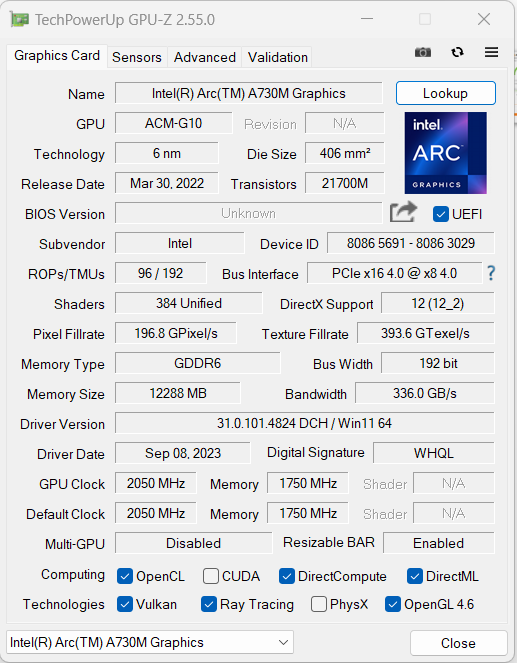
Arc A730MArc A730M- Intels näst mest kraftfulla mobila DGPU - har en maximal TGP på 85 watt, använder supersnabbt GDDR6-minne (12 288 GB) och kan uppnå en maximal klockfrekvens på 2,05 GHz. Grafikkärnan är lämplig för FHD-spel i medelhöga till höga inställningar. Mindre krävande spel tillåter mer.
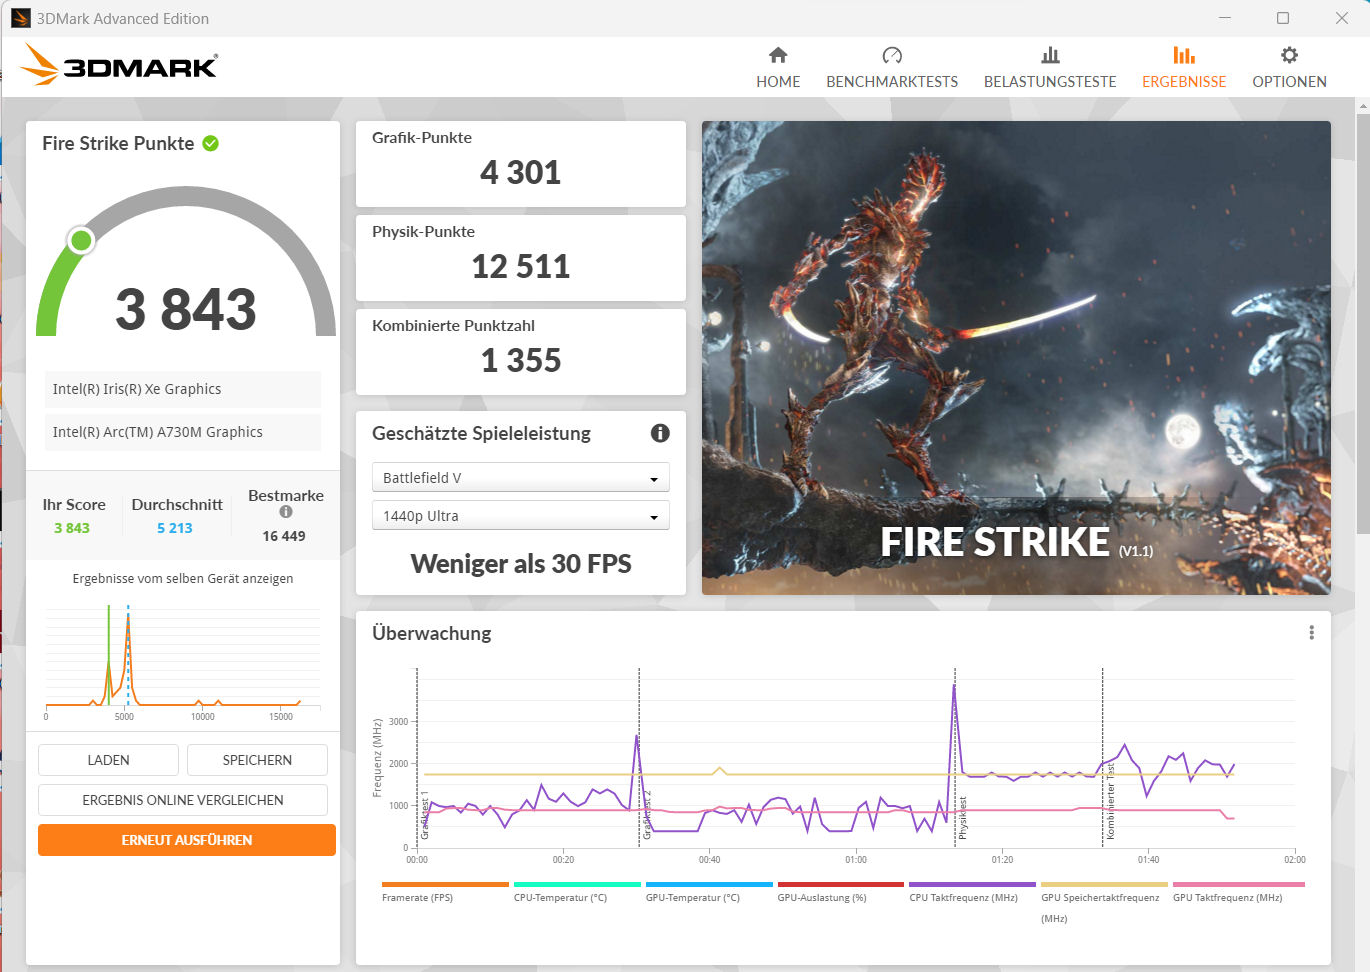
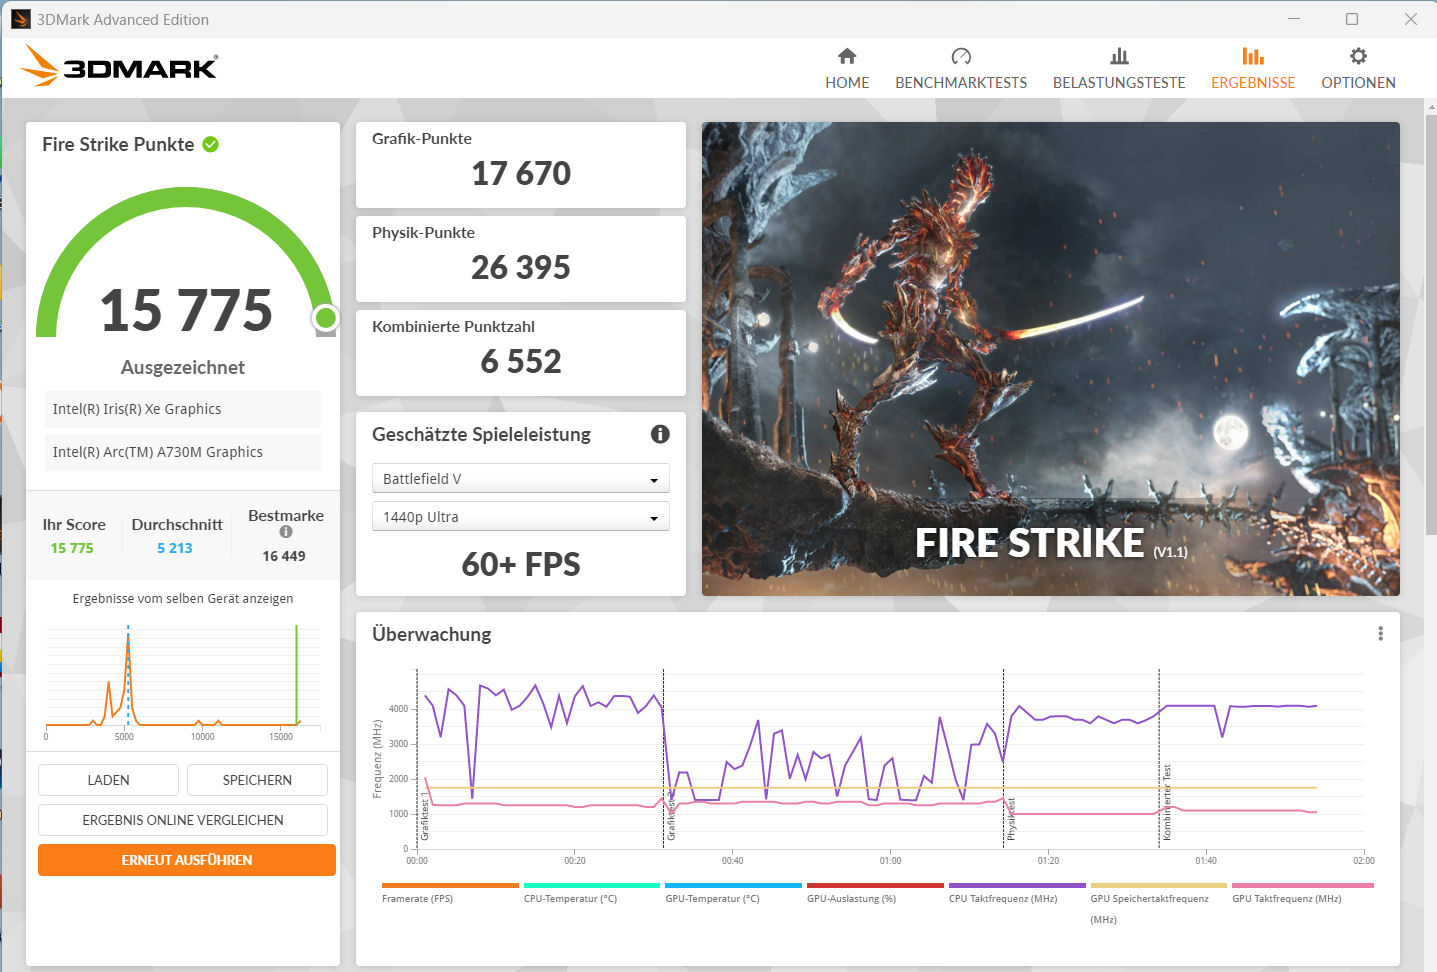
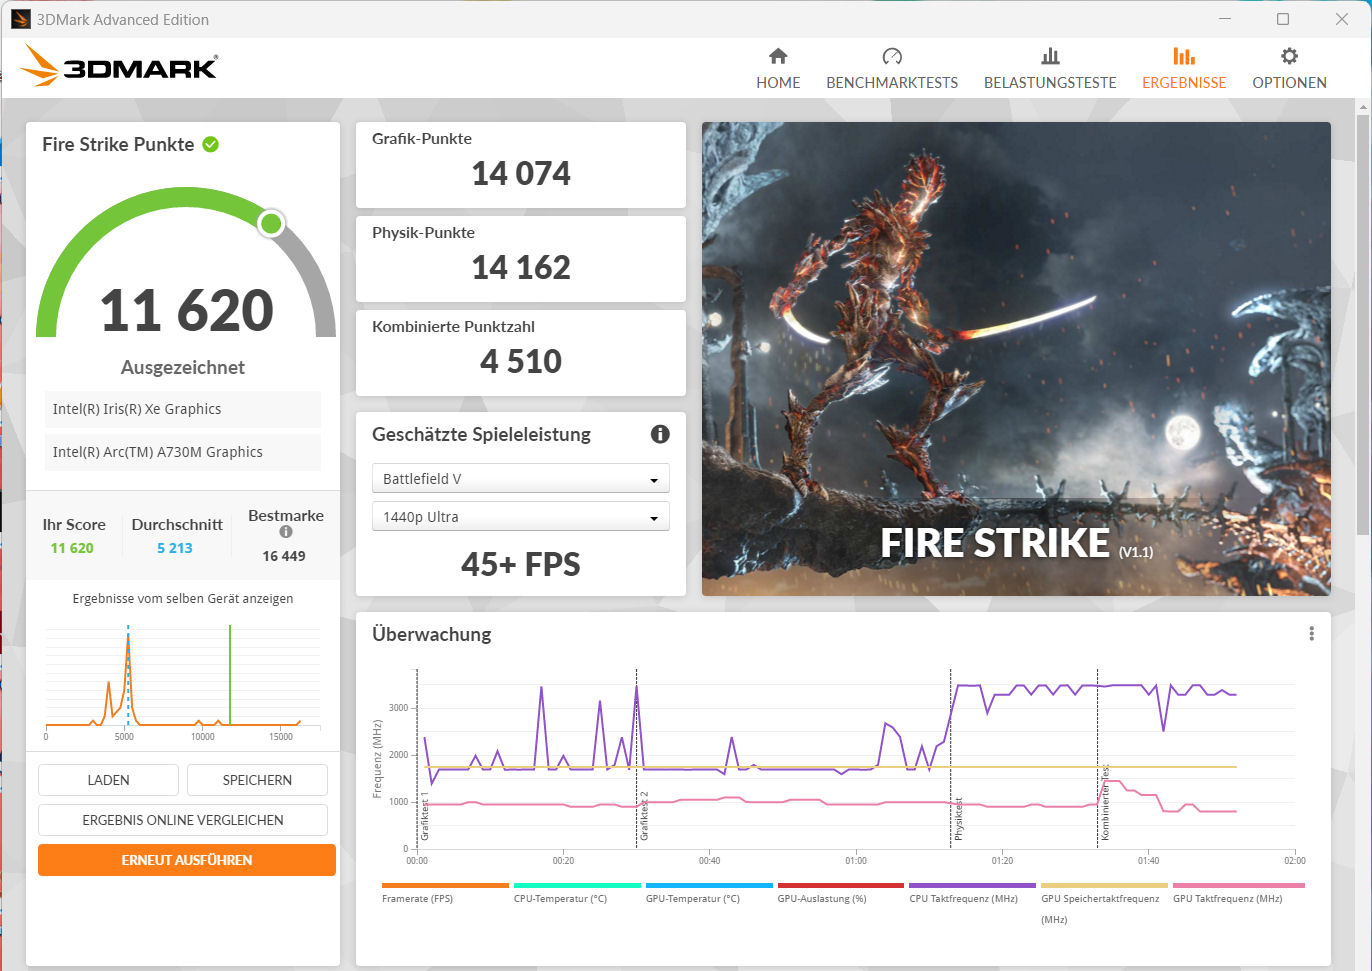
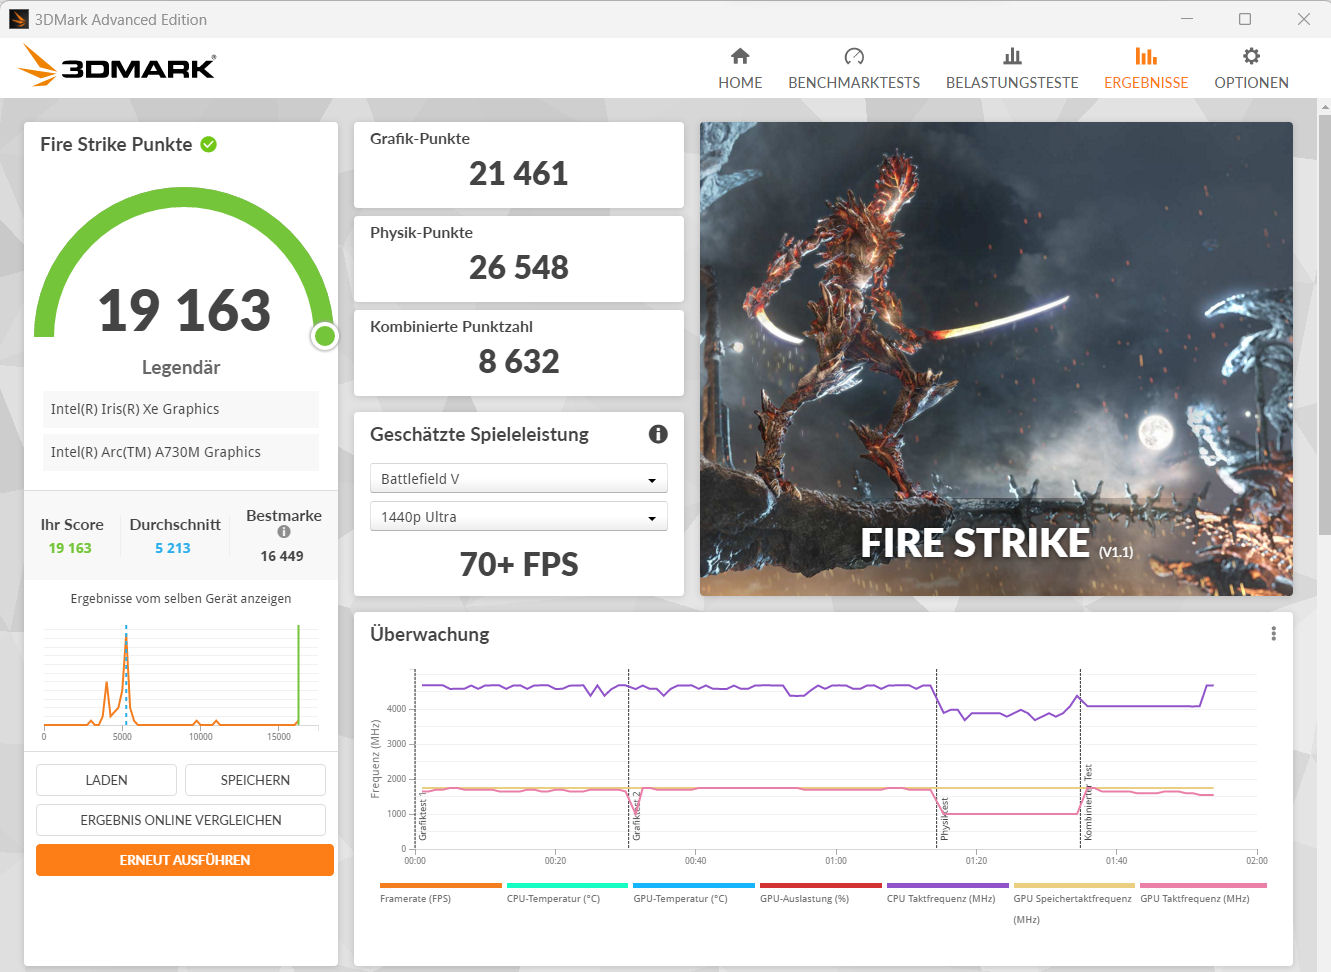
GPU-prestandan beror i hög grad på vilket prestandaläge som används: Profilen "Prestanda" resulterade i benchmark-resultat under (syntetiska benchmarks) eller i nivå (spelpraxis) med det tidigare fastställda GPU-genomsnittet. Den maximala prestandan uppnåddes när "Benchmark Mode" var aktivt (TGP: 85 watt). Allt som allt rankades GPU:n mellanGeForce RTX 3050 ochRTX 3060 när det gäller prestanda.
| 3DMark Performance rating - Percent | |
| Asus TUF A15 FA507 -1! | |
| Gigabyte G5 KE | |
| MSI Cyborg 15 A12VF | |
| Dell Inspiron 16 Plus 7630 -1! | |
| Genomsnitt Intel Arc A730M | |
| Intel NUC X15 LAPAC71H | |
| Genomsnitt av klass Multimedia | |
| Asus VivoBook Pro 16 | |
| 3DMark 11 Performance | 23160 poäng | |
| 3DMark Cloud Gate Standard Score | 46415 poäng | |
| 3DMark Fire Strike Score | 17884 poäng | |
| 3DMark Time Spy Score | 7653 poäng | |
Hjälp | ||
* ... mindre är bättre
| The Witcher 3 - 1920x1080 Ultra Graphics & Postprocessing (HBAO+) | |
| Dell Inspiron 16 Plus 7630 | |
| Gigabyte G5 KE | |
| Asus TUF A15 FA507 | |
| MSI Cyborg 15 A12VF | |
| Asus VivoBook Pro 16 | |
| Genomsnitt av klass Multimedia (11 - 107, n=5, senaste 2 åren) | |
| Genomsnitt Intel Arc A730M (39.8 - 49.4, n=2) | |
| Intel NUC X15 LAPAC71H | |
| GTA V - 1920x1080 Highest AA:4xMSAA + FX AF:16x | |
| Gigabyte G5 KE | |
| MSI Cyborg 15 A12VF | |
| Asus TUF A15 FA507 | |
| Genomsnitt av klass Multimedia (7.92 - 141.6, n=53, senaste 2 åren) | |
| Asus VivoBook Pro 16 | |
| Genomsnitt Intel Arc A730M (40.1 - 43.1, n=3) | |
| Intel NUC X15 LAPAC71H | |
| Final Fantasy XV Benchmark - 1920x1080 High Quality | |
| Gigabyte G5 KE | |
| Dell Inspiron 16 Plus 7630 | |
| Asus TUF A15 FA507 | |
| MSI Cyborg 15 A12VF | |
| Genomsnitt av klass Multimedia (7.61 - 144.4, n=56, senaste 2 åren) | |
| Asus VivoBook Pro 16 | |
| Genomsnitt Intel Arc A730M (41.1 - 49.7, n=3) | |
| Intel NUC X15 LAPAC71H | |
| Dota 2 Reborn - 1920x1080 ultra (3/3) best looking | |
| Dell Inspiron 16 Plus 7630 | |
| Gigabyte G5 KE | |
| MSI Cyborg 15 A12VF | |
| Asus TUF A15 FA507 | |
| Asus VivoBook Pro 16 | |
| Genomsnitt av klass Multimedia (29 - 179.9, n=57, senaste 2 åren) | |
| Intel NUC X15 LAPAC71H | |
| Genomsnitt Intel Arc A730M (80.4 - 91.9, n=3) | |
Witcher 3 FPS diagram
| låg | med. | hög | ultra | |
|---|---|---|---|---|
| GTA V (2015) | 177.4 | 170.6 | 94.3 | 40.1 |
| The Witcher 3 (2015) | 267.3 | 190.3 | 106.9 | 39.8 |
| Dota 2 Reborn (2015) | 102.2 | 101.6 | 96.8 | 91.9 |
| Final Fantasy XV Benchmark (2018) | 98.5 | 67.9 | 41.1 | |
| X-Plane 11.11 (2018) | 70.7 | 55.8 | 47.6 | |
| Strange Brigade (2018) | 377 | 167.8 | 140 | 116.6 |
| Control (2019) | 145.7 | 66 | 51.1 | |
| Flight Simulator 2020 (2020) | 69.3 | 44.2 | 33.7 | 25.7 |
| Cyberpunk 2077 1.6 (2022) | 70.5 | 57.5 | 50.4 | 47 |
| Uncharted Legacy of Thieves Collection (2022) | 31.3 | 35.3 | 27.6 | 26.7 |
| Call of Duty Modern Warfare 2 2022 (2022) | 77 | 65 | 56 | 55 |
| Spider-Man Miles Morales (2022) | 60.5 | 58 | 53.4 | 51.4 |
| The Callisto Protocol (2022) | 80.2 | 72.6 | 67.9 | 47.5 |
| Need for Speed Unbound (2022) | 59.8 | 52.5 | 44.7 | 37.9 |
| High On Life (2023) | 147.9 | 110.1 | 80.9 | 64.7 |
| The Witcher 3 v4 (2023) | 126.2 | 102.8 | 51.2 | 44.4 |
| Dead Space Remake (2023) | 48.2 | 46.7 | 42.2 | 41.3 |
| Hogwarts Legacy (2023) | 69.6 | 48.6 | 43.7 | 34.3 |
| Returnal (2023) | 55 | 53 | 49 | 41 |
| Atomic Heart (2023) | 100.1 | 73.3 | 51.1 | 37.5 |
| Company of Heroes 3 (2023) | 111.3 | 90.6 | 74 | 72.8 |
| Sons of the Forest (2023) | 53.1 | 35.2 | 34.9 | 34.2 |
| Resident Evil 4 Remake (2023) | 86.4 | 64.9 | 60 | 41.3 |
| The Last of Us (2023) | 34.3 | 32.2 | 31.3 | 28.7 |
| Star Wars Jedi Survivor (2023) | 44 | 39.4 | 36.7 | 34.7 |
| Diablo 4 (2023) | 129.7 | 115.6 | 104.5 | 87.8 |
| F1 23 (2023) | 164.9 | 150.3 | 109.6 | 33.1 |
| Ratchet & Clank Rift Apart (2023) | 55.4 | 50.7 | 42.5 | 42.1 |
| Atlas Fallen (2023) | 78 | 74.1 | 70.4 | 59.2 |
| Starfield (2023) | 34 | 30.1 | 24.8 | 22 |
| The Crew Motorfest (2023) | 60 | 57 | 50 | 46 |
| Lies of P (2023) | 97 | 85.8 | 75.1 | 67 |
| Baldur's Gate 3 (2023) | 74.6 | 63 | 55.1 | 52.8 |
| Cyberpunk 2077 (2023) | 71.6 | 57 | 50 | 47.7 |
| EA Sports FC 24 (2023) | 121.8 | |||
| Assassin's Creed Mirage (2023) | 60 | 55 | 55 | 44 |
| Total War Pharaoh (2023) | 207.4 | 121.7 | 74.9 | 60.9 |
| Lords of the Fallen (2023) | 45.1 | 40.1 | 36.8 | 35.4 |
Utsläpp och effekt - NUC X15 levererar magra drifttider
Utsläpp av buller
Vid spel ökar den bärbara datorns bulleremissioner till 51 dB(A) ("Prestanda"). "Benchmark Mode" leder till ännu högre utsläpp, eftersom fläktarna ständigt går på full hastighet. I viloläge och vid daglig användning (kontor, internet) är NUC mycket tystare. Men det är sant: En av de två fläktarna körs konsekvent på låg hastighet. Genom att aktivera inställningen "Passive Cooling Mode" i NUC Software Studio kan detta förhindras.
Ljudnivå
| Låg belastning |
| 23 / 24 / 24 dB(A) |
| Hög belastning |
| 50.61 / 50.89 dB(A) |
 | ||
30 dB tyst 40 dB(A) hörbar 50 dB(A) högt ljud |
||
min: | ||
| Intel NUC X15 LAPAC71H A730M, i7-12700H, Samsung 990 Pro 1 TB | Asus TUF A15 FA507 GeForce RTX 4050 Laptop GPU, R7 7735HS, Micron 2400 MTFDKBA512QFM | Gigabyte G5 KE GeForce RTX 3060 Laptop GPU, i5-12500H, Gigabyte AG4512G-SI B10 | Dell Inspiron 16 Plus 7630 GeForce RTX 4060 Laptop GPU, i7-13700H, WD PC SN740 SDDPTQD-1T00 | Asus VivoBook Pro 16 GeForce RTX 3050 Ti Laptop GPU, i7-12700H, Intel SSD 670p SSDPEKNU010TZ | MSI Cyborg 15 A12VF GeForce RTX 4060 Laptop GPU, i7-12650H, Samsung PM9B1 1024GB MZVL41T0HBLB | |
|---|---|---|---|---|---|---|
| Noise | 11% | -15% | 4% | -10% | -28% | |
| av / miljö * (dB) | 23 | 23.3 -1% | 19.52 15% | 23.2 -1% | 25.2 -10% | 27 -17% |
| Idle Minimum * (dB) | 23 | 23.3 -1% | 31.05 -35% | 23.2 -1% | 25.2 -10% | 27 -17% |
| Idle Average * (dB) | 24 | 23.3 3% | 31.05 -29% | 23.2 3% | 25.2 -5% | 37.5 -56% |
| Idle Maximum * (dB) | 24 | 23.3 3% | 31.05 -29% | 23.2 3% | 25.2 -5% | 38 -58% |
| Load Average * (dB) | 50.61 | 29.6 42% | 55.66 -10% | 35.1 31% | 55.1 -9% | 56.3 -11% |
| Witcher 3 ultra * (dB) | 50.65 | 43 15% | 55.7 -10% | 52.5 -4% | ||
| Load Maximum * (dB) | 50.89 | 43 16% | 55.51 -9% | 52.5 -3% | 61.5 -21% | 56.3 -11% |
* ... mindre är bättre
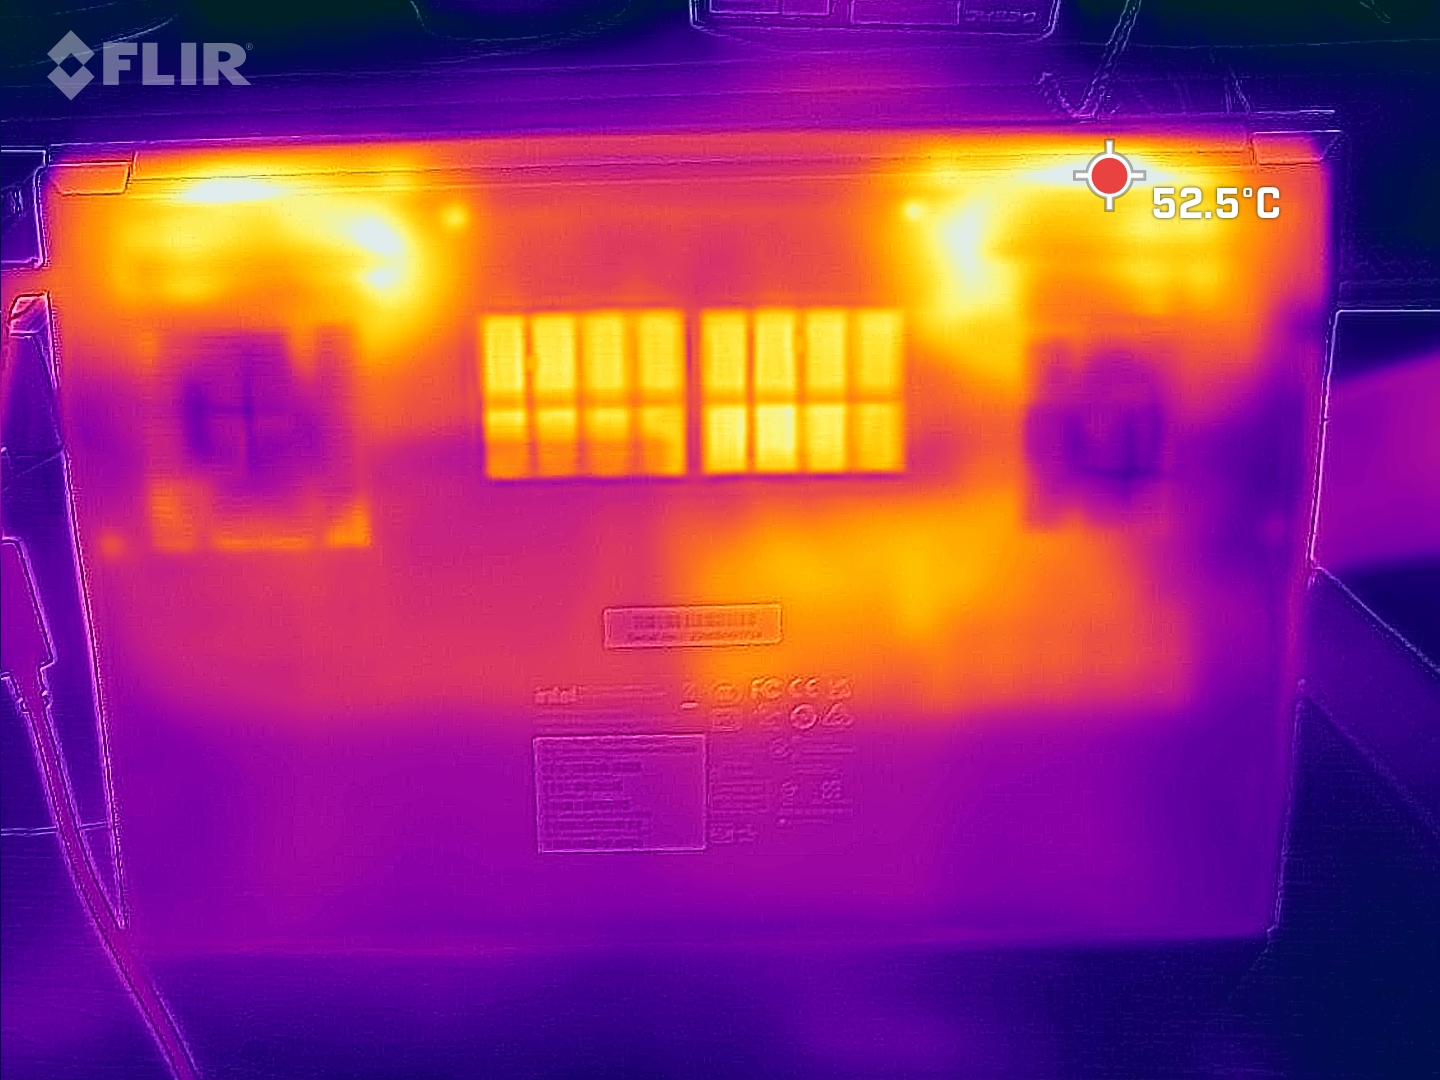
Temperatur
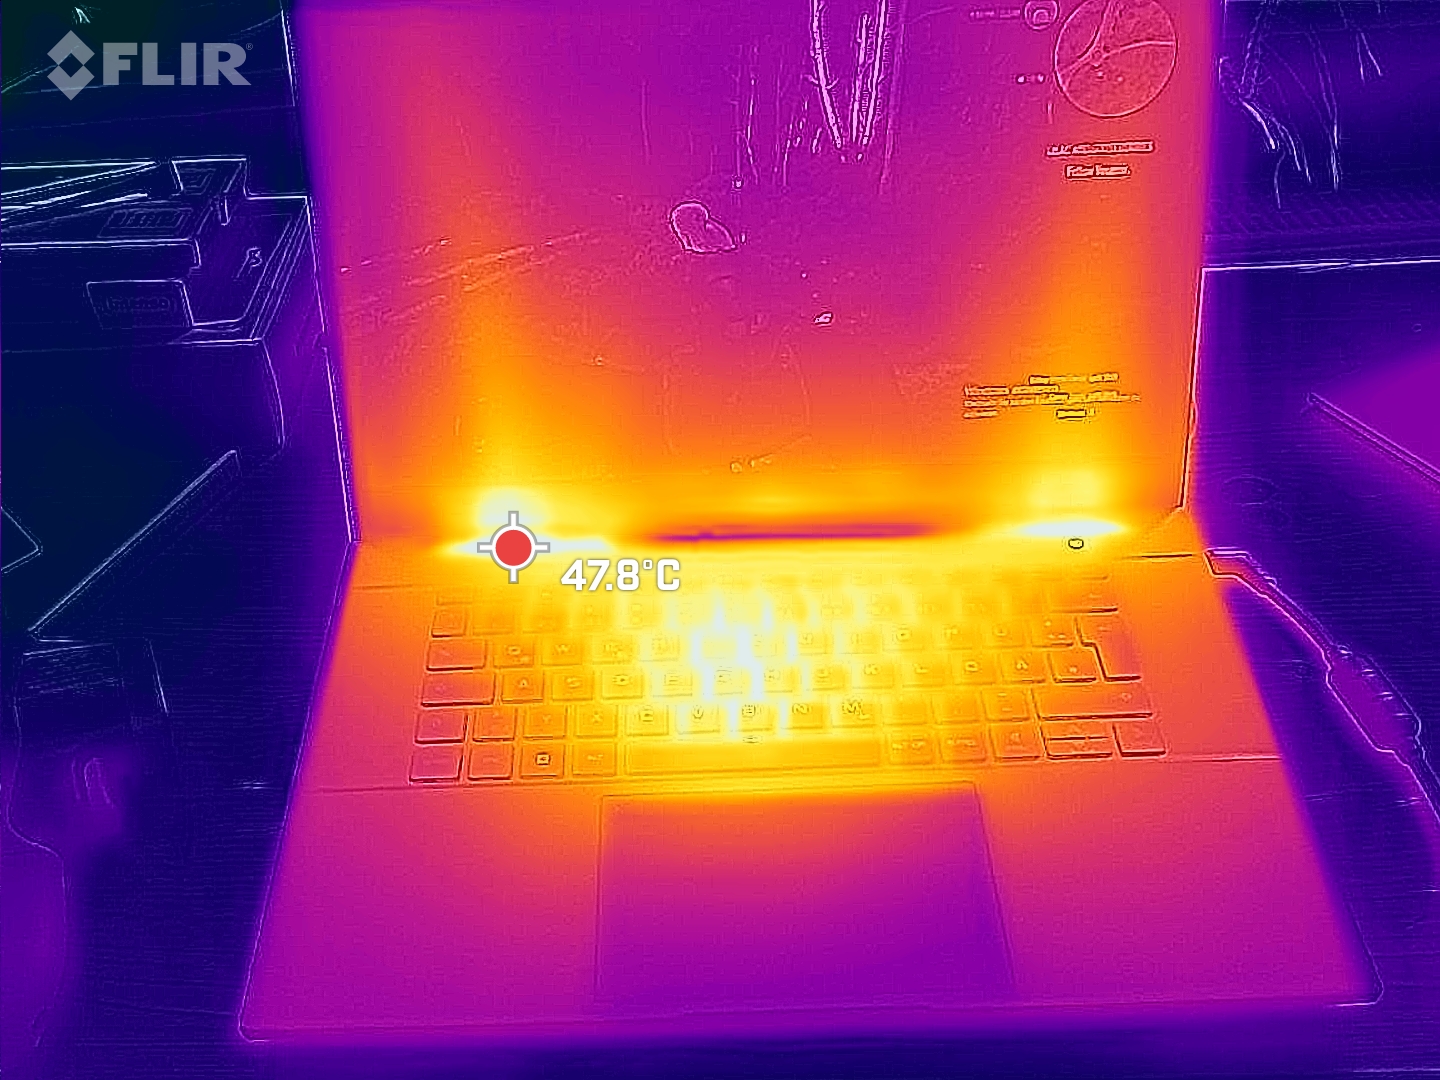
Höga belastningar (stresstest, Witcher 3 test) gör att den bärbara datorn värms upp avsevärt i vissa områden. På det hela taget nådde värdena aldrig kritiska nivåer. Vid daglig användning (kontor, internet) håller sig temperaturen inom det gröna området.
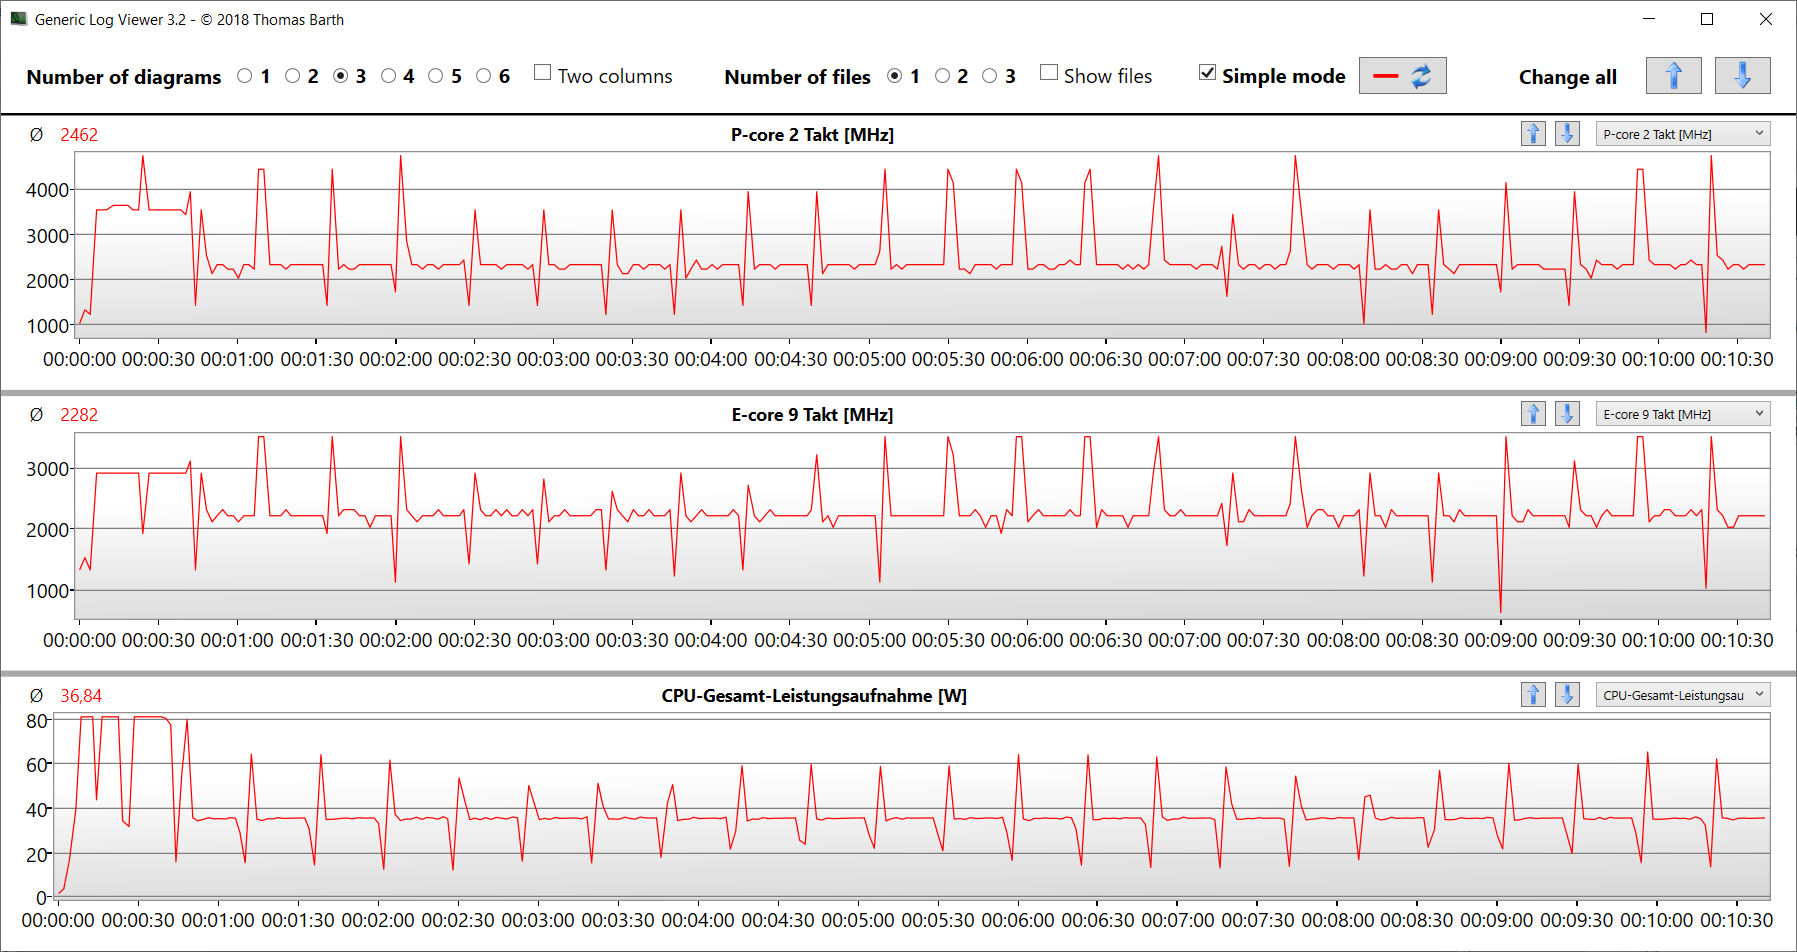
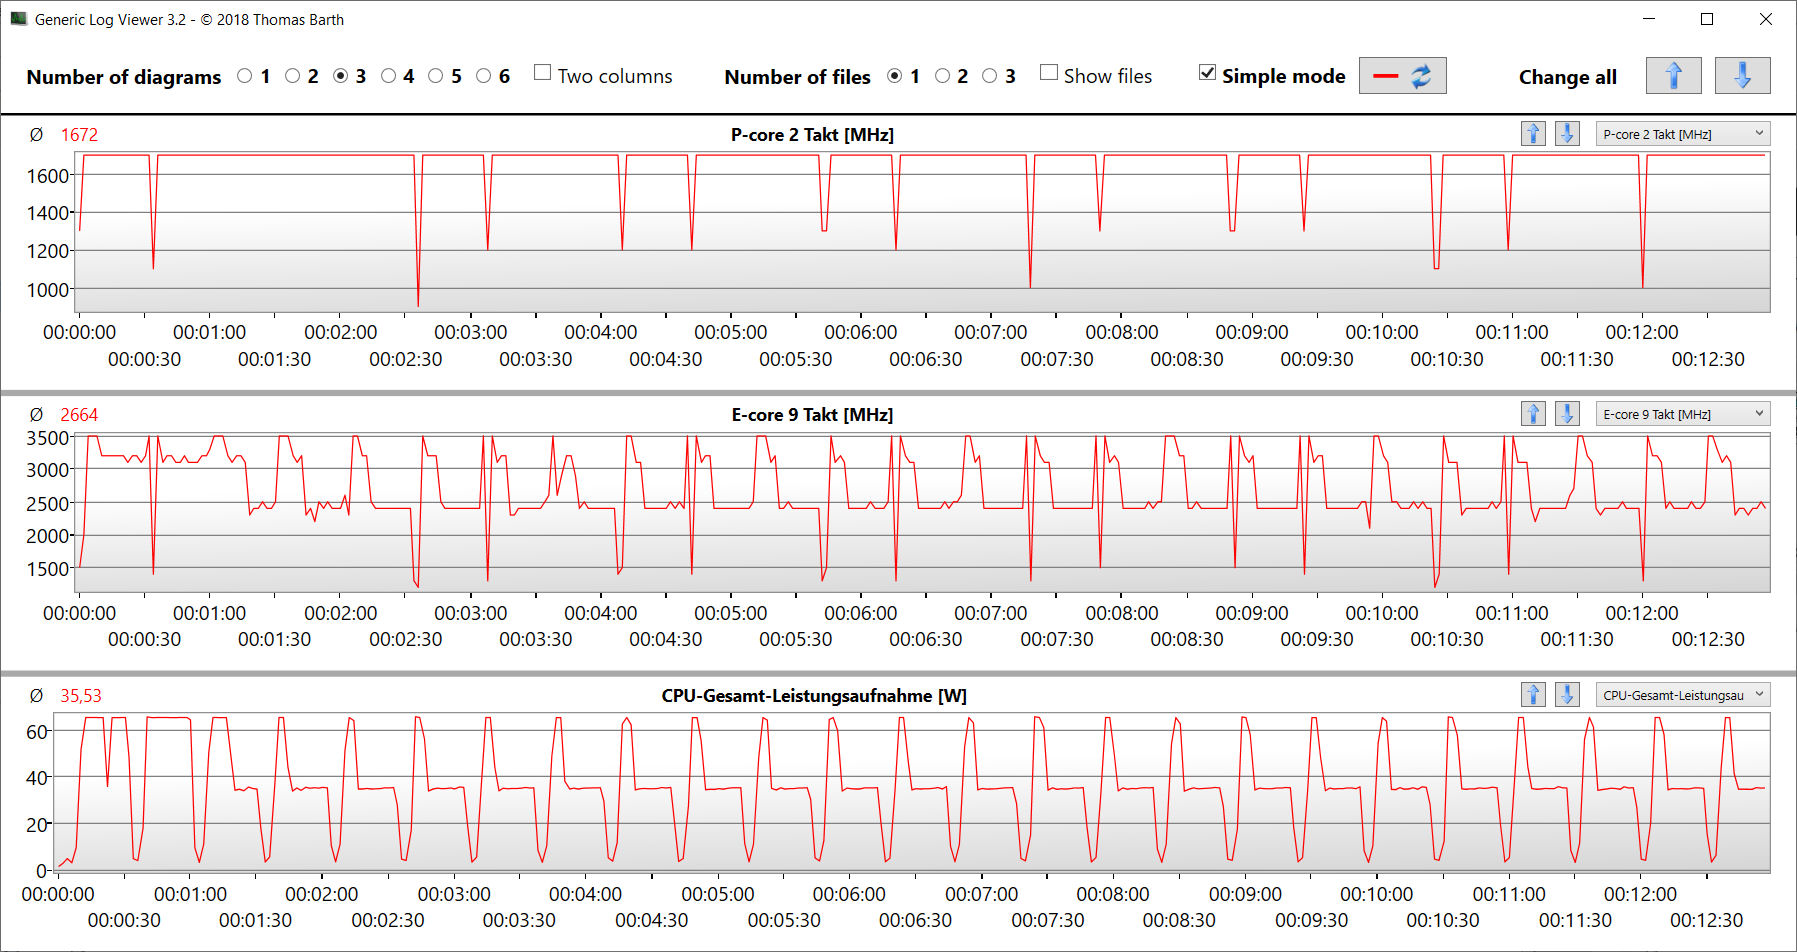
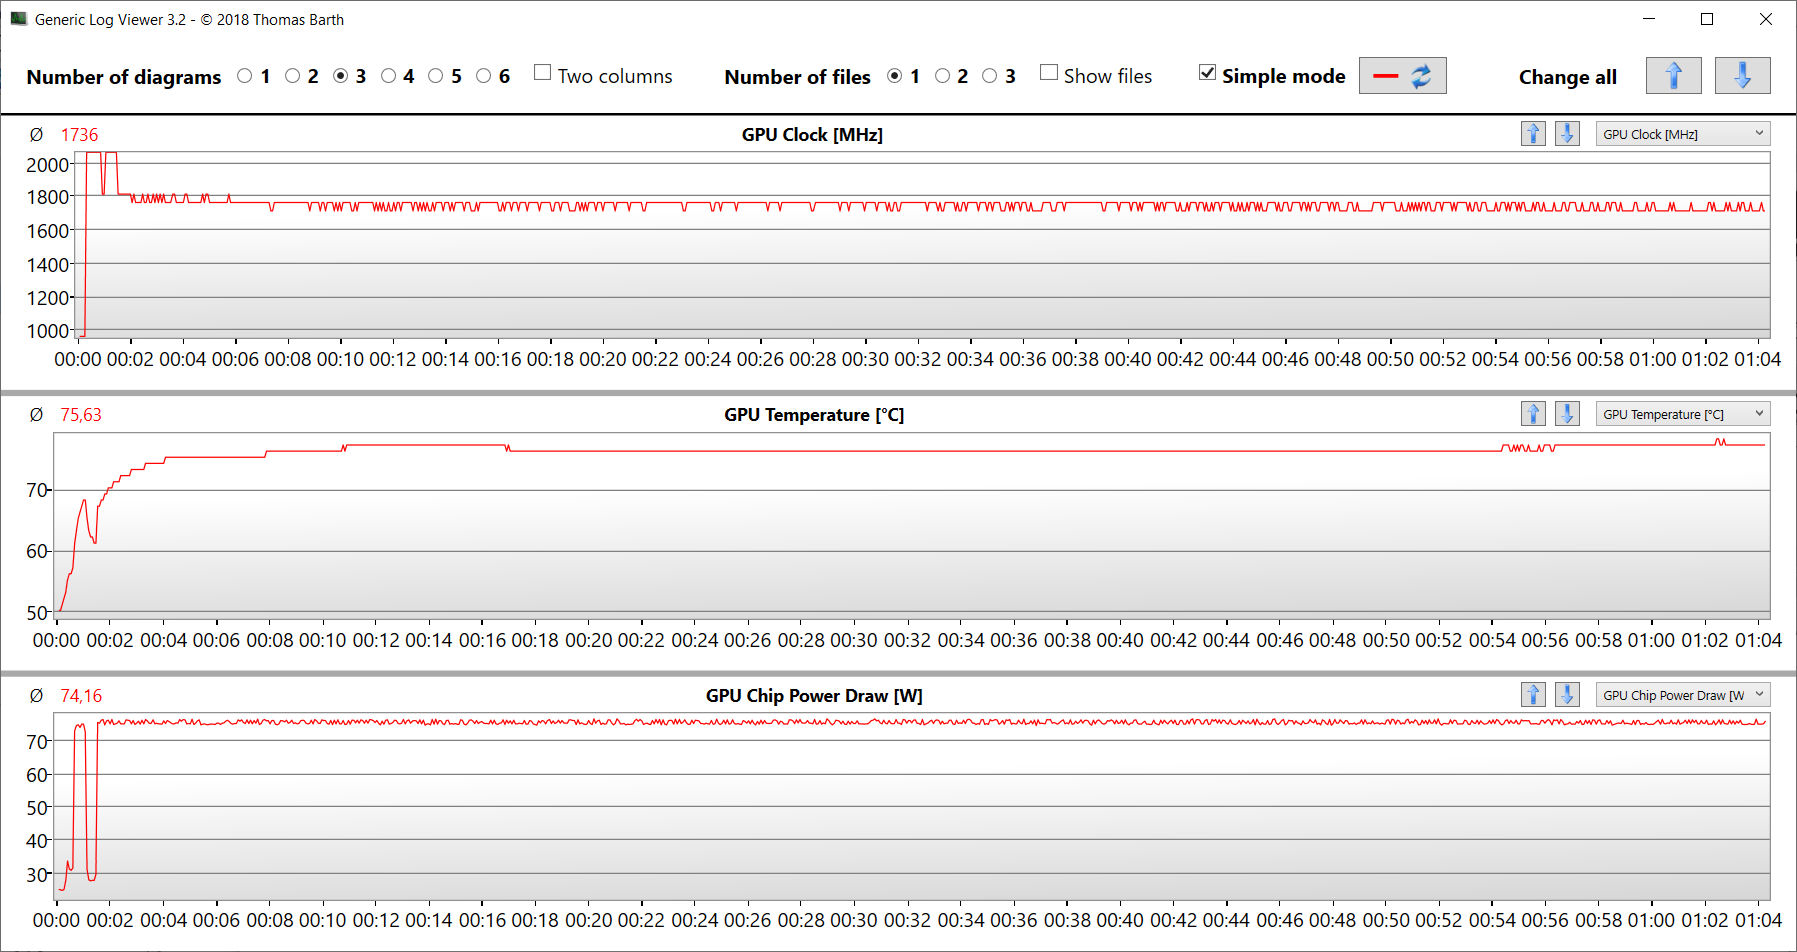
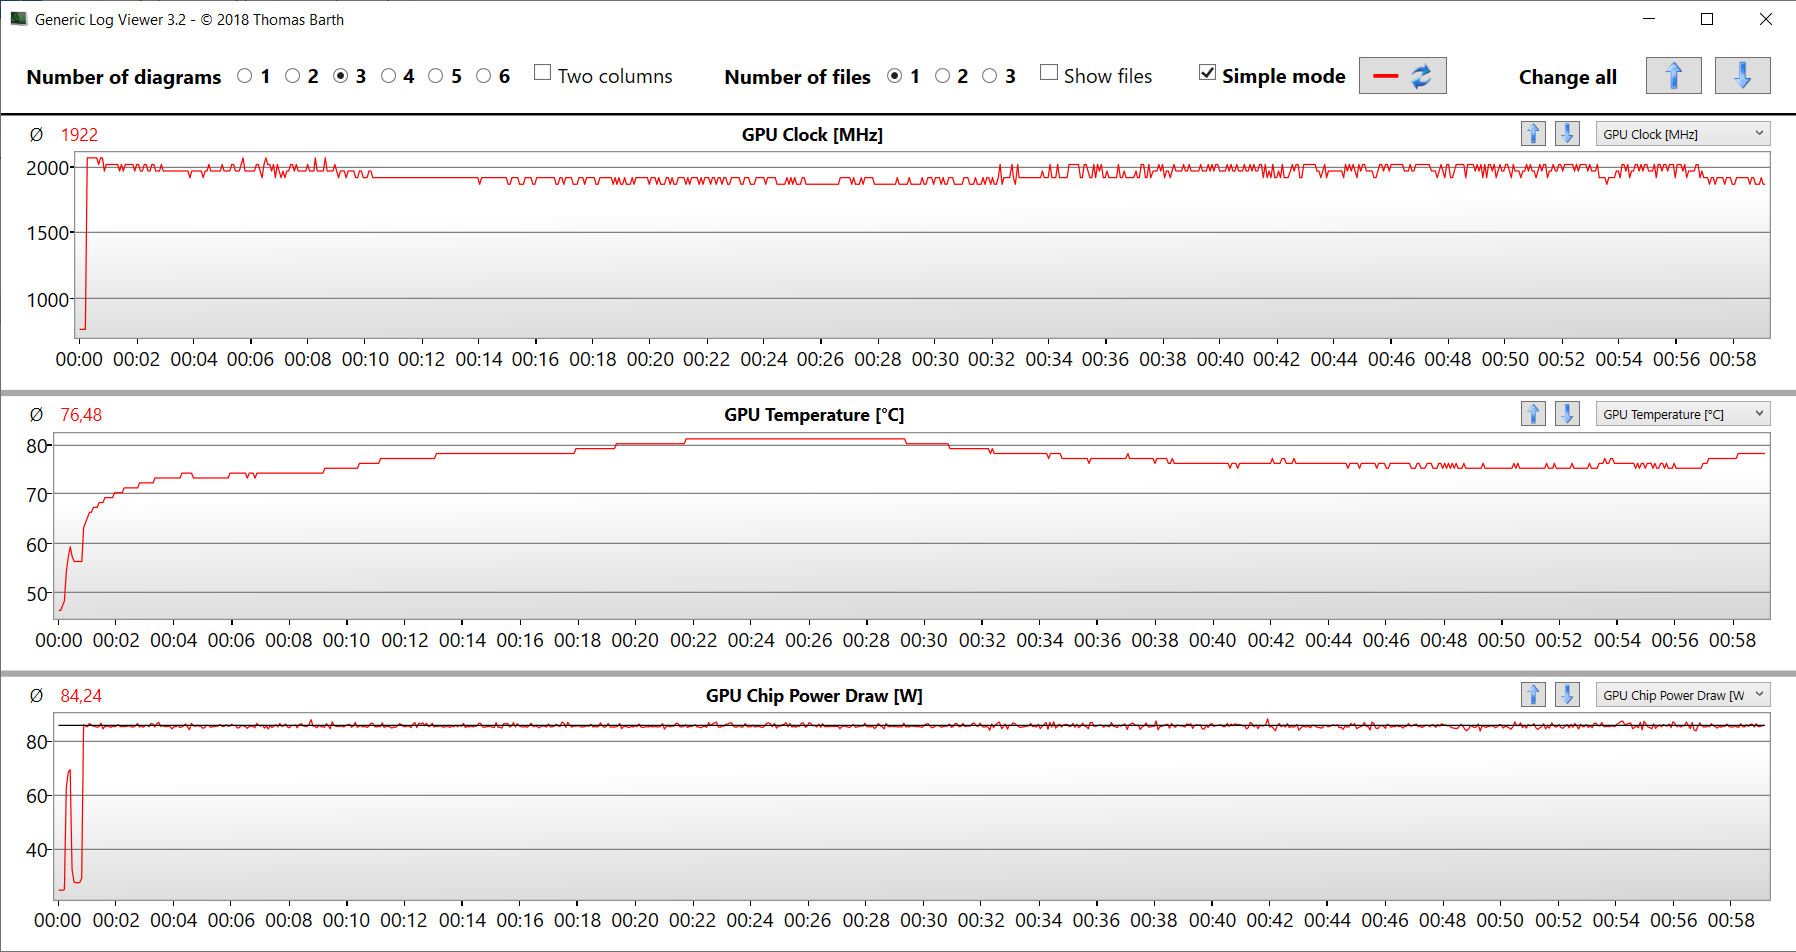
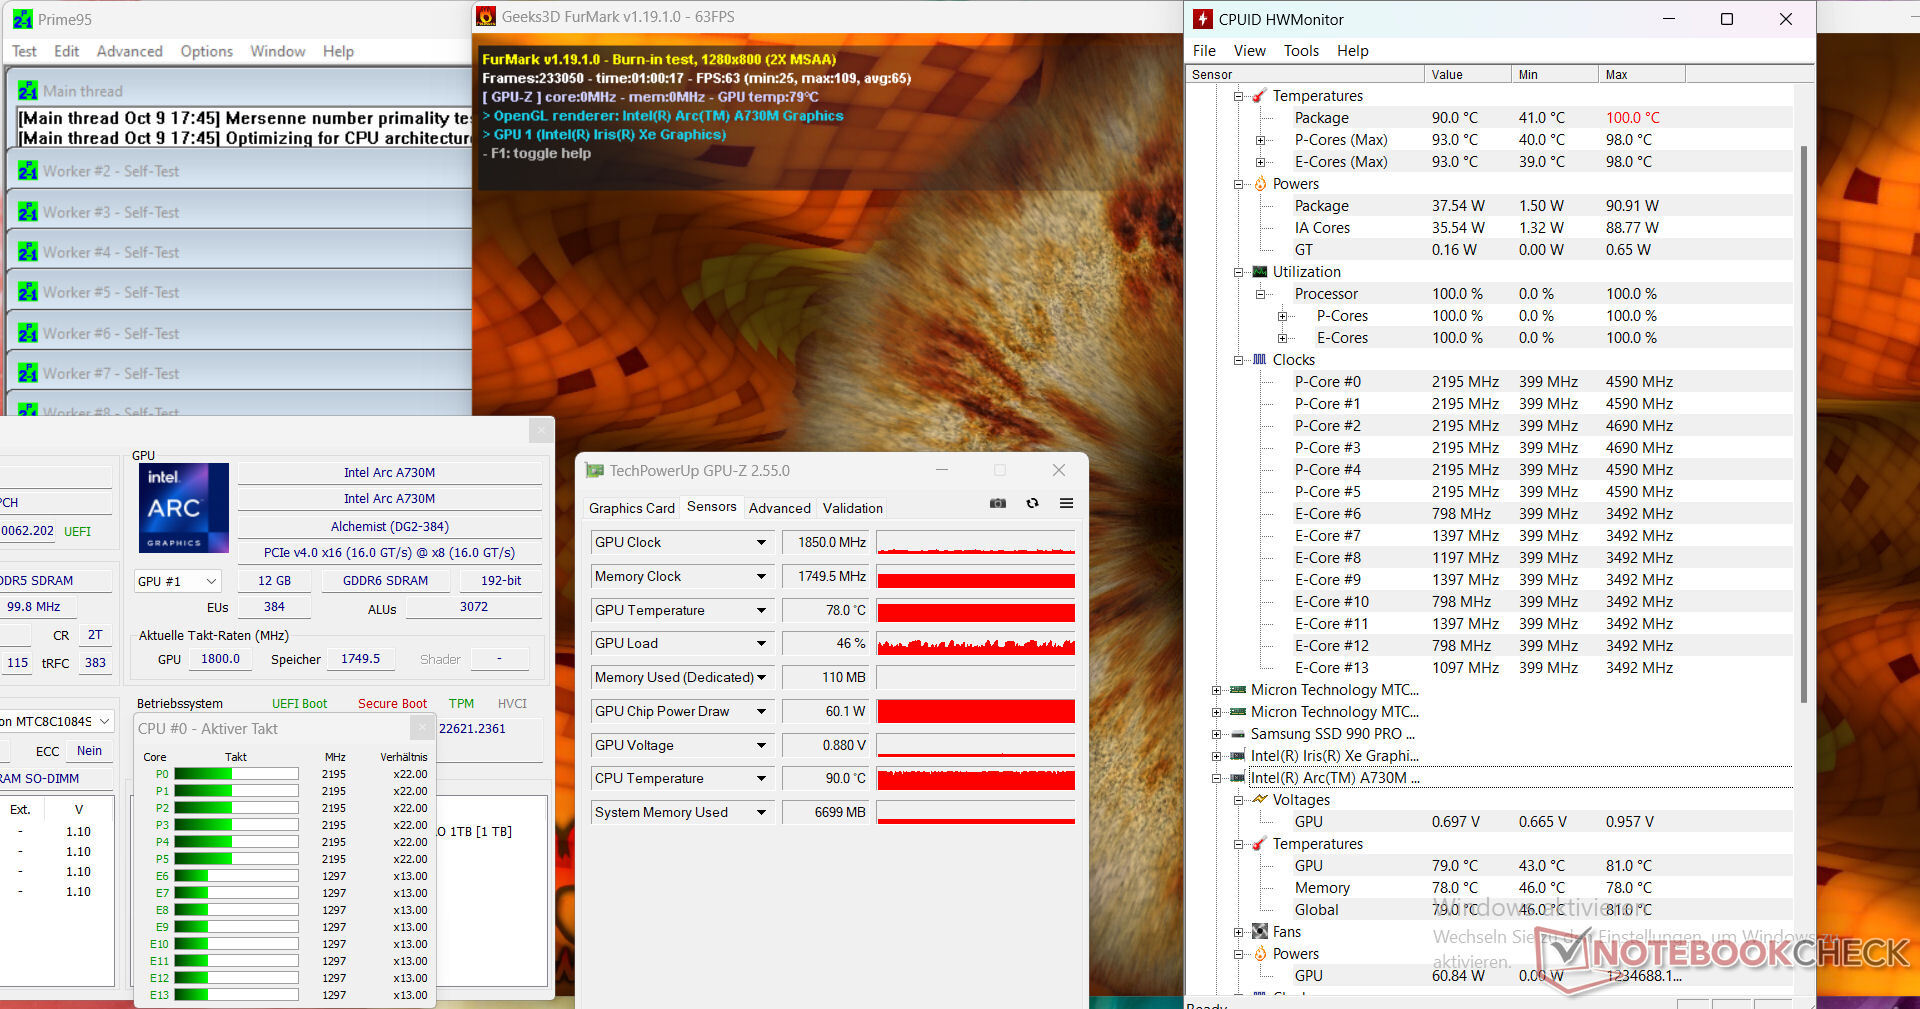
Stresstestet (Prime95 och Furmark i kontinuerlig drift) simulerar ett extremt scenario för att testa systemets stabilitet under full belastning. CPU- och GPU-klockfrekvenserna fluktuerade inom det genomsnittliga intervallet.
(-) Den maximala temperaturen på ovansidan är 59 °C / 138 F, jämfört med genomsnittet av 36.8 °C / 98 F , allt från 21 till 71 °C för klassen Multimedia.
(-) Botten värms upp till maximalt 51 °C / 124 F, jämfört med genomsnittet av 39.1 °C / 102 F
(+) Vid tomgångsbruk är medeltemperaturen för ovansidan 27.3 °C / 81 F, jämfört med enhetsgenomsnittet på 31.3 °C / ### class_avg_f### F.
(-) När du spelar The Witcher 3 är medeltemperaturen för ovansidan 40.9 °C / 106 F, jämfört med enhetsgenomsnittet på 31.3 °C / ## #class_avg_f### F.
(±) Handledsstöden och pekplattan kan bli väldigt varma vid beröring med maximalt 36 °C / 96.8 F.
(-) Medeltemperaturen för handledsstödsområdet på liknande enheter var 28.7 °C / 83.7 F (-7.3 °C / -13.1 F).
| Intel NUC X15 LAPAC71H Intel Core i7-12700H, Intel Arc A730M | Asus TUF A15 FA507 AMD Ryzen 7 7735HS, NVIDIA GeForce RTX 4050 Laptop GPU | Gigabyte G5 KE Intel Core i5-12500H, NVIDIA GeForce RTX 3060 Laptop GPU | Dell Inspiron 16 Plus 7630 Intel Core i7-13700H, NVIDIA GeForce RTX 4060 Laptop GPU | Asus VivoBook Pro 16 Intel Core i7-12700H, NVIDIA GeForce RTX 3050 Ti Laptop GPU | MSI Cyborg 15 A12VF Intel Core i7-12650H, NVIDIA GeForce RTX 4060 Laptop GPU | |
|---|---|---|---|---|---|---|
| Heat | 10% | -12% | -2% | -6% | 13% | |
| Maximum Upper Side * (°C) | 59 | 48.9 17% | 52.6 11% | 47.8 19% | 44.2 25% | 47.5 19% |
| Maximum Bottom * (°C) | 51 | 44.6 13% | 62.4 -22% | 42.2 17% | 53 -4% | 35.5 30% |
| Idle Upper Side * (°C) | 28 | 27.1 3% | 33.6 -20% | 35.2 -26% | 32.1 -15% | 27.7 1% |
| Idle Bottom * (°C) | 30 | 27.5 8% | 34.8 -16% | 35 -17% | 38.4 -28% | 29.5 2% |
* ... mindre är bättre
Högtalare
Stereohögtalarna ger ett hyfsat ljud men knappt någon bas.
Intel NUC X15 LAPAC71H ljudanalys
(±) | högtalarljudstyrkan är genomsnittlig men bra (79.38 dB)
Bas 100 - 315 Hz
(-) | nästan ingen bas - i genomsnitt 17.1% lägre än medianen
(±) | linjäriteten för basen är genomsnittlig (14.2% delta till föregående frekvens)
Mellan 400 - 2000 Hz
(+) | balanserad mellan - endast 1.7% från medianen
(+) | mids är linjära (3.8% delta till föregående frekvens)
Högsta 2 - 16 kHz
(+) | balanserade toppar - endast 2.2% från medianen
(+) | toppar är linjära (5.4% delta till föregående frekvens)
Totalt 100 - 16 000 Hz
(+) | det totala ljudet är linjärt (12.1% skillnad mot median)
Jämfört med samma klass
» 22% av alla testade enheter i den här klassen var bättre, 3% liknande, 76% sämre
» Den bästa hade ett delta på 5%, genomsnittet var 17%, sämst var 45%
Jämfört med alla testade enheter
» 10% av alla testade enheter var bättre, 2% liknande, 88% sämre
» Den bästa hade ett delta på 4%, genomsnittet var 23%, sämst var 134%
Dell Inspiron 16 Plus 7630 ljudanalys
(±) | högtalarljudstyrkan är genomsnittlig men bra (81.8 dB)
Bas 100 - 315 Hz
(-) | nästan ingen bas - i genomsnitt 17% lägre än medianen
(±) | linjäriteten för basen är genomsnittlig (8.4% delta till föregående frekvens)
Mellan 400 - 2000 Hz
(±) | högre mellan - i genomsnitt 6.3% högre än median
(+) | mids är linjära (6.2% delta till föregående frekvens)
Högsta 2 - 16 kHz
(+) | balanserade toppar - endast 2.2% från medianen
(+) | toppar är linjära (5.6% delta till föregående frekvens)
Totalt 100 - 16 000 Hz
(±) | linjäriteten för det totala ljudet är genomsnittlig (15.9% skillnad mot median)
Jämfört med samma klass
» 40% av alla testade enheter i den här klassen var bättre, 6% liknande, 54% sämre
» Den bästa hade ett delta på 5%, genomsnittet var 17%, sämst var 45%
Jämfört med alla testade enheter
» 25% av alla testade enheter var bättre, 5% liknande, 70% sämre
» Den bästa hade ett delta på 4%, genomsnittet var 23%, sämst var 134%
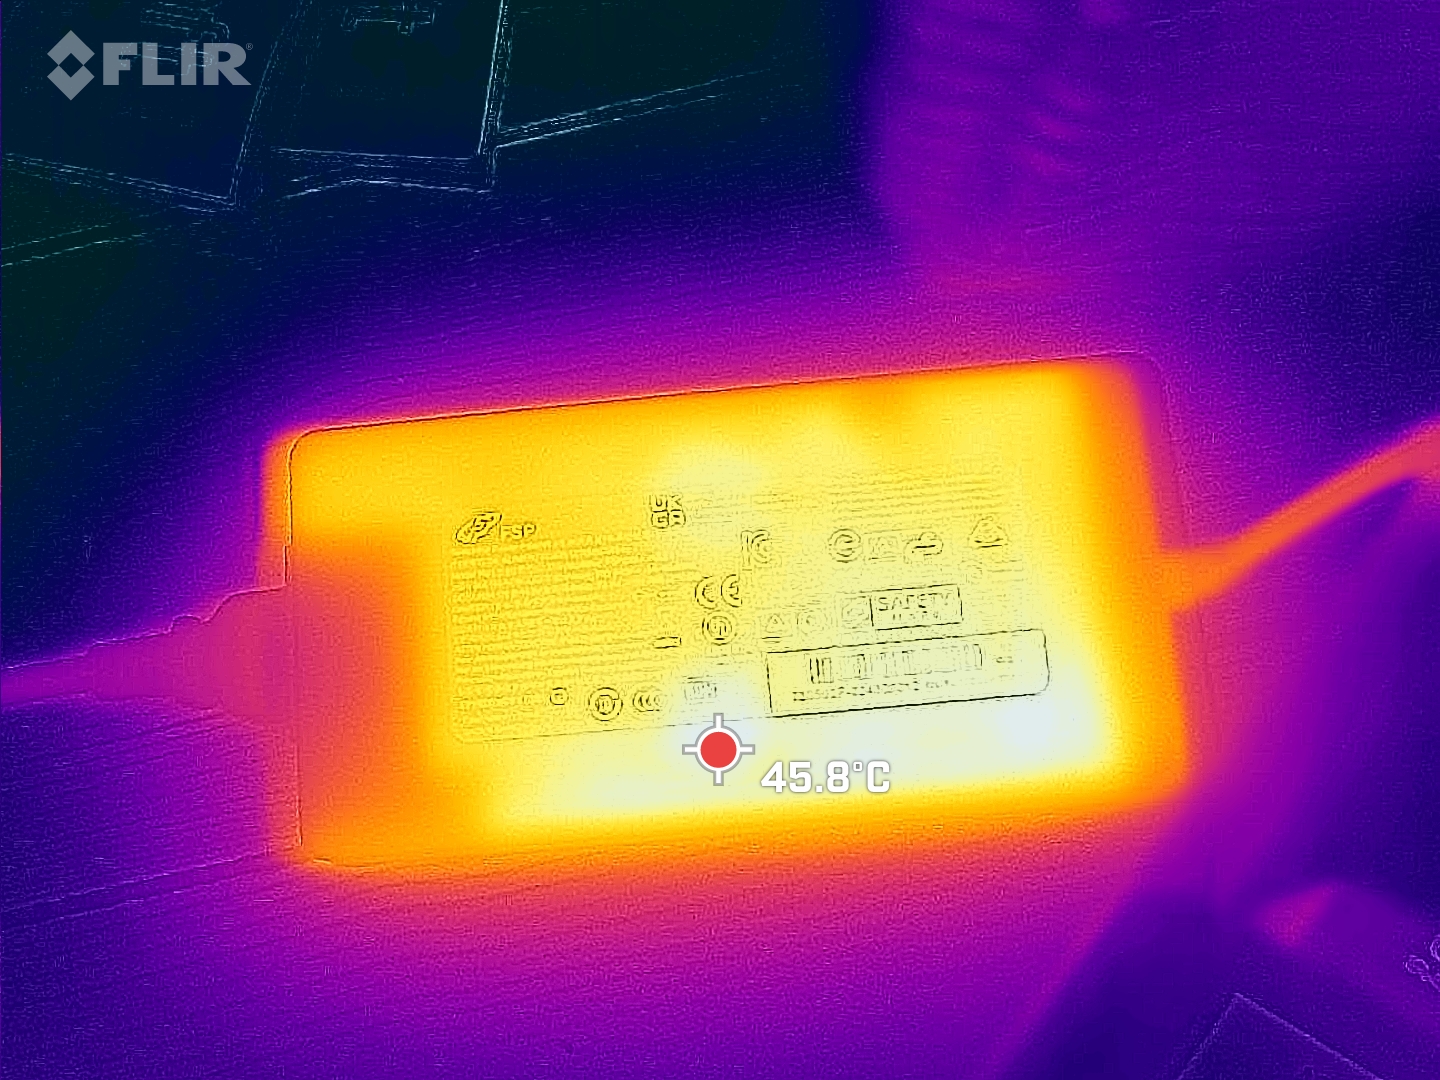
Strömförbrukning
Den bärbara datorns strömförbrukning ligger på den förväntade nivån för den installerade hårdvaran. Stresstestet och Witcher 3 kördes med (något) varierande strömförbrukningsnivåer. Den medföljande strömförsörjningen (230 watt) är tillräckligt stor.
Att döma av dess prestanda per watt är enheten mycket strömhungrig. För jämförelse: DenMSI Cyborg behöver bara ungefär hälften så mycket ström under belastning men levererar betydligt bättre spelprestanda. DenGeForce RTX 4060 i MSI:s bärbara dator, som är begränsad till en TGP på 45 watt, arbetar mycket mer effektivt än Arc 730M.
| Av/Standby | |
| Låg belastning | |
| Hög belastning |
|
Förklaring:
min: | |
| Intel NUC X15 LAPAC71H Intel Core i7-12700H, Intel Arc A730M | Asus TUF A15 FA507 AMD Ryzen 7 7735HS, NVIDIA GeForce RTX 4050 Laptop GPU | Gigabyte G5 KE Intel Core i5-12500H, NVIDIA GeForce RTX 3060 Laptop GPU | Dell Inspiron 16 Plus 7630 Intel Core i7-13700H, NVIDIA GeForce RTX 4060 Laptop GPU | Asus VivoBook Pro 16 Intel Core i7-12700H, NVIDIA GeForce RTX 3050 Ti Laptop GPU | MSI Cyborg 15 A12VF Intel Core i7-12650H, NVIDIA GeForce RTX 4060 Laptop GPU | |
|---|---|---|---|---|---|---|
| Power Consumption | 12% | -1% | -18% | 1% | 32% | |
| Idle Minimum * (Watt) | 7.5 | 8 -7% | 7.66 -2% | 15.6 -108% | 8.7 -16% | 6 20% |
| Idle Average * (Watt) | 11.9 | 12.1 -2% | 10.3 13% | 17.7 -49% | 13.1 -10% | 8.8 26% |
| Idle Maximum * (Watt) | 13.9 | 12.5 10% | 16.05 -15% | 20.6 -48% | 18.3 -32% | 11.9 14% |
| Load Average * (Watt) | 137 | 74.9 45% | 115.8 15% | 87.4 36% | 116 15% | 89 35% |
| Witcher 3 ultra * (Watt) | 166 | 136.6 18% | 168.7 -2% | 121.7 27% | 117.6 29% | 90.3 46% |
| Load Maximum * (Watt) | 203 | 185 9% | 234.6 -16% | 138 32% | 162 20% | 99 51% |
* ... mindre är bättre
Power consumption Witcher 3 / stress test
Power consumption with external monitor
Körtider
15,6-tumsenheten uppnådde körtider på 5:44 h i vårt realistiska WLAN-test (kartläggning av belastningen när webbsidor öppnas med hjälp av ett skript) - ett anständigt men inte fantastiskt värde.
För
Emot
Dom - Det finns inget att förhandla om här
Intel vänder sig med sin NUC X15 till gamers och kreativa användare. Detta innebär att video- och bildredigering, streaming, rendering och spel alla hör till den bärbara datorns användningsområden. ACore i7-12700HochArc A730Mlevererar den nödvändiga kraften - båda chipen körs med konsekvent höga klockfrekvenser.
Intel NUC X15 varken imponerar eller gör någon besviken. Men med tanke på CPU-prestandan och den höga strömförbrukningen är priset på den bärbara datorn helt enkelt för högt.
Dess ineffektiva Arc GPU levererar mindre prestanda per watt jämfört med sina jämförbara konkurrenter. Precis som på alla nuvarande GPU:er (RX7000, RTX 4000) har A730M strålspårningskärnor och AV1-stöd (avkodning och kodning) - funktioner som är nödvändiga på en bärbar dator för skapare.
Enhetens utsläpp är typiska för den här klassen. Praktiska drifttider på nästan 6 timmar kan klassas som anständiga. USB-C-porten (Thunderbolt 4) har inte stöd för Power Delivery men kan mata ut en DisplayPort-signal. Dessutom har den bärbara datorn expansionsalternativ (dockningslösning, extern GPU). Sammantaget lämnade den installerade FHD-skärmen (15,6 tum, IPS, 144 Hz) ett gott intryck på oss.
Ett alternativ kan varaAsus VivoBook Pro 16: Den har något lägre datorprestanda totalt sett, men den drar nytta av längre körtider, Power Delivery och en 16:10-skärm. Aorus 15 9KF-E3DE383SH kan vara ett bra budgetalternativ. Tack vare sin GeForce RTX 4060 (TGP: 140 watt) levererar den mycket bättre spelprestanda än X15. Du kan för närvarande hitta den online för cirka 1 040 USD. Vi har redan testat enkraftfullare versionav Aorus 15.
Pris och tillgänglighet
Intel NUC X15 LAPAC71H kan konfigureras individuellt och beställas via Schenkers onlinebutik. Den aktuella testenheten kan köpas för ca 1 280 USD. Basvarianten (16 GB RAM, 500 GB SSD) kan köpas för cirka 1 050 USD.
Intel NUC X15 LAPAC71H
- 10/13/2023 v7 (old)
Sascha Mölck
Genomskinlighet
Valet av enheter som ska granskas görs av vår redaktion. Testprovet gavs till författaren som ett lån av tillverkaren eller återförsäljaren för denna recension. Långivaren hade inget inflytande på denna recension och inte heller fick tillverkaren en kopia av denna recension innan publiceringen. Det fanns ingen skyldighet att publicera denna recension. Som ett oberoende medieföretag är Notebookcheck inte föremål för auktoritet från tillverkare, återförsäljare eller förlag.
This is how Notebookcheck is testingEvery year, Notebookcheck independently reviews hundreds of laptops and smartphones using standardized procedures to ensure that all results are comparable. We have continuously developed our test methods for around 20 years and set industry standards in the process. In our test labs, high-quality measuring equipment is utilized by experienced technicians and editors. These tests involve a multi-stage validation process. Our complex rating system is based on hundreds of well-founded measurements and benchmarks, which maintains objectivity.
Price comparison

