 Deutsch
 English
 Español
 Français
 Italiano
 Nederlands
 Polski
 Português
 Русский
 Türkçe
 Svenska
 Chinese
 Magyar
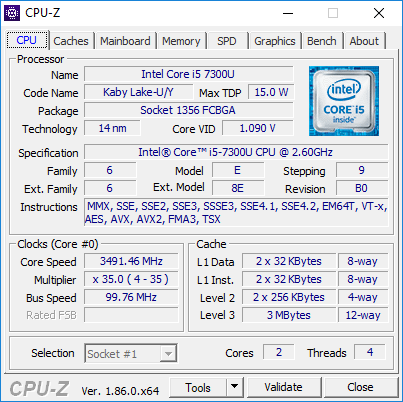
Test: Panasonic Toughbook CF-54 (i5-7300U) Robust Laptop (Sammanfattning)


| SD Card Reader | |
| average JPG Copy Test (av. of 3 runs) | |
| Panasonic Toughbook CF-54G2999VM (Toshiba Exceria Pro SDXC 64 GB UHS-II) | |
| Dell Latitude 7490 (Toshiba Exceria Pro M501 UHS-II) | |
| Dell Latitude 14 7414 Rugged Extreme (Toshiba Exceria Pro SDXC 64 GB UHS-II) | |
| Getac S410 (Toshiba Exceria Pro SDXC 64 GB UHS-II) | |
| Fujitsu LifeBook U748 (Toshiba Exceria Pro SDXC 64 GB UHS-II) | |
| Panasonic Toughbook CF-33 (Toshiba Exceria Pro SDXC 64 GB UHS-II) | |
| maximum AS SSD Seq Read Test (1GB) | |
| Dell Latitude 14 7414 Rugged Extreme (Toshiba Exceria Pro SDXC 64 GB UHS-II) | |
| Dell Latitude 7490 (Toshiba Exceria Pro M501 UHS-II) | |
| Panasonic Toughbook CF-54G2999VM (Toshiba Exceria Pro SDXC 64 GB UHS-II) | |
| Getac S410 (Toshiba Exceria Pro SDXC 64 GB UHS-II) | |
| Fujitsu LifeBook U748 (Toshiba Exceria Pro SDXC 64 GB UHS-II) | |
| Panasonic Toughbook CF-33 (Toshiba Exceria Pro SDXC 64 GB UHS-II) | |
| Networking | |
| iperf3 transmit AX12 | |
| Dell Latitude 14 7414 Rugged Extreme | |
| Getac S410 | |
| Dell Latitude 7490 | |
| Panasonic Toughbook CF-54G2999VM | |
| Fujitsu LifeBook U748 | |
| Panasonic Toughbook CF-33 | |
| iperf3 receive AX12 | |
| Getac S410 | |
| Dell Latitude 7490 | |
| Panasonic Toughbook CF-54G2999VM | |
| Fujitsu LifeBook U748 | |
| Dell Latitude 14 7414 Rugged Extreme | |
| Panasonic Toughbook CF-33 | |
| |||||||||||||||||||||||||
Distribution av ljusstyrkan: 71 %
Mitt på batteriet: 174.5 cd/m²
Kontrast: 291:1 (Svärta: 0.6 cd/m²)
ΔE Color 12.05 | 0.5-29.43 Ø5, calibrated: 4.34
ΔE Greyscale 14.8 | 0.57-98 Ø5.3
56.2% sRGB (Argyll 1.6.3 3D)
35.7% AdobeRGB 1998 (Argyll 1.6.3 3D)
38.62% AdobeRGB 1998 (Argyll 2.2.0 3D)
56.1% sRGB (Argyll 2.2.0 3D)
37.36% Display P3 (Argyll 2.2.0 3D)
Gamma: 1.4
| Panasonic Toughbook CF-54G2999VM B140XTN, AUO2E3C, TN LED, 14.00, 1366x768 | Dell Latitude 14 7414 Rugged Extreme Sharp LQ140K1, IPS, 14.00, 1366x768 | Dell Latitude 7490 AU Optronics AU0223D, IPS, 14.00, 1920x1080 | Panasonic Toughbook CF-33 Manufacturer unknown, ID: TMA1200, IPS, 12.00, 2160x1440 | Samsung Notebook 9 NP900X5T-X01US ID: BOE06E8, Name: BOE HF NV150FHB-N31, IPS, 15.00, 1920x1080 | Getac S410 CMN N140BGE-E33, TN PED, 14.00, 1366x768 | |
|---|---|---|---|---|---|---|
| Display | -0% | 65% | 18% | 74% | 8% | |
| Display P3 Coverage | 37.36 | 37.22 0% | 63.6 70% | 44.24 18% | 65.2 75% | 40.46 8% |
| sRGB Coverage | 56.1 | 55.8 -1% | 88.8 58% | 66.7 19% | 97.4 74% | 60.9 9% |
| AdobeRGB 1998 Coverage | 38.62 | 38.49 0% | 64.8 68% | 45.71 18% | 66.8 73% | 41.8 8% |
| Response Times | -29% | -50% | -19% | -39% | 12% | |
| Response Time Grey 50% / Grey 80% * | 43.2 ? | 43 ? -0% | 48.4 ? -12% | 30 ? 31% | 46 ? -6% | 41.2 ? 5% |
| Response Time Black / White * | 17.2 ? | 27 ? -57% | 32.4 ? -88% | 29 ? -69% | 29.6 ? -72% | 14 ? 19% |
| PWM Frequency | 200 ? | 685 | 2976 ? | 877 ? | ||
| Screen | 68% | 73% | 219% | 114% | 17% | |
| Brightness middle | 174.5 | 493 183% | 328.2 88% | 571 227% | 558.2 220% | 265.1 52% |
| Brightness | 164 | 456 178% | 305 86% | 555 238% | 528 222% | 246 50% |
| Brightness Distribution | 71 | 81 14% | 87 23% | 89 25% | 92 30% | 81 14% |
| Black Level * | 0.6 | 0.53 12% | 0.37 38% | 0.11 82% | 0.46 23% | 0.58 3% |
| Contrast | 291 | 930 220% | 887 205% | 5191 1684% | 1213 317% | 457 57% |
| Colorchecker dE 2000 * | 12.05 | 11.08 8% | 3.82 68% | 22.7 -88% | 4.41 63% | 14.24 -18% |
| Colorchecker dE 2000 max. * | 27.5 | 15.11 45% | 5.58 80% | 34.14 -24% | 10.91 60% | 26.66 3% |
| Colorchecker dE 2000 calibrated * | 4.34 | 3.5 19% | 3.94 9% | |||
| Greyscale dE 2000 * | 14.8 | 11.99 19% | 3 80% | 13.6 8% | 6.6 55% | 14.2 4% |
| Gamma | 1.4 157% | 4.03 55% | 2.36 93% | 5.51 40% | 2.19 100% | 2.03 108% |
| CCT | 14529 45% | 10872 60% | 6962 93% | 6998 93% | 7615 85% | 17152 38% |
| Color Space (Percent of AdobeRGB 1998) | 35.7 | 36 1% | 58 62% | 42.5 19% | 61.3 72% | 38.7 8% |
| Color Space (Percent of sRGB) | 56.2 | 56 0% | 88 57% | 67.02 19% | 97.2 73% | 61 9% |
| Total Average (Program / Settings) | 13% /
41% | 29% /
56% | 73% /
147% | 50% /
85% | 12% /
15% |
* ... smaller is better
Display Response Times
| ↔ Response Time Black to White | ||
|---|---|---|
| 17.2 ms ... rise ↗ and fall ↘ combined | ↗ 11.2 ms rise |  |
| ↘ 6 ms fall | ||
| The screen shows good response rates in our tests, but may be too slow for competitive gamers. In comparison, all tested devices range from 0.1 (minimum) to 240 (maximum) ms. » 34 % of all devices are better. This means that the measured response time is better than the average of all tested devices (21.4 ms). | ||
| ↔ Response Time 50% Grey to 80% Grey | ||
| 43.2 ms ... rise ↗ and fall ↘ combined | ↗ 16.8 ms rise |  |
| ↘ 26.4 ms fall | ||
| The screen shows slow response rates in our tests and will be unsatisfactory for gamers. In comparison, all tested devices range from 0.2 (minimum) to 636 (maximum) ms. » 68 % of all devices are better. This means that the measured response time is worse than the average of all tested devices (33.7 ms). | ||
Screen Flickering / PWM (Pulse-Width Modulation)
| Screen flickering / PWM not detected |  | ||
In comparison: 53 % of all tested devices do not use PWM to dim the display. If PWM was detected, an average of 17830 (minimum: 5 - maximum: 3846000) Hz was measured. | |||


| Cinebench R15 | |
| CPU Single 64Bit | |
| Getac S410 | |
| Dell Latitude 15 3590-K8JP | |
| Lenovo ThinkPad 25 | |
| HP 15-da0405ng | |
| Average Intel Core i5-7300U (125 - 145, n=9) | |
| Lenovo ThinkPad A485-20MU000CGE | |
| Lenovo IdeaPad 720-15IKB | |
| Panasonic Toughbook CF-54G2999VM | |
| HP 250 G4 T6P08ES | |
| Microsoft Surface Go MHN-00003 | |
| Teclast Tbook 16 Power | |
| CPU Multi 64Bit | |
| Dell Latitude 15 3590-K8JP | |
| HP 15-da0405ng | |
| Lenovo ThinkPad A485-20MU000CGE | |
| Getac S410 | |
| Lenovo ThinkPad 25 | |
| Panasonic Toughbook CF-54G2999VM | |
| Average Intel Core i5-7300U (328 - 369, n=9) | |
| Lenovo IdeaPad 720-15IKB | |
| HP 250 G4 T6P08ES | |
| Microsoft Surface Go MHN-00003 | |
| Teclast Tbook 16 Power | |
| PCMark 10 - Score | |
| Average of class Office (2325 - 7157, n=103, last 2 years) | |
| Dell Latitude 7490 | |
| Panasonic Toughbook CF-33 | |
| Panasonic Toughbook CF-54G2999VM | |
| Fujitsu LifeBook U748 | |
| PCMark 8 - Home Score Accelerated v2 | |
| Average of class Office (2304 - 4830, n=12, last 2 years) | |
| Dell Latitude 7490 | |
| Panasonic Toughbook CF-54G2999VM | |
| Dell Latitude 14 7414 Rugged Extreme | |
| Fujitsu LifeBook U748 | |
| Panasonic Toughbook CF-33 | |
| PCMark 8 Home Score Accelerated v2 | 3906 poäng | |
| PCMark 10 Score | 2972 poäng | |
Hjälp | ||
| Panasonic Toughbook CF-54G2999VM Seagate BarraCuda Compute 1TB ST1000LM048 | Lenovo IdeaPad 330-15ARR-81D2005JGE Seagate Mobile HDD 1TB ST1000LM035 | Dell G3 15 3579 Seagate Mobile HDD 1TB ST1000LX015-1U7172 | HP 15-db0500ng Seagate Mobile HDD 1TB ST1000LM035 | Toshiba Tecra A50-C1510W10 Hitachi Travelstar Z7K500 HTS725050A7E630 | Toshiba Satellite Radius 15 P50W-C-102 HGST Travelstar 5K1000 HTS541010A9E680 | |
|---|---|---|---|---|---|---|
| HD Tune Transfer Rate Average | ||||||
| Transfer Rate Average | 98.8 | 84.4 -15% | 97.5 -1% | 98.5 0% | 102.6 4% | 70.5 -29% |

| 3DMark 11 | |
| 1280x720 Performance GPU | |
| Samsung Notebook 9 NP900X5T-X01US | |
| Lenovo ThinkPad 25 | |
| Lenovo ThinkPad A485-20MU000CGE | |
| Lenovo IdeaPad Flex-1570 81CA000RUS | |
| Microsoft Surface Pro (2017) i7 | |
| Getac S410 | |
| Panasonic Toughbook CF-54G2999VM | |
| Average Intel HD Graphics 620 (1067 - 1777, n=132) | |
| Dell Latitude 14 7414 Rugged Extreme | |
| Microsoft Surface Go MHN-00003 | |
| Teclast Tbook 16 Power | |
| 1280x720 Performance Combined | |
| Samsung Notebook 9 NP900X5T-X01US | |
| Lenovo ThinkPad 25 | |
| Lenovo IdeaPad Flex-1570 81CA000RUS | |
| Microsoft Surface Pro (2017) i7 | |
| Lenovo ThinkPad A485-20MU000CGE | |
| Getac S410 | |
| Panasonic Toughbook CF-54G2999VM | |
| Average Intel HD Graphics 620 (814 - 1811, n=132) | |
| Dell Latitude 14 7414 Rugged Extreme | |
| Microsoft Surface Go MHN-00003 | |
| Teclast Tbook 16 Power | |
| 3DMark 11 Performance | 1873 poäng | |
Hjälp | ||
| låg | med. | hög | ultra | |
| BioShock Infinite (2013) | 54.7 | 33.5 | 28.9 |
Ljudnivå
| Låg belastning |
| 28.8 / 28.8 / 29.1 dB(A) |
| Hög belastning |
| 31.3 / 40 dB(A) |
 | ||
30 dB tyst 40 dB(A) hörbar 50 dB(A) högt ljud |
||
min: | ||
| Panasonic Toughbook CF-54G2999VM HD Graphics 620, i5-7300U, Seagate BarraCuda Compute 1TB ST1000LM048 | Dell Latitude 14 7414 Rugged Extreme HD Graphics 520, 6300U, Liteonit CV3-8D128 | Dell Latitude 7490 UHD Graphics 620, i7-8650U, Samsung PM961 MZVLW256HEHP | Panasonic Toughbook CF-33 HD Graphics 620, i5-7300U, Toshiba SG5 256GB THNSNK256GVN8 | Getac S410 UHD Graphics 620, i5-8550U, CUKUSA 1 TB SATA SSD Q0526A | |
|---|---|---|---|---|---|
| Noise | 1% | -1% | -2% | 4% | |
| off / environment * | 28.3 | 30.2 -7% | 28.2 -0% | 30.3 -7% | 28.4 -0% |
| Idle Minimum * | 28.8 | 30.2 -5% | 28.2 2% | 30.3 -5% | 28.4 1% |
| Idle Average * | 28.8 | 30.2 -5% | 28.2 2% | 30.3 -5% | 28.4 1% |
| Idle Maximum * | 29.1 | 30.2 -4% | 31.4 -8% | 30.5 -5% | 28.4 2% |
| Load Average * | 31.3 | 30.2 4% | 31.7 -1% | 30.5 3% | 30.3 3% |
| Load Maximum * | 40 | 31.7 21% | 41.2 -3% | 36.6 8% | 33.3 17% |
* ... smaller is better
(+) The maximum temperature on the upper side is 38.2 °C / 101 F, compared to the average of 34.2 °C / 94 F, ranging from 21.2 to 62.5 °C for the class Office.
(+) The bottom heats up to a maximum of 38 °C / 100 F, compared to the average of 36.7 °C / 98 F
(+) In idle usage, the average temperature for the upper side is 27.1 °C / 81 F, compared to the device average of 29.5 °C / 85 F.
(+) The palmrests and touchpad are cooler than skin temperature with a maximum of 29.8 °C / 85.6 F and are therefore cool to the touch.
(-) The average temperature of the palmrest area of similar devices was 27.7 °C / 81.9 F (-2.1 °C / -3.7 F).
Panasonic Toughbook CF-54G2999VM audio analysis
(-) | not very loud speakers (65.9 dB)
Bass 100 - 315 Hz
(-) | nearly no bass - on average 25.6% lower than median
(+) | bass is linear (5% delta to prev. frequency)
Mids 400 - 2000 Hz
(±) | higher mids - on average 7.8% higher than median
(-) | mids are not linear (17.3% delta to prev. frequency)
Highs 2 - 16 kHz
(+) | balanced highs - only 4.3% away from median
(±) | linearity of highs is average (7.9% delta to prev. frequency)
Overall 100 - 16.000 Hz
(-) | overall sound is not linear (39.6% difference to median)
Compared to same class
» 99% of all tested devices in this class were better, 1% similar, 1% worse
» The best had a delta of 7%, average was 22%, worst was 53%
Compared to all devices tested
» 94% of all tested devices were better, 0% similar, 6% worse
» The best had a delta of 4%, average was 25%, worst was 134%
Apple MacBook 12 (Early 2016) 1.1 GHz audio analysis
(+) | speakers can play relatively loud (83.6 dB)
Bass 100 - 315 Hz
(±) | reduced bass - on average 11.3% lower than median
(±) | linearity of bass is average (14.2% delta to prev. frequency)
Mids 400 - 2000 Hz
(+) | balanced mids - only 2.4% away from median
(+) | mids are linear (5.5% delta to prev. frequency)
Highs 2 - 16 kHz
(+) | balanced highs - only 2% away from median
(+) | highs are linear (4.5% delta to prev. frequency)
Overall 100 - 16.000 Hz
(+) | overall sound is linear (10.2% difference to median)
Compared to same class
» 5% of all tested devices in this class were better, 2% similar, 93% worse
» The best had a delta of 5%, average was 19%, worst was 53%
Compared to all devices tested
» 3% of all tested devices were better, 1% similar, 96% worse
» The best had a delta of 4%, average was 25%, worst was 134%
| Av/Standby | |
| Låg belastning | |
| Hög belastning |
|
| Panasonic Toughbook CF-54G2999VM i5-7300U, HD Graphics 620, Seagate BarraCuda Compute 1TB ST1000LM048, TN LED, 1366x768, 14.00 | Dell Latitude 14 7414 Rugged Extreme 6300U, HD Graphics 520, Liteonit CV3-8D128, IPS, 1366x768, 14.00 | Fujitsu LifeBook U748 i5-8250U, UHD Graphics 620, Samsung PM961 MZVLW256HEHP, IPS, 1920x1080, 14.00 | Dell Latitude 7490 i7-8650U, UHD Graphics 620, Samsung PM961 MZVLW256HEHP, IPS, 1920x1080, 14.00 | Panasonic Toughbook CF-33 i5-7300U, HD Graphics 620, Toshiba SG5 256GB THNSNK256GVN8, IPS, 2160x1440, 12.00 | Getac S410 i5-8550U, UHD Graphics 620, CUKUSA 1 TB SATA SSD Q0526A, TN PED, 1366x768, 14.00 | |
|---|---|---|---|---|---|---|
| Power Consumption | -64% | -1% | -4% | 23% | -12% | |
| Idle Minimum * | 4.4 | 6.8 -55% | 3.33 24% | 3.1 30% | 3.6 18% | 5.6 -27% |
| Idle Average * | 6.3 | 13.4 -113% | 6.9 -10% | 6.5 -3% | 4.6 27% | 7.9 -25% |
| Idle Maximum * | 6.5 | 16.8 -158% | 8.2 -26% | 7.6 -17% | 5.15 21% | 8.4 -29% |
| Load Average * | 36.3 | 35.2 3% | 29.4 19% | 43 -18% | 27 26% | 32.8 10% |
| Load Maximum * | 38.3 | 36.3 5% | 43.4 -13% | 43.8 -14% | 29.2 24% | 34.3 10% |
* ... smaller is better
| Panasonic Toughbook CF-54G2999VM i5-7300U, HD Graphics 620, 33 Wh | Dell Latitude 14 7414 Rugged Extreme 6300U, HD Graphics 520, 97 Wh | Dell Latitude 7490 i7-8650U, UHD Graphics 620, 60 Wh | Panasonic Toughbook CF-33 i5-7300U, HD Graphics 620, 44 Wh | Samsung Notebook 9 NP900X5T-X01US i5-8550U, GeForce MX150, 75 Wh | Getac S410 i5-8550U, UHD Graphics 620, 46.6 Wh | |
|---|---|---|---|---|---|---|
| Battery Runtime | 78% | 59% | 35% | 80% | -11% | |
| WiFi v1.3 | 352 | 628 78% | 561 59% | 475 35% | 635 80% | 312 -11% |
| Reader / Idle | 1116 | 1810 | ||||
| Load | 91 | 127 |
För
Emot

Läs den fullständiga versionen av den här recensionen på engelska här.
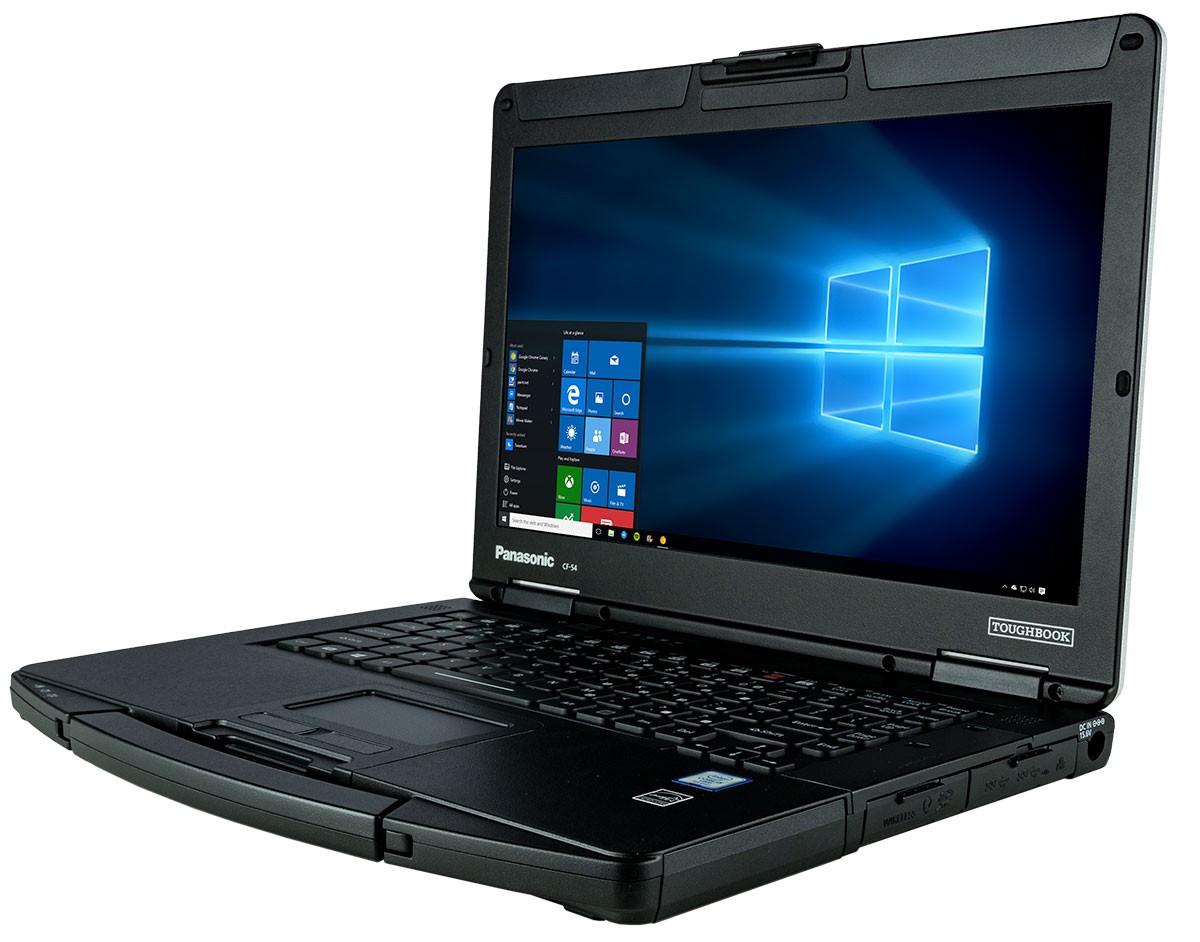
Panasonic erbjuder många olika varianter av Toughbook CF-54 för att den ska passa olika typer av användare. Även om vi inte kan täcka alla kan vi förstås föreslå vilka som bör undvikas och vilka som bör övervägas. I synnerhet bör den som vill använda Toughbook CF-54 utomhus eller i bilen definitivt investera i 1080p-skärmen med en bakgrundsbelysning på 1000 nit. Utan den kommer skärmen vara för mörk i de flesta situationer.
Dessutom, om grafikprestandan inte är av vikt, bör konfigurationen med Core i5-7300U vara tillräcklig då vinsten av att välja i7-7600U framför i5-7300U är minimal. Det är bättre att investera pengarna man sparar på detta i en primär SSD-enhet, vilket ger en tydligare prestandaökning.
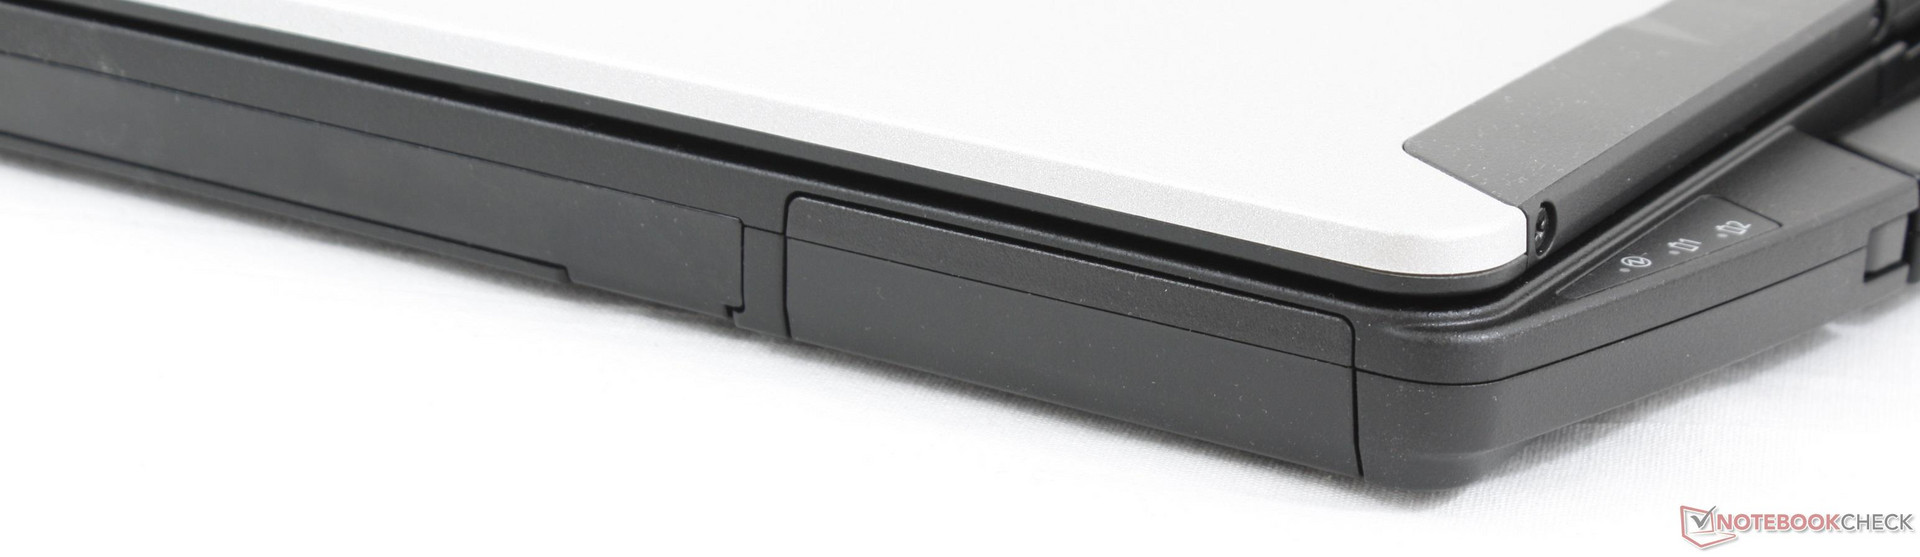
För framtida revideringar hoppas vi på att se alternativ för 8:e generationens Intel-processorer då de äldre generationerna börjar kännas gamla. Bättre placeringar av portarna, jämnare förändringar i fläktens ljudnivå, starkare interna högtalare och hjälpknappar som går att ställa in hade också bidragit till att göra detta till en mer mångsidig maskin.
Panasonic Toughbook CF-54G2999VM
-
10/05/2018 v6(old)
Allen Ngo
Pricecompare
