Trigkey Speed S recension: Färdiga Core i5-11320H minidator för billiga pengar
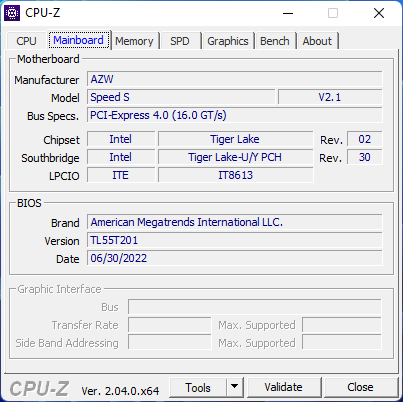
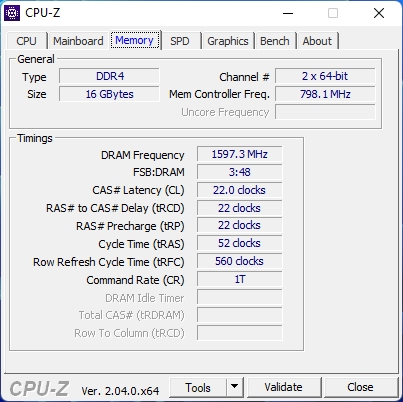
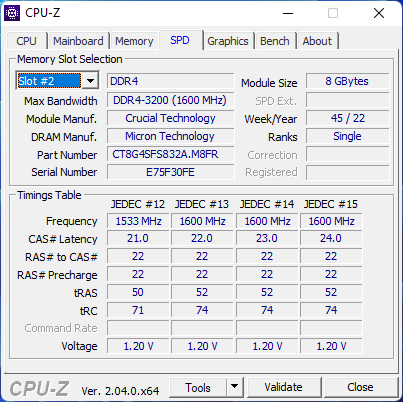
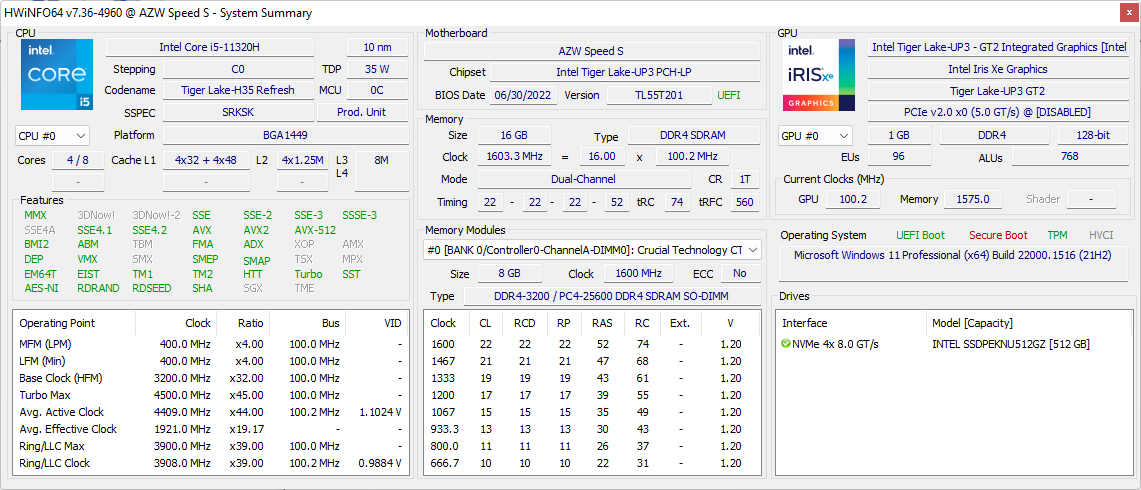
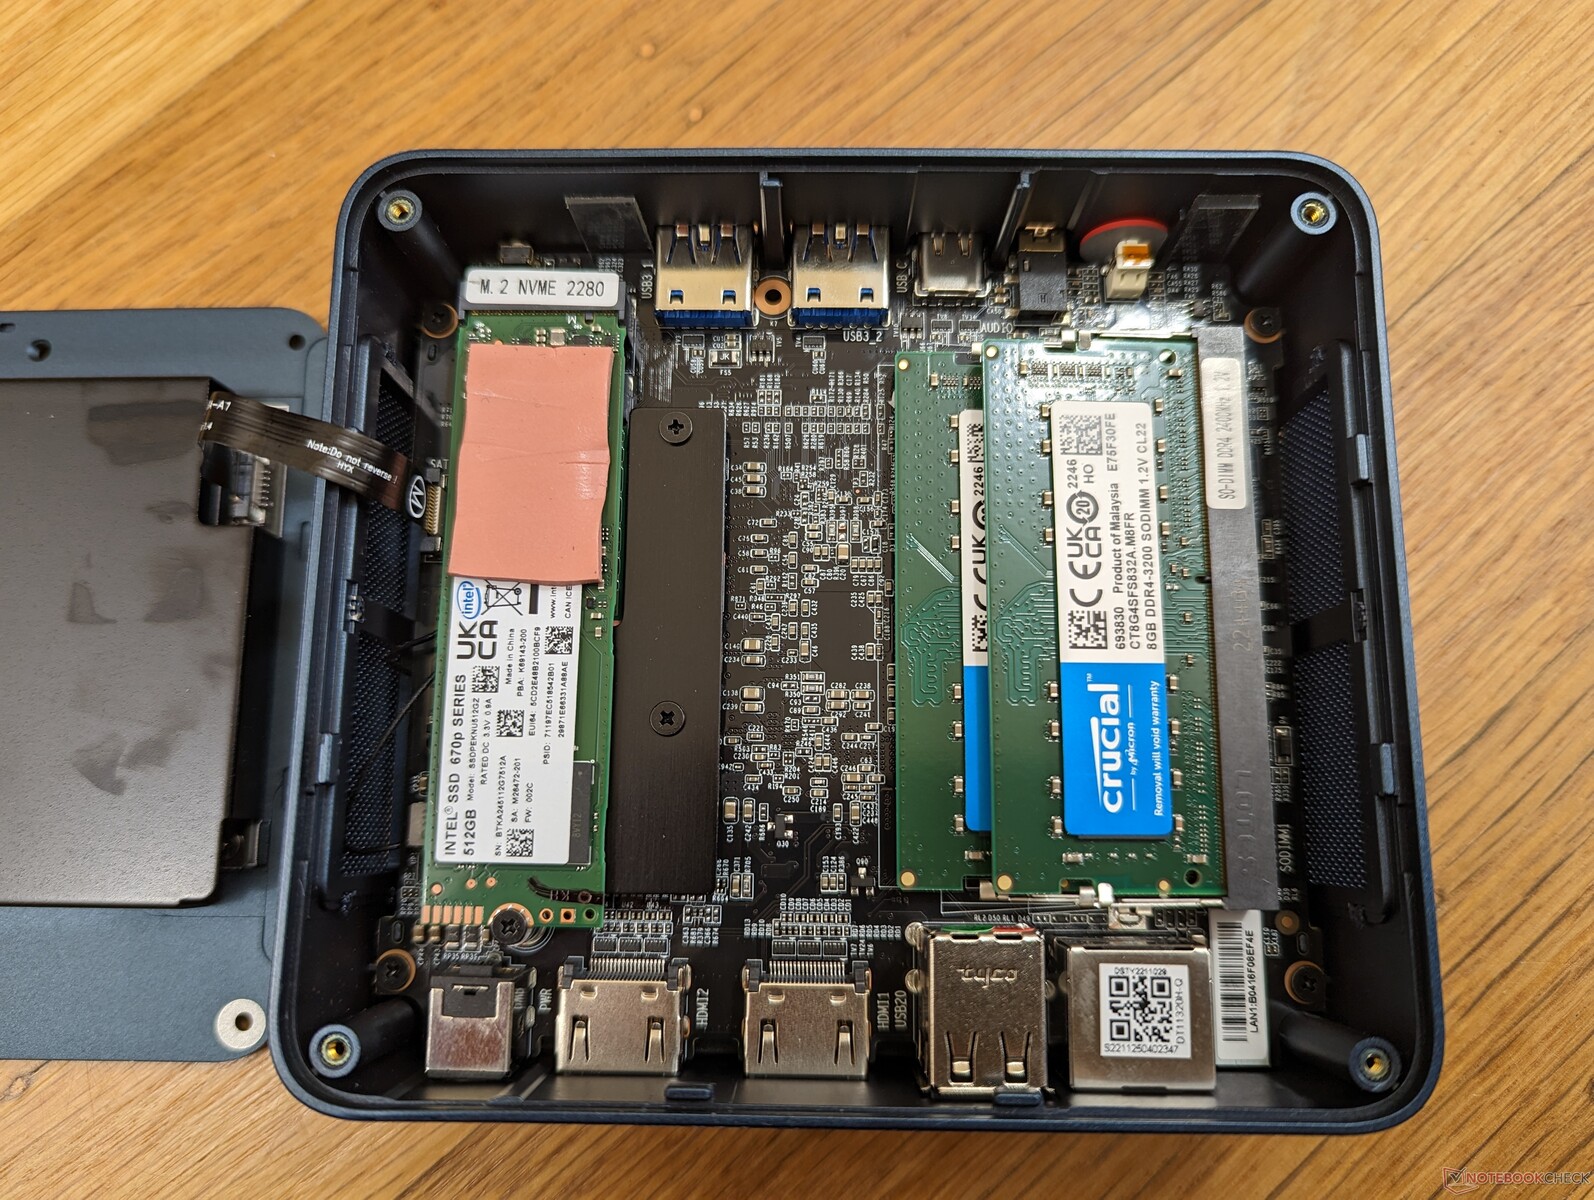
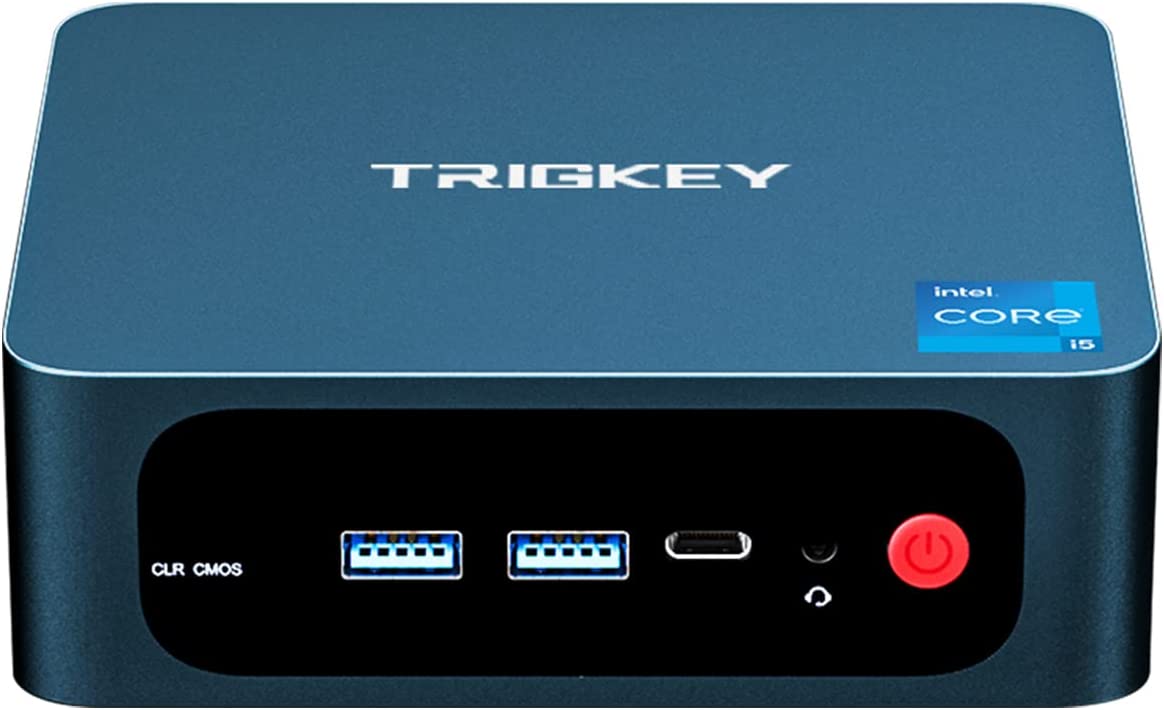
Trigkey Speed S är den snabbare versionen av Trigkey S3. Istället för den åldrande Ryzen 5 3550Hanvänder Speed S den 11:e generationens Core i5-11320H samtidigt som priserna hålls inom det mycket överkomliga intervallet under 400 USD. Vår specifika granskningskonfiguration levereras med 16 GB DDR4-3200 RAM och en 512 GB M.2 PCIe3 x4 SSD.
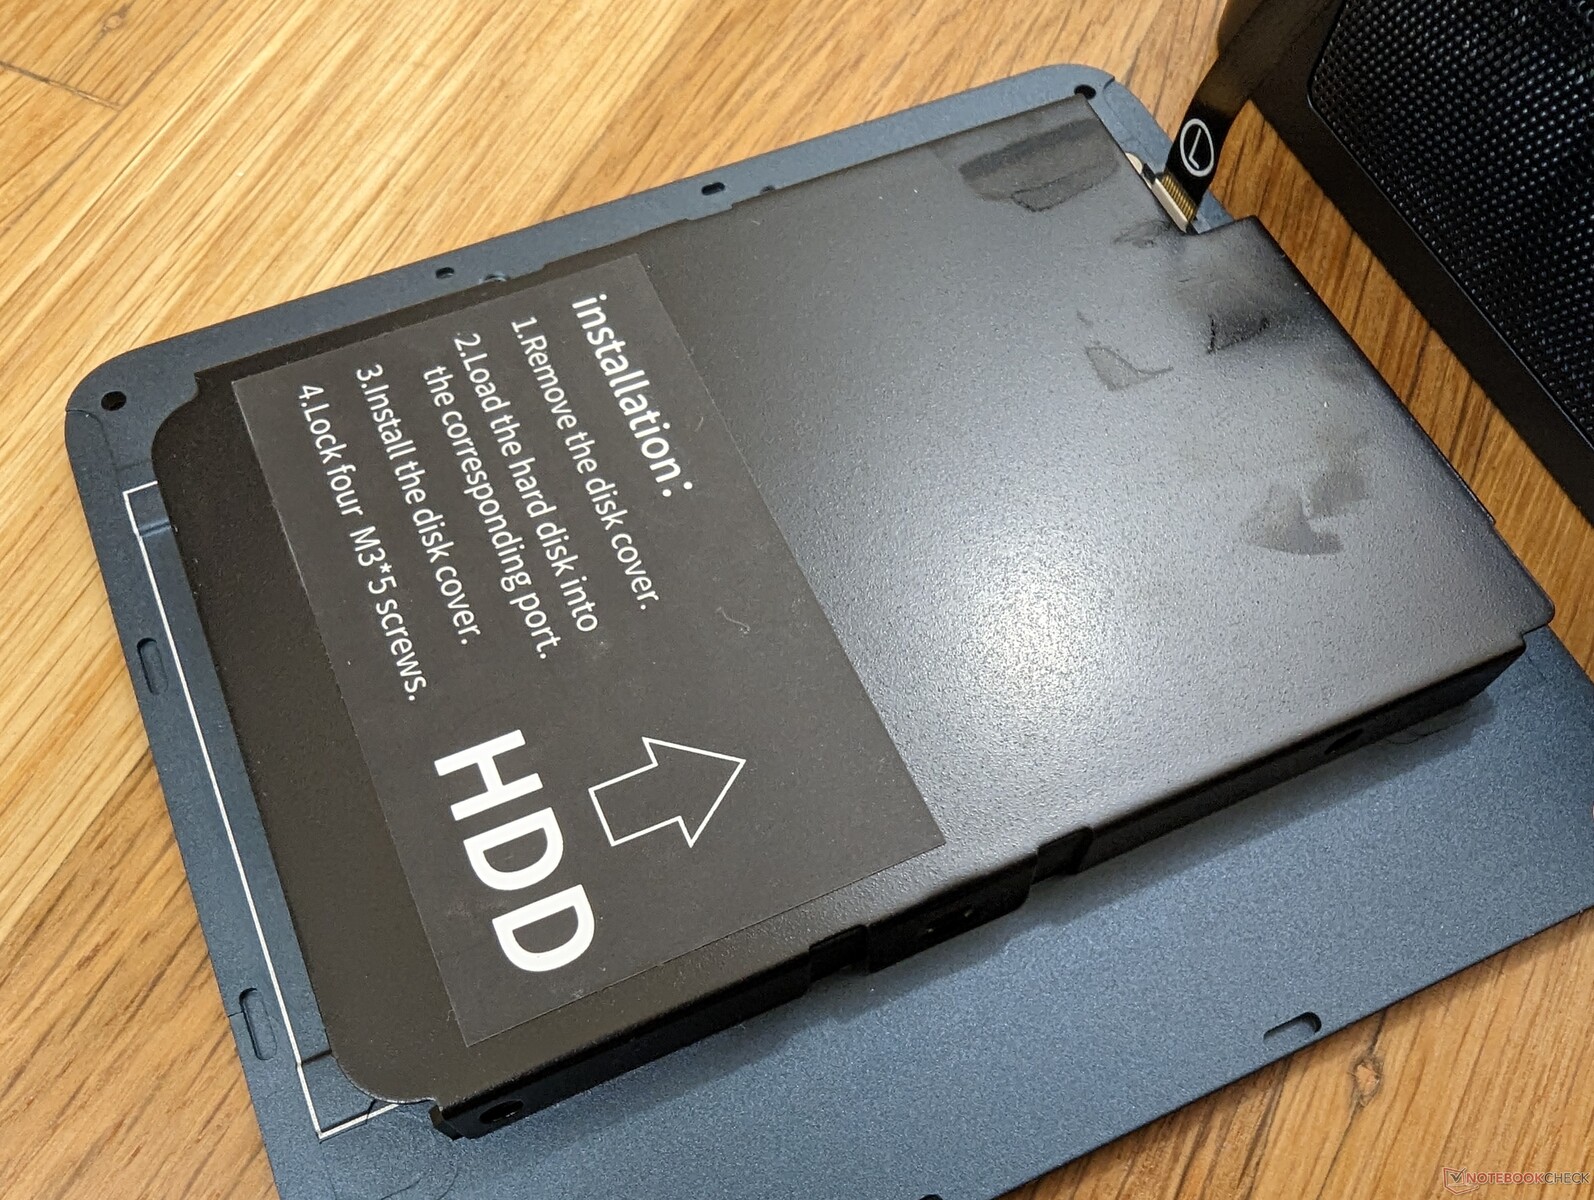
Förutom ovanstående skillnader delar Speed S samma chassidesign och funktioner som S3 och vi rekommenderar därför att du kollar in vår befintliga recension av S3 för att lära dig mer om de fysiska funktionerna i serien. Den här recensionen kommer att visa vilka prestandafördelar användare kan förvänta sig mellan de två modellerna.
Alternativ till Speed S inkluderar andra budgetorienterade minidatorer som t.ex BMax B5 Pro och Beelink SEi eller SER-serien.
Fler recensioner av Trigkey:
Potentiella konkurrenter i jämförelse
Gradering | Datum | Modell | Vikt | Höjd | Storlek | Upplösning | Pris |
|---|---|---|---|---|---|---|---|
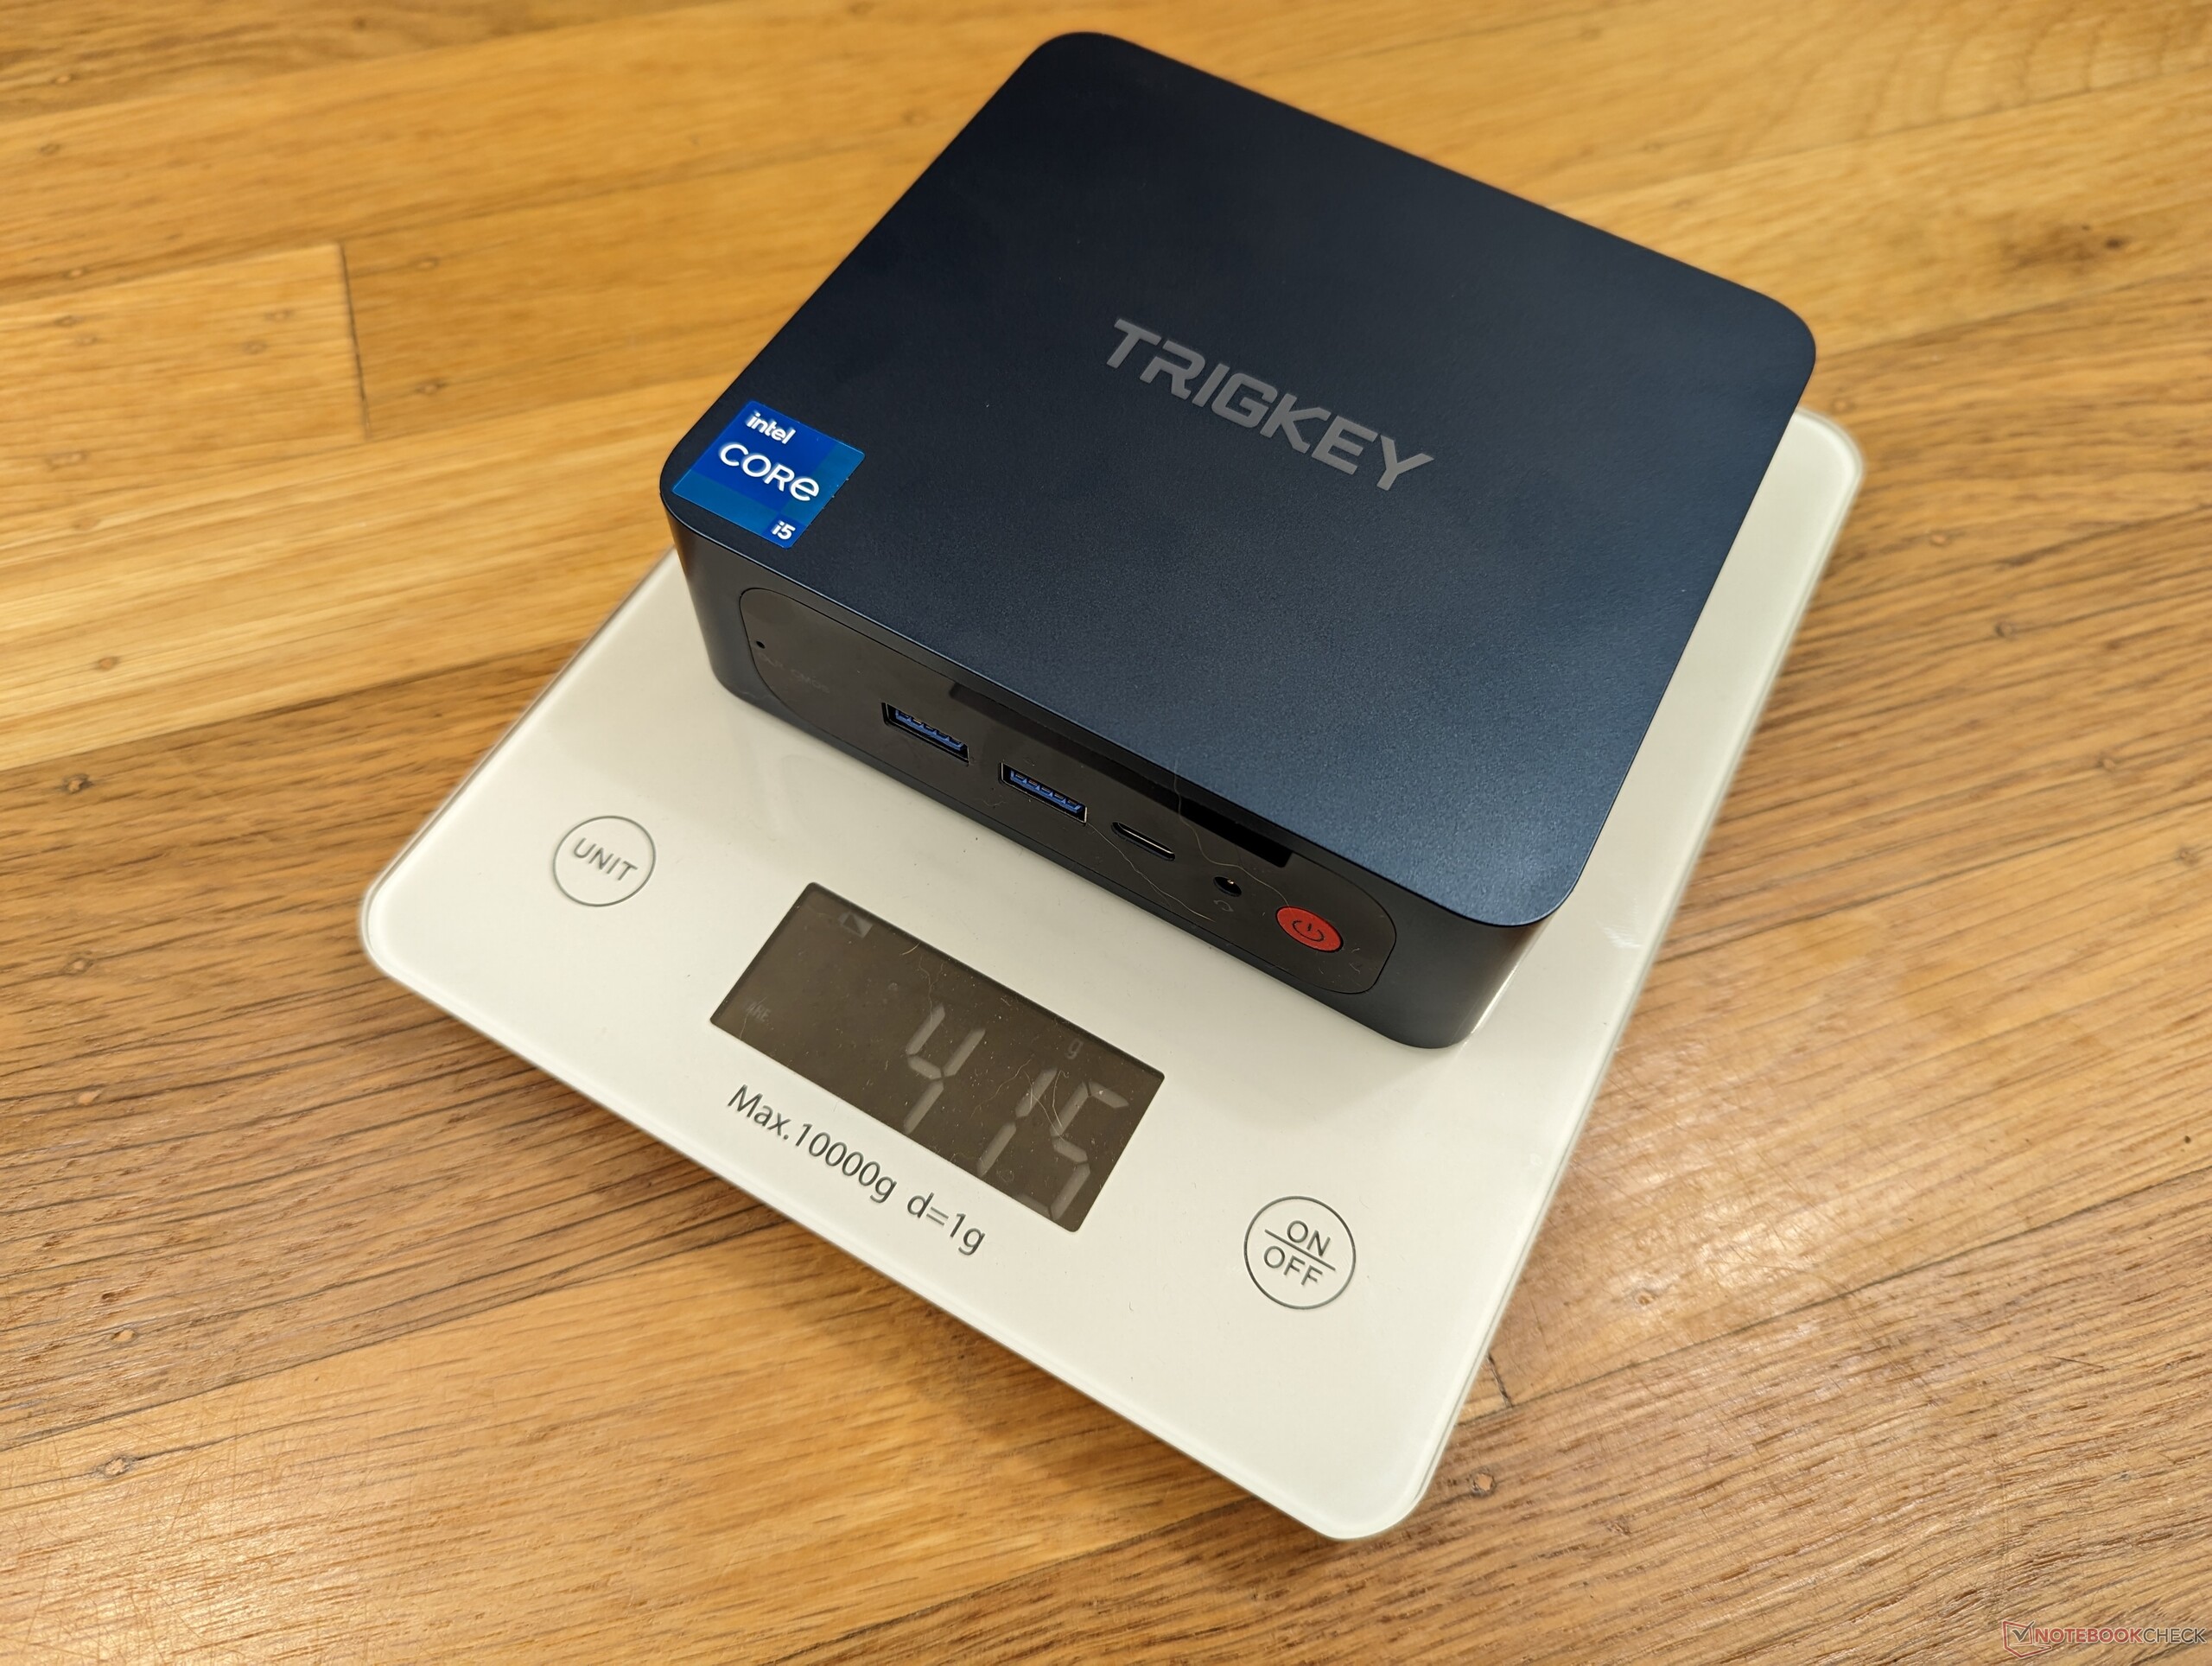
v (old) | 03/2023 | Trigkey Speed S i5-11320H, Iris Xe G7 96EUs | 415 g | 40.7 mm | x | ||
v (old) | 01/2023 | Trigkey S3 R5 3550H, Vega 8 | 419 g | 40.7 mm | x | ||
v (old) | 12/2022 | Beelink SEi12 Core i5-1235U i5-1235U, Iris Xe G7 80EUs | 465 g | 42 mm | x | ||
v (old) | 10/2022 | Beelink SER Pro Ryzen 5 5600H R5 5600H, Vega 7 | 498 g | 42 mm | x | ||
| 78.9 % v7 (old) | 11/2022 | Intel NUC 12 Pro Kit NUC12WSKi7 i7-1260P, Iris Xe G7 96EUs | 511 g | 37 mm | x | ||
v (old) | 11/2022 | BMAX B5 Pro G7H8 i5-8260U, UHD Graphics 620 | 369 g | 43.2 mm | x |
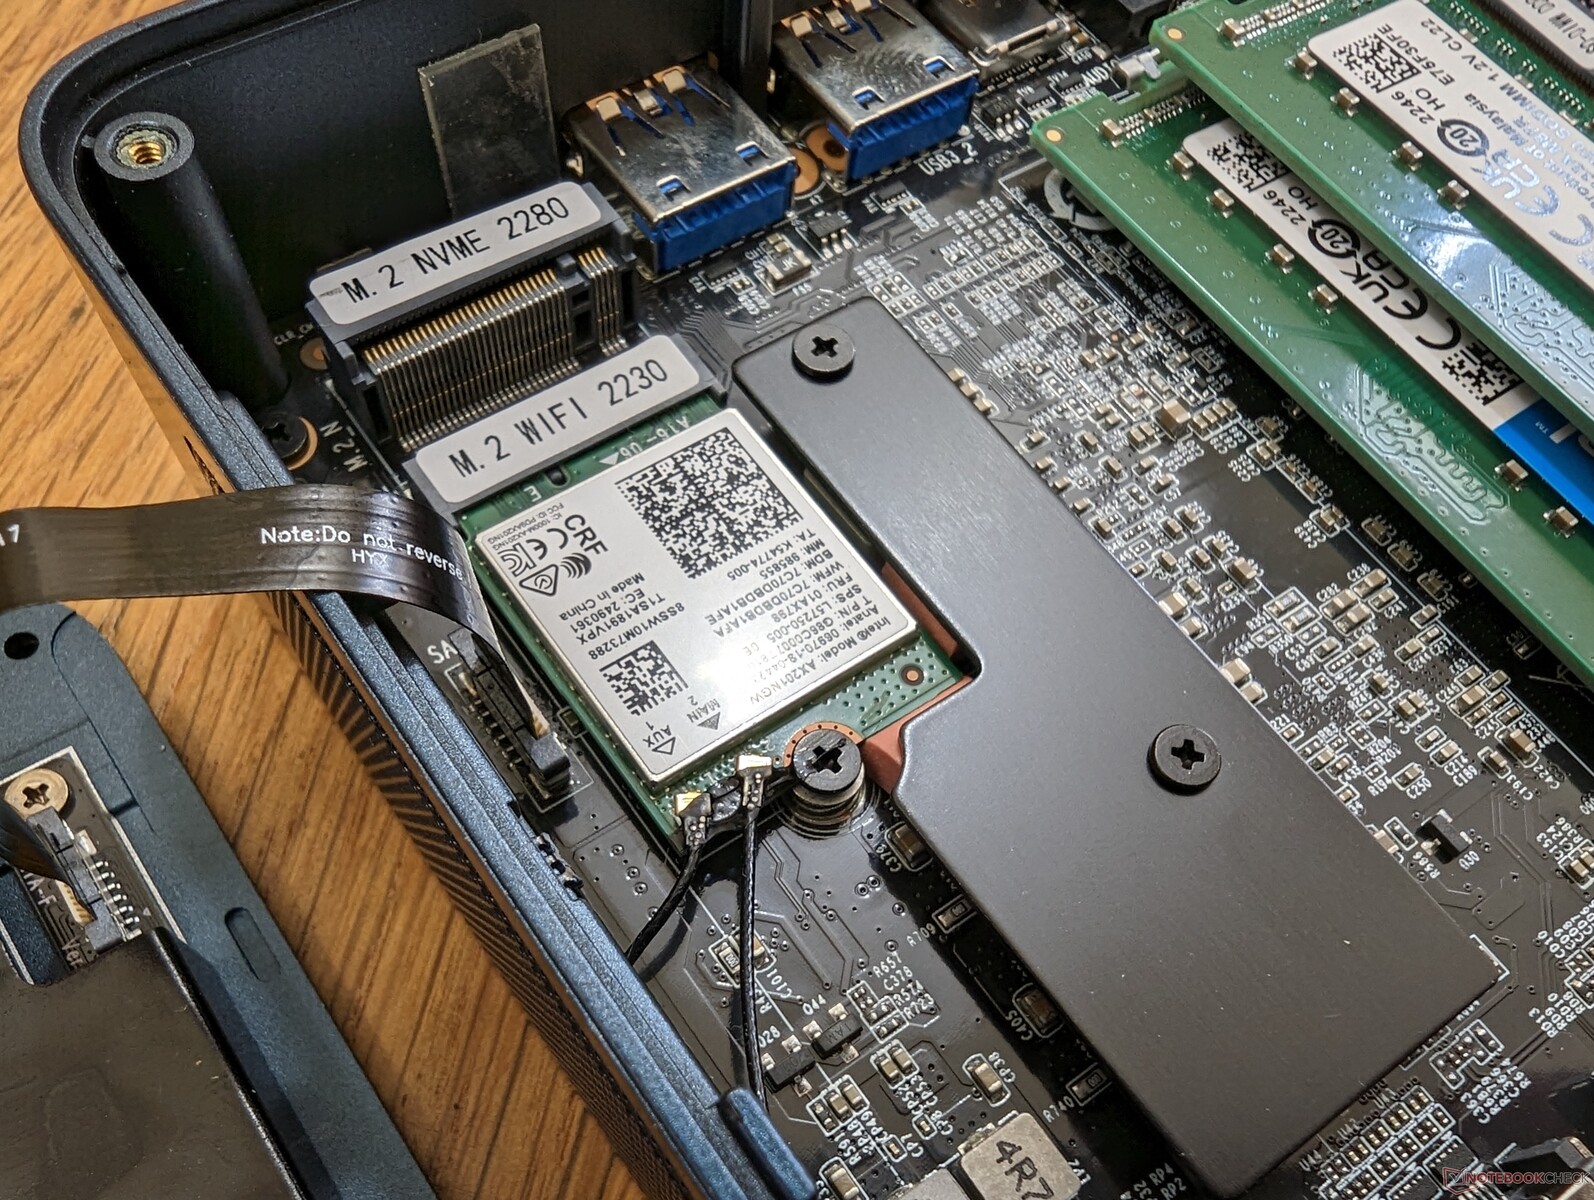
Fall
Kommunikation
Den trådlösa prestandan fluktuerar mer än förväntat, vilket framgår av diagrammet nedan, även efter flera försök. Den är dock tillräckligt snabb för 4K-videoströmning.
Intel AX201 har inte stöd för Wi-Fi 6E.
| Networking | |
| iperf3 transmit AXE11000 | |
| Beelink SEi12 Core i5-1235U | |
| Trigkey Speed S | |
| BMAX B5 Pro G7H8 | |
| Trigkey S3 | |
| iperf3 receive AXE11000 | |
| Beelink SEi12 Core i5-1235U | |
| Trigkey Speed S | |
| BMAX B5 Pro G7H8 | |
| Trigkey S3 | |
| iperf3 transmit AXE11000 6GHz | |
| Intel NUC 12 Pro Kit NUC12WSKi7 | |
| Beelink SER Pro Ryzen 5 5600H | |
| iperf3 receive AXE11000 6GHz | |
| Intel NUC 12 Pro Kit NUC12WSKi7 | |
| Beelink SER Pro Ryzen 5 5600H | |
Prestanda
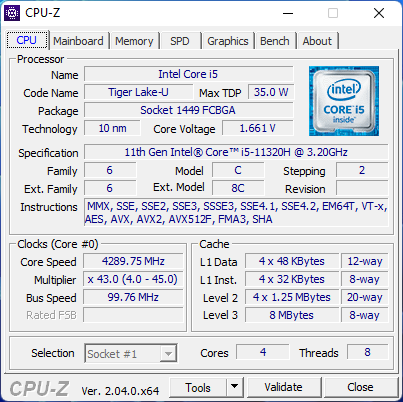
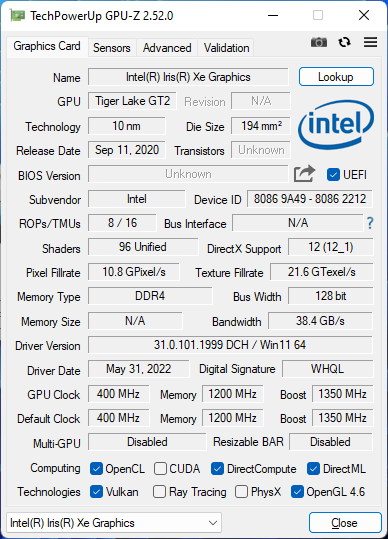
Processor - Core i5-11320H
Cinebench R15 Multi Loop
Cinebench R23: Multi Core | Single Core
Cinebench R20: CPU (Multi Core) | CPU (Single Core)
Cinebench R15: CPU Multi 64Bit | CPU Single 64Bit
Blender: v2.79 BMW27 CPU
7-Zip 18.03: 7z b 4 | 7z b 4 -mmt1
Geekbench 5.5: Multi-Core | Single-Core
HWBOT x265 Benchmark v2.2: 4k Preset
LibreOffice : 20 Documents To PDF
R Benchmark 2.5: Overall mean
| CPU Performance rating | |
| Intel NUC 12 Pro Kit NUC12WSKi7 | |
| Beelink SEi12 Core i5-1235U | |
| Beelink SER Pro Ryzen 5 5600H | |
| Genomsnitt Intel Core i5-11320H | |
| Trigkey Speed S | |
| Trigkey S3 | |
| BMAX B5 Pro G7H8 | |
| Cinebench R23 / Multi Core | |
| Intel NUC 12 Pro Kit NUC12WSKi7 | |
| Beelink SEi12 Core i5-1235U | |
| Beelink SER Pro Ryzen 5 5600H | |
| Genomsnitt Intel Core i5-11320H (5720 - 6051, n=4) | |
| Trigkey Speed S | |
| Trigkey S3 | |
| BMAX B5 Pro G7H8 | |
| Cinebench R23 / Single Core | |
| Intel NUC 12 Pro Kit NUC12WSKi7 | |
| Beelink SEi12 Core i5-1235U | |
| Trigkey Speed S | |
| Genomsnitt Intel Core i5-11320H (1341 - 1467, n=4) | |
| Beelink SER Pro Ryzen 5 5600H | |
| Trigkey S3 | |
| BMAX B5 Pro G7H8 | |
| Cinebench R20 / CPU (Multi Core) | |
| Intel NUC 12 Pro Kit NUC12WSKi7 | |
| Beelink SEi12 Core i5-1235U | |
| Beelink SER Pro Ryzen 5 5600H | |
| Genomsnitt Intel Core i5-11320H (2208 - 2349, n=4) | |
| Trigkey Speed S | |
| BMAX B5 Pro G7H8 | |
| Trigkey S3 | |
| Cinebench R20 / CPU (Single Core) | |
| Intel NUC 12 Pro Kit NUC12WSKi7 | |
| Beelink SEi12 Core i5-1235U | |
| Trigkey Speed S | |
| Genomsnitt Intel Core i5-11320H (557 - 567, n=4) | |
| Beelink SER Pro Ryzen 5 5600H | |
| BMAX B5 Pro G7H8 | |
| Trigkey S3 | |
| Cinebench R15 / CPU Multi 64Bit | |
| Intel NUC 12 Pro Kit NUC12WSKi7 | |
| Beelink SEi12 Core i5-1235U | |
| Beelink SER Pro Ryzen 5 5600H | |
| Genomsnitt Intel Core i5-11320H (857 - 1019, n=4) | |
| Trigkey Speed S | |
| Trigkey S3 | |
| BMAX B5 Pro G7H8 | |
| Cinebench R15 / CPU Single 64Bit | |
| Intel NUC 12 Pro Kit NUC12WSKi7 | |
| Beelink SEi12 Core i5-1235U | |
| Beelink SER Pro Ryzen 5 5600H | |
| Trigkey Speed S | |
| Genomsnitt Intel Core i5-11320H (212 - 215, n=4) | |
| BMAX B5 Pro G7H8 | |
| Trigkey S3 | |
| Blender / v2.79 BMW27 CPU | |
| BMAX B5 Pro G7H8 | |
| Trigkey S3 | |
| Trigkey Speed S | |
| Genomsnitt Intel Core i5-11320H (507 - 543, n=4) | |
| Beelink SEi12 Core i5-1235U | |
| Beelink SER Pro Ryzen 5 5600H | |
| Intel NUC 12 Pro Kit NUC12WSKi7 | |
| 7-Zip 18.03 / 7z b 4 | |
| Intel NUC 12 Pro Kit NUC12WSKi7 | |
| Beelink SER Pro Ryzen 5 5600H | |
| Beelink SEi12 Core i5-1235U | |
| Genomsnitt Intel Core i5-11320H (24718 - 26858, n=4) | |
| Trigkey Speed S | |
| BMAX B5 Pro G7H8 | |
| Trigkey S3 | |
| 7-Zip 18.03 / 7z b 4 -mmt1 | |
| Intel NUC 12 Pro Kit NUC12WSKi7 | |
| Beelink SER Pro Ryzen 5 5600H | |
| Beelink SEi12 Core i5-1235U | |
| Trigkey Speed S | |
| Genomsnitt Intel Core i5-11320H (4813 - 5119, n=4) | |
| BMAX B5 Pro G7H8 | |
| Trigkey S3 | |
| Geekbench 5.5 / Multi-Core | |
| Intel NUC 12 Pro Kit NUC12WSKi7 | |
| Beelink SEi12 Core i5-1235U | |
| Beelink SER Pro Ryzen 5 5600H | |
| Genomsnitt Intel Core i5-11320H (4927 - 5955, n=4) | |
| Trigkey Speed S | |
| Trigkey S3 | |
| BMAX B5 Pro G7H8 | |
| Geekbench 5.5 / Single-Core | |
| Intel NUC 12 Pro Kit NUC12WSKi7 | |
| Beelink SEi12 Core i5-1235U | |
| Trigkey Speed S | |
| Genomsnitt Intel Core i5-11320H (1453 - 1523, n=4) | |
| Beelink SER Pro Ryzen 5 5600H | |
| Trigkey S3 | |
| BMAX B5 Pro G7H8 | |
| HWBOT x265 Benchmark v2.2 / 4k Preset | |
| Intel NUC 12 Pro Kit NUC12WSKi7 | |
| Beelink SER Pro Ryzen 5 5600H | |
| Beelink SEi12 Core i5-1235U | |
| Genomsnitt Intel Core i5-11320H (7.25 - 7.91, n=4) | |
| Trigkey Speed S | |
| Trigkey S3 | |
| BMAX B5 Pro G7H8 | |
| LibreOffice / 20 Documents To PDF | |
| BMAX B5 Pro G7H8 | |
| Trigkey S3 | |
| Beelink SER Pro Ryzen 5 5600H | |
| Beelink SEi12 Core i5-1235U | |
| Genomsnitt Intel Core i5-11320H (44 - 50, n=4) | |
| Intel NUC 12 Pro Kit NUC12WSKi7 | |
| Trigkey Speed S | |
| R Benchmark 2.5 / Overall mean | |
| BMAX B5 Pro G7H8 | |
| Trigkey S3 | |
| Genomsnitt Intel Core i5-11320H (0.581 - 0.622, n=4) | |
| Trigkey Speed S | |
| Beelink SER Pro Ryzen 5 5600H | |
| Beelink SEi12 Core i5-1235U | |
| Intel NUC 12 Pro Kit NUC12WSKi7 | |
* ... mindre är bättre
| Blender | |
| v3.3 Classroom HIP/AMD | |
| Trigkey S3 | |
| v3.3 Classroom CPU | |
| BMAX B5 Pro G7H8 | |
| Trigkey S3 | |
| Trigkey Speed S | |
| Beelink SEi12 Core i5-1235U | |
| Genomsnitt Intel Iris Xe Graphics G7 96EUs (336 - 1259, n=109) | |
| Beelink SER Pro Ryzen 5 5600H | |
| Intel NUC 12 Pro Kit NUC12WSKi7 | |
* ... mindre är bättre
AIDA64: FP32 Ray-Trace | FPU Julia | CPU SHA3 | CPU Queen | FPU SinJulia | FPU Mandel | CPU AES | CPU ZLib | FP64 Ray-Trace | CPU PhotoWorxx
| Performance rating | |
| Intel NUC 12 Pro Kit NUC12WSKi7 | |
| Beelink SER Pro Ryzen 5 5600H | |
| Beelink SEi12 Core i5-1235U | |
| Genomsnitt Intel Core i5-11320H | |
| Trigkey Speed S | |
| BMAX B5 Pro G7H8 | |
| Trigkey S3 | |
| AIDA64 / FP32 Ray-Trace | |
| Intel NUC 12 Pro Kit NUC12WSKi7 | |
| Beelink SER Pro Ryzen 5 5600H | |
| Trigkey Speed S | |
| Genomsnitt Intel Core i5-11320H (6369 - 7489, n=4) | |
| Beelink SEi12 Core i5-1235U | |
| BMAX B5 Pro G7H8 | |
| Trigkey S3 | |
| AIDA64 / FPU Julia | |
| Beelink SER Pro Ryzen 5 5600H | |
| Intel NUC 12 Pro Kit NUC12WSKi7 | |
| Beelink SEi12 Core i5-1235U | |
| Trigkey Speed S | |
| Genomsnitt Intel Core i5-11320H (27391 - 31637, n=4) | |
| BMAX B5 Pro G7H8 | |
| Trigkey S3 | |
| AIDA64 / CPU SHA3 | |
| Intel NUC 12 Pro Kit NUC12WSKi7 | |
| Beelink SER Pro Ryzen 5 5600H | |
| Trigkey Speed S | |
| Genomsnitt Intel Core i5-11320H (1847 - 2099, n=4) | |
| Beelink SEi12 Core i5-1235U | |
| BMAX B5 Pro G7H8 | |
| Trigkey S3 | |
| AIDA64 / CPU Queen | |
| Intel NUC 12 Pro Kit NUC12WSKi7 | |
| Beelink SER Pro Ryzen 5 5600H | |
| Beelink SEi12 Core i5-1235U | |
| Trigkey Speed S | |
| Genomsnitt Intel Core i5-11320H (43565 - 52477, n=4) | |
| BMAX B5 Pro G7H8 | |
| Trigkey S3 | |
| AIDA64 / FPU SinJulia | |
| Beelink SER Pro Ryzen 5 5600H | |
| Intel NUC 12 Pro Kit NUC12WSKi7 | |
| Trigkey S3 | |
| Trigkey Speed S | |
| Genomsnitt Intel Core i5-11320H (4381 - 5011, n=4) | |
| Beelink SEi12 Core i5-1235U | |
| BMAX B5 Pro G7H8 | |
| AIDA64 / FPU Mandel | |
| Beelink SER Pro Ryzen 5 5600H | |
| Intel NUC 12 Pro Kit NUC12WSKi7 | |
| Trigkey Speed S | |
| Genomsnitt Intel Core i5-11320H (16659 - 18770, n=4) | |
| Beelink SEi12 Core i5-1235U | |
| BMAX B5 Pro G7H8 | |
| Trigkey S3 | |
| AIDA64 / CPU AES | |
| Intel NUC 12 Pro Kit NUC12WSKi7 | |
| Beelink SER Pro Ryzen 5 5600H | |
| Trigkey Speed S | |
| Genomsnitt Intel Core i5-11320H (59851 - 76500, n=4) | |
| Beelink SEi12 Core i5-1235U | |
| Trigkey S3 | |
| BMAX B5 Pro G7H8 | |
| AIDA64 / CPU ZLib | |
| Intel NUC 12 Pro Kit NUC12WSKi7 | |
| Beelink SEi12 Core i5-1235U | |
| Beelink SER Pro Ryzen 5 5600H | |
| Genomsnitt Intel Core i5-11320H (330 - 410, n=4) | |
| Trigkey Speed S | |
| Trigkey S3 | |
| BMAX B5 Pro G7H8 | |
| AIDA64 / FP64 Ray-Trace | |
| Intel NUC 12 Pro Kit NUC12WSKi7 | |
| Beelink SER Pro Ryzen 5 5600H | |
| Genomsnitt Intel Core i5-11320H (3536 - 4021, n=4) | |
| Trigkey Speed S | |
| Beelink SEi12 Core i5-1235U | |
| BMAX B5 Pro G7H8 | |
| Trigkey S3 | |
| AIDA64 / CPU PhotoWorxx | |
| Genomsnitt Intel Core i5-11320H (25964 - 36644, n=4) | |
| Beelink SEi12 Core i5-1235U | |
| Intel NUC 12 Pro Kit NUC12WSKi7 | |
| Trigkey Speed S | |
| Beelink SER Pro Ryzen 5 5600H | |
| BMAX B5 Pro G7H8 | |
| Trigkey S3 | |
Systemets prestanda
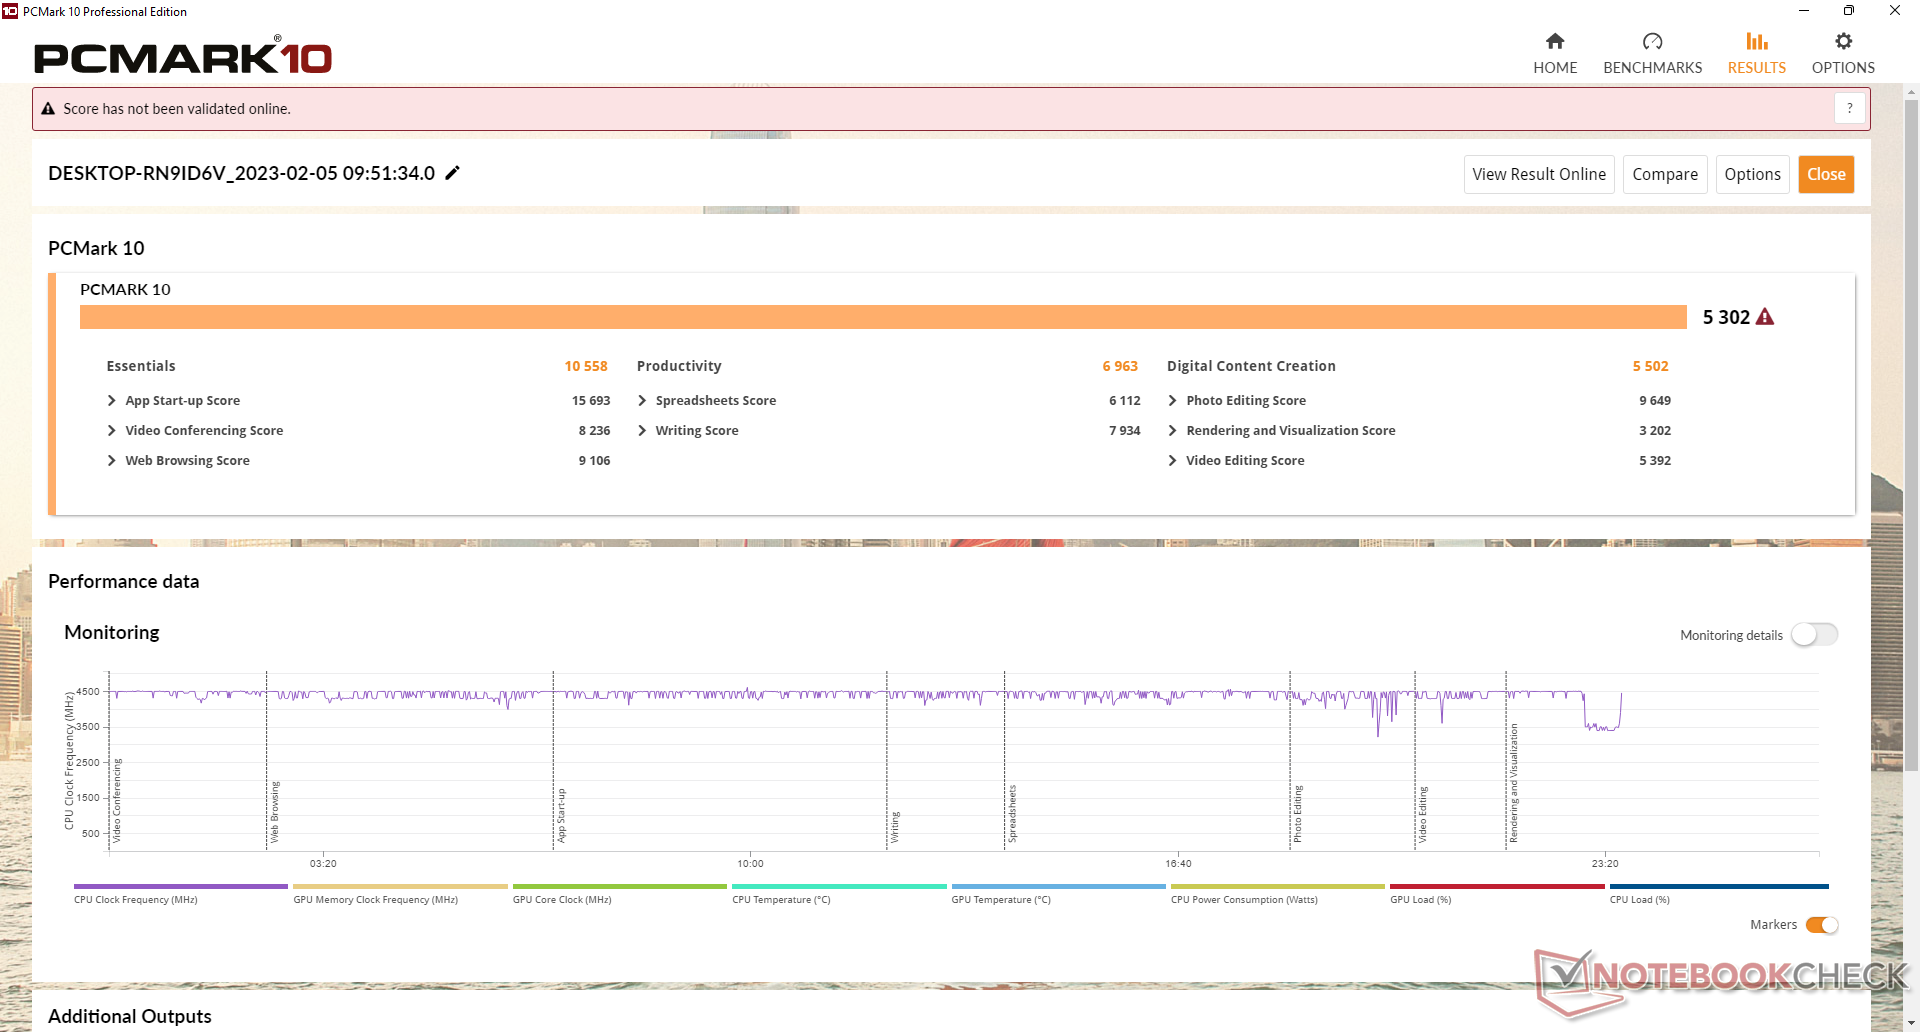
CrossMark: Overall | Productivity | Creativity | Responsiveness
| PCMark 10 / Score | |
| Intel NUC 12 Pro Kit NUC12WSKi7 | |
| Beelink SER Pro Ryzen 5 5600H | |
| Beelink SEi12 Core i5-1235U | |
| Trigkey Speed S | |
| Genomsnitt Intel Core i5-11320H, Intel Iris Xe Graphics G7 96EUs (5095 - 5302, n=3) | |
| Trigkey S3 | |
| BMAX B5 Pro G7H8 | |
| PCMark 10 / Essentials | |
| Beelink SEi12 Core i5-1235U | |
| Intel NUC 12 Pro Kit NUC12WSKi7 | |
| Trigkey Speed S | |
| Beelink SER Pro Ryzen 5 5600H | |
| Genomsnitt Intel Core i5-11320H, Intel Iris Xe Graphics G7 96EUs (9556 - 10558, n=3) | |
| BMAX B5 Pro G7H8 | |
| Trigkey S3 | |
| PCMark 10 / Productivity | |
| Beelink SER Pro Ryzen 5 5600H | |
| Intel NUC 12 Pro Kit NUC12WSKi7 | |
| Beelink SEi12 Core i5-1235U | |
| Trigkey Speed S | |
| Genomsnitt Intel Core i5-11320H, Intel Iris Xe Graphics G7 96EUs (6832 - 6963, n=3) | |
| Trigkey S3 | |
| BMAX B5 Pro G7H8 | |
| PCMark 10 / Digital Content Creation | |
| Intel NUC 12 Pro Kit NUC12WSKi7 | |
| Beelink SER Pro Ryzen 5 5600H | |
| Beelink SEi12 Core i5-1235U | |
| Trigkey Speed S | |
| Genomsnitt Intel Core i5-11320H, Intel Iris Xe Graphics G7 96EUs (5048 - 5615, n=3) | |
| Trigkey S3 | |
| BMAX B5 Pro G7H8 | |
| CrossMark / Overall | |
| Intel NUC 12 Pro Kit NUC12WSKi7 | |
| Beelink SEi12 Core i5-1235U | |
| Trigkey Speed S | |
| Genomsnitt Intel Core i5-11320H, Intel Iris Xe Graphics G7 96EUs (1300 - 1371, n=3) | |
| Beelink SER Pro Ryzen 5 5600H | |
| Trigkey S3 | |
| BMAX B5 Pro G7H8 | |
| CrossMark / Productivity | |
| Beelink SEi12 Core i5-1235U | |
| Intel NUC 12 Pro Kit NUC12WSKi7 | |
| Trigkey Speed S | |
| Genomsnitt Intel Core i5-11320H, Intel Iris Xe Graphics G7 96EUs (1376 - 1456, n=3) | |
| Beelink SER Pro Ryzen 5 5600H | |
| Trigkey S3 | |
| BMAX B5 Pro G7H8 | |
| CrossMark / Creativity | |
| Intel NUC 12 Pro Kit NUC12WSKi7 | |
| Beelink SEi12 Core i5-1235U | |
| Beelink SER Pro Ryzen 5 5600H | |
| Trigkey Speed S | |
| Genomsnitt Intel Core i5-11320H, Intel Iris Xe Graphics G7 96EUs (1241 - 1256, n=3) | |
| Trigkey S3 | |
| BMAX B5 Pro G7H8 | |
| CrossMark / Responsiveness | |
| Beelink SEi12 Core i5-1235U | |
| Trigkey Speed S | |
| Intel NUC 12 Pro Kit NUC12WSKi7 | |
| Genomsnitt Intel Core i5-11320H, Intel Iris Xe Graphics G7 96EUs (1260 - 1494, n=3) | |
| Beelink SER Pro Ryzen 5 5600H | |
| BMAX B5 Pro G7H8 | |
| Trigkey S3 | |
| PCMark 10 Score | 5302 poäng | |
Hjälp | ||
| AIDA64 / Memory Copy | |
| Genomsnitt Intel Core i5-11320H (41106 - 55961, n=4) | |
| Intel NUC 12 Pro Kit NUC12WSKi7 | |
| Beelink SEi12 Core i5-1235U | |
| Beelink SER Pro Ryzen 5 5600H | |
| Trigkey Speed S | |
| Trigkey S3 | |
| BMAX B5 Pro G7H8 | |
| AIDA64 / Memory Read | |
| Genomsnitt Intel Core i5-11320H (46516 - 52799, n=4) | |
| Beelink SER Pro Ryzen 5 5600H | |
| Trigkey Speed S | |
| Intel NUC 12 Pro Kit NUC12WSKi7 | |
| Beelink SEi12 Core i5-1235U | |
| Trigkey S3 | |
| BMAX B5 Pro G7H8 | |
| AIDA64 / Memory Write | |
| Genomsnitt Intel Core i5-11320H (46760 - 63323, n=4) | |
| Trigkey Speed S | |
| Beelink SEi12 Core i5-1235U | |
| Intel NUC 12 Pro Kit NUC12WSKi7 | |
| Beelink SER Pro Ryzen 5 5600H | |
| Trigkey S3 | |
| BMAX B5 Pro G7H8 | |
| AIDA64 / Memory Latency | |
| Trigkey S3 | |
| BMAX B5 Pro G7H8 | |
| Intel NUC 12 Pro Kit NUC12WSKi7 | |
| Genomsnitt Intel Core i5-11320H (77.6 - 114.1, n=4) | |
| Beelink SEi12 Core i5-1235U | |
| Beelink SER Pro Ryzen 5 5600H | |
| Trigkey Speed S | |
* ... mindre är bättre
DPC-latenstid
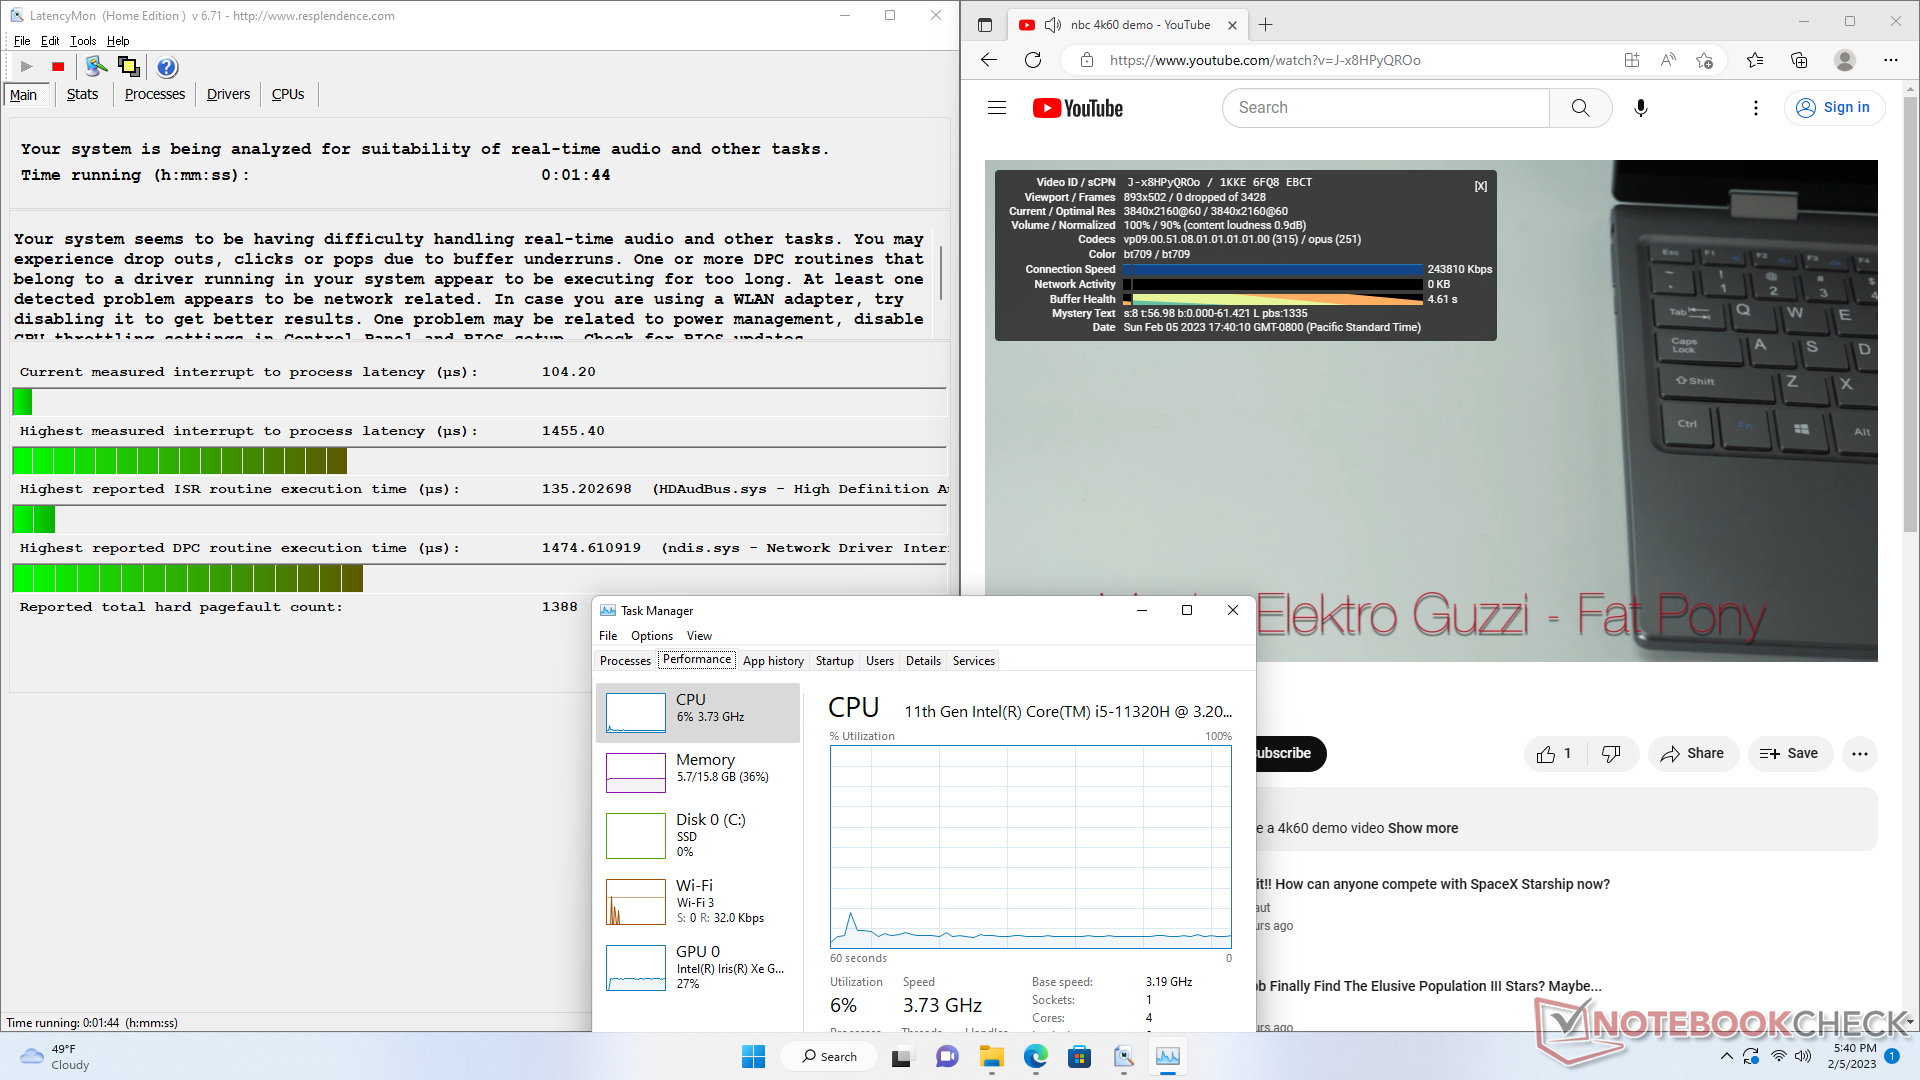
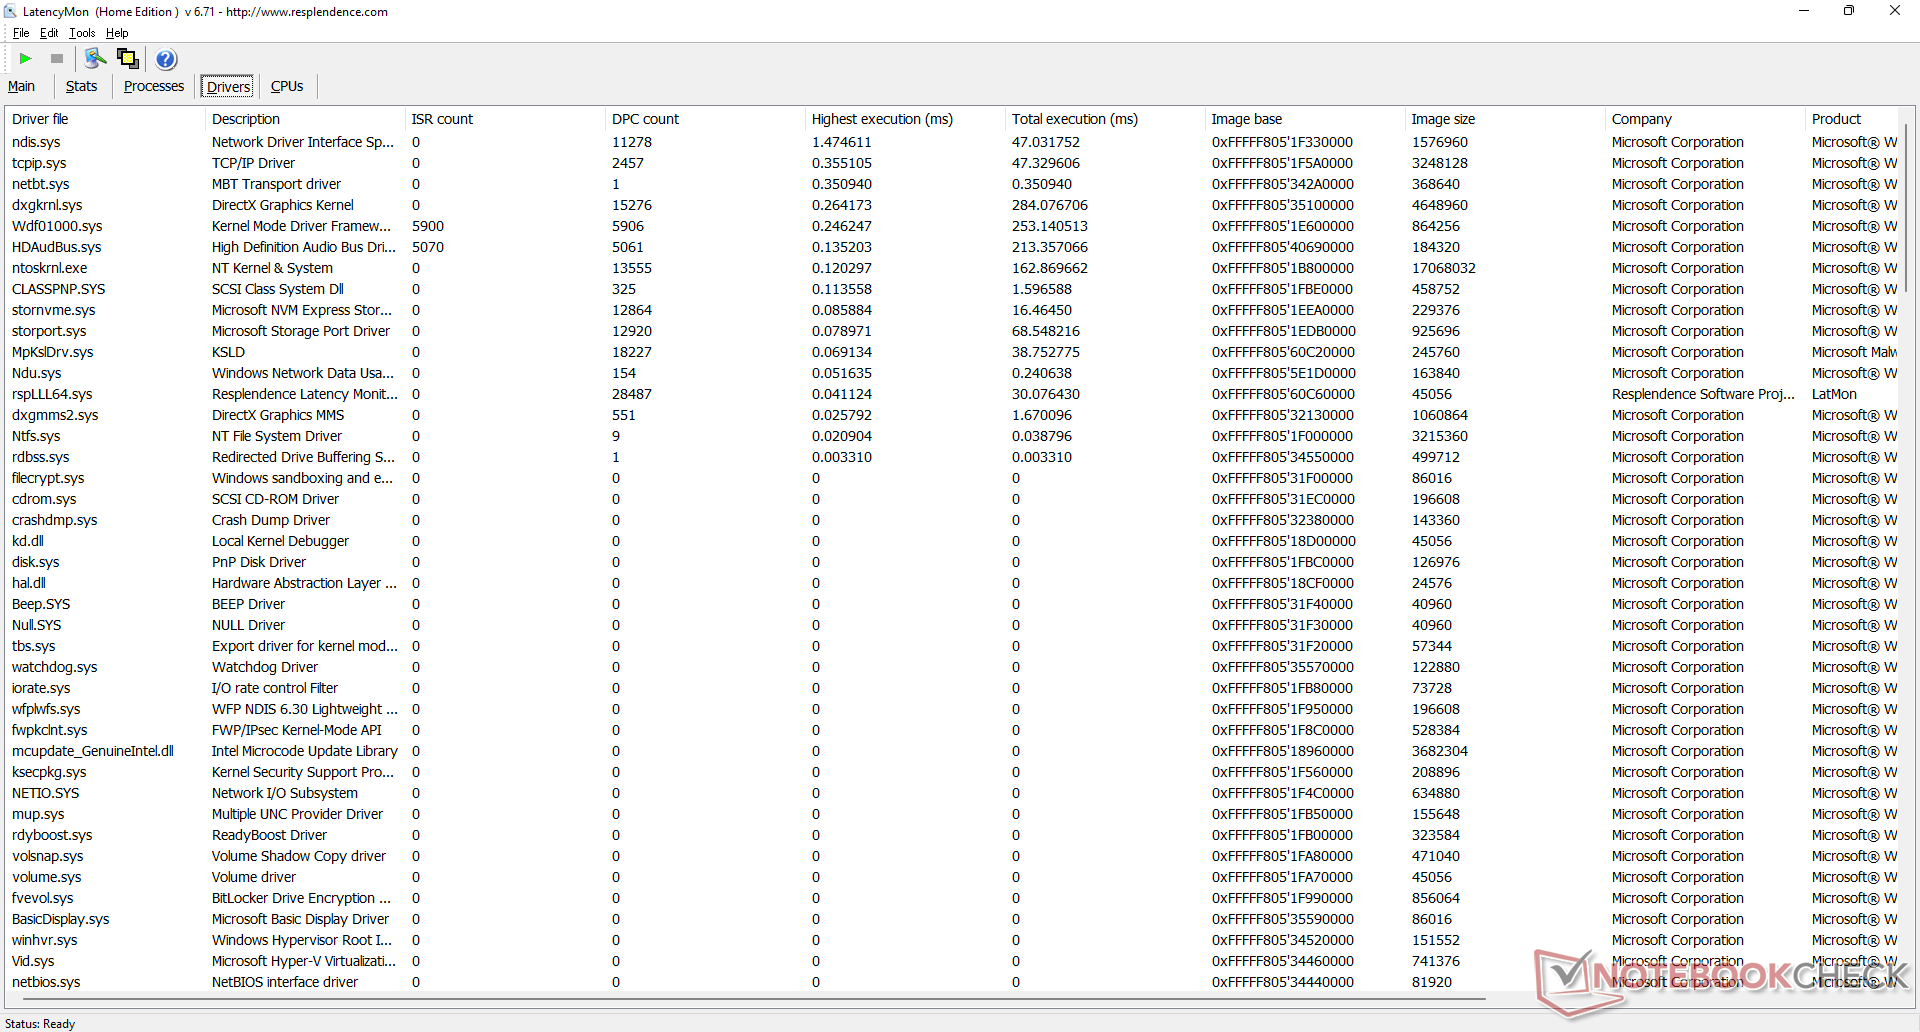
| DPC Latencies / LatencyMon - interrupt to process latency (max), Web, Youtube, Prime95 | |
| Trigkey S3 | |
| Trigkey Speed S | |
| Beelink SEi12 Core i5-1235U | |
| Intel NUC 12 Pro Kit NUC12WSKi7 | |
| Beelink SER Pro Ryzen 5 5600H | |
| BMAX B5 Pro G7H8 | |
* ... mindre är bättre
Lagringsenheter
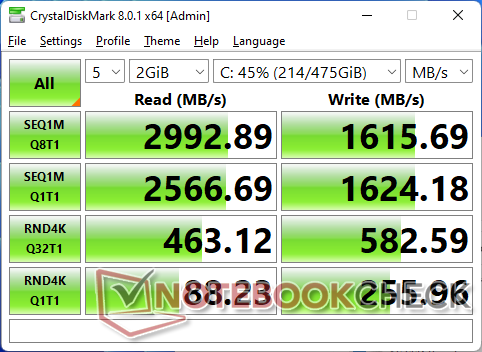
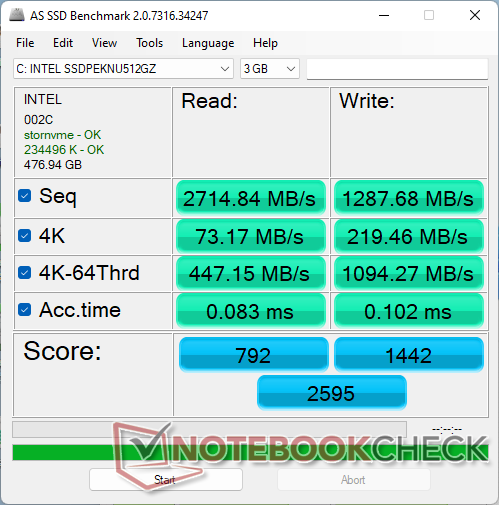

* ... mindre är bättre
Disk Throttling: DiskSpd Read Loop, Queue Depth 8
GPU-prestanda
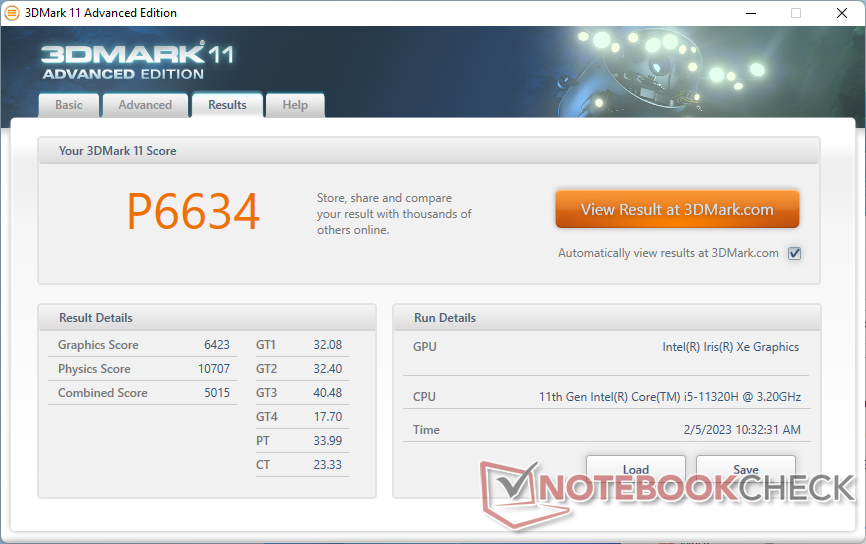
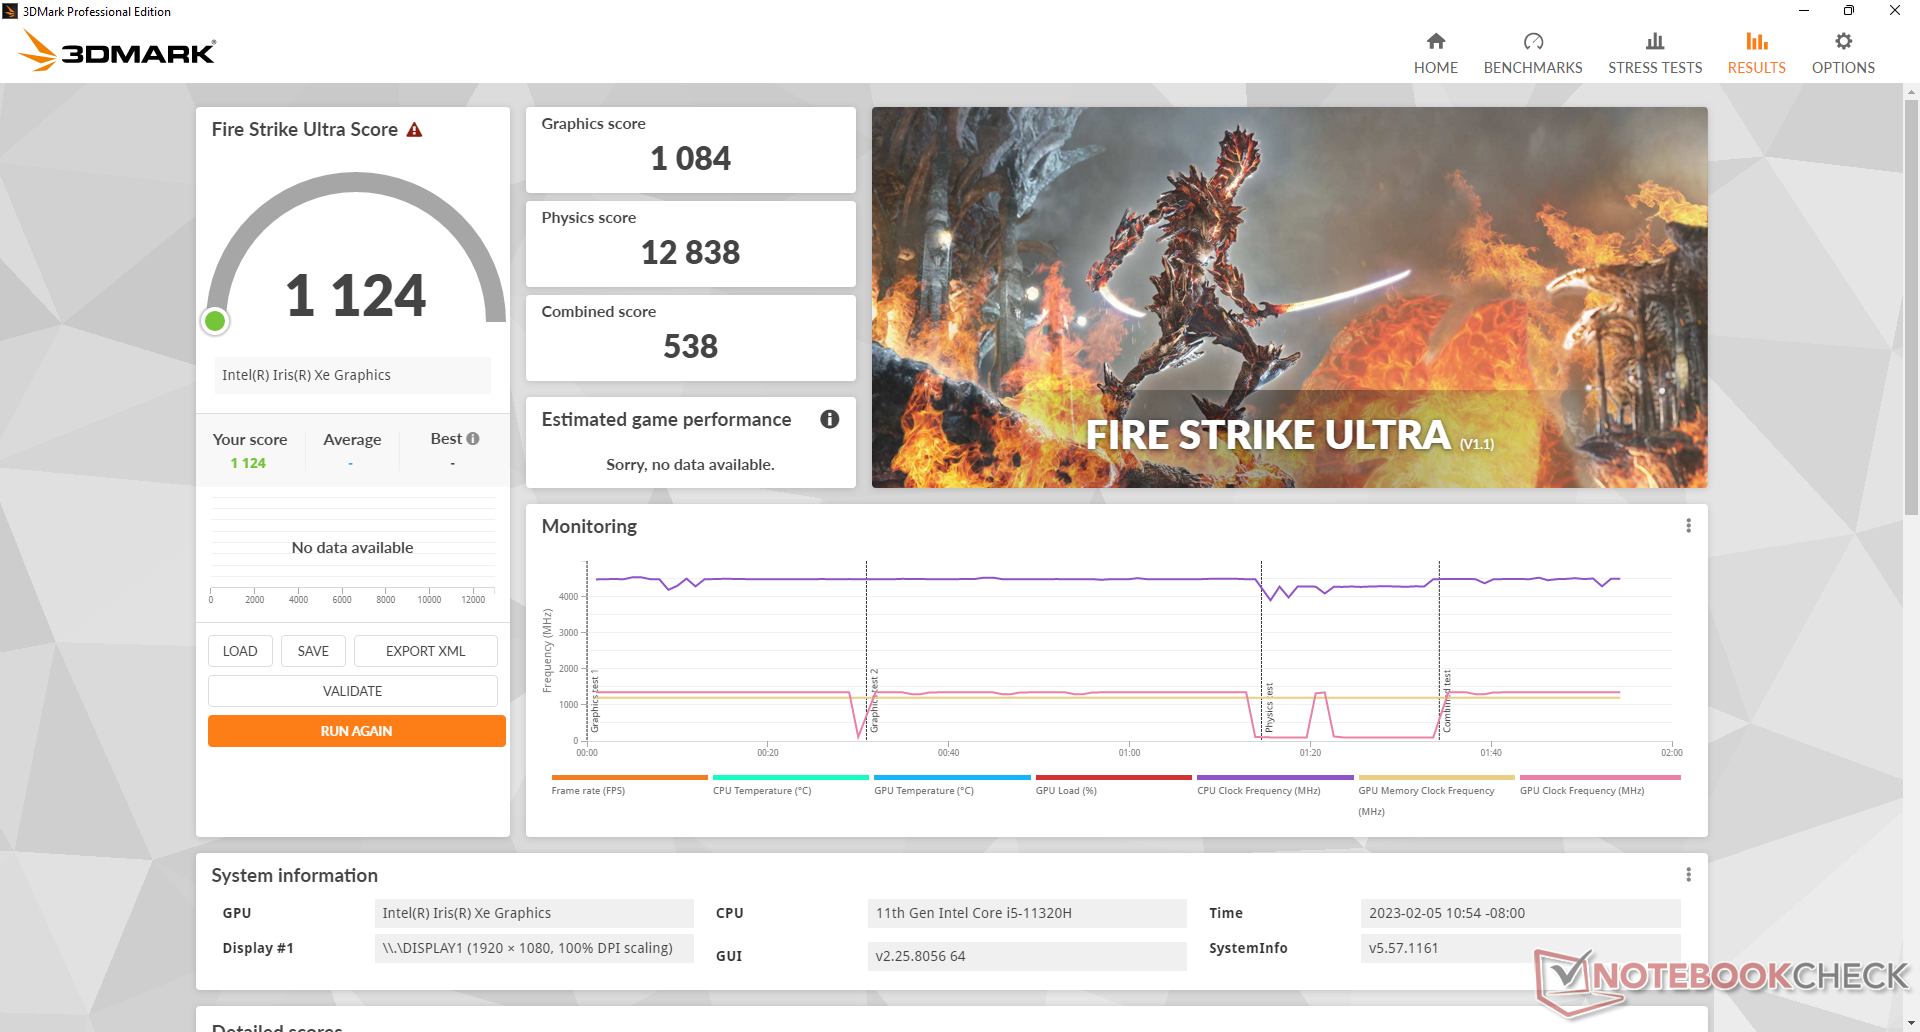
| 3DMark 11 Performance | 6634 poäng | |
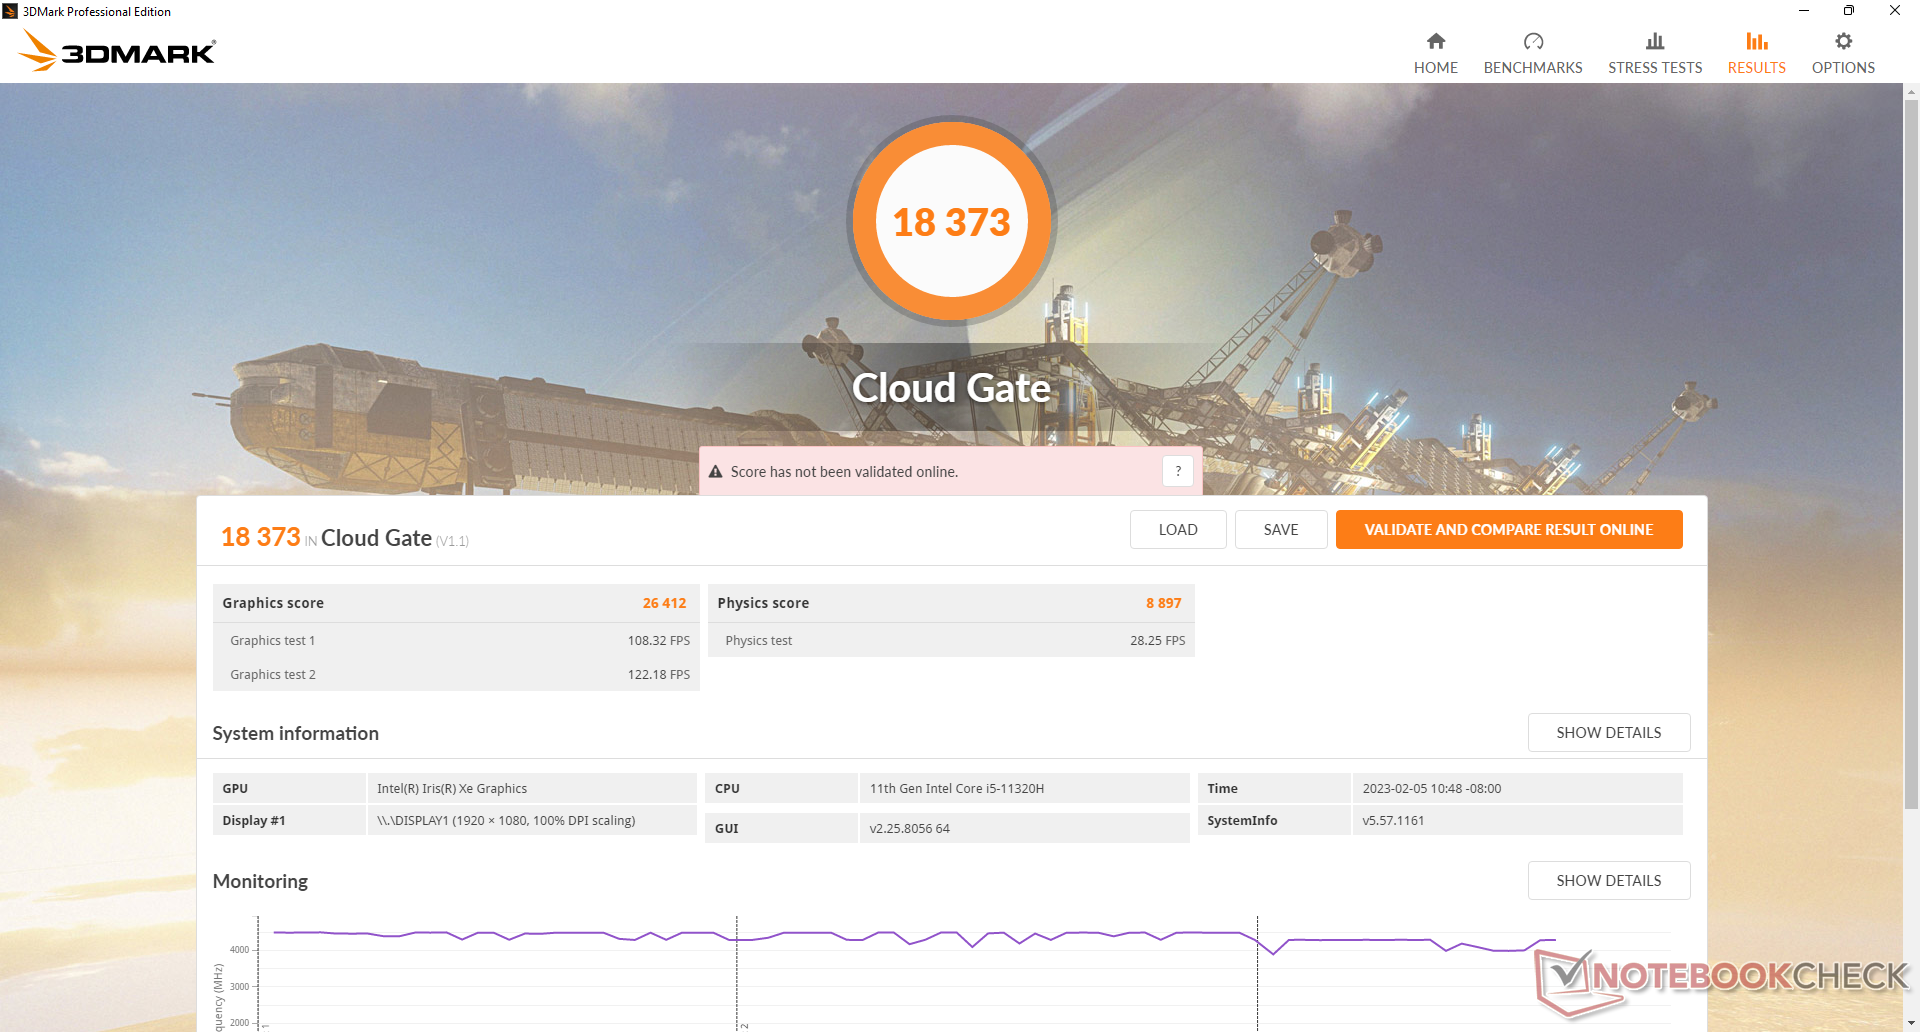
| 3DMark Cloud Gate Standard Score | 18373 poäng | |
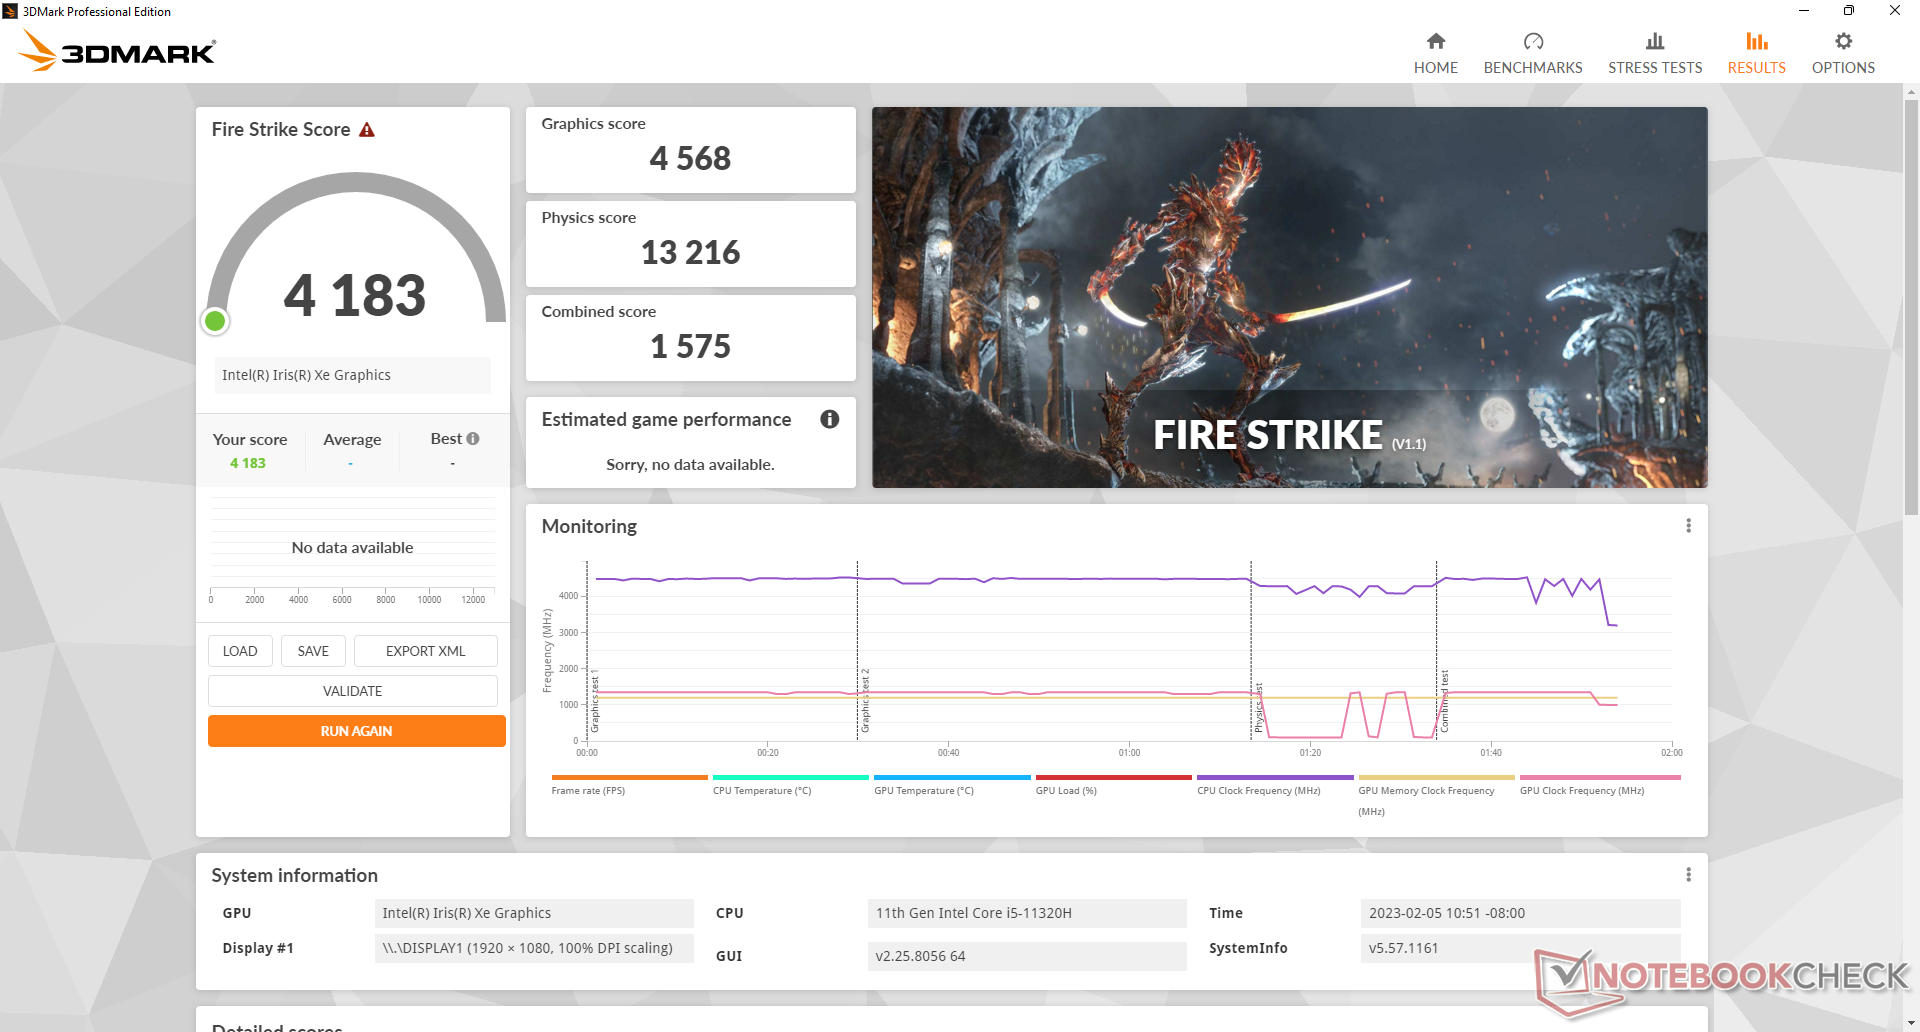
| 3DMark Fire Strike Score | 4183 poäng | |
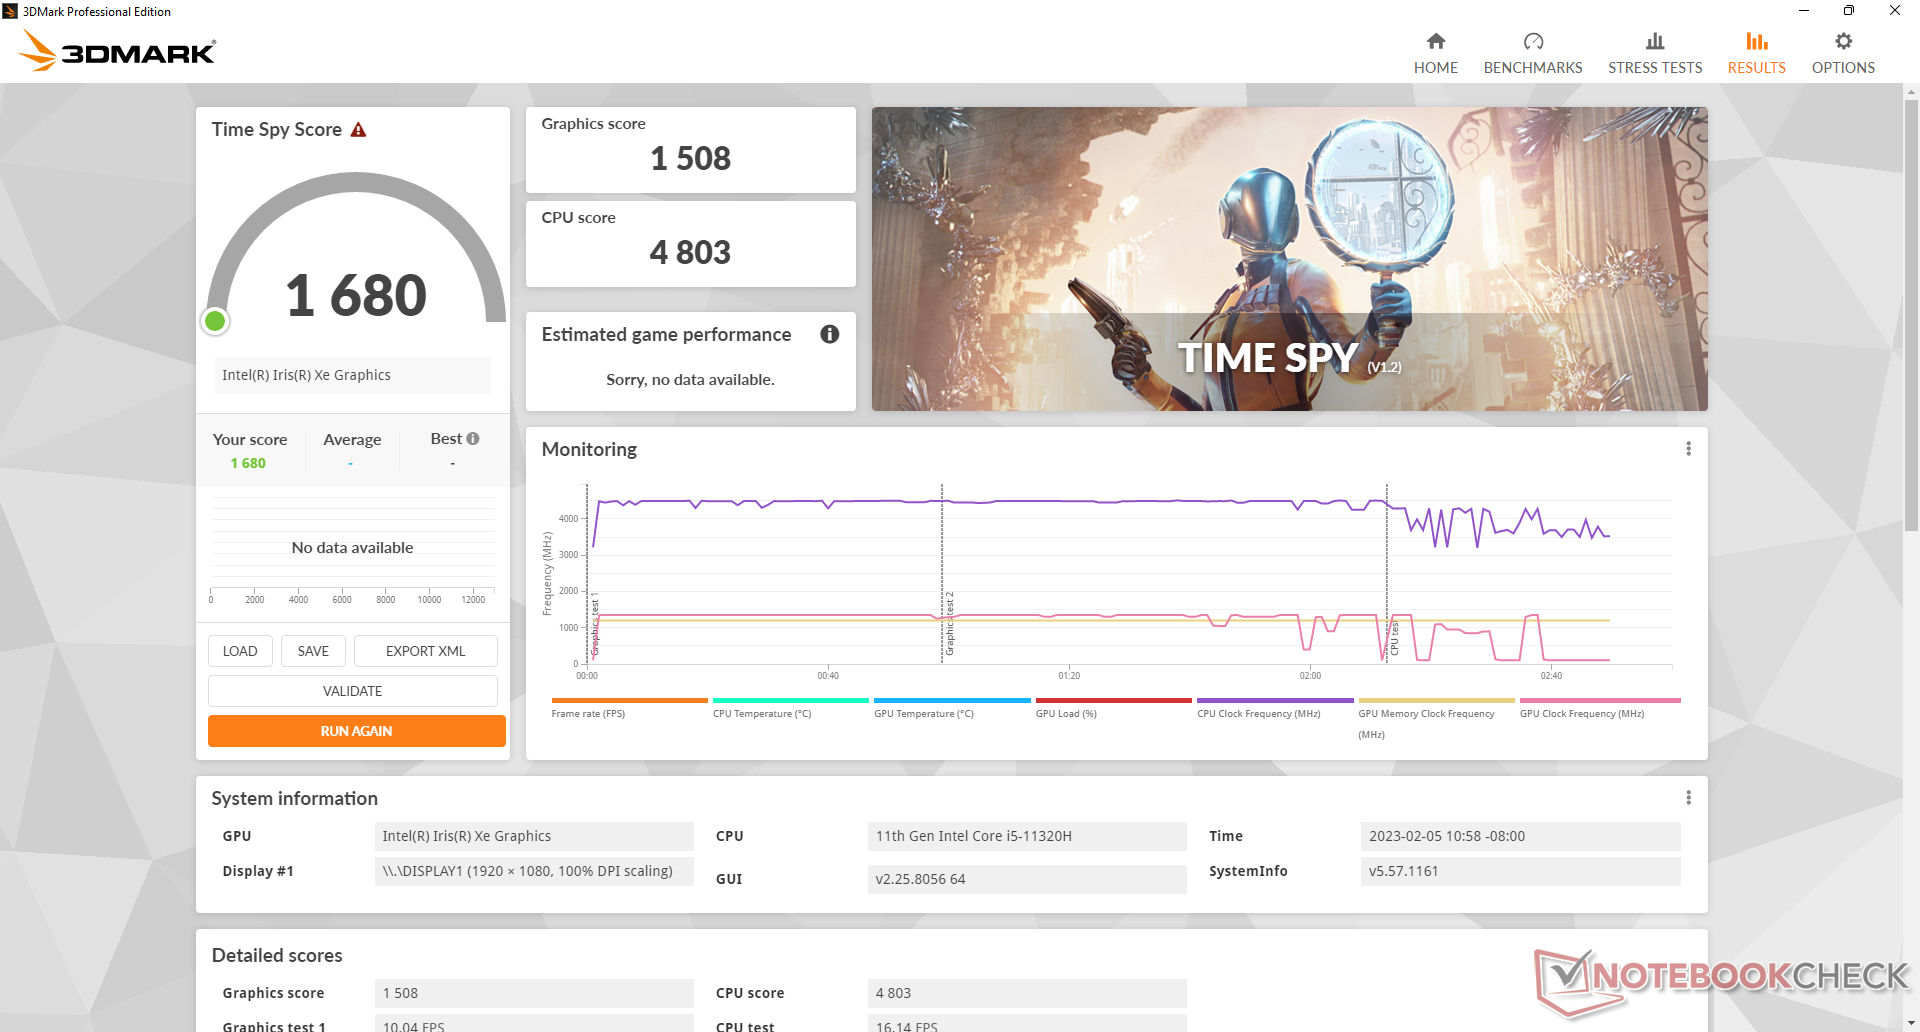
| 3DMark Time Spy Score | 1680 poäng | |
Hjälp | ||
| The Witcher 3 | |
| 1024x768 Low Graphics & Postprocessing | |
| Intel NUC 12 Pro Kit NUC12WSKi7 | |
| Trigkey Speed S | |
| Genomsnitt Intel Iris Xe Graphics G7 96EUs (28.9 - 117.2, n=188) | |
| Beelink SER Pro Ryzen 5 5600H | |
| Beelink SEi12 Core i5-1235U | |
| Trigkey S3 | |
| BMAX B5 Pro G7H8 | |
| 1366x768 Medium Graphics & Postprocessing | |
| Genomsnitt Intel Iris Xe Graphics G7 96EUs (21.4 - 77.8, n=185) | |
| Trigkey Speed S | |
| Beelink SER Pro Ryzen 5 5600H | |
| Beelink SEi12 Core i5-1235U | |
| Trigkey S3 | |
| BMAX B5 Pro G7H8 | |
| 1920x1080 High Graphics & Postprocessing (Nvidia HairWorks Off) | |
| Genomsnitt Intel Iris Xe Graphics G7 96EUs (10.6 - 45.9, n=191) | |
| Beelink SEi12 Core i5-1235U | |
| Beelink SER Pro Ryzen 5 5600H | |
| Trigkey Speed S | |
| Trigkey S3 | |
| Intel NUC 12 Pro Kit NUC12WSKi7 | |
| BMAX B5 Pro G7H8 | |
| 1920x1080 Ultra Graphics & Postprocessing (HBAO+) | |
| Beelink SER Pro Ryzen 5 5600H | |
| Genomsnitt Intel Iris Xe Graphics G7 96EUs (8.79 - 20.1, n=181) | |
| Trigkey Speed S | |
| Beelink SEi12 Core i5-1235U | |
| Trigkey S3 | |
| Cyberpunk 2077 1.6 - 1920x1080 Low Preset | |
| Beelink SER Pro Ryzen 5 5600H | |
| Genomsnitt Intel Iris Xe Graphics G7 96EUs (13 - 25.9, n=42) | |
| Beelink SEi12 Core i5-1235U | |
| Trigkey S3 | |
Witcher 3 FPS Chart
| låg | med. | hög | ultra | |
|---|---|---|---|---|
| GTA V (2015) | 92.2 | 80.3 | 23.4 | 9.04 |
| The Witcher 3 (2015) | 87.8 | 53.5 | 23.5 | 13.1 |
| Dota 2 Reborn (2015) | 121 | 79.4 | 50.6 | 52.3 |
| Final Fantasy XV Benchmark (2018) | 39.8 | 21.3 | 15.4 | |
| X-Plane 11.11 (2018) | 51.1 | 43.7 | 38.7 | |
| Strange Brigade (2018) | 80.1 | 34.5 | 28.5 | 22.9 |
Utsläpp
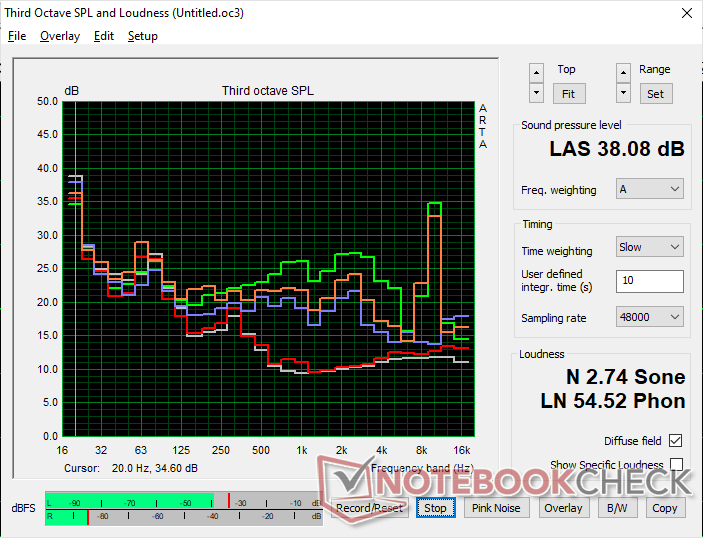
Systembrus
Även om den interna fläkten i sig själv oftast är ohörbar när du strömmar innehåll, uppvisar vår specifika enhet ibland märkbart elektroniskt brus eller spolningsljud vid en frekvens på ~10 kHz, vilket visas i diagrammet nedan. Detta gnissel uppträder oftast när CPU:n är hårt belastad, till exempel under spelande. Tyvärr försvann inte gnisslet ens efter flera timmars spelande. Ett sådant beteende tyder på att billiga delar har använts för att montera modellen.
Förhoppningsvis är problemet specifikt för vår recensionsenhet och inte ett tecken på eventuella detaljhandelsenheter.
Ljudnivå
| Låg belastning |
| 24.1 / 24.1 / 26.6 dB(A) |
| Hög belastning |
| 30.4 / 38.1 dB(A) |
 | ||
30 dB tyst 40 dB(A) hörbar 50 dB(A) högt ljud |
||
min: | ||
| Trigkey Speed S Iris Xe G7 96EUs, i5-11320H, Intel SSD 670p SSDPEKNU512GZ | Trigkey S3 Vega 8, R5 3550H, Kingston NV1 SNVS/500GCN | Beelink SEi12 Core i5-1235U Iris Xe G7 80EUs, i5-1235U, Kingston NV1 SNVS/500GCN | Beelink SER Pro Ryzen 5 5600H Vega 7, R5 5600H, Kingston NV1 SNVS/500GCN | Intel NUC 12 Pro Kit NUC12WSKi7 Iris Xe G7 96EUs, i7-1260P, Transcend M.2 SSD 2200S TS512GMTE220S | BMAX B5 Pro G7H8 UHD Graphics 620, i5-8260U | |
|---|---|---|---|---|---|---|
| Noise | 5% | -8% | -4% | -28% | 3% | |
| av / miljö * (dB) | 23.5 | 23.2 1% | 23.3 1% | 22.8 3% | 30.4 -29% | 23 2% |
| Idle Minimum * (dB) | 24.1 | 24.5 -2% | 27.8 -15% | 26.1 -8% | 33.1 -37% | 25.1 -4% |
| Idle Average * (dB) | 24.1 | 24.5 -2% | 27.8 -15% | 26.1 -8% | 33.1 -37% | 25.1 -4% |
| Idle Maximum * (dB) | 26.6 | 24.5 8% | 27.8 -5% | 28.7 -8% | 33.1 -24% | 25.1 6% |
| Load Average * (dB) | 30.4 | 27.1 11% | 32 -5% | 32.3 -6% | 38.1 -25% | 28.6 6% |
| Witcher 3 ultra * (dB) | 30.4 | 30.6 -1% | 34.1 -12% | 32.8 -8% | 30.1 1% | |
| Load Maximum * (dB) | 38.1 | 31.3 18% | 39.2 -3% | 36.4 4% | 43.6 -14% | 34 11% |
* ... mindre är bättre
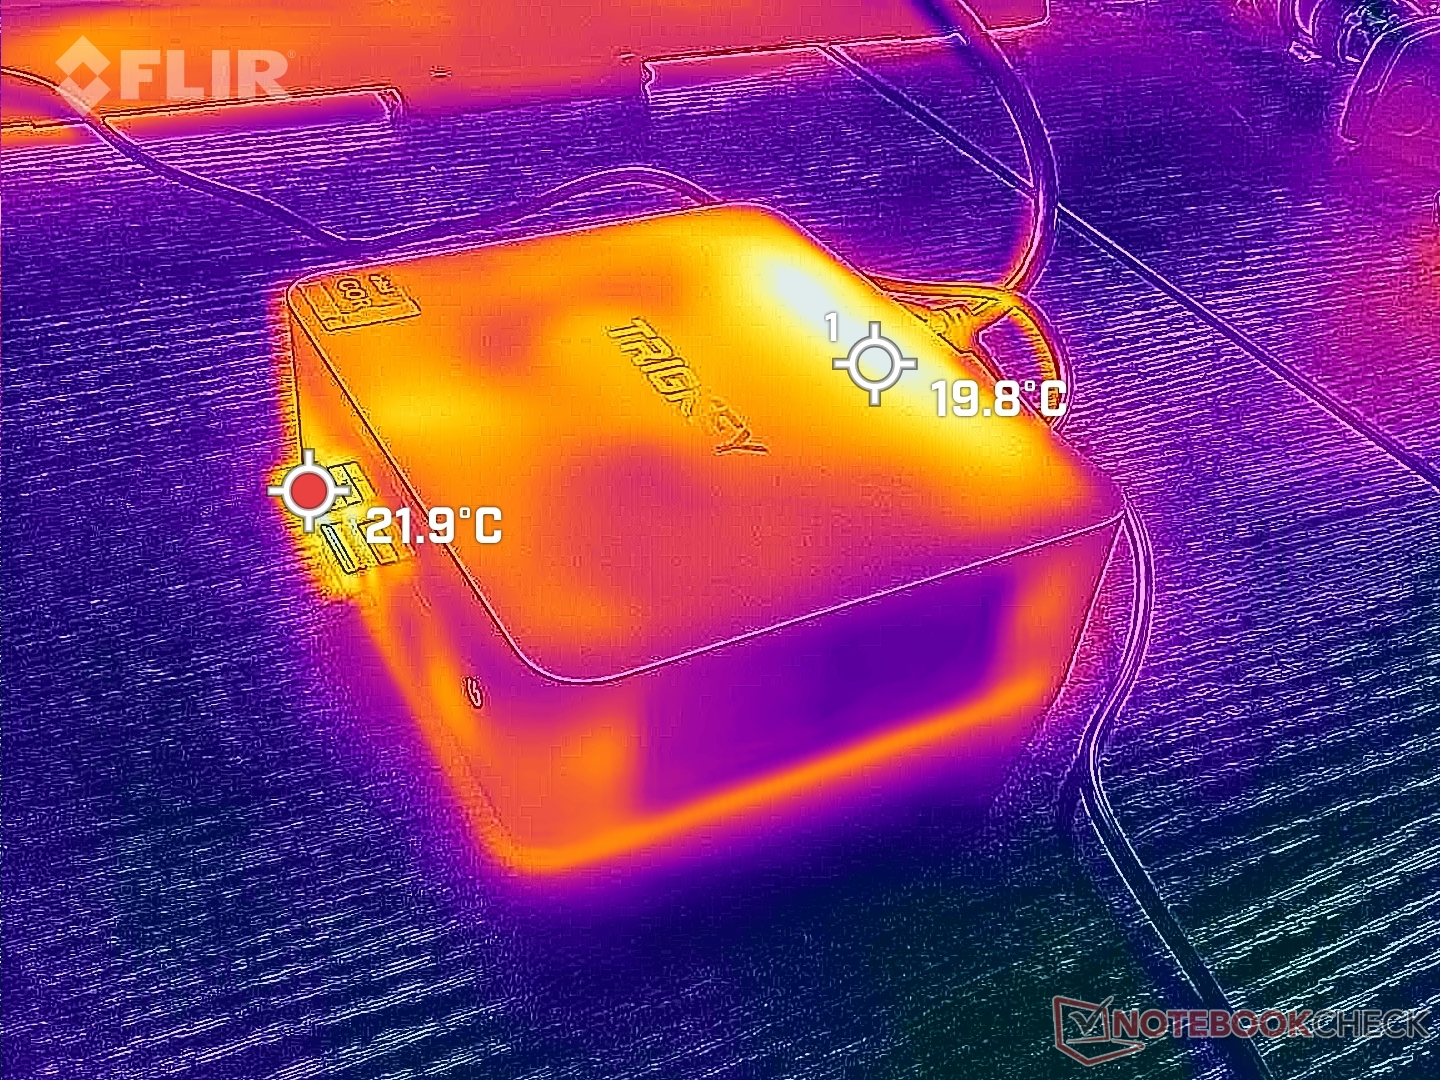
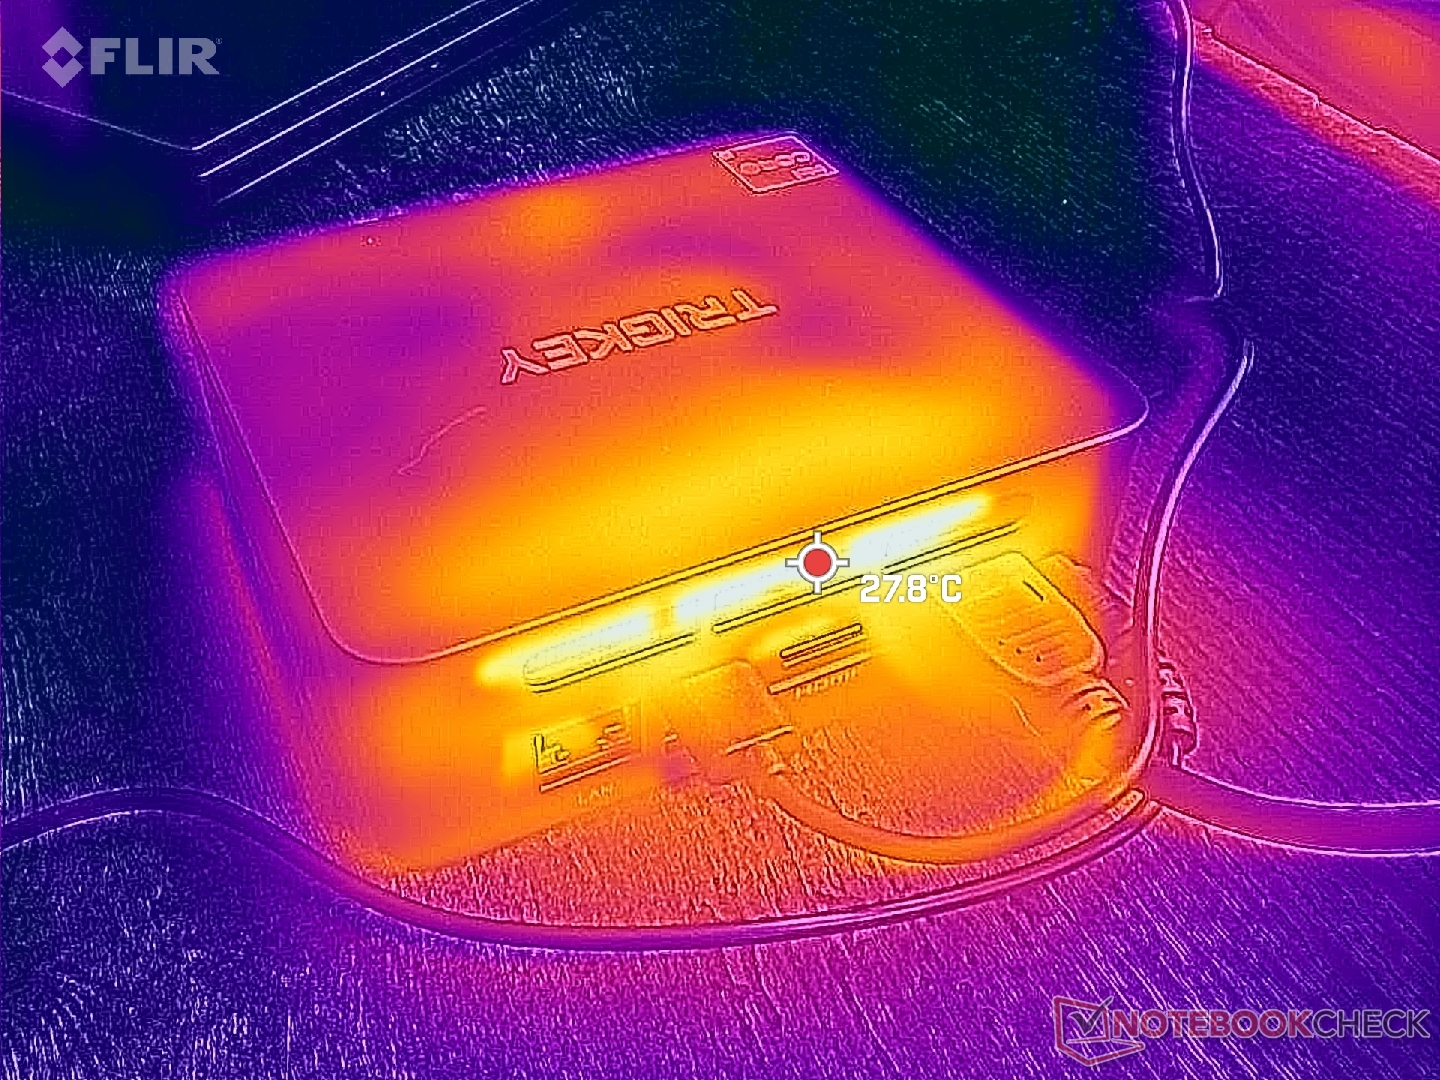
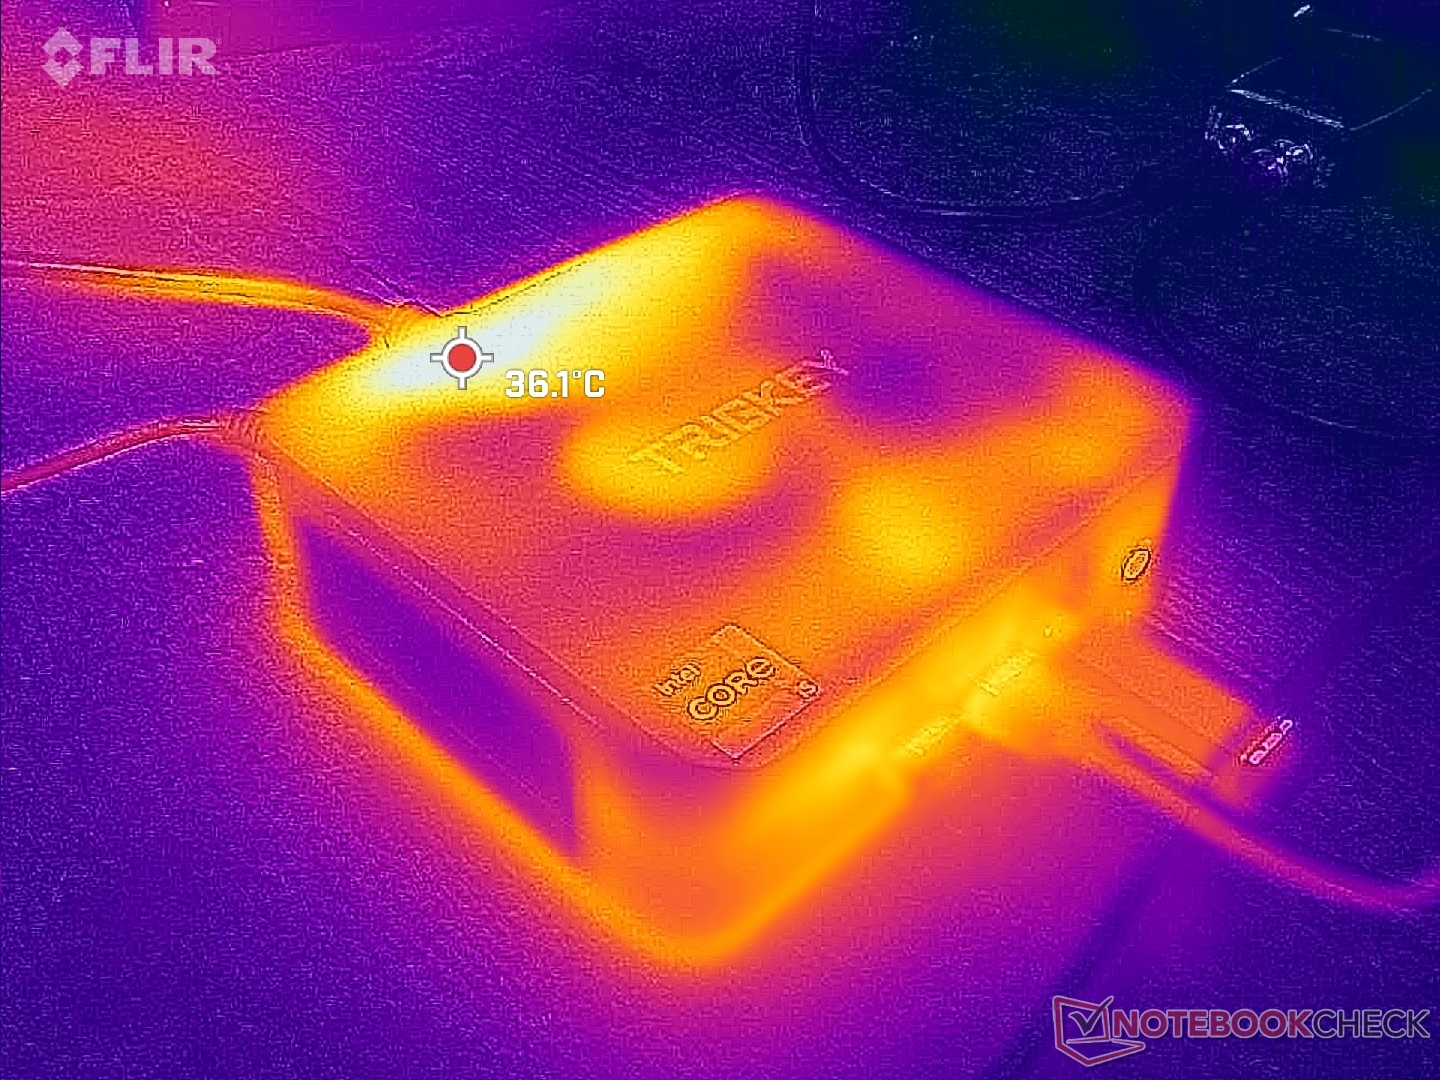
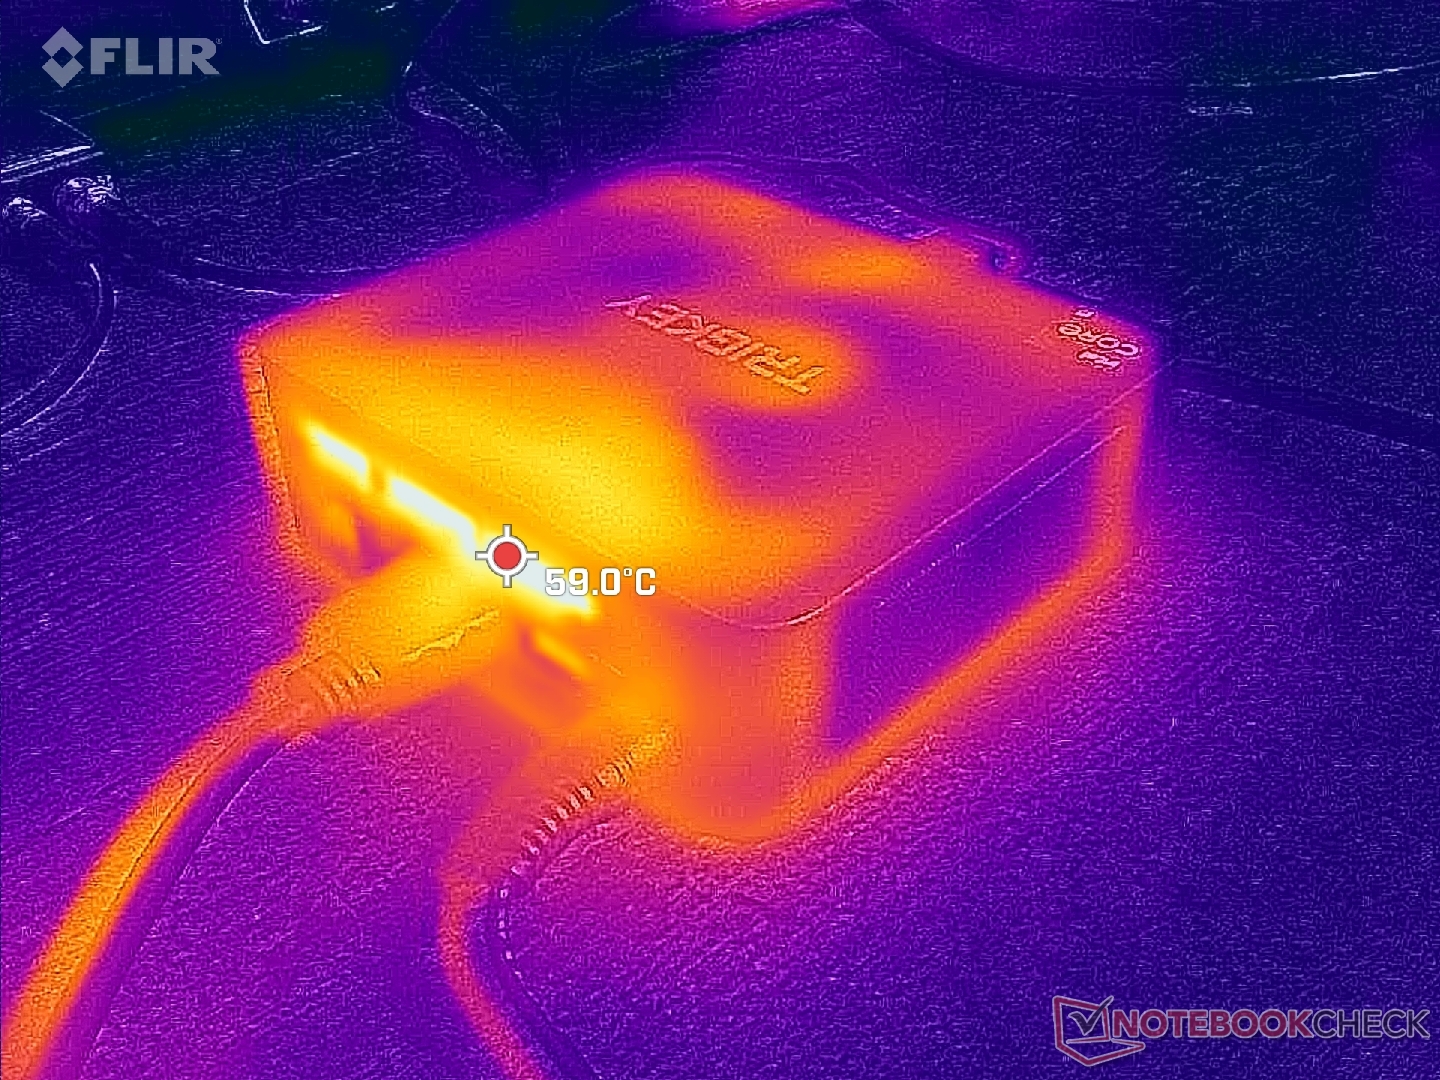
Temperatur
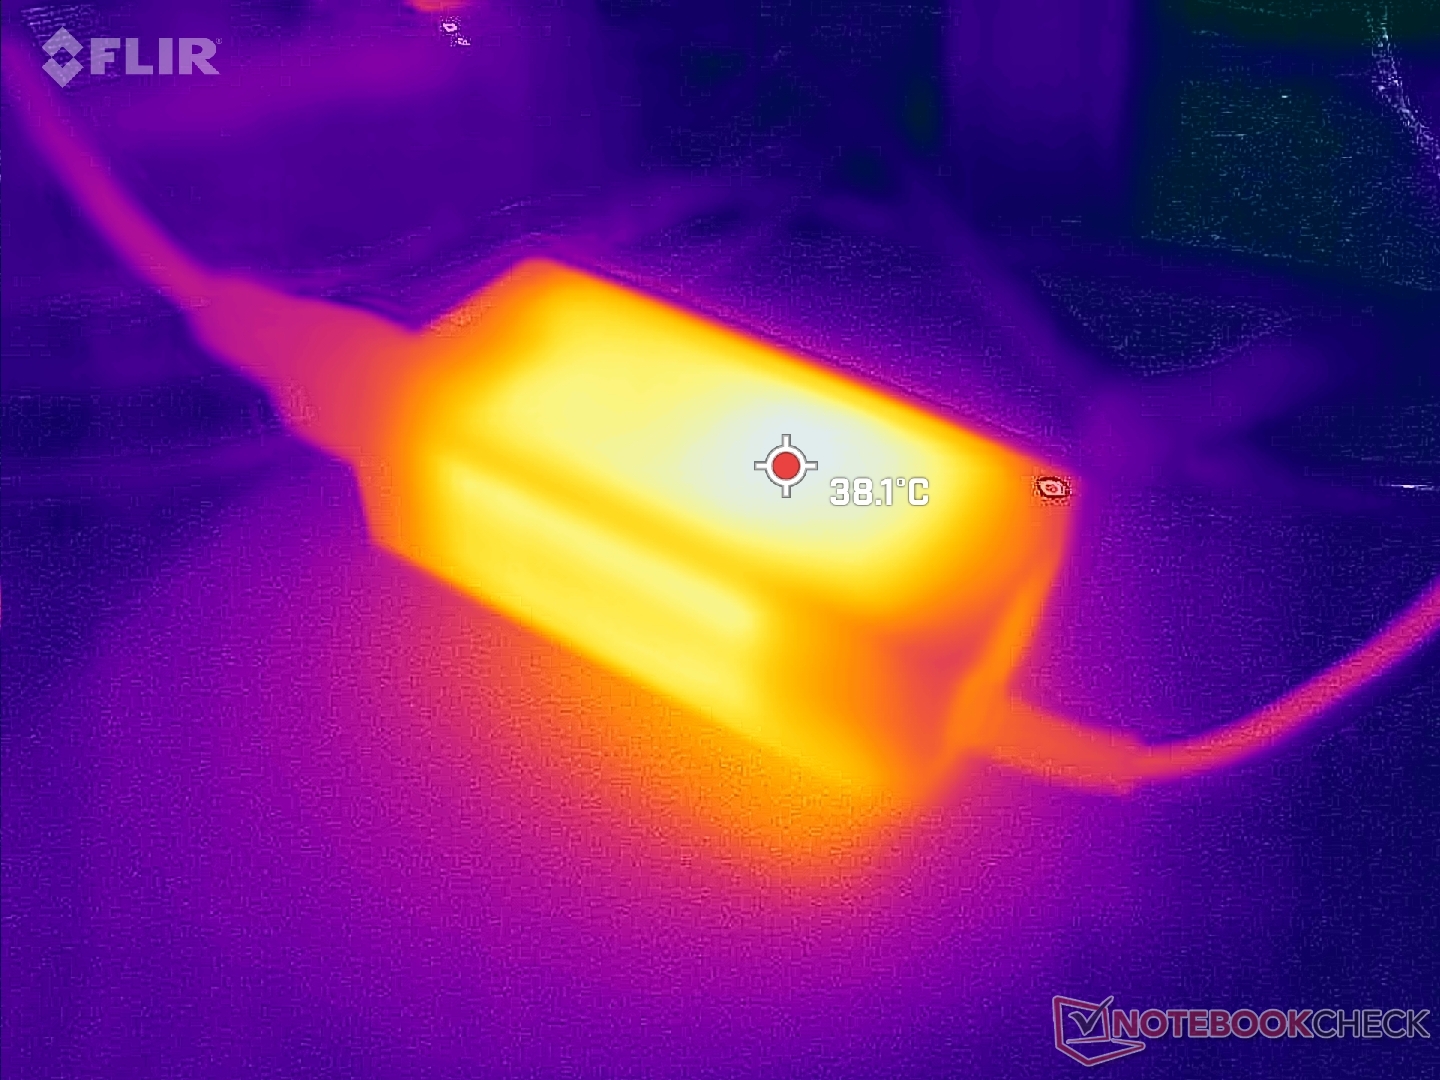
Yttemperaturerna är varmast längs baksidan där varm luft kommer ut. Kall luft kommer in från sidorna av chassit.
Stresstest
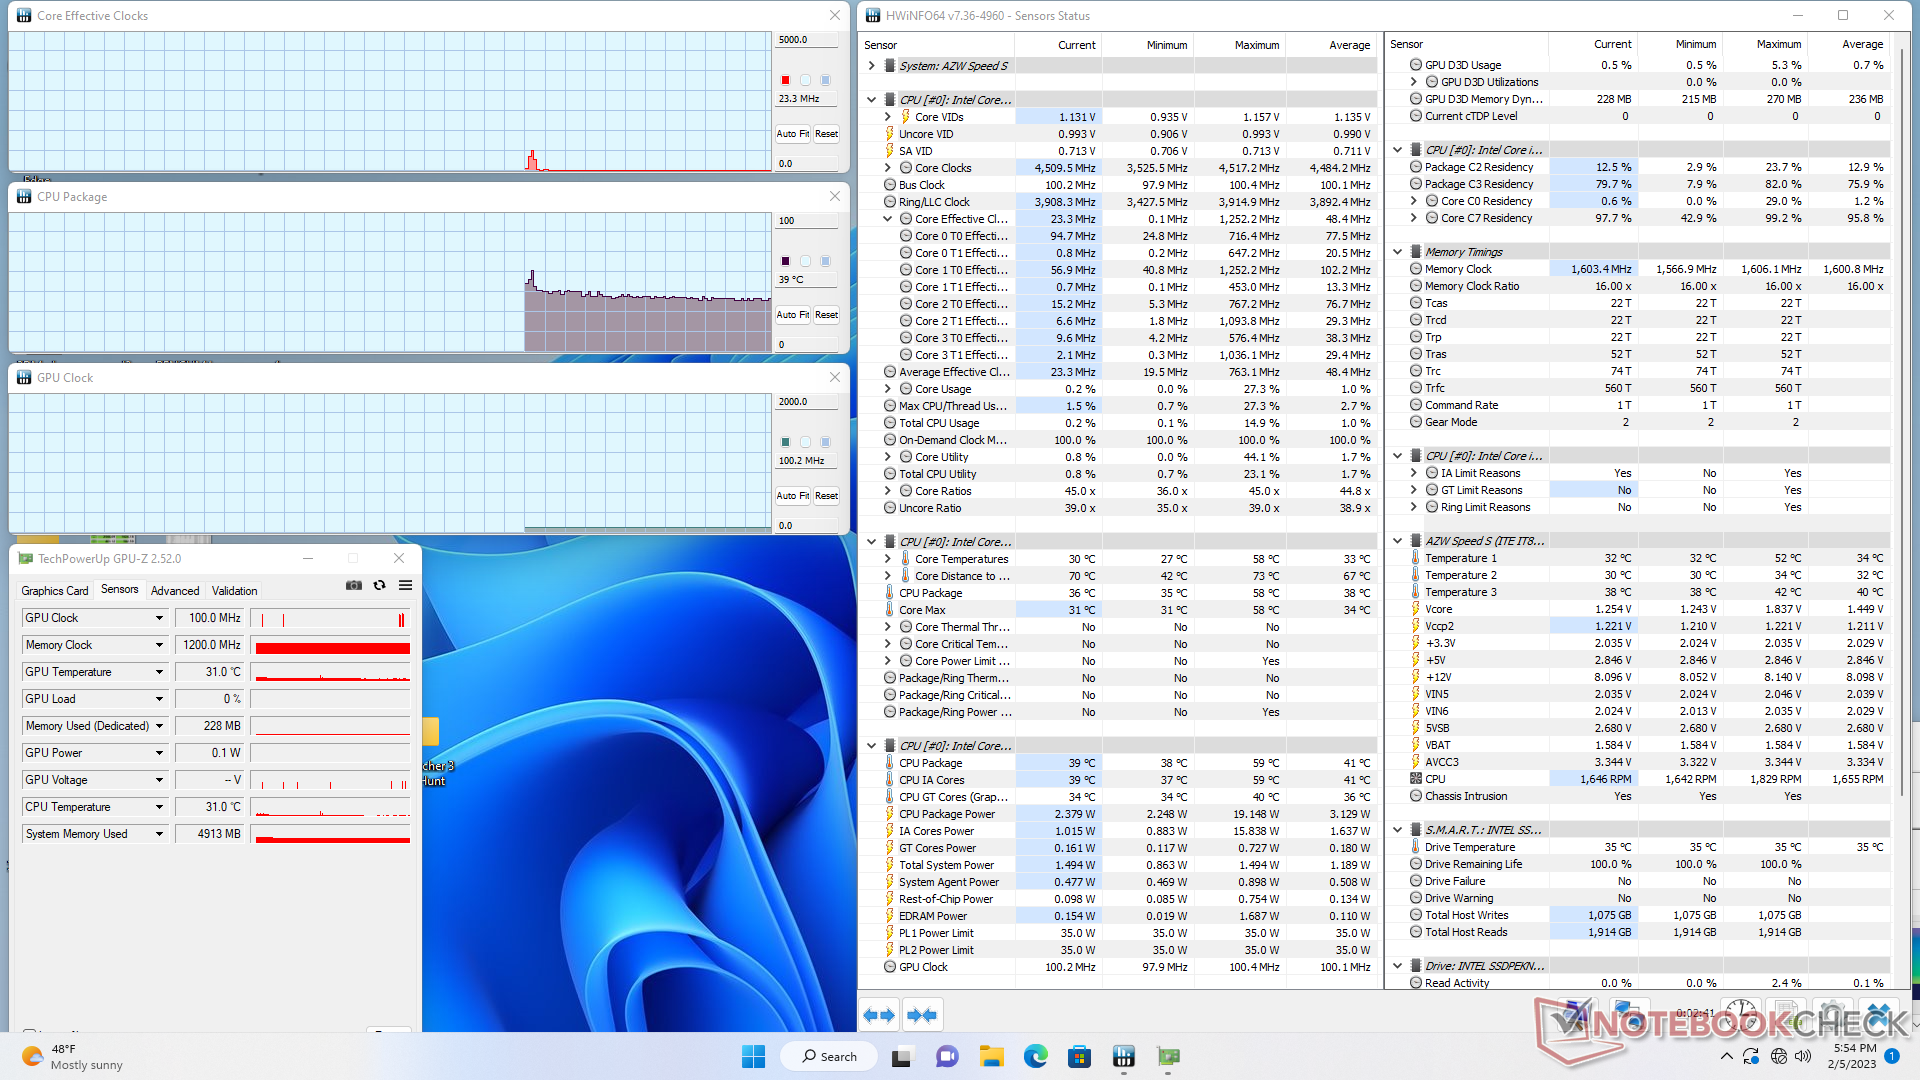
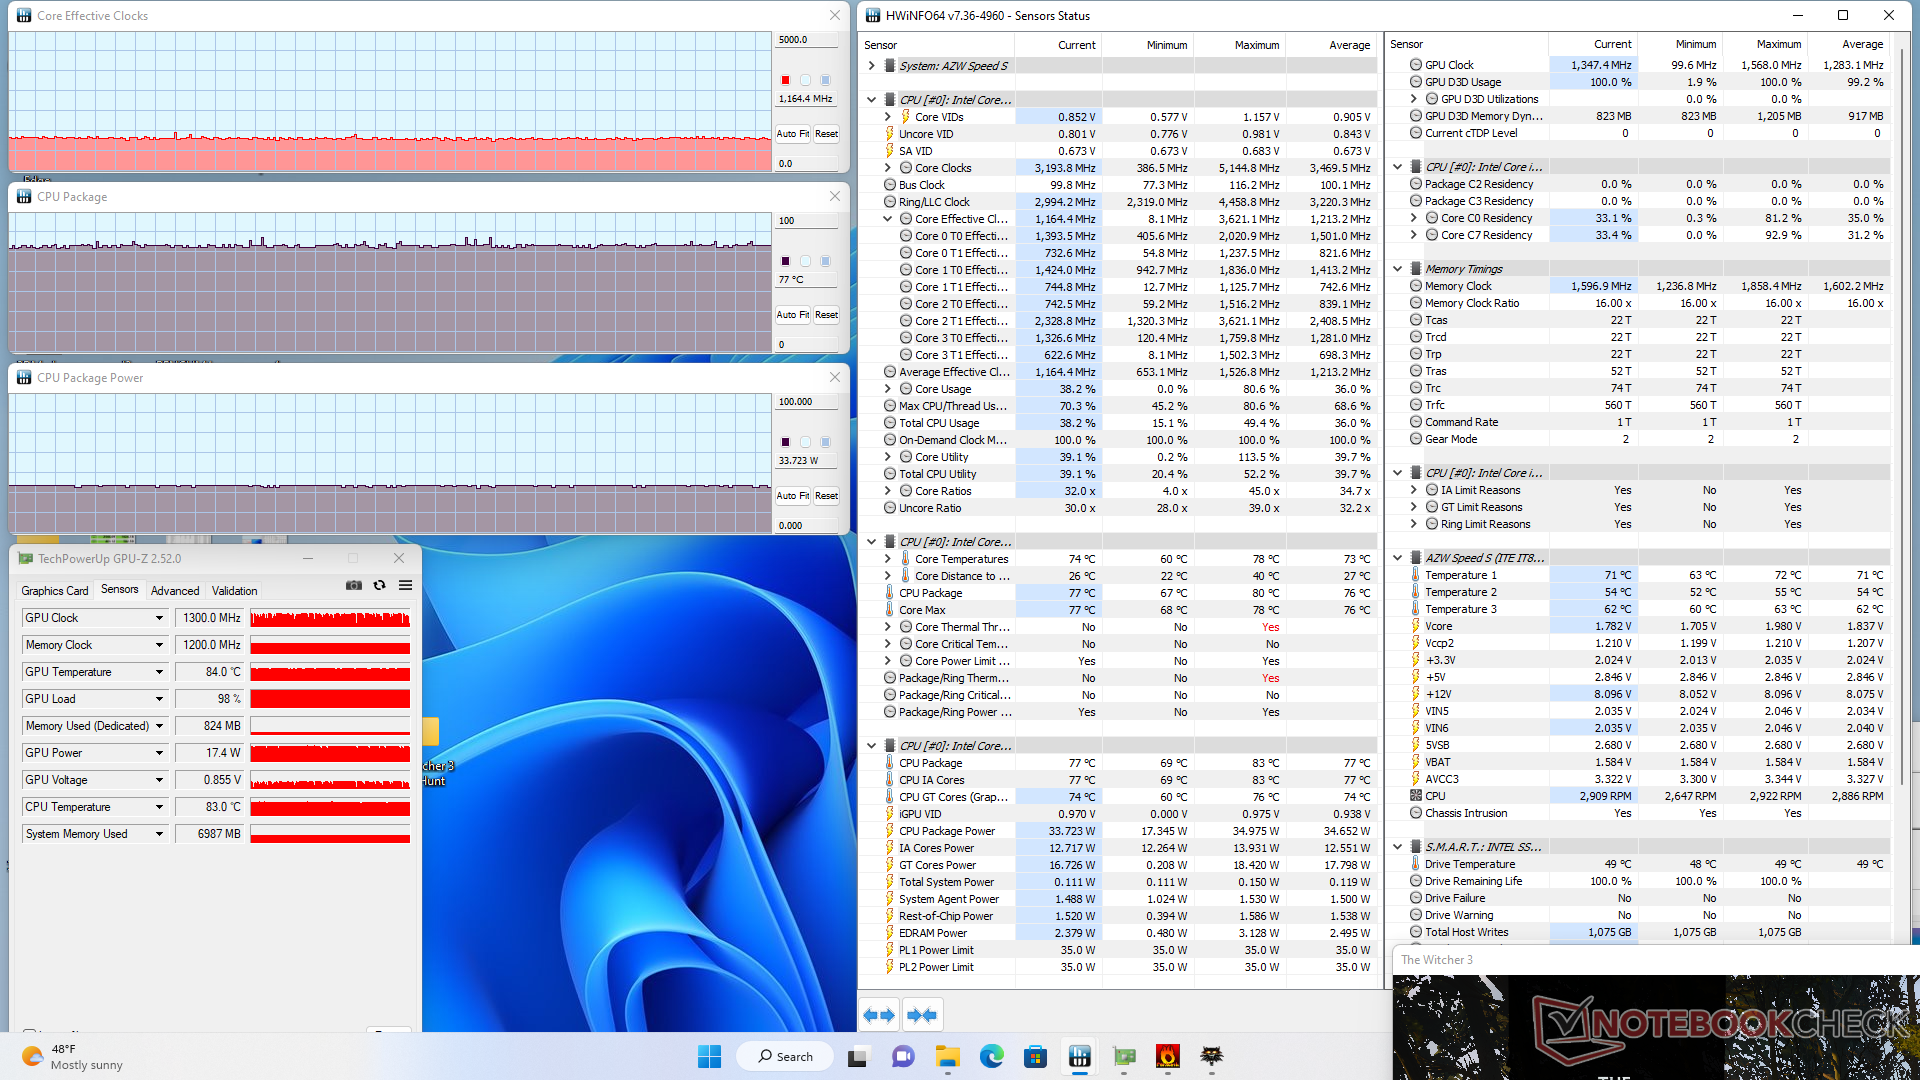
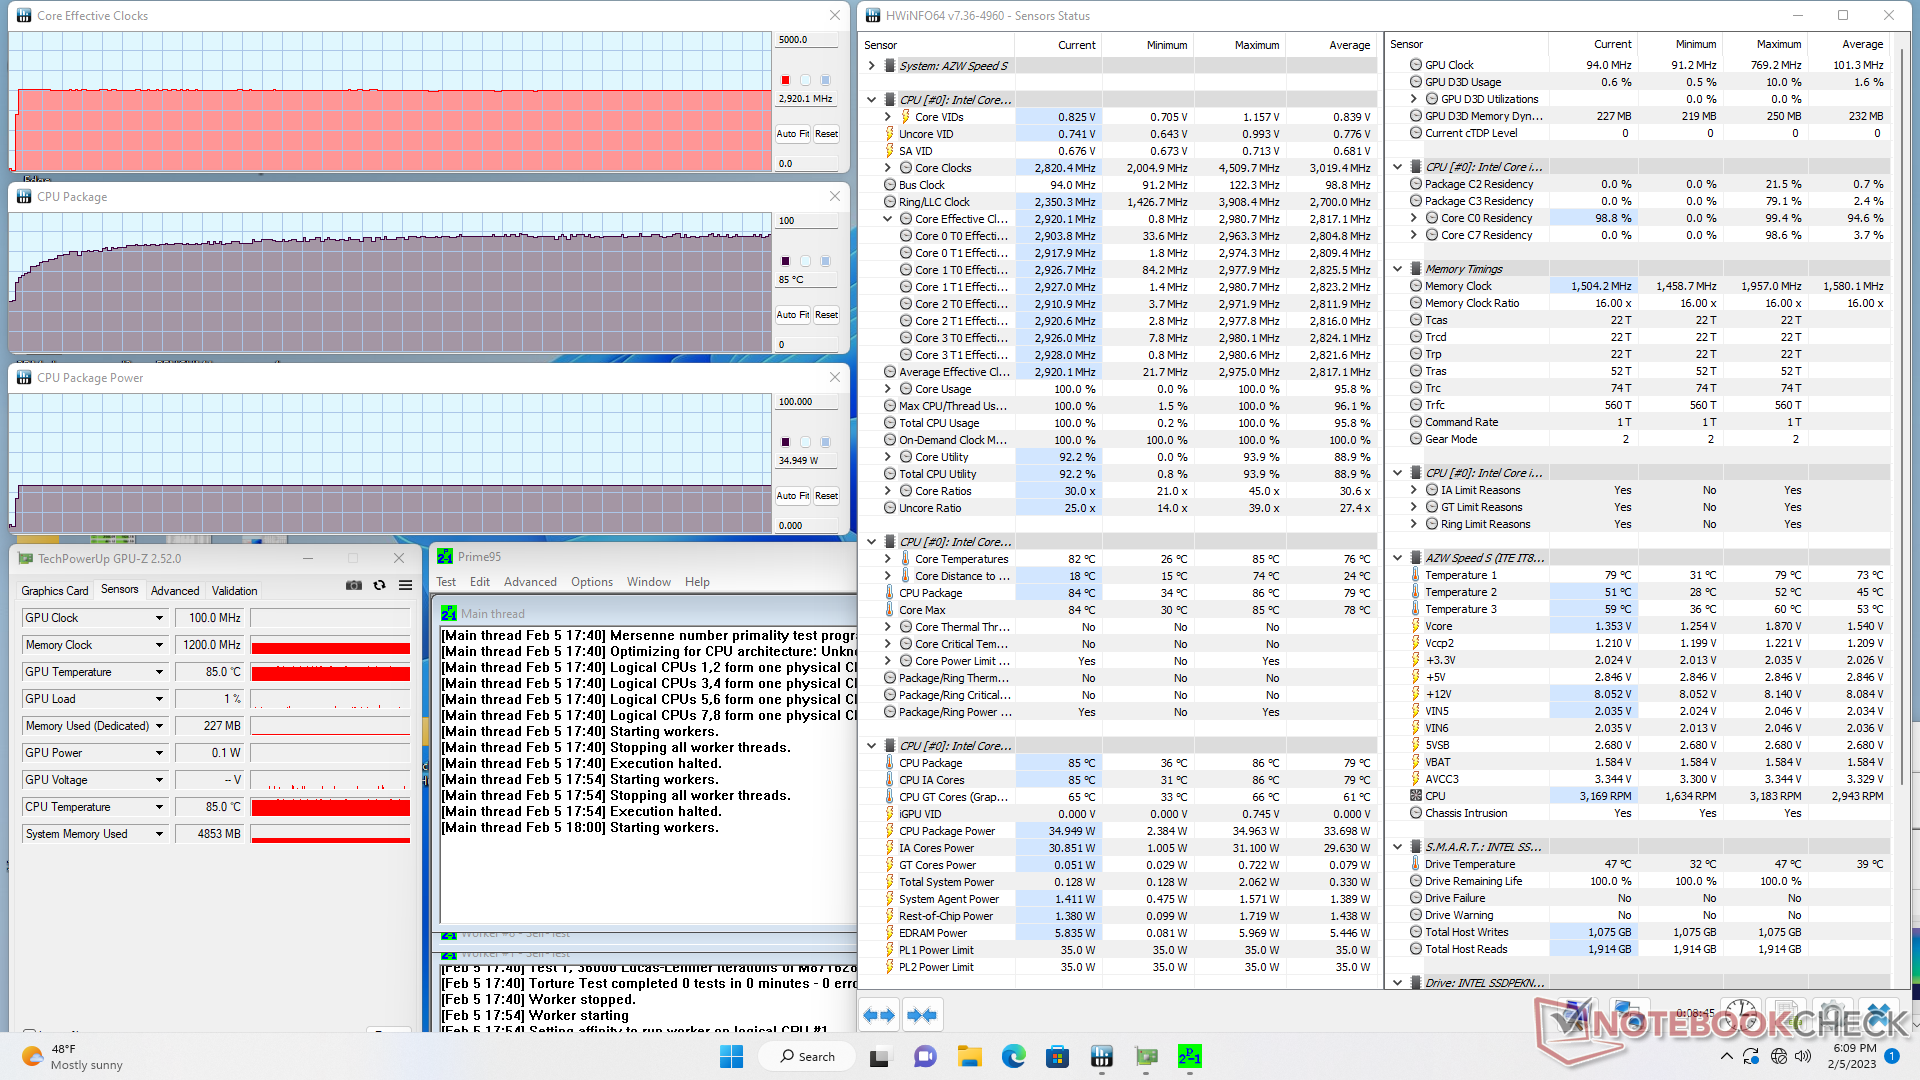
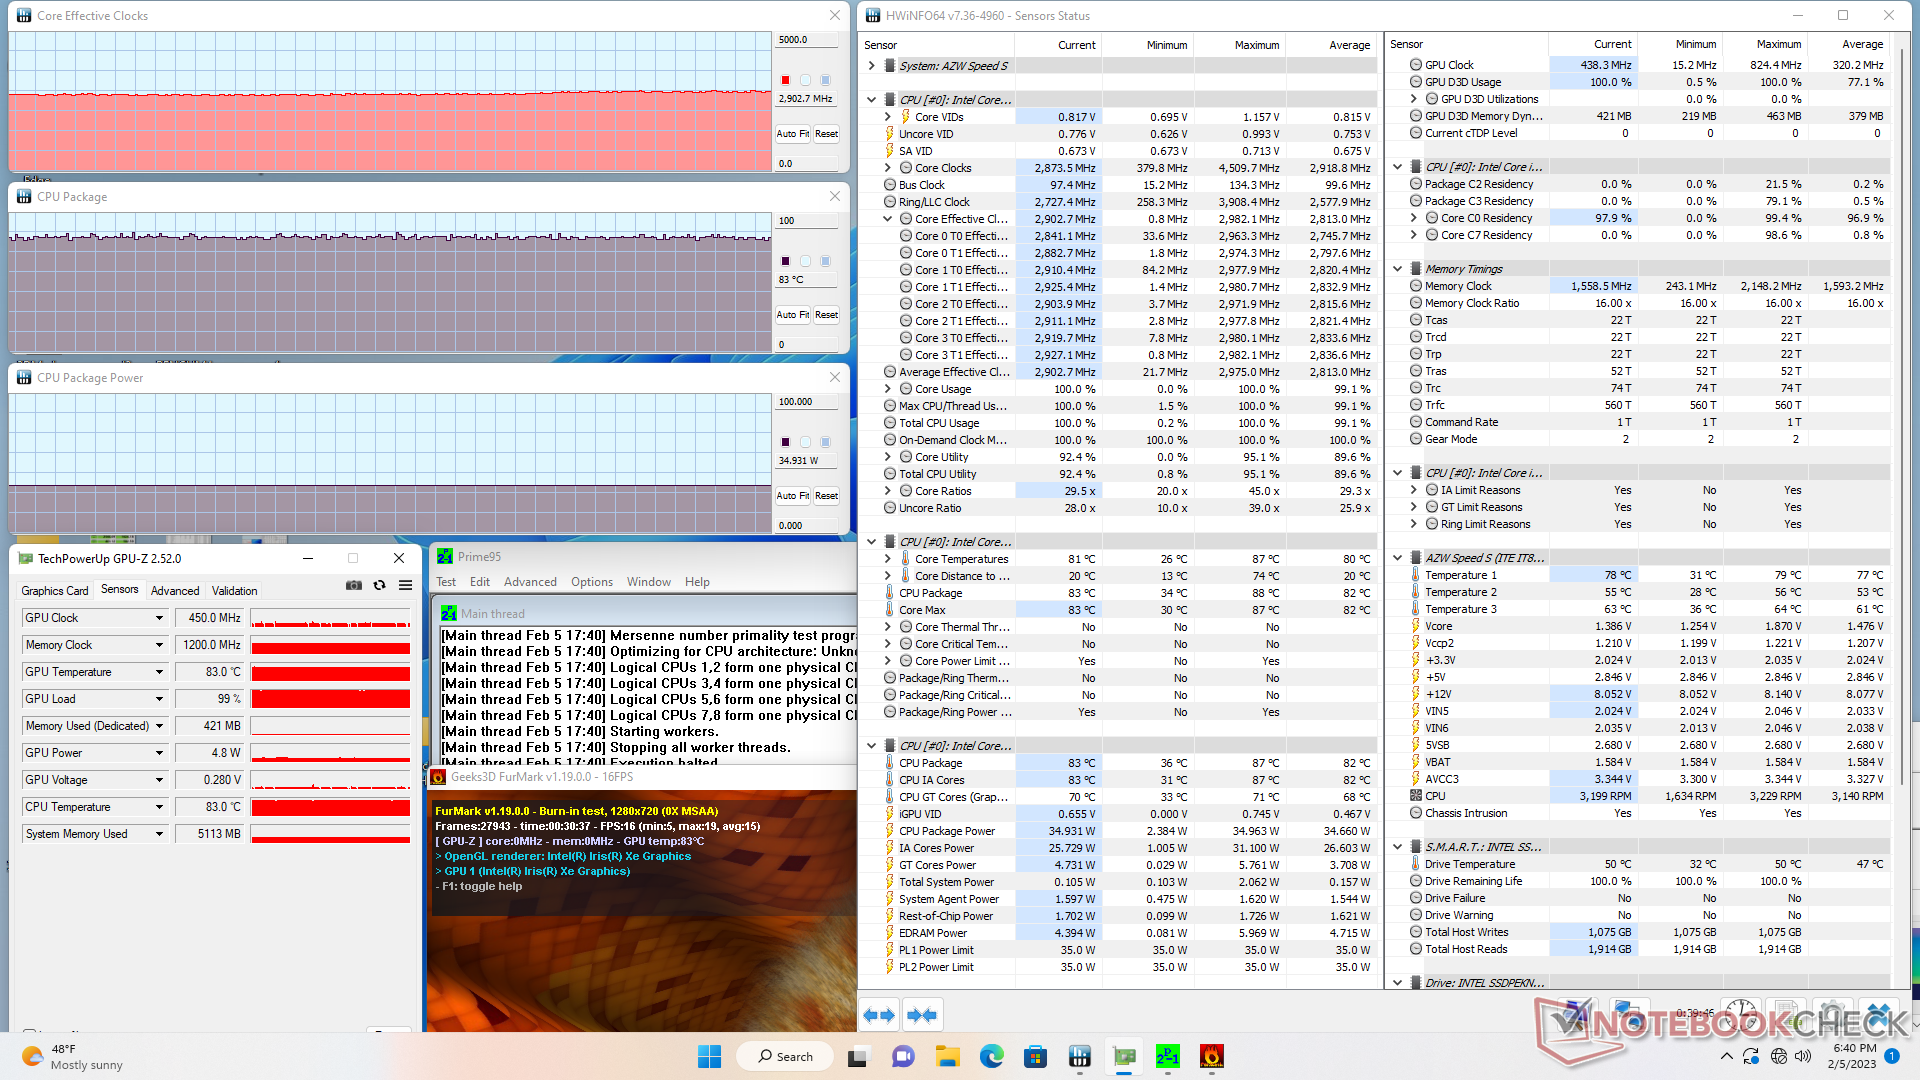
| CPU-klocka (GHz) | GPU-klocka (MHz) | Genomsnittlig CPU-temperatur (°C) | |
| Systemets tomgång | -- | -- | 39 |
| Prime95 Stress | 2.9 | -- | 86 |
| Prime95+FurMark Stress | 2.9 | 438 | 83 |
| Witcher 3 Stress | 1,2 | 1347 | 77 |
Energiförvaltning
Effektförbrukning
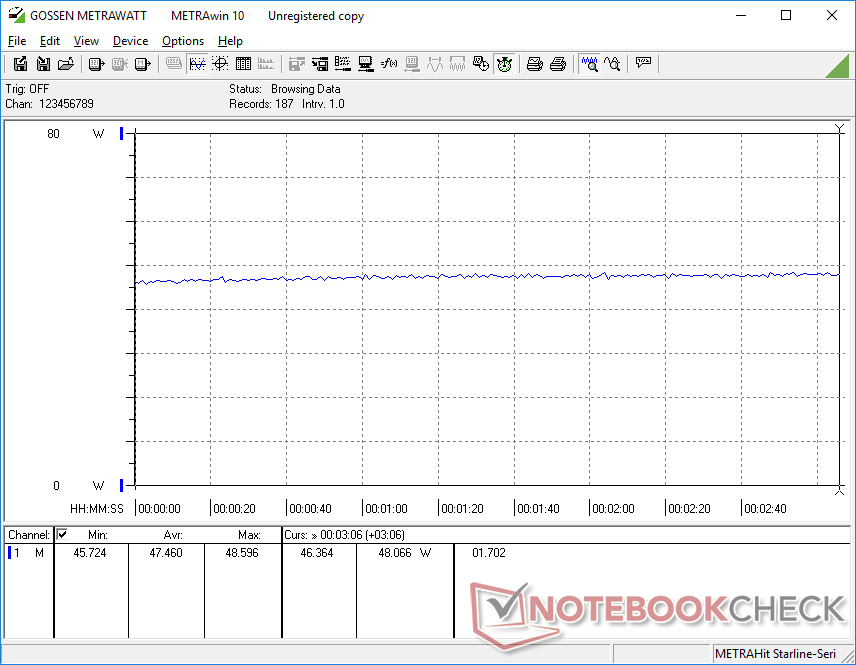

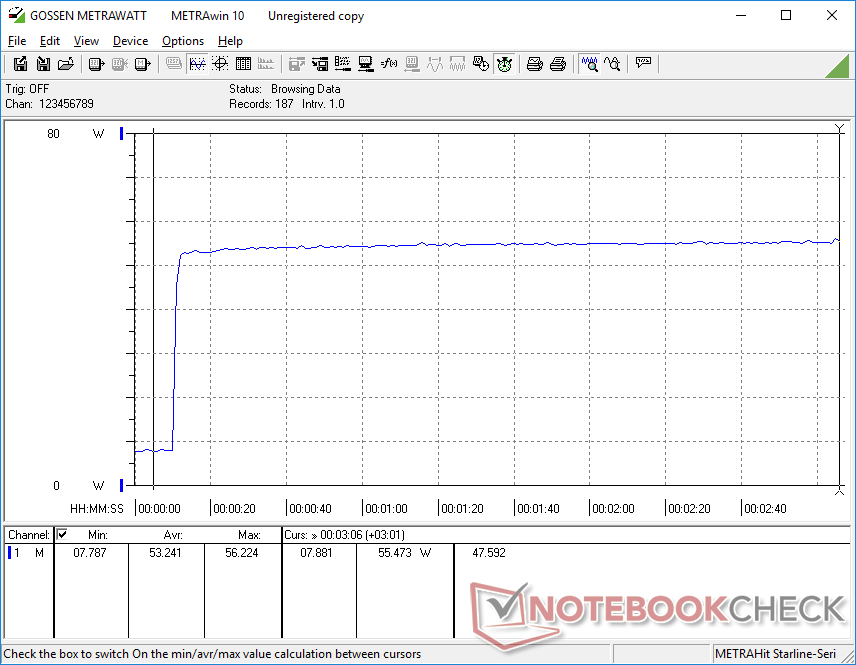
| Av/Standby | |
| Låg belastning | |
| Hög belastning |
|
Förklaring:
min: | |
| Trigkey Speed S i5-11320H, Iris Xe G7 96EUs, Intel SSD 670p SSDPEKNU512GZ, , x, | Trigkey S3 R5 3550H, Vega 8, Kingston NV1 SNVS/500GCN, , x, | Beelink SEi12 Core i5-1235U i5-1235U, Iris Xe G7 80EUs, Kingston NV1 SNVS/500GCN, , x, | Beelink SER Pro Ryzen 5 5600H R5 5600H, Vega 7, Kingston NV1 SNVS/500GCN, , x, | Intel NUC 12 Pro Kit NUC12WSKi7 i7-1260P, Iris Xe G7 96EUs, Transcend M.2 SSD 2200S TS512GMTE220S, , x, | BMAX B5 Pro G7H8 i5-8260U, UHD Graphics 620, , , x, | |
|---|---|---|---|---|---|---|
| Power Consumption | -61% | -82% | 4% | -59% | 15% | |
| Idle Minimum * (Watt) | 6.7 | 11.3 -69% | 15.8 -136% | 5.4 19% | 12.1 -81% | 6 10% |
| Idle Average * (Watt) | 8 | 21.8 -173% | 16.8 -110% | 8.2 -2% | 12.2 -53% | 6.2 22% |
| Idle Maximum * (Watt) | 8.1 | 22.2 -174% | 17 -110% | 8.3 -2% | 12.3 -52% | 6.3 22% |
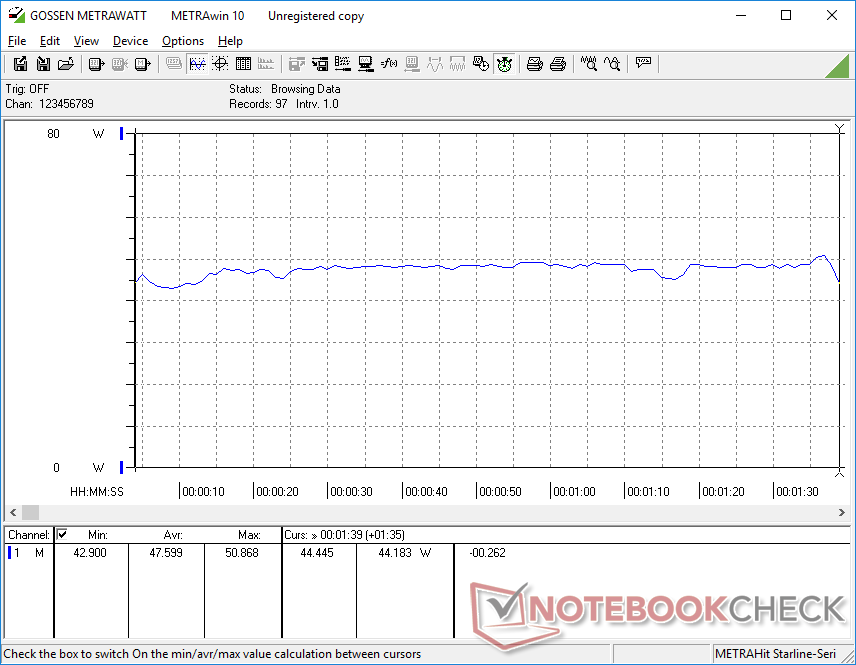
| Load Average * (Watt) | 47.6 | 39.7 17% | 54.4 -14% | 49.3 -4% | 64 -34% | 42.8 10% |
| Witcher 3 ultra * (Watt) | 47.5 | 37.5 21% | 50.7 -7% | 46.1 3% | 35 26% | |
| Load Maximum * (Watt) | 56.3 | 48.9 13% | 119.1 -112% | 50.2 11% | 98.8 -75% | 55.8 1% |
* ... mindre är bättre
Power Consumption Witcher 3 / Stresstest
Power Consumption external Monitor
För
Emot
Dom
NUC-alternativen har stadigt sjunkit i pris utan att offra prestanda genom att levereras med CPU:er i H-serien. Priserna är nu så låga att de börjar tränga undan långsammare Atom- eller Celeron-minidatorer. För 400 USD är Trigkey Speed S redo att användas och till halva priset jämfört med många Intel NUCs som är utrustade med liknande RAM- och lagringskonfigurationer. Den erbjuder inte några avancerade funktioner som Thunderbolt, Wi-Fi 6E eller 2,5 Gbit Ethernet, men många HTPC-användare kommer sannolikt inte att ha något emot det när det gäller 1080p- eller 4K-videoströmning.
Trigkey Speed S är övertygande på alla fronter jämfört med andra minidatorer i samma prisklass.
Jämfört med Trigkey S3 erbjuder Speed S 70 till 120 procent snabbare grafikprestanda och 50 till 60 procent snabbare CPU-prestanda med flera trådar. Den förbrukar lite mer ström i processen när den är belastad, men både prestanda per watt och prestanda per dollar förblir höga. Vi rekommenderar att du kontrollerar om det finns något elektroniskt ljud eller spolningsvisslan vid mottagandet, för säkerhets skull.
Pris och tillgänglighet
Trigkey Speed S som vi recenserade finns nu tillgänglig på Amazon för 399 USD.
Genomskinlighet
Valet av enheter som ska granskas görs av vår redaktion. Testprovet gavs till författaren som ett lån av tillverkaren eller återförsäljaren för denna recension. Långivaren hade inget inflytande på denna recension och inte heller fick tillverkaren en kopia av denna recension innan publiceringen. Det fanns ingen skyldighet att publicera denna recension. Som ett oberoende medieföretag är Notebookcheck inte föremål för auktoritet från tillverkare, återförsäljare eller förlag.
This is how Notebookcheck is testingEvery year, Notebookcheck independently reviews hundreds of laptops and smartphones using standardized procedures to ensure that all results are comparable. We have continuously developed our test methods for around 20 years and set industry standards in the process. In our test labs, high-quality measuring equipment is utilized by experienced technicians and editors. These tests involve a multi-stage validation process. Our complex rating system is based on hundreds of well-founded measurements and benchmarks, which maintains objectivity.
Price comparison

