Test: Nokia 8 Sirocco Smartphone (Sammanfattning)
| Networking | |
| iperf3 transmit AX12 | |
| Sony Xperia XZ2 | |
| Motorola Moto Z2 Force | |
| Nokia 8 Sirocco | |
| Samsung Galaxy S9 | |
| Nokia 8 | |
| Huawei P10 Plus | |
| iperf3 receive AX12 | |
| Sony Xperia XZ2 | |
| Samsung Galaxy S9 | |
| Motorola Moto Z2 Force | |
| Nokia 8 Sirocco | |
| Nokia 8 | |
| Huawei P10 Plus | |

| |||||||||||||||||||||||||
Distribution av ljusstyrkan: 85 %
Mitt på batteriet: 576 cd/m²
Kontrast: ∞:1 (Svärta: 0 cd/m²)
ΔE ColorChecker Calman: 5 | ∀{0.5-29.43 Ø4.72}
ΔE Greyscale Calman: 5.4 | ∀{0.09-98 Ø4.97}
Gamma: 2.3
CCT: 7730 K
| Nokia 8 Sirocco P-OLED, 2560x1440, 5.5" | Sony Xperia XZ2 IPS, 2160x1080, 5.7" | Motorola Moto Z2 Force OLED, 2560x1440, 5.5" | Samsung Galaxy S9 Super AMOLED, 2960x1440, 5.8" | Huawei P10 Plus LTPS, 2560x1440, 5.5" | Nokia 8 IPS, 2560x1440, 5.3" | |
|---|---|---|---|---|---|---|
| Screen | 34% | 1% | 31% | 27% | -16% | |
| Brightness middle (cd/m²) | 576 | 630 9% | 511 -11% | 529 -8% | 568 -1% | 735 28% |
| Brightness (cd/m²) | 597 | 632 6% | 526 -12% | 527 -12% | 562 -6% | 707 18% |
| Brightness Distribution (%) | 85 | 96 13% | 88 4% | 96 13% | 92 8% | 92 8% |
| Black Level * (cd/m²) | 0.44 | 0.43 | 0.79 | |||
| Colorchecker dE 2000 * | 5 | 1.5 70% | 4.3 14% | 1.4 72% | 2.4 52% | 6.7 -34% |
| Colorchecker dE 2000 max. * | 8 | 4.3 46% | 9.6 -20% | 4 50% | 3.8 52% | 12.9 -61% |
| Greyscale dE 2000 * | 5.4 | 2.1 61% | 3.7 31% | 1.6 70% | 2.5 54% | 8.3 -54% |
| Gamma | 2.3 96% | 2.17 101% | 2.11 104% | 2.16 102% | 2.37 93% | 2.24 98% |
| CCT | 7730 84% | 6513 100% | 7075 92% | 6358 102% | 6779 96% | 8906 73% |
| Contrast (:1) | 1432 | 1321 | 930 |
* ... mindre är bättre
Skärmflimmer / PWM (Puls-Width Modulation)
| Skärmflimmer / PWM upptäckt | 250 Hz | 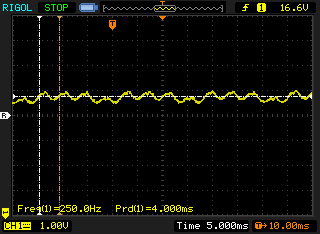 | |
Displayens bakgrundsbelysning flimrar vid 250 Hz (i värsta fall, t.ex. med PWM) . Frekvensen för 250 Hz är relativt låg, så känsliga användare kommer sannolikt att märka flimmer och uppleva ansträngda ögon vid den angivna ljusstyrkeinställningen och nedan. Som jämförelse: 52 % av alla testade enheter använder inte PWM för att dämpa skärmen. Om PWM upptäcktes mättes ett medelvärde av 7747 (minst: 5 - maximum: 343500) Hz. | |||
Visa svarstider
| ↔ Svarstid svart till vitt | ||
|---|---|---|
| 4 ms ... stiga ↗ och falla ↘ kombinerat | ↗ 2 ms stiga | 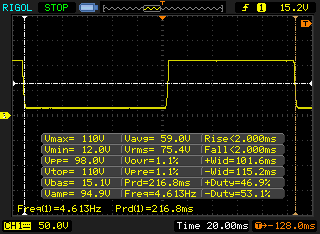 |
| ↘ 2 ms hösten | ||
| Skärmen visar väldigt snabba svarsfrekvenser i våra tester och borde vara mycket väl lämpad för fartfyllt spel. I jämförelse sträcker sig alla testade enheter från 0.1 (minst) till 240 (maximalt) ms. » 16 % av alla enheter är bättre. Det betyder att den uppmätta svarstiden är bättre än genomsnittet av alla testade enheter (19.8 ms). | ||
| ↔ Svarstid 50 % grått till 80 % grått | ||
| 4.8 ms ... stiga ↗ och falla ↘ kombinerat | ↗ 2.8 ms stiga | 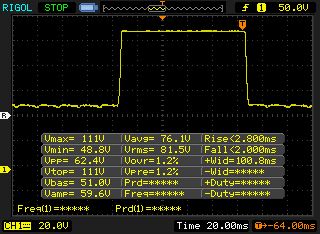 |
| ↘ 2 ms hösten | ||
| Skärmen visar väldigt snabba svarsfrekvenser i våra tester och borde vara mycket väl lämpad för fartfyllt spel. I jämförelse sträcker sig alla testade enheter från 0.165 (minst) till 636 (maximalt) ms. » 17 % av alla enheter är bättre. Det betyder att den uppmätta svarstiden är bättre än genomsnittet av alla testade enheter (31 ms). | ||
| AnTuTu v7 - Total Score (sortera efter värde) | |
| Nokia 8 Sirocco | |
| Sony Xperia XZ2 | |
| Samsung Galaxy S9 | |
| Genomsnitt Qualcomm Snapdragon 835 (8998) (201881 - 217442, n=8) | |
| JetStream 1.1 - 1.1 Total | |
| Sony Xperia XZ2 (Chrome 65) | |
| Samsung Galaxy S9 (Samsung Browser 7.0) | |
| Motorola Moto Z2 Force (Chrome 63.0.3239.111) | |
| Genomsnitt Qualcomm Snapdragon 835 (8998) (52.9 - 80.4, n=19) | |
| Nokia 8 (Chrome 61.0.3163.98) | |
| Nokia 8 Sirocco (Chrome 66) | |
| Huawei P10 Plus | |
| Octane V2 - Total Score | |
| Genomsnitt av klass Smartphone (2800 - 126661, n=151, senaste 2 åren) | |
| Sony Xperia XZ2 (Chrome 65) | |
| Samsung Galaxy S9 (Samsung Browser 7.0) | |
| Motorola Moto Z2 Force (Chrome 63.0.3239.111) | |
| Nokia 8 Sirocco (Chrome 66) | |
| Genomsnitt Qualcomm Snapdragon 835 (8998) (3086 - 14300, n=20) | |
| Nokia 8 (Chrome 61.0.3163.98) | |
| Huawei P10 Plus (Chrome 58.0.3029.83) | |
| Mozilla Kraken 1.1 - Total | |
| Nokia 8 Sirocco (Chrome 66) | |
| Genomsnitt Qualcomm Snapdragon 835 (8998) (2425 - 4813, n=19) | |
| Motorola Moto Z2 Force (Chrome 63.0.3239.111) | |
| Nokia 8 (Chrome 61.0.3163.98) | |
| Huawei P10 Plus (Chrome 58.0.3029.83) | |
| Sony Xperia XZ2 (Chrome 65) | |
| Samsung Galaxy S9 (Samsung Browser 7.0) | |
| Genomsnitt av klass Smartphone (257 - 28190, n=129, senaste 2 åren) | |
| WebXPRT 2015 - Overall | |
| Sony Xperia XZ2 (Chrome 65) | |
| Nokia 8 Sirocco (Chrome 66) | |
| Nokia 8 (Chrome 61.0.3163.98) | |
| Genomsnitt Qualcomm Snapdragon 835 (8998) (57 - 204, n=17) | |
| Samsung Galaxy S9 (Samsung Browser 7.0) | |
| Motorola Moto Z2 Force (Chrome 63.0.3239.111) | |
| Huawei P10 Plus | |
* ... mindre är bättre
| Nokia 8 Sirocco | Sony Xperia XZ2 | Motorola Moto Z2 Force | Samsung Galaxy S9 | Huawei P10 Plus | Nokia 8 | Genomsnitt 128 GB UFS 2.1 Flash | Genomsnitt av klass Smartphone | |
|---|---|---|---|---|---|---|---|---|
| AndroBench 3-5 | -8% | 63% | 1% | 144% | -11% | 135% | 659% | |
| Sequential Read 256KB (MB/s) | 738 | 679 -8% | 696 -6% | 815 10% | 733 -1% | 680 -8% | 762 ? 3% | 2244 ? 204% |
| Sequential Write 256KB (MB/s) | 211.6 | 198.7 -6% | 213.6 1% | 206.9 -2% | 182.6 -14% | 199.1 -6% | 300 ? 42% | 1928 ? 811% |
| Random Read 4KB (MB/s) | 140.7 | 149.4 6% | 148.8 6% | 131 -7% | 173.1 23% | 145.7 4% | 154.7 ? 10% | 312 ? 122% |
| Random Write 4KB (MB/s) | 22.4 | 17 -24% | 78.6 251% | 23.07 3% | 149.8 569% | 14.57 -35% | 131.1 ? 485% | 358 ? 1498% |
| Sequential Read 256KB SDCard (MB/s) | 34.25 ? | 77.4 ? | 79.2 ? | 54 ? | 76.8 ? | 76 ? | ||
| Sequential Write 256KB SDCard (MB/s) | 30.12 ? | 54.7 ? | 67.2 ? | 33.61 ? | 51.7 ? | 59.6 ? |
| Arena of Valor | |||
| Inställningar | Värde | ||
| min | 60 fps | ||
| high HD | 60 fps | ||
| Shadow Fight 3 | |||
| Inställningar | Värde | ||
| high | 60 fps | ||
| minimal | 60 fps | ||
(±) Den maximala temperaturen på ovansidan är 40.8 °C / 105 F, jämfört med genomsnittet av 35.3 °C / 96 F , allt från 21.9 till 247 °C för klassen Smartphone.
(±) Botten värms upp till maximalt 42.3 °C / 108 F, jämfört med genomsnittet av 34 °C / 93 F
(±) Vid tomgångsbruk är medeltemperaturen för ovansidan 32.1 °C / 90 F, jämfört med enhetsgenomsnittet på 33 °C / ### class_avg_f### F.
Nokia 8 Sirocco ljudanalys
(+) | högtalare kan spela relativt högt (91.1 dB)
Bas 100 - 315 Hz
(-) | nästan ingen bas - i genomsnitt 27.1% lägre än medianen
(±) | linjäriteten för basen är genomsnittlig (7.9% delta till föregående frekvens)
Mellan 400 - 2000 Hz
(±) | reducerade mids - i genomsnitt 5.8% lägre än median
(+) | mids är linjära (6.6% delta till föregående frekvens)
Högsta 2 - 16 kHz
(±) | högre toppar - i genomsnitt 11.6% högre än medianen
(+) | toppar är linjära (3.4% delta till föregående frekvens)
Totalt 100 - 16 000 Hz
(±) | linjäriteten för det totala ljudet är genomsnittlig (25.1% skillnad mot median)
Jämfört med samma klass
» 62% av alla testade enheter i den här klassen var bättre, 6% liknande, 31% sämre
» Den bästa hade ett delta på 11%, genomsnittet var 34%, sämst var 134%
Jämfört med alla testade enheter
» 77% av alla testade enheter var bättre, 5% liknande, 18% sämre
» Den bästa hade ett delta på 4%, genomsnittet var 23%, sämst var 134%
Nokia 8 ljudanalys
(+) | högtalare kan spela relativt högt (91.6 dB)
Bas 100 - 315 Hz
(-) | nästan ingen bas - i genomsnitt 26.6% lägre än medianen
(+) | basen är linjär (5.9% delta till föregående frekvens)
Mellan 400 - 2000 Hz
(±) | reducerade mids - i genomsnitt 6.7% lägre än median
(+) | mids är linjära (5.6% delta till föregående frekvens)
Högsta 2 - 16 kHz
(±) | högre toppar - i genomsnitt 8% högre än medianen
(+) | toppar är linjära (5% delta till föregående frekvens)
Totalt 100 - 16 000 Hz
(±) | linjäriteten för det totala ljudet är genomsnittlig (21.9% skillnad mot median)
Jämfört med samma klass
» 45% av alla testade enheter i den här klassen var bättre, 8% liknande, 47% sämre
» Den bästa hade ett delta på 11%, genomsnittet var 34%, sämst var 134%
Jämfört med alla testade enheter
» 63% av alla testade enheter var bättre, 7% liknande, 30% sämre
» Den bästa hade ett delta på 4%, genomsnittet var 23%, sämst var 134%
| Av/Standby | |
| Låg belastning | |
| Hög belastning |
|
Förklaring:
min: | |
| Nokia 8 Sirocco 3260 mAh | Sony Xperia XZ2 3180 mAh | Motorola Moto Z2 Force 2730 mAh | Samsung Galaxy S9 3000 mAh | Huawei P10 Plus 3750 mAh | Nokia 8 3090 mAh | Genomsnitt Qualcomm Snapdragon 835 (8998) | Genomsnitt av klass Smartphone | |
|---|---|---|---|---|---|---|---|---|
| Power Consumption | -29% | 29% | 19% | -66% | -33% | -26% | -34% | |
| Idle Minimum * (Watt) | 0.78 | 0.72 8% | 0.52 33% | 0.65 17% | 1.03 -32% | 0.86 -10% | 0.852 ? -9% | 0.878 ? -13% |
| Idle Average * (Watt) | 1.53 | 2.21 -44% | 0.84 45% | 0.81 47% | 2.61 -71% | 2.13 -39% | 2.02 ? -32% | 1.472 ? 4% |
| Idle Maximum * (Watt) | 1.57 | 2.22 -41% | 0.85 46% | 0.92 41% | 2.83 -80% | 2.16 -38% | 2.12 ? -35% | 1.655 ? -5% |
| Load Average * (Watt) | 3.49 | 4.6 -32% | 2.71 22% | 4.76 -36% | 7.03 -101% | 4.65 -33% | 4.69 ? -34% | 6.72 ? -93% |
| Load Maximum * (Watt) | 6.96 | 9.34 -34% | 7.2 -3% | 5.16 26% | 10.08 -45% | 9.99 -44% | 8.46 ? -22% | 11.3 ? -62% |
* ... mindre är bättre
| Nokia 8 Sirocco 3260 mAh | Sony Xperia XZ2 3180 mAh | Motorola Moto Z2 Force 2730 mAh | Samsung Galaxy S9 3000 mAh | Huawei P10 Plus 3750 mAh | Nokia 8 3090 mAh | |
|---|---|---|---|---|---|---|
| Batteridrifttid | -16% | 1% | -31% | -7% | -9% | |
| Reader / Idle (h) | 26.7 | 23.4 -12% | 27.2 2% | 19.7 -26% | 27.6 3% | 25.1 -6% |
| H.264 (h) | 12.1 | 12 -1% | 13.5 12% | 10.2 -16% | 12.6 4% | 12.2 1% |
| WiFi v1.3 (h) | 11.6 | 11.3 -3% | 8.9 -23% | 7.9 -32% | 12.7 9% | 10.8 -7% |
| Load (h) | 5.3 | 2.7 -49% | 5.9 11% | 2.7 -49% | 2.9 -45% | 4 -25% |
För
Emot
Läs den fullständiga versionen av den här recensionen på engelska här.
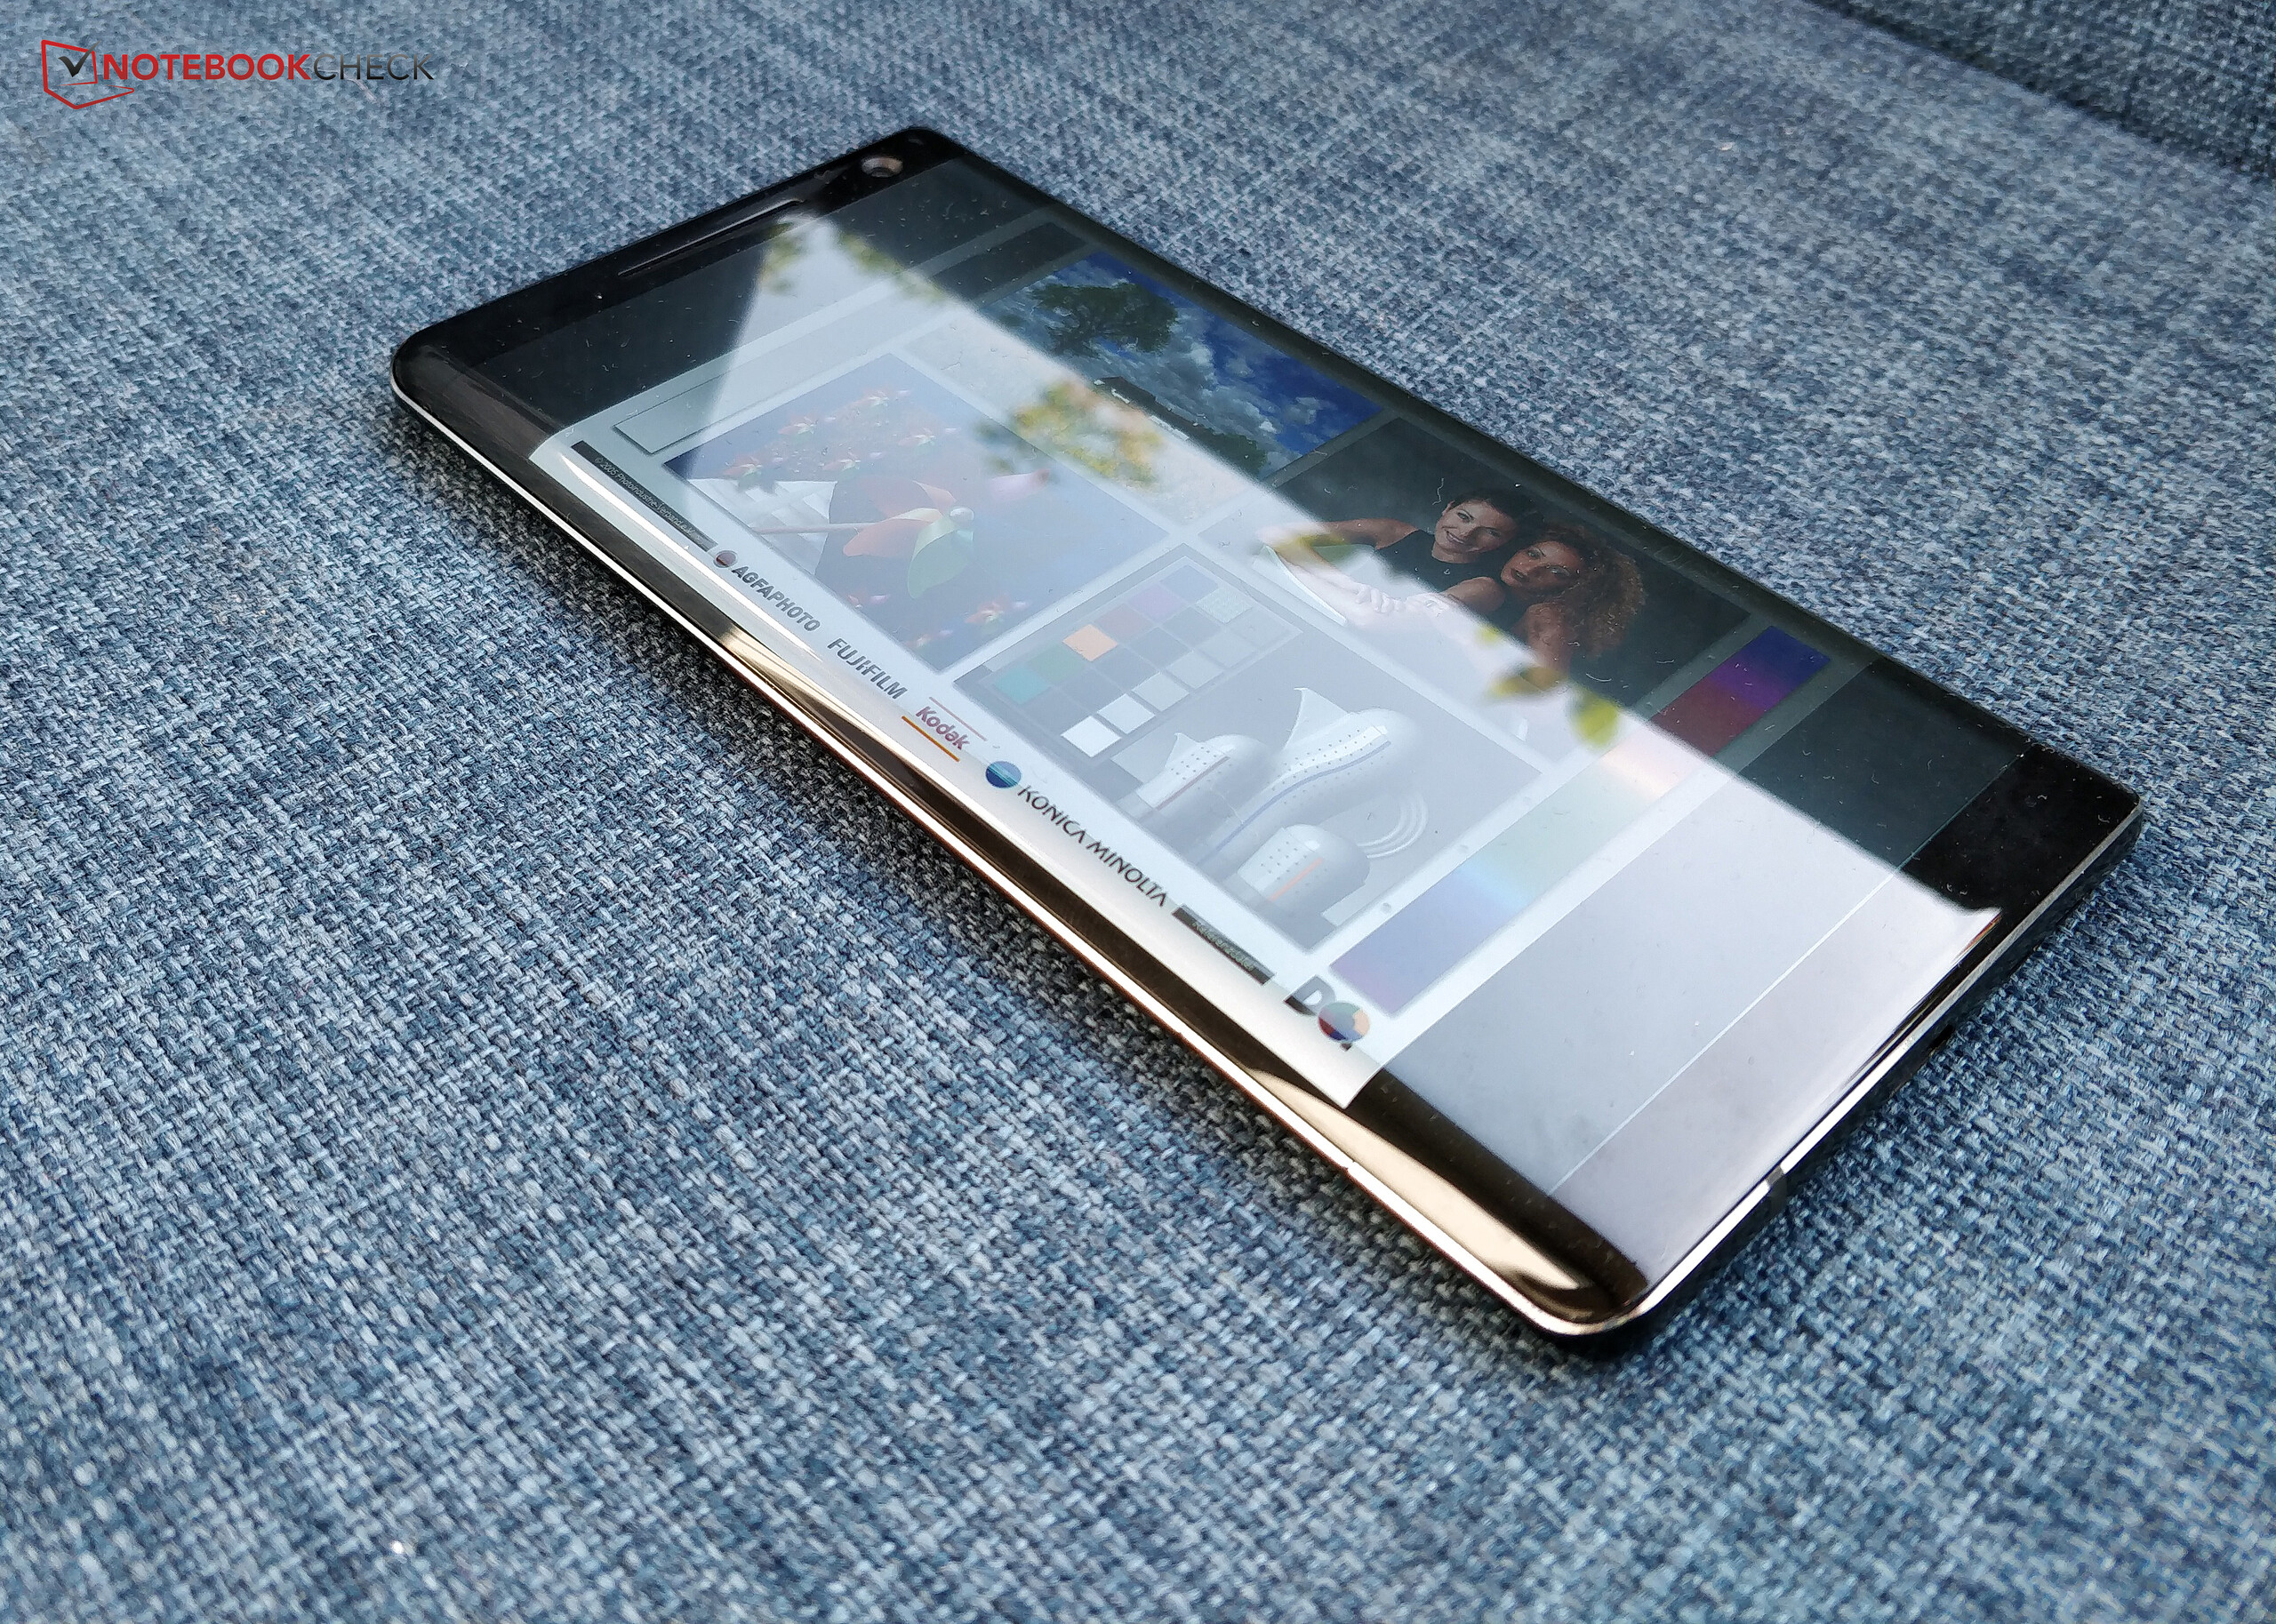
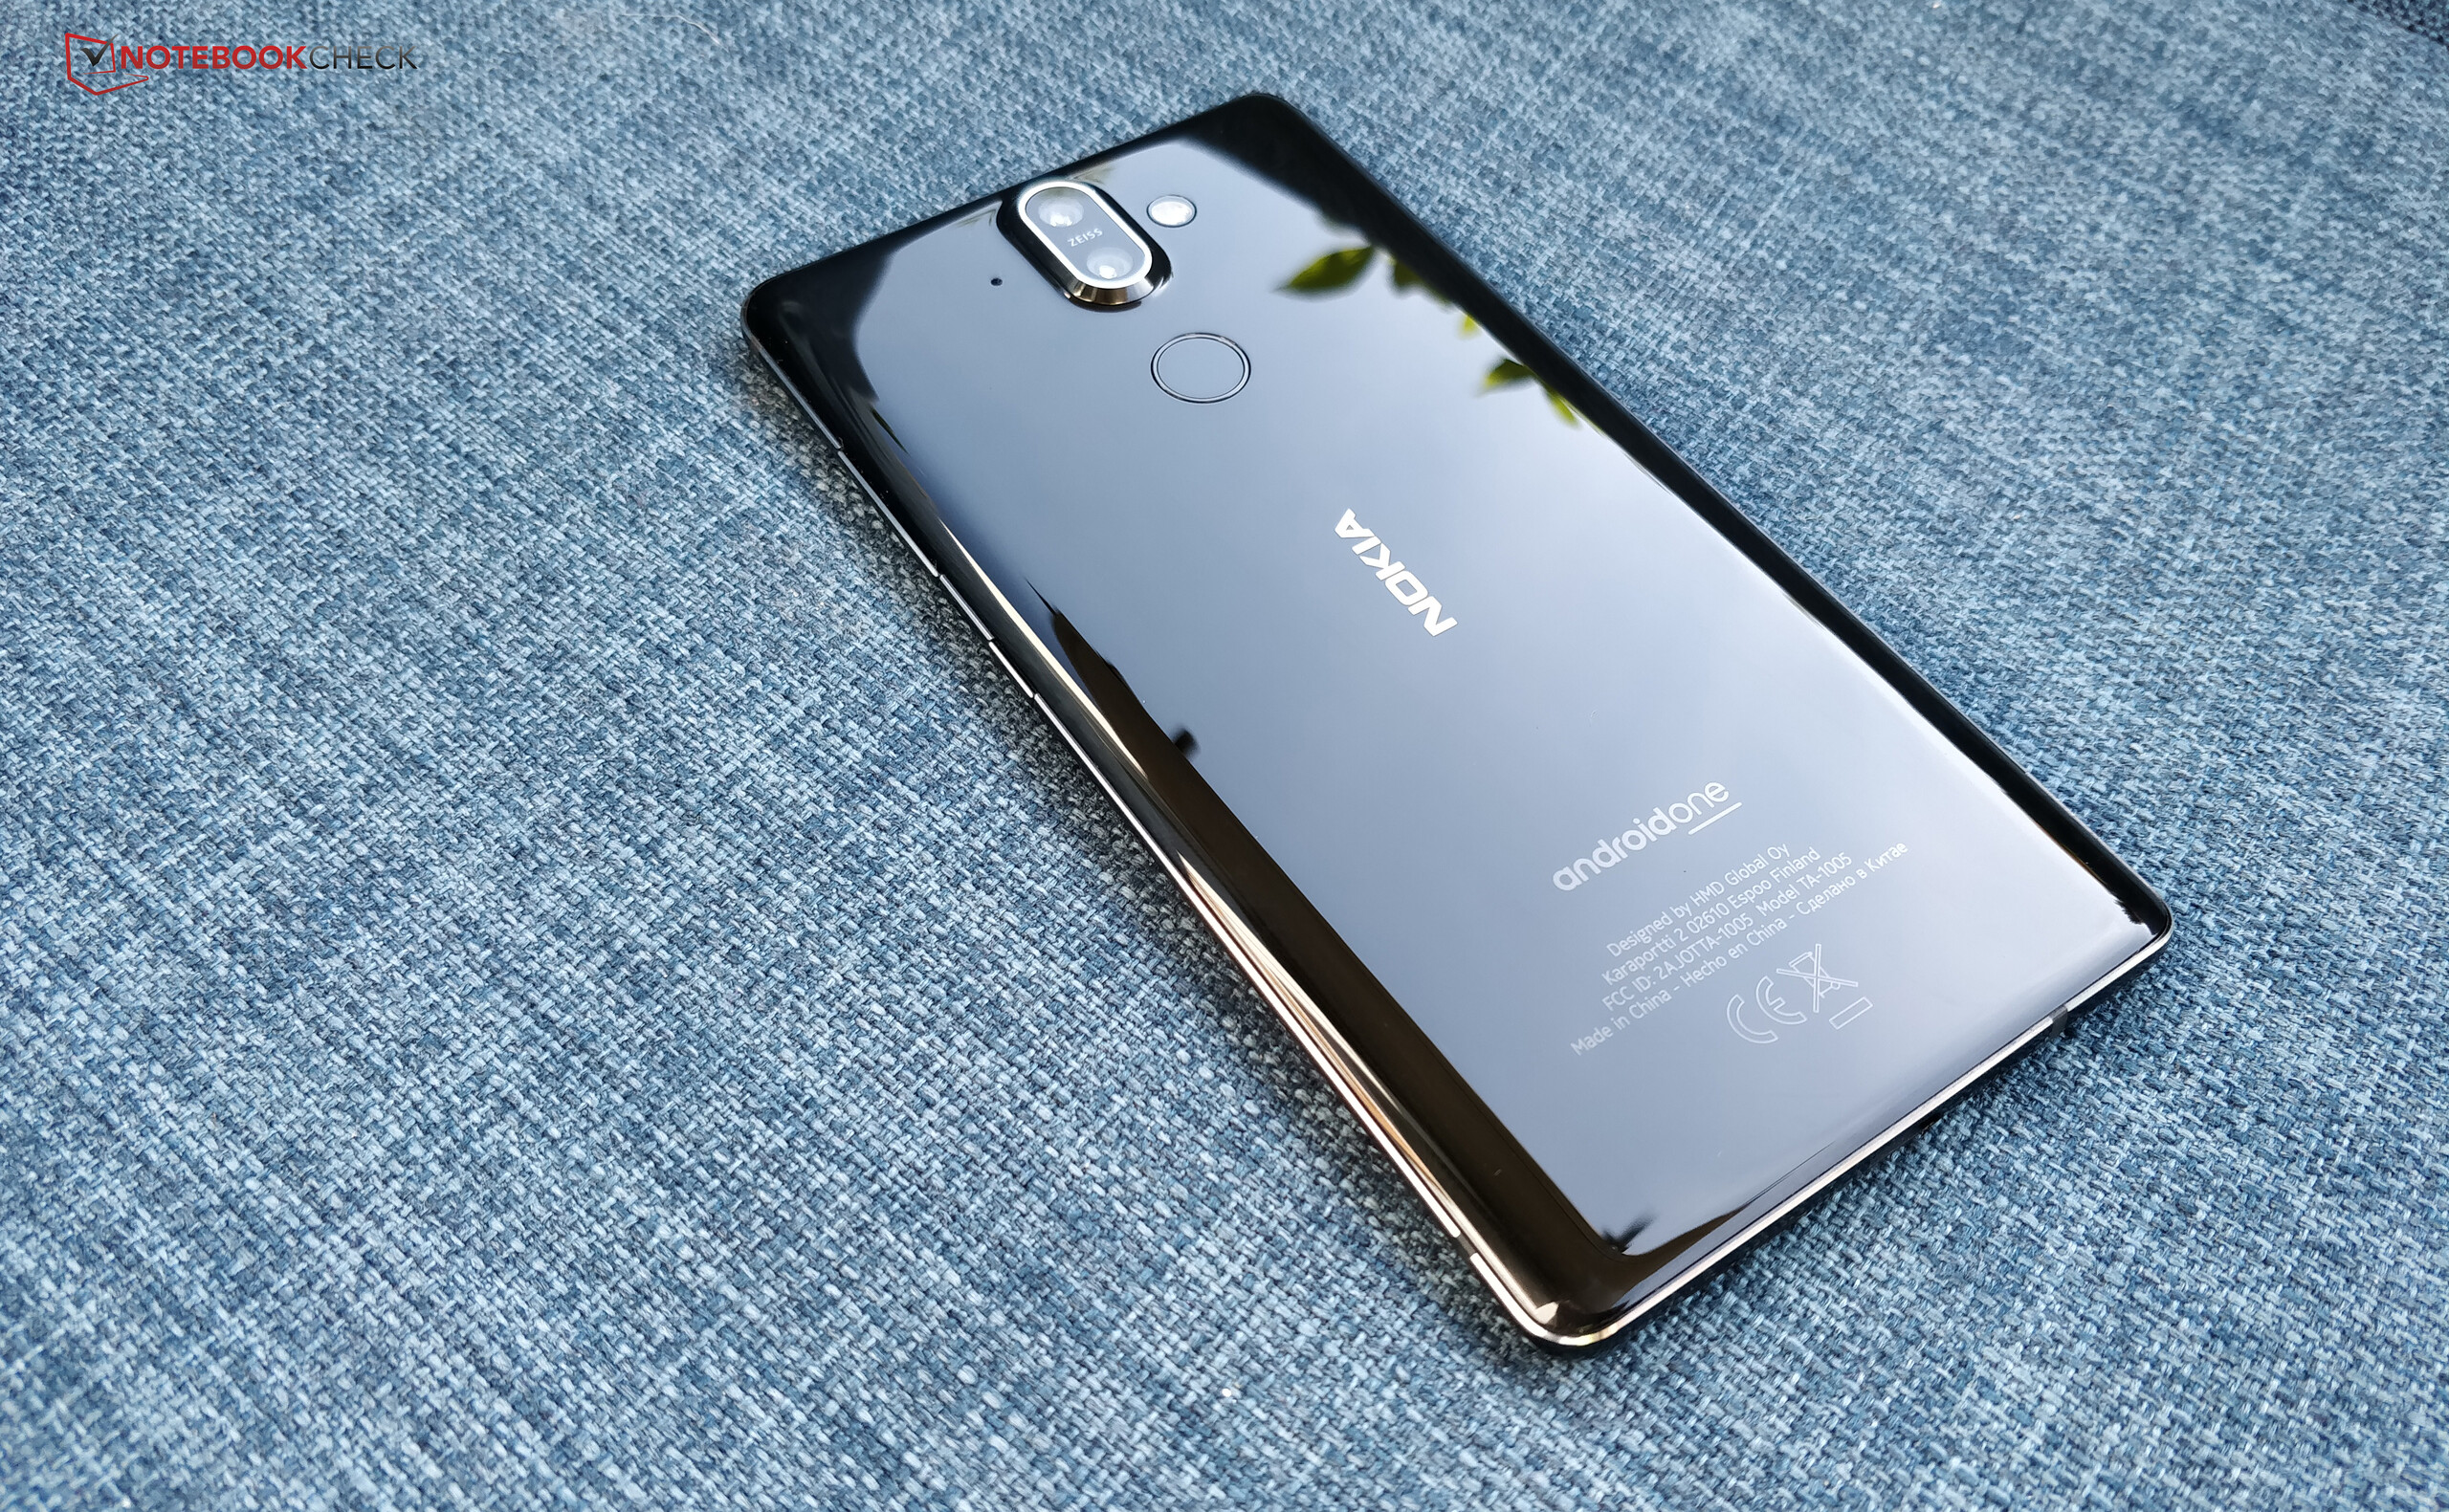
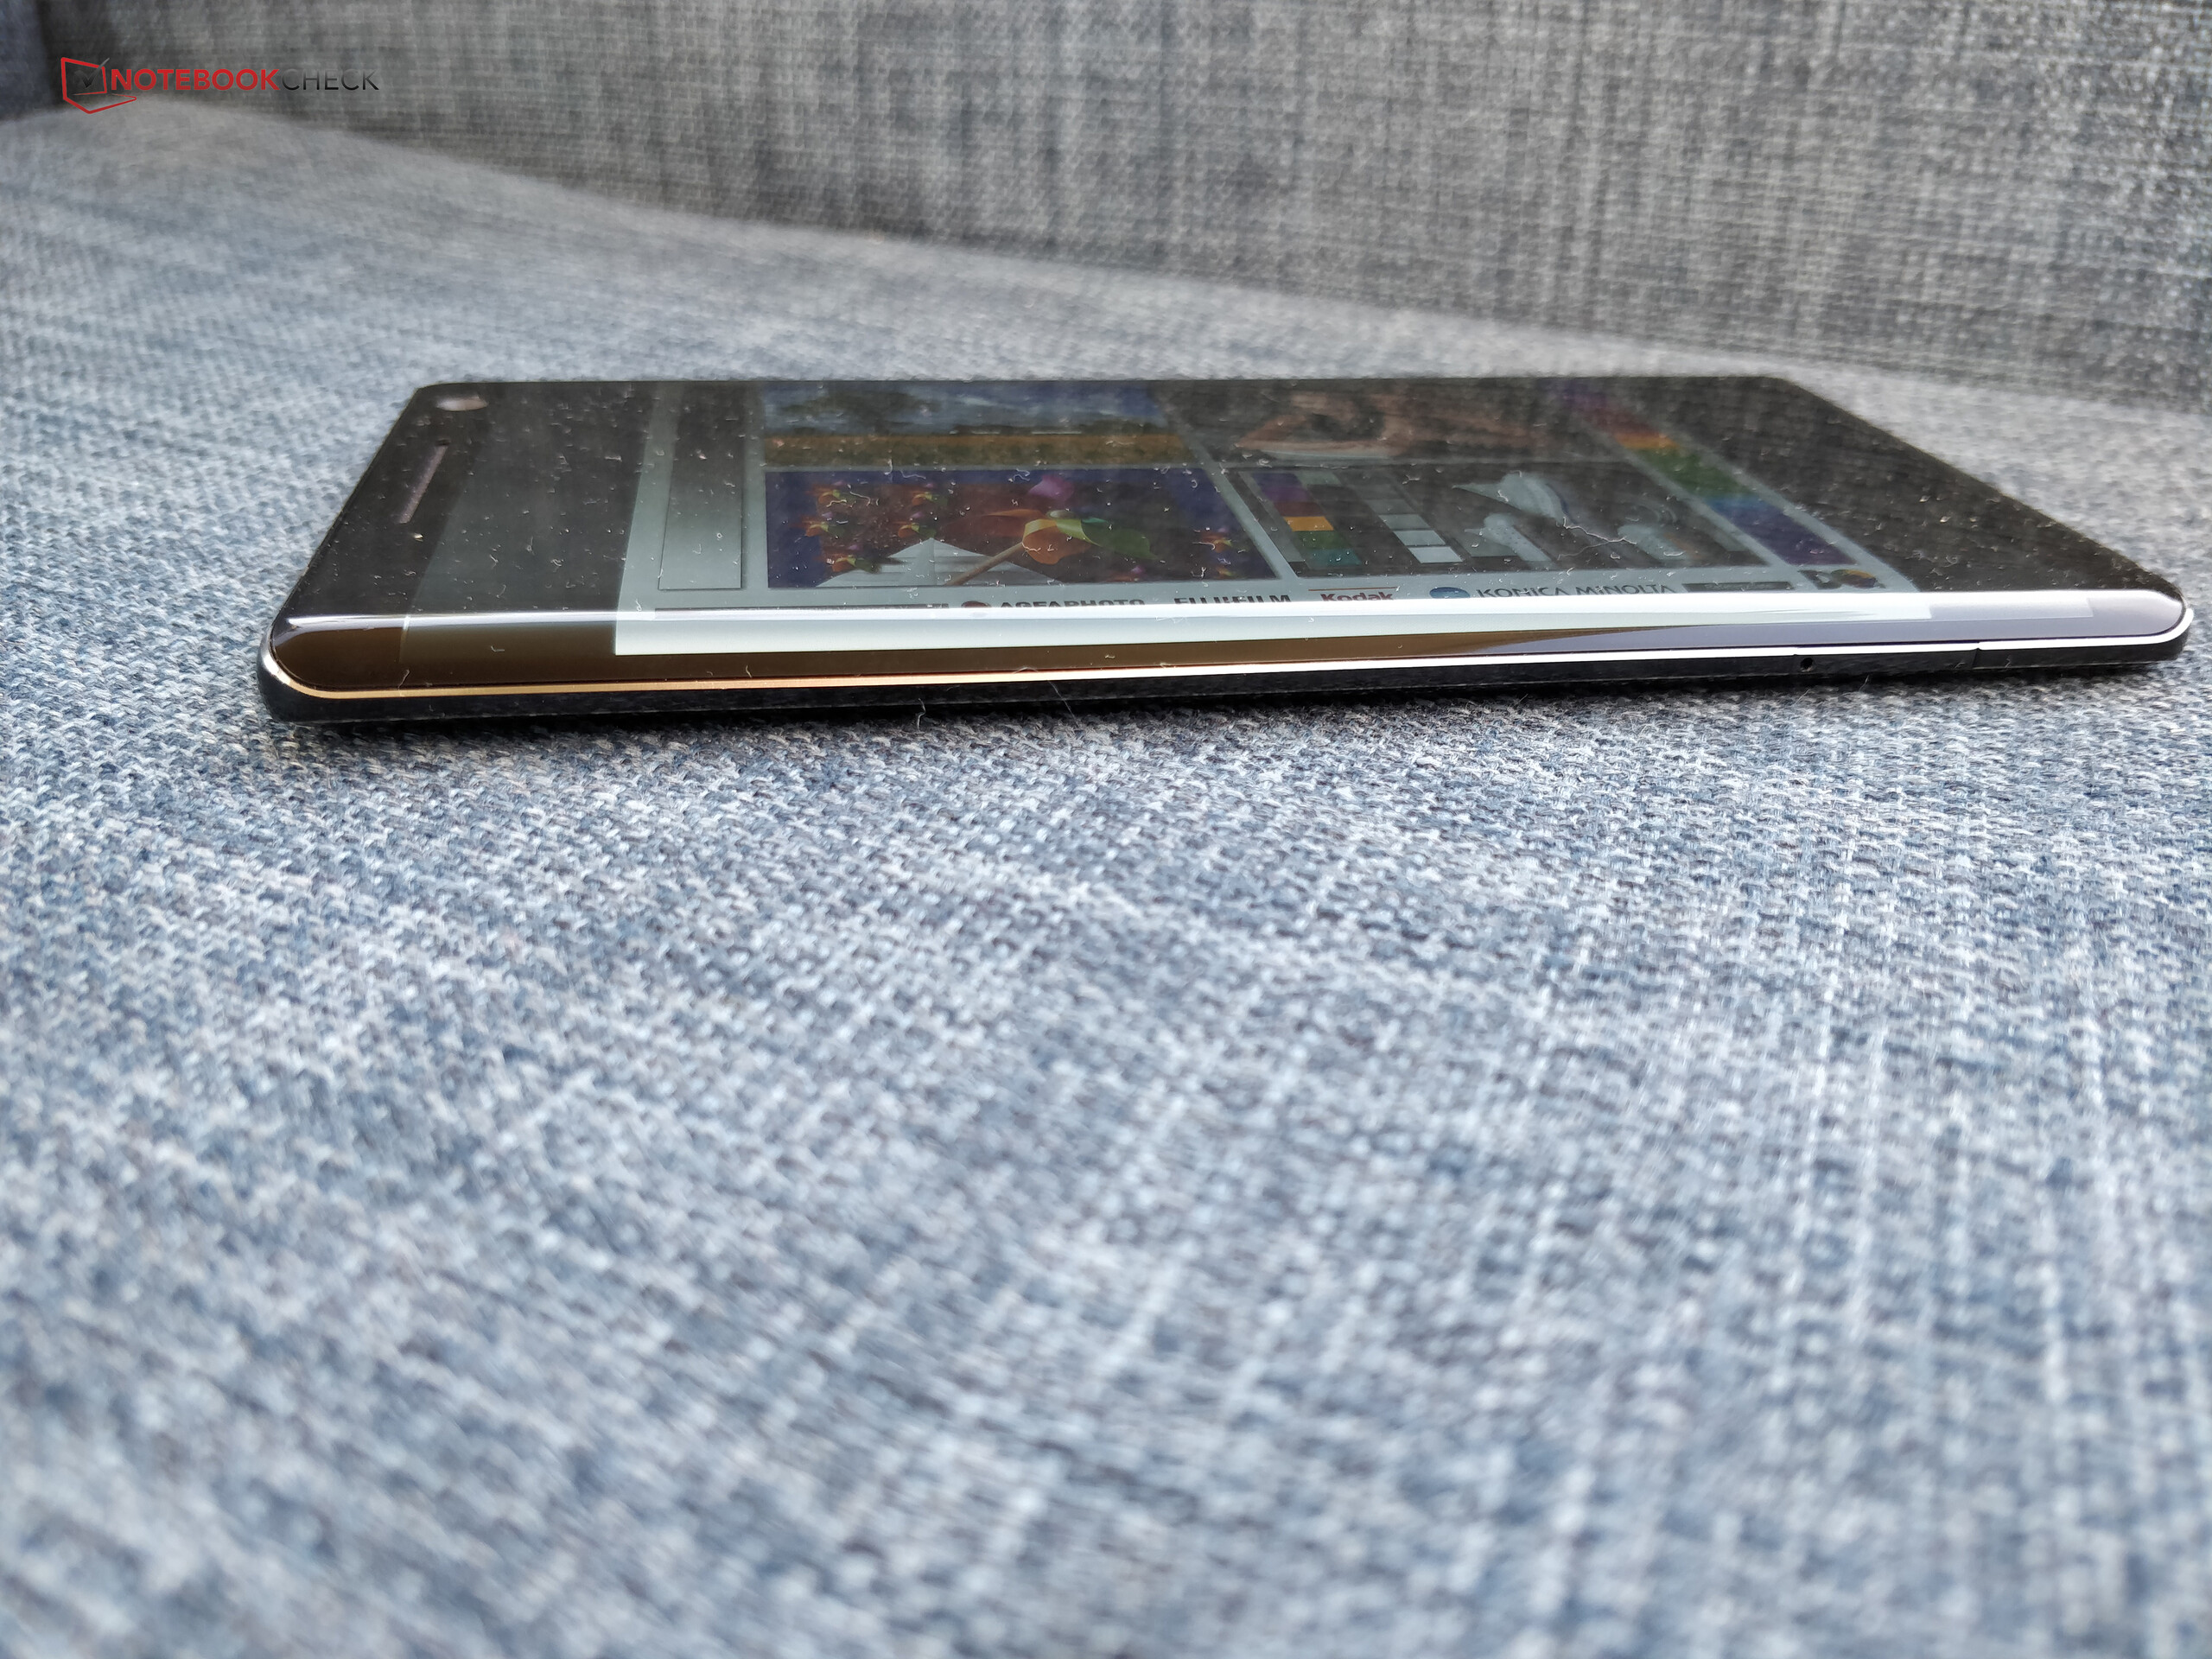
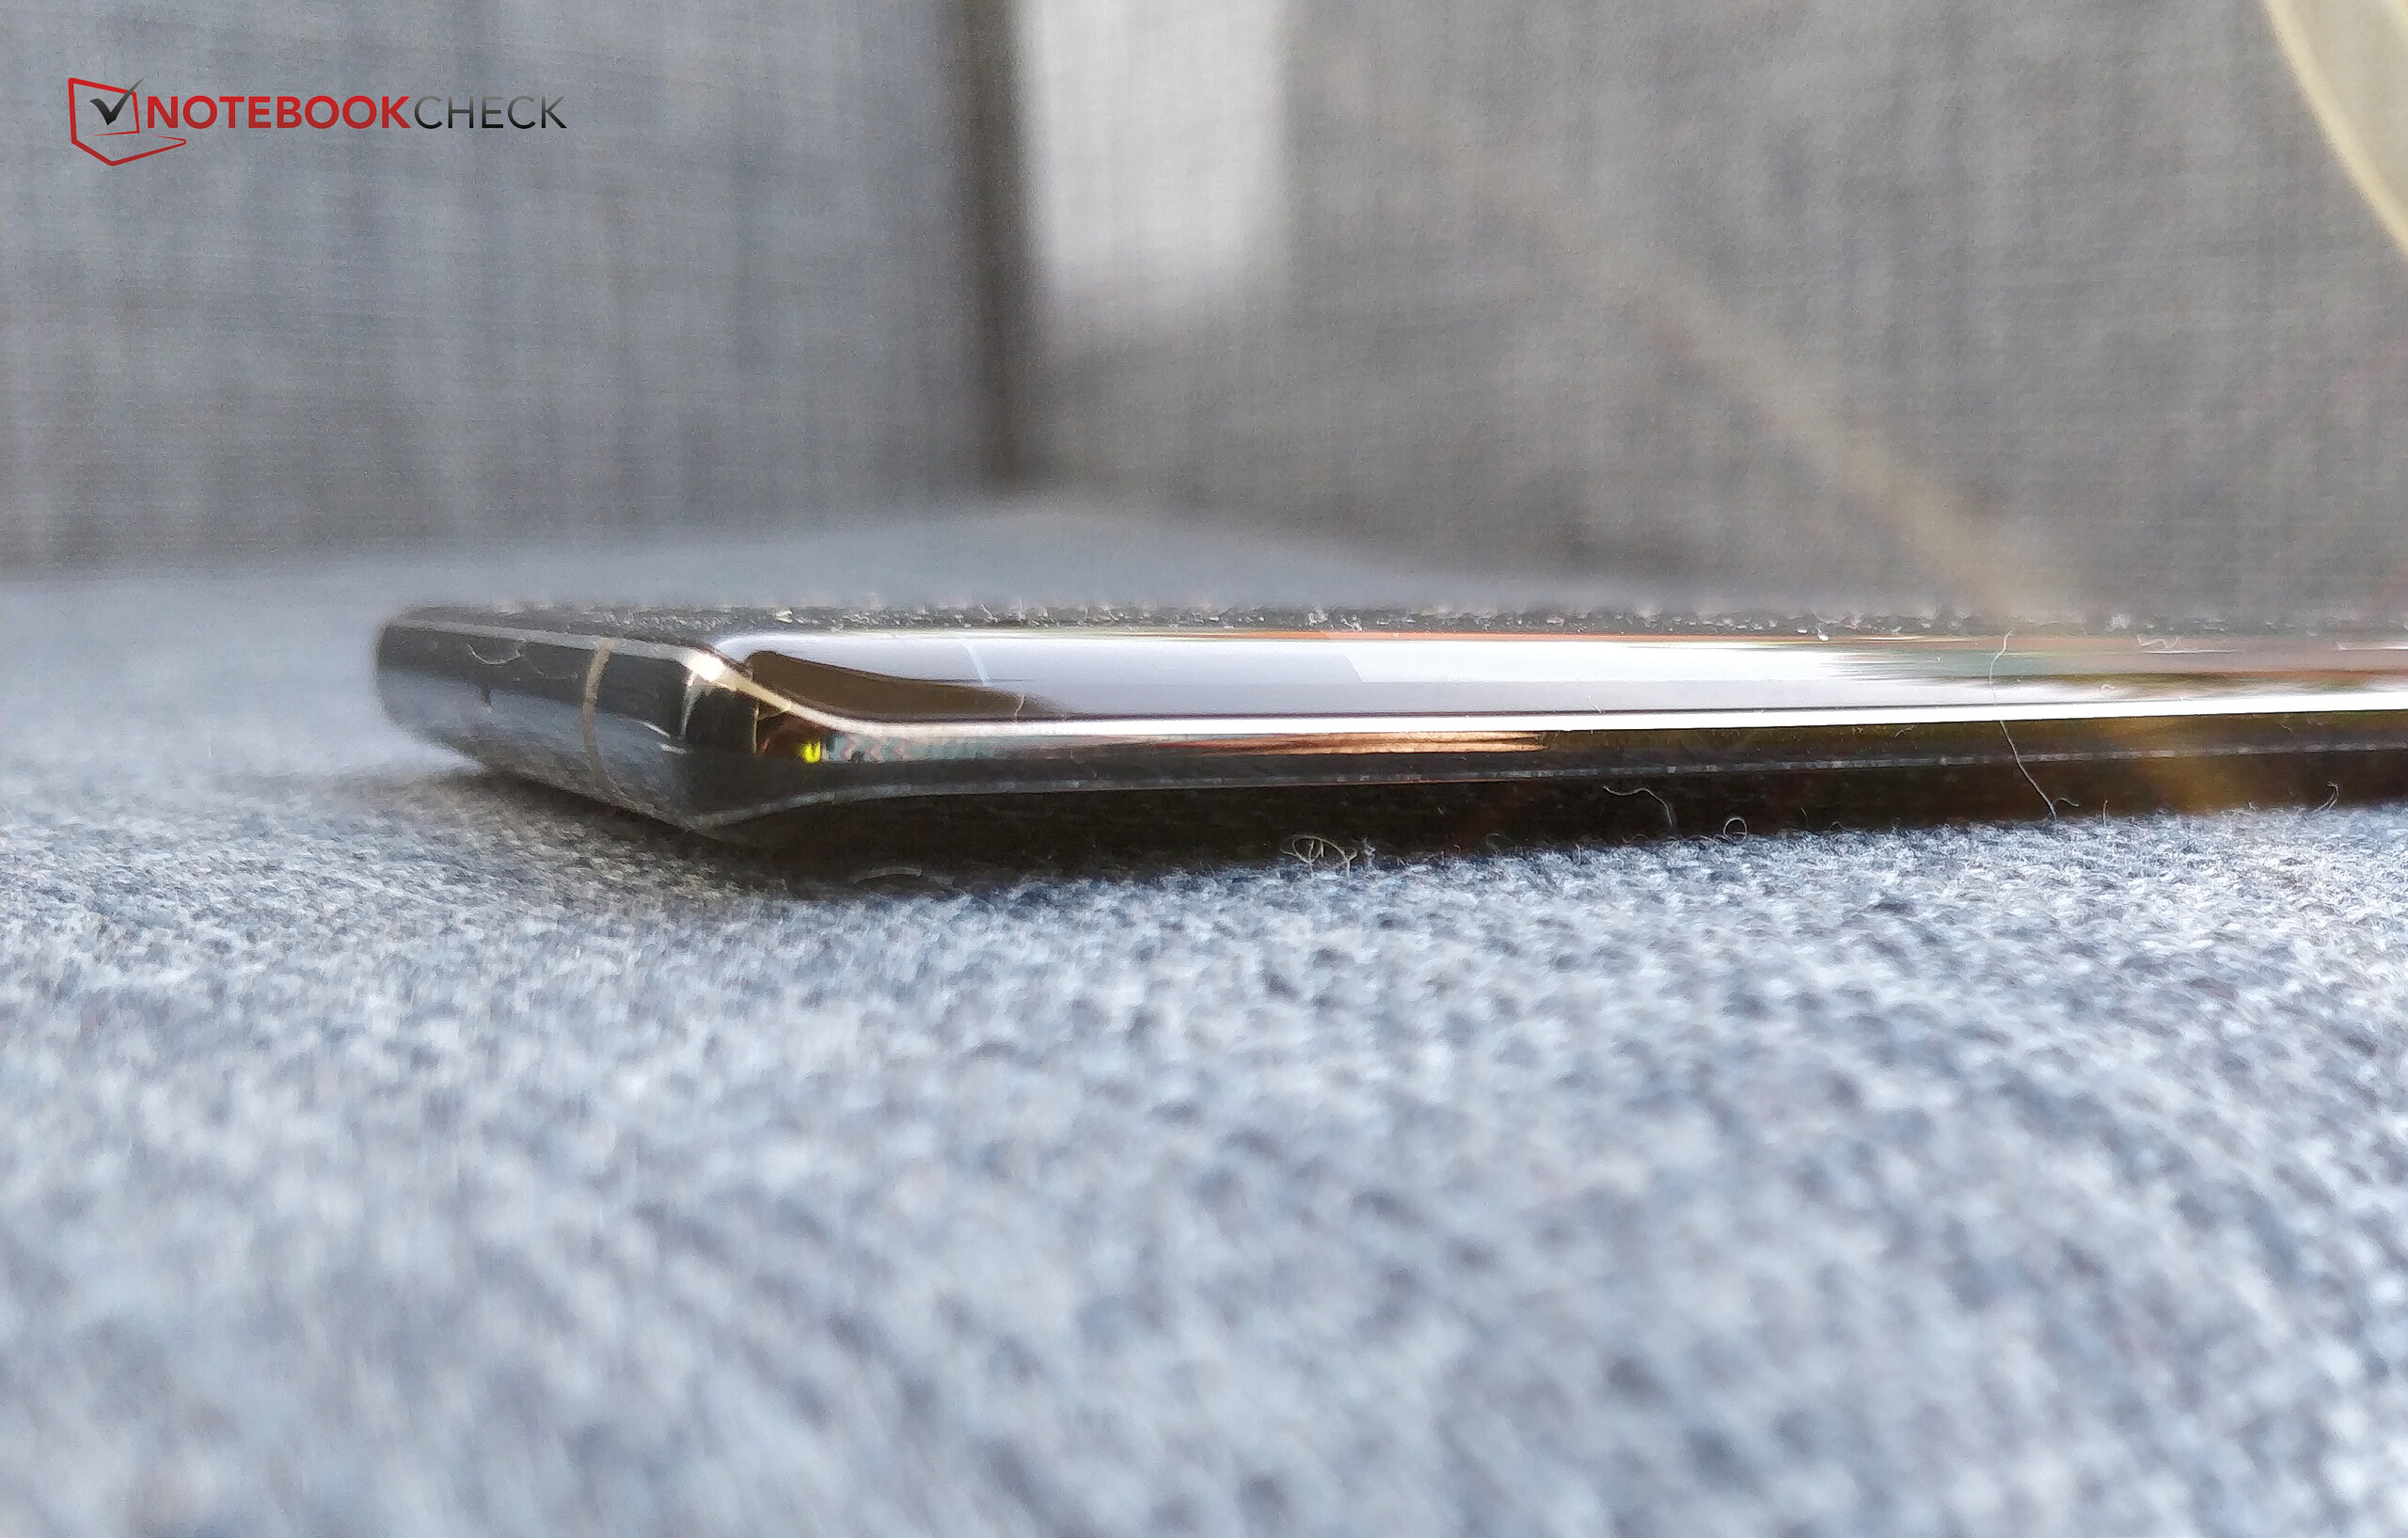
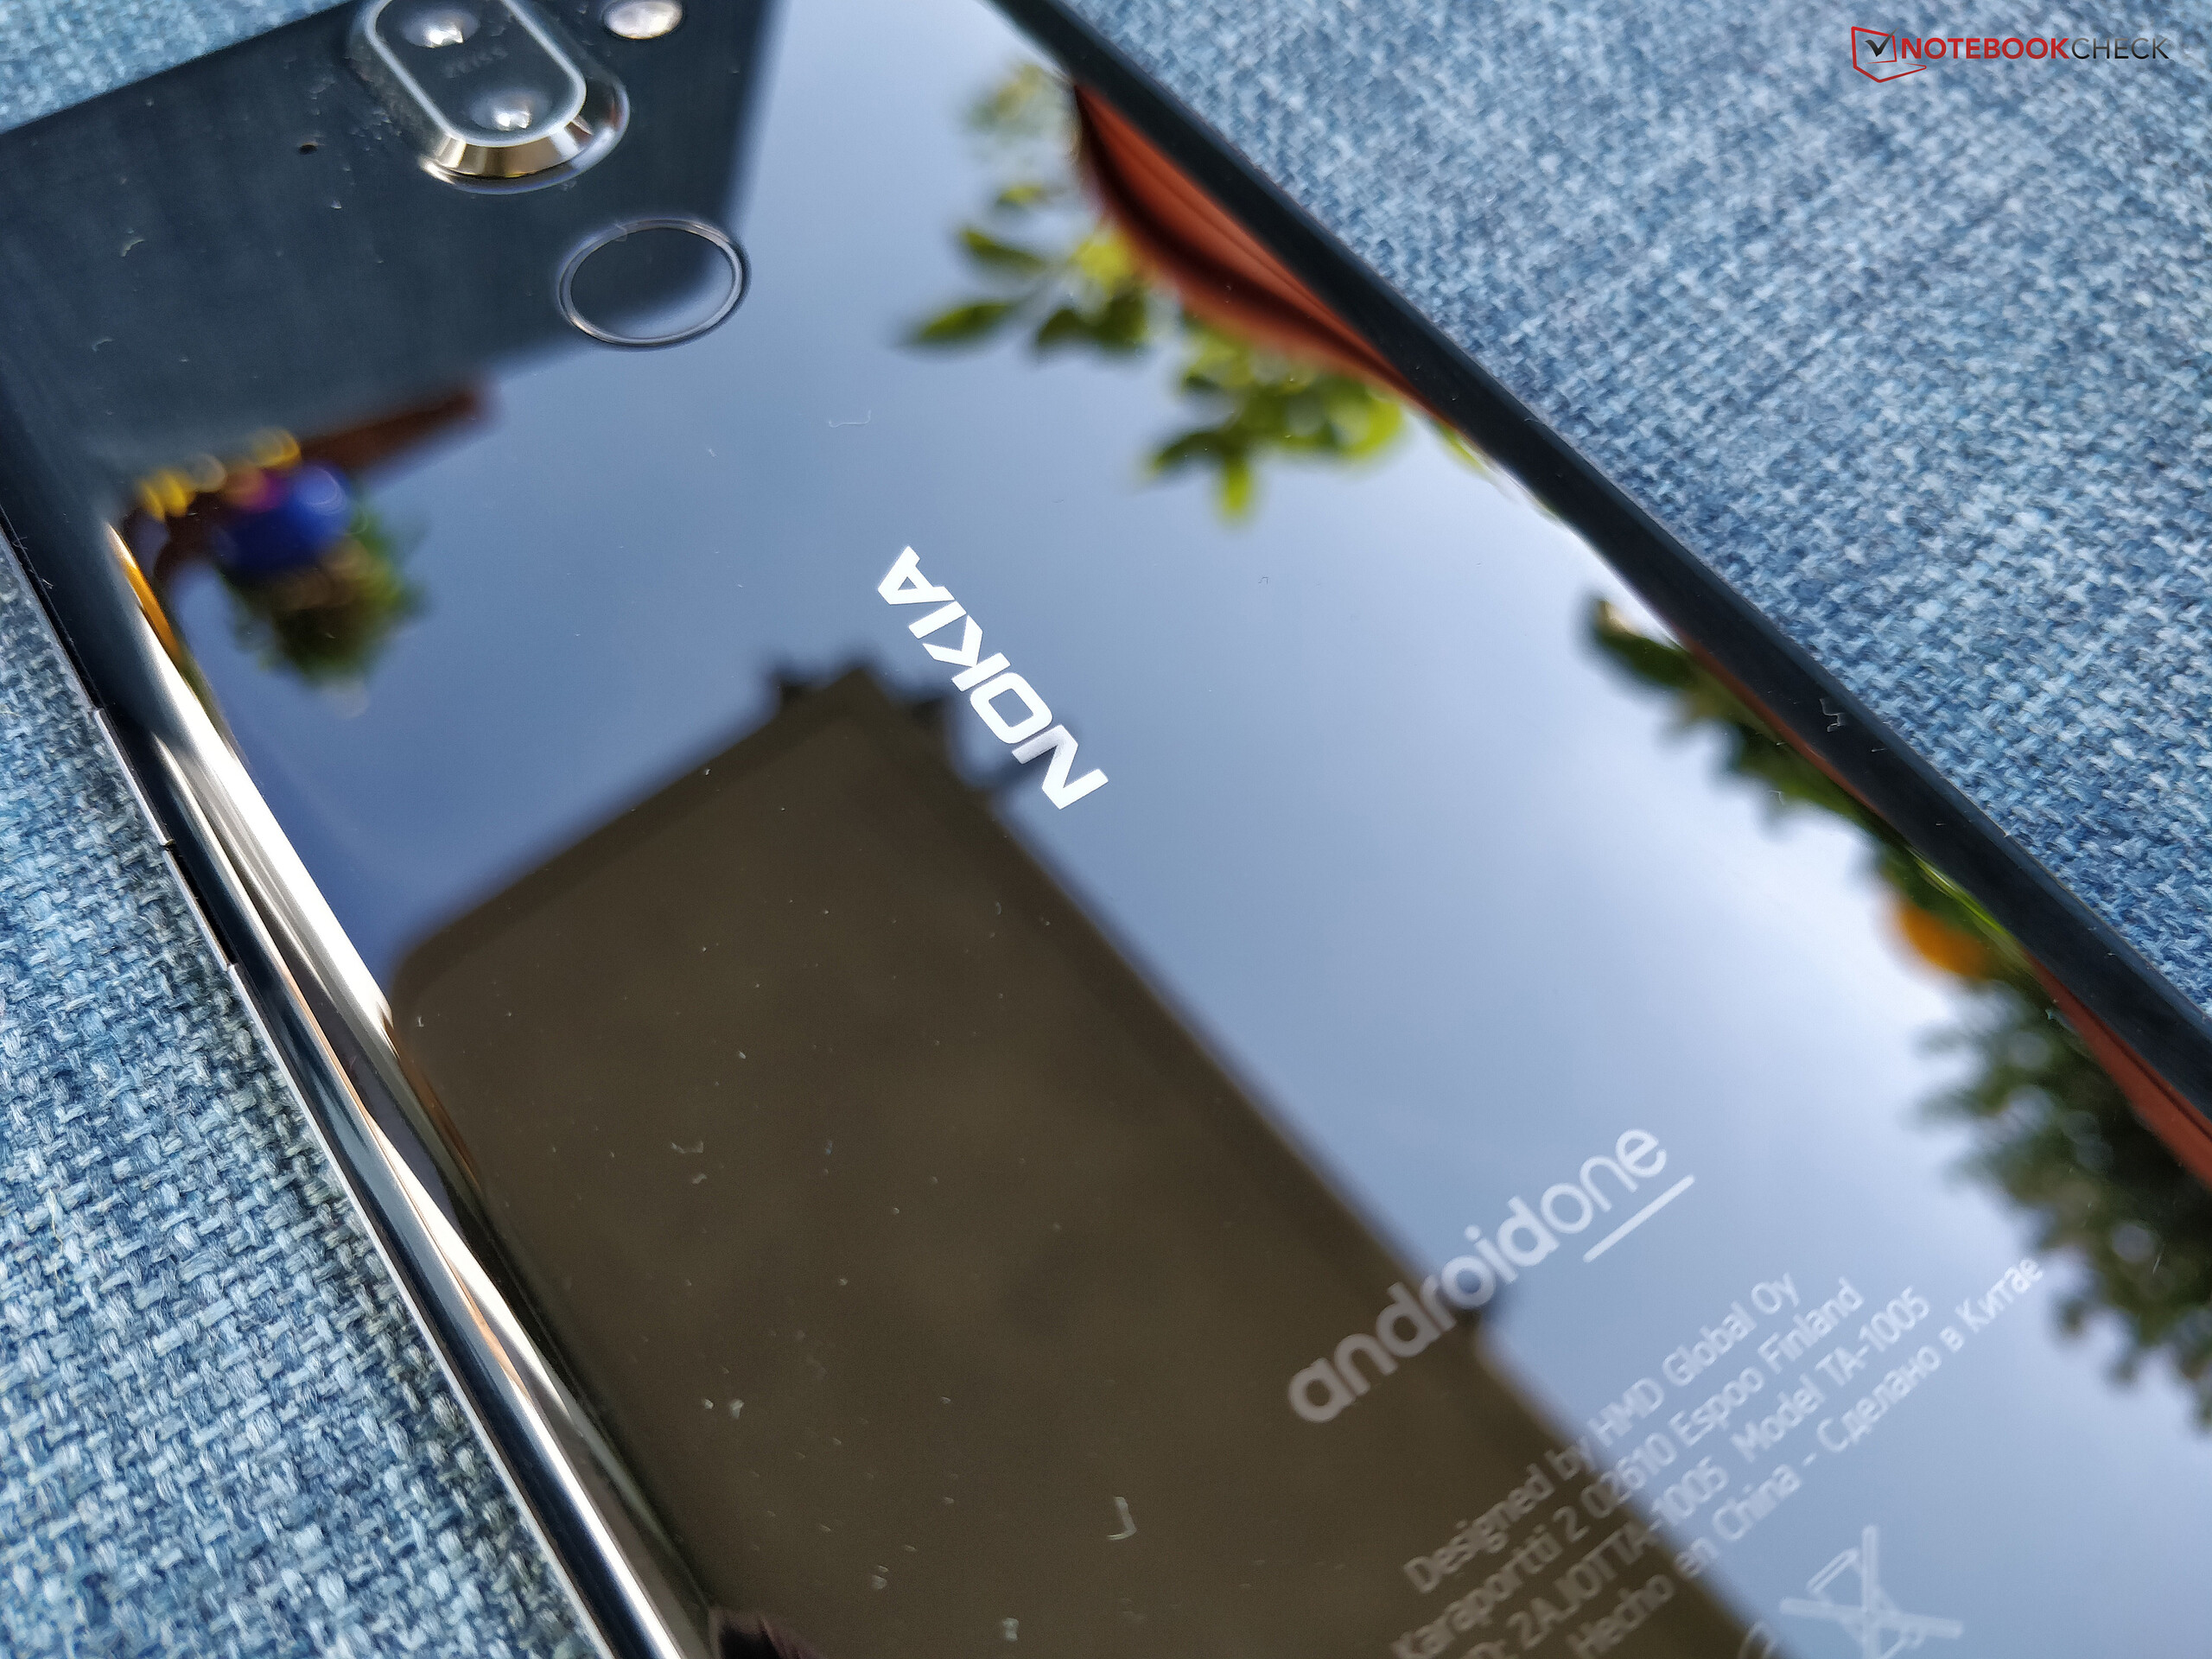
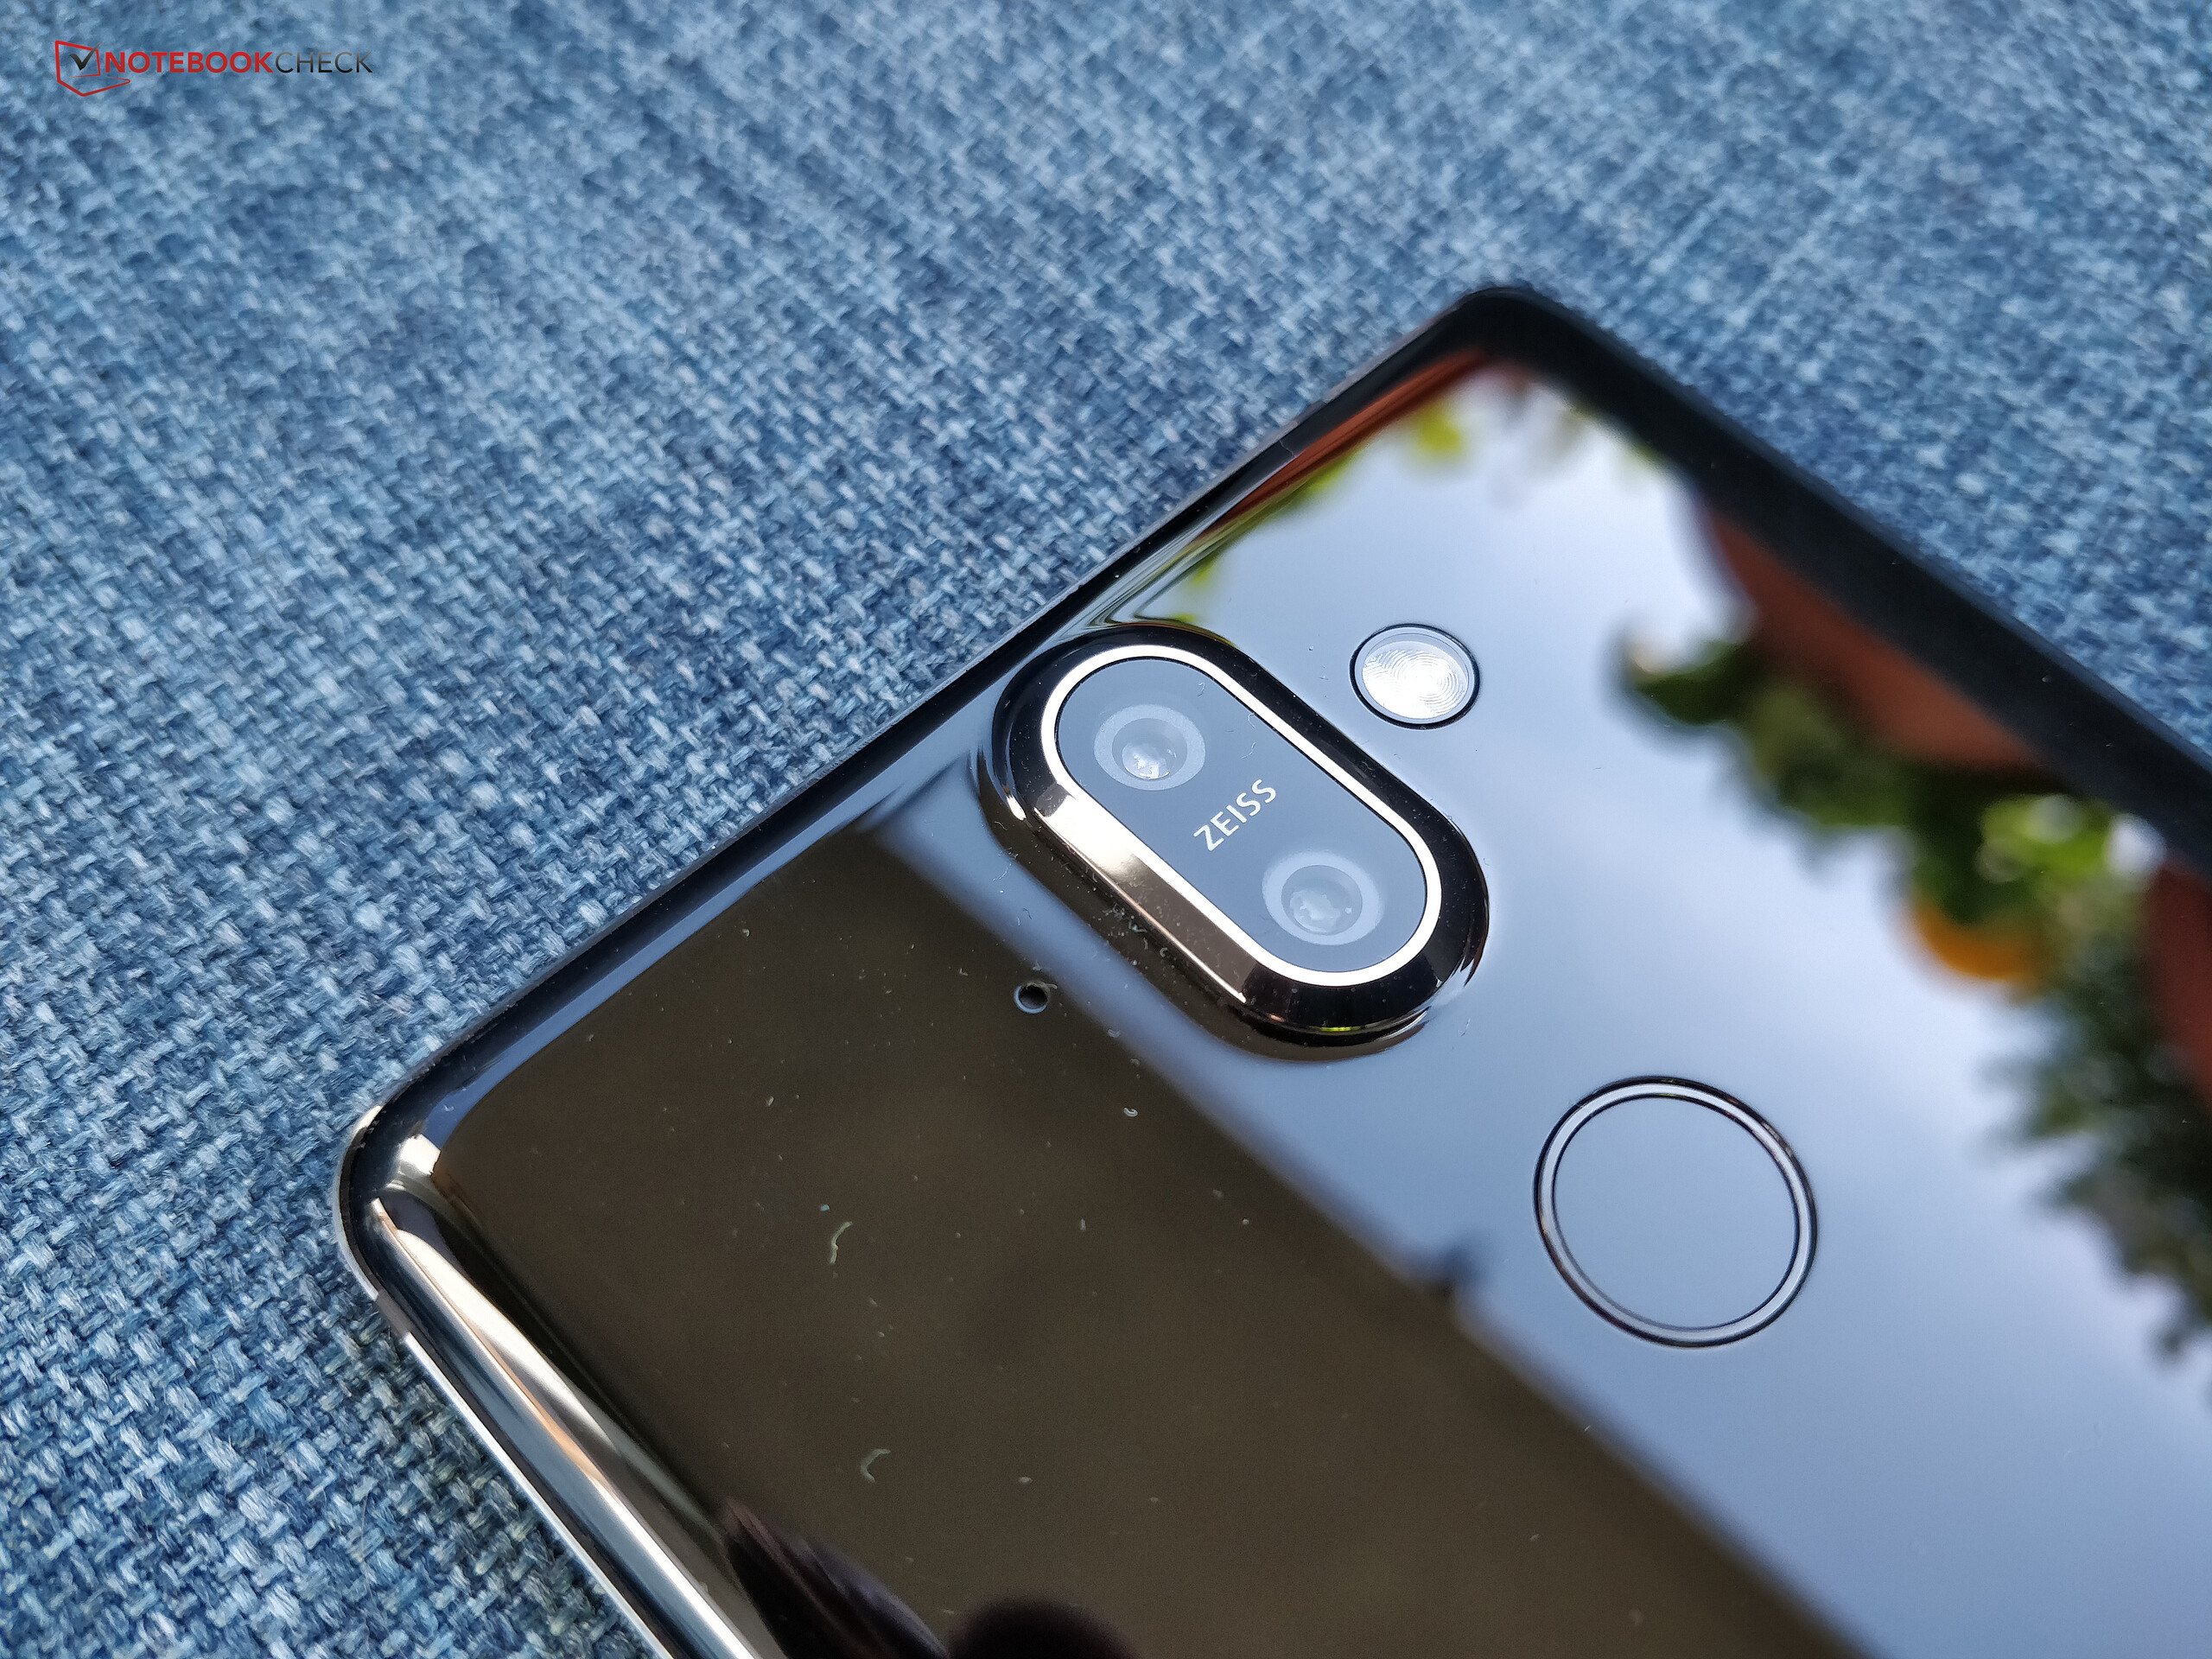
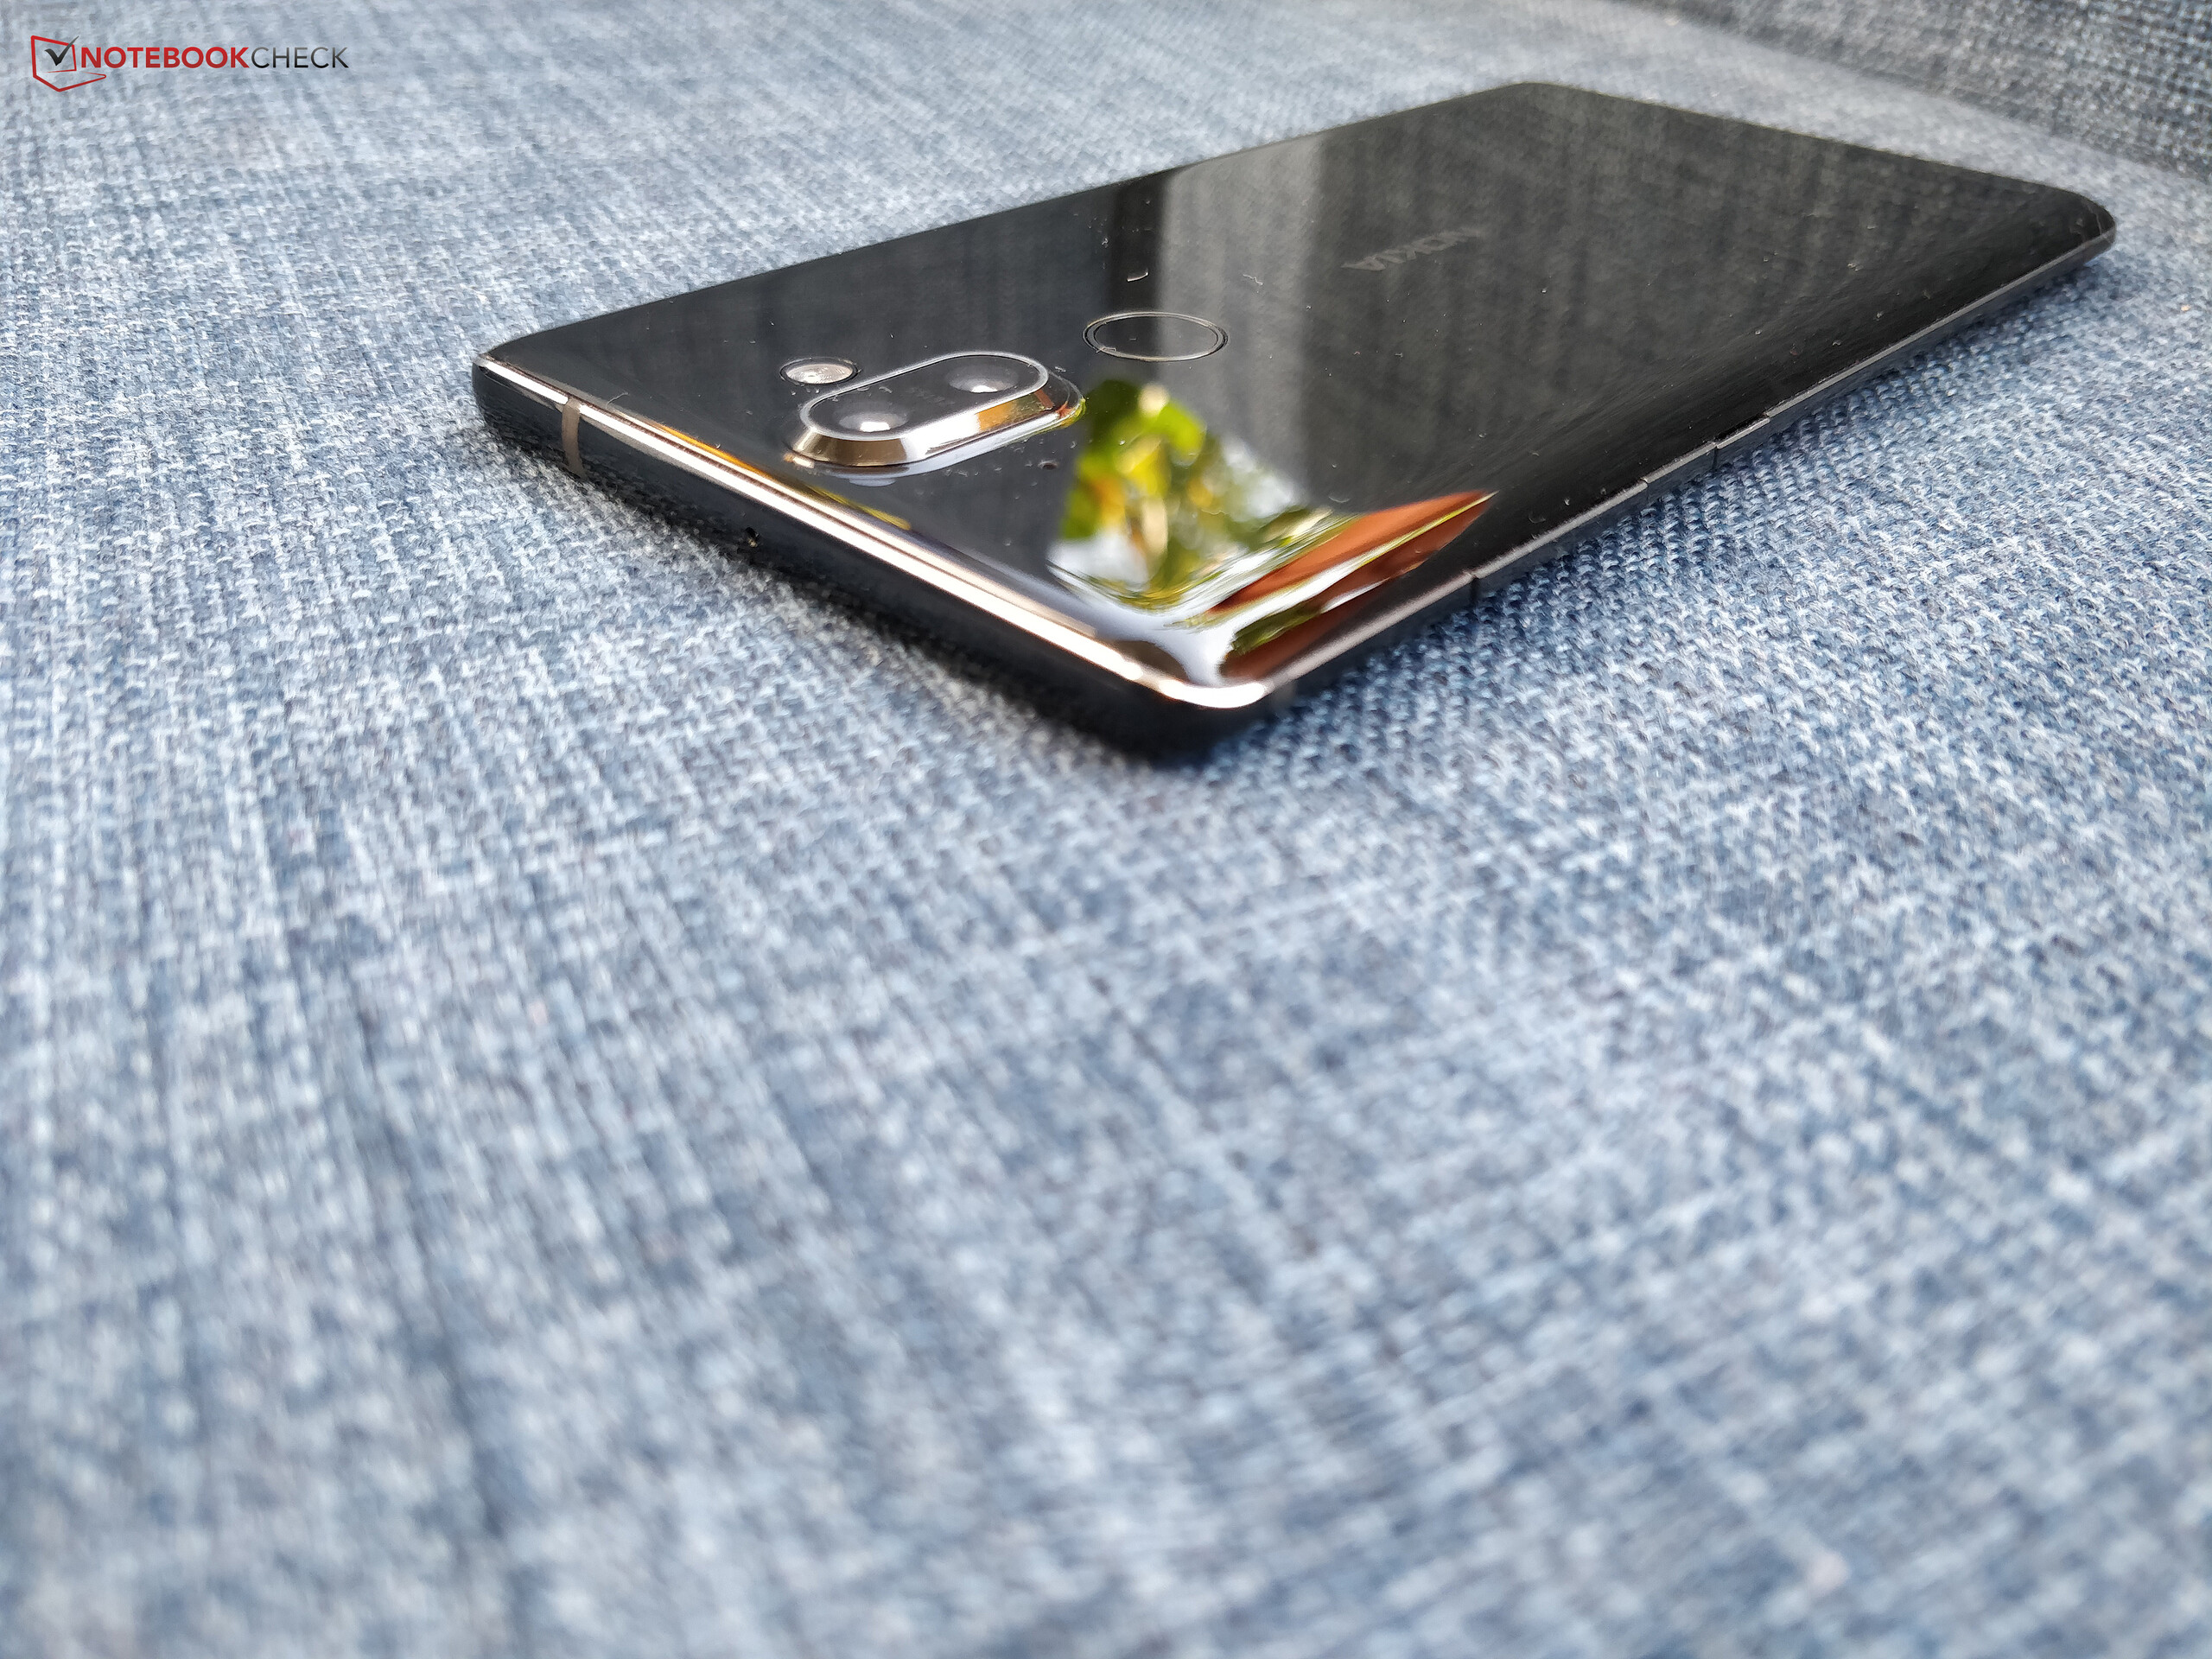
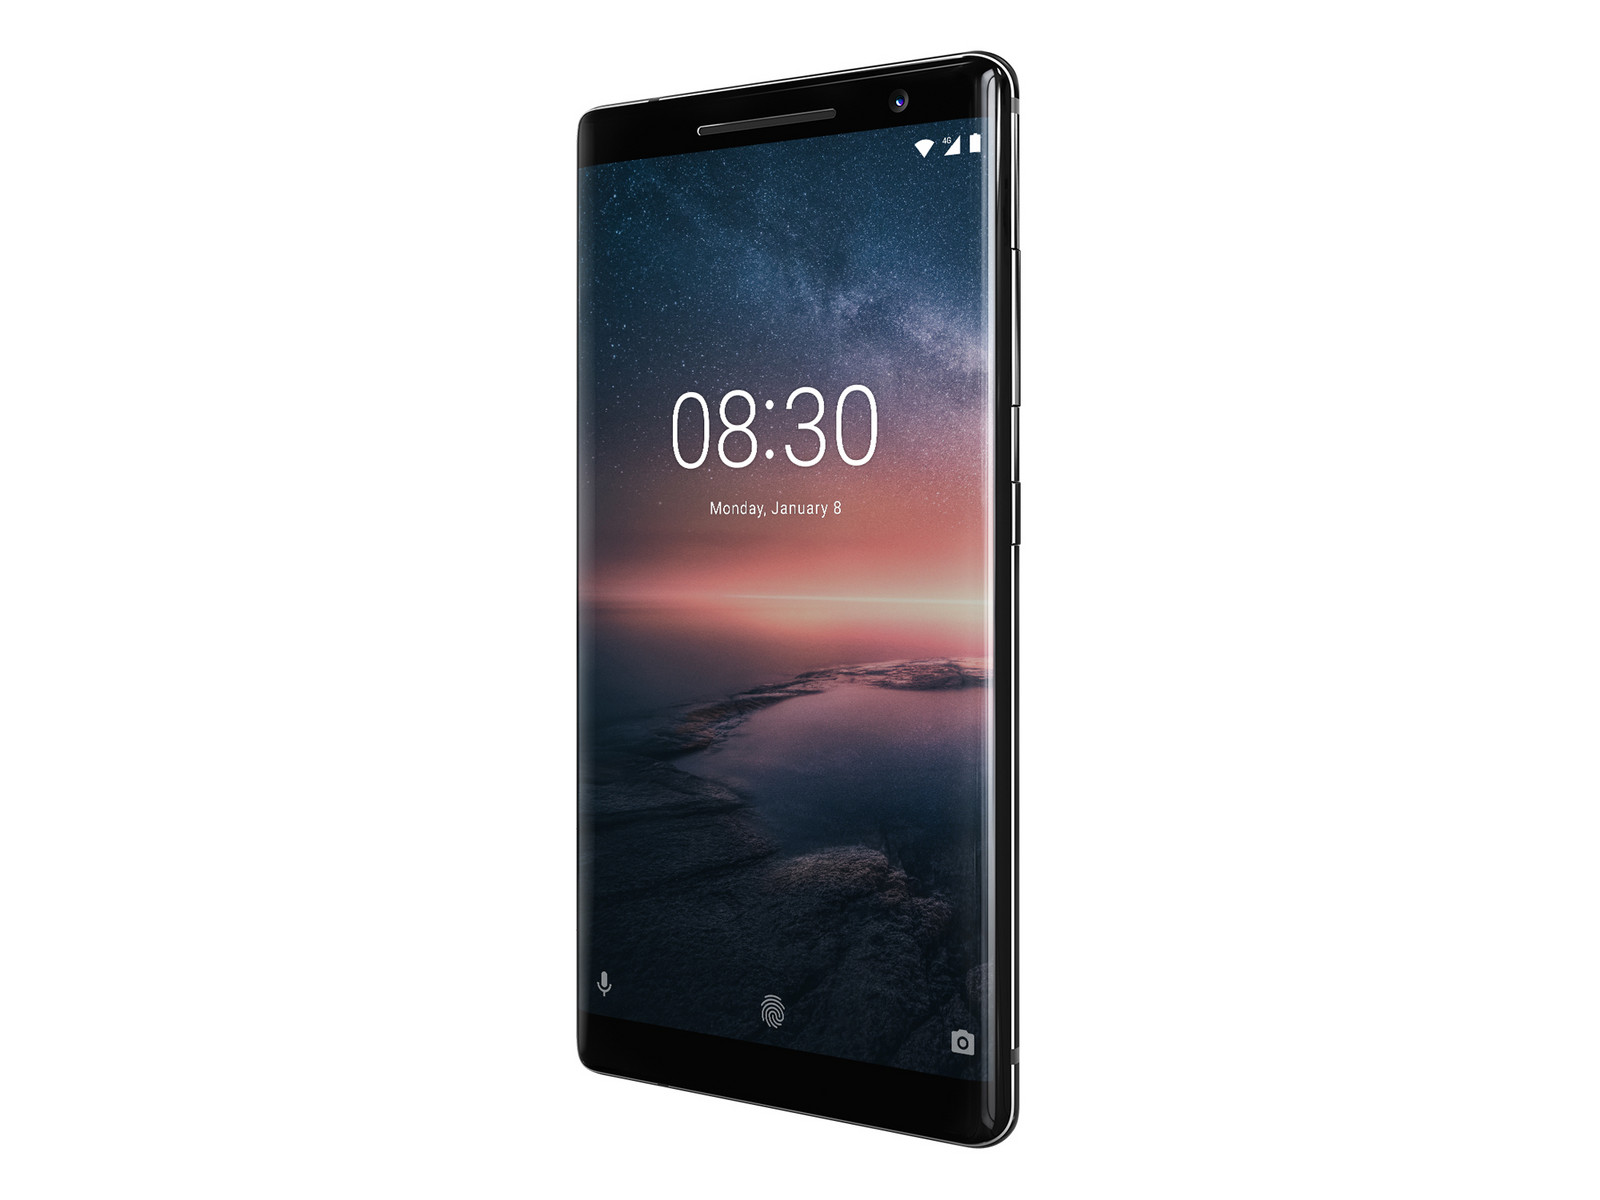
Nokia 8 Sirocco är definitivt en smartphone för individualister; Nokia har hållt vad dom lovade när dom gav den här telefonen ett ganska speciellt namn. Telefonen har alla funktioner som förväntas av en modern toppskikts-modell: Lång batteritid, hög prestanda, en högupplöst skärm, spel i 60 fps, en skaplig dual-kamera och snabbt LTE. Höljet ser väldigt elegant ut, är extremt robust och är dessutom vatten- och dammbeständigt.
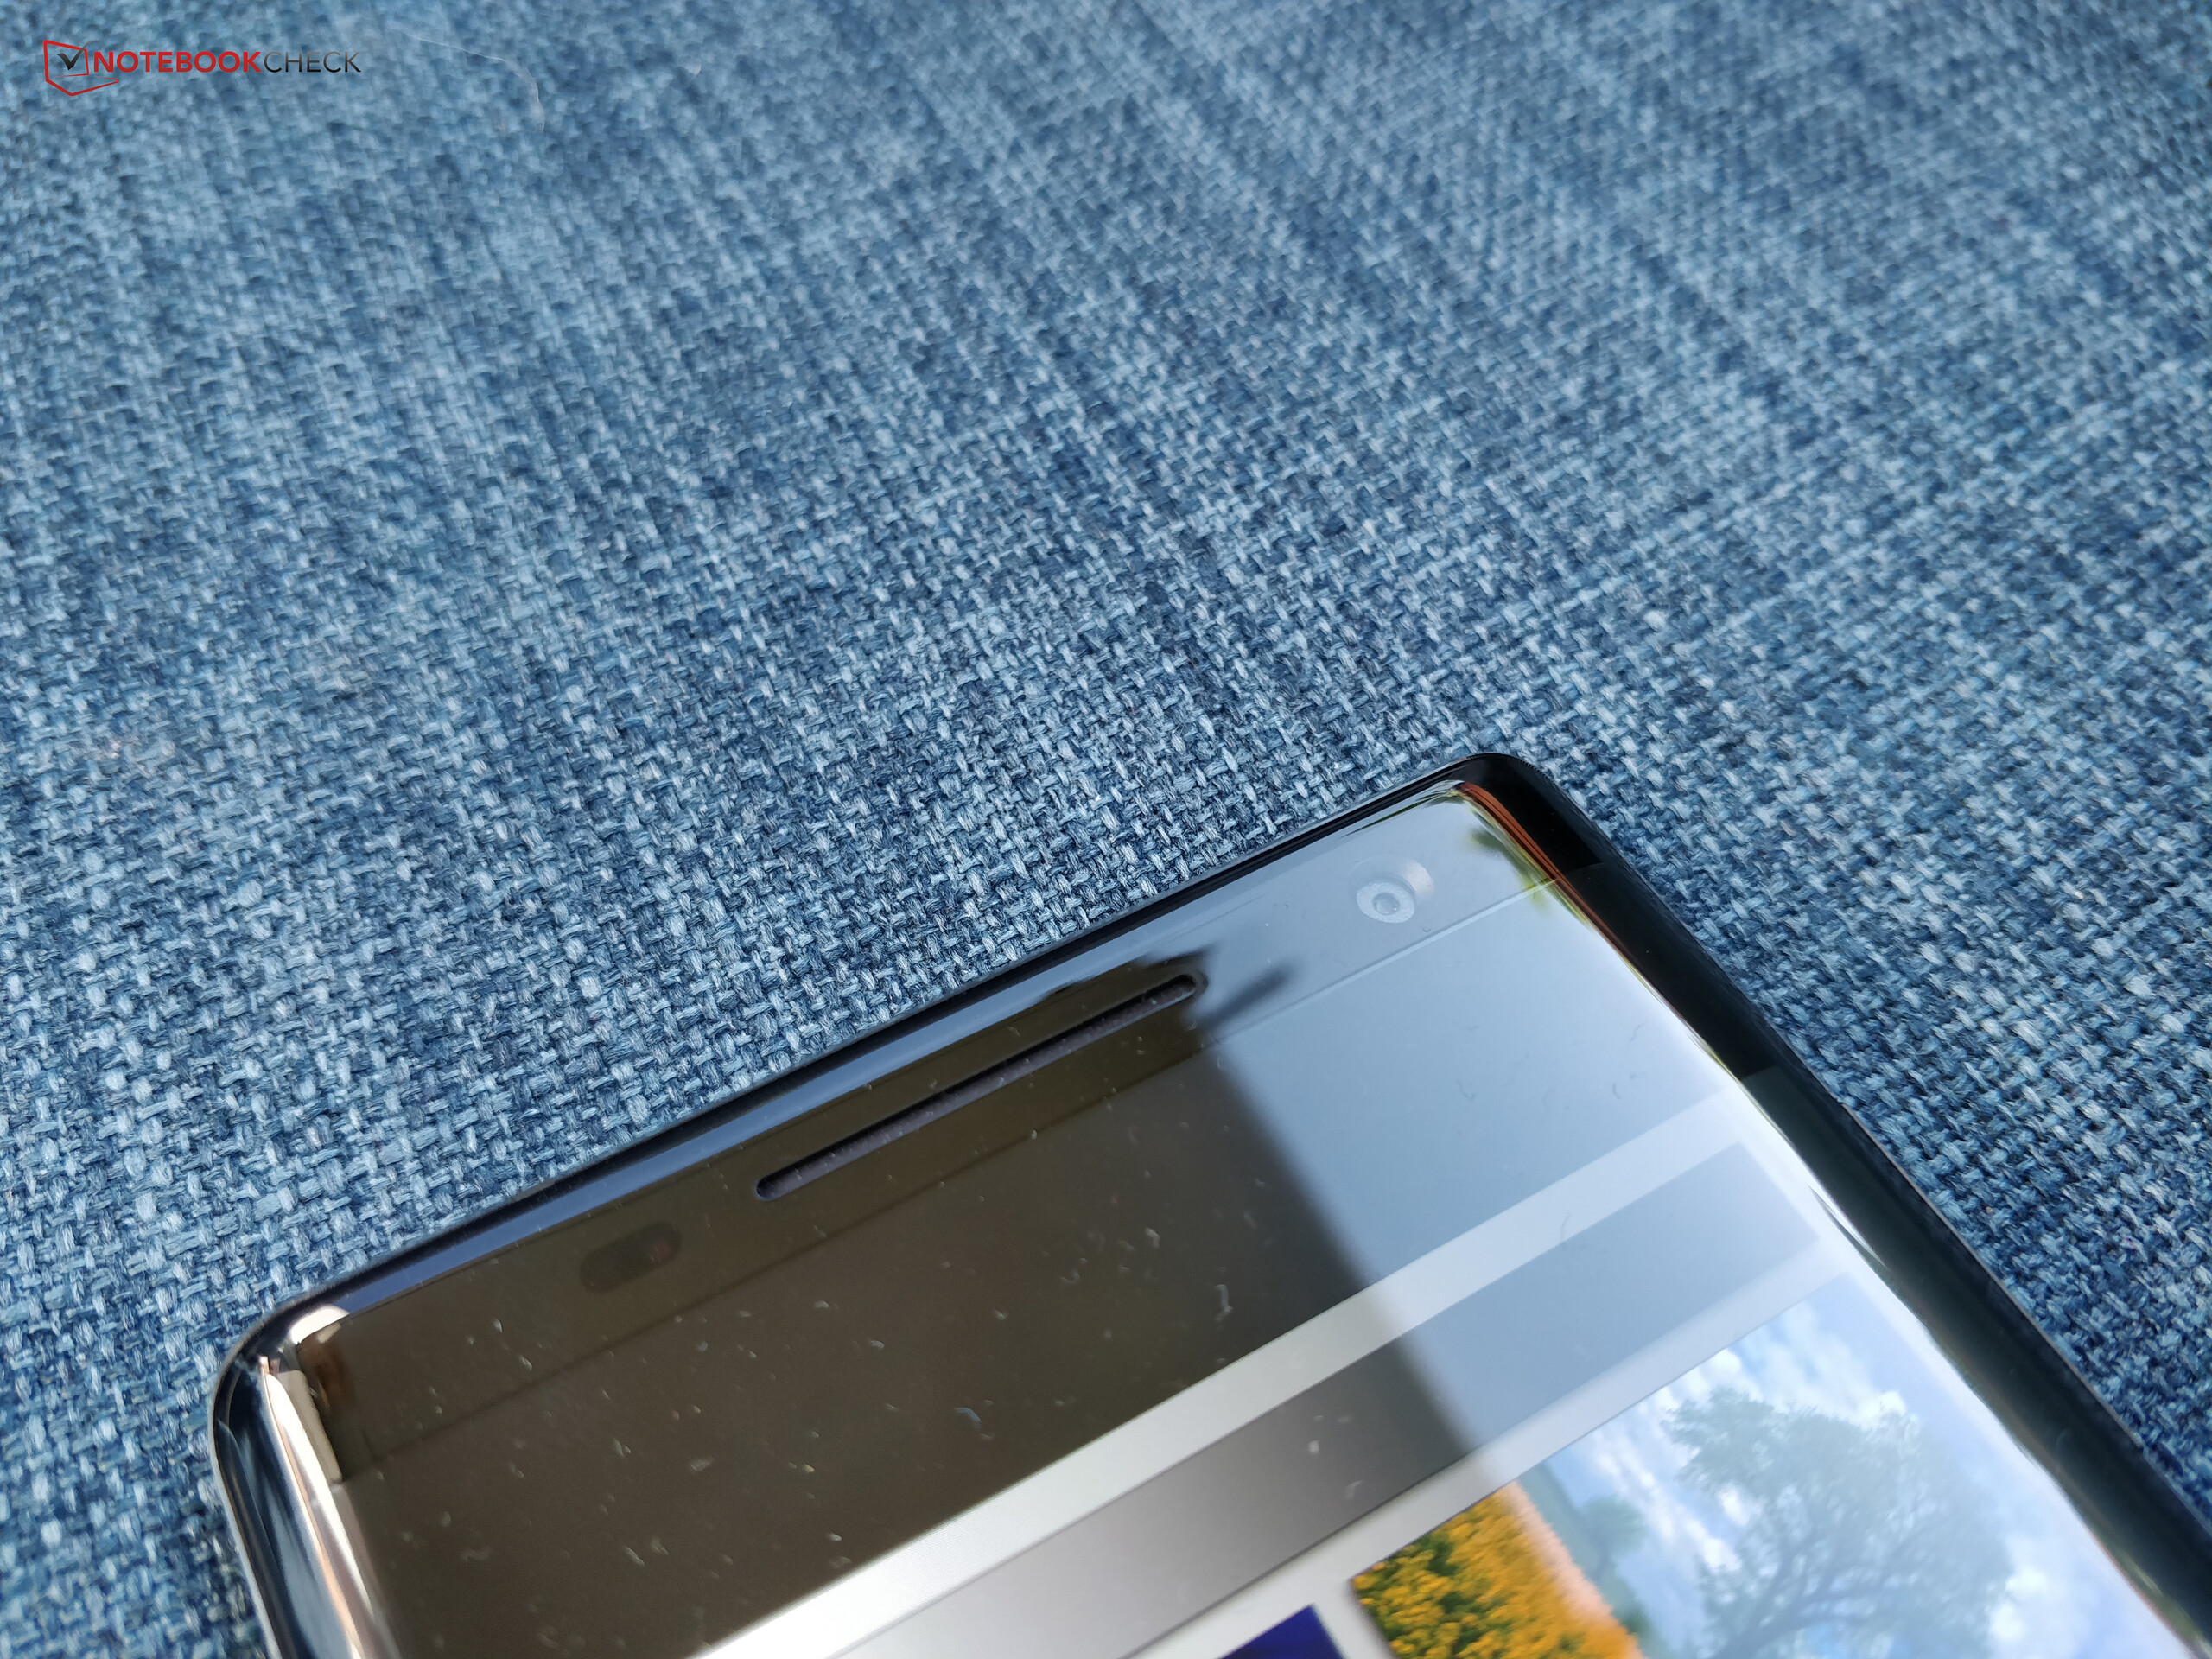
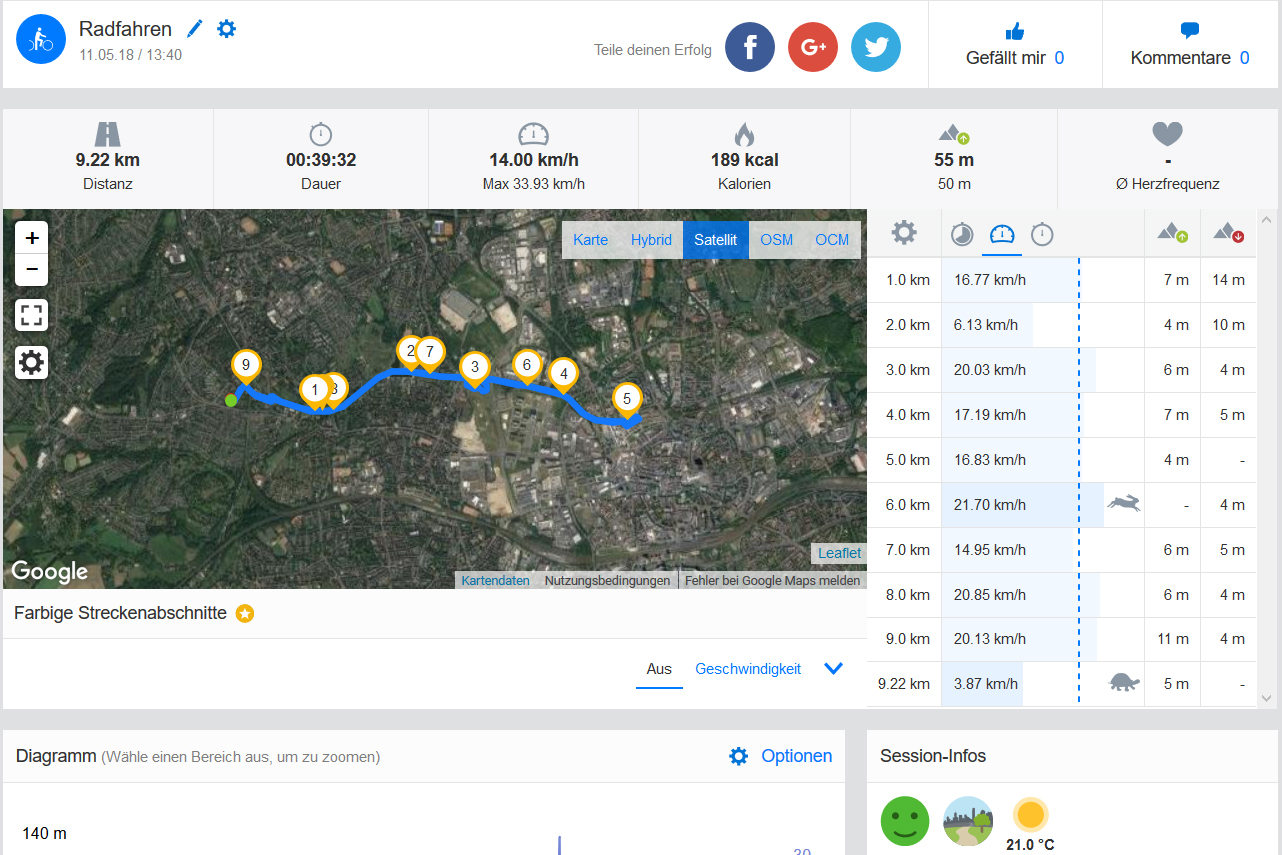
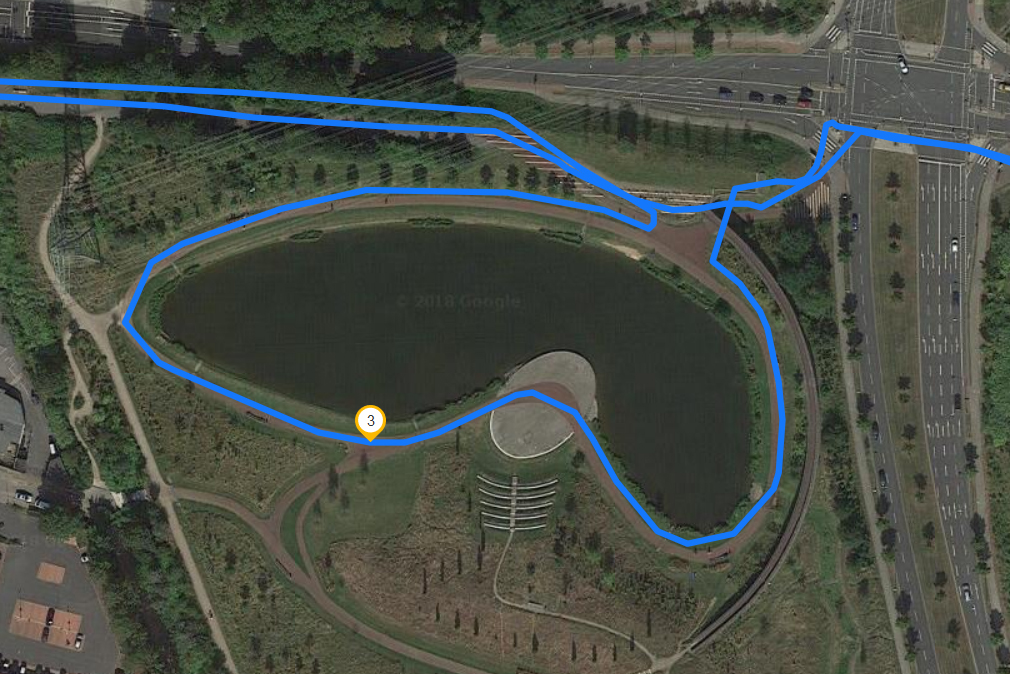
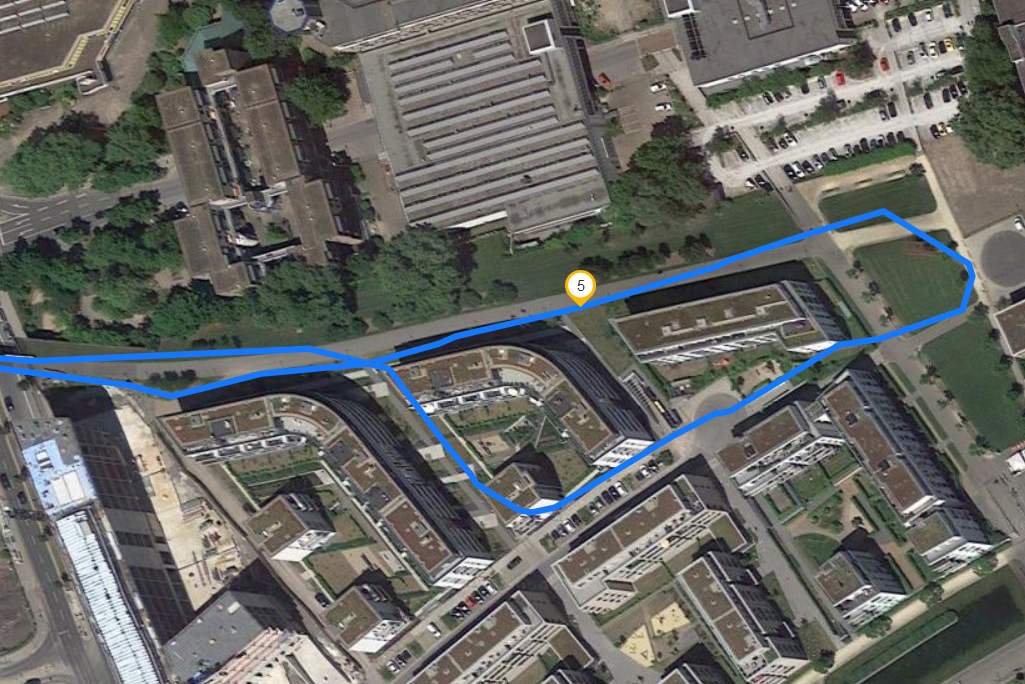
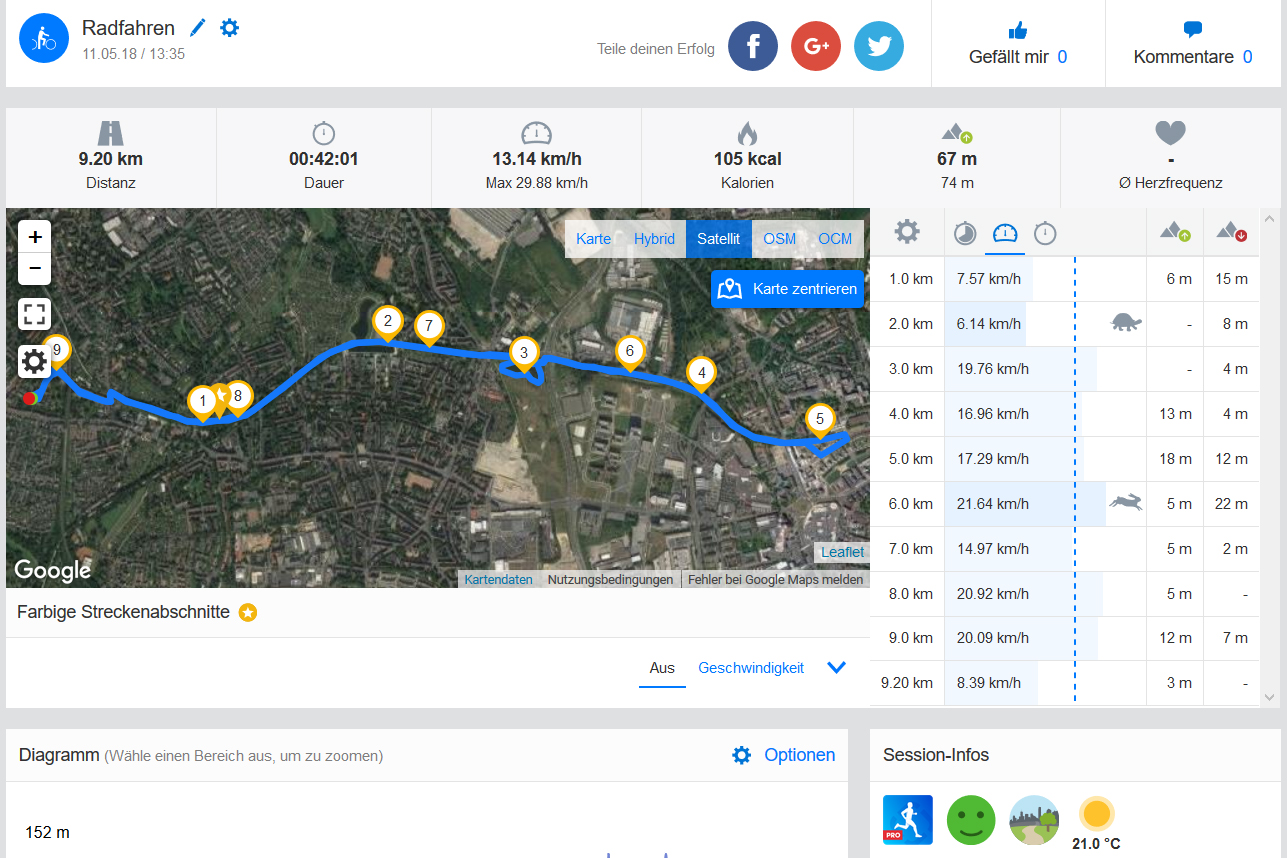
Men Sirocco är inte perfekt: Nokia hade behövt hitta en bättre lösning för den underliga färgeffekten som skärmen skapar på vitt innehåll, löst det underliga GPS-beteendet i Google Maps och utrustat enheten med en bättre framåtriktad kamera. Högtalarna kan ge väldigt högt ljud, men ljudet är obalanserat och det finns ingen certifiering för högupplöst ljud. Den har ganska stark värmeutveckling vid belastning och dess SoC presterar inte konsekvent utan prestandan minskar betydligt efter en kort period av belastning.
Nokia 8 Sirocco är inte perfekt, men det är en bra toppskikts-telefon för individualister.
Trots sina svagheter så har Nokia 8 Sirocco stil och kan också erbjuda många fördelar, inklusive en generös uppsättning tillbehör och ren Android med garanterade uppdateringar. Vi kan därför rekommendera Nokia 8 Sirocco till alla som är redo att acceptera ovan nämna svagheter i utbyte mot någonting som är annorlunda från dom vardagliga modellerna.
Nokia 8 Sirocco
- 09/03/2022 v7 (old)
Florian Wimmer
Price comparison
